ecosystem accounting and the cost of biodiversity losses – the case
TRANSCRIPT

Ecosystem accounting and the cost of biodiversity losses
The case of coastal Mediterranean wetlands
EEA Technical report No 3/2010
ISSN 1725-2237

X

Ecosystem accounting and the cost of biodiversity losses
The case of coastal Mediterranean wetlands
EEA Technical report No 3/2010

Cover design: EEALayout: Diadeis/EEA
Legal noticeThe contents of this publication do not necessarily reflect the official opinions of the European Commission or other institutions of the European Union. Neither the European Environment Agency nor any person or company acting on behalf of the Agency is responsible for the use that may be made of the information contained in this report.
Copyright notice© EEA, Copenhagen, 2010Reproduction is authorised, provided the source is acknowledged, save where otherwise stated.
Information about the European Union is available on the internet. It can be accessed through the Europa server (www.europa.eu)
Luxembourg: Office for Official Publications of the European Union, 2010
ISBN 978-92-9213-092-3ISSN Technical report series 1725-2237DOI 10.2800/39860
European Environment AgencyKongens Nytorv 61050 Copenhagen KDenmarkTel.: +45 33 36 71 00Fax: +45 33 36 71 99Web: www.eea.europa.euEnquiries: www.eea.europa.eu/help/infocentre/enquiries

3Ecosystem accounting and the cost of biodiversity losses
Contents
Acknowledgements .................................................................................................... 4
Executive summary .................................................................................................... 5
Introduction — accounting for biodiversity loss ......................................................... 7
1 Ecosystem accounts and the economics of biodiversity loss ................................ 18Introduction ...........................................................................................................18The purpose of ecosystem accounting ........................................................................19The structure of ecosystem accounts .........................................................................20Conclusions ............................................................................................................21
2 Biodiversity and the valuation of ecosystem services .......................................... 24Biodiversity and ecosystem services ..........................................................................24Measurement of key biodiversity-dependent ecosystem services ...................................24Valuation of biodiversity-dependent ecosystem services: principles and examples 27Biodiversity and international trade ...........................................................................30Conclusion .............................................................................................................32
3 Socio-ecological systems, ecosystem accounting and the case of wetlands in the Mediterranean .................................................... 33
Introduction ...........................................................................................................33Socio-ecological systems as accounting units ..............................................................34Characterizing wetland socio-ecological systems in the Mediterranean ............................35Applying the accounting model at different scales ........................................................40
4 Ecosystem accounts for wetlands: constructing a multi-scale perspective 41Introduction ...........................................................................................................41Land cover stock and change within Mediterranean wetlands: the strategic scale 41The changing ecological potential of coastal wetlands in the Mediterranean 43Ecosystem accounts: developing a local view ..............................................................48Refining measures of ecosystem function ...................................................................53Building ecosystem accounts at different scales ..........................................................54
5 Ecosystem accounting and the costs of maintenance at local scales 56Introduction ...........................................................................................................56The Doñana socio-ecological system ..........................................................................57The Camargue socio-ecological system ......................................................................63The Amvrakikos socio-ecological system ....................................................................73The Danube delta socio-ecological system ..................................................................78
6 Ecosystem accounting and biodiversity loss ........................................................ 85Why accounting for ecosystems? ...............................................................................85Meeting policy-makers demands using existing information supplies ..............................87Conclusions ............................................................................................................87
References ............................................................................................................... 89

Ecosystem accounting and the cost of biodiversity losses4
Acknowledgements
Acknowledgements
Project team
Ronan Uhel, EEA;Rania Spyropoulou, EEA;Françoise Breton, ETC-LUSI;Coralie Beltrame, La Tour du Valat, France;Juan Arévalo, ETC-LUSI;Dominique Richard, ETCBD;Berta Martin, University Autonomous, Madrid;Pedro Lomas, University Autonomous, Madrid;Erik Gomez, University Autonomous, Madrid;Pere Tomas, Tour du Valat, Camargue;Driss Ezzine de Blas, Tour du Valat, Camargue;Iulian Nichersu, Danube Delta National Institute and Eugenia Marin, Danube Delta National Institute.
Editorial team
Roy Haines-Young, University of Nottingham;Marion Potschin, University of Nottingham;Pushpam Kumar, University of Liverpool;Jean-Louis Weber, European Environment Agency (EEA).

5
Executive summary
Ecosystem accounting and the cost of biodiversity losses
Executive summary
The way people are thinking about biodiversity is changing. Until recently, arguments in support of the conservation of species and habitats were based primarily on issues such as their evolutionary uniqueness, rarity or threat of extinction. Today, these arguments also include how maintaining biodiversity directly benefits people by contributing to well-being or quality of life. This new angle means that questions about the costs of biodiversity loss to society have become paramount.
This report focuses on ways we can use land and ecosystem accounting techniques to describe and monitor the consequences of biodiversity loss in the coastal wetlands of the Mediterranean. These ecosystems are characterised by the close coupling of economic, social and ecological processes, and any accounting system has to represent how these key elements are linked and change over time. This report discusses the importance of estimating the ecological and social costs of maintaining these systems, and the problems surrounding providing monetary estimates of the services associated with wetlands. It also shows how individual wetland socio-ecological systems (SES) can be defined and mapped using the remotely sensed land cover information from Corine Land Cover.
Although socio-ecological systems have no crisp boundaries, and any mapping is an approximation even at the local scale, this study shows that consistent mapping of such units can be achieved by aggregating combinations of land cover types that are considered typical of them. In this instance a set of core areas were identified using the wetland classes of the Corine classification, and these were expanded by enlarging the boundary of the SES using a 5 km buffer, to include associated cover types such as irrigated areas, dunes separating wetlands from the sea, and settlements surrounded by these elements. Using this procedure, 159 individual coastal wetland SES were mapped across the Mediterranean basin (1). Ecosystem accounts for these systems were then prepared at pan-Mediterranean, regional and local scales.
This report also shows that land cover information can be used to build basic ecosystem accounts for stock and change across different scales, and that indicators of change in ecological condition can be built using the new sources of Earth observation data that are becoming available. New spatial modelling techniques have been used to assess the biodiversity characteristics and ecological potential of wetland sites and the pressures upon them. New indicators proposed include ecological potential. This describes the capacity of systems to sustain biodiversity and provide ecosystem services based on the measurement of the density of high biodiversity value cover types at different spatial scales, and the fragmentation of such areas by roads and other infrastructure. Pressures upon ecological systems have also been characterised by indicators based on measures of urban and agricultural 'temperatures'. These measures take into account internal pressures as well as those from the neighbourhood of the ecosystems.
Using these different types of measure, novel types of account have been created that show the spatial relationships between areas of high ecological potential and the pressures upon them, and how both appear to be changing over time. In the study, socio-ecological systems dominated by wetlands were identified in the Mediterranean for 31 administrative regions. Of the 15 for which complete data were available, 14 showed an increase in urban temperature between 1990 and 2000, and all showed a loss of ecological potential. The largest change was in Andalucía.
The work demonstrates that understanding the linkage between spatial scales is particularly important – because as the case of Mediterranean wetlands illustrates, ecosystems are spread across many jurisdictions, and the data collected locally may vary in its content and quality. Thus it is often difficult to build up a consistent picture using locally derived information sources. The results presented here show how broad-scale data can provide important
(1) Note that the term Mediterranean is used loosely and includes wetlands on the southern Atlantic coast of Spain, and the Black Sea.
Executive summary

Ecosystem accounting and the cost of biodiversity losses
Executive summary
6
contextual information for assessments at local scales. The report concludes with an analysis of four wetland case study areas: Doñana; Camargue, Amvrakikos and the Danube delta. Although the accounts developed reflect the particular issues and pressures that are found in these different areas, it is clear that a generic accounting methodology can help set the problems of individual sites in a broader context.
From the beginning of the TEEB project (2), accounting has been acknowledged as a necessary component, because the protection and maintenance of public goods such as the life-support functions provided by ecosystem services are fundamental to notions of sustainable development. As a step towards developing such accounts, this study examines the possible contribution of environmental accounting in general and ecosystem accounting in particular to the economics of ecosystems and biodiversity.
The key messages that emerge from this work are:
• ecosystemaccountsareopenframeworksthatbring together different approaches to ecosystem assessment, such as those based on physical, monetary, or other criteria, and link them to efforts to value particular service outputs or the costs of ecosystem capital maintenance;
• sincetheyareconsistentwithandpartoftheUNSEEA system and the UN System of National Accounts (SNA), ecosystem accounts potentially provide a robust and systematic framework for policy makers, because of the association to well established indicators such as GDP;
• tobemosteffective,accountingapproachesmust be implemented at different scales. Macro accounts can be developed with the
support of Earth observation programmes (for example, GEO, GMES), and statistical networks (for example, Eurostat, UNCEEA, UNSD). Micro-scale accounts can be built at the level of individual public or private organisations and used to calculate complete ecosystem costs and benefits in the context of local needs such as infrastructure project assessments. While these tasks are challenging, there are currently insufficient data resources to enable such work to be started;
• themulti-functionalcharacterofecosystemsis a major issue for assessments. In many cases, ecosystem degradation results from the preference given to one or a very limited number of services: food, fibre or energy crops in agriculture, timber in forestry, fish in fishery and fish farming, navigation in estuaries or deltas. Such emphasis often means that stakeholders and decision-makers often overlook other services that generate ancillary products and public benefits, such as recreational or environmental regulation (for example, formation of soil, water regulation, or carbon storage and sequestration). Accounts provide an overarching framework in which these multi-functional issues can be addressed.
The calculation of the value of biodiversity and the costs that result from its loss is a formidable problem. TEEB needs both robust data and tools to produce these estimates which help people in their decision-making. This study shows how ecosystem accounting provides such a robust tool. Although this report is a study of wetlands, these tools is applicable to all type of ecosystem and can be used to promote a more holistic or ecosystem approach to policy and management.
(2) TEEB, The Economics of Ecosystems and Biodiversity, in the context of which, this methodological study was undertaken.

7
Introduction — accounting for biodiversity loss
Ecosystem accounting and the cost of biodiversity losses
Ecosystem services and biodiversity loss
The way people are thinking about biodiversity is changing. Until recently, arguments in support of the conservation of species and habitats were based primarily on issues such as their evolutionary uniqueness, rarity or threat of extinction. Today, these arguments also include how maintaining biodiversity directly benefits people by contributing to well-being or quality of life. This new angle means that questions about the costs of biodiversity loss to society have become paramount.
One method for examining the relationships between biodiversity and its benefits to people is based on ecosystem services – ecosystem outputs that fundamentally depend on the properties of living systems. Ecosystem services include the provisioning of food and fibre, the regulation of natural processes such as flooding, and the cultural qualities that help define an area's 'sense of place' and may be important for community identity and cohesion, recreation and tourism. The significance of such ecosystem services for human well-being has been highlighted by the publication in 2005, of the Millennium Ecosystem Assessment (MA, 2005), which reported that at global scales, 60 % of the services examined in the study (15 out of 24) are being degraded or used unsustainably. Human activities have been responsible for most of the damage – largely through effects on biodiversity and integrity of ecological systems. Box 0.1 describes in more detail the types of ecosystem services recognised in the Millennium Ecosystem Assessment, and how they have changed recently.
What is biodiversity loss?
The word biodiversity is used to describe a number of different things. Often it refers to the richness or variety of living species in an area. In this context, biodiversity loss can simply mean the reduction in numbers in a plant or animal population found in an area or, in the most extreme cases, the extinction of a species. However, the term biodiversity loss can also be used to indicate a reduction in genetic
Introduction — accounting for biodiversity loss
diversity within populations, and in the variety of habitats and ecological communities in which species occur. We depend on the structure of these ecosystems and their associated ecological processes for all provisioning, regulation and cultural services. Human impact can undermine or change the productivity of ecosystems, the nutrient cycle within them, or alter the balance between different species groups, so that the capacity of these systems to deliver ecosystem services may be undermined. Thus biodiversity loss does not only mean the loss of species, but also the loss of ecosystem functioning (Box 0.2).
The output of ecosystem services, and consequent benefits for society, depends on the quantity and quality of the ecosystems. Understanding the implications of biodiversity loss involves tracking changes in the quantity and quality of ecosystems over time, and a detailed understanding of the links between living organisms and the services they support.
Ecosystem accounts are tools that we can use to describe systematically how the quantity and quality of ecosystems, and the ecological structures and processes that underpin them, change over time. Ultimately, they can help us understand the costs of such change to people, either in monetary terms or in relation to the risks to their health or livelihood.
This report illustrates how we can use ecosystem accounts to look at the resources wetland ecosystems provide. It pays particular attention to coastal wetlands in the Mediterranean basin, and shows how ecosystem accounts offer a way of examining policy and management options and strategies. This approach can be applied to all types of ecosystem to ensure that society takes better account of ecosystem services and biodiversity, and takes note of their value when decision-making.
Wetlands and the services they provide
Wetland ecosystems are particularly important for exploring how changes in biodiversity impacts

Ecosystem accounting and the cost of biodiversity losses8
The Millennium Ecosystem Assessment went on to look at the way the key services had changed historically through a series of global and sub-global assessments. The results are summarised as follows:
ECOSYSTEM SERVICES
LIFE ON EARTH - BIODIVERSITY
Supporting - Nutrient cycling - Soil formation - Primary production - ...
Good social relations - Social cohesion - Mutual respect - Ability to help others
Security - Personal safety - Secure resource access - Security from disasters
Basic material for good life - Adequate livelihoods - Sufficient nutritious food - Shelter - Access to goods
Health - Strength - Feeling well - Access to clean air and water
CONSTITUENTS OF WELL-BEING
Freedom of choice and action
Opportunity to be able to achiece what an individual values
doing and being
Source: Millennium Ecosystem Assessment
Cultural - Aesthetic - Spiritual - Educational - Recreational - ...
Regulating - Climate regulation - Flood regulation - Disease regulation - Water purification - ...
Provisioning - Food - Freshwater - Wood and fiber - Fuel - ...
Arrow’s colorPotential for mediation by socioeconomic factors
Arrow’s widthIntensity of linkages between ecosystem services and human well-being
Weak
MediumMedium
StrongStrong
Weak
Provisioning Services
Service Sub-category Status Notes
Food
Fiber
Genetic resources
Biochemicals, natural
medicines, pharmaceuticals
Water
substantial production increase
substantial production increase
declining production due to overharvest
substantial production increase
declining production
forest loss in some regions, growth in others
declining production of some fibers, growth in others
declining production
loss through extinction and crop genetic resource loss
loss through extinction, overharvest
unsustainable use for drinking, industry, and irrigation;
amount of hydro energy unchanged, but dams increase
ability to use that energy
crops
livestock
capture fisheries
aquaculture
wild foods
timber
cotton, hemp, silk
wood fuel
fresh water
global
regional and local
Regulating Services
Cultural Services
Spiritual and religious values
Aesthetic values
Recreation and ecotourism
rapid decline in sacred growes and species
decline in quantity and quality of natural lands
more areas accessible but many degraded
Air quality regulation
Climate regulation
Water regulation
Erosion regulation
Water purification and
waste treatment
Disease regulation
Pest regulation
Pollination
Natural hazard regulation
decline in ability of atmosphere to cleanse itself has declined
net source of carbon sequestration since mid-century
preponderance of negative impacts
varies depending om ecosystem change and location
increased soil degradation
declining water quality
varies depending on ecosystem change
natural control degraded through pesticide use
apparent global decline in abundance of pollinators
loss of natural buffers (wetlands, mangroves)
+/-
+/-
+/-
+/-
+/-
An arrow pointing upwards indicates that the condition of the service globally has been enhanced and pointing downwards that it has been degraded.
Supporting services, such as soil formation and photosynthesis, are not included here as they are not used directly by people.
Box 0.1 The Millennium Ecosystem Assessment approach and key findings
The Millennium Ecosystem Assessment highlighted the links between ecosystem services and the elements of human well-being in the graphic below. The weight and width of the arrows indicate the relative importance of different aspects of the relationship.

Introduction — accounting for biodiversity loss
Ecosystem accounting and the cost of biodiversity losses 9
Box 0.2 The accounting model
If ecosystems are regarded as assets that provide benefits to people, then we can think of describing them and the way they change over time in terms of an 'account' similar that used to calculate our financial situation. Over time the stock or quantity of a habitat may change as a result of the balance between the processes that transform or restore it, and the quality of the stock carried over may change as the functionality of the system is modified by other impacting factors or pressures. Accounts are a way of describing these changes, both in physical terms using different indicators of ecosystem integrity and health, and in terms of the monetary values we place on these assets.
Table 0.1 Total economic value of global wetlands by continent and wetland type (thousands of USD per year, 2000)
society. Globally, wetlands make a significant contribution to human well-being and support an important flow of ecosystem services, including food, freshwater, building materials, protection from flooding and coastal erosion, carbon storage and sequestration, and opportunities for tourism. Many wetland areas also have enormous cultural significance. Although is hard to quantify, the temptation of computing an 'economic value' for wetlands for showing their importance has motivated economists. It has for example recently been suggested that a 'conservative' estimate of their value be around USD 3.4 billion per year (Table 0.1) (Schuyt, and Brander, 2004). Such estimate – surprisingly low at 0.01 % of the global GDP of the same 2000 year (at USD 30.2 trillion,
according to the World Bank) – illustrates both the current interest for assessing the 'right value' of Nature and the difficulty of doing it, because of lack of data on the physical and monetary realms as well as of unsolved conceptual issues regarding what to value.
At a global scale, wetlands represent a very diverse set of ecosystems, providing many different types of service. This report focuses on the coastal systems of the Mediterranean basin and Table 0.2 lists some of the important services that have been identified in this study as important in these areas. The classification broadly follows the approach of the MA. However, in order to examine the possible costs should the integrity of the ecological systems
Stock attime 1
Stock attime 2
Stock carried overDo gains
compensatefor losses?
Gain in stocke.g. by afforestation
Loss of stocke.g. by deforestation
Has the quality of the stock been maintained?
Mangrove Unvegetated sediment
Salt/brackish
marsh
Freshwater marsh
Fresh water woodland
Total
North America 30 014 550 980 29 810 1 728 64 315 676 846
Latin America 8 445 104 782 3 129 531 6 125 123 012
Europe 0 268 333 12 051 253 19 503 300 141
Asia 27 519 1 617 518 23 806 29 149 597 1 818 534
Africa 84 994 159 118 2 466 334 9 775 256 687
Australasia 34 696 147 779 2 120 960 83 907 269 462
Total 185 667 2 848 575 73 382 3 836 333 223 3 444 682
Source: After Schuyt, and Brander, 2004.

Ecosystem accounting and the cost of biodiversity losses
Introduction — accounting for biodiversity loss
10
Provisioning Food Hunting
Food gathering
Fishing
Seafood
Livestock
Agriculture
Aquaculture
Materials Fresh water
Salt works
Construction materials (arids)
Fibre crops
Tree plantations
Forest related Timber
Fuel/Wood
Cork
Pines
Plant related Genetic resources
Medicinal and cosmetic plants
Physical support Communication
Housing
Cultural Amenity Recreation
Tourism/Ecotourism
Landscape beauty
Identity Sense of place
Cultural heritage
Religious/Spiritual
Didactic Education/Interpretation
Scientific research
Traditional ecological knowledge
Regulating Cycling Soil retention and erosion control
Hydrological regulation
Saline equilibrium
Pollination for useful plants
Climate regulation
Sink Soil purification
Waste treatment
Water purification
Prevention Flood buffering
Pest prevention
Invasive species prevention
Air quality
Refugium Habitat maintenance
Breeding Food web maintenance
Nursery
Table 0.2 Services associated with Mediterranean coastal wetlands
Note: Those services shown in bold show a strong and direct relationship to biodiversity. The others have weaker links and are more associated with the physical, social and cultural characteristics of the area.

Introduction — accounting for biodiversity loss
Ecosystem accounting and the cost of biodiversity losses 11
that underpin these services be undermined, we have refined the classification to highlight those services that are most sensitive to changes in biodiversity.
Wetlands are amongst the most threatened ecosystems as a result of drainage, land reclamation, land conversion, pollution and overexploitation It has been estimated that more than half of all Mediterranean wetlands have been lost (IUCN, 2002). Salt marshes, for example, have been progressively 'reclaimed' and converted to arable or industrial land; a particularly dramatic example is provided by the wetlands of Doñana in south-west Spain, where more than half of the original untransformed marsh area has been lost since 1929 along with about 90 % of the shallow seasonal lakes (Figure 0.1). Nevertheless, in the Mediterranean many important areas remain. In some areas, particularly in southern Mediterranean countries, people's livelihoods are closely linked to the health
and integrity of coastal wetland systems. For example, MedWet (3) reports that along the North African coast fish and shellfish remain a significant source of protein for many people, and that in many other part of the Mediterranean, fishing for direct household consumption or for sale in local markets is still commonplace (Box 0.3).
The wetlands of the Mediterranean Basin are only a subset of all wetlands, but have nevertheless proved important and valuable for the development and testing of this ecosystem accounting approach. In Europe we are relatively well placed in terms of the data resources available to describe these systems. The analytical resources needed for the present work could also be mobilised relatively quickly. It is important to note, however, that the generic approach we have used here to understand the consequences of biodiversity loss, and ultimately the costs of that loss, can be applied both to wetlands elsewhere and to any other type of ecosystem.
Figure 0.1 Natural capital loss in Doñana, Spain, since 1928
1956
1928
1977
1998
2006
(3) www.medwet.org/medwetnew/en/04.RESOURCE/04.1.wetlandfacts01.html.
Source: Lomas et al., 2007, after Zorrilla, 2006.

Ecosystem accounting and the cost of biodiversity losses12
Examples of the value and direct uses of wetlands in the Mediterranean have been described by MedWet, an organisation established in 1991 to encourage international collaboration among Mediterranean countries, specialised wetland centres and international non-governmental organisations (NGOs) in protecting wetlands. In 2002 MedWet was recognised as a regional initiative under the global Ramsar Convention.
MedWet reports that while coastal fish and shellfish are an important source of protein for many people along the North African Coast, similar dependency is also found in other parts of the Mediterranean basin. Fishing for individual consumption and for sale at local markets and restaurants still occurs widely, and mullet, sea bream, sea bass and eel are all important species provided by Mediterranean wetlands. To mature into adults, mullet larvae need the sheltered areas of coastal lagoons, where they feed for up to three years on weed, invertebrates and rich sediments found on the bottom of the lagoon.
Wetlands are particularly susceptible to pollution, as illustrated by the case of the Bouzigues oysters in the Thau lagoon, which are famous throughout France (Harzallah and Chapelle, 2002; Mesnage et al. 2007). Despite the importance of the lagoon for oyster production, the productive capacity of these wetlands can be damaged by poor water conditions. Described locally as malaigue (sick water), hypoxic conditions result from a combination of climatic conditions (high temperatures and no wind) and high nutrient concentrations. The consequent reduced levels of dissolved oxygen are lethal for oysters, as well as other shellfish and fish. Eutrophication is Source: After Harzallah and Chapelle, 2002.
exacerbated by the high number of tourists who visit the area in the summer.
Since the 1980s there have been considerable efforts to improve the quality of water entering the lagoon by better wastewater treatment. However, concerns remain and management of the exchange of water between the sea and the lagoon ecosystem is now being considered.
Box 0.3 Mediterranean wetlands and the production of protein
The causes of biodiversity loss and the loss of ecosystem services
The Millennium Ecosystem Assessment explains the reasons for biodiversity loss and its impact on ecosystem services in terms of indirect and direct drivers of change. Indirect drives are broad-scale influences such as climate change or agricultural markets that, in the context of biodiversity and ecosystem services, change environmental conditions or the way people and society behave. The direct drivers, for example land management decisions, comprise the more immediate influences that affect the distribution, structure and dynamics of ecological systems.
Wetlands are amongst the most productive and biodiverse terrestrial habitats. They are also
amongst the most sensitive to direct and indirect drivers of change. Coastal wetlands are particularly vulnerable. It has been estimated, for example, that worldwide over the last 20 years, about 30 to 50 % of the area of Earth's major coastal environments have been degraded. This loss far exceeds those suffered by the tropical forests. Wetland losses are largely the result of the pressure that such areas are under in terms of human use and development, and the susceptibility of these systems to outside factors (Valiela and Fox, 2008; Duarte, 2007).
There are many examples from the wetlands of Europe to illustrate just how quickly they can be degraded, with a consequent impact on human well-being. The major drivers of change include the loss of the sediment needed to sustain the
FRANCE
Bouzigues
SETE
MèzeMourreBlanc
Marseillan Volume: 25 Mm3
Surface: 70 km2
Maximum length: 19.5 kmMaximum width: 4.5 kmMean depth: 4 mMaximum depth: 10 mCatchment area: 300 km2
Shellfish cultivation areas
2 km
Mediterranean Sea
The Thau Lagoon
Introduction — accounting for biodiversity loss
Ecosystem accounting and the cost of biodiversity losses 13
wetlands – through the damming of rivers; the over-use of water upstream and changes in their hydrology: land-use changes, which have resulted in the draining of large areas of land and its conversion for intensive agricultural production or urban development; eutrophication and pollution; the introduction of alien species; overharvesting of fish stocks; and the general loss of the biodiversity associated with such areas due to the modification of habitats.
In wetlands, the effects of these drivers of change on human well-being and prosperity include the increased risk of flooding as the water storage capacity of wetland areas is diminished; the loss of wetland areas as 'nutrient sinks' that help buffer and purify the waters entering the marine system; the loss of wildlife areas and their associated recreational potential. As we face the problem of
dealing with climate change, the loss of wetland areas has also diminished services such as carbon storage that might be important for our future.
Wetland ecosystems might be particularly sensitive to the direct and indirect pressures arising from the impacts of human development and environmental change – but they are not unique in this respect. Many of the ecosystems that we find both in Europe and other parts of the world are under such pressures. If we are not, in the long term, to lose the benefits they currently or could in the future provide, we need better ways of monitoring their fate, and better ways of using this type of information more effectively in our decision-making. Ecosystem accounting is one such tool, and in this report we examine how it can be used most effectively.
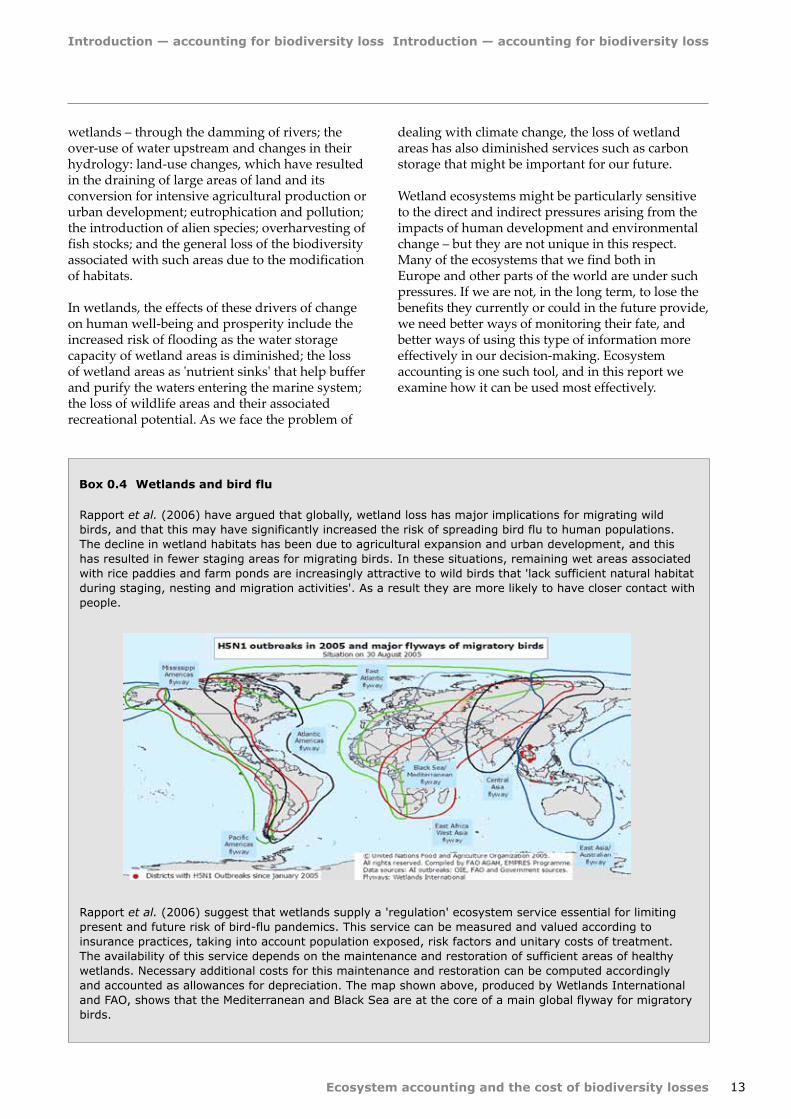
Box 0.4 Wetlands and bird flu
Rapport et al. (2006) have argued that globally, wetland loss has major implications for migrating wild birds, and that this may have significantly increased the risk of spreading bird flu to human populations. The decline in wetland habitats has been due to agricultural expansion and urban development, and this has resulted in fewer staging areas for migrating birds. In these situations, remaining wet areas associated with rice paddies and farm ponds are increasingly attractive to wild birds that 'lack sufficient natural habitat during staging, nesting and migration activities'. As a result they are more likely to have closer contact with people.
Rapport et al. (2006) suggest that wetlands supply a 'regulation' ecosystem service essential for limiting present and future risk of bird-flu pandemics. This service can be measured and valued according to insurance practices, taking into account population exposed, risk factors and unitary costs of treatment. The availability of this service depends on the maintenance and restoration of sufficient areas of healthy wetlands. Necessary additional costs for this maintenance and restoration can be computed accordingly and accounted as allowances for depreciation. The map shown above, produced by Wetlands International and FAO, shows that the Mediterranean and Black Sea are at the core of a main global flyway for migratory birds.
Introduction — accounting for biodiversity loss

Ecosystem accounting and the cost of biodiversity losses
Introduction — accounting for biodiversity loss
14
Linking biodiversity, ecosystem services and people
The study of the links between biodiversity and ecosystem services is a relatively new field. It is also a particularly challenging one because it requires us to connect different disciplines and integrate understandings across a range of subject areas. Once we start to investigate the connection between ecological processes and the needs of people, then it is clear that we have to think of ecosystems in much broader ways – that is, as coupled social and ecological systems, or socio-ecological systems (Folke et al., 2003). These systems are said to be coupled, because each component depends on and influences the other. To understand how they work, it is necessary to investigate in detail how people interact and shape the environment through their management actions and cultural practices, as well as look at the underlying biophysical processes. The task is particularly challenging, because as Erikson (2007) notes, despite their mutual dependencies, the interactions between the social and ecological components are highly uncertain and outcomes are often unpredictable. The recent discussion of the role of wetlands in the context of the migratory routes of birds and avian influenza illustrates just how complex this coupling can be (Box 0.4).
Wetlands in Europe provide us with some particularly good examples of these cultural landscapes and are therefore especially useful in helping us to think some of these ideas through. This report examines how socio-ecological systems can be defined and mapped, and how we can use them as accounting units within which we can begin to understand the costs of biodiversity loss.
As we look at ecosystems in general, and the importance of the link between biodiversity and the services that the environment provides, it is important to distinguish those services that have a stronger or weaker link to the activities and characteristics of living organisms. For example, many coastal wetlands in Europe, such as the Camargue, are important for the production of salt. The industry depends on the evaporation of saline waters in the lagoons of the delta, and while this fundamentally depends on natural processes, it is not really an ecosystem service in the strict sense of the word – more a service provided by a particular type of landscape. The mechanisms that generate most ecosystem services have biodiversity at their core; that is, living organisms that are responsible for, or support the output of, some benefit to people. For example, In the Camargue, for example, biodiversity in the form of the bulls and horses that
have traditionally been reared there is an important cultural asset in the context of tourism.
If we are to understand the implications of biodiversity loss, we must understand how a change in biodiversity affects the delivery of the different ecosystem services. The mechanisms and relationships linking the different ecological elements that give rise to the service can be complex; we cannot assume that there is a simple and direct relationship between the two. Understanding these relationships, or production functions, is key to successfully calculating the costs of biodiversity loss.
The impact of recent changes in the numbers of bulls reared in the Camargue is an interesting example of just how complex some of these relationships between biodiversity and service output are. Traditionally, bulls were kept at low densities, grazed on the lower salt marsh areas in summer and were moved to higher ground not liable to flooding in winter. Since the 1970s, however, herd densities have increased, partly as a result of tourist demand and partly as a result of agricultural support measures. This increase, coupled with the fact that pasture land has been lost to agricultural cropping, has meant that the remaining pasture areas have often become over-grazed, that fodder and hence nutrients have to be imported into the area, and that the incidence of disease in the herds is now much higher than before (Beaune, 1981).
As is also illustrated by the Camargue example, coastal wetland ecosystems of the Mediterranean described in this study are good examples of systems that can provide many services to people at the same time. These multifunctional ecosystems present particular difficulties for managers and policy makers: it is often difficult to reconcile the different needs that people have for the services associated with these ecosystems or to calculate the exact costs of biodiversity loss though its impact on the different service systems that might depend upon them.
Chapters 1 and 2 of this report look at the ways in which we can represent the multiple services that may be associated with an area of wetland as part of a much wider discussion about how we characterise services and value them. Ultimately, economic valuation of ecosystem services can help decision-makers identify the main trade-offs among ecosystem services and how they might be viewed by different stakeholder groups. For example, the introduction of eucalyptus in Mediterranean wetlands for paper production has impacted on

Introduction — accounting for biodiversity loss
Ecosystem accounting and the cost of biodiversity losses 15
aquifers and hence water supply in these areas. As a result, it has been decided in some places that these plantations should be eliminated – but this may lead to a loss of income for honey producers, as eucalyptus is an important nectar source.
The ecosystem approach and ecosystem accounting
The ecosystem approach emerged as a focus of discussion in the international policy community concerned with the management of biodiversity and natural resources in the 1980s and early 1990s. It was suggested that a new focus for decision-making was needed that would deliver more integrated policy and management than had previously been achieved. This is now a central element of the Convention for Biological Diversity (CBD), which in 1995 adopted it as the 'primary framework' for action (IUCN, 2004). According to the CBD, the ecosystem approach:
'….places human needs at the centre of biodiversity management. It aims to manage the ecosystem, based on the multiple functions that ecosystems perform and the multiple uses that are made of these functions. The ecosystem approach does not aim for short-term economic gains, but aims to optimize the use of an ecosystem without damaging it.' (4)
A decade on, the task we still to face is to find effective ways of describing to managers, policy makers and the people who own or use different kinds of ecosystem, how these multiple functions relate to each other, how they are changing and what significance these changes might have. A key theme promoted in the principles formulated by the CBD is that decision-making should take full account of the value of ecosystem services. The land and ecosystem accounting framework described in this study is one way that this can be done.
Land and ecosystem accounts can be used to represent changes in our 'natural capital' in the same way that economic accounts can be used to monitor changes in the monetary wealth of organisations and countries. They operate in much the same way as conventional monetary accounts, in that we try to represent the stocks of different ecosystem elements, and processes that affect them, and how these changes affect the flow of benefits or service that arise from them. The concept is one that has been actively developed by the EEA for Europe (EEA,
2006) and is one that is central to the development of integrated economic and environmental accounts being promoted by the UN (UN and others, 2003). Much of the background to this work is summarised in Chapter 1 of this report.
Broadly, land and ecosystem accounts let us look at the asset stocks represented by ecosystems and service or benefit flows that they generate in two ways. First, and most straightforwardly, simply in terms of the physical units used to measure these stocks and flows. Thus the stock of a wetland ecosystem can be described in terms of its area, or a resource such as the population of a species that might be described in terms of numbers or density. Similarly, the production, regulating or cultural services that the system generates can be represented in terms of, for example, tonnes of fish harvested per day, the amount of carbon stored per year, or the annual number of visits to an area for recreational activities.
The second way that ecosystem accounts can represent asset stocks and flows is in monetary terms. This is, however, by no means easy, because of the nature of many of the ecosystem services. The attempt to devise robust ways to make such valuations is now a major focus of debate both in the research and policy communities.
To facilitate comparison, it is important to try to assign monetary values to ecosystem services. This is particularly useful when dealing with multifunctional systems, like wetlands, where ecosystems give rise to a bundle of benefits – and we might want to see how the value of the total package changes in the light of some management strategy, development or external pressure. It also makes the comparison between different areas a little easier. The task of monetary valuation is not simple because many ecosystem services are not traded and so we cannot use market values as a guide to the worth of an ecosystem.
Provisioning services are perhaps the easiest to deal with since they are often commodities and are bought and sold in some kind of market, or at least they are part of commodities that are traded. However, not all production services can be valued in this way. Throughout the world, for example, much of the food generated by wetlands underpins the subsistence livelihoods of farmers and fisherman. Even in Europe, the informal or wild foods that wetlands provide can be of great significance culturally. These types of service, like
(4) www.iucn.org/themes/CEM/ourwork/ecapproach/index.html.

Ecosystem accounting and the cost of biodiversity losses
Introduction — accounting for biodiversity loss
16
most regulation and cultural services, are generally referred to as non-market services, and to value them, other approaches are needed. Chapter 2 of this report describes how we can examine these types of service in greater detail.
The valuation of ecosystem services is a complex issue, both for those who attempt to make such calculations and those who use the results in decision-making. Certainly, estimates of the value of wetlands, like those shown in Table 0.1 should be considered carefully. A number of points need to be made about them. First, their accuracy is highly dependent on the quality of the biophysical data that underlies them – for example, unless we have robust estimates of the area and condition of different wetlands, it is impossible to accurately scale up to aggregated values from individual case studies. For example, Schuyt and Brander (2004) suggest that the total, annual value of wetlands could be as high as USD 70 billion/year if the estimate of the global area of wetlands used in the Ramsar Convention is used. One contribution that ecosystem accounting can make is to help provide a systematic and consistent set of biophysical data on which estimates of value can be built.
A second point that needs to be made about the estimates of value like those shown in Table 0.1 is that they are heavily dependent on the sorts of information people have available to them at the time estimates are made. For example, wetlands are now valued much more highly because of the services they offer in terms of carbon storage and sequestration than they were a decade or so ago. This is because of what we now know about the possible impacts or likelihood of climate change. As people's attitudes and needs change, physical accounts provide a more constant basis on which estimates of value can be based.
Thirdly, should these ecosystems be totally destroyed or transformed by human action, such figures cannot be used as indicators of the full cost of biodiversity loss. The figures themselves are annual estimates for the value of outputs; the total costs would be much higher, since this level of income would be lost every year thereafter. The scale of the loss that is calculated depends on how we value or discount the future. As Chapter 3 of this report explains, perhaps the best way of using estimates of value is to look at them in terms of the relative or marginal changes resulting from different decision-making strategies or scenarios describing alternative plausible futures. This type of analysis can help us understand the changes in the costs of maintaining the outputs from ecosystems and
people's well-being in the face of the direct and indirect drivers that impact upon them.
Because many ecosystem services have no simple market value, these ecosystems are often not given sufficient consideration in decision-making. The final point that needs to be made about estimates such as those shown in Table 0.1 is that they are probably underestimates, because not all of the services associated with them were used in the calculations. For example, the role of supporting services is particularly problematic.
Whatever the case, it is clear that, because we do not always know how even the relative values of ecosystems might change, the effects of direct and indirect pressures on these systems that lead to their degradation and destruction are often not managed. The full costs to society are never calculated. In the context of wetlands, decision-making has traditionally only considered the value of those ecosystem services that have a market value. Today it is more widely acknowledged that the non-market benefits that they provide must also be taken into account. The approach to ecosystem accounting described in this report explores how this might be done.
How can we calculate the costs of biodiversity loss?
Whether we use physical or monetary units to describe the ecosystem stocks and service flows, accounts are essential for calculating the costs of biodiversity loss to society. Even if we cannot put a monetary value to the decline in some services, for example flood protection, a change in, say, flood frequency can be quantified and its implications for people or communities considered. Moreover, even if society finds it difficult to put a precise monetary value on the total outputs of services from an ecosystem, it is possible to look at the costs of restoring ecosystem function or maintaining it, as part of the debate that decision-makers and stakeholders must have when looking at future options. In this report we therefore take a very broad interpretation of what costs mean.
In constructing ecosystem accounts we have sought to describe both the quantity and quality of ecosystem assets in physical terms, and to use new types of indicator to identify how the health of these systems is changing under different types of external pressure. These indicators of ecosystem health can also be used to look at the effectiveness of restoration efforts. To make the results as useful

Introduction — accounting for biodiversity loss
Ecosystem accounting and the cost of biodiversity losses 17
as possible, however, we also make a first attempt to estimate the costs of protection and restoration. This is an important basis for accounting and provides a framework for subsequent forecast studies – because in looking at the question of the costs of biodiversity loss we need to know how these costs might change under a range of possible futures. For example, on the basis of the evidence provided by the case studies covered in this report, we might consider the relative benefits of eliminating the effects of current European Agriculture Policies, which encourage the intensification of land use in wetland areas, or the
effects of adopting new measures to control water extraction or overharvesting, or encourage greater stakeholder participation in management decisions.
This report is therefore of direct relevance to the examination of the economic issues surrounding biodiversity loss, as it provides an example of the impact that human activities have had on an ecosystem that is important and valuable in its own right, and describes an evolving methodological framework that will be an essential tool for decision-makers in the future.

Ecosystem accounting and the cost of biodiversity losses18
Ecosystem accounts and the economics of biodiversity loss
Introduction
Without reinvestment economic systems collapse. As the implications of the global credit-crunch work their way through our economies, the power of this simple proposition is ever clearer. The unknown scale of the toxic assets that have been built in our banking systems has meant that trust between borrowers and lenders has broken down. The result is that the opportunities for both individuals and businesses are limited or evaporate, the economy slows and the well-being of people suffers.
Without reinvestment in ecological systems they also collapse. There is a striking parallel between the economic problems we now face and difficulties we confront in relation to sustaining green infrastructure. Natural capital is the ecological resource base on which we all depend, but it has been shrinking for some time. The exploitation of ecological systems, and the damage that human activities have had upon them through pollution, conversion and biodiversity loss, has meant that, increasingly, the capacity of ecosystems to renew themselves has been undermined. Thus the ecosystem services that flow from them have been impaired and human well-being is threatened. The conclusion that the UN's Millennium Development Goals are unlikely to be met because ecosystems are not being used sustainably is a stark and sobering one (MA, 2005). The ecological debts that human societies have accumulated are, it seems, just as perfidious as the toxic financial assets that are currently undermining our economic systems. They are also a legacy that this and future generations will have to resolve.
The toxic assets that have caused so many problems in the financial system are essentially concealed debts of unknown scale and character that have eroded confidence in any form of reinvestment. The
scale of our ecological debts is also unclear. In this report we examine how, through new approaches for accounting for natural capital, some of these uncertainties can be resolved, and how potentially better governance mechanisms might be developed so that the consequences of biodiversity loss can be better understood and dealt with.
This work builds on the recent efforts of the EEA, which has been developing and testing a system of ecosystem accounts as part of the revision of the UN System of Integrated Economic Environmental Accounting (SEEA2003 (5)) being undertaken by the UN London Group (see also Weber, 2007; EEA, 2006). It argues that the construction of ecosystem accounts should not be regarded as a narrow technical exercise, but seen as part of a much wider debate that is taking our understanding of how the calculation of our wealth must go 'Beyond GDP' (6). It also argues that ecosystem accounts are an important way of answering crucial policy questions related to human well-being, sustainability of the use of natural capital. They also provide a framework in which strategies for adapting to climate change can be explored and conflicts between sector policies or environmental debts resulting from international trade examined.
At a time when people are arguing that to overcome the present financial downturn we need to contemplate a 'Global Green New Deal', we need to ensure that a sufficiently robust conceptual framework is in place to ensure that effective action on a range of environmental problems can be taken. In this and the next chapter we describe the potential role of ecosystem accounting in general terms, and then move on to illustrate and consider its application in detail in relation to the specific problems facing wetlands in the Mediterranean.
1 Ecosystem accounts and the economics of biodiversity loss
(5) http://unstats.un.org/unsd/envaccounting/seea.asp.(6) See the EU-sponsored conference in Brussels, 19–20 November 2007: www.beyond-gdp.eu.

Ecosystem accounts and the economics of biodiversity loss
Ecosystem accounting and the cost of biodiversity losses 19
The purpose of ecosystem accounting
Ecosystem accounting has been designed to answer three basic questions about the interaction between artificial and natural capital (Figure 1.1), namely:
• Istheassetthatnaturalcapitalrepresentsbeingmaintained over time through natural processes or maintenance and restoration, in terms of amount (stock of ecosystems) and quality (functional capacity of ecosystems), at levels consistent with the needs of society both now and in the future?
• Isthefullcostofmaintainingthestockandquality of natural capital covered by the current price of goods and services produced in the economy, and, accordingly, are national income and final demand (consumption plus investment) correctly calculated in the national accounts?
• Howistheflowofecosystemgoodsandservicessupplied to final uses either by the market (and government institutions) or for free (by virtue of their non-exclusive nature) impacting, or feeding back, on the overall calculation of our wealth
and well-being, measured as both monetised and non-monetised values?
Three issues arise in relation to the first question. These concern how to measure the amount and quality of ecosystem assets, how to assess the level of assets required for society's needs and what metrics might be employed to calculate the gap between them. In developing the accounting framework presented here, we have interpreted the notion of need very broadly, to include both material and non-material elements, tangible benefits and options offered by ecosystem's renewal and adaptation capacity. The amount and quality of ecosystem assets expected by society is expressed through the willingness of various social groups to maintain ecosystem services for productive and non-productive uses (7). This willingness may be reflected partly in market values, but also in the targets set by international or regional conventions, regulations or directives and national laws; all can readily be translated into an accounting framework and, like the assets themselves, be measured in physical units.
(7) Non-productive covers both material use that has no market value and simply the existence value of natural capital.
Figure 1.1 The conceptual framework in which ecosystem accounting is set
Additional maintenance and restoration
costs
Ecosystem services entangled
into commodities and externalities
Adjusteddisposable
Concealed costs: the income side
Co
nce
ale
d b
en
efi
ts:
the d
em
an
d s
ide
+
Consumption of (domestic)ecosystem capital
+
Imports (including full ecosystem cost)_
Exports (including full ecosystem cost)
Inclusive final demandat full cost of goods andservices
+ or - Net external transfers
- Consumption of fixed capital_ Consumption of (domestic)
ecosystem capital
National income
Public good
€
=
=
Ecosystem servicesStock and flows (quantities)Resilience/health (qualities)
Ecosystem assets
Man-made assets
Nationalincome

Ecosystem accounting and the cost of biodiversity losses
Ecosystem accounts and the economics of biodiversity loss
20
The question of the cost of maintaining the stock and quality of natural capital follows on from the assessment of the gap between outputs and needs. The estimate of cost can be made by pricing the amount of work or the abstention of use required to close that gap. It should be noted that these costs are different from the expenditure on management or protection of a given ecosystem, and should capture the expenditures needed to restore the consumption of any ecological capital associated with domestic ecosystems or those from which any imports of services are derived. Since the consumption of ecological capital is equivalent in accounting terms to a negative transfer into the next period, i.e. a virtual debt, it is important that the costs of replacing it are fully reflected in any overall accounting exercise. In the framework presented in Figure 1.1 these maintenance costs are used as an estimation of ecosystem capital depreciation to be added up to the conventional consumption of fixed capital when adjusting the Gross domestic product for calculating its net value, which measures the National Income. Compared to the conventional nNational income, the new Adjusted disposable (real) national income (ADNI) could potentially be a powerful sustainability indicator, which could aggregate performance over sectors, companies or products.
The final question identified above concerns the interaction between the flows of ecosystem services and the overall calculation of our real consumption (see Figure 1.1). Ecosystem services make a significant contribution to the value of goods and services generated by the economy, or are enjoyed individually or collectively by end users as free non-market services. The value of marketed ecosystem services may not, however, fully reflect their costs, because of unaccounted externalities associated with the consumption of natural capital assets. Thus, to represent the full cost of goods and services, an adjustment to their conventional value currently measured at purchasers' price is needed using the calculation of the additional cost of maintaining ecosystem goods and services. Adjusted disposable (real) national income (ADNI) and inclusive final demand (IFD) are therefore proposed as the most appropriate calculations of the overall value of the economic benefits that flow from natural and artificial capital. These metrics can be used to explore the balance between GDP, ADNI, IFD and the loss of ecological capital. Clearly, if full costs of maintaining ecosystem services are not met, ADNI and IFD may decline. These maintenance costs therefore represent the level of reinvestment that is needed to sustain our ecological capital and prevent the accumulation of potentially toxic ecological debt.
The structure of ecosystem accounts
Ecological assets, or ecosystems in their broad sense, are capable of providing two types of output. The first consists of things such as food provisioning or the harvest of timber, which arise from systems or parts of systems that can be privately owned and used for production purposes. The second type lie outside the market and represent a public good, for example regulating services such as those relating to climate, water supply and hazards such as flooding, and the many cultural services associated with well-functioning ecosystems. We suggest these public goods also include the capacity of the ecosystems to sustain, reproduce and adapt themselves, and that proper account must also be taken of the extent to which the basic integrity of ecosystems is maintained over time.
Natural capital is fundamentally a shared asset, supplying positive externalities in the form of ecosystem services to all, individually and collectively. It does so in much the same way as artificially created assets like transport networks, water supply and sanitation systems, health and education services, and the internet. We therefore suggest that from an economic point of view, all the components of the shared infrastructure, including ecological assets, should be maintained and restored (amortised in accounting terms) and the costs of doing so be clearly represented as they are in financial accounting.
The ecosystem accounting framework proposed is summarised in Figure 1.2. The diagram sets out the relationship between the accounting tables in terms of whether they are linked by establishing some kind of accounting balance, rating, or valuation estimate. The approach builds on and extends the system of land accounts that the EEA has developed (EEA, 2006) by showing how the key elements that define ecological integrity can be described alongside the outputs of ecosystems that are more directly important for human well-being. The framework differentiates between accounting elements that specifically describe the various components of natural capital (the elements on the left-hand side of the diagram), and those that can be used to make a connection with the various activity sectors used to characterise the economy (the elements on the right-hand side of the diagram). Thus the accounts can be broken down into three major components:
• first,asetofbasic accounts describing the important stocks and flows that constitute

Ecosystem accounts and the economics of biodiversity loss
Ecosystem accounting and the cost of biodiversity losses 21
Figure 1.2 A framework for ecosystem accounting and the calculation of the full cost of ecosystem goods and services
Accounts by sna sectors/activities/commodities:mfa, sut, piot, hybrid accounts, expenditure distresssyndrome accounts
Ecosystem services value (k€) Use of ecosystem services, value in k€
Land functions accounts (ha)Regulating and socio-cultural ecosystem services (joules, c,or ha*person*time*EP points)
Use of regulating and socio-culturalecosystem services (joules, C, or
ha*person*time*EP points)
Provisioning ecosystem services (ha, tonnes, m3, joules)
Provisioning ecosystem services (ha, tonnes, m3, joules)
Land use accounts forprovisioning services (ha)
Consumption and formation of land cover bysectors and commodities (ha)
Water asset account(m3, srkm or joules) Water account (m3, joules)
Biomass/carbon account(tonnes of dry biomass/C
or joules)
Biomass/carbon account(tonnes of dry biomass/C or joules)
Biodiversity rarefactionaccount (index) Other consumption, emission of residuals
Ecosystem rating: ecosystem distress syndrome
Ecosystem rating: table of ecosystem stress factors – by
ecosystem typesEcosystem rating: table of ecosystem stress
factors by sectors/activities/commodities
Total ecological potential (weighted km² by EP points)
Environmental protection and management expenditures, in k€
Environmental protection and managementexpenditures, in k€
Consumption of ecosystem capitalin EP points – distance to target
Consumption of ecosystem capital bysectors/activities/commodities in EP points
Ecosystem target values,in EP points
Mean standard unitary restorationcost in constant k€ by EP points
Consumption of ecosystemcapital by ecosystem (k€)
Consumption of ecosystem capital byactivities and products (k€)
Accounting balance Valuation, pricing EP = Ecological potential (actual)
Input to rating, rating Bridging classification
Eco
syst
em
cap
ital
Tab
les b
y se
ctor, a
ctivity
an
d co
mm
od
ity
Accounts by ecosystem asset types
Eco
syst
em
serv
ices
Basi
c acc
ou
nts
Land cover account(ha)

Ecosystem accounting and the cost of biodiversity losses22
natural capital and its uses. These accounts describe the quantity of the different ecosystems, measured in terms of, say, area (for habitats) or lengths (for rivers), the biomass or carbon stored within them and the use of these assets by different economic activity sectors. Also included in this basic set of tables are accounts that document the biodiversity status of the ecosystem units and its changes over time;
• second,asetofaccountsdescribingthecondition of the ecosystem capital base, which document the health status of the ecosystem. The approach builds on the approach of Rapport (2007a, 2007b) and others, who have suggested that it is possible to identify and document the symptoms of what they describe as the Ecosystem Distress Syndrome (EDS). Essentially EDS is a measure of the integrity of the ecosystem, which they argue can be implemented at any scale;
• third,asetofaccountsthatdocumenttheoutputof ecosystem services, their uses and values.
Basic accounts, ecosystem capital and ecosystem services tables are established by ecosystem types. They are mirrored by economic sector accounts that reflect the corresponding natural resource use (in physical and in monetary units), emission of residuals and pressure on ecosystems as well as protection and management expenditures actually paid by governments and companies.
It is important to note several other features of the framework suggested in Figure 1.2.
• Toavoidtheproblemofdoublecountinginmaking valuations, the framework distinguishes between ecosystem services that are directly used by people and the supporting ecological functions, which are covered by the other accounting tables.
• Theservicesuseddirectlybypeopleincludeboth marketed and non-marketed services. It is assumed that the value of the former is reflected in their observed market price. For the final-use non-market services it is suggested that these are initially measured in physical terms, and then assigned values using the most appropriate methods for calculating their shadow prices.
• Asarguedabove,themostappropriatevaluationof ecosystem functioning is in terms of the costs of their restoration and maintenance, which can be split between actual expenditure on environmental protection and maintenance (recorded in the environmental protection and management accounts by sectors and ecosystems) and the additional costs required for maintaining ecosystems at an appropriate level, which have to be calculated in reference to the former and imputed as consumption of ecosystem capital. These aspects are covered by the accounts in the lower part of Figure 1.2, which show the steps that lead up to the
Figure 1.3 A simplified approach to ecosystem accounts and national accounts adjustment
Ecosystemdependency
(land, soil, energy, water, N, P, K...)
Biodiversity rarefaction
(loss of adaptability)
HANPP
(Biomassdiverted from
nature)
Landscapeecologicalpotential
(the landscaperadiography)
Healthypopulations
(human and wildlife)
Catchmentsexergy loss
(from waterevaporation
and pollution)
Totalecologicalpotential
(terrestrial ecosystems)

Ecosystem accounting and the cost of biodiversity losses 23
calculation of mean standard unitary restoration costs that enable an estimate of the full cost of goods and services.
The accounting framework shown in Figure 1.2 is a generic one, and provides a general framework in which the interactions between natural capital and the economy can be understood. From a national perspective, the estimate of the full costs of goods and services represents an allowance for the depreciation of the nation's natural capital as a result of the domestic consumption of ecosystem services, and thus the amount that should be reinvested if the price of the products has not been met in the current accounting period. It is essentially an estimate of the liability or debt that will have to be met or compensated for by future generations if this reinvestment is not currently made. However, it can also clearly be extended to cover the international dimensions of trade, by including the additional costs of maintenance arising in relation to non-domestic ecosystems from which imports of services are obtained. Thus the importing country would have to add this component into the full cost of the products it uses. In this case, the importing country imposes a virtual debt onto the exporting country because its ecosystems are degraded.
Conclusions
It has been widely acknowledged that while GDP is a good a measure of the volume of transactions in an economy, it is an inadequate measure of welfare (EU, 2007; European Communities, 2008). A number of flaws have been highlighted, including the fact that it does not reflect the consumption of natural capital and the loss of welfare to this and future generations that results. Thus new measures are being sought. For example, the Beyond GDP Conference has proposed, as an interim step, a basket of four high-level indicators: ecological footprint, human appropriated net primary productivity (HANPP), landscape ecological
potential and environmentally weighted material consumption. The accounts suggested here refine this approach and provide the basis for a diagnostic system based on six indicators (Figure 1.3). These form the basis of a fundamental suite or portfolio of indicators that can, we suggest, describe how overall or total ecological potential is changing and the costs of reversing such trends.
If ecosystems are used sustainably then they are both resilient to disturbance and capable of self-renewal, which is important to public goods. If the value of ecosystems is to be properly reflected in decision-making, then we need to develop new ways of describing their structure and condition. The accounting framework suggested here is one potential approach to understanding the full cost of goods and services. The accounts can be used to develop estimates of the amount of reinvestment in natural capital that is required at the global scale, but can also be applied at the national level, in the context of specific policies, or in the context of developing management plans for particular sites or habitats. The development and application of the accounting framework is, we suggest, an essential step towards better articulating the economics of ecosystems and biodiversity for society.
The remaining parts of this report consider in greater detail the questions surrounding the monetary valuation of services, and how accounting techniques can be applied to the problems facing wetlands in the Mediterranean. Case studies will be used to examine data issues and the practical aspects of building accounts, and how through the use of spatially explicit information, questions of scale and relevance can be addressed. But there are still many data gaps and scientific uncertainties, and the construction of a complete set of ecosystem accounts such as those described here remains a challenge. However, by considering the current state of knowledge for this important ecosystem type it may be possible to identify how these barriers might be overcome.

Ecosystem accounting and the cost of biodiversity losses24
Biodiversity and the valuation of ecosystem services
Biodiversity and ecosystem services
The relationship of biodiversity and ecosystem services is complex enough at the scientific level, and made even more so when we turn to the problem of economic valuation and accounting. Biodiversity, that is the variety and variability of life forms, is one of the services that healthy and well-functioning ecosystem provides. However, it is also clear that ecosystems and biodiversity also generate a wide range of other services through the bio-geo-chemical processes that they embody – and many of these are critical for human sustenance. An ecosystem, which is a dynamic complex of plant, animal and microorganism communities and other non-living environments interacting as a functional unit, provides services that sustain, strengthen and enrich various constituents of human well-being. Following the approach of the Millennium Ecosystem Assessment (MEA, 2005) human well-being is taken here to be the set of basic materials that support a good life, including food and nutrition, security, freedom to act and make choices, good social relations and security.
Measurement of key biodiversity-dependent ecosystem services
As noted in the introduction to this report, the MEA took an ecosystem service perspective, because its focus was management of ecosystem for enhancing human well being and poverty reduction. In this context, biodiversity did not appear explicitly as a service, unless it was at the species level, where is could be treated as part of provisioning services, associated, for example with, cultivated, forest or, marine ecosystems. Nevertheless, the wider importance of biodiversity for human well-being should not be overlooked.
The complexity of the relationship between ecosystem services and biodiversity must be seen in the context of the larger canvas of ecosystem dynamics, which encompasses the ways ecosystems respond to human pressure, biodiversity and its
thresholds, and the interplay of economic, technical and institutional factors. Although recent research has attempted to shed some light on this complexity (Hooper et al., 2005; Spehn et al., 2005; Dirzo and Loreau, 2005), the picture remains unclear for those attempting to value ecosystem services and account for them when developing effective response strategies. However, on the basis of the evidence available, Kinzig et al. (2007) attempted to estimate the relative importance of different species groups and ecosystems, species interactions and abiotic factors in maintaining provisioning services and final benefits (Figure 2.1).
In Figure 2.1 the size of the black and white dots indicates the importance of each component of biodiversity for each provisioning service considered by Kinzig et al. (2007). A black dot indicates that all the species in that category are required for the service, while a white dot indicates that there is some redundancy among the species in that group. The background shading is used to indicate the proportion of the species group that needs to be maintained to sustain the service on the basis of current evidence: grey indicates that a high proportion of all species within the category should be conserved, mid-grey indicates some redundancy and white indicates a high level of redundancy.
Although some broad patterns emerge from the analysis of Kinzig et al. (2007), these authors conclude that we lack any 'clear idea of what an interest in maintaining the flow of particular ecosystem services means for the conservation of biodiversity'. As a result, it would seem safest to approach the valuation of ecosystem services via the goal of an integrated account of ecosystem services and conventional economic sectors. As discussed in the previous chapter, from the accounting perspective, the valuation of provisioning, cultural and regulating services entering into the consumption and production spheres would therefore be appropriate. That in no way reduces the importance of biodiversity and its associated supporting services, which are the primary inputs to all other services, but it avoids the danger of
2 Biodiversity and the valuation of ecosystem services

Ecosystem accounting and the cost of biodiversity losses 25
Figure 2.1 The importance (symbol size), number of species involved (black, white) and degree of redundancy (cell shade) of species or ecosystems involved in supplying provisioning services
double counting when making any aggregated cost estimates, and these, as we have shown, can be accounted for in other ways, namely in terms of the full costs of goods and services.
The unique feature of most of the services emanating from ecosystems is that although their importance is acknowledged by society, they are often unaccounted for, unpriced and outside the domain of the market. Conventionally, such problems are
Fo
od
Fib
re
Fu
el
Gen
eti
cre
sso
urc
es
Bio
chem
icals
an
dp
ham
ace
uti
cals
Orn
am
en
tal
ress
ou
rces
Fre
sh w
ate
r
Taxonomic group
Bacteria • • •Protists • • •Fungi • • •Invertebrates
Plants • • • • • • •Vertebrates • • •Ecosystems
Marine • • •Freshwater • • •Forests • • • • • •Grassland & Savana • • • • •Desert • • • •Tundra • • •Mountain • • • •Agroecosystems • • • • •Urban ecosystems • • • •Species interactions
Plant-insect •Plant-microbial •Abiotic features
Soil properties •Source: After Kinzig et al., 2007.

Ecosystem accounting and the cost of biodiversity losses
Biodiversity and the valuation of ecosystem services
26
treated as externalities where markets fail. In these situations, decision-makers try to correct the failure by creating market-like situations. They do this by attempting to obtain the subjective value of services through various valuation techniques based on stated preferences.
In the case of regulating services, for example climate, waste treatment capacity, nutrient management and various watershed functions, classic market failure is common (Bator, 1954). Such difficulties are particularly problematic when the consequences of market failure and biodiversity loss fall upon the most vulnerable sections of society, especially in developing countries, where many people depend upon them for their livelihood. As a result, in recent years there has been an added focus on creating situations in which markets can be created, so that desirable outcomes can be achieved in terms of implications of different decisions that impact on ecosystems and, in turn, human well-being (Costanza et al., 1995). Thus, increasingly, valuation issues have become central to debates about conservation of both biodiversity and ecosystem services.
Also in recent years there have been concerted attempts to value ecosystem services. Some have been targeted towards terrestrial ecosystem services (Daily et al., 1997) and a few have focused on marine ecosystems (Duarte, 2000). Some studies have tried
to capture the value of all types of ecosystem and services at the global scale (Costanza et al., 1997; Limburg and Folke, 1999; Woodward and Wui, 2001). Although such work has drawn the attention of researchers as well as practitioners and conservation managers and has stimulated interest in the valuation problem, it has not been without its criticisms, especially in relation to uncertainty associated with estimates (Winkler, 2006) and the methods used to reveal preferences (Allen and Loomis, 2006). One of the most serious criticisms is the use in these studies of the benefit transfer method and replacement costs approach.
However, the valuation of ecosystem services is not meant merely to show the importance of ecosystems to society, but rather to enable decision-makers to evaluate alternative courses of action and thus clarify the dilemmas that arise from being faced with conflicting choices. Essentially, the valuation of ecosystem services helps the decision-making process in the following ways:
• bycapturingsomeofthesomeoftheoutofmarket services;
• byhelpingdecision-makerstoexaminetrade-offs and explore alternative courses of action;
• byextendingcostbenefitanalysis(CBA);• byassistinginthedevelopmentofgreen
accounting as per SEEA2003 (UNSD);
Figure 2.2 The ecosystem valuation framework
Step 4: Aggregation or comparison
Step 1: Geographical specificationof the boundaries of the system
Step 2: Assessment of ecosystem
Step 3: Valuation using monetaryor other indicators
Ecosystem
Optionvalues
Indirect usevalues
Non-usevalues
Direct usevalues
Total economic value (TEV)
Regulationservices
Provisioningservices
Culturalservices
Source: Hein et al., 2006.
Note: The solid arrows represent the most important links between the elements of the framework. The dashed arrows indicate the four principal steps in the valuation of ecosystem services.

Ecosystem accounting and the cost of biodiversity losses 27
• inthecontextofsectoralandprojectpolicies,bystrengthening environmental impact assessment and making appraisal criteria more acceptable, transparent and credible.
Overall, the valuation of ecosystems has the potential to clear the clouds of conflicting goals in terms of political, social and economic feasibility of the policies, although clearly it might not be the last word on the matter.
Valuation of biodiversity-dependent ecosystem services: principles and examples
Ecosystems provide valuable services. The strong indication that these services have been degraded considerably in last 50–60 years (MA, 2005) is a major cause of concern for scientists and decision-makers. For example, more land has been converted to cropland since 1945 than in the 18th and 19th centuries combined; 25 % of the world's coral reefs have been badly degraded or destroyed and 35 % of mangrove area lost in the last two or three decades (MEA, 2005). The question that then arises is, how valuable are the services that are and were associated with these ecosystems? We need to be able to answer this question to inform the
Table 2.1 Most widely used approaches to service valuation
Methodology Approach Applications
Change in productivity
Trace impact of change in environmental services on produced goods
Any impact that affects produced goods (for example, declines in soil quality affecting agricultural production)
Cost of illness, human capital
Trace impact of change in environmental services on morbidity and mortality
Any impact that affects health (for example, air or water pollution)
Replacement cost Use cost of replacing the lost good or service
Any loss of goods or services (for example, previously clean water that now has to be purified in a plant)
Travel cost method Derive demand curve from data on actual travel costs
Recreation, tourism
Hedonic prices Extract effect of environmental factors on price of goods that include those factors
Air quality, scenic beauty, cultural benefits (for example, the higher market value of waterfront property, or houses next to green spaces)
Contingent valuation Ask respondents about their willingness to pay for a specified service
Any service (for example, willingness to pay to keep a local forest intact)
Choice modelling Ask respondents to choose their preferred option from a set of alternatives with particular attributes
Any service
Benefits transfer Use results obtained in one context in a different context
Any service for which suitable comparison studies are available
choices we make in relation to how we manage these ecosystems in the future.
Valuation provides insight into the losses (or gains) across different stakeholders arising out of perturbations in ecosystems and subsequent services. Such work ensures that choices are better informed by assessing who the losers and winners are, which can clearly be very important for evaluating the outcomes of public policy options. The general approach used to make valuations is based on the fact that human beings derive benefit (utility) from the use of ecosystem services either directly or indirectly, whether currently or in the future. However, several important aspects of this valuation paradigm need to be stressed.
First, the utility that an individual human being derives from a given ecosystem service depends on that individual's preferences. The utilitarian approach, therefore, bases its notion of value on attempts to measure the specific utility that individual members of society derive from a given service, and then aggregates across all individuals, weighting them all equally.
Second, utility cannot be measured directly. In order to provide a common metric that can be used to express the benefits of the very diverse

Ecosystem accounting and the cost of biodiversity losses
Biodiversity and the valuation of ecosystem services
28
variety of services provided by ecosystems, the utilitarian approach attempts to measure all services in monetary terms. This is purely a matter of convenience, in that it uses units that are widely recognised, saves the effort of having to convert values already expressed in monetary terms into some other unit, and facilitates comparison with other activities that also contribute to societal well-being. It explicitly does not mean that only services that generate monetary benefits are taken into consideration in the valuation process. On the contrary, the essence of almost all work on valuation of environment and ecosystems has been to find ways to measure benefits that do not enter markets and so have no directly observable monetary benefits.
Valuation of ecosystem services for cost-benefit analysis or integrated ecosystem accounting under SEEA calls for an interdisciplinary effort from both economists and ecologists. Overall, it requires the application of a consistent set of logical steps involving the identification of key services, appropriate biophysical data, monetisation and aggregation (Figure 2.2). While the production and asset boundary should be carefully defined and the distinction between intermediate and final outputs from ecosystems clearly defined, the initial condition of the ecosystem and the beneficiary's preference must also be clearly identified. Some of the most widely used valuation methods are summarised in Table 2.1.
Some of the lessons emerging from recent work in the area are that:
• valuingecosystemservicesrequiresintegratingecology and economics, with ecology providing
insights into how services are generated, and economics establishing the relative worth of services through market and non-market valuation techniques. By providing insights into questions about how the quantity and quality of services change under various possible states of the ecosystem or how human action changes the production of services, natural scientists can provide a robust framework in which valuation studies can be made;
• valuationofecosystemserviceshastobecontextspecific, ecosystem specific and guided by the perception of beneficiaries;
• totalvaluationevaluateswholecatchments,landscapes, or mapping unit, while marginality valuation evaluates the incremental changes in ecosystem services as a consequence of some measured pressure on the ecosystem under consideration. Increasingly, however, the focus of valuation studies should be on marginal change in value rather than the calculation of total value. In this context, a sound understanding of the initial condition or state of the ecosystem is essential, along with an understanding of how that system might change under a given set of policy or management interventions, or other more indirect drivers;
• whencarryingoutvaluationofecosystemservices, the services should be independent of each other. Establishing clear-cut biophysical linkages and relationships not only facilitates the valuation exercise but also ensures its credibility in public policy debates;
• establishingpropertyrightsfortheecosystemiscritically important for valuation;
• whileundertakingvaluation,issuesofirreversibility and resilience must be kept in mind;
Table 2.2 The valuation of ecosystem services – when, why and how?
Approach Why do we do it? How do we do it?
Determining the total value of the current flow of benefits from an ecosystem
To understand the contribution that ecosystems make to society
Identify all mutually compatible services provided. Measure the quantity of each service provided and multiply by the value of each service
Determining the net benefits of an intervention that alters ecosystem conditions
To assess whether the intervention is economically worthwhile
Measure how the quantity of each service would change as a result of the intervention, as compared to their quantity without the intervention; multiply by the marginal value of each service
Examining how the costs and benefits of an ecosystem (or an intervention) are distributed
To identify winners and losers, for ethical and practical reasons
Identify relevant stakeholder groups; determine which specific services they use and the value of those services to that group (or changes in values resulting from an intervention)
Identifying potential financing sources for conservation
To help make ecosystem conservation financially self-sustaining
Identify groups that receive large benefit flows, from which funds could be extracted using various mechanisms
Source: After Pagiola et al., 2004.

Biodiversity and the valuation of ecosystem services
Ecosystem accounting and the cost of biodiversity losses 29
• uncertaintyisoneofthekeychallengesinvaluation of ecosystem services, so decision-makers will therefore value a sensitivity analysis;
• participatoryexercisesimprovetherepresentativeness of the sample, ensuring participation, and embedding outcomes in the institutional processes would enable the valuation more authentic and acceptable to the decision-makers.
Valuations are essentially about assigning relative weights to the various aspects or circumstances when making a decision. When we value the services of ecosystems, and decision-makers take these values into account when making policies, a framework for distinguishing and grouping these values is required. The context of valuation of ecosystem services, its purpose and appropriateness of methodology are the key considerations. Pagiola et al. (2004) provides a useful summary (Table 2.2).
Several issues pertinent to valuation of ecosystem services and application to decision-making have emerged, especially with a better understanding of the mechanisms of ecosystem functioning. The relevance of the state of ecosystem functioning has not been given adequate emphasis in the derivation of ecosystem values, thereby rendering the values derived of little worth, particularly when one is examining issues related to sustainability.
In order to provide meaningful indicator of the scarcity of ecosystem services and functions, economic valuation should account for the state of ecosystem. Even though ecosystems can recuperate from shocks and disturbances, through the inherent property of resilience, in some instances the ecosystem may shift to an entirely new state of equilibrium (Holling, 2001; Walker and Pearson, 2007). Standard economic-theory-based concepts deriving ecosystem values using marginal analytic methods are limited to situations where ecosystems are relatively intact and functioning in normal bounds far away from any bifurcation (Limburg et al., 2002). This is of particular significance to developing countries, where significant trade-offs exist between conservation and economic development, and decisions often favour the latter. Therefore, decisions made on the basis of a snapshot ecosystem value can result in false policy directives.
The second issue concerns the aggregation of individual values to arrive at larger values, namely societal values. Ecosystem goods and services, by definition, have a public dimension, whatever the
property right regime, public, common or private. It means that several additional benefits accrue to society as a whole, apart from the benefits provided to the individuals (Daily, 1997; Wilson and Howarth, 2002). The theoretical underpinnings of economic valuation methodologies rest on the axiom of individual preferences and individual utility maximisation, which do not justify the public good characteristic of ecosystem services. Valuation methodologies, such as contingent valuation, utilise individual preferences as a way of deriving values and these may be used for resource allocation where these goods are largely public in nature. A considerable body of recent literature therefore favours adoption of a discourse-based valuation (Wilson and Howarth, 2002). The primary focus of a discourse-based valuation approach is to come up with a consensus societal value of scarcity indicator, derived through a participatory process, to be used for allocation of ecological services largely falling into the public domain.
The application of the conventional approaches to economic valuation becomes further constrained when sustainability and social equity are also included as goals along with economic efficiency for ecosystem management (Costanza and Folke, 1997). While the methodologies for deriving values with economic efficiency are comparatively well developed, integrating equity and sustainability requires several things: first, a better understanding of the functional relationships between the various parameters and phenomena responsible for generating the services; second, an understanding of the social mechanisms or processes governing value formation (discourse-based valuation being one such approach).
Finally, it must be recognised that ecosystem services can be observed to be flowing at different spatial scales, ranging from micro watershed to biome level. The variation in scale at which these services and subsequent benefits are arising could pose a problem in accounting and valuation. The ecological scale usually does not match the scales of decision-making unit for which accounting, and valuation is executed. This mismatch, along with other epistemological gaps, remains a challenge to scientists (Reid et al., 2006). Provisioning services and cultural services are mostly related to tangible outputs – the producers or consumers are known and hence the scale is clearly identified – but regulating services occur at different spatial scales as shown in Table 2.3. This mismatch of scale and actors basically means that by internalising the conventional externality the gainers and losers have provided an additional rationale for accounting of

Ecosystem accounting and the cost of biodiversity losses
Biodiversity and the valuation of ecosystem services
30
costs of restoration of biodiversity and management of ecosystem services.
Biodiversity and international trade
Trade is a major driver of change in ecosystem services and biodiversity. This macroeconomic driver causes a loss in one part of the world while the real action (import and consumption) happens elsewhere. Deforestation in Amazonia due to cattle ranching, for example, is stimulated by demand for Brazilian beef in North America and Europe. Trading in virtual water, especially from semi-arid parts of the world, and loss of mangrove forest in Sundarbans due to the growing demand for tiger prawn from Japan and America, are some other well-known examples While the foreign exchange earned in the national economies of India or Bangladesh reflect is reflected in their net income from abroad, the costs of biodiversity loss or coastal water pollution are not recorded – thus violating the accounting principles of double-entry book keeping. The importance of developing such accounts when looking at biodiversity loss issues can best be illustrated by reference to the case of aquaculture.
Chopra, Kapuria and Kumar (2008, forthcoming) have documented the impact of aquaculture export from Sundarbans mangroves and its impact on human well-being, paying particular attention to the costs of biodiversity loss in the region.
Modern aquaculture undertaken in intensive and semi-intensive ways, with high stocking density, is known to have profound impacts on coastal ecosystems. One of the major impacts happens to be the conversion of agricultural areas and mangroves to land devoted to aquaculture. Usually the conversion involves agricultural fields and land adjoining mangroves, which are ecologically fragile.
One of the serious drawbacks of modern aquaculture is that it is driven by current revenue maximisation and hardly pays any attention to long-term ecological balance (Folke et al., 1998; Gunawardena and Rowan, 2005). Internalising these ecological costs into the pricing structure would be a possible policy response. Accounting for the costs would be an absolute necessity. Internalisation of these ecological costs into mainstream national accounts would reveal the costs society (the consumers in the industrial countries) should pay for its consumption and preferences and which are presently transferred de facto to the suppliers (invariably poor people in the aquaculture exporting country). Ecological costs, if embedded into the pricing, would also pave the path for sustainable development.
Activities like aquaculture have serious ecological implications that impact society and human well-being. By impacting on the state of ecosystems, aquaculture impairs the functionality of ecosystems and their capacity to deliver a wide range of other
Ecological scale Dimensions (km2) Regulation services
Global > 1 000 000 Carbon sequestration
Climate regulation through regulation of albedo, temperature and rainfall patterns
Biome-landscape 10 000–1 000 000 Regulation of the timing and volume of river and ground water flows
Protection against floods by coastal or riparian ecosystems
Regulation of erosion and sedimentation
Regulation of species reproduction (nursery service)
Ecosystem 1–10 000 Breakdown of excess nutrients and pollution
Pollination (for most plants)
Regulation of pests and pathogens
Protection against storms
Plot-plant < 1 Protection against noise and dust
Control of run-off
Biological nitrogen fixation (BNF)
Table 2.3 Most relevant ecological scales for the regulation services
Source: After Hein, 2006.
Note: Some services may be relevant at more than one scale.

Biodiversity and the valuation of ecosystem services
Ecosystem accounting and the cost of biodiversity losses 31
services that are beneficial to society. Modern aquaculture seems to emerge as one such activity especially in coastal areas and mangroves. This can be better understood in terms of the ecological footprint.
Rees and Wackernagel (1994) explain ecological footprint as the land area necessary to sustain current levels of resource consumption and waste discharge by a human population. They were the first to introduce this concept, but the spirit of the concept goes back to Bogstrom's ghost acreage, reflecting areas of agricultural land required for fuel consumption, and Odum's (1989) energy, showing the amount of energy consumed per unit of area per year. Using these ideas, Rees and Wackernagel estimated, for example, that for food, forestry products, carbon dioxide assimilation and energy the Fraser Valley in Vancouver depends on an area 19 times larger that contained within its boundaries. They go further and suggest that it would not be possible to sustain the present human population of more than 6 billion people at the same material standard as that enjoyed in the US without having the resources of at least two additional planets (Rees and Wackenagel, 1996). In the same vein, another concept – carrying capacity – is sometimes used: the maximum rate of resource consumption and waste discharge that can be sustained indefinitely without progressively impairing the functional integrity and productivity of ecosystems.
Some commentators maintain ecological footprint is a static concept. Ecosystems are dynamic and characterised by a complex of behaviours involving non-linearities, thresholds and discontinuities (Costanza et al., 1993). Although the idea of an ecological footprint may not be able to capture the dynamic aspects of ecosystems, it does shed some
light on the precise requirement of human activities such as modern aquaculture. Ever-expanding aquaculture is projected as a saviour of growth and a bringer of prosperity in developing countries, but monoculture-dominated aquaculture uses ecosystem services for the purposes of production. It uses ecosystem services for all its input requirements – feed, seed, water, waste treatment etc., and yet it does not pay their full costs.
Folke et al. (1998) have estimated the ecological footprint of seafood production. For shrimp pond farming, the requirement is 34–187 hectares per hectare of farming area. Waste assimilation also needs 2–22 ha/ha of farming. They go on to suggest that the implication of the size of the supporting mangrove nursery area becomes clearer when shrimp farming is analysed at a national and regional level where usually the mangrove nursery area for post larvae extends far beyond the physical location of the shrimp farms (Table 2.4).
These footprint estimates show that aquaculture is not sustainable. For example, shrimp pond farming is largely dependent on wild-caught prawn seed. The way this is collected causes serious damage to wild fish and other coastal organisms, with serious consequences for coastal biodiversity.
Aquaculture includes farming of aquatic organisms like fish, shrimps, crustaceans, and many other species for food and ornamental purposes (for example, pearl). Its most distinctive feature is its controlled production with greater precision in inputs. The FAO defines aquaculture as 'the farming of aquatic organisms in inland and coastal areas involving interactions in the rearing process to enhance production and the individual or corporate ownership of the stock being cultivated'. The International Standard Industrial Classification of
Activity Resource production support
Waste assimilation
Salmon cage farming, Sweden 40 000–50 000 .....
Tilapia cage farming, Zimbabwe 10 000 115–275
Fish tank system, Chile ..... 16–180
Shrimp pond farming, Columbia 34–187 .....
Shrimp pond farming Asia ..... 2–22
Mussel rearing, Sweden 20 .....
Cities in the Baltic Sea drainage basin 133 .....
Table 2.4 The ecological footprint of seafood production
Note: Values are area of footprint per area of activity, ha/ha.
Source: Adapted from Folke et al., 1998.

Ecosystem accounting and the cost of biodiversity losses
Biodiversity and the valuation of ecosystem services
32
Country Quantity Value
M tonnes % USD million % USD '000/tonne
China 30.6 67.3 30 870 48.7 1.01
India 2.5 5.4 2 936 4.6 1.19
Vietnam 1.2 2.6 2 444 3.9 2.04
Thailand 1.2 2.6 1 587 2.5 1.35
Indonesia 1.0 2.3 1 993 3.1 1.91
Bangladesh 0.9 2.0 1 363 2.2 1.49
Japan 0.8 1.7 3 205 5.1 4.13
Chile 0.7 1.5 2 801 4.4 4.15
Norway 0.6 1.4 1 688 2.0 2.65
USA 0.6 1.3 907 1.4 1.50
Table 2.5 Volume and value of aquaculture production
All economic activities recognises aquaculture as a separate activity, although only in recent years has the data on aquaculture been provided separately from the data on fisheries.
Shrimp, along with salmon, constitutes the major share in aquaculture in terms of value and volume of global trade. Aquaculture as a whole has experienced an added momentum in production and trade all over the world during the last three decades (1975–2005). Since the 1980s production has increased and trade has accelerated. The average rate of growth of aquaculture has been more than 10 % per annum since the 1980s, and output had reached 259.4 million tonnes with a value of USD 70.3 billion in 2004. Over the same period, capture fisheries grew at the rate of only 2 % per annum. Although aquaculture has achieved global-industry status, developing countries have a more than 90 % share (Table 2.5). Of this, Asian countries contribute 89 % of aquatic production (80 % in value terms) (World Bank, 2006). Among the Asian nations China has the major share at 67 % and 49 % in volume and value terms respectively, followed by India. Following the principle of accounting and the spirit of sustainable development, the costs of biodiversity loss due to this export must be accounted and adjusted, but the national accounts in consuming countries do not seem to reflect this situation.
Conclusion
This chapter has considered the parameters of the valuation problem. As discussed in Chapter 1, valuation data are an important part of ecosystem accounting, giving us information about the marketed and non-marketed services used directly by people. However, these data are often unavailable or partial, and so the picture we build of the importance of a particular ecosystem may be far from complete. Frequently we only have physical data about the state and trends exhibited by an ecosystem and can only speculate about what the changes in value to people might be. The chapters that follow consider wetlands in the Mediterranean in terms of the extent to which the data currently available allow us to construct both physical and economic accounts, and examine the extent to which we can value the current flow of benefits they provide. They also describe the net benefits of an intervention that alters ecosystem conditions and the ways those benefits are distributed, and identify ways of financing the conservation and maintenance of these systems. This work is based on the premise that the valuation of ecosystem services has to be context specific, guided by the perceptions and needs of beneficiaries. Thus the focus of the study is on using accounts to determine the extent to which the ecological integrity of these wetlands systems is intact, and how accounts can be used to better understand costs of restoring and sustaining their functioning.
Source: After World Bank, 2006.

33
Socio-ecological systems, ecosystem accounting and wetlands in the Mediterranean
Ecosystem accounting and the cost of biodiversity losses
Introduction
Socio-ecological systems are those in which there is a close coupling, or linkage, between social and ecological processes (Gallopin, 1991). The social component may include individuals, groups, institutions and political organisations, while the ecological consists of the biophysical structures and processes that we recognise as an ecosystem (Vandewalle et al., 2008). Although both components can show independent behaviour, it is also clear that they can exhibit strong mutual interdependencies. Institutions and markets can shape the way people interact and use ecosystems; biophysical structures and processes fundamentally determine the quantity and quality of the ecosystems services that are potentially available to society.
As suggested in Figure 3.1, socio-ecological systems operate at a number of different nested spatial
3 Socio-ecological systems, ecosystem accounting and the case of wetlands in the Mediterranean
Figure 3.1 Conceptual diagram of elements of a social-ecological system
and temporal scales and are thus best regarded as complex multi-scale systems. In relation to spatial scale, for example, an individual species may be part of a local wetland, which is in turn part of a larger watershed basin. Similarly, individuals and institutions may be connected hierarchically, taking in local, national and international levels (Ostrom, 1990). In relation to time, not only do SES have a history, but also the different components may respond at different rates to the things that influence them; SES may exhibit both fast operating localised changes and longer-term, broad scale patterns of change (Holling et al., 2002). For example, ecosystem services such as food production are dependent on both shorter-term factors, such as the growth of annual plants and pattern of the seasons, as well as longer term changes related to biogeochemical processes (for example, climate change) and various social driving forces (ageing population) that may occur over decades or
Local ecosystems
Ecosystemservices
Human actions
Interventions
Biodiversity
Ecosystem
Watershed bassin
Local institutions
People
Social system
Na
tiona
l–Regional institutions
Source: After Resilience Alliance, 2007c.

Ecosystem accounting and the cost of biodiversity losses
Socio-ecological systems, ecosystem accounting and wetlands in the Mediterranean
34
centuries. SES can therefore exhibit novel behaviours that would not be expected from looking at social and ecological systems in isolation. Some of the most important characteristics of SES is that they can exhibit feedback and resilience, and non-linear dynamics with thresholds, time lags and alternative stable states (Gatzweiler and Hagedorn, 2002; Liu et al., 2007). As a result, management or policy interventions in such systems may be difficult and can involve making decisions against a backdrop of considerable uncertainty. Ecosystem accounting may offer a framework in which some of these issues can be addressed systematically.
Socio-ecological systems as accounting units
The concept of a socio-economic system is important because it helps overcome the separation of thinking about human and natural systems that has characterised western thought since the Enlightenment (Davidson-Hunt and Berkes, 2003). Many have argued that the traditional human-nature dichotomy is inadequate for addressing sustainability problems, which involve phenomena at the interface between nature and society. The socio-economic system concept has been promoted as one way of articulating the humans-in-nature paradigm (Berkes and Folke, 1998), and to show that an understanding of the dynamics of social and ecological dynamics cannot be achieved by looking at them in isolation.
A number of recent studies have focused on the relationships between ecological and social systems, aiming to identify and characterise interactions existing between people, biodiversity and ecosystems (Anderies at al., 2004; Liu et al., 2007). Moreover, there is a growing body of work that seeks to develop the guidelines for assessing and managing resilience in social-ecological systems (Resilience Alliance, 2007 a, b, c). It has been argued that any analysis of these complex systems must consider not only social and ecological characteristics, but also others that emerge from coupled social-ecological dynamics. Thus, while the social characteristics can be described by indicators such as employment, population structure and governance arrangements, and the natural characteristics of these systems described in terms of biodiversity at the species and habitat levels, the coupled nature of SES can be captured though analysis of the dynamics of land cover and use, the study of human impact and the system resilience, and the assessment of ecosystem services.
Despite the increasing body of work describing change in SES, however, it is by no means clear how universal the different types of dynamic are, or the particular circumstances under which different kinds of behaviour might arise. Thus there remains a considerable research challenge. As a first step we need tools that allow us to track change systematically in order to document the trajectories that SES exhibit. We also need methods of providing information to resource managers or policy advisors on the costs of biodiversity loss. This report suggests that ecosystem accounting is one such tool.
As Chapters 1 and 2 of this report show, ecosystem accounts are a systematic way of documenting both the structural characteristics and functional status of ecosystems, and the ways they are linked to the wider economy. Interestingly, accounts are not a concept that has been widely discussed in relation to the problems of characterising social-ecological systems, despite the fact that they can potentially provide a rich and detailed description of the relationships between components of natural and social systems. The aim of this study is therefore to show more fully how these tools can be used, and to illustrate what insights they can provide by looking at the case of Mediterranean wetlands.
One of the key issues in any accounting or valuation exercise is how to define the boundaries of the system of interest (see for example Figure 3.2). This is also an issue that arises in relation to the characterisation of socio-ecological systems, and it has been argued that, in fact, there is no perfect way to set the boundaries of a system. Initial assessments, it is suggested, may need to be modified as the understanding of a given problem changes (Resilience Alliance, 2007b). In other words, analysis, like accounts, must be purpose driven. This study focuses, in particular, on how SES might be defined in accounting terms and how cross-scale and cross-boundary issues can be taken into account. All SES are essentially open systems, and the problem of imports and exports across their boundaries, however defined, is an issue that accounts might help to resolve.
In order to take this work forward, we have chosen to focus on the coastal wetlands of the Mediterranean Basin. The social-ecological system perspective has not been used extensively for the study of these ecosystems and an additional aim of this work is to extend the framework to this important topic area. The lack of application of the SES concept to the Mediterranean is paradoxical because, as Naveh and Lieberman (1993) note, resource use and transformation is so long-standing
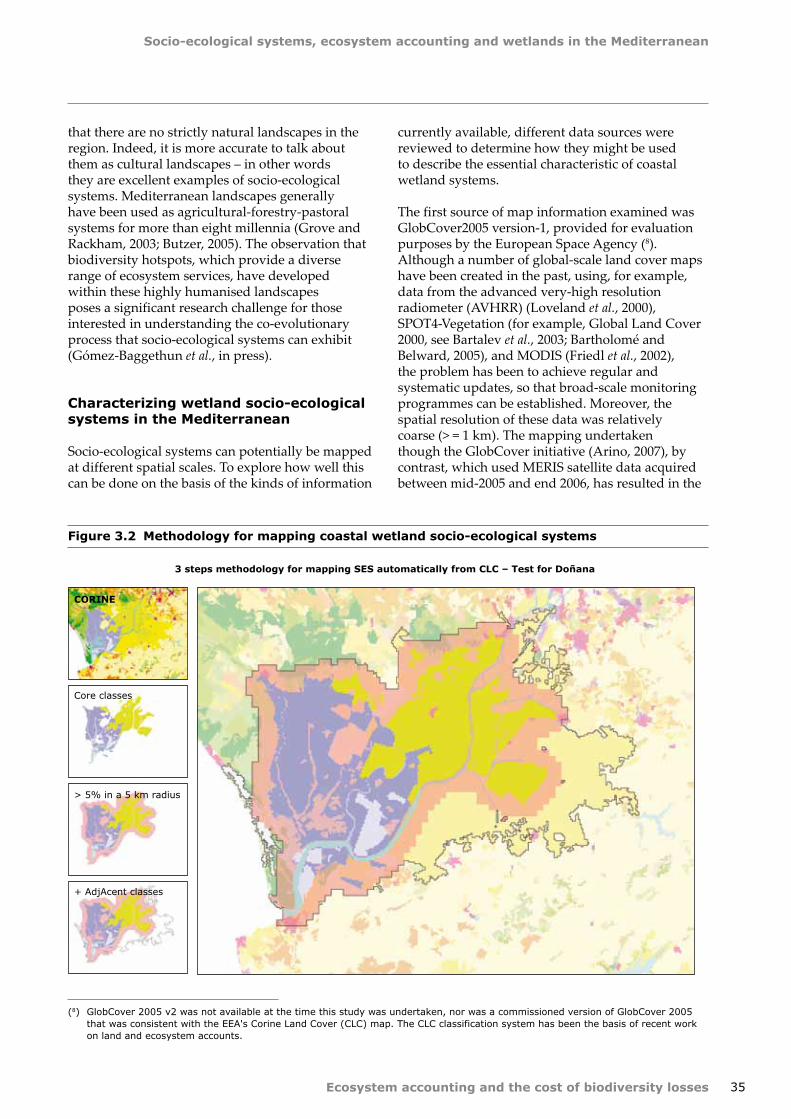
Socio-ecological systems, ecosystem accounting and wetlands in the Mediterranean
Ecosystem accounting and the cost of biodiversity losses 35
that there are no strictly natural landscapes in the region. Indeed, it is more accurate to talk about them as cultural landscapes – in other words they are excellent examples of socio-ecological systems. Mediterranean landscapes generally have been used as agricultural-forestry-pastoral systems for more than eight millennia (Grove and Rackham, 2003; Butzer, 2005). The observation that biodiversity hotspots, which provide a diverse range of ecosystem services, have developed within these highly humanised landscapes poses a significant research challenge for those interested in understanding the co-evolutionary process that socio-ecological systems can exhibit (Gómez-Baggethun et al., in press).
Characterizing wetland socio-ecological systems in the Mediterranean
Socio-ecological systems can potentially be mapped at different spatial scales. To explore how well this can be done on the basis of the kinds of information
currently available, different data sources were reviewed to determine how they might be used to describe the essential characteristic of coastal wetland systems.
The first source of map information examined was GlobCover2005 version-1, provided for evaluation purposes by the European Space Agency (8). Although a number of global-scale land cover maps have been created in the past, using, for example, data from the advanced very-high resolution radiometer (AVHRR) (Loveland et al., 2000), SPOT4-Vegetation (for example, Global Land Cover 2000, see Bartalev et al., 2003; Bartholomé and Belward, 2005), and MODIS (Friedl et al., 2002), the problem has been to achieve regular and systematic updates, so that broad-scale monitoring programmes can be established. Moreover, the spatial resolution of these data was relatively coarse (> = 1 km). The mapping undertaken though the GlobCover initiative (Arino, 2007), by contrast, which used MERIS satellite data acquired between mid-2005 and end 2006, has resulted in the
(8) GlobCover 2005 v2 was not available at the time this study was undertaken, nor was a commissioned version of GlobCover 2005 that was consistent with the EEA's Corine Land Cover (CLC) map. The CLC classification system has been the basis of recent work on land and ecosystem accounts.
Figure 3.2 Methodology for mapping coastal wetland socio-ecological systems
Core classes
CORINE
> 5% in a 5 km radius
+ AdjAcent classes
3 steps methodology for mapping SES automatically from CLC – Test for Doñana

Ecosystem accounting and the cost of biodiversity losses
Socio-ecological systems, ecosystem accounting and wetlands in the Mediterranean
36
production of a global land cover map at 300 metre resolution using cover classes consistent with the FAO Land Cover Classification System. Since these data will be freely available, it is likely that these and other similar products will become widely used as a source of basic environmental information at the macro-scale (9).
The second source of data considered was Corine Land Cover (CLC). Three land cover time slices are available for more than 35 countries in Europe: 1990 (circa), 2000 and the most recent update, 2006. The EEA has used these data extensively for building land cover accounts based on gridded maps of land cover stock and change at 1 hectare and 1 km2 (EEA 2006). CLC is therefore potentially able to give a picture of the structure of SES at the meso-scale.
However, before either of these data sources can be used to map different types of SES, some algorithm or rules are needed to aggregate the land cover classes into larger units that correspond to the target of the socio-ecological system. Since the properties of CLC data were already well known, the
development of an automated mapping procedure was first tried using this information source.
Socio-ecological systems have no crisp boundaries, and any mapping is an approximation even at the local scale. Nevertheless, consistent mapping of such units can at least be achieved by aggregating combinations of land cover types that are considered typical of them. Thus in the case of coastal wetlands a set of 'core areas' were identified using the wetland classes of the CLC classification system, and these were expanded by enlarging the boundary of the SES using a 5 km buffer, to include associated cover types such as irrigated areas, dunes separating wetlands from the sea, and settlements surrounded by these element. The process is illustrated in Figure 3.2, using the example of the wetlands of Doñana, Spain. Using this procedure, 159 individual coastal wetland SES were mapped across the Mediterranean Basin (10).
Figure 3.3 shows the pan-Mediterranean picture that can be built up using these data sources. In this map, the automatically identified SES derived
Figure 3.3 Pan-Mediterranean mapping of coastal wetland socio-ecological systems
(9) GlobWetlands programme of the European Space Agency, for example, will use very high-resolution satellite images to map wetlands. The frequency of satellite images acquisition will allow seasonal dynamics to be monitored, and so provide information on land and water biomass, eutrophication levels, turbidity and sediment loads. Moreover, given that the data are generated by radar, cloud cover will not be an issue.
(10) Note that the term Mediterranean is used loosely and includes wetlands on the southern Atlantic coast of Spain, and the Black Sea.
ramsarDB_10km
SES WetlandsTest automatic mapping
CLC_SES_wetlands_northGC_SES_wetlands_south & eastcoastline_buffer 10+10km010 Cultivated Managed11 Irrigated Post flooded14 Rainfed cropland20 Mosaic (~242-243-244)21 Mosaic (~242-243)30 Mosaic (~243)40 to 100 Forest110; 120 Transitional woodland shrub130 Shrubland140 Grassland150 Sparse vegetation180 Wetlands190 Artificial areas, urban200 Bare areas210 Water bodies (incl lagoons, estuaries)220 Permanent snow and ice230
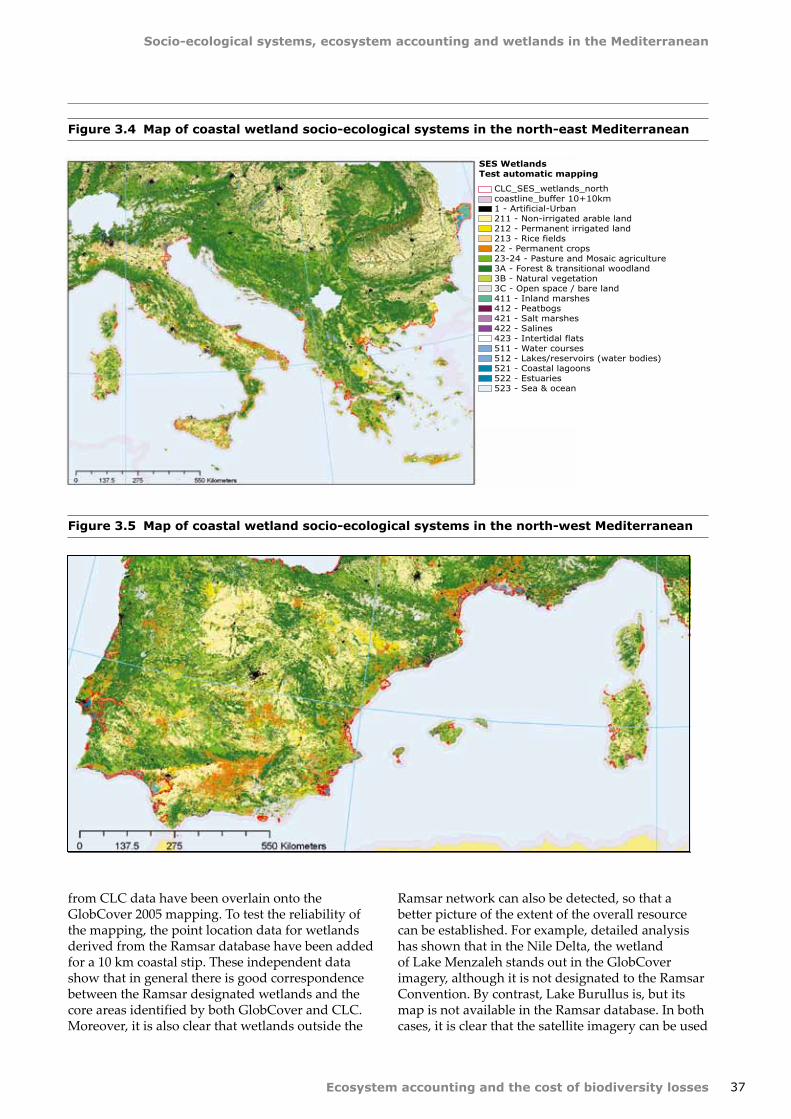
Socio-ecological systems, ecosystem accounting and wetlands in the Mediterranean
Ecosystem accounting and the cost of biodiversity losses 37
Figure 3.4 Map of coastal wetland socio-ecological systems in the north-east Mediterranean
Figure 3.5 Map of coastal wetland socio-ecological systems in the north-west Mediterranean
SES WetlandsTest automatic mapping
CLC_SES_wetlands_northcoastline_buffer 10+10km1 - Artificial-Urban211 - Non-irrigated arable land212 - Permanent irrigated land213 - Rice fields22 - Permanent crops23-24 - Pasture and Mosaic agriculture3A - Forest & transitional woodland3B - Natural vegetation3C - Open space / bare land411 - Inland marshes412 - Peatbogs421 - Salt marshes422 - Salines423 - Intertidal flats511 - Water courses512 - Lakes/reservoirs (water bodies)521 - Coastal lagoons522 - Estuaries523 - Sea & ocean
from CLC data have been overlain onto the GlobCover 2005 mapping. To test the reliability of the mapping, the point location data for wetlands derived from the Ramsar database have been added for a 10 km coastal stip. These independent data show that in general there is good correspondence between the Ramsar designated wetlands and the core areas identified by both GlobCover and CLC. Moreover, it is also clear that wetlands outside the
Ramsar network can also be detected, so that a better picture of the extent of the overall resource can be established. For example, detailed analysis has shown that in the Nile Delta, the wetland of Lake Menzaleh stands out in the GlobCover imagery, although it is not designated to the Ramsar Convention. By contrast, Lake Burullus is, but its map is not available in the Ramsar database. In both cases, it is clear that the satellite imagery can be used

Ecosystem accounting and the cost of biodiversity losses
Socio-ecological systems, ecosystem accounting and wetlands in the Mediterranean
38
Figure 3.6 Map of coastal wetland socio-ecological systems in the north Adriatic
Figure 3.7 Map of coastal wetland socio-ecological systems in the north Aegean
to make a quick scan of the large areas and create a framework in which more detailed and targeted monitoring might be established.
More detailed views of the wetland SES using the same data are provided in Figure 3.4–3.7.
SES WetlandsTest automatic mapping
CLC_SES_wetlands_northGC_SES_wetlands_south & eastcoastline_buffer 10+10km1 - Artificial-Urban211 - Non-irrigated arable land212 - Permanently irrigated land213 - Rice fields22 - Permanent crops23-24 - Pasture and Mosaic agriculture3A - Forest & transitional woodland3B - Natural vegetation3C - Open space / bare land411 - Inland marshes412 - Peatbogs421 - Salt marshes422 - Salines423 - Intertidal flats511 - Water courses512 - Lakes/reservoirs (water bodies)521 - Coastal lagoons522 - Estuaries523 - Sea & ocean
ramsarDB_10km

Ecosystem accounting and the cost of biodiversity losses 39
ScalesAccounts Governance
Framework Coverage Indicators/Aggregates Institutions Measures
Glo
bal/
Co
nti
nen
tal
SNA macro-adjustments (simplified accounts)
• Six indicators representing total ecological potential
• Externaltradebalance/Virtual use, footprints
• Averagerestorationcosts
• Consumptionofecosystem capital
• Externaltradebalance/Virtual transfers, ecological debts
• Lossoftotalecologicalpotential (physical degradation)
• Virtualtransfersandfootprint accounts (land, carbon, water…)
• BeyondGDPAccounting
• Consumptionofecosystem capital (cost of mitigating physical degradation)
• AdjustedSNAaggregate/Disposable national income
• AdjustedSNAaggregate/Final demand at full cost, imports/exports
• AdjustedSNAaggregate/Imports/Exports at full cost
• Internationalconventions
• Internationalfinancial institutions
• Marketregulationauthorities
• Internationalandtransnational organisations
• Monitoringofdistanceto targets
• Internationalfinancialstandards (for loans…)
• Globalmarketofecosystem permits, IPES
• Programmesassessment (for example, REDD)
• Contributiontothe budget of international organisations
• Businessaccountingstandards, norms, ecological rating
Nati
on
al/
Reg
ion
al
SNA macro-adjustments (detailed accounts)
• Six indicators representing total ecological potential
• Externaltradebalance/Virtual use, footprints
• Averagerestorationcosts
• Consumptionofecosystem capital
• Externaltradebalance/Virtual transfers, ecological debts
• Lossoftotalecologicalpotential (physical degradation)
• BeyondGDPaccounting
• Consumptionofecosystem capital (cost of mitigating physical degradation)
• AdjustedSNAaggregate/Disposable national income
• AdjustedSNAaggregate/Final demand at full cost, imports/exports
• AdjustedSNAaggregate/Imports/Exports at full cost
• Ministriesofeconomy and finance
• Environmentalagencies
• Sectorministries
• Parliaments
• Courts(compensations…)
• BeyondGDPmacro-economics
• Greentaxes
• Clearinghouseonecosystem services prices
• Clearinghouseonecosystem mitigation costs
• Ecologicallabellingofproducts
SEEA 2012 Framework (complete national/regional economic environmental accounts)
• Sectoraccounts
• Protectionandmanagement expenditures, taxes
• Material/Energyflows
• Naturalassets
• Ecosystemaccounts
• Stocks,health
• Landcoverandmaterial flows
• Ecosystemservices
• Sectorperformanceindicators
• Metabolism/Decouplingindicators
• Useoflandandnaturalresources
• Useofecosystemservices
• Consumptionofecosystem capital by sectors
• Ecosystempotentials,capacities
• Consumptionofecosystem capital by ecosystems
Act
ion
level
Accounting norms
• Six indicators representing total ecological potential
• Tradebalances,virtualuse, footprints
• Localrestorationcosts
• Protectionandmanagement expenditures, taxes
• Material/Energybalances
• Naturalassetsbalance
• Ecosystemservices
• Loss/Winofecologicalpotential
• Consumptionofecosystem capital
• Metabolism/Decouplingindicators
• Useofnaturalassets
• Useofecosystemservices
• Municipalities
• Localagencies(environment, forest, water, land planning…)
• Projects
• Impactsassessments/Public debate
• Business
• Auditors,ecologicalrating agencies
• Accountabilityofpublic and private decision-makers
• Costsandbenefitsassessments
• Marketsofspecificecosystem services, PES
• Environmentalliability
• Corporateaccounting(depreciation of ecosystem capital)
• Ecologicalrating
Table 3.1 Accounting and governance scales
Note: SNA: UN System of national accounts, 2008. IPES: International payments for ecosystem services (UNEP). UN-REDD: Reducing emissions from deforestation and forest degradation.

Ecosystem accounting and the cost of biodiversity losses
Socio-ecological systems, ecosystem accounting and wetlands in the Mediterranean
40
Applying the accounting model at different scales
Having identified the set of coastal wetland SES across the Mediterranean basin, it is now possible to explore the extent to sets of accounts can be built for them. This can clearly be done at various spatial scales: by taking the whole set and asking questions about their extent and condition and how they are changing over time to compile a picture of how in tact they are as elements of natural capital. This is typical of the kinds of information that decision-makers need at the macro- (global) and meso- (regional or national) scales when seeking to test whether particular policy goals, such as those represented by the Ramsar convention are being met. At more local scales decision-makers may still be interested in such goals, but here the focus might be on how particular management objectives are transforming the sites at the micro (local) scale and how the different system elements are interacting within a site, and between the site and its surroundings.
If an effective accounting system is to be useful, then it must be capable of operating across these different scales, and of nesting local information into the global picture. The system must be capable of using information available across all sites to gain an insight into the resource as a whole, and of interpreting such information in the context of the particular circumstances of an individual SES. Although this report examines wetlands, the same kinds of question about the functioning of sites and ecosystems are relevant more generally. Thus Table 3.1 sets out systematically the kinds of information required at different scales, and how accounting approaches may be used to provide the kinds of measure that support decision-making at each of these levels. Chapter 4 examines the extent to which existing data resources permit this multi-scale accounting perspective to be created for wetlands, and consequent insights into the problem of biodiversity loss.

41Ecosystem accounting and the cost of biodiversity losses
Introduction
This chapter examines the extent to which ecosystem accounts for the Mediterranean SES identified earlier in this study can be constructed at scales from the strategic down to the local. The aim is to both demonstrate and test some of the basic accounting concepts and to explore what insights can be gained into the changes in natural capital associated with these units. The work is based on information derived from Corine Land Cover (CLC) for 1990 and 2000 that gives a picture of the entire region, together with a special inventory for the 10 km coastal strip that extends the time series for land cover change back to 1975 (11). Eventually, when Corine Land Cover is updated for 2006, a dataset showing land cover change over a 30-year period will be available for a large area of the coastal Mediterranean. The present study focuses on the period up to 2000.
The database of land cover change information that has been constructed using Corine Land Cover has been described in earlier work undertaken by the EEA on land and ecosystem accounting (EEA, 2006). The raw data on stock and change are help in a spatially explicit format that uses a grid of 1 km × 1 km cells that cover the whole of Europe. In addition to the stock and change information for each cell, in the database these units are also tagged with information about which administrative units they are part of within the NUTS hierarchy, the dominant landscape type that they have been assigned to, and other characteristics, such as which sea-basin they are located in. As a result, the information can be aggregated into different geographical units, so that alternative scale perspectives can be built up. For the purposes of the analysis presented here, the 1 km × 1 km cells have also been assigned to the SES units described in Chapter 3, so that specific accounts can also be prepared for them.
Land cover stock and change within Mediterranean wetlands: the strategic scale
In the accounting framework described in Chapter 1, the most basic accounts deal with stock and change information. The system of land and ecosystem accounts developed by the EEA has established a methodology for constructing such accounts that is based on identifying all the potential types of land cover change that might be observed using CLC data, by cross-tabulating all the CLC land cover types. Altogether, considering the full set of CLC land cover classes, there were 1 936 possible types of change. These have been grouped and named to indicate the most important processes by which land cover change occurs.
To illustrate what can be achieved at the broad, strategic scale using such data, the information on stock and change between 1990 and 2000 has been extracted at NUTS 1 level for nine countries (Table 4.1); NUTS 1 is the administrative scale normally used for land planning across much of the Mediterranean. Estimates of stock and change are given in hectares.
The data shown in Table 4.1 suggests that at this scale some significant changes can be detected, which may potentially impact on the integrity and health of the wetlands. Urban sprawl, that is the development of residential areas and associated infrastructure, appears to have occurred between 1990 and 2000 in the wetland SES of Spain, as well as to a lesser extent in France and Italy. The extension of irrigation areas (denoted by land cover flow 'lcf421') is very important in the south of Spain, in Greece and north-east Italy; this kind of change may indicate competition for water between agriculture and wetlands. According to Table 4.1, conversion of wetlands to agriculture (represented by land cover flow 'lcf53') is more limited, but it still taking
4 Ecosystem accounts for wetlands: constructing a multi-scale perspective
(11) These data were produced by the LaCoast/JRC and Eurosion/DG Environment and EEA initiatives.

Ecosystem accounting and the cost of biodiversity losses
Ecosystem accounts for wetlands: constructing a multi-scale perspective
42
Figure 4.1 Land cover flows for the 10 km coastal strip of the Mediterranean, 1975–1990 and 1990–2000
Area (ha)
1975–1990
1990–2000
0 100 000 200 000 300 000
LCF9 Changes of Land Cover due to natural...
LCF8 Water bodies creation and management
LCF7 Forest creation and management
LCF6 Withdrawal of farming
LCF5 Conversion from other land cover to...
LCF4 Agriculture internal conversions
LCF3 Sprawl of economic sites and ...
LCF2 Urban residential sprawl
LCF1 Urban land management
Spain, France and Italy combined
LCF8 Water bodies creation and management
LCF7 Forest creation and management
LCF6 Withdrawal of farming
LCF5 Conversion from other land cover to...
LCF4 Agriculture internal conversions
LCF3 Sprawl of economic sites and...
LCF2 Urban residential sprawl
LCF1 urban land management
Area (ha)0 20 000 40 000 60 000
LCF9 Changes of Land Cover due to natural...
Spain
LCF8 Water bodies creation and management
LCF7 Forest creation and management
LCF6 Withdrawal of farming
LCF5 Conversion from other land cover to...
LCF4 Agriculture internal conversions
LCF3 Sprawl of economic sites and...
LCF2 Urban residential sprawl
LCF1 urban land management
LCF9 Changes of Land Cover due to natural...
France
Area (ha)0 10 000 20 000
0 100 000 200 000Area (ha)
LCF8 Water bodies creation and management
LCF7 Forest creation and management
LCF6 Withdrawal of farming
LCF5 Conversion from other land cover to...
LCF4 Agriculture internal conversions
LCF3 Sprawl of economic sites and...
LCF2 Urban residential sprawl
LCF1 urban land management
LCF9 Changes of Land Cover due to natural...
Italy
1975–1990
1990–2000
1975–1990
1990–2000
1975–1990
1990–2000
Key: LCF1 Urban land management; LCF2 Urban residential sprawl; LCF3 Sprawl of economic sites and infrastructures; LCF4 Agriculture internal conversions; LCF5 Conversion from other land cover to agriculture; LCF6 Withdrawal of farming; LCF7 Forests creation and management; LCF8 Water bodies creation and management; LCF9 Changes of Land Cover due to natural and multiple causes.

Ecosystem accounts for wetlands: constructing a multi-scale perspective
Ecosystem accounting and the cost of biodiversity losses 43
place even though many of these wetland areas are protected. The conversion of semi-natural habitats to agriculture ('lcf 521' and 'lcf522') is, however, much more widespread. The continuing conversion of other natural or semi-natural land found in coastal areas to agriculture is a phenomenon associated with many coastal areas in the Mediterranean, which arises as an indirect consequence of urban sprawl – development on formerly farmed areas that pushes farmers onto more marginal lands.
The wetland areas where forest is a significant land cover element also show up in the data of Table 4.1. The effect of rotational felling and planting can be seen, and while this broadly results in a stable cover of trees across the units, the extent to which the quality of these habitats is being maintained needs to be determined.
The structure of the land cover database constructed by the EEA enables different views of the information to be generated. Since Table 4.1 is a very high-level summary, it is clearly useful if accounts can be used to look at patterns in more detail. For example, given the availability of data extending back to 1975 for the 10 km coastal strip, we can investigate whether rates of change are increasing or decreasing and whether the trends observed for the SES are part of a more general pattern. An overview of some of the trends is shown in Figure 4.1.
Several features are apparent from the data shown in Figure 4.1, which differ from those in Table 4.1 in that they cover the whole of the 10 km strip in Spain, France and Italy, and not just the SES described earlier. When comparing the two periods, 1975–1990 and 1990–2000, the general speed of residential urban sprawl along the coastal strip appears to have slowed in France and in Italy, but has increased in Spain. Moreover, it is clear that much of the conversion of wetlands to agriculture, whether associated with our SES or not, occurred in the earlier period. Spain also stands out as continuing to show high rates of conversion to agriculture from semi-natural land after 1990, compared to France and Italy.
Using remotely-sensed information currently available, basic ecosystem accounts can now be constructed routinely at broad spatial scales. Such accounts are useful for developing a strategic overview of the extent and change in a basic ecosystem resource and monitoring trends. The retrospective analysis for the 10 km coastal strip
for the Mediterranean also demonstrates that as the length of such time series increases, the value of such information in detecting different geographical patterns will also grow. As noted in Chapter 3, the GlobCover initiative will provide a Corine equivalent update for 2006. In the future, such accounts could form part of online mapping platforms such as those recently demonstrated by the European Space Agency (ESA) GlobWetland (12) project.
The changing ecological potential of coastal wetlands in the Mediterranean
Although basic accounts documenting the stock and change of the land cover elements associated with wetlands are important, it is also essential that ecosystem accounts provide an insight into the changing functionality or integrity of these systems, and potentially the pressures upon them. The land cover change data provided by Corine can also be used to develop a range of physical indicators that can begin to assess the potential of land to support biodiversity and ecosystem services at broad spatial scales. The basis of the approach is to look at the neighbourhood characteristics of each 1 km x 1 km cell in the accounting database, and to derive measures of the influence of surrounding land parcels weighted by their distance from the target cell.
The methodology underpinning the approach has been fully described in Land cover accounts for Europe, 1990–2000 (EEA, 2006). The so-called CORILIS algorithm allows weighted aggregate measures to be calculated at a variety of spatial scales for individual land cover themes, such as urban land cover or agriculture; typically averages have been calculated over radii of 5, 10 and 20 km. Basically, the resulting maps show a smoothed surface for each land cover theme that measures the general influence or degree of presence that this land cover has in the locality at different scales. When applied to urban or agricultural cover types the maps can be thought of as taking the urban or agricultural 'temperature' of any given locality based on its neighbourhood characteristics.
These physical aggregate measures can be used to construct accounts describing changes in the stress factors that might impact upon an ecosystem. Thus they form part of the block of accounts dealing with ecosystem capital described in Chapter 1. In the context of the wetland study these accounts have
(12) www.globwetland.org/index.html.

Ecosystem accounting and the cost of biodiversity losses
Ecosystem accounts for wetlands: constructing a multi-scale perspective
44
Table 4.1 Land cover flows 1990–2000 for Mediterranean wetland socio-ecological systems
Bulgaria Monte-negro
Spain France
BG
1 S
EVERN
A
BU
LGARIA
BG
2 Y
UZH
NA
BU
LGARIA
CS (
No N
UTS)
ES5 E
STE
ES6 S
UR
FR8
MÉD
ITERRAN
ÉE
lcf11 Urban development/infilling 742 1 431 1 166
lcf12 Recycling of developed urban land 9 381 31 906 7 579
lcf13 Development of green urban areas 1 590
lcf21 Urban dense residential sprawl 27 772 13 727
lcf22 Urban diffuse residential sprawl 77 804 44 414 46 216
lcf31 Sprawl of industrial and commercial sites 41 605 20 723 10 918
lcf32 Sprawl of transport networks 10 547
lcf33 Sprawl of harbours 12 243 424 2 014
lcf34 Sprawl of airports 6 254
lcf35 Sprawl of mines and quarrying areas 4 558 9 487
lcf36 Sprawl of dumpsites 2 915
lcf37 Construction 23 267 41 552 11 872
lcf38 Sprawl of sport and leisure facilities 16 324 11 448 2 703
lcf41 Extension of set aside fallow land and pasture 13 727 58 035
lcf421 Conversion from arable land to permanent irrigation perimeters 1 431 727 849 2 756
lcf422 Other internal conversions of arable land 8 639 151 368
lcf433 Conversion from olives groves to vineyards and orchards 1 802 15 211
lcf441 Conversion from permanent crops to permanent irrigation perimeters 583 41 764 5 512
lcf442 Conversion from vineyards and orchards to non-irrigated arable land 1 113 11 024
lcf443 Conversion from olive groves to non-irrigated arable land 477
lcf444 Diffuse conversion from permanent crops to arable land 10 176 7473 26 182
lcf451 Conversion from arable land to vineyards and orchards 11 554 23 479 96 672 7 261
lcf452 Conversion from arable land to olive groves 2 067
lcf461 Conversion from pasture to permanent irrigation perimeters
lcf462 Intensive conversion from pasture to non-irrigated crop land 530
lcf463 Diffuse conversion from pasture to arable and permanent crops 32 171 15 9530 15 158
lcf511 Intensive conversion from forest to agriculture 371 33 443 2 014
lcf512 Diffuse conversion from forest to agriculture 371 8 056 1 166
lcf521 Intensive conversion from semi-natural land to agriculture 4 611 435 925 23 267
lcf522 Diffuse conversion from semi-natural land to agriculture 2 438 49 555 4 77
lcf53 Conversion from wetlands to agriculture 25 546 3 657
lcf54 Other conversions to agriculture 371 212 3498
lcf61 Withdrawal of farming with woodland creation 2 332
lcf62 Withdrawal of farming without significant woodland creation 8 533 66 303 10 971
lcf71 Conversion from transitional woodland to forest 689 6 095 20 882
lcf72 New forest and woodland creation, afforestation 3 445 28 408 24 804
lcf73 Forests internal conversions 1 007
lcf74 Recent fellings, re-plantation and other transition 67 204 14 204
lcf81 Water bodies creation 1 060 795 159
lcf82 Water bodies management
lcf91 Semi-natural creation and rotation 2 120 5 830 6 148
lcf912 Semi-natural rotation 15 741 3 498
lcf913 Extension of water courses 636
lcf92 Forests and shrubs fires 265 24 486
lcf93 Coastal erosion 6 625 1 272 1 537
lcf99 Other changes and unknown 6 731 78 493 12 932
No change 62 805 734 739 78 705 8 289 518 18 692 464 16 777 574
Total 62 805 746 982 78 705 8 642 339 20 941 784 17 107 499
been used to calculate for each of the SES identified, the:
• 'urbantemperature',whichgivesapictureofthepressure of urban and artificial land use within
and in the neighbourhood of each ecosystem unit; and
• 'intensiveagriculturetemperature',whichgivesa picture of the pressures from the broad pattern arable land and permanent crops in the area.

Ecosystem accounts for wetlands: constructing a multi-scale perspective
Ecosystem accounting and the cost of biodiversity losses 45
Greece Croatia Italy Romania Slovenia
GR1-V
OREIA
ELL
AD
A
GR2 K
EN
TRIK
I ELL
AD
A
GR4 N
ISIA
AIG
AIO
U,
KRIT
I
HR (
No N
UTS)
ITD
NO
RD
-EST
ITF
SU
D
ITE C
EN
TRO
ITG
ISO
LE
RO
0 (
Sud E
st)
SI0
SLO
VEN
IJA
lcf11 Urban development/infilling
lcf12 Recycling of developed urban land 2 014
lcf13 Development of green urban areaslcf21 Urban dense residential sprawllcf22 Urban diffuse residential sprawl 8 215 954 2 067 56 392 7 314lcf31 Sprawl of industrial and
commercial sites4 134 4 293 10 971 477 8 268 4 611
lcf32 Sprawl of transport networks 1 590lcf33 Sprawl of harbours 1 166lcf34 Sprawl of airports 1 908 2 597lcf35 Sprawl of mines and quarrying
areas2 809 2544 477
lcf36 Sprawl of dumpsites 1 961lcf37 Construction 13 038 6 943 1 219lcf38 Sprawl of sport and leisure
facilities371 7 473 53 4 240
lcf41 Extension of set aside fallow land and pasture
5 141 7 791 424 2 438
lcf421 Conversion from arable land to permanent irrigation perimeters
407 305 27 136 103 562 135 786
lcf422 Other internal conversions of arable land
753 819 82 044 41 764
lcf433 Conversion from olives groves to vineyards and orchards
lcf441 Conversion from permanent crops to permanent irrigation perimeters
lcf442 Conversion from vineyards and orchards to non-irrigated arable land
1 007 1 855 16 854 4 611
lcf443 Conversion from olive groves to non-irrigated arable land
583
lcf444 Diffuse conversion from permanent crops to arable land
3 710
lcf451 Conversion from arable land to vineyards and orchards
159
lcf452 Conversion from arable land to olive groves
636
lcf461 Conversion from pasture to permanent irrigation perimeters
10 123
lcf462 Intensive conversion from pasture to non-irrigated crop land
9 911 3 975
lcf463 Diffuse conversion from pasture to arable and permanent crops
6 466 4 717
lcf511 Intensive conversion from forest to agriculture
lcf512 Diffuse conversion from forest to agriculture
795
lcf521 Intensive conversion from semi-natural land to agriculture
7 367 2 279
lcf522 Diffuse conversion from semi-natural land to agriculture
1 219
lcf53 Conversion from wetlands to agriculture
9 699 5 459 4 293
lcf54 Other conversions to agriculturelcf61 Withdrawal of farming with
woodland creation5 194 477
lcf62 Withdrawal of farming without significant woodland creation
1 219 81 461
lcf71 Conversion from transitional woodland to forest
3 286 1 855 17 808
lcf72 New forest and woodland creation, afforestation
1 166
lcf73 Forests internal conversionslcf74 Recent fellings, re-plantation and
other transition10 494 1 961 1 484 13 144 11 448
lcf81 Water bodies creation 265 1 696lcf82 Water bodies management 1 325lcf91 Semi-natural creation and rotation 2 703 1 378 3 021lcf912 Semi-natural rotation 5 936 6 413 5 406lcf913 Extension of water courseslcf92 Forests and shrubs fireslcf93 Coastal erosion 8 427 3 339 2 014 1 537lcf99 Other changes and unknown 10 176 2 014 3 445 6 996
No change 11 266 104 7 953 021 490 303 1 264 209 13 217 829 160 5052 3 186 254 4 836 356 25 116 541 123 543
Total 12 522 151 8 106 085 490 674 1 265 004 13 424 423 161 9150 3 201 465 5 154 939 25 189 893 123 543
Table 4.1 Land cover flows 1990–2000 for Mediterranean wetland socio-ecological systems (cont.)

Ecosystem accounting and the cost of biodiversity losses
Ecosystem accounts for wetlands: constructing a multi-scale perspective
46
The particular advantage of the CORILIS algorithm is that the way the averages are calculated for each individual land cover layer means that they remain additive; thus at any one scale, the averages calculated for all land cover types in a cell would still sum to 100 % in exactly the same way as would the raw data. This property can be used to derive a third aggregate measure, called the green background landscape index (GBLI).
The green background landscape index is calculated by subtracting the sum of the urban and agricultural temperatures from 100. It is taken to be a measure of the degree to which the landscape is favourable for nature because of the presence of semi-natural habitats in the area and the connectivity that they have with similar areas around them. The GBLI index is regarded as a 'first proxy' for landscape potentials related to biodiversity and ecosystem services.
One limitation of GBLI is that it is based on satellite images, and while these provide comprehensive coverage and scope for monitoring change, because of their coarse nature they tend to overlook local complexity of landscapes and the richness of the biodiversity that they host. In order to overcome the difficulty, an additional indicator has been developed, based on the extent of areas in the locality designed for nature conservation at the European scale. Since these Natura 2000 sites have been identified as the result of intensive field work, it can be assumed that they pick out areas of high ecological value. Moreover, since they are also the target of public funds to ensure their favourable conservation status, they are of considerable interest in the political arena.
Using the maps of designated areas, smoothed averages indicating the ecological potential of the areas in and around them can be calculated at different scales by applying the same CORILIS methodology as used for the Corine land cover, to produce the NATURILIS index.
By adding GBLI and NATRUILIS a much better picture of the ecological potential of the land can be derived. The combined measure specifically allows the identification of:
• greenlandscapethatisdesignatedandhasthehighest potential ecological value;
• greenlandscapethatisnotdesignatedbuthassome value by virtue of the widespread presence of more common semi-natural habitats, as measured by GBLI;
• intensivelyusedlandscapes,withlowGBLIvalues, where there is nevertheless some conservation interest, as indicated by a high NATURILIS value; and
• intensivelyusedlandscapesthatarenotdesignated and are considered as having a lower ecological value in terms of their GBLI.
Clearly, all such measures of ecological potential are simplifications of reality, and it is probably the case that even the combined insights that GBLI and NATURILIS bring do not fully capture the functional properties of the landscape. In order to begin to overcome this problem, an additional indicator of fragmentation has been developed: the mean effective mesh size (MEFF). This can be interpreted as the expected size of the area that is accessible when starting a movement at a randomly chosen point from a semi-natural patch inside the
Figure 4.2 (a) Net landscape ecological potential in 2000, and (b) change in net ecological potential, 1990–2000, for socio-ecological ecosystems in the north-west Mediterranean
LegendNet Landscape Ecological Potential 2000NLEP, scale : 0 - 255
High : 14.743Low : 0
Source:
Methodology:
EEA/ETCLUSI from GBLI,NATURILIS and MEFF
EEA/ETCLUSIProvisional results – February 2008
European Environment Agency
LegendChange Net LEP1900 to 20001 Km2 grid, range :-255 to +255
High : 118.464Low : -84,664
Source:
Methodology:
EEA/ETCLUSI from GBLI,NATURILIS and MEFF
EEA/ETCLUSIProvisional results – February 2008
European Environment Agency
a) b)

Ecosystem accounts for wetlands: constructing a multi-scale perspective
Ecosystem accounting and the cost of biodiversity losses 47
Table 4.2 Measure of net landscape ecological potential and external pressures for wetlands in the Mediterranean
LEAC Aggregates — Coastal Wetlands Socio-Ecological Systems (SES)
Mean values per km² in SESSurface of
coastal SES wetlands
Urban temperature
2000
Change in urban
temperature 1990–2000
Intensive agriculture
temperature 2000
Change in intensive
agriculture temperature 1990–2000
Landscape net
ecological potential
2000
Change in landscape
net ecological potential
1990–2000
Nature designation
index (combined N2000 and national)
Mean effective
mesh size in SES 2005
Population density (inhab/km²) 2000
UNITS km² 0–100 0–100 0–100 0–100 0–100 0–100 0–100 logN(MEFF) inhabitants
Coastal Regions with SES Wetlands
SURF_SES _WET1
URB_TEMP _2
URB_TEMP _9
XB_TEMP_ 20
XB_TEMP_ 90
LNEP2000 LNEP_90_00
NATURILIS _ LNMEFF POPCLC_2 00
BG13 Severoiztochen 17 6 0.1 62 0.2 n.a. n.a. 24 n.a. 25
BG23 Yugoiztochen 175 12 0.1 35 0.0 n.a. n.a. 16 n.a. 267
CS Montenegro 452 1 n.a. 0 n.a. n.a. n.a. n.a. n.a. n.a.
ES51 Cataluña 695 8 1.0 60 – 0.2 46 – 2 8 122 112
ES52 Comunidad Valenciana
898 9 3.7 50 – 1.1 56 – 3 20 111 404
ES53 Illes Balears 203 4 1.1 42 – 1.3 60 – 1 20 104 115
ES61 Andalucía 3 444 4 0.4 47 2.5 74 – 6 17 163 188
ES62 Región de Murcia
622 6 1.6 55 – 0.7 30 – 1 15 92 145
FR81 Languedoc-Roussillon
1 636 8 0.2 30 0.7 75 – 2 31 112 140
FR82 Provence-Alpes-Côte d'Azur
1 601 7 0.2 22 0.7 83 – 2 35 121 154
FR83 Corse 195 6 0.1 25 – 0.5 72 – 1 11 107 44
GR11 Anatoliki Makedonia, Thraki
1 154 2 n.a. 60 n.a. n.a. n.a. 23 n.a. 32
GR12 Kentriki Makedonia
1 343 4 n.a. 77 n.a. n.a. n.a. 11 n.a. 75
GR14 Thessalia 51 5 n.a. 50 n.a. n.a. n.a. 12 n.a. 57
GR21 Ipeiros 442 2 n.a. 21 n.a. n.a. n.a. 29 n.a. 40
GR22 Ionia Nisia 67 7 n.a. 20 n.a. n.a. n.a. 14 n.a. 232
GR23 Dytiki Ellada 956 2 n.a. 41 n.a. n.a. n.a. 25 n.a. 44
GR24 Sterea Ellada 172 2 n.a. 60 n.a. n.a. n.a. 35 n.a. 82
GR25 Peloponnisos 138 4 n.a. 38 n.a. n.a. n.a. 10 n.a. 92
GR41 Voreio Aigaio 105 1 n.a. 43 n.a. n.a. n.a. 29 n.a. 21
GR42 Notio Aigaio 12 2 n.a. 7 n.a. n.a. n.a. 8 n.a. 44
HR Croatia 254 3 n.a. 9 n.a. n.a. n.a. 0 n.a. 108
ITD3 Veneto 1 416 5 0.2 32 0.1 86 – 2 24 147 180
ITD4 Friuli-Venezia Giulia
335 4 0.1 37 2.0 83 – 2 25 147 78
ITD5 Emilia-Romagna 917 4 0.2 65 – 0.1 47 – 3 17 141 93
ITE1 Toscana 345 7 – 0.3 27 0.6 75 – 2 34 115 131
ITF4 Puglia 673 3 0.3 50 – 1.8 67 – 1 24 129 118
ITG1 Sicilia 103 17 1.1 35 – 0.6 30 – 1 14 51 449
ITG2 Sardegna 1 034 10 1.2 42 – 0.8 63 – 1 13 133 250
RO02 Sud-Est 4 855 2 0.1 12 0.0 n.a. n.a. 44 n.a. 25
SI00 Slovenija 27 8 0.6 2 – 0.2 n.a. n.a. 12 n.a. 261
reporting unit (for the purposes of this report, a 1 km grid), without encountering a physical barrier (as defined by a road or built-up area); high MEFF values indicate the less-fragmented areas.
The combination of GBLI, NATURLIS and MEFF provides the basis for an aggregate measure of important aspects of ecosystem integrity, net landscape ecological potential (NLEP), which can be used to monitor change and therefore track
changes in the condition of different SES. Figure 4.2 illustrates the nature of these physical aggregates in more detail. These data show wetland ecosystems in the north-west part of the Mediterranean basin in the boarder context of the other habitats of the coastal strip. Not only can clear differences be seen in terms of the existing (2000) potential (Figure 4.2 a), but also differences emerge in relation to the change of potential seen between 1990 and 2000 (Figure 4.2 b).
Note: Socio-ecological system results have been aggregated at NUTS2 level.

Ecosystem accounting and the cost of biodiversity losses
Ecosystem accounts for wetlands: constructing a multi-scale perspective
48
The aggregate measures of ecological potential and the measures of possible pressures upon it in from agriculture and development were calculated for all the SES units that were covered by the Corine land cover database (Table 4.2). The data have been aggregated at NUTS2 level, and in all cases the indices have been calculated using the CORILIS methodology with a smoothing radius of 5 km. Also included in the analysis is a measure of population in the SES for the year 2000. To assist with comparisons, all the measures have been standardised on the basis of the area of the SES in each NUTS unit, and so are expressed as mean values per km2.
The data in Table 4.2 suggest that for the coastal wetland SES in Spain, pressure from urbanisation in the general locality has tended to increase more markedly since 1990 compared to the other areas considered, although agricultural pressure has declined somewhat. The geographical patterns of intensive agriculture and urban temperatures at NUTS2 level are also shown in Figure 4.3 and Figure 4.4. Overall, however, it appears that in each of the NUTS2 areas for which there are data there has been a loss of net landscape ecological potential for the period 1990–2000. The loss of potential has been particularly marked for Andalucía, where agricultural temperatures have also increased, probably because of conversion of arable land to permanent irrigation, and semi-natural land to agriculture to over this period (see Table 4.1, Spain ES96 SUR).
Ecosystem accounts: developing a local view
The analysis presented so far has been framed at the broad, strategic scale. From the patterns observed, clear geographical patterns begin to emerge. These types of data and the ecosystem accounts that might be built using them, illustrate how monitoring change in the stock of land cover units associated with a given set of SES might be monitored, and how some of the pressures upon them may be assessed in relation to some overall conservation or protection objective. The advantages of using such data include the fact that they can also be used to explore patterns at more local scales. To illustrate how this can be done, this report explores the construction of ecosystem accounts for a set of case study locations.
Four coastal wetlands were chosen for more detailed study, namely: Doñana in Spain, the Camargue in France, Amvrakikos in Greece and the Danube delta in Romania. These sites were selected because of their regional importance in the
broad Mediterranean region and because they all fell within the area covered by the current Corine land cover mapping, so that the nested approach described in the earlier parts of this report could be carried through. They were also selected because each of them is managed for conservation purposes; this allowed the practical context of ecosystem accounting at the site level to be explored, and also meant that a wide range of other information about the sites could be assembled quite rapidly for the purposes of this study.
As an introduction to the investigation of the case study sites, Tables 4.3, 4.4 and 4.5 provide an overview of the stock and change observed for the study sites using the same accounting approach as described earlier in this chapter.
Despite being on the Atlantic coast of Spain, Doñana at the mouth of the Guadalquivir River has a strong western Mediterranean character. The focus of the SES is the Doñana Natural Area, set up in 2005 by amalgamating the protected areas of the Doñana National Park and the Doñana Natural Park. Although the area has extensive inland marshes, woodlands of various types are also extensive (Table 4.4). Historically, the issues of concern here relate to the impact of agriculture and forestry on biodiversity, as well as the influence of development and tourism along the coastal strip outside the wetland area. The data shown in Table 4.4 reflect some of these issues. Of the four sites, it is apparent that the turnover of land cover between 1990 and 2000 is much higher here than for the other case study areas, with roughly 13 % of the area of the SES undergoing some kind of change (Table 4.4). More than half of the turnover was related to the felling and replanting of woodlands and conversions to forest, although conversion from semi-natural land to agriculture was also significant. Doñana has the highest net landscape ecological potential score of the two sites for which these data were available, and showed the largest loss over the accounting period (Table 4.5), reflecting pressure from both development and agriculture sites.
The Camargue, at the mouth of the Rhone in France, is the biggest delta in the western Mediterranean. It is also a site of international importance for conservation, and is of particular interest because of issues that surround the management of the hydrology of the area and the different needs of agriculture and nature conservation. The data shown in Tables 4.3 and 4.4 suggest that while the extent of land conversions between 1990 and 2000 was lower than for Doñana, the transformation of semi-natural areas to agriculture was still possibly

Ecosystem accounts for wetlands: constructing a multi-scale perspective
Ecosystem accounting and the cost of biodiversity losses 49
Figure 4.3 Pressure on wetlands from intensive agriculture (a, 2000) and change (b, 1990–2000) summarised by NUTS2 regions
Legend
WETLANDS Surface of SES Wetlads - km2
SES_nuts2_TOT.SURFWETWetland SES
Mean Agriculture PressureSES_nuts2_TOT.AGR_2000 / SES_nuts2_TOT.SURFWET1
Mean Pressure 2000from Intensive Agriculture
on Wetlands SES,by NUTS2 Regions0 - 12
20 - 30
1
10
1,000
32 - 43
47 - 55
60 - 67
Legend
WETLANDS Surface of SES Wetlads – km2
SES_nuts2_TOT.SURFWET1+Wetland SES
Mean Agriculture PressureSES_nuts2_TOT.AGR_2000 / SES_nuts2_TOT.SURFWERT1
Mean Pressure 2000from Intensive Agriculture
on Wetlands SES,by NUTS2 Regions0 – 12
20 – 30
1
10
1,000
32 – 43
47 – 55
60 – 77
Legend
WETLANDS Surface of SES Wetlads – km2
SES_nuts2_TOT.SURFWET1+Wetland SES
Change 1990-2000 of mean Agriculture PressureSES_nuts2_TOT.AGR_0090 / SES_nuts2_TOT.SURFWET1
Change 1990-2000of Mean Pressure
from Intensive Agricultureon Wetlands SES,by NUTS2 Regions
-0.3 – 0.1
0.1 – 0.3
1
10
1,000
0.4 – 0.6
1.0 – 1.6
3.7
a)
b)

Ecosystem accounting and the cost of biodiversity losses
Ecosystem accounts for wetlands: constructing a multi-scale perspective
50
Figure 4.4 Pressure on wetlands from urban proximity (a, 2000) and change (b, 1990–2000) summarised by NUTS2 regions
Legend
WETLANDS Surface of SES Wetlads – km2
SES_nuts2_TOT.SURFWET1Wetland SES
Mean Urban Pressure on Wetland SES0-100
Mean Pressure from Urban Land Useon Wetlands SES,by NUTS2 Regions
1 – 3
3 – 5
1
10
1,000
5 – 8
8 – 12
17
Legend
WETLANDS Surface of SES Wetlads – km2
SES_nuts2_TOT.SURFWET1Wetland SES
Change 1990-2000 of Mean Urban Pressure on Wetland SESSES_nuts2_TOT.URB_0090 / SES_nuts2_TOT.SURFWET1
Change 1990-2000of Mean Pressure
from Urban Land Useon Wetlands SES,by NUTS2 Regions
1 – 3
3 – 5
1
10
1,000
5 – 8
8 – 12
17
a)
b)

Ecosystem accounts for wetlands: constructing a multi-scale perspective
Ecosystem accounting and the cost of biodiversity losses 51
Table 4.3 Basic stock and change accounts for the case study areas
Doñana Camargue Amvrakikos Danube delta
19
90
20
00
Net
chan
ge
19
90
20
00
Net
chan
ge
19
90
20
00
Net
chan
ge
19
90
20
00
Net
chan
ge
111 Continuous urban fabric 110 118 8 0 0 0
112 Discontinuous urban fabric
28 28 0 226 239 13 2 309 2 371 62 4 624 4 624 0
121 Industrial or commercial units
25 38 13 0 570 788 218 421 447 26
122 Road and rail networks, associated land
0 0 0 0
123 Port areas 0 0 0 139 139 0
124 Airports 0 0 214 214 0 0
131 Mineral extraction sites 253 263 10 0 115 138 23 193 193 0
132 Dump sites 30 – 30 0 0 139 139 0
133 Construction sites 43 67 24 19 – 19 3 126 123 56 56 0
141 Green urban areas 0 0 0 0
142 Sport and leisure facilities 18 61 43 26 26 0 35 35 0 140 179 39
211 Non-irrigated arable land 5 803 5 302 – 501 1 186 1 134 – 52 12 236 12 288 52 60 393 60 274 – 119
212 Permanently irrigated land 3 139 4 302 1 163 0 5 713 5 700 – 13 0
213 Rice fields 2 792 3 144 352 19 925 20 174 249 406 396 – 10 0
221 Vineyards 30 30 0 208 168 – 40 0 623 584 – 39
222 Fruit trees and berry plantations
479 868 389 327 311 – 16 6 645 6 533 – 112 208 208 0
223 Olive groves 831 806 – 25 0 4 115 4 130 15 0
231 Pastures 0 0 98 98 0 2 447 2 408 – 39
241 Annual crops associated with permanent crops
21 – 21 0 0 0
242 Complex cultivation patterns
589 883 294 3 857 3 846 – 11 27 753 27 535 – 218 898 898 0
243 Agriculture mosaics with natural vegetation
1 020 1 138 118 0 14 995 15 095 100 181 181 0
244 Agro-forestry areas 325 324 – 1 0 0 0
311 Broad-leaved forest 18 969 7 695 – 11 274 24 24 0 4 792 4 765 – 27 21 456 21 491 35
312 Coniferous forest 29 661 29 610 – 51 157 157 0 213 209 – 4 0
313 Mixed forest 1 556 1 370 – 186 0 807 807 0 0
321 Natural grassland 3 243 3 174 – 69 1 169 1 087 – 82 11 342 11 278 – 64 18 355 18 253 – 102
322 Moors and heathland 0 0 0 0
323 Sclerophyllous vegetation 12 601 11 127 – 1 474 0 21 594 21 688 94 0
324 Transitional woodland shrub
13 571 25 646 12 075 38 38 0 7 3–25 7 342 17 3 253 3 218 – 35
331 Beaches, dunes and sand plains
4 324 3 629 – 695 1 205 1 233 28 222 274 52 6 008 6 110 102
332 Bare rock 0 0 0 0
333 Sparsely vegetated areas 0 0 309 309 0 7 174 7 174 0
334 Burnt areas 93 – 93 0 188 – 188 0
335 Glaciers and perpetual snow
0 0 0 0
411 Inland marshes 31 471 31 666 195 703 703 0 675 672 – 3 210 151 210 283 132
412 Peatbogs 0 0 0 0
421 Salt marshes 1 088 1 088 0 22 929 22 900 – 29 6 873 6 808 – 65 815 815 0
422 Salines 4 811 4 872 61 1 750 1 750 0 120 120 0 0
423 Intertidal flats 0 0 0 0
511 Water courses 742 510 – 232 735 735 0 366 298 – 68 8 008 8 008 0
512 Water bodies (lakes and reservoirs)
7 500 7 416 – 84 178 178 0 1 000 1 016 16 42 179 42 179 0
521 Coastal lagoons 0 26 700 26 687 – 13 7 329 7 329 0 68 732 68 732 0
522 Estuaries 1 793 1 793 0 0 0 0
523 Sea and ocean 9 – 9 57 29 – 28 0 0
Total 146 968 146 968 0 81 419 81 419 0 138 362 138 362 0 456 593 456 593 0

Ecosystem accounting and the cost of biodiversity losses
Ecosystem accounts for wetlands: constructing a multi-scale perspective
52
Table 4.4 Basic flow accounts for the case study areas
Code Flows 1990–2000 Doñana Camargue Amvrakikos Danube delta
lcf12 Recycling of developed urban land 15
lcf21 Urban dense residential sprawl 8
lcf22 Urban diffuse residential sprawl 13 62
lcf31 Sprawl of industrial and commercial sites 6 218 26
lcf35 Sprawl of mines and quarrying areas 10 115
lcf37 Construction 23 123
lcf38 Sprawl of sport and leisure facilities 43 39
lcf412 Diffuse extension of set-aside fallow land and pasture 331 9
lcf421 Conversion from arable land to permanent irrigation perimeters 327 52
lcf422 Other internal conversions of arable land 248
lcf433 Other conversions between vineyards and orchards 12
lcf441 Conversion from permanent crops to permanent irrigation perimeters 18 61
lcf442 Conversion from vineyards and orchards to non-irrigated arable land 39
lcf444 Diffuse conversion from permanent crops to arable land 24
lcf451 Conversion from arable land to vineyards and orchards 186 16
lcf463 Diffuse conversion from pasture to arable and permanent crops 35 35 52
lcf511 Intensive conversion from forest to agriculture 435
lcf512 Diffuse conversion from forest to agriculture 73 10
lcf521 Intensive conversion from semi-natural land to agriculture 1 079 82 38
lcf522 Diffuse conversion from semi-natural land to agriculture 300 86
lcf53 Conversion from wetlands to agriculture 223 29 28
lcf54 Other conversions to agriculture 22 19
lcf62 Withdrawal of farming without significant woodland creation 308
lcf71 Conversion from transitional woodland to forest 1 170 330
lcf72 New forest and woodland creation, afforestation 1 323
lcf73 Forests internal conversions 121
lcf74 Recent fellings, re-plantation and other transition 12 526 22 295
lcf81 Water bodies creation 8
lcf91 Semi-natural creation and rotation 323 349 102
lcf93 Coastal erosion 29
lcf99 Other changes and unknown 70 57 65 132
No change 127 725 81 002 137 185 455 630
Total 146 968 81 419 138 362 456 593
significant, along with the conversion of permanent cops to irrigated agriculture. The Camargue SES is much smaller than Doñana, and so although the area changes associated with agriculture are smaller the French site shows a much larger increase in the agricultural pressure indicator: agricultural temperature (Table 4.5).
Compared to Doñana and Camargue, the wetlands of Amvrakikos in Greece are more characteristic of the eastern Mediterranean. They are located at the mouth of the Louros and Arachtos rivers and the issues of interest here mainly concern the
inter-relationships between the wetlands and marine systems offshore. The data shown in Tables 4.3 and 4.4 suggest, however, that while the extent of land conversions between 1990 and 2000 has been limited, the main internal change has been sprawl associated with industrial and mining sites. In 2000 Amvrakikos had the highest population density of the four case study areas considered. Unfortunately, the calculation of landscape net ecological potential could not be made for this site. However, the nature designation index suggested that this area might have the lowest nature conservation value of the four areas (Table 4.5).

Ecosystem accounts for wetlands: constructing a multi-scale perspective
Ecosystem accounting and the cost of biodiversity losses 53
The last case study site to be considered is the Danube delta, which is the largest delta in Europe with a very long history of human occupation. This study site was selected to give some insight into conditions in the Black Sea. As Tables 4.3 and 4.4 show, it is the largest of the four areas considered and experienced the lowest turnover of land between 1990 and 2000. Both urban and agricultural temperatures have increased (Table 4.5); such trends might clearly be significant given the high conservation importance of the area, as shown by its nature designation index.
Refining measures of ecosystem function
Although measures such as change in net ecological potential can give an insight into how the ecological condition of particular sites might be changing, it must be acknowledged that the set of metrics currently available are currently limited.
Further work is required, both to link these types of indicator with ground-based information and to extend ways in which other kinds of remotely sensed data are used to build measures of ecosystem function. To show what might be achieved, this study includes some further exploratory work using the case study sites.
The first exercise involved a pilot study on the wetlands of Doñana, which looked at the relationship between the landscape ecological potential, patterns of species richness and the normalised difference vegetation index (NDVI). The latter is a measure of the physiological activity of vegetation surfaces that can be constructed using multi-spectral remotely sensed data. The study site was divided into 10 km x 10 km cells, and for each cell the number of common and endangered vertebrate species, together with the number of endangered plants were determined from field survey data (Figure 4.4). The mean values of
Units Doñana Camargue Amvrakikos Danube delta
Surface of coastal SES wetlands km² 1 473 827 1 802 5 858
Tota
l va
lues
in S
ES
Urban temperature 20000–100 739 268 2 879 7 411
Change in urban temperature 1990–20000–100 74 14 318 194
Intensive agriculture temperature 2000 0–100 19 690 20 701 28 538 69 049
Change in intensive agriculture temperature 1990–20000–100 995 814 182 1 295
Landscape net ecological potential 2000 0–100 180 982 83 228 n.a n.a
Change in landscape net ecological potential 1990–20000–100 – 4 098 – 1 513 n.a n.a
Nature designation index (combined N2000 and national)0–100 117 894 79 452 38 696 531 461
Effective mesh size 2005 logN(MEFF) 278 560 124 672 n.a n.a
Population 2000 inhabitants 11 023 21 917 104 357 43 702
Mea
n v
alues
per
km
² in
SES
Urban temperature 20000–100 0.5 0.32 1.6 1.27
Change in urban temperature 1990–20000–100 0.05 0.02 0.22 0.03
Intensive agriculture temperature 2000 0–100 13.37 25.03 15.84 11.79
Change in intensive agriculture temperature 1990–20000–100 0.68 0.98 0.1 0.22
Landscape net ecological potential 20000–100 122.87 100.64 n.a n.a
Change in landscape net ecological potential 1990–20000–100 – 2.78 – 1.83 n.a n.a
Nature designation index (combined N2000 and national)0–100 80.04 96.07 21.47 90.72
Mean effective mesh size in SES 2005 logN(MEFF) 189.11 150.75 n.a n.a
Population density (inhabitants/km²) 2000 inhabitants 7 27 58 7
Table 4.5 Change in pressures and ecological potential of case study sites

Ecosystem accounting and the cost of biodiversity losses
Ecosystem accounts for wetlands: constructing a multi-scale perspective
54
Figure 4.5 Species richness in Doñana regionlandscape ecological potential (LEP, derived from land cover data alone) and net landscape ecological potential (NLEP, derived from land cover and Natura 2000 data) were calculated for each cell. The corresponding NDVI values for July and November 2000 were determined for each cell.
As might be expected, LEP and NLEP are highly correlated with each other, but more interestingly both showed a significant positive correlation with the number of vertebrate species in each cell (for LEP r=0.526, p<0.000, n=113) and the number of endangered plants (for LEP r=0.438, p<0.000, n=113) in each cell. The associations that both metrics showed with NDVI were complex; while the correlation with NDVI for November was significant (for LEP r=0.437, p<0.000, n=113), that for July was not. A preliminary investigation of the patterns suggests that the weak association in summer may reflect the fact that this as the dry period, when natural vegetation surfaces are at their least vigorous. Only the irrigated agricultural areas of Doñana showed high values at this time. These preliminary results therefore suggest that comparative, broad scale measures such as LEP and NLEP are probably capturing important information about the differences between sites, and potentially could be used to make an initial assessment of the ecological implications of the direction of change if measured over time.
A second exploratory exercise involved remotely sensed satellite data from MODIS to estimate net primary productivity (NPP) and gross primary productivity (GPP) for four SES sites, namely Doñana, Camargue, Amvrakikos and the Danube delta. The work was based on the application of the MODIS-GPP algorithm described by Gebremichael and Barros (2006), which uses a light-use efficiency approach that relates GPP linearly to the absorbed photosynthetically active radiation (APAR). Inputs to the algorithm include reflectance from red and near-infrared bands, site area, solar radiation, air relative humidity and temperature and a coefficient for vegetation type, which reflects the amount of carbon a specific vegetation type can produce per unit of energy.
The results of the analysis are shown in Figure 4.6. For each of the sites considered, the annual NPP estimates are given. Unfortunately, ground-based measurements of the productivity for the study sites are not available to check the estimates derived from the MODIS data, or to compare the relative differences in productivity estimates between sites. For validation we have to rely on studies such as that by Turner et al. (2006), which indicate that
at global scales both MODIS-derived NPP and GPP measures are responsive to general trends in the magnitude of NPP and GPP associated with differences in local climate and land use. Nevertheless, although the results of this analysis are preliminary, some interesting patterns emerge that warrant further investigation. For example, the factors causing the inter-year variation in NPP need to be investigated. 2005 was a particularly dry year in Doñana, and this may explain the low values observed at this time compared to other years for this site. The apparent longer-term decline in NPP observed for the Camargue also requires further investigation. Finally, the different inter-year variability shown by the sites also merits further attention; Amvrakikos shows a much greater variation from year to year than the other sites.
Building ecosystem accounts at different scales
This chapter has demonstrated that land cover information can be used to build basic land accounts for stock and change at a variety of spatial scales. It has also shown how indicators
.27 – 48
49 – 73
74 – 89
90 – 101
102 – 122
123 – 139
140 – 181
31.000 31.000 Metres15.500 0
Legend
NATURA2000 Doñana region
Number of vertebrate species

Ecosystem accounts for wetlands: constructing a multi-scale perspective
Ecosystem accounting and the cost of biodiversity losses 55
of change in ecological condition can be built using the new sources of Earth observation data that are becoming available. The linkage between scales made by this work is particularly important, because as the case of Mediterranean wetlands illustrates, ecosystems are spread across many jurisdictions, and the data collected locally may vary in its content and quality. Thus it is often difficult to build up a consistent picture using locally derived information sources. The multi-scale perspective that can be built up using the types of land cover data described here means that a basic framework of ecosystem accounts can potentially be constructed for all sites so that their dynamics can be looked at in a broader geographical context. Such accounts could, we suggest, make a significant contribution to the next-generation information systems being developed through initiatives such as GlobWetland II (13), which aim to deliver a range of data characterising the ecological status and
dynamics of specific wetland sites to users via the internet.
However, in terms of using accounts to help calculate the costs of biodiversity loss, it must be acknowledged that the range of data described here is restricted. One of the key problems is that the time span over which change can be monitored is limited, and that information on many aspects of biodiversity and ecosystem function can only be derived at present at more local scales from ground-based investigation. A particular problem that needs to be addressed is the value of ecosystem services emanating from individual sites, and the extent to which the full costs of maintaining that flow are being met. Thus the next part of this report looks at how the accounting framework described here can be developed as a tool to inform broader debates about the economics of ecosystems and biodiversity.
(13) www.emwis.net/initiatives/fol060732/globwetland-follow.
Figure 4.6 Estimates for net primary productivity (NPP) for four coastal wetland socio-ecological ecosystems derived from application of the MODIS-GPP algorithm
0.80.70.60.50.40.30.2
2000 2001 2002 2003 2004 2005 2006
Doñana, Mean NPP (Kg C/m-2)
0.8
0.7
0.60.5
0.40.3
0.22000 2001 2002 2003 2004 2005 2006
Camargue (Park), Mean NPP (Kg C/m-2)
0.8
0.7
0.6
0.5
0.4
0.3
0.2
0.8
0.6
0.4
0.22000 2001 2002 2003 2004 2005 20062000 2001 2002 2003 2004 2005 2006
Amvrkikos, Mean NPP (Kg C/m-2) Danube, Mean NPP (Kg C/m-2)

Ecosystem accounting and the cost of biodiversity losses56
Ecosystem accounting and the costs of maintenance at local scales
Introduction
The aim of constructing a set of environmental accounts is to assess whether the value of natural capital represented by an ecosystem is changing over time. In the context of this study the ecosystem of interest is a coastal wetland, and the aim is to determine whether those systems are being maintained and renewed over time, and how the output of services is changing. More particularly, accounts can help determine whether the output of services (both market and non-market ones) meets society's needs or expectations. It is also important to establish whether the full cost of maintaining that natural capital is covered by the current prices for ecosystems goods and services that the society is prepared to pay. As argued in Chapter 1, it is suggested that the gap between the actual output of services and the level required by the society can be expressed clearly in physical terms as a set of ecosystem accounts, and that the construction of such accounts is the first step towards quantifying monetary costs of a biodiversity loss and, hence, the [insurance] value of resilience. Resilience is captured in such a set of accounts by identifying the minimum level of natural capital that is needed to generate the final services associated with the Socio-ecological system (SES) itself and the intermediate services that downstream systems require, given the level of environmental variation associated with the systems.
If we treat the SES as an accounting unit and seek to calculate its annual worth in such a way that the contribution of the environment and the damage that human activity imposes upon it are fully taken into account, then two steps are required. First, we must start with the income generated from the artificial capital associated with the SES and add to it the value of non-market ecosystem services associated with it to give an estimate of the local 'Inclusive Domestic Product' (IDP) for the SES. Second, we must adjust that estimate by the losses incurred due to the consumption of both artificial and natural types of capital and subtract it from the local IDP to calculate the net domestic product for the SES.
The construction of a set of ecosystem accounts that would describe both the values associated with the output of services and the maintenance costs is a formidable undertaking. The results presented in the last chapter did no more than show how it is possible to develop some indicators of the ecosystem stock and condition; the insights that these indicators currently bring to the questions about ecosystem integrity are at present, unfortunately, limited. Much of the data we need is simply not available on such a broad, strategic scale. Thus, we have to turn our attention to a more local situation and consider the four sites for coastal wetlands case studies identified in more detail. The aim is to test, in a general way, the robustness of the 'strategic view' that was built up using the kinds of land cover data available and the broad scale, and to explore further how such information might be integrated with the other, more locally specific, data to determine whether these ecosystem assets are being maintained over time.
The conceptual framework that forms the basis for this analysis is shown in Figure 5.1. This diagram has been designed to emphasise the fact that understanding the costs of biodiversity loss does not mean simply calculating the change in marginal values associated with the services arising from an ecosystem as a result of the impact of external factors on the 'health' or vigour of the system. It goes without saying that we need to be aware of these changes and of the potential losses from damage to the integrity of ecological systems. However, as Kontogianni et al. (2008) have noted, these values can change as a result of a number of demand-and-supply factors. Their review suggested that there was little conclusive evidence to suggest that WTP values were stable over short-to-medium period of time, and that they are highly likely to change in the longer term. This, they conclude, makes the task of modelling the dynamics of preferences very complex. We might add that it also makes them an insecure and, at best, partial basis for estimating the contribution that ecosystems make to human well-being, because it is not clear that they reflect the underlying costs of maintaining the integrity of that system. The output of many of the provisioning
5 Ecosystem accounting and the costs of maintenance at local scales

Ecosystem accounting and the costs of maintenance at local scales
Ecosystem accounting and the cost of biodiversity losses 57
services associated with wetland SES may, for example, involve trade-offs in relation to other services and, particularly, the supporting functions on which many other outputs depend.
In this chapter we will consider the four case study areas in more detail and will examine what insights presently exist in terms of understanding the maintenance costs associated with them. Given limited data, this analysis is largely qualitative in nature but it can be used to indicate what directions future work might take. For each of the study areas, we provide an overview of their recent history and the issues currently surrounding the maintenance of those natural capital assets that are associated with them.
The Doñana socio-ecological system
Location and history
The Doñana wetlands socio-ecological system located in the south west of Spain at the mouth of the Guadalquivir River is sometimes referred to as the Doñana fluvio-littoral system (Montes et al., 1998). It includes four main units (Figure 5.2): the coastal system, the Aeolian sand dunes to the west, and two wetland ecosystems – the Guadalquivir River Estuary and the Doñana marsh, which is the flood plain of the Guadalquivir River.
The full extent of the Doñana SES is shown in Figure 5.3. The land cover map that has been constructed using the Corine Land Cover data for the year 2000 shows these core semi-natural units. It also shows how the boundary of the unit in question extends beyond the latter to include the forests, heaths grasslands and sclerophyllous scrub areas to the west.
Figure 5.2 Doñana fluvio-littoral system
Doñana Natural Park
MATALASCAÑAS
EL ROCIO
SEVILLE
Doñana National Park
CoastlineAeolian sheetsMarshes
Guadalquivir Estuary
GUADAL
QUIV
IR R
IVER
N
0 5 10 15 20 25 30 km
Ecosystemstocks and flows
Ecosystemhealth
Service 1: e.g. timber
Service 2: e.g. fish
Service 3: e.g. water regulation
Service 4: e.g. eco-tourism
Service 5: e.g. n
Land coverBiomass/carbonSoilSpecies/populationsInland waterSeeAtmosphere
VigourOrganisationResilienceAutonomyHealthy populations
Service 1 value
Service 2 value
Service 3 value
Service 4 value
Service 5 value
Maintenance/restoration costs
Figure 5.1 Calculating the balance between service values and ecosystem maintenance and restoration costs

Ecosystem accounting and the cost of biodiversity losses
Ecosystem accounting and the costs of maintenance at local scales
58
In the early part of the 20th century, the population of the area was small, and the wetland ecosystems were largely intact. It supported a small-scale, subsistence economy that depended upon a range of provisioning ecosystem services. This situation started to change, however, after about 1930 with efforts to establish a more market-based economy. Land reclamation occurred and the development of intensive agriculture began. Between the years 1929 and 1956, private companies drained large areas of the marshes in order to cultivate rice, and from 1959 through to 1978, further transformations occurred as a result of the state-sponsored initiatives. The Almone-Marismas Plan, a major project to irrigate crops with groundwater, was implemented in the 1970s, and this resulted in the creation of about 8 000 ha of permanently irrigated land. Over the same period, the state actions had also led to the creation of extensive forest plantations, where eucalyptus and pine were introduced to the dune areas to supply the production of wood and pulp. At the same time, the pressures from the tourist trade along the coast have also been increasing from about 1970 onwards. The beaches of the area were declared of 'national interest for tourism', thus leading to a major urban development of Matalascañas, situated
on the edge of the Doñana National Park and within the Natural area (Figure 5.3).
Ecosystem transformations
The scale of these long-term transformations are summarised in the basic account of land- cover stock shown in Table 5.1. These data have been derived from the local sources. They show how the Doñana's natural capital base has been diminished through the simplification of ecosystems, which, in its turn, has been a result of efforts mostly aimed at increasing agricultural productivity throughout the area.
More than half of the originally untransformed marsh area has been lost — along with about 90 % of the shallow seasonal lakes. Some remaining areas of untransformed marshes become isolated because of the construction of flood barriers (Ministerio de Asuntos Sociales, 1989) and their functionality is reduced. In addition, Montes (2000) reports that more than half of the cork tree forest has been destroyed through the afforestation activities. The function of great importance to aquifer recharge – that of hydrological regulation — has also
Figure 5.3 Land cover in the Doñana SES in 2000
Legend
Donana SES
Artificial/Urban
Non irrigated arable land
Irrigated perimeters
Rice fields
Permanent crops
Pasture and agriculture mosaics
Forested land
Natural grassland, healthland, sclerophylous vegetation
Open space with little or no vegetation
Inland marshes
Peatbogs
Salt marshes
Salines
Intertidal flats
Water course
Lakes/reservoirs
Coastal lagoons42
Estuaries
Sea & ocean
Matalascaňas

Ecosystem accounting and the costs of maintenance at local scales
Ecosystem accounting and the cost of biodiversity losses 59
been affected by the high evapotranspiration rates of eucalyptus plantations and the over-extraction from the aquifer for irrigation purposes (Custodio, 1995). At the same time, sedimentation rates in the estuary have increased. While the background rate over the last 2 500 years has been around 1 mm/yr, in the last 50 years it has been nearer to 3–6 mm/yr (Rodríguez Ramirez et al., 2005). The water storage capacity of the marshes has been reduced by 26 hm3 in the last 50 years.
Some of the most striking aspects of the loss of ecosystem integrity can be illustrated by the changes in biodiversity detected in the area. The Spanish Imperial Eagle (Aquila adalberti) and the Iberian Lynx (Lynx pardinus), both of which used to be present within Doñana natural protected area in significant numbers, are now in danger of extinction (Ferrer and Negro, 2004) — as a result of human persecution and the loss of habitat (Nowell and Jackson, 1996). The decline of both species may also be partly due to a significant reduction in the abundance of prey, the European Rabbit (Oryctolagus cuniculus) among others. The rabbit is generally recognized as a keystone species. Due to the specificity of their diet, the conservation of
many raptor species depends on the stability of rabbit populations (Delibes-Mateos et al., 2007). The numbers of European Rabbits in Doñana were significantly reduced in the 20th century as a result of disease, while both the Imperial Eagle and the Iberian Lynx are known to feed preferentially on the rabbit in the area.
Another notable loss from the area has been the Guadalquivir Estuary Sturgeons (Acipenser sturio), which had been exploited commercially up to the mid-1970s. Their numbers have reduced significantly since the early 1960s and now they are considered critically endangered. A number of reasons have been suggested for this decline, including the construction of the Alcalá Dam, over-fishing, water pollution, gravel extraction on spawning grounds and the reduced water flow.
The biodiversity characteristics of the area have also been transformed as a result of the introduction of alien species. Seven introduced fish species are found in the Guadalquivir River, namely: Carp (Cyprinus carpio), Goldfish (Carassius auratus), Eastern Mosquitofish (Gambusia holbrooki), Largemouth Bass (Micropterus salmoides), Mummichog (Fundulus
Table 5.1 Land-cover changes during the period between 1956 and 2006
Land cover (ha) 1956 1977 1988 2006
Artificial Water infrastructure 0 0 164 291
Urban 138 501 928 928
Agricultural areas Aquiculture 0 0 3 608 3 482
Rice fields 5 040 27 740 40 751 40 751
Irrigation lands 23 407 45 193 45 182
Non-irrigated land 6 922 14 770 18 581 14 913
Greenhouse agriculture 0 0 162 154
Drained marsh 54 743 41 894 15 033 10 189
Salines 156 930 1 304 1 304
Natural areas Marsh water flows 5 734
'Lucios' (shallow, seasonal lakes) 6 417 546 565 565
Restored marshes 0 0 7 952
Non-transformed marshes 77 508 46 300 30 205 30 783
Fluvial beaches 1 371 4711 3 288 2 885
Water courses and estuarine 5 740 4 315 4 303 4 706
Other 1 810 431 1 494 1 494
Total 165 579 165 579 165 579 165 579
Source: ModifiedfromZorrilla,2006.
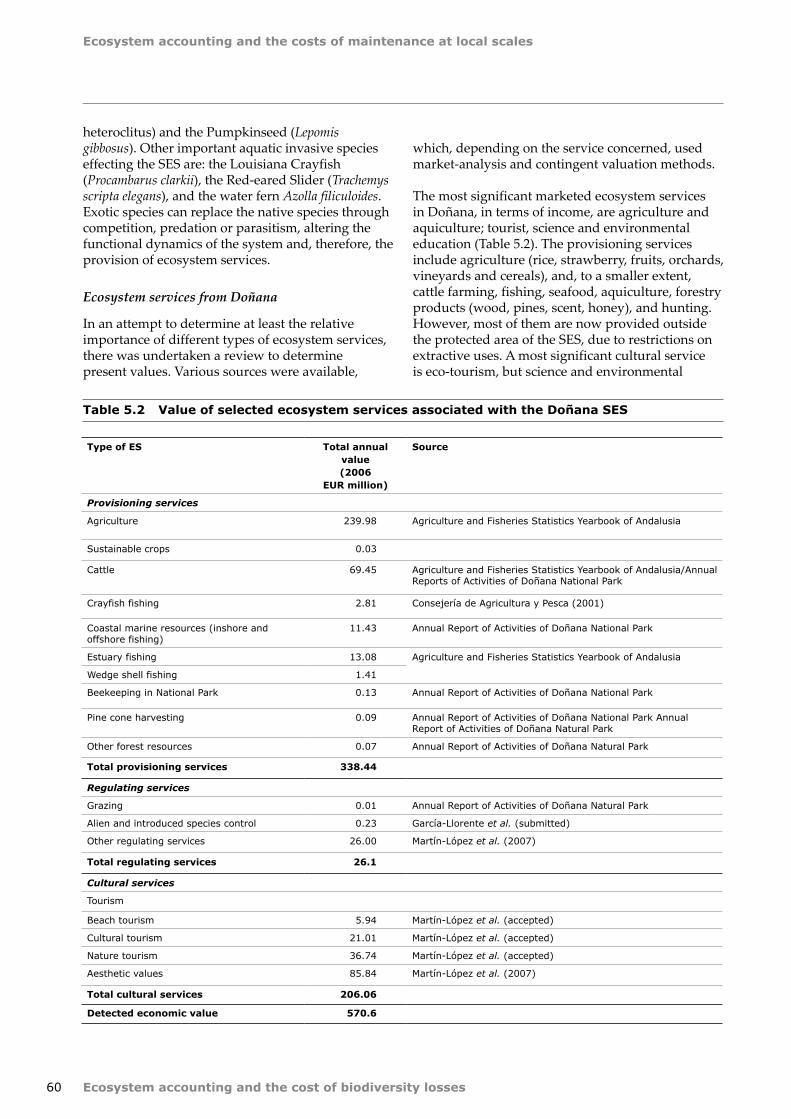
Ecosystem accounting and the cost of biodiversity losses
Ecosystem accounting and the costs of maintenance at local scales
60
heteroclitus) and the Pumpkinseed (Lepomis gibbosus). Other important aquatic invasive species effecting the SES are: the Louisiana Crayfish (Procambarus clarkii), the Red-eared Slider (Trachemys scripta elegans), and the water fern Azolla filiculoides. Exotic species can replace the native species through competition, predation or parasitism, altering the functional dynamics of the system and, therefore, the provision of ecosystem services.
Ecosystem services from Doñana
In an attempt to determine at least the relative importance of different types of ecosystem services, there was undertaken a review to determine present values. Various sources were available,
which, depending on the service concerned, used market-analysis and contingent valuation methods.
The most significant marketed ecosystem services in Doñana, in terms of income, are agriculture and aquiculture; tourist, science and environmental education (Table 5.2). The provisioning services include agriculture (rice, strawberry, fruits, orchards, vineyards and cereals), and, to a smaller extent, cattle farming, fishing, seafood, aquiculture, forestry products (wood, pines, scent, honey), and hunting. However, most of them are now provided outside the protected area of the SES, due to restrictions on extractive uses. A most significant cultural service is eco-tourism, but science and environmental
Table 5.2 Value of selected ecosystem services associated with the Doñana SES
Type of ES Total annual value (2006
EUR million)
Source
Provisioning services
Agriculture 239.98 Agriculture and Fisheries Statistics Yearbook of Andalusia
Sustainable crops 0.03
Cattle 69.45 Agriculture and Fisheries Statistics Yearbook of Andalusia/Annual Reports of Activities of Doñana National Park
Crayfish fishing 2.81 Consejería de Agricultura y Pesca (2001)
Coastal marine resources (inshore and offshore fishing)
11.43 Annual Report of Activities of Doñana National Park
Estuary fishing 13.08 Agriculture and Fisheries Statistics Yearbook of Andalusia
Wedge shell fishing 1.41
Beekeeping in National Park 0.13 Annual Report of Activities of Doñana National Park
Pine cone harvesting 0.09 Annual Report of Activities of Doñana National Park Annual Report of Activities of Doñana Natural Park
Other forest resources 0.07 Annual Report of Activities of Doñana Natural Park
Total provisioning services 338.44
Regulating services
Grazing 0.01 Annual Report of Activities of Doñana Natural Park
Alien and introduced species control 0.23 García-Llorente et al. (submitted)
Other regulating services 26.00 Martín-López et al. (2007)
Total regulating services 26.1
Cultural services
Tourism
Beach tourism 5.94 Martín-López et al. (accepted)
Cultural tourism 21.01 Martín-López et al. (accepted)
Nature tourism 36.74 Martín-López et al. (accepted)
Aesthetic values 85.84 Martín-López et al. (2007)
Total cultural services 206.06
Detected economic value 570.6
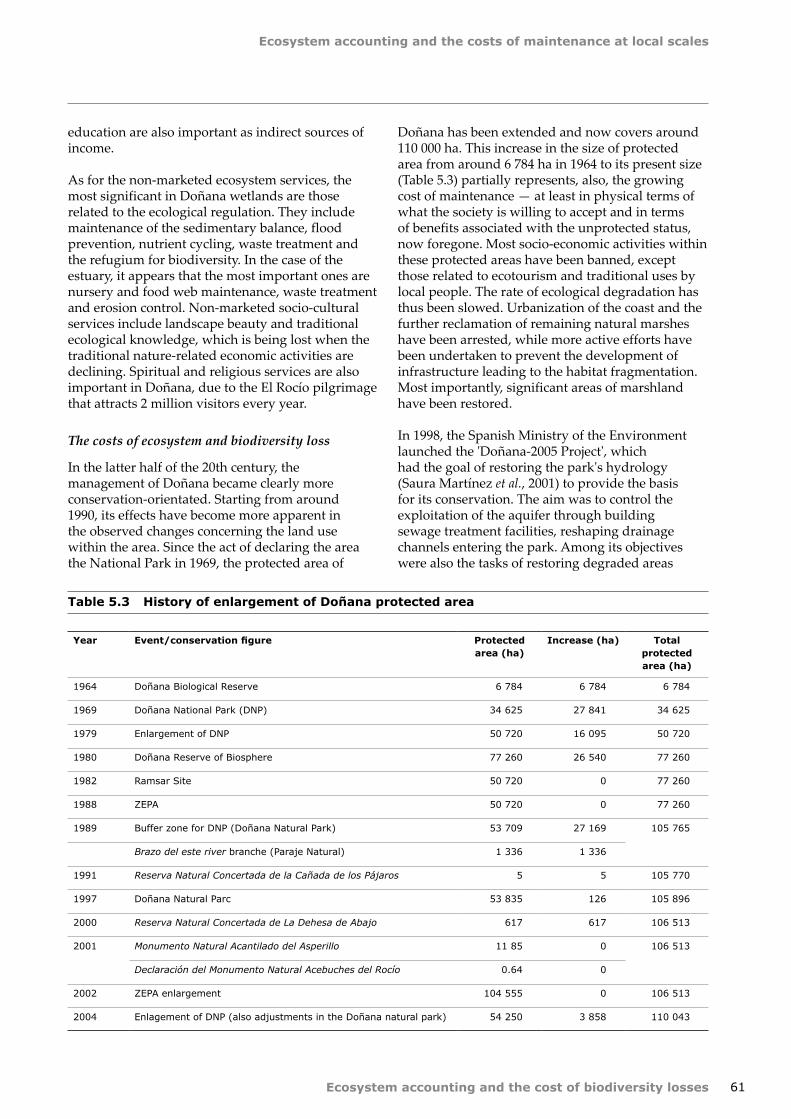
Ecosystem accounting and the costs of maintenance at local scales
Ecosystem accounting and the cost of biodiversity losses 61
education are also important as indirect sources of income.
As for the non-marketed ecosystem services, the most significant in Doñana wetlands are those related to the ecological regulation. They include maintenance of the sedimentary balance, flood prevention, nutrient cycling, waste treatment and the refugium for biodiversity. In the case of the estuary, it appears that the most important ones are nursery and food web maintenance, waste treatment and erosion control. Non-marketed socio-cultural services include landscape beauty and traditional ecological knowledge, which is being lost when the traditional nature-related economic activities are declining. Spiritual and religious services are also important in Doñana, due to the El Rocío pilgrimage that attracts 2 million visitors every year.
The costs of ecosystem and biodiversity loss
In the latter half of the 20th century, the management of Doñana became clearly more conservation-orientated. Starting from around 1990, its effects have become more apparent in the observed changes concerning the land use within the area. Since the act of declaring the area the National Park in 1969, the protected area of
Doñana has been extended and now covers around 110 000 ha. This increase in the size of protected area from around 6 784 ha in 1964 to its present size (Table 5.3) partially represents, also, the growing cost of maintenance — at least in physical terms of what the society is willing to accept and in terms of benefits associated with the unprotected status, now foregone. Most socio-economic activities within these protected areas have been banned, except those related to ecotourism and traditional uses by local people. The rate of ecological degradation has thus been slowed. Urbanization of the coast and the further reclamation of remaining natural marshes have been arrested, while more active efforts have been undertaken to prevent the development of infrastructure leading to the habitat fragmentation. Most importantly, significant areas of marshland have been restored.
In 1998, the Spanish Ministry of the Environment launched the 'Doñana-2005 Project', which had the goal of restoring the park's hydrology (Saura Martínez et al., 2001) to provide the basis for its conservation. The aim was to control the exploitation of the aquifer through building sewage treatment facilities, reshaping drainage channels entering the park. Among its objectives were also the tasks of restoring degraded areas
Table 5.3 History of enlargement of Doñana protected area
Year Event/conservation figure Protected area (ha)
Increase (ha) Total protected area (ha)
1964 Doñana Biological Reserve 6 784 6 784 6 784
1969 Doñana National Park (DNP) 34 625 27 841 34 625
1979 Enlargement of DNP 50 720 16 095 50 720
1980 Doñana Reserve of Biosphere 77 260 26 540 77 260
1982 Ramsar Site 50 720 0 77 260
1988 ZEPA 50 720 0 77 260
1989 Buffer zone for DNP (Doñana Natural Park) 53 709 27 169 105 765
Brazo del este river branche (Paraje Natural) 1 336 1 336
1991 Reserva Natural Concertada de la Cañada de los Pájaros 5 5 105 770
1997 Doñana Natural Parc 53 835 126 105 896
2000 Reserva Natural Concertada de La Dehesa de Abajo 617 617 106 513
2001 Monumento Natural Acantilado del Asperillo 11 85 0 106 513
Declaración del Monumento Natural Acebuches del Rocío 0.64 0
2002 ZEPA enlargement 104 555 0 106 513
2004 Enlagement of DNP (also adjustments in the Doñana natural park) 54 250 3 858 110 043

Ecosystem accounting and the cost of biodiversity losses
Ecosystem accounting and the costs of maintenance at local scales
62
and purchasing the abandoned agricultural land for further restoration work, and to providing the Imperial Eagle and Iberian Lynx with suitable hunting grounds (García-Novo et al., 2007). The average budget spent between 1998 and 2005 on this restoration project was EUR 83.5 million (14).
Other restoration and protection schemes have included the Green Corridor and Guadiamar Restoration Project — undertaking which have resulted in an investment of more than EUR 165 million over the last decade. The need for such initiatives was prompted by one of the most significant environmental disasters in Spain, namely the rupture, in 1998, of the Aznalcóllar mining dam situated upstream of Doñana.
The Doñana National Park and the Environment Department of the Andalusian Government have also invested resources in various efforts to eradicate and control the alien invasive species in Doñana. Over the last 20 years the amount spent on this objective has been; about EUR 3.7 million. During the most recent three years of the period, the allocation on projects dealing with invasive species represented about 12 % of their conservation budget.
In addition to numerous restoration and management schemes, considerable funds are also spent on research. In the context of water quality and quantity, the Spanish Geology and Mines Institute (IGME) has invested, during the last seven years, about EUR 1.9 million in the research of the aquifer of Doñana (Almonte-Marismas) (Manzano et al., 2005). Between 2004 and 2006, the Doñana National Park and the Environment Department of the Andalusian Government allocated more than a quarter of their research budget to problems associated with alien species.
Although these amounts are significant, they do not represent the full maintenance costs for the Doñana SES. Many human activities, both in the SES and upstream, continue to produce an impact on its ecological integrity, particularly in relation to water supply for the wetlands. In practice it means the following.
• Recentyearshaveseenthedevelopmentofstrawberry farming around the protected area, specialising in growing 'out of season' fruit for the consumers in northern Europe. It has been reported (15) that the abstraction of water
for irrigation, often from illegal boreholes, has reduced the flow in some of the rivers draining into Doñana by as much as 50 %, which has led to the drying out of some wetland areas. These farming activities have also lead to the loss of natural habitats, and the severance of migration corridors important for species such as the Iberian Lynx.
• RiceproductioninDoñanahasalsobeenproducing a significant adverse impact on the availability of water for the wetlands. About 35 000 ha are allocated to this crop, on the land that was once an open marshland. Although, to reduce diffuse pollution loads, rice farmers have recently adopted 'integrated' production methods,, the cultivation of rice continues to require large inputs of water. It has been argued (15) that while these rice growing areas have become clearly important for waterfowl, it would be beneficial to reduce the total area under the cop and introduce a more diverse form of farming. The environmental impact of rice cultivation could be reduced even further if more efficient irrigation systems were introduced and organic cultivation methods were taken up.
• Itisthoughtthattheintroduction,in1940s,ofEucalyptus (specifically, E. camaldulensis and E. globulus) into the Doñana area has also had a significant impact on water supply to many wetlands. With their deeper roots, these species can cause an appreciable water-table drawdown, and so displace the native vegetation and reduce natural flows to wetland areas. This problem was particularly acute in the El Abalario-La Mediana-La Rocina area, where much of the natural water-table discharge to the Ribetehilos and Mediana wetland complexes, as well as some other isolated lagoons, was lost. Since the 1980s, eucalyptus plantations have been cleared in the National Park and the Nature Park, and although this may now have positive impacts on the water provisioning service within the SES, it is interesting to note that provision services associated with these plantations (forest products and honey) are now in decline.
• Inparalleltothereducedwaterflows,inrecentyears, sedimentation rates in the Doñana have been increasing, and this has also constituted an impact on the ecosystem integrity. A number of causes have been identified, including canalisation and increasing discharge rates, the removal of the natural vegetation cover, and the removal of orchards and vineyards in
(14) See also: www.unep-wcmc.org/sites/wh/donana.html.(15) http://assets.panda.org/downloads/rz_oemn_factsheet_donana.pdf.

Ecosystem accounting and the costs of maintenance at local scales
Ecosystem accounting and the cost of biodiversity losses 63
the areas draining into Doñana. The increased sedimentation has reduced a loss of germination rates of the vegetation cover, and caused a release of phosphorus, which sometimes acts a trigger for threshold effects or the shifts in regime in the water state from clear to turbid.
A summary of the issues related to the maintenance and restoration of the natural capital of Doñana is given in Figure 5.4, using the conceptual framework introduced earlier. A complete calculation is not possible at this stage due to lack of information, but it is clear that valuation of the service output alone (and, indeed, marginal changes in the value resulting from any trade-offs between them) would not provide a complete picture. On the basis of the accounting model presented in Chapter 1, the aim, we suggest, should be:
(a) to use the issues described above as the initial premise;
(b) to create a set of basic accounts describing changes in the main ecosystem stocks and flows;
(c) a set of accounts describing the service flows from the SES;
(d) a third block of accounts covering the changes in ecological capital and the costs of maintaining those (or is it 'this block').
The Camargue socio-ecological system
Location and ecosystem characteristics
The Camargue is a socio-ecosystem located in the southern France, in the Mediterranean area. Structurally, it is made up of three parts, separated by the arms of the Rhone river. The area between the river's arms is called the 'Grande Camargue', while the area to the west is the 'Petite Camargue' and the area to the east the 'Plan du Bourg' (Figure 5.5). The SES mostly falls within the Camargue Regional Natural Park (PNRC) and is designated as a wetland
Figure 5.4 The balance between service values and ecosystem maintenance and restoration costs in Doñana
EcosystemStocks & Flows
EcosystemHealth
Service 1: Agricultural production
Service 2: Fishing and aquaculture
Service 3: Water quality/quantity
Service 4: Tourism
Service 5: Scientific value
Loss of open marsh shallow lagoons, water courses and native woodlands andexpansion of agricultural,artificial areas.
Loss of species, reducedwater flows and increasedsedimentation rates.
Expansion of alien species, increased number of endagered species, reduced resilience of vegetation communitiesdue to increasedsedimentation rates.
Service value increasing/stable?
Service value increasing/stable?
Service value Probably declining
Service value probably increasing?
Service value probably declining
Maintenance/restoration costs
Expansion of protected areas and investment inconservation and restoration of habitats, species and
ecosystem functioning (hydro-dynamics, control of alienspecies and water quality)

Ecosystem accounting and the cost of biodiversity losses
Ecosystem accounting and the costs of maintenance at local scales
64
Parc National Régional de Camargue
Réserve Naturelle Nationale de Camargue
Réserve Naturelle Régionale de la Tour du Valat
Propriétés du Conservatoire du Littoral
Propriétes du Conseil Général des Bouches-du-Rhône
Forêt publique soumise au régime forestier
Réserve Naturelle Régionale de Fromagère & Buisson Gros
Figure 5.5 The Camargue SES
Figure 5.6 Land cover in the Camargue SES
Camargue
Artificial/Urban
Non irrigated arable land
Irrigated perimeters
Rice fields
Permanent crops
Pasture and agriculture mosaics
Forested land
Natural grassland, healthland, sclerophylous vegetation
Open space with little or no vegetation
Inland marshes
Peatbogs
Salt marshes
Salines
Intertidal flats
Water course
Lakes/reservoirs
Coastal lagoons42
Estuaries
Sea & ocean
Legend
of international importance — because of high diversity among its species and habitats, and of the role it plays in the migratory patterns for European
birds. The two main ecosystem functional units are the fluvial-riparian freshwater wetland system in the

Ecosystem accounting and the costs of maintenance at local scales
Ecosystem accounting and the cost of biodiversity losses 65
Table 5.4 Changes in land cover, in 1942–1984, for the broader region of the Camargue
Land cover (ha) 1942 1953 1976 1984
Water bodies (lakes, reservoirs) 21 675 21 200 14 500 14 450
Temporary salt marshes 7 650 6 475 3 175 3 025
Sansouïre, grassland 33 875 27 825 15 500 15 200
Inland marshes 29 375 29 950 19 625 18 625
Forest 4 425 4 200 3 375 3 100
Salines 5 625 6 875 22 150 20 950
Agriculture 33 950 19 850 42 950 41 975
Industrial * 575 650 5 825* 8 550*
Rice 300 20 000 8 500 10 000
Other 7 550 7 975 9 400 9 125
Total 145 000 145 000 145 000 145 000
Note: *Cautionisneeded,asfiguresfortheperiodof1976–84includesurfacesearmarkedforindustrialdevelopment,ratherthan the areas actually developed. In 2008, large parts of these are still covered with (semi)-natural wetlands.
Source: According to Tamisier, 1990.
upper Camargue and the marine-riparian saltwater wetland system of the central and southern areas.
In terms of land use, it is possible to identify three broad belts (Figure 5.6). The core of the area is the nature protection zone made up of the central lagoons. Fishing activities here are strictly controlled. Around the periphery lies a belt of intensive production; salt is made in the south, and agriculture is practiced in the north, east and west. Between these two zones, there is a belt
of more extensive land use in connection with activities linked to tourism, cattle farming, nature protection, hunting, fishing and reed exploitation (Beaune, 1981). The pattern of agriculture has, however, changed over time. Vine production reached its peak in the late 19th century, to be overtaken in importance by the production of salt and rice in the 20th century (ARPE-PACA, 1992). Although rice production has passed its peak, this area remains the most important area for this crop in France.
Figure 5.7 Hydrological dynamics of the Camargue before (a) and after (b) the building of dykes in the late 19th and early 20th centuries
Marine inflows
Regular freshwater floods
N
10 km
Areas of main hydrologicalintervention
Dykes
N
10 km
a) b)
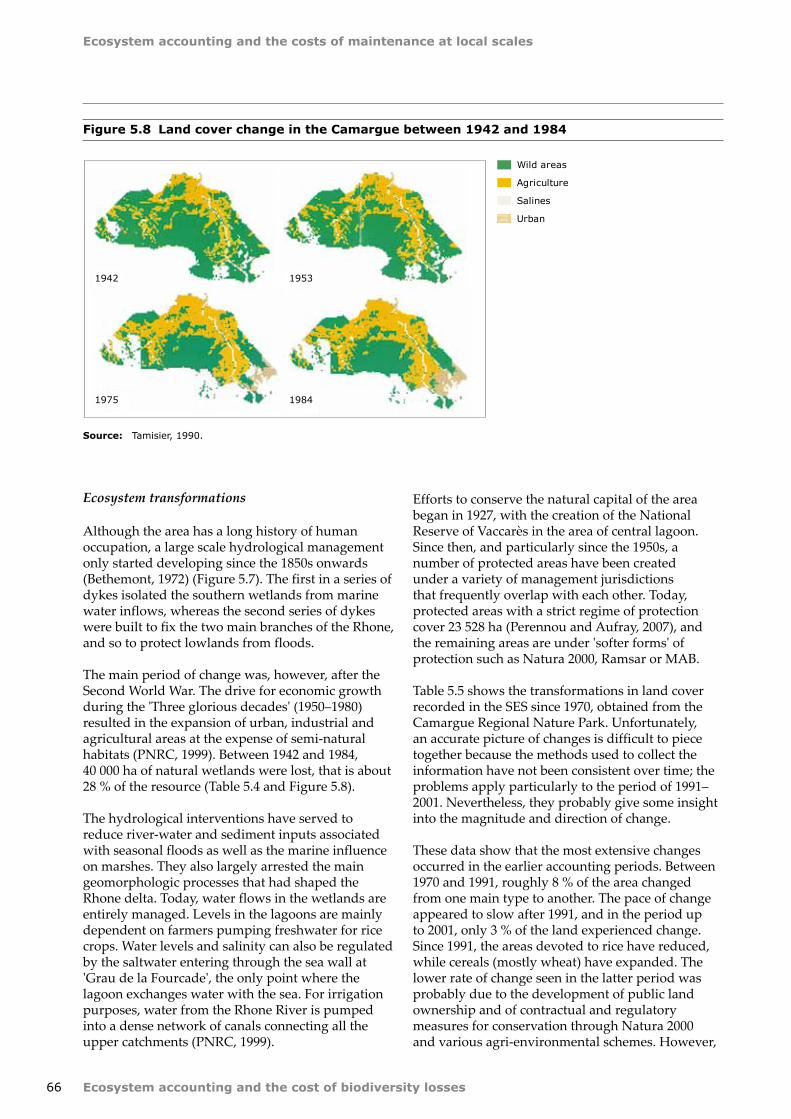
Ecosystem accounting and the cost of biodiversity losses
Ecosystem accounting and the costs of maintenance at local scales
66
Figure 5.8 Land cover change in the Camargue between 1942 and 1984
Wild areas
Agriculture
Salines
Urban
1942 1953
1975 1984
Ecosystem transformations
Although the area has a long history of human occupation, a large scale hydrological management only started developing since the 1850s onwards (Bethemont, 1972) (Figure 5.7). The first in a series of dykes isolated the southern wetlands from marine water inflows, whereas the second series of dykes were built to fix the two main branches of the Rhone, and so to protect lowlands from floods.
The main period of change was, however, after the Second World War. The drive for economic growth during the 'Three glorious decades' (1950–1980) resulted in the expansion of urban, industrial and agricultural areas at the expense of semi-natural habitats (PNRC, 1999). Between 1942 and 1984, 40 000 ha of natural wetlands were lost, that is about 28 % of the resource (Table 5.4 and Figure 5.8).
The hydrological interventions have served to reduce river-water and sediment inputs associated with seasonal floods as well as the marine influence on marshes. They also largely arrested the main geomorphologic processes that had shaped the Rhone delta. Today, water flows in the wetlands are entirely managed. Levels in the lagoons are mainly dependent on farmers pumping freshwater for rice crops. Water levels and salinity can also be regulated by the saltwater entering through the sea wall at 'Grau de la Fourcade', the only point where the lagoon exchanges water with the sea. For irrigation purposes, water from the Rhone River is pumped into a dense network of canals connecting all the upper catchments (PNRC, 1999).
Efforts to conserve the natural capital of the area began in 1927, with the creation of the National Reserve of Vaccarès in the area of central lagoon. Since then, and particularly since the 1950s, a number of protected areas have been created under a variety of management jurisdictions that frequently overlap with each other. Today, protected areas with a strict regime of protection cover 23 528 ha (Perennou and Aufray, 2007), and the remaining areas are under 'softer forms' of protection such as Natura 2000, Ramsar or MAB.
Table 5.5 shows the transformations in land cover recorded in the SES since 1970, obtained from the Camargue Regional Nature Park. Unfortunately, an accurate picture of changes is difficult to piece together because the methods used to collect the information have not been consistent over time; the problems apply particularly to the period of 1991–2001. Nevertheless, they probably give some insight into the magnitude and direction of change.
These data show that the most extensive changes occurred in the earlier accounting periods. Between 1970 and 1991, roughly 8 % of the area changed from one main type to another. The pace of change appeared to slow after 1991, and in the period up to 2001, only 3 % of the land experienced change. Since 1991, the areas devoted to rice have reduced, while cereals (mostly wheat) have expanded. The lower rate of change seen in the latter period was probably due to the development of public land ownership and of contractual and regulatory measures for conservation through Natura 2000 and various agri-environmental schemes. However,
Source: Tamisier, 1990.

Ecosystem accounting and the costs of maintenance at local scales
Ecosystem accounting and the cost of biodiversity losses 67
it is also important to note that the data quoted in Table 5.5 show net change only; in this latter period, some agricultural land was converted to marshes (722 ha) to support hunting and reed production, but at the same time, a further 659 ha of marshes were transformed for agricultural use. The apparent reduction in urban areas is also unlikely to reflect the true situation in relation to the pressures of development, because since 1991, most municipalities have recorded a population increase and an expansion of activities related to tourism.
The biodiversity of the Camargue is rich, and it is designated as a wetland of international importance under the Ramsar Convention. Information on the changes in biodiversity is heavily biased in favour of the associated bird species; the area is well-known as one of the keystone ecological sites for European migratory species. The Camargue is important for
a number of heron species, whose numbers are now increasing, following a sharp decline at the beginning of the 20th century, as a result of better protection measures. The area is also notable for its Greater Flamingo, whose populations have also increased in the recent years; wintering ducks and coot, and a range of waders and gull bird species. Although hunting has produced an adverse impact on some duck species, marsh restoration and captive breeding has shown a tendency to be of support to the populations of some species.
The salty and frequently flooded lowlands of the Camargue have always been used for extensive grazing; and bulls, sheep and horses are an essential element of the cultural landscape. The numbers in the herds of bulls and horses have increased since the 1970s, being stimulated by the demand from the tourism, support measures provided by
Table 5.5 Land cover change in the Camargue SES
1970 1991 2001 2006
Total (ha) 84 556 84 556 84 556 84 556
of which
Agricultural 22 370 24 299 25 365 22 440
Natural 46 919 43 607 43 578 43 870
Salines 12 292 13 338 14 137 14 760
Urban 1 310 1 698 1 445 1 230
of which
Permanently irrigated agriculture
Rice fields 9 970 13 583 11 928 8 774
Beaches, dunes and sand plains 2 067 1 834 1 643 1 710
Bare rock 0 0 0 0
Inland marshes 9 493 9 004 10 142 10 385
Salines 12 292 13 338 14 137 14 760
Intertidal flats 0 0 0
Water courses 3 114 3 114 3 114 3 114
Water bodies (lakes, reservoirs) 0 0 0 0
Coastal lagoons and salt marshes 15 447 14 758 14 300 14 213
Estuaries 0 0 0 0
Important agricultural and natural types for Camargue
Cereals (mostly wheat) 6 530 4 805 5 376 5 924
Salt steppes (sansouïre) 10 754 10 165 5 376 5 924
Grassland 1 460 1 014 1 168 1 369
Fallow NA 3,463 6 200 4 982
Lawn 3 561 3 108 1 837 1 710
Woods 1 690 1 624 2 373 2 606

Ecosystem accounting and the cost of biodiversity losses
Ecosystem accounting and the costs of maintenance at local scales
68
the park authorities, and the official recognition of the local adapted races. Over the same period, the numbers of sheep have declined — as a result of the extension of cropping and the reduction in demand for wool (Boulot, 1991; Beaune, 1981). The increase in bull numbers, coupled with the reduced area available for grazing, has meant that some pastures have become over-grazed and the incidence of disease has increased (Boulot, 1991; Beaune, 1981)). Usually, cattle are let in salty lowlands (marshes and sansouïre) in summer and taken to elevated pastures, not liable to flooding, in winter, or they are moved outside the delta. However, since some areas have been partly used for rice, the situation is further exacerbated by the fact that around 60 % of the lands, traditionally used for grazing, do not belong to breeders (PNRC, 1999).
Ecosystem services from the Camargue
Due to its large variety of habitats, high water availability, connection with the Mediterranean landscape and its place in the network of European migratory birds, the Camargue performs a number of key ecological functions. They include habitat provision, specific diversity maintenance (birds, insects, and amphibians), water purification and nutrient cycling (Isenman, 2004). The area, therefore, provides a number of important ecosystem services, and many of these are significant in relation to the local and regional economy (Table 5.6) (Mathevet, 2000; Perennou and Aufrey, 2007). The high primary productivity of the area supports provisioning services in the form of agricultural production (especially rice), the freshwater marshes support
Table 5.6 Main ecosystem functions and ecological services identified in the Camargue
Service-type Category Service Specific location (if any)
Provisioning Food Hunting Freshwater marshes
Salt production Lagoons transformed into saline, close to the sea
Fishing Lagoons (and Rhone river and coast, not detailed here)
Livestock Salty pastures ('sansouïres' and lawns)
Agriculture Peripheral, mainly Northern/Western/Eastern highlands
Materials Reed production Freshwater marshes
Regulating Cycling Soil retention
Hydrological regulation
Pollination for useful plants
Climate regulation Lagoons
Sink Soil purification
Water purification Lagoons, drainage ditches
Prevention Pest prevention
Invasive species prevention
Air quality
Socio-cultural Recreational Tourism Agro-eco-tourism inland and beaches
Landscape beauty
Didactic Education/interpretation Freshwater marshes – lagoons
Scientific research Semi-natural and lagoons
Traditional ecological knowledge
Supporting Nutrient cycling
Soil formation
Primary production
Source: Mathevet, 2000; Perennou and Aufray, 2007.

Ecosystem accounting and the costs of maintenance at local scales
Ecosystem accounting and the cost of biodiversity losses 69
Table 5.7 Direct and indirect use values for selected ecosystem services associated with the 'Grande Camargue', whenever possible
Provisioning services Physical units 1 Physical units 2 Market Shadow Resource
price prices rent
value
1 2 1 2 3 5 6
Fishing and related activities
Fishing 104.5 tonnes 1 species 627 000
Aquaculture tonnes
Illegal captures tonnes
... tonnes
Seaweed farming tonnes
Hunting tonnes 117 241 number 3 837 742 2 415 960
Harvesting for fuel, timber and other products
Reeds 402 000 bundles tonnes 767 820 138 000
Fuelwood m3
Timber m3
Rice 45 537 tonnes 8 652 081
Products of traditional/organic tonnes
Other agriculture products 13 465 tonnes 1 989 979
Husbandry
Cattle tonnes 6 455 number
Horses tonnes 3 000 number
Sheep, goats tonnes 20 000 number
Other animals tonnes number
Cultural services
Tourism and related activities
Tourism as a whole 311 918 visitors ####### nights ########
Regular tourism visitors nights
Eco-tourism visitors nights
Activities linked to tourism
Knowledge
Traditional
Scientific 40 visitors 41 publications
Regulating services
Habitat provision for fisheries and other species
Spawning/coastal water ha
Spawning/breeding ground in Wetland
ha
Nursery and juvenile habitat ha
Adult habitat ha
...
Natural hazard protection
Filtering ha 100 km3
Flood mitigation ha number
...
...
Nature conservation services
Water regulating functions ha m3
Habitats maintenance ha number
...
Key 1 Quantity, number of units 2 Measurement unit 3 Raw products at producer price (without VAT) 4 Products used for further production: fuel, forage, seeds, fertilisers, food prepared in restaurants, small tools… 5 Measurement of non-market services according to the willingness to pay of users or equivalent production functions 6 In economics, rent is a surplus value after all costs and normal returns have been accounted for, i.e. the difference

Ecosystem accounting and the cost of biodiversity losses
Ecosystem accounting and the costs of maintenance at local scales
70
hunting and fishing, while the salt production is significant for the saline lagoons. In addition, important regulating services include water purification; a number of local biological purification plants are based on Phragmites stands. Tourist-related activities are amongst the most important cultural services.
Traditional activities such as fishing and reed-cutting still occur in the Camargue, but the number of people dependent on such activities is small. The main areas for reed bed exploitation are mainly located in the parts of the delta outside the SES. But again, in total, very few people are thus supported. These activities are sustained by agri-environmental subsidies from the park authorities, who allocate those because reed beds are an important natural habitat for many protected species.
The most significant marketed ecosystem services in the Camargue, in terms of revenue, are agriculture, hunting and tourism (Table 5.7). The services, for which the differences between the market value and the resource rent are known,
are reed extraction and hunting (Mathevet, 2000). These estimates suggest there is a marked difference between the income derived and the costs of production. However, it should be noted that all the figures presented here are approximate, since such information is difficult to collect. The data on hunting, for example, probably only give an insight into the magnitude of the income related to this activity, because it is difficult to gain precise information from this, somewhat secretive, sector. Similarly, the data on tourism should be interpreted with care, as there is no single source of information on visitor frequency to the Camargue.
A major data deficiency, when estimating the value of services, is in the area concerning the regulation of water quality and quantity, and its importance for the other services it supports. A simplified budget for hydrological flows is presented in Figure 5.9. The overall water balance is negative because of high evapotranspiration, enhanced by the high temperatures and the wind. Overall, the water levels and salinity in the lagoons are largely driven by the amount of drainage freshwater from rice fields, although natural factors, such as floods,
Figure 5.9 Simplified hydrological budget for the Camargue (volumes in millions of m3 )
Irriga�on : 400
Sea entrance : 5
Lagoon exit 2 2 : 5
Evapotranspira�on : 5
Drainage : 5
Irrigation : 400
Sea entrance : 9
Rainfall : 360
Lagoon exit : 22
Evapotranspiration : 565
Drainage : 180
Source: ModifiedfromPNRC,2007,fromP.Chauvelon,TourduValat.

Ecosystem accounting and the costs of maintenance at local scales
Ecosystem accounting and the cost of biodiversity losses 71
can also play a part. Today, some freshwater is diverted into the marsh as part of the management plan for hunting and, to a lesser extent, for nature conservation. There are two hydrological seasons: from April to September, the rice crops are intensively irrigated (70 % of the water is pumped in July and August), and from October to March, when water pumping stops and rainfall is sufficient for agriculture (PNRC, 1999). This use of freshwater imposes an inverted hydrological rhythm onto the Camargue, where water availability is high in summertime, when the Mediterranean ecosystems are usually dry. The closed hydro-system of the salinas involves the pumping of about 80 mm3 of sea water each year, in order to produce 0.8 million tonnes of salt in the Grande Camargue (PNRC, 1999).
The quality of water reaching the Camargue has declined, and the recent contamination of the Rhone by PCBs resulted in a ban on fishing in the river. The contamination of fish is, however, well documented in the lagoons (Oliveira et al., 2008; Roche et al., 2000), although information on its ecological is lacking. The lagoons are also contaminated from pesticides used in the rice production (Comoretto et al., 2008).
Over the last century, there has been a significant reduction in the load of sediments brought into the delta area by the Rhone river, which is a result of damming and dyking (Sabatier and Provansal, 2002); there is also significant coastal erosion (PNRC and EID, 2006). Such losses, coupled with the effects of the rising sea levels mean that towns such as Saintes-Maries-de-la-Mer are at a significant risk from flooding and inundation.
Table 5.8 Extent of protected areas within thenatural regional park
Year Surface of protected areas (ha)
1920 0
1930 13 117
1940 13 117
1950 14 705
1960 14 705
1970 17 635
1980 19 426
1990 19 887
2000 20 937
2008 23 528
The costs of ecosystem and biodiversity loss
The Camargue Park was created in 1970 and is one of the oldest in France. It was established because the French Government wanted to have a protected area in the Camargue since it was recognized as an internationally important wetland. The key local actors agreed to its creation, provided the direction of the park was undertaken through a private foundation. This situation was, however, unique in France, and the transition to a more 'normal' institutional structure began in 2002. From that date until 2004, the park was run in part by a 'Groupement d'Intérêt Public', an administrative transition structure made up of public and private bodies. Since 2005, a 'Syndicat Mixte' has managed the Park. This change did not meet with approval of all interest groups and legal action was taken against the new park administration. The situation was resolved by the passing of special law in 2007, which had ensured that private landowners would still be part of the management structure, even if in minority.
Table 5.8 shows the gradual increase in the size of the area taken into some form of protection since 1930. All in all, the total annual expenditure for nature protection in the Camargue is between EUR 14–15 million, although this may be an underestimate. We have not included some agro-environmental subsidies provided by the park, for instance, to the two cities in the area to manage their waste and wastewater. Making precise estimates is even more difficult because the park does not fit within local administrative boundaries; for example, only the rural part of Arles lies, within the park. This makes the use of municipal statistics
Source: Perennou and Aufray, 2007.

Ecosystem accounting and the cost of biodiversity losses
Ecosystem accounting and the costs of maintenance at local scales
72
problematic. A further EUR 3 million is spent on research and development.
It is worth noting that about the two thirds of the total expenditure is directed towards the maintenance of the dykes: both on the arms of the Rhone and on the Mediterranean Sea coast, to protect agriculture and human infrastructures. A considerable effort at water management was first initiated after the major floods of 2003–2004, and so this level of expenditure is relatively new. One may argue that these protection works are contradictory because they further disrupt the 'natural' functioning of the delta.
In terms of gaining an insight into the implications of biodiversity loss within the Camargue, the trade-offs between the services listed in Tables 5.6 and 5.7 should be noted. Historically, agricultural expansion has tended to undermine the water quality and this has been producing an impact on services such as fishing and hunting. Agriculture also influences the availability of water within the socio-ecosystem and, hence, it distorts its functions
of hydrological regulation, the salinity in the lagoons (thus, affecting biodiversity and fishing) and the levels of pest species such as mosquitoes. The consequences for supporting services are not known.
The expansion of tourism has also created impacts on biodiversity — though urbanisation and disturbance. With a peak in the summer, tourist activities increase the seasonal demand for water and the release of waste, with has an impact on the public expenditure and water quality. On the other hand, it has enhanced livestock production by stimulating a demand for traditional events; the problem this has generated in terms of overgrazing has been noted above (see PNRC, 1999 for impact of tourism). Hunting also has produced contrasting effects. On the one hand, the management of marshes for duck hunting tends to increase the habitat and food availability for these species and for other aquatic birds. At the same time, it enhances direct and indirect faunal mortality, it modifies the plant communities and natural habitats, and it creates a competition for land traditionally used for livestock grazing.
Figure 5.10 The balance between service values and ecosystem maintenance and restoration costs in the Camargue
EcosystemStocks & Flows
EcosystemHealth
Service 1: Agricultural production
Service 2: Hunting
Service 3: Water quality/quanity
Service 4: Tourism
Loss of open marsh andexpansion of agricultural,artificial areas.
Loss of species, reducedwater flows and increasedsedimentation rates.
Reduced resilience of vegetation communitiesdue to increasedsedimentation rates.
Service value increasing/stable?
Service value stable?
Service value Probably declining
Service value probably increasing
Maintenance/restoration costs
Expansion of protected areas and investment inconservation and restoration of habitats, species and
ecosystem functioning (hydro-dynamics and water quality)

Ecosystem accounting and the costs of maintenance at local scales
Ecosystem accounting and the cost of biodiversity losses 73
Figure 5.11 The Amvrakikos SES
Artificial/Urban
Non irrigated arable land
Irrigated perimeters
Rice fields
Permanent crops
Pasture and agriculture mosaics
Forested land
Natural grassland, healthland, sclerophylous vegetation
Open space with little or no vegetation
Inland marshes
Peatbogs
Salt marshes
Salines
Intertidal flats
Water course
Lakes/reservoirs
Coastal lagoons42
Estuaries
Sea & ocean
Legend
Corine land cover 2000Amvrakikos
A summary of the issues related to the maintenance and restoration of the natural capital of the Camargue is given in Figure 5.10. The summary uses the conceptual framework introduced earlier in the chapter. Once again, a complete calculation is not possible at this stage because of the lack of information, but it is clear that valuation of the service output alone (and, indeed, a marginal change in the value resulting from any trade-offs between them) would not provide a full idea of the costs of biodiversity loss in this area.
The Amvrakikos socio-ecological system
Location and ecosystem characteristics
The Gulf of Amvrakikos is an enclosure of the Mediterranean Sea on the western coast of Greece (Figure 5.11). The rivers Louros and Arachtos enter the gulf in the north and form a double delta that forms some of the largest areas of wetlands in Mediterranean Europe. These wetlands are characterised by great diversity of habitat types, extensive fresh and salt water marshes and lagoons among them. The marine waters of Amvrakikos
also provide a major fishing ground for commercial coastal fisheries and the area for aquaculture.
The main part of the SES is made up of the Amvrakikos National Park, which covers the area of about 1 800 km²; it also includes the marine waters of the Amvrakikos Gulf and the adjacent coastal lagoons, salt and freshwater marshes, hills and remnants of riverine forests, and buffer zones with agricultural land and villages. The catchment area that feeds the Gulf is, however, much larger and extends to about 300 000 ha.
The SES is dominated by three large natural lagoons: Rodia, Tsoukalio and Logarou Lagoon. Extensive areas of salt marshes, reed beds and brackish water meadows border the lagoons. The Rodia marsh is one of the largest reed areas in South Eastern Europe.
In general terms, Mediterranean sclerophyllous vegetation is the dominant semi-natural land cover type (Figure 5.12) – along with natural grasslands, salt marshes and coastal lagoons. The valleys of the Louros and Arachtos Rivers also retain some small remnants of the riparian forest. Apart from
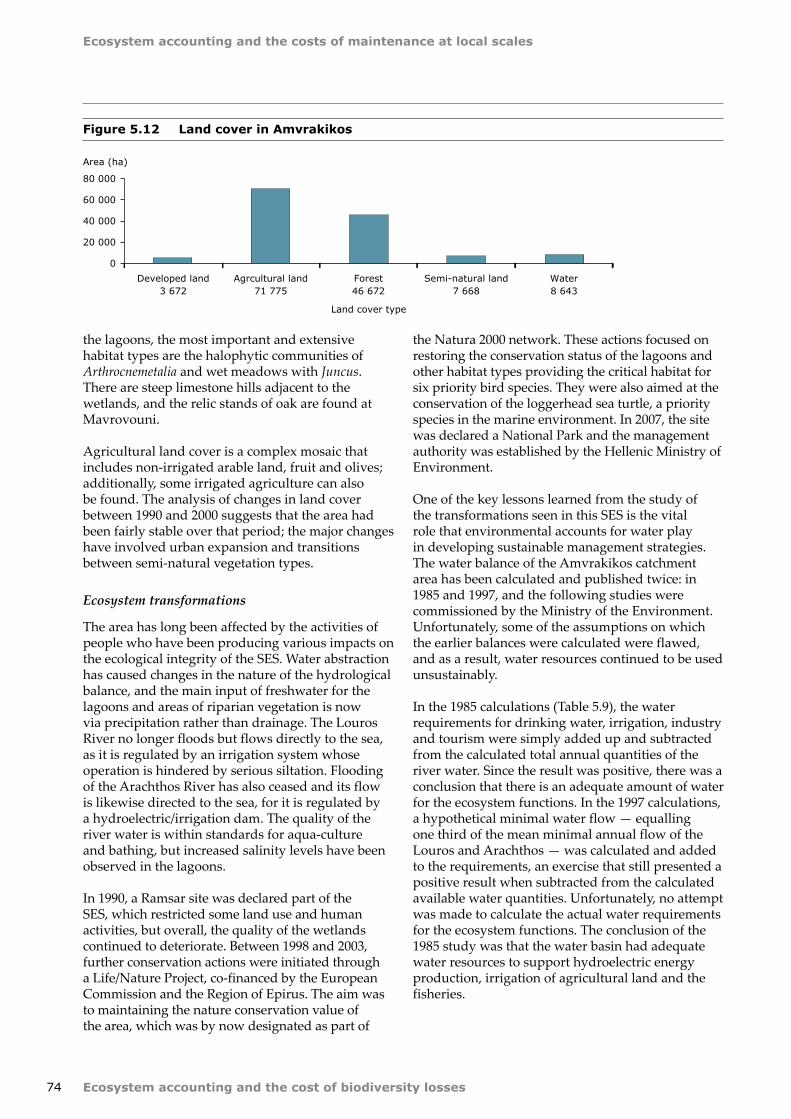
Ecosystem accounting and the cost of biodiversity losses
Ecosystem accounting and the costs of maintenance at local scales
74
the lagoons, the most important and extensive habitat types are the halophytic communities of Arthrocnemetalia and wet meadows with Juncus. There are steep limestone hills adjacent to the wetlands, and the relic stands of oak are found at Mavrovouni.
Agricultural land cover is a complex mosaic that includes non-irrigated arable land, fruit and olives; additionally, some irrigated agriculture can also be found. The analysis of changes in land cover between 1990 and 2000 suggests that the area had been fairly stable over that period; the major changes have involved urban expansion and transitions between semi-natural vegetation types.
Ecosystem transformations
The area has long been affected by the activities of people who have been producing various impacts on the ecological integrity of the SES. Water abstraction has caused changes in the nature of the hydrological balance, and the main input of freshwater for the lagoons and areas of riparian vegetation is now via precipitation rather than drainage. The Louros River no longer floods but flows directly to the sea, as it is regulated by an irrigation system whose operation is hindered by serious siltation. Flooding of the Arachthos River has also ceased and its flow is likewise directed to the sea, for it is regulated by a hydroelectric/irrigation dam. The quality of the river water is within standards for aqua-culture and bathing, but increased salinity levels have been observed in the lagoons.
In 1990, a Ramsar site was declared part of the SES, which restricted some land use and human activities, but overall, the quality of the wetlands continued to deteriorate. Between 1998 and 2003, further conservation actions were initiated through a Life/Nature Project, co-financed by the European Commission and the Region of Epirus. The aim was to maintaining the nature conservation value of the area, which was by now designated as part of
the Natura 2000 network. These actions focused on restoring the conservation status of the lagoons and other habitat types providing the critical habitat for six priority bird species. They were also aimed at the conservation of the loggerhead sea turtle, a priority species in the marine environment. In 2007, the site was declared a National Park and the management authority was established by the Hellenic Ministry of Environment.
One of the key lessons learned from the study of the transformations seen in this SES is the vital role that environmental accounts for water play in developing sustainable management strategies. The water balance of the Amvrakikos catchment area has been calculated and published twice: in 1985 and 1997, and the following studies were commissioned by the Ministry of the Environment. Unfortunately, some of the assumptions on which the earlier balances were calculated were flawed, and as a result, water resources continued to be used unsustainably.
In the 1985 calculations (Table 5.9), the water requirements for drinking water, irrigation, industry and tourism were simply added up and subtracted from the calculated total annual quantities of the river water. Since the result was positive, there was a conclusion that there is an adequate amount of water for the ecosystem functions. In the 1997 calculations, a hypothetical minimal water flow — equalling one third of the mean minimal annual flow of the Louros and Arachthos — was calculated and added to the requirements, an exercise that still presented a positive result when subtracted from the calculated available water quantities. Unfortunately, no attempt was made to calculate the actual water requirements for the ecosystem functions. The conclusion of the 1985 study was that the water basin had adequate water resources to support hydroelectric energy production, irrigation of agricultural land and the fisheries.
Figure 5.12 Land cover in Amvrakikos
80 000
Area (ha)
60 000
40 000
20 000
0
Developed land Agrcultural land Forest Water3 672
Land cover type
71 775 46 672 7 668 8 643Semi-natural land
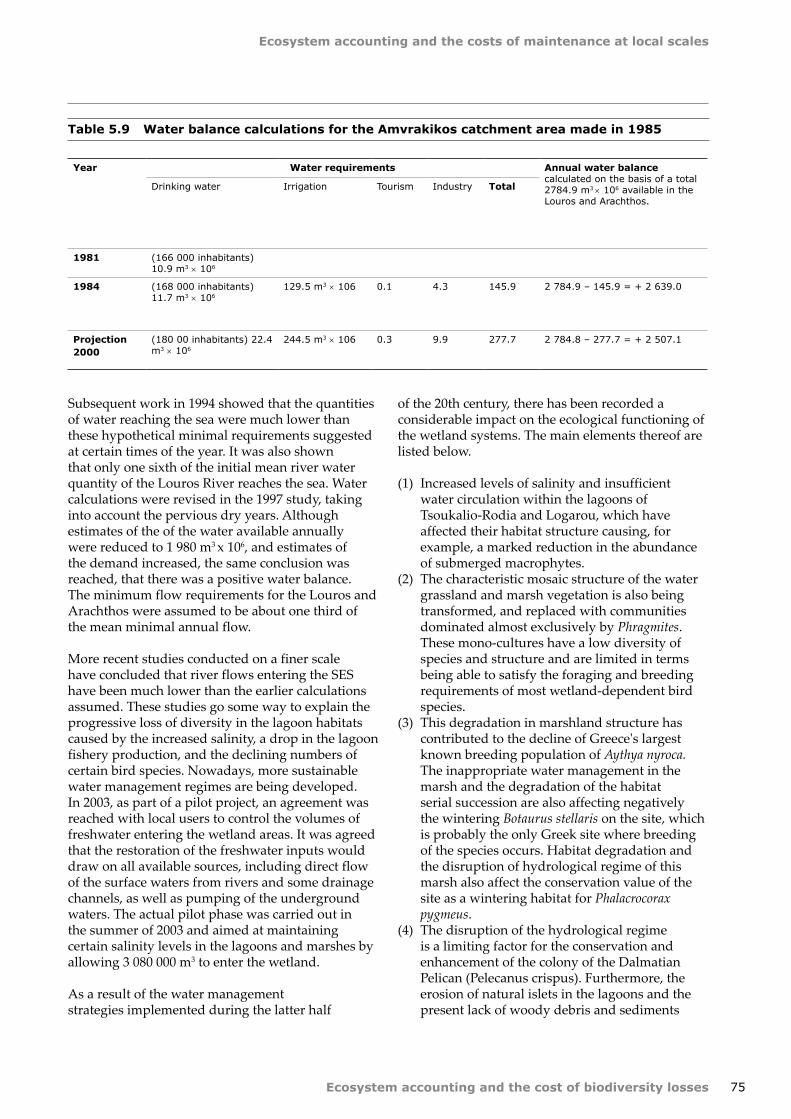
Ecosystem accounting and the costs of maintenance at local scales
Ecosystem accounting and the cost of biodiversity losses 75
Table 5.9 Water balance calculations for the Amvrakikos catchment area made in 1985
Year Water requirements Annual water balance calculated on the basis of a total 2784.9 m3 × 106 available in the Louros and Arachthos.
Drinking water Irrigation Tourism Industry Total
1981 (166 000 inhabitants) 10.9 m3 × 106
1984 (168 000 inhabitants) 11.7 m3 × 106
129.5 m3 × 106 0.1 4.3 145.9 2 784.9 – 145.9 = + 2 639.0
Projection 2000
(180 00 inhabitants) 22.4 m3 × 106
244.5 m3 × 106 0.3 9.9 277.7 2 784.8 – 277.7 = + 2 507.1
Subsequent work in 1994 showed that the quantities of water reaching the sea were much lower than these hypothetical minimal requirements suggested at certain times of the year. It was also shown that only one sixth of the initial mean river water quantity of the Louros River reaches the sea. Water calculations were revised in the 1997 study, taking into account the pervious dry years. Although estimates of the of the water available annually were reduced to 1 980 m3 x 106, and estimates of the demand increased, the same conclusion was reached, that there was a positive water balance. The minimum flow requirements for the Louros and Arachthos were assumed to be about one third of the mean minimal annual flow.
More recent studies conducted on a finer scale have concluded that river flows entering the SES have been much lower than the earlier calculations assumed. These studies go some way to explain the progressive loss of diversity in the lagoon habitats caused by the increased salinity, a drop in the lagoon fishery production, and the declining numbers of certain bird species. Nowadays, more sustainable water management regimes are being developed. In 2003, as part of a pilot project, an agreement was reached with local users to control the volumes of freshwater entering the wetland areas. It was agreed that the restoration of the freshwater inputs would draw on all available sources, including direct flow of the surface waters from rivers and some drainage channels, as well as pumping of the underground waters. The actual pilot phase was carried out in the summer of 2003 and aimed at maintaining certain salinity levels in the lagoons and marshes by allowing 3 080 000 m3 to enter the wetland.
As a result of the water management strategies implemented during the latter half
of the 20th century, there has been recorded a considerable impact on the ecological functioning of the wetland systems. The main elements thereof are listed below.
(1) Increased levels of salinity and insufficient water circulation within the lagoons of Tsoukalio-Rodia and Logarou, which have affected their habitat structure causing, for example, a marked reduction in the abundance of submerged macrophytes.
(2) The characteristic mosaic structure of the water grassland and marsh vegetation is also being transformed, and replaced with communities dominated almost exclusively by Phragmites. These mono-cultures have a low diversity of species and structure and are limited in terms being able to satisfy the foraging and breeding requirements of most wetland-dependent bird species.
(3) This degradation in marshland structure has contributed to the decline of Greece's largest known breeding population of Aythya nyroca. The inappropriate water management in the marsh and the degradation of the habitat serial succession are also affecting negatively the wintering Botaurus stellaris on the site, which is probably the only Greek site where breeding of the species occurs. Habitat degradation and the disruption of hydrological regime of this marsh also affect the conservation value of the site as a wintering habitat for Phalacrocorax pygmeus.
(4) The disruption of the hydrological regime is a limiting factor for the conservation and enhancement of the colony of the Dalmatian Pelican (Pelecanus crispus). Furthermore, the erosion of natural islets in the lagoons and the present lack of woody debris and sediments

Ecosystem accounting and the cost of biodiversity losses
Ecosystem accounting and the costs of maintenance at local scales
76
Table 5.10 Accounts for lagoon fisheries
Lagoon 1977 1978 1979 1980 1981 1982 1983 1993 1994 1995
Tsoukalio (2 880 ha)
162.5 179.7 179.7 161.0 159.1 208.0 166.4 74.9 74.1 84.4
Logarou (2 500 ha)
146.6 135.0 130.4 159.9 183.2 205.6 188.8 100.3 102.7 139.3
Table 5.11 Accounts for fisheries in inland waters
Year Indicator of change in fisheries yield
Total tonnes from the water catchment area
Total numbers of fishermen in the water
catchment area
Indicator of change in numbers of fishermen
1983 100 1 127 100
1984 106 1 144 101
1985 97 637 1 116 99
1986 108 423 1 200 106
1987 82 457 1 153 102
1988 80 521 1 058 94
1989 86 500 1 097 97
1990 112 1 050 1 200 106
1991 83 508 1 184 105
…
1993
(that used to enter the system during the flooding of the Louros River and through the natural breaks in the lagoon barriers now re-enforced by dikes) present a threat of the rapid decline in the nesting habitat of this species. As a result, the nesting islets for the Dalmatian Pelicans and several other Annex I species (terns, waterfowl, waders, etc.) are declining.
An additional issue has been the loss of water buffalos that , as in other Mediterranean wetlands, were traditionally grazed on the freshwater marshes. It should be noted, however, that the situation is somewhat exacerbated by the fact that they were removed from Amvrakikos in the early 1970s, in an attempt to modernize livestock breeding systems. Imported and improved breeds were introduced because of their assumed market value. It was found, however, that the new breeds could not withstand the climatic conditions and the increased salinity of the wetlands, and were kept on farms or grazed on the hills and adjacent areas. The extinction of water buffalos in Amvrakikos, and the subsequent lack of reed bed management, lead to an expansion of reed beds within the lagoons, which reduced their quality as a foraging and nesting habitat for most wetland-dependent bird species.
Since 2001, a small reintroduction programme has begun and the effects of grazing on the vegetation structure are now being recorded — in order to examine the effectiveness of restoration measures. It appears that water buffaloes have proved to be a useful restoration and management tool, especially when combined with an increased inflow and circulation of freshwater into the lagoons. They have also proved to be an important ecotourism attraction and have already provided some marginal revenue to land managers — due to the rising markets for buffalo meat, cheese and butter.
Ecosystem services from Amvrakikos
No systematic study of the ecosystem services generated by the Amvrakikos SES has proved available, and so the picture presented here is somewhat limited.
In terms of provisioning services, several commercial fish species (Anguilla anguilla, Mugil spp., Solea spp. Gobius niger, Sparus aurata, Dicentraurchus labrax) have been exploited traditionally in the lagoons, which they enter seasonally through openings from the sea. Simple accounts for the fisheries in both the lagoons and inland waters are shown in Tables 5.10 and 5.11. Although the data do

Ecosystem accounting and the costs of maintenance at local scales
Ecosystem accounting and the cost of biodiversity losses 77
not extend into the present, overall, there appears to have been a reduction in yields of the lagoon fisheries — of about 10–15 % over the period of 1980–1995. There is also evidence of a decline in the yield of fisheries associated with inland waters.
In terms of the conservation value and services related to biodiversity, the SES, as noted above supports significant waterfowl populations every winter. Despite damage to these systems in the past, the lagoons remain important foraging habitat for
40 out of the 78 Annex I bird species present on the site. Salt marshes are important foraging/breeding habitats for 47 of these species, and freshwater marshes and meadows are important for 56 of them. The latter include the nationally important colonies of Platalea leucorodia (35 pairs), Plegadis falcinellus (20 pairs), and Ardea purpurea (20 pairs). The remnants of riparian forests are important for 31 of the Annex I bird species, and the oak woods — for four of those.
Table 5.12 Expenditure on restoration (2003) as proposed by the ETANAM project
Category Actions Preliminary budget, EUR
Projects to improve general infrastructure
Dredging of ports, improvement of fishing facilities 6 660 650
Restoration of hydraulic balance in the gulf and the wetlands 7 726 122
Projects to strengthen environmental protection and management
Protection and monitoring of biodiversity 7 100 000
Land purchase in reserves with a strict regime 523 000
Restoration of lagoons 5 248 454
Sewage treatment and translocation of processing units 41 284 741
Solid waste management 8 258 958
Agricultural runoff reduction and management 8 791 794
Projects to enhance the surroundings of important sites
Making sites attractive for visitors 7 885 793
Promotion of the site for ecotourism and visitor management 10 923 178
Total 104 402 690
Theme Issue Investment, EUR Years Source
Conservation Life-Nature project(For the northern coastal part)
1 945 400 1999–2003 Life-Nature project Application to the European Commission
Protection and monitoring of biodiversity
(Total of operations of the National Park Management Authority)
1 024 400 2007–2013 Ministry of the Environment, Operational Programme for the Environment
Research Hydraulic works for pollution and sedimentation control
410 000 2007–2013 Ministry of the Environment, Operational Programme for the Environment
Freshwater input and restoration management in the lagoons
7 000 000 Final report of Life-Nature project (already submitted for financing)
Maintenance and restoration costs for natural resource
Removal of dead fish 340 000 2008 Press reports
Table 5.13 Summary of the most important allocations in the budget for Amvrakikos: conservation, research and restoration

Ecosystem accounting and the cost of biodiversity losses
Ecosystem accounting and the costs of maintenance at local scales
78
Figure 5.13 The balance between service values and ecosystem maintenance and restoration costs in Amvrakikos
EcosystemStocks & Flows
EcosystemHealth
Service 1: Fishing
Service 2: Water quality/quatity regulation
Service 3: Conservation and heritage
Loss of open marsh andlagoons.
Loss of species, reducedwater flows and increasedsedimentation rates.
Reduced resilience of delta system due toreduced freshwater imputs.
Service value probably declining
Service value probably declining
Service value probably stable
Maintenance/restoration costs
Expansion of protected areas and investment inconservation and restoration of habitats, species and
ecosystem functioning (hydro-dynamics, and water quality)
The costs of ecosystem and biodiversity loss
Given the limited information on ecosystem services from Amvrakikos, it is difficult to make estimates of the costs related to ecosystem and biodiversity loss. However, some information on environmental expenditures is available and suggests some considerable expenditure is required to restore ecological functioning.
In 2003, ETANAM, the Life/Nature Project noted above, proposed a set of investments into the sustainable development of the area. These proposals emphasised the need for a range of combined actions that would target more than one ecosystem function or service and cover food provisioning, nature conservation, tourism and recreation, and research (Table 5.12). About 68 % of the proposed expenditure involved direct intervention to enhance environmental management or protection.
Some of these proposals made by the Nature-Life project have been included in the Operational Programme for the Environment adopted by the
Ministry of Environment for the period of 2007–2013 (Table 5.13).
Given the limited nature of the information available for ecosystem services in Amvrakikos, an assessment of the balance between service outputs and maintenance costs is incomplete (Figure 5.13). However, it is clear that a substantial investment is needed to restore and maintain the ecological functions of the SES.
The Danube delta socio-ecological system
Location and ecosystem characteristics
The coupled social-ecological system of the Danube delta is situated in South–East Romania. It covers 5 800 km², an area which includes the delta proper, the upstream Danube floodplain and the Danube River between Cat's Bend and Isaccea, the Razim-Sinoie lagoon complex, and the area of marine waters up to a depth of 20 m.
Note: Based on limited data.

Ecosystem accounting and the costs of maintenance at local scales
Ecosystem accounting and the cost of biodiversity losses 79
The SES is characterised by a wide range of land cover types and associated ecosystems (Figure 5.14).In addition to the extensive cover of semi-natural habitats that include wetlands and lagoons, inland marshes and natural grasslands, and broadleaved forests, extensive areas have been transformed by human activities and now – by crop-based agriculture.
The diversity of habitats found in the SES, coupled with the fact that it is located at the intersection of the main European bird migration ways, means that it is a site of considerable ecological importance. The core of the area is the Danube delta Biosphere Reserve that was established in 1990 and designed in accordance with the International Convention for the Protection of the World Cultural and Natural Heritage (1990), the Convention of Wetland Zones of World Importance (RAMSAR Convention – 1991) and the International Biosphere Network (UNESCO – Man and Biosphere programme). In addition to its importance for biodiversity, the SES provides a number of important ecological functions and services including hydrological regulation, sediment and nutrient retention. The area also has a considerable
cultural and heritage value, and is economically important for agriculture and fishing.
Ecosystem transformations
Although the area has had a long history of human occupation, the pace of change in the cultural landscape increased during the 19th and 20th centuries. As a result, many of the ecosystem services associated with the area have been impaired or damaged.
Key elements in this process of transformation were the measures introduced at the end of the 19th century to improve the navigability of the Sulina branch of the Danube. Between 1862 and 1902, the channel was shortened and deepened to allow marine navigation, so that ships got access to upstream ports such as Galati and Braila. At this time, many canals were also being dredged into the interior of the delta, to increase fish production, to improve transport, and to supply freshwater to the Razim-Sinoe Lake complex. In the middle of the 20th century, a further significant canal construction took place, which resulted in the dense drainage network of channels we see today (Figure 5.15, left).
Figure 5.14 Land cover in the Danube delta SES
Artificial/Urban
Non irrigated arable land
Irrigated perimeters
Rice fields
Permanent crops
Pasture and agriculture mosaics
Forested land
Natural grassland, healthland, sclerophylous vegetation
Open space with little or no vegetation
Inland marshes
Peatbogs
Salt marshes
Salines
Intertidal flats
Water course
Lakes/reservoirs
Coastal lagoons42
Estuaries
Sea & ocean
LegendDanube Delta Biosphere Reserve

Ecosystem accounting and the cost of biodiversity losses
Ecosystem accounting and the costs of maintenance at local scales
80
This network has been built to supply fish farms, agricultural areas, terrains, and the areas of reed and forest that support economic activities. Such engineering structures have had a considerable impact on the natural water circulation system and caused some important consequences for a range of natural processes.
The land cover of the SES was also transformed over this period, especially during the last half of the 20th century – the years under the former communist regime. During this time, the delta was administered by the state-owned consortium, which promoted the exploitation of resources in the area, covering activities such as fishing, agriculture and reed harvesting (Figure 5.15, right). Thus, during the period of 1960–1970 there was an extensive effort to increase reed production, by damming areas to regulate and optimize the water levels. Channels were also cut in order to facilitate reed harvesting and transportation to a cellulose factory, especially the one built upstream, near Braila. After 1970, attention turned to fish production, and during that time, areas were dyked, enclosed and used for the commercial production of fish, while from 1980 a number of new of polders were created to support agriculture.
The large-scale human intervention during the 19th and 20th centuries considerably modified the landscapes of the SES and the functioning of the delta ecosystem. When the works stopped in the early 1990s – after political changes took place in Romania, the dyked area of the Danube delta was covering about 97 408 ha, and about one third of that area was devoted to agriculture use (Staras, 2001). These impacts were exacerbated by the fact that the hydrotechnical engineering had transformed about 400 000 ha of the land upstream – the area naturally subject to flooding (Baboianu, 2002).
Starting from 1990, the agricultural polders have been used less intensively – due to various economic factors and the dry climate of the area. Moreover, many of the fishponds are not suitable for the purpose they were intended for, because of their organic bottom layers. Thus, the productivity is low and the costs of pumping are high (Staras, 2001).
Human activities in the SES have had a considerable impact upon its natural functioning. Some key aspects are summarised in Figure 5.16, where comparison is made between certain changes in the hydrological regime during the period between
Figure 5.15 Hydrotechnical history of the Danube delta (left) and history of land reclamation (right)
Danube Danube
LegendLegend
Excavation periodBuilding period1880–1902
1903–19161930–19401941–19511952–1960> 1960
1960–1970
1971–1980
1981–1989

Ecosystem accounting and the costs of maintenance at local scales
Ecosystem accounting and the cost of biodiversity losses 81
1960 and 1990. In that time, the volume of water entering the system more than doubled. There was also some input of nutrients in the form of nitrogen and phosphorous. The natural equilibrium between plankton-benthos-fish fauna was, therefore, disrupted, and algal blooms (Cyanobacteria) became a chronic problem during the summer months (Baboianu, 2002). The increase in discharges also occurred at a time when the water storage capacity of the system was reduced, which created associated problems of high flow rates and erosion. These problems are now compounded by the fact that sediment supply into the SES has also diminished as a result of damming upstream. Between 1921 and 1960, the amount of alluvium carried by the Danube at the delta entrance was estimated to be around 67.5 million tonnes per year. After that , especially after the construction of the Iron Gates Dams, the average annual suspended sediment discharge decreased significantly – from 41.3 million tonnes in the period of 1971–1980, to 29.2 million tonnes between 1981 and 1990 (Bondar, 1970).
Ecosystem services from the Danube delta
Fishing, both commercial and for subsistence purposes, is the single most important type of livelihood within the delta. In 2004, there were issued 1 375 professional fishing permits, but almost all households in the area also have permits for family consumption. State-owned enterprises employed fishermen until mid-1990s, but after the collapse of these enterprises, responsibilities were transferred to individual fishermen at a
considerable cost. Many were not able to mobilize the necessary resources and thus felt they were gradually excluded from this income-generating activity. Evidence suggests that profitability of the local fishermen activities decreased significantly after 2003 – as a result of restrictions introduced along with the concession system, but it is difficult to estimate average incomes.
Apart from fishing, a major source of income in the delta region is agriculture. While some localities have access to significant resources in addition to agricultural, others have no other options. Although agriculture provides essential family subsistence resources, it is a much poorer source of cash income than fishing. Animal husbandry is also practiced for subsistence needs, rather than for commercial purposes. Animals are often raised in the wild, even during the winter, when they suffer high mortality rates. Beekeeping potential of Danube delta forests was estimated at 1 200 tonnes of honey, from which 200 tonnes are mildew honey that is produced only sporadically (over intervals of four to five years).
The high cost of transportation is a major obstacle to commercial livestock production. Merchants are willing to come and buy the cattle from the villages, but residents complain about the low prices, and many prefer to keep their animals for their own consumption or for some unspecified future needs. Since travel costs are prohibitive for trade, the only option is to sell small quantities of products through
Figure 5.16 Changes in water and nutrients exchange between river and floodplain
Delta ecosystems
1971–1980Before 1960 1980–1989
Danube river
Water inflow ((cm/s)P(P04) (mg/l)N(NO3) (mg/l)
P(PO4) inflowtonnes/year
N(NO3) inflowtonnes/year
100 700 1 400
4 000 17 000 29 300
309< 0,01
0,4
3590,061,5
6200,071,5

Ecosystem accounting and the cost of biodiversity losses
Ecosystem accounting and the costs of maintenance at local scales
82
relatives or acquaintances in town, sending them along as a package on the boat.
Tourism (which also includes angling and hunting) has the potential to become an important source of income for the area. The companies that operate on the delta have the obligation to use only the established touristic routes where they develop – only with a license – their touristic activities. The access to the areas outside the touristic routes is allowed only by rowing boats. To develop their activities on the Danube delta Biosphere Reserve's (DDBR) territory, the tour-operators must respect 'The rules for the development of tourism in the DDBR'. This way they are legally bound to respect the measures taken to protect the deltaic ecosystem.
After 1989, tourism in the delta has declined significantly. This is because of many factors, among them the collapse of the state-organized tourism and the changing patterns of tourism at a national level. Hotels built in the delta in the communist era were closed down, and their privatization proved a failure. However, around 98–99 % of the tourists in the county today actually do visit the Danube delta (Apolon, 2003), and tourism has started to develop again. After a brief increase in 2001, the numbers stabilized in 2003 and 2004, and appear to be on the rise yet again.
Both local people and policy-makers agree that tourism, and in particular rural tourism, has the potential to provide a significant alternative to fishing and agriculture in the delta and to become a source of welfare for the region. Recent years have witnessed a gradual development of rural-tourism facilities, with increasing numbers of households investing in their accommodation capacity. There has also been a recent increase in the number of tourist facilities operated by private businesses.
The costs of ecosystem and biodiversity loss
One of the main objectives for the management of the Danube delta Biosphere Reserve, as formulated in 1994 with the IUCN and UNESCO assistance, was to 'maintain or restore the natural operation and functions of the delta ecosystem'. It was proposed that ecological restoration work should be undertaken where the natural or semi-natural character of the area has been lost as a result of human activity. Steps were initiated to:
• formulatethecriteriaforidentifyingsitesandimplementing restoration projects based on best international practice in restoration ecology; and
• deviseandimplementastrategyforecologicalrestoration and/or habitat creation in abandoned polders, taking into account any present ecological value they may have.
The restoration programme for the Danube delta was started in 1992 (Figure 5.17). The ecological restoration actions in the Danube delta Biosphere Reserve (Gomoiu and Baboianu, 1992) broadly aim at the following:
• todevisearestoration'philosophy'thatwouldrecognise the deltaic nature of the area and the initial structure for the ecosystems;
• toidentifytheecologicaloptimumforeveryecological restoration case (hydrological optimum, chemical optimum, economical optimum, etc.);
• toanalyseeveryzoneproposedforecologicalrestoration in comparison with the rest of the delta and to balance the individual-holistic proportion regarding both structures and the functions of ecosystems;
Figure 5.17 Implemented restoration work in the Danube delta
Danuble DeltaRestoration areas
DDBR total area 580 000 ha
Restoration areas 15 025 ha
at DDBR limit
1. Ostrovul Babina......... 2 100 ha2. Ostrovul Cernovca ..... 1 580 ha3. Popina II .................. 3 600 ha4. Furtuna Est - Vest...2 115 ha5. Dunavãt II ................ 1 260 ha6. Holbina I .................. 1 270 ha7. Holbina II ................. 3 100 ha

Ecosystem accounting and the costs of maintenance at local scales
Ecosystem accounting and the cost of biodiversity losses 83
Figure 5.18 Benefits of restoring the agricultural polder area (Babina case study)
Unsustainable / Abandoned Agriculture
NON USE VALUEUSE VALUE
WETLAND RESTORATION
NUTRIENT REMOVAL - 15 kg P/ha/year
- 335 kg N/ha/year
SEDIMENT RETENTION - 11 tons/ha/year
HABITAT for birds and fishAESTHETIC valuesWATER STORAGE
FISH: 34 kg/ha/yearREED: 1-2 tons/ha/yearPASTURES: 0,5 cows/ha/year
50-100 USD/ha/year at low costs
instead of subsidies
• totakeintoaccounttheimportantroleof the Danube River water quality for ecological restoration of all aquatic systems, which necessitates improvements in water quality across the entire Danube River basin.
The year 1993 saw the commencement of a pilot project focusing on the rehabilitation of the agricultural polders of Babina (2 200 ha) and Cernovca (1 580 ha). It was intended to be the first of a range of further common rehabilitation projects. In order to take the project forward, it was necessary:
• toinvestigatethestructureandconditionoftheterrestrial and aquatic ecosystems;
• todeterminethedegreeofstructuralalterationsin the biocoenoses and ecosystems compared to their previous state;
• toproceedtoananalysisoftheecologicalsituation on the basis of indicator species –
in order to elaborate forecasts regarding the probable development of the ecosystem; and,
• todevelopasystemofecologicalmonitoringand ensure that it is applied – as a means of checking on the rate of success regarding the measures introduced.
The proposed solution for restoring near-natural conditions of uncontrolled flooding was to create small openings in the surrounding dike. The goal was to allow uncontrolled flooding while being able to use the existing channel network for the filling and emptying of the polder. Benefits associated with the restoration of the Babina agricultural polder area are summarised in Figure 5.18.
The correlations between service values and ecosystem maintenance and restoration costs in the Danube SES are summarised in Figure 5.19.

Ecosystem accounting and the cost of biodiversity losses
Ecosystem accounting and the costs of maintenance at local scales
84
Figure 5.19 The balance between service values and ecosystem maintenance and restoration costs in the Danube SES
EcosystemStocks & Flows
EcosystemHealth
Service 1: Fishing
Service 2: Agriculture
Service 3: Reed production
Service 4: Conservation and heritage
Service 5:Tourism
Loss of open marsh and lagoons.
Loss of species, reduced water flows, increased erosion and decreasedsedimentation rates.
Reduced resilience of delta system due to increased water and nutrient imputs.
Service value declining
Service value probably stable
Service value probably declining
Service value probably declining
Service value probably increasing
Service 6: Water quality/quantity regulation Service value probably declining
Maintenance/restoration costs
Expansion of protected areas and investment inconservation of habitats, species and ecosystem functioning
(hydro-dynamics and water quality)

85
Ecosystem accounting and biodiversity loss
Ecosystem accounting and the cost of biodiversity losses
Why accounting for ecosystems?
Ecosystems and the benefits that they produce are poorly recorded in the national economic accounts., At present, it is only when their value can be incorporated into the price of some product that account is really taken of the contribution they make. And when their market price is zero, as is often the case, they simply do not exist in national accounting terms. As a result, they can be appropriated for production purposes or simply degraded without any recording. Thus, a range of ecosystem services that support production are seen as just 'externalities', and all the free amenities and regulating services supplied by thriving ecosystems are largely outside the calculation of our 'wealth' in the conventional denominators such as GDP.
In this report we have argued that these free ecosystem services should be somehow measured, valued and added to the existing criteria, such as GDP, to provide more inclusive aggregates to guide the decisions by policy-makers, businesses and consumers. From the beginning of the TEEB project, accounting has been acknowledged as a necessary component, because the protection and maintenance of public goods, such as the life-support functions provided by ecosystem services, are fundamental to notions of sustainable development. As a step towards developing such accounts, this study has examined the possible contribution that environmental accounting in general and ecosystem accounting in particular could make to the economics of ecosystems and biodiversity. Our key findings are presented below.
1. Ecosystem accounts can be implemented across a range of geographical scales relevant to prevailing governance models and societal welfare considerations. The basic scales are the Global/Continental, the National/Regional
6 Ecosystem accounting and biodiversity loss
and the Local. Each scale corresponds to a different governance framework. The Global/Continental scale is the one of general objectives stated by international conventions. It requires simplified accounts that can be used to monitor the main trends and distortions in all countries. The National/Regional scale is where the enforcement of environmental policies and regulations prevails. The enforcement is effected through environmental agencies and ministries of economy, statistical offices and courts. The Local scale is the action level: local government, site level, management, projects, case studies and business. This is the scale where assessing and valuing ecosystem services are both essential and feasible – because informed actors can express their real preferences.
2. From the point of view of policy-making and data collection, ecosystem accounting should be prioritised from a top-down perspective, not bottom-up (16). To each of the three governance scales addressed above, there can be assigned a mission, an access to data and a time frame. If there is any chance of integrating the environment into economic decision-making, the strategy should consider the three interconnected tiers and their feasibility, but overall, the local decisions have increasingly to take account of the global contexts. Thus, as our local case studies have shown, while issues may vary from one locality to another, rarely are there sufficient expertise or data resources to gain a complete picture at the microscale. Regional and global assessments can, however, provide a framework within which local decisions can be made about the benefits and costs of management interventions.
3. Simplified global scale ecosystem accounts, updated annually, can be used to assess losses in total ecological potential in physical units, and ultimately – the costs of restoring the capacity
(16) The difficulties of 'Accounting for Ecosystems' starting from cases studies and the valuation of ecosystem services have been considered in a recent article by Mäler et al. (2008). The authors state in the conclusion that 'When we deal with ecosystem services, we, the analysts, and we, the accountants, must figure out the accounting prices from knowledge of the working of every ecosystem. It is therefore-at least for now-impossible to design a standardized model for building a wealth-based accounting system for ecosystems. We have to develop such an accounting system by following a step by step path, going from one ecosystem to another.'

Ecosystem accounting and the cost of biodiversity losses
Ecosystem accounting and biodiversity loss
86
of ecosystems to deliver services from one year to the next. This maintenance cost means consumption of ecosystem capital, which can be recorded in two ways:
• tohelpcalculatethevalueofdomesticand imported products at their full cost in addition to their purchase price; and,
• bythesubtractionfromtheGrossNational Product (including fixed capital consumption), to provide the basis for calculating a new headline aggregate, the Adjusted Disposable National Income (ADNI).
We suggest that simplified global-scale ecosystem accounts can be produced at short notice on the basis of global monitoring programmes and international statistics.
4. Integration of national economic-environmental accounts with ecosystem accounts. The first task is to compute ecosystem capital consumption and use this to derive ADNI on the basis of national socio-economic statistics and monitoring systems. The second task is to integrate such ecosystem accounts with the national accounting matrixes and the monetary and physical indicators used for policy making. The process for implementing these national accounts is the revision of the UN SEEA by 2012–13.
5. Local and private actors are increasingly demanding guidance in order to take the environment into account in their every day decisions when developing projects of various types. As the Mediterranean Wetlands case study shows, ecosystem accounts would be very helpful for planning departments and environmental protection agencies, to internalize environmental considerations fully when considering, for example, the costs-benefits of development proposals. Businesses are also interested – as shown by their response to carbon accounting and recent interest in biodiversity considerations. Progress at this scale could be through the development of guidelines based on the general principles but adapted to needs of the various user communities.
6. Socio-ecological systems are the appropriate analytical units for such accounting. They reflect higher levels of interaction between ecosystem and people. Stocks and flows of land cover, water, biomass/carbon and species/biodiversity are the priority accounts. They should be established primarily in order to calculate the ecological potential of many terrestrial socio-ecosystems. Depending on
operational targets, scales and data availability, the formula used may be a simplified or a more sophisticated one. Ecosystem services are the outcomes of ecosystem functions which are directly or indirectly used by people. In order to take this work forward, UNEP and EEA are taking steps to develop an international standard classification of ecosystem services that can be used more generally in environmental accounting and ecosystem assessments.
7. Asset valuation is both practicable and useful in the context of the cost-benefit assessments of the impacts produced by projects. Accounting approaches can help policy-makers review the trade-offs between possible future benefits from new developments and the total present benefits from economic natural resources and main non-market ecosystem services. They thus can see if benefits compensate losses. In the case of regular national accounting, the method contains several risks. The main one relates to the non-use values – often of a public good nature – which tend to be ignored or inadequately valued because of the problems mentioned previously. For renewable assets the valuation of the stocks is not even necessary. What matters first is that the ecosystems are capable of renewing themselves, that their multiple functions can be maintained over time – whatever the present preference for one or the other service they deliver. If the degradation of ecological potentials can be observed and measured in physical units, then it is possible to calculate a restoration cost. This can be expressed in two ways. One is the average cost of maintenance work, and the other – the benefit losses arising from reducing extraction or harvesting down to a level compatible with the resilience of the socio-ecological systems. The case studies presented here illustrate both aspects.
8. Maintenance of the ecosystem capital is yet another approach to valuation. The approach discussed in this report considers, in a holistic way, the capacity of ecosystems to deliver services in the present and future time. Two elements are highlighted:
• theactualexpendituresforenvironmentalprotection and resource management;
• theadditionalcostspotentiallyneededtomitigate ecosystem degradation.
When the actual expenditures are not sufficient for maintaining the ecosystem, it may be necessary to incur additional costs and make an appropriate allowance. This is what is done in business and national accounts under the expressions,

Ecosystem accounting and biodiversity loss
Ecosystem accounting and the cost of biodiversity losses 87
'cost of capital maintenance' or 'fixed capital consumption'. An estimate of 'ecosystem capital consumption' should be calculated in the same way as the 'fixed capital consumption' and then added to it. This procedure will allow adjustment to the calculations of company profit or national income. As for the fixed capital, such adjustment will measure what should be reinvested in order to maintain an equivalent productive (and in the case of ecosystems, reproductive) capacity of the asset. This is what should be set aside at the end of the accounting period and be made available at the beginning of the next one in order to restore capacities. This is an important accounting measure which can support actions such as reduced distribution of dividends and accordingly reduced taxes on benefits.
Meeting policy-makers demands using existing information supplies
This study has shown that the major barrier to taking the ecosystem accounting forward is the lack of data. This issue requires a strategic response. On the bright side, in the last 30 years progress with data collection has been considerable – with the development of earth observation satellites, ground positioning systems, in situ real time monitoring, data bases, geographical information systems and the internet. As a result, both public and private organisations now have the capacities and networks that make it possible to take the first steps towards comprehensive ecosystem accounting.
Two major barriers to progress can be identified, however. The first relates to the lack of guidelines for accounting for ecosystem benefits and costs, in particular at the level of local governments/agencies and companies. For example, what the Mediterranean case study illustrates is that data are regularly collected by the natural park bodies, but putting together these data in an integrated framework is a huge effort. The recommendation should be to progress to the drafting of such accounting guidelines at the local level, starting first from the needs of the local actors for information on physical state, economic costs and benefits in relation to their mandate.
The second difficulty relates to restrictions on the data access imposed by some public organisations. As long as it concerns public data paid by the public's money, this situation should not be allowed to continue. Back to the bright side, this state of events is addressed by the new data policies of the major space agencies, the open-access policy
adopted by most environmental agencies, and initiatives for facilitating access to scientific knowledge and data. Statistical offices have also considerably improved access to their databases and developed local statistics. However, more progress is needed, for example with merging further statistical and GIS data, and with respect to the development of grid databases.
Data collection methods will only develop if they meet the needs of policy-makers, companies and the public. A new product results from iterations between the supply and demand. The supply-side brings together intuition of a need and technical capacities to meet it, draws sketches, designs models, prototypes, etc. The demand-side expresses needs, preferences and, finally, validates the supplied product by using it. Accounting methodologies for the environment have been designed proficiently over the past three decades, and now they can be tested in different contexts. The progress is now being made, but we have not yet met the demand-side requirements, as expressed through initiatives such as Beyond GDP (2007), TEEB, UNEP's Green Economy initiative (2008), and national initiatives such as the Stiglitz-Sen-Fitoussi Commission on the Measurement of Economic Performance and Social Progress in France.
All these initiatives (launched before the present financial and economic crises) tell that there is an urgent need to reflect more correctly the social and environmental interactions of the economic development. The current crises amplify this need. All the initiatives acknowledge that physical indicators are part of the response. They all suggest, then, a need for new monetary indicators. It is, therefore, essential for the supply-side to start to develop these new measures on the basis of existing data. These measures will initially be coarse and simple but they will help users to change their perspectives.
Conclusions
Given the scale and the pace of global environmental social and economic change, 'Business as Usual' is no longer an option. Crises can, however, provide the context and justification for new kinds of transformative actions, and history shows many examples of what is possible in such situations. The approach to accounting that we have described here may at present be difficult to implement and may not fully capture what needs to be known – but perfection should not be the enemy of the good (SNA1953). The political momentum of TEEB,

Ecosystem accounting and the cost of biodiversity losses
Ecosystem accounting and biodiversity loss
88
coupled with recent methodological breakthroughs and data opportunities, provide a rich backdrop against which we can be confident of success, given the right conditions. The means to build ecosystem accounts are now available, and the will to find new decision-making frameworks is also evident.
The challenge is now to build, through case studies and real applications, the demand for such tools and the capacity to use them, and finally to ensure that initiatives are supported – both politically and financially.

89
References
Ecosystem accounting and the cost of biodiversity losses
References
Allen, B. P. and Loomis, J. B., 2006. 'Deriving values for the ecological support function of wildlife: an indirect valuation approach', Ecological Economics, Vol. 56, pp. 49–57.
Apolon, A., 2003. 'Turismul în judetul Tulcea în anul 2003', Raport nepublicat, Ministerul Transportului si Turismului, Tulcea.
ARPE-PACA, 1992. Le Parc Naturel Régional de Camargue : Occupation du sol en 1991 et évolution depuis 1970, Editions de l'ARPE PACA , Aix-en-Provence.
Beaune, G., 1981. Zones d'équilibre, conservation de la nature et maintien des acrivités traditionnelles en Camargue. Unpublished report. Arles: Parc Naturel Régional de Camargue.
Bethemont, J., 1972. 'Le thème de l'eau dans la vallée du Rhône : essai sur la genèse d'un espace hydraulique', Unpublished PhD dissertation, University of St Etienne, St Etienne.
Boulot, S., 1991. Essai sur la Camargue:Environnement, état des lieux et prospective, Actes Sud, Arles.
Carson, R. T., 1991. 'Constructed markets', In Braden, J. and Kolstad, C., (ed.), Measuring the demand for environmental quality, Elsevier Press, Amsterdam, Netherlands.
Comoretto, L.; Arfib, B.; Talva, R.; Chauvelon, P.; Pichaud, M.; Chiron, S. and Höhener, P., 2008. 'Runoff of pesticides from rice fields in the Ile de Camargue (Rhône River delta, France): Field study and modelling', Environmental Pollution, No 151, pp. 486–493.
Costanza R. et al., 1997. 'The value of world's ecosystem services and natural capital', Nature, No 387, 253–260.
Costanza, R.; Waignerm, L.; Folke. C. and Maler, K. G., 1993. 'Modeling complex ecological economic systems: toward an evolutionary dynamic
understanding of people and nature', Bio Science, Vol. 43, 1993, pp. 545–555.
Costanza, R. and Folke, C., 1997. 'Valuing ecosystem services with efficiency, fairness and sustainability as goals', Island Press, Washington, D.C.
Custodio, E., 1995. 'La explotación de las aguas subterráneas y su problemática asociada', In VI Simposio de Hidrogeología: Hidrogeología y recursos hidráulicos, Vol. XX, 1995, pp. 297–313.
Daily, G. C., (ed.), 1997. Nature's services: Societal dependence on natural ecosystems, Island Press, Washington, D.C.
Daily, G.C. et al., 1997. 'Ecosystem services: Benefits supplied to human species by natural ecosystems issues', Ecology, Vol. 1, No 2; pp. 1–18.
Dasgupta, P. and K G Maler, K. G., 2004. 'Environmental and Resource Economics: Some Recent Developments', SANDEE Working Paper, No 7–04, Kathmandu.
Dasgupta, P. and Maler, K. G., (eds.), 1997. 'The Environment and Emerging Developmental Issues', Vols. 1 and 2, Clarendon Press, Oxford.
Dasgupta, P. and Maler, K. G., (eds.), 1997. 'The Environment and Emerging Developmental Issues', Vols. 1 and 2, Clarendon Press, Oxford.
Dasgupta, P. and Maler, K. G., 1994. 'Poverty Institutions and the Environmental Resource base', World Bank Environment Paper, No 9, The World Bank,Washington, D.C.
Dasgupta, P. and Maler, K. G., 2000. 'Net national product, wealth and social well-being', Environment and Development Economics, Vol. 5, pp. 69–93.
Dasgupta, P., 2001. Environment and Human Well‑being, Oxford University Press, Oxford.
Delibes-Mateos, M.; Redpath, S. M.; Angulo, E.; Ferreras, P. and Villafuerte R., 2007. 'Rabbits as a

Ecosystem accounting and the cost of biodiversity losses
References
90
keystone species in southern Europe', Biological Conservation, Vol. 137, No 1, pp. 149–156.
Duarte, C., (ed.), 2007. 'Global Loss of Coastal Habitats', Fundación BBVA, Madrid, 10 October 2007. A video of the conference is available at: www.fbbva.es/coastalhabitats.
EEA, 2006. Land accounts for Europe 1990–2000: Towards integrated land and ecosystem accounts, EEA Report No 11/2006. http://reports.eea.europa.eu/eea_report_2006_11/en.
EU, 2007. 'Beyond GDP, Measuring progress, true wealth, and the well-being of nations', Conference Proceedings, EU, 2007. www.beyond-gdp.eu/proceedings/bgdp_proceedings_full.pdf.
European Communities, 2008. The Economics of Ecosystems and Biodiversity, Interim Report. http://ec.europa.eu/environment/nature/biodiversity/economics/pdf/teeb_report.pdf.
Ferrer, M. and Negro, J. J., 2004. 'The Near Extinction of Two Large European Predators: Super Specialists Pay a Price', Conservation Biology, Vol. 18, No 2, pp. 344.
Folke, C.; Colding, J. and Berkes, F., 2003. 'Synthesis: building resilience and adaptive capacity in social–ecological systems', In: Berkes, F., Colding, J., Folke, C. (eds.), Navigating Social–Ecological Systems: Building Resilience for Complexity and Change, Cambridge University Press, Cambridge.
Freeman, A. M., 1991. 'Valuing environmental resources under alternative management regimes', Ecological Economics, Vol. 3, 1991, pp. 247–256.
Freeman, A. M., 1998. 'The economic value of biodiversity', Bioscience, Vol. 48, No 5, p. 339.
Garcia-Novo, F.; García, J. C. E.; Carotenuto, L.,; Sevilla, D. G. and Lo Faso R. P. F., 2007. 'The restoration of El Partido stream watershed (Doñana Natural Park): A multi-scale, interdisciplinary approach', Ecological Engineering, Vol. 30, No 2, pp. 122–130.
Gunawardena, M. and Rowan, J. S., 2005. 'Economic valuation of a mangrove ecosystem threatened by shrimp aquaculture in Sri Lanka', Environmental Management, Vol. 36, No 4, pp. 535–550.
Hanemann, W. M., 1998. 'Economics of Biodiversity', in Wilson, E. O. and Peter, F. M. (eds.), Biodiversity, National Academy Press, Washington, D.C.
Harzallah, A. and Chapelle, A., 2002. 'Contribution of climate variability to occurrences of anoxic crises 'malaïgues'', in The Thau lagoon (southern France) Influence de la variabilité climatique sur l'apparition de crises anoxiques ou 'malaïgues' dans l'étang de Thau (sud de la France), Oceanologica Acta 25: pp. 79–86.
Hein, L.; van Koppen, K.; de Groot, R. S.; van Ierland, E. C., 2006. 'Spatial scales, stakeholders and the valuation of ecosystem services', Ecological Economics, Vol. 57, pp. 209–228.
Holling, C. S., 2001. 'Understanding the complexity of economic, ecological and social systems', Ecosystems, Vol. 4, pp. 390–405.
De la Torre, I. and Batker, D. K., 2004. 'Prawn to Trade, Prawn to Consume', A joint project of the ISA Net and APEX, USA.
Isenmann, P., 2004. Les oiseaux de Camargue et leurs habitats. Une histoire de cinquante ans 1954–2004, Paris:Editions Buchet – Chastel Ecologie.
IUCN, 2002. 'Integrated Water Management to Address Environmental Degradation in the Mediterranean Region'.
IUCN, Nature Conservancy and World Bank, 2004. 'How Much is an Ecosystem Worth?', World Bank, Washington, D.C.
Kinzig, A. P. et al.,' 2006. Resilience and regime shifts: assessing cascading effect's, Ecology and Society, Vol. 11, No 1, p. 20.
Kontogianni, A.; Skourtos, M. and Harrison, P.A., 2008. 'Review of the dynamics of economic values and preferences for ecosystem goods and services', www.rubicode.net/rubicode/RUBICODE_Review_on_Dynamics_of_Values.pdf.
Limburg, K. and Folke, C., 1999. 'The ecology of ecosystem services: introduction to the special issue', Ecological economics, Vol. 29, pp. 179–182.
Limburg, K. E.; O'Neill, R.V.; Costanza, R.; Farber, S., 2002. 'Complex systems and valuation', Ecological Economics, Vol. 41, pp. 409–420.
Lomas, P. L.; Gómez-Baggethun, E.; Martín-López, B.; Zorrilla, P.; Sastre, S.; García-Llorente, M.; Borja, P. and Montes, C., 2007. 'Hacia la elaboración de un modelo de gestión sostenible en la Comarca de Doñana', Informe Final del Proyect, Universidad Autónoma de Madrid, Madrid.

References
Ecosystem accounting and the cost of biodiversity losses 91
Loreau, M., Nayeem, S. and nchausti, P. I., (eds.), 2002. 'Biodiversity and ecosystem functioning: synthesis and perspective,OUP', Oxford.
Malayang, B, H.; Thomas, H. and P, Kumar, P., 2005. 'Responses to Ecosystems Change and Their impact on Human Well Being', Sub Global Assessment, MA, Island Press, Washington, D.C.
Mäler, K-G.; Aniyar, S. and Jansson, A., 2008. 'Accounting for ecosystem services as a way to understand the requirements for sustainable development', Proceedings of the National Academy of Sciences, Vol. 105, No 28, p. 9501.
Mathevet, R., 2000. 'Usages des zones humides camarguaises : Enjeux et dynamique des interactions Environnement/Usagers/Territoires', Unpublished PhD dissertation. University Jean Moulin, Lyon.
Manzano, M.; Custodio, E.; Mediavilla, C. and Montes, C., 2005. 'Effects of localised intensive aquifer exploitation on the Doñana wetlands (SW Spain)',. In: Sahuquillo, A., Capilla, J., Martínez–Cortina, L., Sánchez–Vila, X., (eds.), Groundwater Intensive Use, IAH, Selected Papers, Vol. 7, Balkema, Leiden, pp. 209–219.
Mesnage, V.; Ogier, S.; Bally, G.; Disnar, J. R.; Lottier, N.; Dedieu, K.; Rabouille, C. and Copard, Y., 2007. 'Nutrient dynamics at the sediment-water interface in a Mediterranean lagoon (Thau, France): Influence of biodeposition by shellfish farming activities'. Marine environmental research, Vol. 63, No 3, pp. 257–277.
Millennium Ecosystem Assessment, 2005. Findings from Condition and Trends Working Group, Millennium Ecosystem Assessment, Island Press, Washington, D.C.
Millennium Ecosystem Assessment, 2005. Findings from Condition and Trends Working Group, Millennium Ecosystem Assessment, Island Press, Washington, .D.C.
Montes, C.; Borja, F.; Bravo, M. and Moreira, J. M., 1998. 'Doñana: una aproximación ecosistémica', Consejería de Medio Ambiente, Sevilla, España.
Montes, C., 2000. 'The Guadalquivir River Basin and the Doñana Wetlands, Southern Spain – the potential for achieving 'Good Water Status' through integrated management of multiple functions and values'. In: WWF (ed.), Implementing the EU Water Framework Directive: A seminar series on water, WWF Freshwater Program, Copenhagen.
Nowell, K. and Jackson, P., 1996. 'Wild Cats: Status Survey and Conservation Action Plan', IUCN Publications, The Burlington Press, Cambridge, United Kingdom.
Oliveira Ribeiro, C.A.; Vollaire, Y.; Coulet, E. and Roche, H., 2008. Bioaccumulation of polychlorinated biphenyls in the eel (Anguilla anguilla), Environmental pollution, Vol. 153, pp. 424–431.
Pagiola Stefano et al., 2004. Assessing the Economic Value of Ecosystem Conservation, TNC-IUCN-WB, Washington, D.C.
Pearce, D. W. and Warford, J. J., 1993. World without end. Oxford University Press, Oxford, United Kingdom.
Perennou, C. and Aufray, R., 2007. L'évolution de la Camargue depuis 60 ans: synthèse des données quantifiées, Retrieved 1 October2008, from the Tour du Valat, www.tourduvalat.org/nos_programmes/observatoires_biodiversite_et_politiques_publiques/suivi_de_la_camargue.
PNRC, 1999. 'Usages de l'eau et équipements hydrauliques en Camargue', Courrier du Parc, pp. 48–49.
Parc Naturel Régional de Camargue & EID, 2006. Etude et définition des enjeux de protection du littoral sableux en Camargue, Retrieved 1 October 2008, from the PNRC, www.parc-camargue.fr/Francais/download.php?categorie_id=97.
Primavera, J. H., 1993. 'A critical review of shrimp pond culture,' Reviews in Fisheries Sciences, Vol. 1, pp. 151–201.
Primavera, J. H., 2000. Integrated Mangrove – Aquaculture Systems in Asia, Aquaculture Department, Southeast Asian Fisheries Development Center, Tigbauan, Philippines.
Pritchard, L; Colding, J.; Birkes, F.; Svedin, U. and Folke, C., 1998. 'The Problem of Fit Between Ecosystems and Institutions', International Human Dimensions Programme on Global Environmental Change.
Rapport, D. J., 2007a. 'Sustainability science: and ecohealth perspective', Sustainability Science, Vol. 2, pp. 77–84.
Rapport, D. J., 2007b. 'Healthy Ecosystems: An Evolving Paradigm', In, Pretty, J.; Ball, A.; Benton,

Ecosystem accounting and the cost of biodiversity losses
References
92
T.; Guivant, J.; Lee, D.; Orr, D.; Pfeffer, M. and Ward, H. (eds.), Handbook of Environment and Society, Sage, London.
Rapport, D.J., 2006. 'Avian Influenza and the Environment: An Ecohealth Perspective', report to UNEP/DEWA (with contributions from John Howard, Luisa Maffi and Bruce Mitchell).
Rees, W. and Wackernagel, M., 1994. 'Ecological footprint and appropriated carrying capacity', , In Jansson, A.M. et al. (eds.), Investing in Natural Capital, Island Press, Washington, D.C., pp. 362–390.
Resilience Alliance, 2007a. Assessing and managing resilience in social‑ecological systems: A practitioner's workbook, Vol. 1, version 1.0., Resilience Alliance. www.resalliance.org/3871.php.
Resilience Alliance, 2007b. Assessing resilience in social‑ecological systems: A scientist's workbook, Resilience Alliance. www.resalliance.org/3871.php.
Resilience Alliance, 2007c. Bounding the System: Describing the Present, Resilience Alliance. http://wiki.resalliance.org/index.php/Bounding_the_System_–_Level_2.
Roche, H.; Buet, A.; Jonot, O. and Ramade, F., 2000. 'Organochlorine residues in European eel (Anguilla anguilla), Crussian carp (Carassius carassius) and catfish (Ictalurus nebulosus) in Vaccarès lagoon (French National Nature Reserve Naturelles of Camargue),' Aquatic Toxicology, Vol. 48, pp. 443–459.
Sabatier, F. and Provansal, M., 2002. 'La Camargue sera-t-elle submergée?', La Recherche, Vol. 355, pp. 72–73.
Saura Martínez, J.; Bayán Jardín, B.; Casas Grandes, J.; Ruiz de Larramendi, A. and Urdiales Alonso, C., 2001. Documento Marco para el Desarrollo del Proyecto Doñana 2005, Ministerio de Medio Ambiente, Madrid, pp. 201.
Schuyt, K. and Brander, L., 2004. Living waters: Conserving the source of life: The economic values of the world's wetlands, WWF, Gland, Switzerland.
Prepared with the support of the Swiss Agency for the Environment, Forests and Landscape (SAEFL).
Spehn, E. M. et al., 2005. 'Ecosystem Effects of biodiversity manipulations in European grasslands', Ecological Monographs, Vol. 75, No 1, pp. 37–63.
Tamisier, A., 1990. Camargue. Milieux et paysages, évolution de 1942 à 1984, Editions de l'Association ARCANE, Arles.
UN, EC, IMF, WB and OECD, 2003. Integrated Environmental and Economic Accounting (SEEA2003), UN Statistical Division, New York. http://unstats.un.org/UNSD/envAccounting/seea2003.pdf.
Valiela and Fox, 2008. Science, Vol. 319, pp. 290–291.
Wackernagel, M. and Rees, W., 1996. Our Ecological Footprint: Reducing Human Impacts on the Earth, New Society, Gabriola Press, British Columbia, Canada.
Wackernagel, M. and Rees, W., 1996. Our Ecological Footprint: Reducing Human Impacts on the Earth, New Society, Gabriola Press, British Columbia, Canada.
Walker, B. H. and Pearson, L., 2007. 'A resilience perspective of the SEEA', Ecological Economics, Vol. 61, No 4, pp. 708–715.
Weber, J.-L., 2007. 'Implementation of land and ecosystem accounts at the European Environment Agency,' Ecological Economics, Vol. 61, No 4, 15 March 2007, pp. 695–707.
Wilson, M. A. and Howarth, R. B., 2002. 'Discourse based valuation of ecosystem services: Establishing fair outcomes through group', Ecological Economics.
Winkler, R., 2006. 'Valuation ecosystem goods and services: Part I and II', Ecological Economics.
Woodward, R. T. and Wui, Y.-S., 2001. 'The economic value of wetland services: a meta-analysis', Ecological Economics, Vol. 37, pp. 257–270.

European Environment Agency
Ecosystem accounting and the cost of biodiversity lossesThe case of coastal Mediterranean wetlands
2010 – 92 pp. – 21 x 29.7 cm
ISBN 978-92-9213-092-3ISSN Technical report series 1725-2237DOI 10.2800/39860

European Environment AgencyKongens Nytorv 61050 Copenhagen KDenmark
Tel.: +45 33 36 71 00Fax: +45 33 36 71 99
Web: eea.europa.euEnquiries: eea.europa.eu/enquiries
TH
-AK-1
0-0
03-E
N-N
DO
I 10.2
800/3
9860