ecosystem composition and export production variability corinne le quéré, erik buitenhuis,...
Post on 20-Dec-2015
220 views
TRANSCRIPT

Ecosystem composition and
export production variability
Corinne Le Quéré, Erik Buitenhuis, Christine
Klaas
Max-Planck-Institute for Biogeochemistry, Germany
and Olivier Aumont
Laboratoire de Dynamique du Climat et des Océans, France

1850 today 2100
CO
2 s
ink (
Pg
C/y
)
Prentice et al., 2001
OCEAN
LAND
climate feedback

4
NPZD
PISCES
Dynamic Green Ocean Model
(DGOM)

SeaWiFS
Chla (mgChl/m3
)
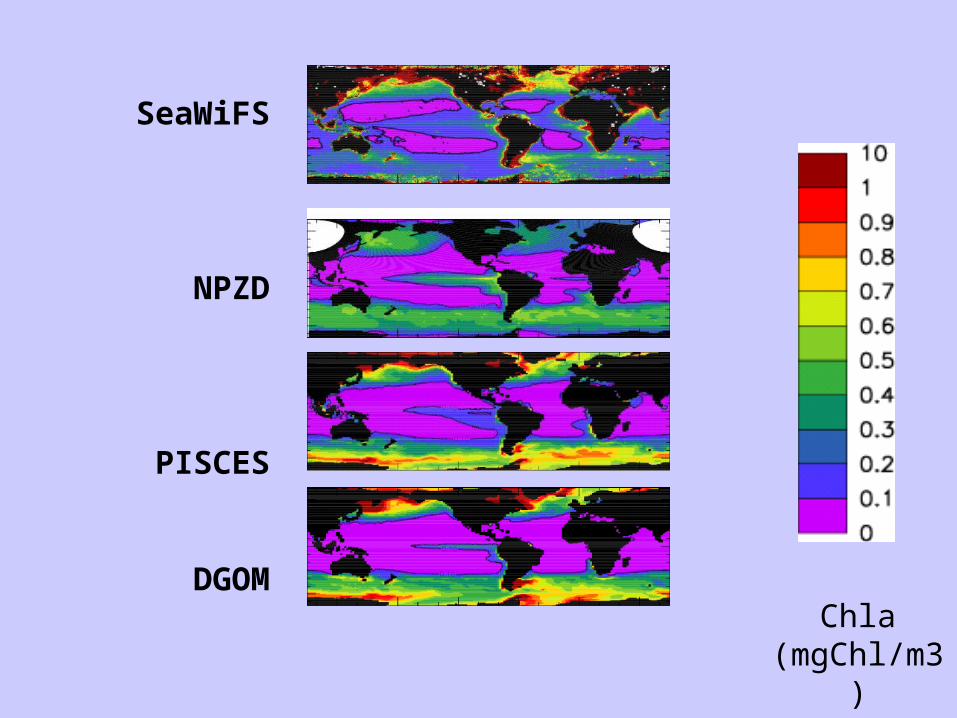
SeaWiFS
NPZD
PISCES
DGOMChla
(mgChl/m3)

SeaWiFS
50%
Interannual standard deviation of Chla (%)
Chla (mgChl/m3)

SeaWiFS
NPZD
PISCES
DGOM
50%
Interannual standard deviation of Chla (%)
Chla (mgChl/m3)

Nano Cocco. Diatoms
Description
maximum growth rate µ at 0°C (1/d)
0.6 0.4 0.6
half sat. P (nM) 19 4 75
half sat. Si (µM) 2
half sat. Fe (pM) 20 20 120
Light affinity dependence 6 6 4
Phytoplankton traits

cocco
diatoms
nano
Abundance of PFT (%)
DGOM
cocco
diatoms
nano
70N
0
70Srelative contribution

cocco
diatoms
nano
Interannual standard deviation of chla per PFT (%)

cocco
diatoms
nanno
Interannual standard deviation of chla per PFT (%)
5 PFTs 4 PFTs

1997 1998 1999 2000 2001 2002 2003
diatoms
coccolithophorids
nano phytoplankton
0.02
0.1
1.5
Plankton-specific chla in the North Atlantic
(40N-45N, mgChla/m3)
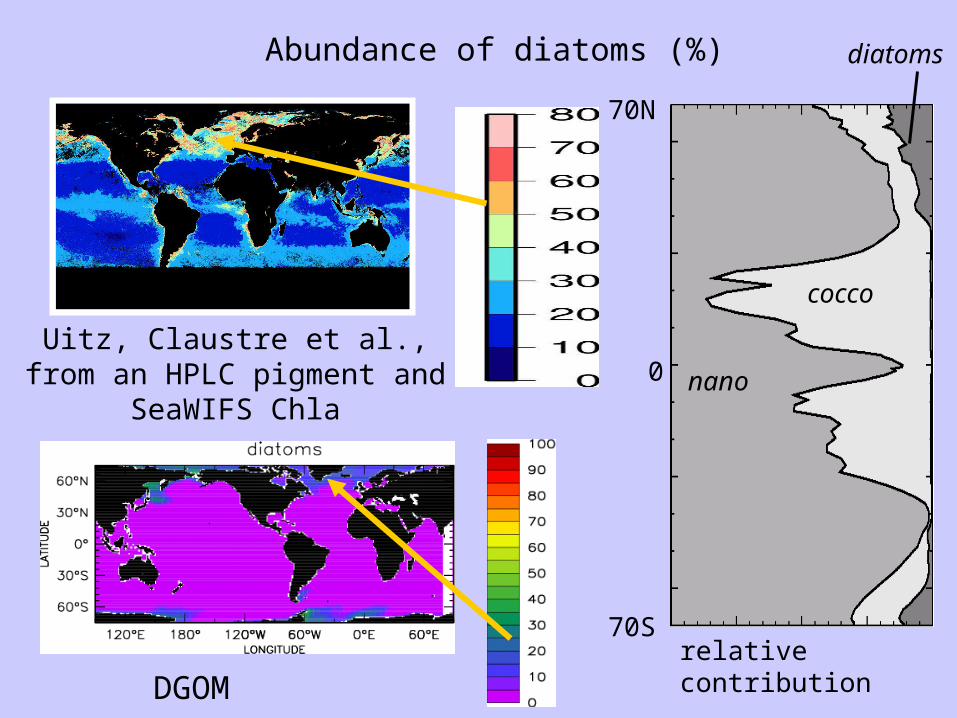
DGOM
Abundance of diatoms (%)
Uitz, Claustre et al., from an HPLC pigment and SeaWIFS Chla
cocco
diatoms
nano
70N
0
70Srelative contribution

Coccolithophorid bloom frequency
Analysis from C. Brown
cocco
diatoms
nano
DGOM
70N
0
70Srelative contribution

Global Bloom
Model 8.0 (0.22) 1.0 (0.03)
Seawifs 1 (BF + Laws)
17.3 (0.46) 6.2 (0.35)
MEAN (Standard deviation)
Export Production (PgC/y)

Total
0
0.1
0.2
0.3
0.4
0.5
0.6
0.7
0.8
0.9
1
MLD Fe PO4 Si PP EXPorg EXPco3 Chl DCHL/ NCHL/ CCHL/ MES MIC
Sarm
Obs
EQUL
EME2
EMES
EMI2
EMIC
Total
0
0.1
0.2
0.3
0.4
0.5
0.6
0.7
0.8
0.9
1
MLD Fe PO4 Si PP EXPorg EXPco3 Chl DCHL/C NCHL/C CCHL/C MES MIC
Sarm
Obs
SWAM
SWFE
SWPO
SWSI
sensitivity of plankton sensitivity of plankton biomass tobiomass to
growthgrowth grazinggrazing
diatoms
nano
Cocco.
Meso-zoo
Micro-zoo
diatoms
nano
Cocco.
Meso-zoo
Micro-zoo

Conclusions
• More complexity in marine ecosystems gives more variability in fluxes
• More in line with observations
• Mean spatial distribution in PFTs is critical to reproduce chl variability


Description PCUL DGSW SWAM SWFE SWPO SWSI
half sat. P diatoms (nM) 75 75 300 75 300 75
half sat. P nano/pico(nM) 19 19 100 19 100 19
half sat. PCoccolith. (nM)
4 4 4 4 4
half sat. SiDiatoms (µM)
4 4 0.4 4 4 0.4
half sat. Fe diatoms (aM) 120 120 700 700 120 120
half sat. Fe nano/pico (aM) 25 25 300 300 25 25
half sat. FeCoccolith. (aM9
25 300 300 25 25
Phytoplankton traits

Description Units PCUL DGSWSWAM
SWFE SWPOSWSI
half saturation PO4 diatoms
nM 75 75 300 75 300 75
half saturation PO4
nanophytoplankton
nM 19 19 100 19 100 19
half saturation PO4
coccolithophorids
nM 4 4 4 4 4
half saturation SiO3
diatoms
µM 4 4 0.4 4 4 0.4
half saturation Fe diatoms
aM 120 120 700 700 120 120
half saturation Fe nanophytoplankton
aM 25 25 300 300 25 25
half saturation Fecoccolithophorids
aM 25 300 300 25 25
Phytoplankton traits
Total
0
0.1
0.2
0.3
0.4
0.5
0.6
0.7
0.8
0.9
1
MLD Fe PO4 Si PP EXPorg EXPco3 Chl DCHL/ NCHL/ CCHL/ MES MIC
SarmObsPCULDGSWSWAMSWFESWPOSWSI

Description PCUL EQUL EME2 EMES EMI2 EMIC
max. growth rate Meso-zoo (1/d)
0.9 0.24 0.24 0.9 0.24 0.24
half sat. Meso-zoo (µM) 18 0.29 0.29 0.29 0.29 0.29
mortality rate Meso-zoo (1/d)
0.1*mes 0.0580.058*mes
0.1*mes
0.058 0.058
max growth rate Micro-zoo (1/d)
4 2 2 2 4 2
half saturation Micro-zoo (µM)
18 18 18 18 18 3
Zooplankton traits

DescriptionUnits
PCUL EQULEME2EMESEMI2 EMIC
max. growth rate mesozooplankton
1/d 0.9 0.24 0.24 0.9 0.24 0.24
half saturation mes
µM 18 0.29 0.29 0.29 0.29 0.29
mortality rate mes
1/d0.1*mes
0.058
0.058*mes
0.1*mes
0.058
0.058
max growth rate microzooplankton
1/d 4 2 2 2 4 2
half saturation mic
µM 18 18 18 18 18 3
Zooplankton traits
Total
0
0.1
0.2
0.3
0.4
0.5
0.6
0.7
0.8
0.9
1
MLD Fe PO4 Si PP EXPorg EXPco3 Chl DCHL/ NCHL/ CCHL/ MES MIC
SarmObs
PCULEQULEME2EMESEMI2EMIC

POC
CaCO3
Si
sediment trap data base of C. Klaas
Impact of El Nino in % on Chla (full line from SeaWiFS) and export (dots from traps)

cocco
diatoms
nanno
Abundance of PFT (%)
DGOM PISCES