ecosystem markets and · pdf file1 forest trends’ ecosystem marketplace ecosystem...
TRANSCRIPT

1
FOREST TRENDS’ ECOSYSTEM MARKETPLACE
Ecosystem Markets and Finance: A Global Primer
5/1/2015

2
ABOUT FOREST TRENDS ECOSYSTEM MARKETPLACE
Ecosystem Marketplace, an initiative of the non-profit organization Forest Trends, is a leading source of information on environmental markets and payments for ecosystem services. Our services include annual reports, quantitative market tracking, original articles and news aggregation. Our mission is to provide solid, transparent and trustworthy information on payments for ecosystem services and environmental markets to help these mechanisms better finance conservation… and to put a value on the invaluable.
CONTENTS DISCLAIMER
Ecosystem Marketplace is an initiative of Forest Trends. This document was prepared and based upon information Ecosystem Marketplace collected through surveys and qualitative interviews with market participants. Ecosystem Marketplace does not represent or warrant the accuracy, suitability or content of the survey responses. It is the sole responsibility and obligation of readers to satisfy themselves as to the accuracy, suitability and content of the information contained herein. Ecosystem Marketplace makes no warranties and shall have no liability to the reader for any inaccuracy, representation or misrepresentation set out herein. The reader further agrees to hold Ecosystem Marketplace harmless from and against any claims, loss or damage in connection with or arising out of any commercial decisions made on the basis of the information contained herein. The reader of this report is strongly advised not to use the content of this report in isolation, but to take the information contained herein together with other market information and to formulate his/her own views, interpretations and opinions thereon. The reader is strongly advised to seek appropriate legal and professional advice before entering into commercial transactions.
CONTACT
Molly Peters-Stanley, Director, Forest Trends’ Ecosystem Marketplace [email protected] +1-202-298-3005

3
ACRONYMS USED IN THIS REPORT
AFOLU – Agriculture, forest or land use ES – Ecosystem services FCPF – Forest Carbon Partnership Facility Ha – Hectare MtCO2e – Million tons of carbon dioxide equivalent PES – Payments for ecosystem services PWS – Payments for watershed services REDD - Reduced Emissions from Deforestation and forest Degradation REDDX – Forest Trends’ REDD Expenditures Tracking Project
GLOSSARY
Co-benefits: Additional environmental, social, or other benefits arising from a carbon project quantified based on metrics or indicators defined by the project developer, a co-benefits certification program, or third party carbon project standard accounting for both climate and co-benefits. Some registries and standards enable co-benefits certification to be “tagged” onto issued carbon offsets, if quantification and verification of co-benefits are not already embedded in a carbon project standard.
Compensatory Mitigation: The restoration, creation, enhancement, and/or in certain circumstances preservation of natural resources for the purposes of offsetting adverse impacts which remain after all appropriate and practicable avoidance and minimization has been achieved. For the purposes of this report, compensatory mitigation represents a spectrum of practices that range from rigorous and measurable biodiversity offsets to less direct efforts to compensate for impacts through assessed fees or penalties for adverse land impacts, financial donations and land protection.
Compliance carbon markets: Marketplaces through which regulated entities obtain and surrender emissions permits (allowances) or offsets to meet predetermined regulatory targets. In the case of cap-and-trade programs, participants – often including both emitters and financial intermediaries – are allowed to trade allowances or offsets to make a profit from unused allowances or to meet regulatory requirements.
Credit – A unit of measure representing the environmental commodity that is able to be traded (this can be functional, e.g. a ton of carbon equivalent, or a measure of area), based on the environmental activity.
Mitigation Bank – A site, or suite of sites, where resources (e.g., wetlands, streams, habitat, species) are restored, established, enhanced and/or preserved for the purpose of providing compensatory mitigation for impacts. In general, a mitigation bank sells compensatory mitigation credits to developers whose obligation to provide compensatory mitigation is then transferred to the mitigation bank sponsor.
Mitigation Hierarchy: In this order, the progression of steps in mitigating harm to biodiversity stemming from any number of resource extraction or use activities: Avoidance; minimization; rehabilitation/restoration; offsetting.
Natural infrastructure for water: Natural systems like wetlands, forests, or grasslands that underpin the global water system and perform important functions such as pollution filtration, water storage, or protection against flooding that are often supplemented or replaced by engineered infrastructure.
Public watershed services subsidies: Large-scale, publically-funded programs that reward land managers for activities enhancing or protecting water supply and/or other ecosystem services.
Reduced Emissions from Deforestation and forest Degradation (REDD and REDD+): Existing forest areas with demonstrable risk of land-use change or reduced carbon storage are conserved, resulting in the avoidance of a business-as-usual scenario that would have produced higher emissions. Emissions reductions occur primarily through avoided emissions. In 2010, UNFCCC negotiators defined the “plus” as encompassing reduced emissions from deforestation and forest degradation, as well as additional efforts to sustainably manage forests, and conserve and enhance carbon stocks.

4
Standard: A set of project design, monitoring, and reporting criteria to which carbon offsetting activities and/or projects’ environmental, social and other co-benefits can be certified or verified. In the voluntary offset markets, many competing standards have emerged with the intent to increase credibility in the marketplace. More recently, national and sub-national regulated markets have also designed standards specific to regional needs, for use within voluntary and/or compliance offset markets.
Transaction (“transacted”/”contracted”): We consider “transactions” to occur at the point that offsets are contracted or suppliers otherwise agree to deliver offsets immediately or in the future. Payment and delivery of issued offsets can occur simultaneously (“spot” transaction); payment can occur immediately (“pre-pay”) or upon delivery (“pay on delivery”) for offsets expected to be issued in the future; and contracts can specify a firm volume of offsets to deliver (“firm” or “fixed” delivery), or specify that delivery and payment are based on the volume of offsets actually issued to the project in the future (“unit contingent”). This report tracks all of the above contract types, and some options contracts, as “transactions.”
Voluntary carbon offset markets: Marketplaces through which companies, organizations and individuals voluntarily obtain and retire emissions offset credits to meet internal carbon footprint or emission reduction goals.
Voluntary compensation: Activities funded by companies and other organizations seeking to mitigate for their own impacts voluntarily.
Water quality trading: Two or more parties trade water quality credits, usually measured in pounds of pollution reduction, to offset impacts and/or meet compliance with clean water standards. Water quality trading may take place through direct contracts or through some type of market exchange, often a clearinghouse or auction mechanism. The most common types of credits are for nitrogen, phosphorus, stormwater, and thermal load (e.g. temperature) reduction.
Water stewardship: Broadly, an approach to business water management and reporting that considers water use and impacts across the value chain and incorporates goals and actions related to watershed management, stakeholder engagement, public policy, and transparency into a company’s strategy on water.
Watershed services: The benefits to society provided by healthy natural systems (like forests or wetlands), such as aquifer recharge, flow regulation, erosion control, and water purification.
5
I. ECOSYSTEM SERVICES MARKETS AND FINANCE – OVERVIEW AND KEY TAKEAWAYS
The last decade has seen significant growth in demand by government, business, and communities to invest in the enhancement and protection of ecosystem services. This primer summarizes the major ecosystem market segments.
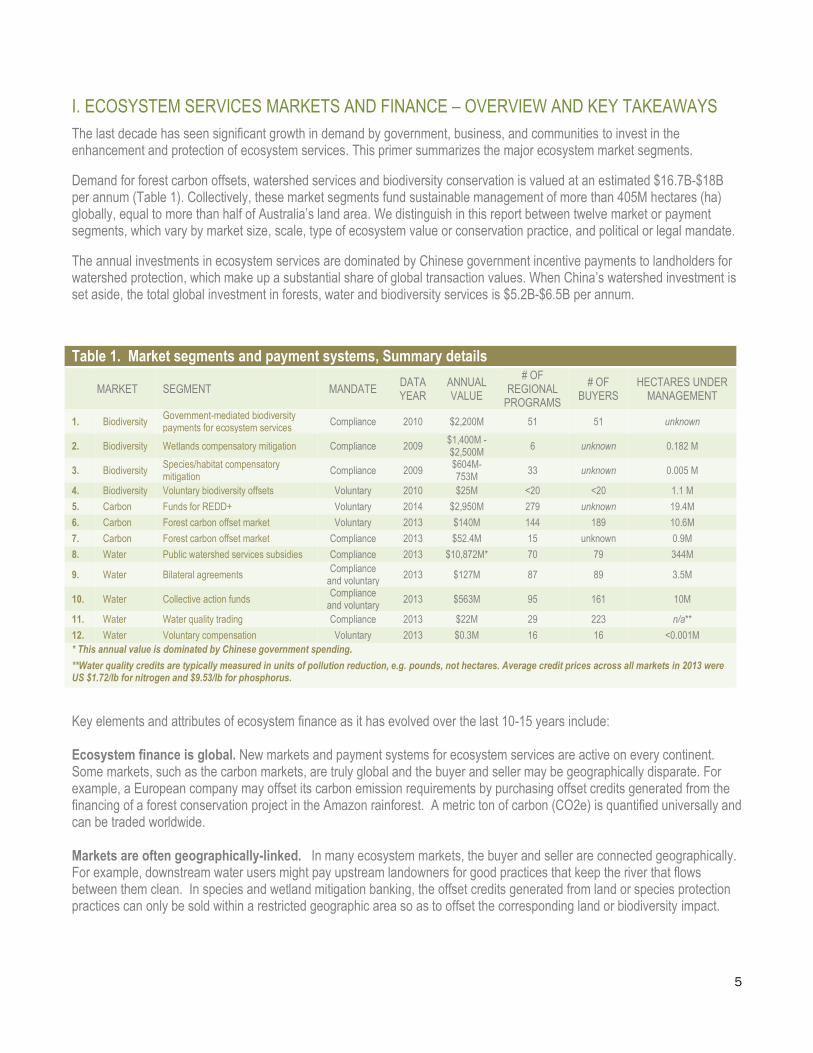
Demand for forest carbon offsets, watershed services and biodiversity conservation is valued at an estimated $16.7B-$18B per annum (Table 1). Collectively, these market segments fund sustainable management of more than 405M hectares (ha) globally, equal to more than half of Australia’s land area. We distinguish in this report between twelve market or payment segments, which vary by market size, scale, type of ecosystem value or conservation practice, and political or legal mandate.
The annual investments in ecosystem services are dominated by Chinese government incentive payments to landholders for watershed protection, which make up a substantial share of global transaction values. When China’s watershed investment is set aside, the total global investment in forests, water and biodiversity services is $5.2B-$6.5B per annum.
Table 1. Market segments and payment systems, Summary details
MARKET SEGMENT MANDATE DATA YEAR
ANNUAL VALUE
# OF REGIONAL
PROGRAMS
# OF BUYERS
HECTARES UNDER MANAGEMENT
1. Biodiversity Government-mediated biodiversity payments for ecosystem services
Compliance 2010 $2,200M 51 51 unknown
2. Biodiversity Wetlands compensatory mitigation Compliance 2009 $1,400M - $2,500M
6 unknown 0.182 M
3. Biodiversity Species/habitat compensatory mitigation
Compliance 2009 $604M-753M
33 unknown 0.005 M
4. Biodiversity Voluntary biodiversity offsets Voluntary 2010 $25M <20 <20 1.1 M
5. Carbon Funds for REDD+ Voluntary 2014 $2,950M 279 unknown 19.4M
6. Carbon Forest carbon offset market Voluntary 2013 $140M 144 189 10.6M
7. Carbon Forest carbon offset market Compliance 2013 $52.4M 15 unknown 0.9M
8. Water Public watershed services subsidies Compliance 2013 $10,872M* 70 79 344M
9. Water Bilateral agreements Compliance
and voluntary 2013 $127M 87 89 3.5M
10. Water Collective action funds Compliance
and voluntary 2013 $563M 95 161 10M
11. Water Water quality trading Compliance 2013 $22M 29 223 n/a**
12. Water Voluntary compensation Voluntary 2013 $0.3M 16 16 <0.001M
* This annual value is dominated by Chinese government spending.
**Water quality credits are typically measured in units of pollution reduction, e.g. pounds, not hectares. Average credit prices across all markets in 2013 were US $1.72/lb for nitrogen and $9.53/lb for phosphorus.
Key elements and attributes of ecosystem finance as it has evolved over the last 10-15 years include: Ecosystem finance is global. New markets and payment systems for ecosystem services are active on every continent. Some markets, such as the carbon markets, are truly global and the buyer and seller may be geographically disparate. For example, a European company may offset its carbon emission requirements by purchasing offset credits generated from the financing of a forest conservation project in the Amazon rainforest. A metric ton of carbon (CO2e) is quantified universally and can be traded worldwide. Markets are often geographically-linked. In many ecosystem markets, the buyer and seller are connected geographically. For example, downstream water users might pay upstream landowners for good practices that keep the river that flows between them clean. In species and wetland mitigation banking, the offset credits generated from land or species protection practices can only be sold within a restricted geographic area so as to offset the corresponding land or biodiversity impact.

6
Market value is tied to biodiversity results. In addition to providing monetary value, all ecosystem markets have explicit rules, criteria and, in many cases, monitoring and verification requirements tied to the achievement of biodiversity results. Carbon offset credits for forest protection have both project validation and annual verification requirements. Species and wetland banking credits have explicit, legal requirements for permanent monitoring and enforcement of land protection. Market values fluctuate, but most markets continue to grow. The evolution of markets over the last decade or more has seen changes in market values due to both volume and price fluctuations. This has been particularly evident in both compliance and voluntary carbon markets. However, and as demonstrated in the pages that follow, most ecosystem markets and payment systems tracked have seen continued growth over time. Markets are illiquid. All ecosystem markets and payment systems are still characterized by relatively few participants and a modest volume of aggregate market activity. Many payments for ecosystem services occur bilaterally between discrete buyers and sellers that currently number in the hundreds. In general, the supply side of markets for ecosystem services is well known while information about buyers (the demand side) is much less understood. Robust markets require strong government policy. The majority of ecosystem services markets, and the most robust among them, are in some way driven by government policies. The wetland mitigation market in the United States, for example, is driven by federal law and a No Net Loss policy that requires companies to compensate for any impacts on wetlands and streams. While the voluntary carbon market continues to be active each year, its size ($379 million in transactions in 2013) is dwarfed by the regulated European compliance market that has historically been in the $ billions. Voluntary markets offer opportunities for investment and innovation. More than $3 billion in payments for ecosystem services to date have been voluntary. Most notably, investments in avoided deforestation have largely occurred outside of regulation. In many cases, however, compliance and voluntary markets are complementary, with regulation or the promise of emerging regulated (compliance) markets driving development of more robust market infrastructure and a greater familiarity with market-based mechanisms for conservation. As such, voluntary markets can serve as the testing ground for concepts and new innovations eventually adopted in the compliance markets. Ecosystem markets require a new type of accounting. Creating markets for ecosystem services requires new methodologies for measuring and verifying outcomes. In the carbon markets, the unit of exchange is one metric ton of carbon dioxide equivalent CO2e). Water quality credits may be calculated according to a unit of pollution reduction, for example pounds of nitrogen (N) or phosphorus (P) removed. Species or wetland offsets are related to the land area set aside and protected. For businesses and NGOs engaged in developing, buying or selling any of these credits, new accounting techniques must be adopted to show credit value on traditional balance sheets and profit/loss (revenue/expense) statements. Markets and payments for ecosystem services value the invaluable. Ecosystems provide people with important “services” that are often not valued in monetary terms. Forests and other biological systems sequester carbon, filter water, provide wood for shelter and heat, and are valued sources of food and livelihoods. While these services are vital to life on Earth, they are often not accounted for in modern economic systems – effectively placing a value of “zero” on the climate, water, and biodiversity. Markets and payments for ecosystem services create systems through which people, businesses and governments can see value in, and pay for, the benefits that nature provides.
7
II. FOREST CARBON MARKETS
PERFORMANCE AND OUTLOOK
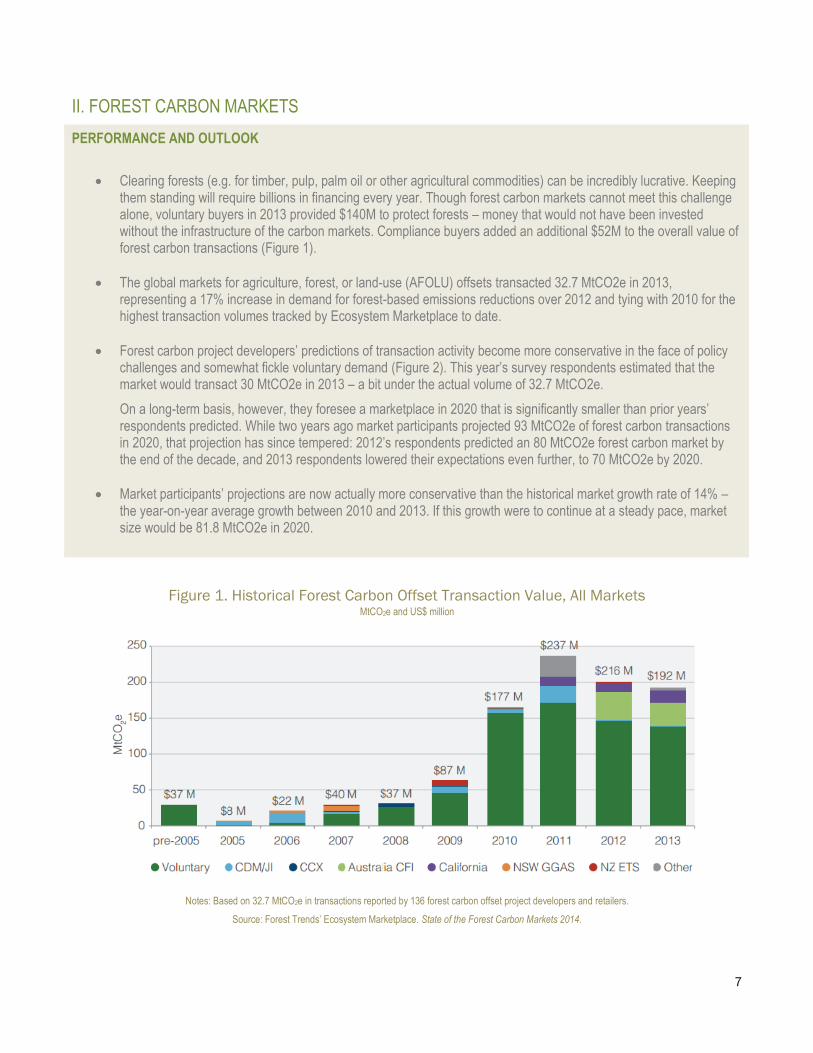
Clearing forests (e.g. for timber, pulp, palm oil or other agricultural commodities) can be incredibly lucrative. Keeping them standing will require billions in financing every year. Though forest carbon markets cannot meet this challenge alone, voluntary buyers in 2013 provided $140M to protect forests – money that would not have been invested without the infrastructure of the carbon markets. Compliance buyers added an additional $52M to the overall value of forest carbon transactions (Figure 1).
The global markets for agriculture, forest, or land-use (AFOLU) offsets transacted 32.7 MtCO2e in 2013, representing a 17% increase in demand for forest-based emissions reductions over 2012 and tying with 2010 for the highest transaction volumes tracked by Ecosystem Marketplace to date.
Forest carbon project developers’ predictions of transaction activity become more conservative in the face of policy challenges and somewhat fickle voluntary demand (Figure 2). This year’s survey respondents estimated that the market would transact 30 MtCO2e in 2013 – a bit under the actual volume of 32.7 MtCO2e.
On a long-term basis, however, they foresee a marketplace in 2020 that is significantly smaller than prior years’ respondents predicted. While two years ago market participants projected 93 MtCO2e of forest carbon transactions in 2020, that projection has since tempered: 2012’s respondents predicted an 80 MtCO2e forest carbon market by the end of the decade, and 2013 respondents lowered their expectations even further, to 70 MtCO2e by 2020.
Market participants’ projections are now actually more conservative than the historical market growth rate of 14% – the year-on-year average growth between 2010 and 2013. If this growth were to continue at a steady pace, market size would be 81.8 MtCO2e in 2020.
Figure 1. Historical Forest Carbon Offset Transaction Value, All Markets MtCO2e and US$ million
Notes: Based on 32.7 MtCO2e in transactions reported by 136 forest carbon offset project developers and retailers.
Source: Forest Trends’ Ecosystem Marketplace. State of the Forest Carbon Markets 2014.

8
Figure 2. Project Developers Predictions, All Markets, 2012-2013 MtCO2e
Notes: Based on predictions provided by 73 survey respondents.
Source: Forest Trends’ Ecosystem Marketplace. State of the Forest Carbon Markets 2014.
MARKET SEGMENTS
The voluntary forest carbon offset market is currently the only active international market for forestry offsets, where thousands of discrete buyers and sellers voluntarily enter into contracts for forest-based emissions reductions. Purely voluntary demand for forest carbon offsets increased 7% last year, with buyers demanding 29 MtCO2e, up from 26.6 MtCO2e in 2012. Forestry and land-use offsets were the most popular offset category on the voluntary carbon markets in 2013 and comprised 49% of voluntary market value. Two out of every five offsets transacted by voluntary buyers last year came from a forest project, making forestry the most sought-after offset category.
Figure 3. Market Profile: Voluntary forest carbon offsets

9
Source: Forest Trends’ Ecosystem Marketplace.
Market observers frequently considered project-level funding, which is mostly coming from the private sector, to be a “drop in the bucket” compared to the many billions that developed donor country governments are expected to commit to reducing deforestation in developing countries. Forest Trends’ REDD Expenditures Tracking Project (REDDX) has tracked $4.5 billion in REDD finance commitments to 14 tropical forest countries in the last few years – a figure that indeed dwarfs project-level private finance. However, less than $0.6 billion has been disbursed to recipient governments, according to REDDX.
Multilateral institutions such as the World Bank’s Forest Carbon Partnership Facility (FCPF) have ramped up funding for REDD over the past few years, overshadowing the bilateral and private foundation funding supplying the bulk of funds in the early years of 2009 and 2010. The majority of this funding has been dispersed through FCPF’s Readiness Fund targeting non-emissions-reductions preparations, but the institution reached a significant milestone in December 2013 when it approved the Methodological Framework for its Carbon Fund, unlocking a potential $390 million in payments for emissions reductions.
There are currently eleven countries in the Carbon Fund pipeline: Chile, Costa Rica, the Democratic Republic of Congo (DRC), Ghana, Guatemala, Indonesia, Mexico, Nepal, Peru, the Republic of Congo, and Vietnam. In September, Costa Rica became the first country to sign a letter of intent with FCPF, providing insight on the maximum payment for emissions reductions it could receive: up to $63 million for as much as 12 MtCO2e. Buyers in the Carbon Fund have expressed their willingness to pay $5/tCO2e, but the final price will depend on the result of negotiations with each country.
The World Bank’s BioCarbon Fund also created a new funding initiative for forests – the Initiative for Sustainable Forest Landscapes – in December 2013, after years of focusing on UN Clean Development Mechanism (CDM) projects. The initiative aims to direct $30 million to $50 million to forests in six jurisdictions, starting with Oromia, Ethiopia.
It is important to note that almost all of the commitments tracked by REDDX are grants to help countries develop and implement a REDD strategy, not payments for performance, which are what Ecosystem Marketplace tracks in its State of report series. Payments for verified emissions reductions are set to occur in the third and final ‘phase’ of the UN-REDD program, and no national government has yet reached that stage.
Figure 4. Market Profile: Funds for REDD+
Source: Forest Trends’ Ecosystem Marketplace.
1Notes: Disbursed funds only. An additional $1,610M committed but not disbursed.
10
III. BIODIVERSITY MARKETS AND COMPENSATION
PERFORMANCE AND OUTLOOK
The global annual market size is estimated to be at least $2.4-4.0B, and likely much more, as 80% of existing programs are not transparent enough to estimate their market size1.
North America continues to dominate activity in biodiversity markets, with 15 active programs and 4 in development. The US aquatic compensatory mitigation and conservation banking programs account for the greatest volume of payments and area to the global biodiversity market, bringing in $2.0-3.4 billion and protecting over 15,000 ha annually2.
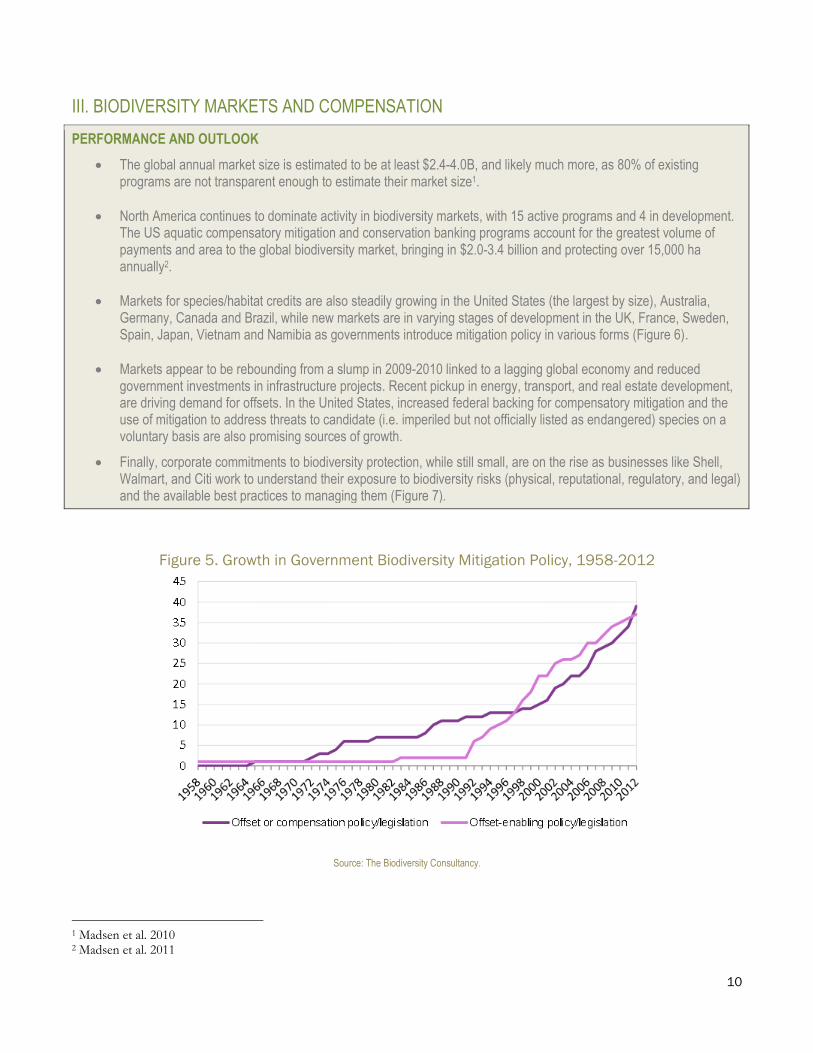
Markets for species/habitat credits are also steadily growing in the United States (the largest by size), Australia, Germany, Canada and Brazil, while new markets are in varying stages of development in the UK, France, Sweden, Spain, Japan, Vietnam and Namibia as governments introduce mitigation policy in various forms (Figure 6).
Markets appear to be rebounding from a slump in 2009-2010 linked to a lagging global economy and reduced government investments in infrastructure projects. Recent pickup in energy, transport, and real estate development, are driving demand for offsets. In the United States, increased federal backing for compensatory mitigation and the use of mitigation to address threats to candidate (i.e. imperiled but not officially listed as endangered) species on a voluntary basis are also promising sources of growth.
Finally, corporate commitments to biodiversity protection, while still small, are on the rise as businesses like Shell, Walmart, and Citi work to understand their exposure to biodiversity risks (physical, reputational, regulatory, and legal) and the available best practices to managing them (Figure 7).
Figure 5. Growth in Government Biodiversity Mitigation Policy, 1958-2012
Source: The Biodiversity Consultancy.
1 Madsen et al. 2010 2 Madsen et al. 2011

11
Figure 6. Growth in Corporate Biodiversity Mitigation Commitments, 2000-2012
Source: The Biodiversity Consultancy.
MARKET SEGMENTS
Government-mediated biodiversity payments for ecosystem services programs are large-scale publicly funded efforts that include conservation incentives benefitting biodiversity (such as in Brazil, the United States, and Australia); dedicated biodiversity funds (as in United Kingdom, New Zealand), and habitat- or species-specific funding tranches (Mexico, Brazil, Australia). Collectively these programs deliver at least $2.2B annually for biodiversity conservation. Recent commitments to globally double biodiversity funding by 2015 may drive spending even higher.3
At present, however, investments in forests appear to be low relative to other types of land cover, although data on some programs – especially debt-for-nature swaps and programs operated by public utilities – is difficult to obtain.4 It is also difficult to gauge program impacts even in terms of simple metrics like land area under management.
Wetlands compensatory mitigation, currently active in the United States, is by size ($1.4-$2.5B per annum) the largest ecosystem services market in the world. Here, developers – who are often in the transportation, real estate development, or energy sectors – are required by law to first seek to avoid damages to wetlands or streams, then minimize damage as much as possible, and finally mitigate for any residual impacts. Developers with mitigation requirements have the option of carrying out mitigation activities themselves, paying an in-lieu fee to a fund that will be used for wetland restoration, or buying wetland credits from a third-party wetland bank (regulators’ preferred option and the market segment discussed in this report).
Wetland banks tend to be fairly small in size: the average bank size in 2014 was 178 ha.5 Credit prices meanwhile are very high: average price per credit (one credit can equal one acre, a functional assessment, or a combination of the two, depending on the regional-level regulator in question) was $74,535 per credit in 2008 (the most recent year for which data is available).6
3 “Governments vow to double biodiversity finance by 2015,” 2014.
4 Forest Trends’ Ecosystem Marketplace, 2008.
5 US Army Corps of Engineers, 2014.
6 Madsen et al, 2010.

12
Figure 7. Market Profile: Government-mediated biodiversity payments
Source: Forest Trends’ Ecosystem Marketplace.
Figure 8. Market Profile: Wetlands compensatory mitigation
Source: Forest Trends’ Ecosystem Marketplace.
Species/habitat compensatory mitigation follows a similar logic to wetland compensatory mitigation: parties damaging protected species or habitats must mitigate any for residual impacts (after attempting to avoid and minimize). Markets for species/habitat credits are active in the United States (the largest by size), Australia, Germany, Canada and Brazil, while new markets are in varying stages of development in the UK, France, Sweden, Spain, Japan, Vietnam and Namibia. Altogether, at least $604-$753M is transacted per year in these markets. Credit prices appear to range significantly in value. In the US, the

13
credit price in 2009 was $78,290 per hectare,7 and in 2011 $7,038 per hectare in Australia’s BioBanking program.8 Banks are small; in 2014 the average conservation bank in the United States was 263 ha.9
Figure 9. Market Profile: Species/habitat compensatory mitigation
Source: Forest Trends’ Ecosystem Marketplace.
IV. WATERSHED INVESTMENT MECHANISMS
PERFORMANCE AND OUTLOOK
In 2013, governments, businesses, and donors channeled $12.3B toward nature-based solutions to the global water crisis that rehabilitated and/or protected more than 365M ha of water-critical ecosystems worldwide.
By value, the field was still dominated by national public subsidy programs, which account for more than 88% of funding – and which came primarily from Chinese government agencies. Investment by water users with significant dependencies on healthy watersheds was still relatively low. Private sector buyers spent $41M in 2013, nearly twice 2011 values. Within that category, private-sector energy companies transacted $9.3M, followed by private water utilities ($8.9M) and the food and beverage industry ($8.8M).Other industries like agriculture, forestry, and fisheries, and the apparel/textiles sector, despite significant risk exposure at a landscape level, were notably absent as investors in natural infrastructure strategies.
Outlook for growth is cautiously optimistic. National-level spending—the backbone of growth over the last five years— showed some signs of slowing down in 2013 in Australia, Costa Rica, Mexico, and the United States. However, Chinese leadership appears committed to proceed at full speed with domestic compensation for watershed protection. At the five-year average growth rate, transactions are poised to hit $20B a year somewhere around 2018 (Figure 11), assuming that current investment policies and programs are held constant.
7 Ibid.
8 Madsen et al, 2011.
9 US Army Corps of Engineers, 2014.

14
But the scale of investment in 2015 and beyond depends heavily on factors affecting demand—including business interest in ‘water stewardship’ strategies and how prominent a role natural infrastructure plays in decisions about infrastructure spending. The emergence of standards and certifications for watershed protection and other project development guidance has promising implications for both project developers and buyers, but remains in very early stages. Similarly, on the supply side, private finance—in particular institutional and high net worth individuals—has expressed interest in investing in conservation projects, though given a lack of ‘investment-ready’ projects, funding at significant scale is unlikely in the near future.
Figure 10. Five-Year Projection of Global Watershed Investment Values Based on Current Annual
Growth, 2014-2018
Source: Forest Trends’ Ecosystem Marketplace.
MARKET SEGMENTS
Public watershed services subsidies are large-scale, publicly financed programs offering incentives to landholders for practices enhancing or safeguarding watershed services such as aquifer recharge or natural pollution filtration. These programs often have a strong focus on socio-economic co-benefits, with payments designed to provide sustainable livelihood support and training to rural or poor populations. This is the largest market segment by size, driven mainly by significant investment by national and provincial-level government in China, which spent a total of $11.5B on public watershed services subsidies in 2013.
Other well-known national public subsidy programs are active in Mexico, Costa Rica, South Africa, and Ecuador. Many have a strong focus on forest protection – especially in China, Mexico, and Costa Rica – although it is difficult to determine the scale of investment by land area. Programs generally pay for practice rather than performance, with relatively low rates of monitoring or verifying outcomes.
Payments for watershed services (PWS) include both bilateral and collective action fund mechanisms (such as a water trust fund) linking buyers and sellers of watershed services. These agreements are usually voluntary although in some cases a regulatory driver is present. This is the largest group of watershed investment projects tracked, and also the most diverse: there is significant variation in size, transaction activity, and project sophistication.
Globally PWS payments in 2013 are estimated at $690M. Most programs are on the smaller side (median land area protected is 2,000 ha) and active at the sub-state/provincial scale (e.g. involving two or more municipalities). Projects tend to be quite disconnected from one another and often seem to ‘reinvent the wheel’ when it comes to project development. An exception to this is the network of water trust funds connected through the Latin American Water Funds Partnership that share financing

15
models and project design elements (e.g. monitoring protocols), and have transacted an estimated $19M since 2012 and leveraged another $65M in financing for future projects.
Figure 11. Market Profile: Public watershed services subsidies
Source: Forest Trends’ Ecosystem Marketplace.
Figure 12. Market Profile: Water Funds and Bilateral Contracts
Source: Forest Trends’ Ecosystem Marketplace.
16
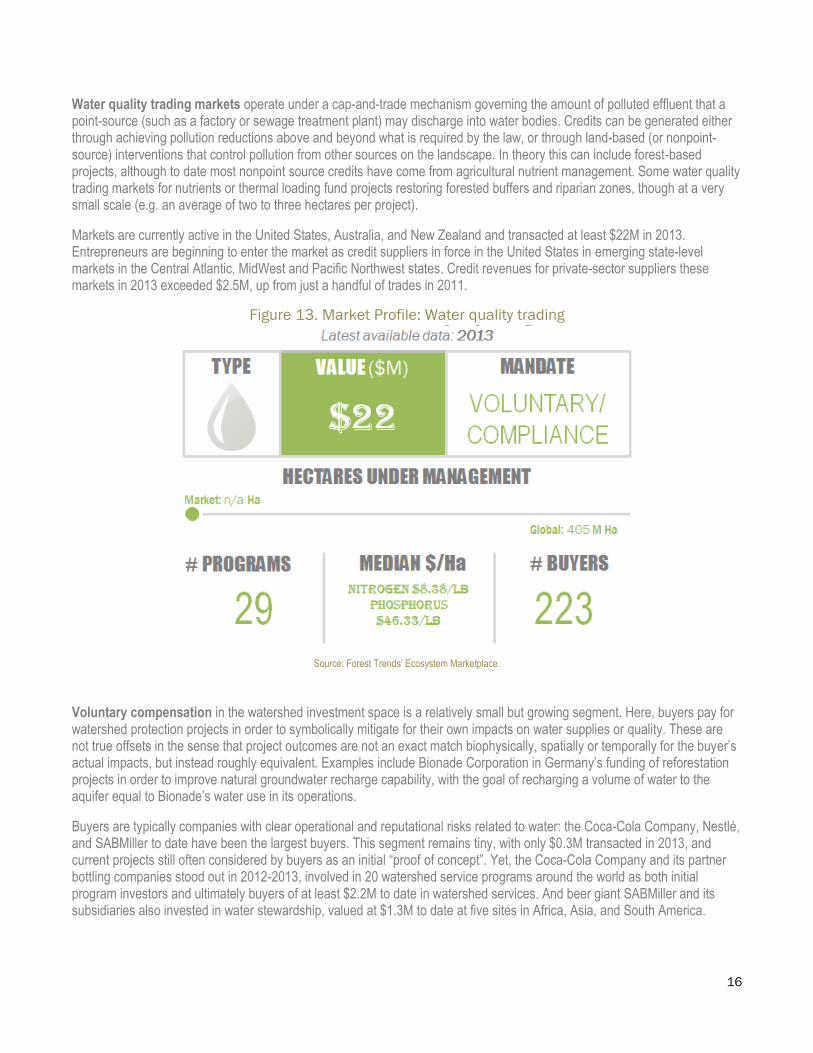
Water quality trading markets operate under a cap-and-trade mechanism governing the amount of polluted effluent that a point-source (such as a factory or sewage treatment plant) may discharge into water bodies. Credits can be generated either through achieving pollution reductions above and beyond what is required by the law, or through land-based (or nonpoint-source) interventions that control pollution from other sources on the landscape. In theory this can include forest-based projects, although to date most nonpoint source credits have come from agricultural nutrient management. Some water quality trading markets for nutrients or thermal loading fund projects restoring forested buffers and riparian zones, though at a very small scale (e.g. an average of two to three hectares per project).
Markets are currently active in the United States, Australia, and New Zealand and transacted at least $22M in 2013. Entrepreneurs are beginning to enter the market as credit suppliers in force in the United States in emerging state-level markets in the Central Atlantic, MidWest and Pacific Northwest states. Credit revenues for private-sector suppliers these markets in 2013 exceeded $2.5M, up from just a handful of trades in 2011.
Figure 13. Market Profile: Water quality trading
Source: Forest Trends’ Ecosystem Marketplace.
Voluntary compensation in the watershed investment space is a relatively small but growing segment. Here, buyers pay for watershed protection projects in order to symbolically mitigate for their own impacts on water supplies or quality. These are not true offsets in the sense that project outcomes are not an exact match biophysically, spatially or temporally for the buyer’s actual impacts, but instead roughly equivalent. Examples include Bionade Corporation in Germany’s funding of reforestation projects in order to improve natural groundwater recharge capability, with the goal of recharging a volume of water to the aquifer equal to Bionade’s water use in its operations.
Buyers are typically companies with clear operational and reputational risks related to water: the Coca-Cola Company, Nestlé, and SABMiller to date have been the largest buyers. This segment remains tiny, with only $0.3M transacted in 2013, and current projects still often considered by buyers as an initial “proof of concept”. Yet, the Coca-Cola Company and its partner bottling companies stood out in 2012-2013, involved in 20 watershed service programs around the world as both initial program investors and ultimately buyers of at least $2.2M to date in watershed services. And beer giant SABMiller and its subsidiaries also invested in water stewardship, valued at $1.3M to date at five sites in Africa, Asia, and South America.

17
Figure 14. Market Profile: Voluntary compensation for watershed services
Source: Forest Trends’ Ecosystem Marketplace.
V. LOOKING AHEAD
With the human population set to reach nine billion by mid-century, critical ecosystem services such as water availability, intact forests and the Earth’s climate are coming under intense pressure. In order to properly value and protect these resources, a fuller integration of ecological and economic systems is essential. Ecosystem markets and payment systems have emerged as an increasingly important tool for channeling finance to land, water and biodiversity protection, and for holding both the public and private sector accountable for previously externalized environmental impacts. Reflecting upon the emergence and growth of ecosystem finance over the past 10-15 years, here are some trends that Forest Trends’ Ecosystem Marketplace will be monitoring over the next decade: Integration of ecosystem service markets. For the first decade of tracking emerging ecosystem finance, the focus has been on the evolution of unique carbon, water, and biodiversity markets. Looking ahead we expect to see increasing harmonization of these markets and payment systems. This will be evident through investors’ efforts to aggregate multiple ecosystem services within specific projects. It may also become evident with companies seeking multiple benefits from their actions; for example looking for ways to maximize both water and climate protection within their supply chains. Increased blending of public and private financing. A complex spectrum of both public expenditure and private investment is likely to be the key to long-term conservation of forests and other natural systems and to securing land-based reductions in greenhouse gas emissions. Increased public support of country forest and climate programs and for performance-based forest protection should create a basis for increased private investment in forest and land use carbon markets. Public and private institutions may collaborate in issuing green bonds and other financial mechanisms to promote conservation. Several hundred companies’ commitments for low- and zero-deforestation commodity supply chains such as timber, pulp, palm oil, soy and beef should increase both demand for and investment opportunities in commodity-related forest protection. Larger scale of ecosystem market and payment opportunities. The next decade will likely see more programs that take a holistic, landscape or larger-scale approach to ecosystem services protection. Recent developments in creating both country-level and subnational programs for forest and climate programs may be followed by concerted efforts to establish national or

18
regional programs for protection of water supplies and for biodiversity protection. In time, these larger-scale programs may begin to weave together approaches, such as public or private investments in natural infrastructure aimed at securing forest or agricultural landscapes for both watershed protection and climate benefits. Use of ecosystem markets to mitigate risk. Increasingly in the future, governments and companies will face heightened risks from climate change, water scarcity and resource loss; losses that, for businesses engaged in commodity or resource related work, have a clear impact on the bottom line. Ecosystem services markets can play a role in mitigating environmental risks, especially those that occur outside of a company’s direct operations, either “upstream” in its supply chain or “downstream” in its customer base. Consider these examples: a coastal utility investing in nearby wetland restoration to protect its service area from storms and flooding; a beverage company paying landowners upstream of a factory to plant trees along a riverbed; and a cosmetics company paying for forest conservation that protects the biodiverse flora it uses to invent new products. In all of these cases, an upfront investment in ecosystem management cushions against the risk of the loss of a major ecosystem service central to a company’s business. Economic efficiency in resource protection. One of the key arguments for using market-based mechanisms is efficiency. In the carbon markets, the concept of a “cap and trade” policy is to achieve emissions reductions at the lowest possible cost to society, since one ton of carbon (CO2e) emitted from an oil rig in Canada has the same effect on the atmosphere as one ton emitted from a garments factory in Korea or the clearing and burning of forests for palm oil in Indonesia. As the costs of climate change, water scarcity and resource availability rise, markets may be used as a tool for channeling limited finance effectively. This is apparent in Louisiana, where the state government is facing rapid wetlands loss and struggling to prioritize where to focus restoration efforts. New methodologies to measure the carbon content of these ecosystems has attracted preliminary private sector investment. Since payments will be based on emissions reductions actually being achieved, the market-based model should, in theory, channel financing to places where restoration is most likely to work and where the “services” of wetlands – notably coastal protection – is most needed (e.g. near critical infrastructure or dense populations). In conclusion, while many of the markets and payment systems tracked and reported on in this publication are relatively new, small and growing, the body of evidence points toward continued growth and innovation in environmental finance as a means to attract private investment and to promote long-term, sustainable protection of the Earth’s forests, water and resources.