ecosystem services in fine flavor cocoa agroforestry
TRANSCRIPT

Ecosystem services in fine flavor cocoa agroforestry systems from
Ecuador
MSc Thesis Plant Production Systems
Gabriela Galarza Ferrín August 2019 [email protected]

2

3
Ecosystem services in fine flavor cocoa agroforestry systems from
Ecuador
MSc Thesis Plant Production Systems
Name Student: Gabriela Galarza Ferrín
Registration Number: 910523-249090
Study: MSc Organic Agriculture – Specialization Agroecology
Chair group: Plant Production Systems (PPS)
Code Number: PPS-80436
Date: August 2019
Supervisors: dr.ir. Maja Slingerland
dr. Lotte Woittiez
Examiners: dr. Marieke Sassen
Disclaimer: this thesis report is part of an education program and hence might contain (minor) inaccuracies and errors.
Correct citation: Galarza, G., 2019, Ecosystem services in fine flavor cocoa agroforestry systems from Ecuador, MSc Thesis Wageningen University, 77 p.
Contact: [email protected], [email protected] for access to data, models and scripts used for the analyses.

4

5
Table of Contents
ACKNOWLEDGEMENTS ................................................................................................................................... 7 SUMMARY ...................................................................................................................................................... 9 1. INTRODUCTION .................................................................................................................................... 11
Shade trees and ecosystem services in cocoa agroforestry systems (CAFS) .............................................. 12 1.1. BACKGROUND INFORMATION ................................................................................................................ 12
Soil fertility ............................................................................................................................................ 12 Pest and disease regulation ................................................................................................................... 13 Carbon storage and climate change mitigation ...................................................................................... 14 Climate change adaptation .................................................................................................................... 14 Trade-offs and synergies between ecosystem services in CAFS ................................................................ 15 Ecuador and the potential of fine flavor cocoa ....................................................................................... 18
1.2. PURPOSE OF THE STUDY ....................................................................................................................... 18 1.3. RESEARCH QUESTIONS ......................................................................................................................... 18
2. METHODOLOGY .................................................................................................................................... 21 2.1. STUDY SITE ....................................................................................................................................... 21 2.2. FIELDWORK AND FARM SELECTION .......................................................................................................... 21 2.3. SHADE TREE MEASUREMENTS ................................................................................................................ 22 2.4. PLOT CHARACTERIZATION AND MANAGEMENT ........................................................................................... 24 2.5. MEASUREMENT OF ECOSYSTEM SERVICES ................................................................................................. 24
Yield 24 Disease incidence .................................................................................................................................. 24 Soil quality............................................................................................................................................. 25 Carbon storage ...................................................................................................................................... 26 Biodiversity............................................................................................................................................ 26
2.6. DATA ANALYSIS ................................................................................................................................. 26 3. RESULTS ................................................................................................................................................ 29
3.1. CHARACTERIZATION OF THE FARMS AND MANAGEMENT PRACTICES ................................................................. 29 3.2. SHADE CHARACTERISTICS ..................................................................................................................... 30 3.3. PROVISION OF ECOSYSTEM SERVICES ....................................................................................................... 31 3.4. INTERACTIONS BETWEEN ECOSYSTEM SERVICES, MANAGEMENT PRACTICES AND SHADE ........................................ 35
4. DISCUSSION .......................................................................................................................................... 41 Cocoa yield ............................................................................................................................................ 41 Disease control ...................................................................................................................................... 43 Aboveground carbon storage ................................................................................................................. 44 Shade diversity ...................................................................................................................................... 45 Soil quality............................................................................................................................................. 46
5. CONCLUDING REMARKS ....................................................................................................................... 47

6
6. REFERENCES .......................................................................................................................................... 49 7. ANNEXES............................................................................................................................................... 57
7.1. ANNEX I .......................................................................................................................................... 57 7.2. ANNEX II ......................................................................................................................................... 58 7.3. ANNEX III ........................................................................................................................................ 59 7.4. ANNEX IV ........................................................................................................................................ 61 7.5. ANNEX V ......................................................................................................................................... 62 7.6. ANNEX VI ........................................................................................................................................ 69

7
Acknowledgements First of all, I would like to thank my supervisors Maja and Lotte who gave me the opportunity to carry this research as part of the Cocoa Soils project. They were open, flexible, and always willing to engage in interesting discussions. I am very grateful for their approach as supervisors, as their guidance was instrumental for the development of my scientific research skills. More importantly, they pushed me to come up with my own ideas and hypothesis and to find a topic I was passionate about, and for that I will be forever grateful.
Then I would like to thank Ecuador’s Secretaría Nacional de Ciencia, Tecnología e Innovación SENESCYT for funding all of the costs related to my MSc studies. The Cocoa Soils Project provided funding to carry fieldwork data collection for this thesis research. I also thank the Plant Productions Systems Chairgroup from Wageningen University and Research, for providing academic and organizational support during the development of this thesis.
Thanks to Corporación Fortaleza del Valle (CFV), the organization that opened the doors for me to propose and carry this research. Specially to Holguer Vera and Berto Zambrano, from the administration of CFV, who’s help and collaboration were crucial for the development of this research.
Special thanks to Gabriel Job Laaz, who helped me as assistant on the field and became a good friend. His dedication and commitment during fieldwork were pivotal for the collection of data. His knowledge and advice as supervisor of CFV were essential for the farm selection, and his insights as cocoa farmer were of great help to understand the cocoa farming systems.
More importantly, thanks to all the farmers that were part of this study. They opened their farms to me and shared not only their practices but their views and concerns. Their generosity and kindness were always present.
A number of people from Plant Production Systems provided advice and help during the development of this research. Danae and Marieke offered useful advice during the formulation of the thesis proposal. Thanks to Bastiaen, Ekatherina, Eva, and Joost for their help with statistics and R. Sanne, Shinhye, Brent, Chantalle and Dirk provided helpful comments on the manuscript. And finally I thank Marieke for reading the final document and for providing feedback as examiner.
Lastly, I would like to thank my partner Alicia and my family, without their love and encouragement none of this could have been possible.

8

9
Summary This study addresses the provision of ecosystem services by smallholder fine flavor cocoa agroforestry systems from Ecuador. Understanding the factors that influence the provision of ecosystem services, and the interactions between ecosystem services in cocoa agroforestry systems can serve to design multifunctional agroecosystems that support high levels of food production while also contributing to social and environmental goals. The following ecosystem services were measured: cocoa productivity (yield), carbon storage (aboveground carbon), disease control (disease incidence of moniliasis and witches’ broom), biodiversity (shade tree diversity), and soil quality (soil structure and soil life). The effect of management practices and the characteristics of shade trees on the provision of ecosystem services was also assessed. And finally, trade-offs and synergies between ecosystem services were identified.
The studied cocoa farms (n=40) had an average cocoa yield of 282 kg ha-1 yr-1. Moniliasis infection was present in an average of 39% of the trees of the farms. Whereas witches’ broom infection was present in an average of 87% of the trees of the studied farms. The cocoa agroforestry systems stored in average 65.5 t C ha-1, and the mean number of shade tree species was 5.6. Soil quality indicators collected from visual soil assessment were recorded.
Irrigation was the only management practice that significantly improved cocoa yield. Other management practices did not have a significant effect on yield. Cocoa age showed a negative effect on disease control. And banana density negatively influenced carbon storage and shade tree diversity. The results suggest there is room for improvement of the organic management practices currently in use.
Significant interactions between ecosystem services were found. All of the statistically significant interactions between ecosystem services were synergies. Our results show that shade diversity and soil fertility positively influence disease control. Whereas soil quality has a positive effect on carbon storage.
It is concluded that the diversity of shade and the density of banana trees are important factors of the structure of cocoa agroforestry systems, that determine the provision of ecosystem services. Irrigation, and cocoa age influence the provision of some ecosystem services, and the use of optimal organic management practices could potentially improve the provision of ecosystem services. Finally, synergies between ecosystem services were identified. This research contributes to the understanding of ecosystem service provision by smallholder fine-flavor cocoa farms, which can serve to design multifunctional cocoa agroecosystems that provide the greater number of benefits.

10

11
1. Introduction Current global trends are posing a series of challenges to agriculture. The world’s population is expected to reach 10 billion by 2050, increasing the demand for agricultural products (FAO, 2017). The needed increase in productivity is hindered by widespread degradation of natural resources, thus higher competition for land and water is expected (FAO, 2011). Additionally, climate change will cause global temperature increase, higher rainfall variability and more frequent droughts and floods which will in general reduce yields (Gladek et al., 2016; Porter et al., 2014). At the same time, the expansion of agricultural land is the main driver of deforestation, and the sector is one of the main emitters of greenhouse gasses (Gladek et al., 2016) and contributes to the current massive loss of biodiversity (WWF, 2018).
Various authors have proposed the need of multifunctional agriculture that increases food production while sustaining social and environmental goals (Bretagnolle et al., 2018; FAO, 2017; Waldron et al., 2017; Zhang & Schwärzel, 2017). Ecosystem services (ES) are the processes and conditions derived from ecosystems that sustain and enhance human wellbeing (Martinez-Harms et al., 2015) and include: provisioning, regulating, cultural, and supporting services (Millenium Ecosystem Assessment, 2005). Thus, multifunctional agriculture should be capable of providing various ES at the same time. Agroecosystems are designed mainly to deliver provisioning services, especially food production, but they are also beneficiaries of ES. Agriculture requires supporting services like soil fertility, nutrient cycling, soil formation and soil structure, and water provisioning. Agriculture may also receive regulating services like pollination and pest and disease control (Power, 2010).
Agroforestry – the combined production of trees and crops on the same piece of land – is a traditional way of farming which is now regarded as a promising form of multifunctional agriculture (Dagar & Tewari, 2017; FAO, 2017; Waldron et al., 2017). Due to the introduction of trees in agriculture, agroforestry can provide increased and more stable food production, as well as other benefits to the farmers, including higher income through sale of tree products, reduced external dependence of agricultural inputs (e.g. fertilizers) and subsistence products (e.g. fuelwood, building material; Dagar & Tewari, 2017). Furthermore, agroforests are thought to contribute to climate change mitigation through carbon sequestration, while also maintaining biodiversity (De Beenhouwer et al., 2013a; Harvey et al., 2014; Nadège et al., 2018; Rajab et al., 2016). Traditional agroforestry systems are widespread in tropical agriculture and support the livelihoods of numerous smallholder farmers in developing countries.
Cocoa (Theobroma cacao) is an important crop of tropical agriculture. Cocoa trees are shade tolerant and have traditionally been cultivated in agroforestry systems shaded by large forest trees, but more recently the removal of shade trees and the establishment of intensive full-sun cocoa plantations has been promoted in many places (van Vliet & Giller, 2017). Nowadays, cocoa systems show a wide variation in complexity, ranging from full-sun monocultures to agroforests with different combinations of cocoa tree density, diversity of shade trees, and density of shade trees (Deheuvels et al., 2012; Somarriba et al., 2018; Sonwa et al., 2017). In Latin America, it is estimated that 70% of the 1.5 million hectares under cocoa cultivation are under shade. In Ghana and Ivory Coast shaded cocoa represents 71-72%, and it is even more prevalent in Cameroon and Nigeria with 92-98% (Somarriba et al., 2014).

12
Cocoa supports the livelihoods of millions of smallholder farmers and the economy of many developing countries.
Shade trees and ecosystem services in cocoa agroforestry systems (CAFS) Shade trees are the essential elements that make a cocoa plantation an agroforestry system. There is increasing evidence that shade trees have a multifunctional role in sustaining cocoa production and improving farmers’ livelihoods (Vaast & Somarriba, 2014). Shade trees support farmers by providing food and non-food resources for household consumption, farm use, or sale (Barrios et al., 2018; Tscharntke et al., 2011). In West Africa, shade trees from CAFS are used for timber, firewood, traditional medicine, and for their edible products such as fruits (Anglaaere et al., 2011; Herzog, 1994; Jagoret et al., 2014). A similar use is given in Central America, where the set of agroforestry products contribute to family benefit (cash flow + value in domestic consumption) as much or more than cocoa (Cerda et al., 2014).
Moreover, evidence suggests that shade trees in CAFS sustain cocoa production through the provision of supporting ES: soil fertility, pest and disease regulation, climate change adaptation, and water regulation (Blaser et al., 2018; De Beenhouwer, Aerts, & Honnay, 2013; Tscharntke et al., 2011; Vaast & Somarriba, 2014). This study aims to shed light into the role of CAFS on the provision of ES, to understand their relevance as a form of multifunctional agriculture.
1.1. Background information In this section, I discuss current knowledge on the role of shade trees from CAFS on soil fertility and pest and disease regulation because of their importance to cocoa productivity. The potential of CAFS for climate change mitigation and adaptation is also reviewed because it has important implications for the sustainability of the system. Other ES mentioned will not be reviewed as they fall out of the scope of this research. Current knowledge on the interactions between ES is then discussed. Finally, the case of fine flavor cocoa from Ecuador is reviewed.
Soil fertility According to Vaast & Somarriba (2014) after conversion from forest to cocoa farms, soil fertility declines rapidly in full-sun cultivation. Shade trees improve soil fertility by providing nutrients through biomass decomposition and bringing nutrients from deeper soil layers into the system. Most of the root activity of cocoa happens in the superficial soil layer, while the root systems of some fruit shade trees have particularly deep soil activity, and thus can retrieve nutrients that are outside of the effective root zone of cocoa. These trees get nutrients that are moving down in the soil profile, immobilize them in their biomass and later make them available for cocoa through litter fall (Tscharntke et al., 2011).
A recent study found that shade tree leaves provide 12–51% (89–242 kg DM ha-1 yr-1) of the total litter input in cocoa agroforestry systems in Mexico (Pérez-Flores et al., 2018). The study looked at seasonal changes, but does not report the density of shade trees or cocoa. The inclusion of leguminous trees (planting pattern = 18 x 18 m) is estimated to fix 50 kg N ha-1 yr-1 from the atmosphere into CAFS (Nygren & Leblanc, 2015). Moreover, green leaves of pruned shade trees can leach soluble nutrients into the soil faster and in higher concentrations than litter fall (Limon et al., 2018). In general, the nutrients in solution in the soil in CAFS are related to the quality of the organic matter resulting from

13
decomposition of the litter layer (de Souza et al., 2018). Jaimez and Franco (1999) estimated that soil litter contributes 40% of N, P, K, Ca and Mg required by cocoa in agroforestry systems.
Trees also improve soil fertility by modifying the soil environment and supporting soil biota and decomposition. Their canopies provide shade to the soil, the dead leaves and branches deliver nutrient inputs and soil cover, and trees regulate humidity by intercepting rainfall and transpiring water taken from the soil. These processes affect microclimate and soil properties like nutrient content, moisture, temperature and erosion which have an influence on the abundance, diversity and activity of soil biota (Barrios et al., 2012). However, the extent of the benefits of shade trees on soil fertility are not yet clear. Blaser et al. (2017) found limited positive effects of shade trees on soil fertility (improved soil C, N, and soil aggregation) which were restricted to the area under the tree and were not significant at the plot scale.
Pest and disease regulation Compared to natural ecosystems, agroecosystems are highly vulnerable to pests and diseases. This has been linked to the simplification of agroecosystems and the subsequent loss of biodiversity. Thus, increasing biodiversity has been proposed to decrease pest and disease risk (Avelino et al., 2012). In CAFS with low diversity like monocultures, the spread of pests and diseases could be easier because there are no other crops that can act as physical barriers. While CAFS with high biodiversity are hypothesized to have more functionally important groups. Functional diversity can be represented by, among others, predators (e.g. insect eating birds, bats and frogs, and parasitoids, etc.), herbivores, pollinators (e.g. ceratopogonids, ants, etc.)(Toledo-Hernández et al., 2017).
Jacobi et al. (2015) found significant evidence of higher infestation of witches’ broom (Moniliophthera perniciosa) in monocultures compared to cocoa agroforestry systems in Bolivia. The increase in the number and complexity of interactions between functional groups in diverse CAFS make them hard to study, nonetheless some research has been conducted. Bisseleua et al. (2017) found that exclusion of naturally occurring ant species reduced cocoa yield by 30%. Ants (Crematogaster sp., Camponotus brutus and Oecophylla longinoda) reduced pest damage by Salhbergella singularis (Hemiptera: Miridae) and Characoma stictigrapta (Lepidoptera: Noctuidae), while on the contrary dominance by one ant species increased black pod disease. Van Bael et al. (2007) found that bird predation reduced damage to cocoa leaves by herbivores. According to Gras et al. (2016) the impact of predators (ants, birds and bats) is affected by the percentage of canopy cover, with the highest yields at 30-40% of canopy cover . Nonetheless, pest and disease regulation are not automatically achieved by increasing plant diversity in a cocoa system. If plant species that harbor pest and diseases are included in the CAFS, the risks might actually increase (Schroth et al., 2000).
In addition to biodiversity, microclimatic and nutritional effects of shade trees on CAFS can also play a role in pest and disease control. The mechanisms by which shade trees affect microclimate are thought to be the reduction of air movement and UV radiation, temperature buffering and increase in humidity.
Schroth et al. (2000) reviewed the effects of shade intensity on the severity of pests and disease attacks in cocoa. Shade trees contribute to a reduction of thrips, miryds, witches’ broom, anthrachnosis and terminal dieback, and cocoa swollen shoot virus. Whereas ink disease, stem canker and moniliasis are lower under moderate shade than under heavy shade or full-sun. On the other

14
hand, black pod disease, blight and shoot rot increase under shade. Evans (1981) observed that unshaded cocoa demonstrated increased turbulence, favoring inoculum movement of Moniliophthora perniciosa, with a subsequent infection increase. Another study found that at the same shade level, black pod disease was significantly reduced under a diverse layer of shade trees compared to under just one species of planted shade tree (Bos et al., 2007).
Complex interactions related to the life cycle of each pest and disease and the characteristics of the CAFS are to be expected. Moreover, well-nourished cocoa plants are less vulnerable to pests and diseases, thus the effect of shade tree on soil fertility indirectly affects pest and disease regulation (Schroth et al., 2000).
Carbon storage and climate change mitigation The biomass of shade trees acts as a carbon sink. By reducing the amount of carbon in the atmosphere shade trees contribute to climate change mitigation. Several studies report that carbon biomass and storage are higher in CAFS than full-sun monocultures. Blaser et al. (2018) studied mature cocoa systems (15-25 years since establishment) in Ghana. They report aboveground carbon stocks averaging 38.3 t C ha-1 (±19.9) in agroforests of different shade levels compared to 10.1 t C ha-1 (±1.4) in cocoa monoculture. Cocoa agroforests had 70% to 530% more aboveground carbon than monoculture, depending on the percentage of canopy cover (Figure 1). In Cameroon, traditional CAFS showed an aboveground biomass of 138.1 t C ha−1 on average, while innovative CAFS – defined by the authors as agroforests with the use of selected varieties managed under light shade, with high chemical fertilizer and pesticide inputs – stored 46.9 t C ha−1 (Nadège et al., 2018). In Indonesia, aboveground carbon values of 103 t C ha-1 in cocoa-coconut AFS versus 10 t C ha-1 for cocoa monoculture have been reported (Santhyami et al., 2018).
While these studies focused on aboveground carbon, Asase & Tetteh (2016) included root biomass and soil carbon and found mean carbon storage of 138.1 t C ha−1 in cocoa dominated agroforests in Ghana. It is clear that CAFS can store substantial carbon compared to cocoa monocultures and other agricultural land use systems, making them a relevant climate change mitigation strategy. However, various studies have found contradictory results regarding the capacity of CAFS to capture carbon in the soil. It is unclear if the addition of shade trees into cocoa systems provides additional soil carbon sequestration (Blaser et al., 2018, 2017; van Vliet & Giller, 2017).
Climate change adaptation Cocoa agroforests have been proposed as a strategy for climate change adaptation (Vaast & Somarriba, 2014). Trees in agroforestry systems have the potential to increase crop resilience to the effects of climate change by buffering droughts and extreme temperatures. Through their foliage and roots, trees enhance water infiltration and storage while reducing evaporation.
Few studies have addressed these effects specifically for CAFS. Niether et al. (2018) examined the effects of CAFS on rainwater throughfall (portion of precipitation that falls to the soil from the canopy) and microclimate in a long-term trial in Bolivia. They found that under agroforestry, water demand due to cocoa transpiration decreased, but throughfall was also reduced. Rainfall intercepted by shade and cocoa tree canopy reduced the amount of rainwater reaching the soil. Throughfall reduction would have different effects on the crop depending on precipitation. Under high and heavy rains, it can protect the crop, but it might reduce water availability to cocoa during dry periods.

15
On the other hand, agroforests maintained microclimatic conditions with smaller variations in temperature and relative humidity compared to full-sun monoculture. Additionally, vapor pressure deficit (VPD) increased above 2kPa (from this threshold the net photosynthetic rate of cocoa decreases) more frequently in monocultures than in CAFS (Niether et al., 2018). These results suggest that shade trees also have an effect in reducing the physiological stress of cocoa.
In Ghana, Blaser et al. (2018) also found a positive effect of trees on microclimate regulation, and reduction of soil water under high shade levels. Soil water at medium shade levels was similar to the monoculture.
Additionally, CAFS also increase livelihood resilience to climate change through a crop diversification strategy. When cocoa harvests are compromised, the products of tree crops (fruit, fodder, fuel, timber) can provide alternative sources of income and food to the farmers (Waldron et al., 2017).
Trade-offs and synergies between ecosystem services in CAFS The Millennium Ecosystem Assessment (2005) highlighted the need to manage ecosystems to obtain multiple ES, therefore it is necessary to identify trade-offs and synergies among different ES. Trade-offs occur when the provision of one ES is reduced as a consequence of the increased provision of another ES (Howe et al., 2014). One clear example is the trade-off between agricultural intensification to increase yields (provisioning ES) and services provided by functional diversity like pollination and pest control (regulating ES). While synergies occur when the provision of two or more ES increase at the same time. Trade-offs and synergies among ES can happen if the ES are responding to the same driver of change (e.g fertilizer use has a positive effect on crop yield and negative effect on water quality) or because of direct interactions between ES (e.g. pest control increases crop yield Bennett et al., 2009). According to Lavorel & Grigulis (2012) the provision of ES depends on ecosystem properties (i.e. ecosystem structure and processes).
If CAFS are to be used as a multifunctional form or agriculture, a better understanding of the trade-offs and synergies between the ES they provide is necessary, together with an identification of the underlying processes that shape these relationships. Cocoa agroforests show a wide variation in structure and plant species composition and these characteristics determine their value for ES provision (Asase & Tetteh, 2016). A first step on this quest is to find relations between the levels of ES provided and the properties of the agroecosystem.
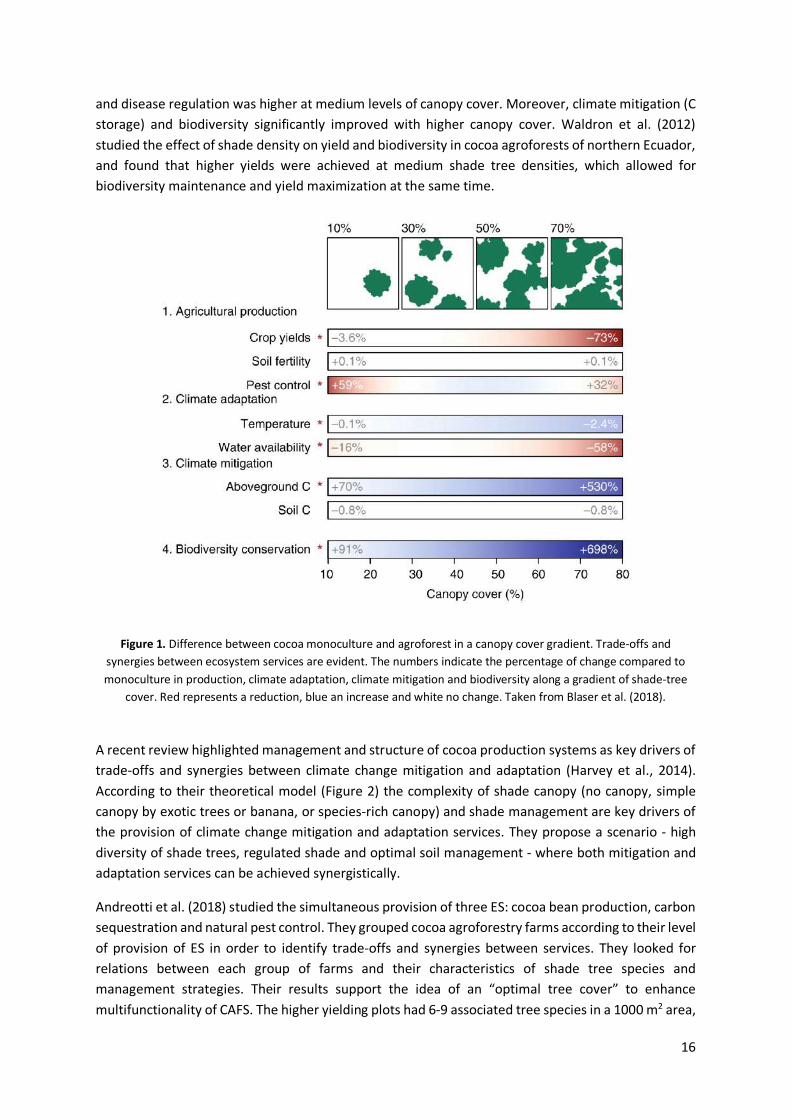
Many authors have taken tree cover as a driver of the provision of ES by CAFS (Barrios et al., 2018; Blaser et al., 2018; Waldron et al., 2012). Most of the research has been targeted to understand the optimal shade levels to achieve higher yields, and there is evidence of a trade-off between shade cover and yield (van Vliet & Giller, 2017). However, such studies focused only on one ES. More recently, some authors have attempted to measure several ES in CAFS at the same time. Blaser et al. (2018) examined ES provision along a shade cover gradient in cocoa agroforests in Ghana. The study measured biodiversity as the species richness of trees, ants, birds and litter frogs; disease as the percentage of pods lost to disease, soil fertility through chemical soil analyses, carbon stocks from aboveground biomass, litter and soil; and microclimate through temperature and humidity. Figure 1 illustrates that there are synergies and trade-offs between ecosystem services. They found that yield decreased with increasing canopy cover, soil fertility was slightly improved compared to monoculture,
16
and disease regulation was higher at medium levels of canopy cover. Moreover, climate mitigation (C storage) and biodiversity significantly improved with higher canopy cover. Waldron et al. (2012) studied the effect of shade density on yield and biodiversity in cocoa agroforests of northern Ecuador, and found that higher yields were achieved at medium shade tree densities, which allowed for biodiversity maintenance and yield maximization at the same time.
Figure 1. Difference between cocoa monoculture and agroforest in a canopy cover gradient. Trade-offs and synergies between ecosystem services are evident. The numbers indicate the percentage of change compared to monoculture in production, climate adaptation, climate mitigation and biodiversity along a gradient of shade-tree
cover. Red represents a reduction, blue an increase and white no change. Taken from Blaser et al. (2018).
A recent review highlighted management and structure of cocoa production systems as key drivers of trade-offs and synergies between climate change mitigation and adaptation (Harvey et al., 2014). According to their theoretical model (Figure 2) the complexity of shade canopy (no canopy, simple canopy by exotic trees or banana, or species-rich canopy) and shade management are key drivers of the provision of climate change mitigation and adaptation services. They propose a scenario - high diversity of shade trees, regulated shade and optimal soil management - where both mitigation and adaptation services can be achieved synergistically.
Andreotti et al. (2018) studied the simultaneous provision of three ES: cocoa bean production, carbon sequestration and natural pest control. They grouped cocoa agroforestry farms according to their level of provision of ES in order to identify trade-offs and synergies between services. They looked for relations between each group of farms and their characteristics of shade tree species and management strategies. Their results support the idea of an “optimal tree cover” to enhance multifunctionality of CAFS. The higher yielding plots had 6-9 associated tree species in a 1000 m2 area,

17
supporting the potential of achieving high yields with some level of associated shade trees. These farms with higher levels of ES provision favored cocoa tree development and controlled for interspecific competition using a limited number of associated species. Additionally, their results suggest that carbon storage is strongly related to tree basal area.
Figure 2. Diagram showing how cocoa production systems can be managed to achieve synergies between climate change mitigation and adaptation. Taken from Harvey et al. (2014).
The three studies reviewed in this section that address multiple ecosystem services in CAFS (Andreotti et al., 2018; Blaser et al., 2018; Harvey et al., 2014) support the idea that trade-offs and synergies do occur in cocoa agroforestry systems. Furthermore, they highlight two key drivers of the interactions between ES: i) shade tree density/complexity, and ii) management practices. However, the two research papers (Andreotti et al., 2018; Blaser et al., 2018) follow different methodological approaches and consider different drivers of ES (canopy cover vs. shade tree diversity and management practices) and different ES. Moreover, both studies are restricted to West Africa. Although these studies shed light onto trade-offs and synergies between ES, their interactions and drivers are far from being well understood. The enormous variation of CAFS and the interactions between ES evidently show the need for more studies of this kind. The importance of different agroforestry systems in ES provision is poorly understood and represents a technical barrier that prevents the adoption of synergic CAFS. Context specific studies can inform management decisions that support the multifunctionality of cocoa plantations.
For the reasons presented above, this thesis research aims to measure the provision of different ES in CAFS. I will try to find relations between the level of provision of five ES and shade tree density/complexity and management practices. The study uses fine flavor cocoa agroforestry farms in

18
Ecuador as study model. Fine flavor cocoa from Ecuador belongs to the ‘Nacional’ variety, cultivated in the country for at least 500 years. Evidence suggests ‘Nacional’ variety descends from wild cocoa trees from the Amazon (Loor Solorzano et al., 2012). This variety has been selected because due to its origin, it is probably well adapted to grow and produce on agroforestry systems.
Ecuador and the potential of fine flavor cocoa Ecuador, a small South American country, is the 4th biggest cocoa producer in the world, providing around 6% of the cocoa beans (Leissle, 2018). More importantly it is the first producer of fine flavor cocoa, with more than 50% of the world’s volume (ANECACAO, n.d.). Export of cocoa grains is of high economic importance for Ecuador and the area under cultivation has increased in the last decade. In order to face the future challenges of agriculture, the cocoa sector in Ecuador needs to develop sustainably, and cocoa agroforestry might be a suitable solution.
The high market value of the fine flavor cocoa produced in Ecuador (‘Nacional’ variety), coupled with its cultivation in agroforestry systems, make it a good candidate for win-win scenarios where farmer’s livelihoods are supported and ES are maintained (Waldron et al., 2012). Cocoa of the ‘Nacional’ variety is used to produce specialty chocolate because of its superior organoleptic characteristics and is associated to specialty markets that request organic or other type of certifications. However, this type of cocoa has lower yields compared to full-sun monocultures of improved hybrid varieties (especially CCN51). According to Waldron, Justicia, & Smith (2015) ‘Nacional’ cocoa agroforestry in Ecuador needs to combine yield increases, with certification and payment for other ES (e.g. REDD) in order to stop farmers from converting away from traditional cocoa agroforestry. A better understanding of the trade-offs and synergies between the ES these systems provide, can serve to increase yields while supporting other ES of cacao ‘Nacional’ agroforests, some of which may be eligible for in payment of ES schemes.
1.2. Purpose of the study The aim of this study is to assess ES in fine flavor cocoa agroforests in Ecuador in order to identify trade-offs and synergies between them. The ES that will be measured (with associated indicators in parentheses) are productivity (cocoa yield), soil quality (visual soil analysis), disease control (disease incidence), climate change mitigation (carbon storage by shade trees), and biodiversity (shade tree diversity). Furthermore, this study aims to characterize the shade tree complexity of these systems (shade tree density, diameter and diversity) and management, and look for their influence on ES provision. Based on the literature review presented in the introduction, I hypothesize the direction of the interactions between ES in Figure 3.
1.3. Research questions 1. What levels of ecosystem services (productivity, soil quality, disease control, carbon storage
and biodiversity) do the studied cocoa agroforestry farms support? 2. What is the relation between the levels of ecosystem services supported and the following
characteristics of the farms? a. Shade tree density, diameter and diversity b. Management practices
3. Which are the identifiable trade-offs or synergies between the measured ecosystem services?

19
Figure 3. Hypothesized directions of the interactions between the measured ecosystem services. Biodiversity refers to shade tree biodiversity.
Diseasecontrol
Carbonstorage
Soilquality
Biodiversity Productivity

20

21
2. Methodology 2.1. Study site The study was carried out in the province of Manabí, one of the main cocoa-producing regions of Ecuador. The province is located in northwestern Ecuador, next to the Pacific Ocean. It belongs to the biogeographic zone Tumbes-Chocó-Magdalena, a global biodiversity hotspot. Precipitation varies across the year defining two main seasons, a wet and a dry season (Figure 4). Around 70% of the precipitation occurs in the wet season, between December and May, with highest intensity in February. The dry season goes from June to October, and rainfall ceases or very sporadic light rains of short duration can occur. Mean temperature is 25 degrees Celsius with low monthly variation (Figure 4). Altitude varies in the province from 0 to 840 meters above sea level (m.a.s.l.), a low altitude Coastal Range is present with most peaks between 500-600 m.a.s.l.
Figure 4. Climate of the Manabí province, Ecuador. Mean monthly precipitation (left): the blue area represents
normal values and green bars values for 2018. And mean monthly temperature (right): blue bars show normal values and the red line values for 2018. Source: Sistema de Información Agrícola y Agropecuaria (2018).
2.2. Fieldwork and farm selection Fieldwork was carried out between mid-December 2018 and mid-February 2019. Forty farms associated to the cooperative Corporación Fortaleza del Valle (CFV) were sampled, as explained below. CFV is a smallholder farmers’ cooperative with more than 900 members across Manabí. They produce certified organic and fair-trade fine flavor cocoa of the ‘Nacional’ variety.
Farms were selected to represent the variation in yield and when possible the variation in shade levels. Yield data and field supervisor’s records for 2017 (n=541) were provided by CFV. To ensure the measurement of cocoa stands we excluded the farms reported to have less than 50% of their farms planted with cocoa. And to exclude the effect of too serious yield limiting and reducing factors we excluded the farms of the lower half (Q1 and Q2) of the yield distribution. From both the 3rd and 4rd quartile, 60 farms were randomly selected. From both these subsamples, 20 farms with similar agroecological conditions were selected, based on advice from CFV field supervisors and based on practical considerations (e.g. distance, accessibility). Figure 5 shows the geographical location of the sampled farms.
2018 2018

22
Figure 5. Geographical location of the visited farms within the Manabi provice, Ecuador. Source: Corporación Fortaleza del Valle, 2018.
2.3. Shade tree measurements Blaser et al. (2018) report that the effect of the percentage of canopy cover can also be represented by shade tree density and diameter at breast height. Canopy cover is difficult to assess, and might not accurately represent the provision of ES by shade trees (Waldron et al., 2015, 2012). Thus, shade tree density and diameter at breast height were measured. To do so in a time effective matter, we used a sampling method called Variable Area Transect (VAT) (Sheil & Sidiyasa, 2003). Nath, Pélissier, & Garcia (2010) assessed the efficiency and accuracy of this method compared to square plots to sample tree density and diversity in tropical agroforestry systems. They found that VAT was more suitable to measure tree density and diversity because it requires less effort (man-hours) while it increases the information collected per unit of effort.
A graphical representation of VAT is presented in Figure 6. The VAT method works by stablishing a baseline of known length, then cells with variable lengths are stablished at both sides of the baseline by counting the number of trees until a predefined number is reached. The distance from the baseline to the last tree is taken as the width of the cell. In this way the area of each cell is determined, and tree density is calculated. The description of the criteria used is detailed in Table 1. A 30 m baseline with marks every 10 m was established on each farm, the transect was placed randomly avoiding the borders of the plots to consider border effect. In the few cases in which the farm included several plots, the plot was chosen to best represent the general characteristics of the farm or based on the easiness of access.

23
Figure 6. Variable Area Transect example design. This figure shows eight variable cells 10 m wide that extend from the 40 m transect line. All distances are defined horizontally, each cell captures five trees, or less (rmax), and the distance to the most distant tree included (filled in the figure) is recorded. The maximum distance to
search in each cell before deciding it is “empty” is 15 m (Lmin ). The maximum distance to search before collecting 5 trees is 20 m (Lmax). Taken from Sheil & Sidiyasa (2003).
Table 1. Defined values of guiding criteria for the Variable Area Transect.
Criteria Defined value Baseline 30 m Cell depth 10 m rmax 5 trees (cocoa and shade separately) Lmin 15 m Lmax 20 m
The number of cocoa and shade trees in each cell was registered and their density assessed. Diameter at breast height DBH (1.30 m) was measured for shade trees and diameter at 0.30 m (D30) was registered for cocoa trees. Shade tree diversity was also determined (see section 3.5.5.).

24
2.4. Plot characterization and management Semi-structured interviews were conducted with the farmers managing the farms to collect the information described in Table 5 of Annex I. Information was collected on plot characterisation (land history, cocoa tree age, density and planting pattern), plot management (irrigation, soil fertility, pruning, pest and disease management) and shade trees (number, density, management, use). The collected data was recorded in a notebook and then tabulated into an excel sheet. Audio recordings of the interviews were made as backup.
2.5. Measurement of ecosystem services Indicators for each ES were chosen based on literature (see introduction). Here I describe the methods to measure five ES: productivity (cocoa yield), soil quality (visual soil analysis), disease control (disease incidence), climate change mitigation (carbon storage by shade trees), and biodiversity (shade tree diversity). Table 2 gives an overview of the indicators and their units.
Yield Yield data for the sampled farms (n=40) and from all the members of the cooperative (n=748) from 2015 to 2018 was collected from Corporación Fortaleza del Valle. Yield was expressed as kg of dry beans per hectare using the conversion factor used by the cooperative (0.3846 dry beans per unit of wet beans). Farms without farm size data were excluded from the analysis.
Disease incidence
Using the transect baseline for cocoa and shade tree measurements, cocoa trees were examined for presence or absence of the two most important diseases in the region: moniliasis (Moniliophthora roreri) and witches’ broom disease (Moniliophthora perniciosa). The number of trees with disease symptoms was counted to obtain the percentage of diseased trees. The level of infection for each tree was assessed by counting the number of infected branches for witches’ broom (Figure 7) and of infected pods for moniliasis (Figure 8), and visually evaluating the infection compared to healthy structures. Levels of infection were defined as high (>70%), medium (<70% and >30%) and low (<30%).
Figure 7. Cocoa branches infected by witches’ broom disease (Moniliophthora perniciosa). A young infected branch
is shown in the left and a necrotized infected branch is shown in the right. Source: http://gubiler.blogspot.com

25
Figure 8. Pods infected by moniliasis (Moniliophthora roreri), external (left) and internal (right) evidence of infection.
Soil quality Three soil samples were taken per farm, randomly distributed across the transect baseline. Each sample was taken using a spade to collect a piece of soil of 20 x 20 x 25 cm (length, width, depth). A visual soil field assessment tool developed by Bunning et al. (2011) was used to assess soil quality. Additionally, visual soil descriptors were recorded quantitatively whenever possible (Leeuwen et al., 2018). Table 2 lists the indicators assessed and their units. The sampling process is illustrated in Figure 18 of Annex II.
Table 2. Overview of indicators measured and calculated for each ecosystem service.
ES measure Indicator Units
Productivity Cocoa yield kg ha-1 yr-1
Disease control Moniliasis
Witches broom
% infected cocoa trees
level of infection (low, moderate, high)
Soil quality Context information slope soil cover rough surface hard crust soil surface cracks moisture level Soil structure depth of first horizon type of pedality size biggest aggregates
degrees of inclination % score (poor, good, moderate) presence/absence presence/absence score (dry, moist, wet) cm type of aggregates cm

26
aggregate size distribution % grade of pedality consistency of aggregates tillage pan presence aggregate size distribution Soil life # earthworms # roots rooting depth Soil texture texture first horizon texture second horizon Soil color
% score (weak, moderate, strong) score presence/absence score (poor, moderate, good) number of earthworms number of roots cm texture class texture class Munsell color code (horizon 1 and 2) Munsell color (horizon 1 and 2)
Carbon storage Aboveground biomass of cocoa and
shade trees
t dry matter ha-1
t C ha-1
Biodiversity Shade tree diversity species richness ha-1
Carbon storage Standing aboveground biomass (AGB) was calculated for both shade trees (woody trees, banana, palm trees) and cocoa trees, based on measured density and DBH (section 3.3.) The allometric equations used are listed in Table 3. Carbon storage was calculated from AGB by using the conversion factor of 0.475, a general estimate of the amount of carbon in dry matter.
Table 3. Allometric equations used for aboveground biomass (AGB) calculations. DBH is diameter at 1.30 m and D30 is diameter at 0.30 m height
Type Equation Source
Cocoa 𝐴𝐺𝐵 = 10(().+,-.,.+/∗123(456)) Andrade et al. (2008)
Woody trees 𝑙𝑜𝑔(𝐴𝐺𝐵) = −0.834 + 2.223 ∗ log(𝐷𝐵𝐻) Segura et al. (2006)
Banana 𝐴𝐺𝐵 = 0.03 ∗ 𝐷𝐵𝐻2.13 Noordwijk et al. (2002)
Palm trees ln(𝐴𝐺𝐵) = −3.3488 + 2.7483 ∗ ln(𝐷𝐵𝐻) Goodman et al. (2013)
Biodiversity In each transect the diversity of shade trees was measured by identifying the different species and their frequency. This was done through farmers’ experience by asking the name of the tree to the farmer. Common names were linked to scientific names based on literature. In the case identification through common names was not possible, photographs were taken and the species were identified to the lower taxonomic level possible.
2.6. Data analysis First, collected data was used to calculate indicator values. Then, exploratory and descriptive data analyses were carried out to find patterns and possible outliers among the data. Next, graphs and statistical analyses were done using R 3.3.3 (R Core Team, 2017). Bar and boxplot graphs were created

27
to describe the levels of ES provision of the sampled farms using the package ‘ggplot2’ (Wickham, 2016). The scripts used to produce the graphs are presented in Annex VI.
In order to identify the effect of management, shade characteristics, and the interaction with other ES, multiple linear regression analyses were performed for each ES (‘stats’ package). Regression models were created for each ES based on theoretical background: the hypothesized interactions between ES (Figure 3), the expected influence of management practices and the expected influence of shade characteristics. Because of the small size of the sample, the regression models were built to include between four to six explanatory variables. For each ES, regression models with different combinations of variables were tested. The best explanatory variables were chosen based on the Akaike Information Criterion (AIC) and the amount of variance explained by the model compared to other tested models. In this way, the best model to explain the variance of each ES was selected, and the explanatory variables that contribute the most to explain the variance were identified.
For each regression model, an analysis of outliers and influential cases was carried (‘stats’ package) by examining standardized residuals, Cook’s distance, leverage and covariance ratios. Outliers were excluded from the analysis when there were reasons to support they represented different conditions or were a result of measurement error.
The assumptions for linear regression were tested in the following way. Independency of errors was assessed with the Durbin-Watson test of the ‘lmtest’ package (Zeileis & Hothorn, 2002). Multicollinearity was explored using the Variance Inflation Factor (VIF) of the ‘car’ package (Fox & Weisberg, 2011) and tolerance (1/VIF). Assumptions of residuals were tested through exploration of residual plots and using the following tests: Breusch-Pagan test for homoskedascity (‘car’ package) and Shapiro-Wilk test for normality of error distribution (‘stats’ package). Finally, a global validation of linear regression model assumptions was carried using the package ‘gvlma’ (Pena & Slate, 2019).
When a regression model did not fulfill one or more assumptions, a non-parametric bootstrap analysis with 2000 replicates was performed using the package ‘boot’ (Canty & Ripley, 2019). Robust 95% confidence intervals were created and compared to the confidence intervals of the linear regression model. The script used for linear regression analysis and tests is presented in Annex V.

28

29
3. Results As mentioned earlier, this research aims to look for trade-offs and synergies between ecosystem services in fine flavor cocoa agroforestry systems. In this section I start by characterizing the management practices and shade characteristics of the farms. Next, I present the levels of ecosystem service provision found for yield, disease regulation, soil quality, carbon storage, and biodiversity. Finally, I describe the significant interactions found between ecosystem services, management practices, and shade characteristics.
3.1. Characterization of the farms and management practices The sampled farms are classified as small family farms, they have an average size of 5.42 hectares (𝜎= 6.20) and the mean area dedicated to organic cocoa plantation is 2.46 ha (𝜎= 1.42). Cocoa was the only crop in 52.5% (21) of the farms, while 47.5% (19) also had other land use including pasture, citrus fruit trees, and short cycle crops like maize, cassava, plantain, rice, beans, etc. Two farmers reported conventional cocoa production. All of the farms cultivated the ‘Nacional’ cocoa variety, and 12.5% of the farmers specifically reported the use of the improved ‘Nacional’ clones EET-103 (4) and EET-105 (1). Improved clones were always mixed with older non-characterized cultivars of ‘Nacional’.
Farmers were asked about the age of the cocoa trees. Up to four age groups of cocoa plants were recorded for each farm, but it was not possible to obtain information about the number of trees of each age. Cocoa tree age ranged from 1 to 100 years. Figure 9 shows the distribution of the minimum and maximum age of cocoa trees, in average the minimum age of cocoa plants was 10.7 years (𝜎=10.6), while the average maximum age was 45.1 years (𝜎= 31.9).
Figure 9. Minimum and maximum ages of cocoa trees obtained from farmer interviews for each farm (n=40). The
diamond represents the mean.
The relevance of the diseases measured in this study was corroborated through the interviews; 65% (26) of the farmers ranked moniliasis and witches’ broom as the two main pest and disease problems. Additionally, 75% (30) of the farmers ranked moniliasis as the most important disease that affected them and 60% (24) ranked witches’ broom in the second place. Other pests and diseases reported in

30
order of importance were squirrels, a parasitic plant referred to as comida de pájaro, and unidentified insects. Most of the farmers reported to manage moniliasis and witches’ broom by manually removing infected pods and branches, primarily during harvest.
Pesticides were not regularly applied in any of the studied farms, 17.5% (7) farms reported a one-time application of Bordeaux mixture (fungicide), which was part of an extension program carried out by the Ecuadorian government in the years 2015 and 2017. As members of an organic certified cooperative, the farmers are not allowed to use agrochemicals, however they did not practice any type of organic pest-management.
Organic compost was the main type of fertilizer applied, 60% (24) of the farmers applied organic compost provided by CFV, the rest of the farmers did not apply any type of fertilizer. Only two farms also included other type of fertilization, one applied green manure and cow manure, and the other farm used chicken manure. Half of the farmers who used fertilization applied it only one time, the other half did it once a year. In average farmers applied 362 kg ha -1 (𝜎=319) of organic compost, this average includes the farmers that applied regularly and only once.
Regarding cocoa pruning, 87% (35) of the farms performed maintenance pruning; 62.5% (25) pruned regularly and on average 1.18 times per year (𝜎=0.68) whereas 25% (10) pruned their cocoa in only one occasion ever. In most of the cases pruning was done by external laborers from CFV or provided by the Ministry of Agriculture MAG.
Irrigation was used during the dry season by 45% (18) of the farms for an average of 4.5 months (𝜎=1.57) and a mean frequency of 1.9 times per month (𝜎=1.25). Most of the farms (16) used well water as a source, while two farms used river water and one used a swamp. The most used method of irrigation is flooding (13) followed by manual irrigation with hose (4) and sprinkler irrigation (1). It is interesting to note that 8 additional farms used to have irrigation from the regional system, which stopped since the system was damaged by the earthquake of 2016.
Finally, farmers were asked to list other perennial species they keep in the farm. The farmers reported an average of 15 species (𝜎=7.61) which were used primarily for food (mainly fruit), timber and firewood. A total of 73 different species (or varieties) were reported by all the farmers, a list can be found on Table 6 of Annex III.
3.2. Shade characteristics A fundamental feature of cocoa agroforestry systems is their variation in complexity. Shade structure is especially important to characterize the complexity of CAFS. As this study was conducted, it became obvious that, because of very clear differences, shade should be separated between banana and woody trees (onwards referred to as “trees”). Figure 10 shows the variation in the density of cocoa, banana and trees. Cocoa density was in average 848.8 trees ha-1 (𝜎=280.6). In total, shade showed a mean density of 459.6 trees ha-1 (𝜎=379.4), from which banana was planted in an average density of 306 trees ha-1 (𝜎=385.18) and trees at a mean density of 153.4 trees ha-1 (𝜎=126.7). One farm had a banana density of over 2000 trees ha-1, which is around five times higher than its density of cocoa trees.
The trunk diameter of shade and cocoa was also registered. For cocoa, the diameter at 30 cm height was in average 18.7 cm (𝜎=5.75). Whereas the diameter at breast height DBH (1.30 cm) of shade was

31
in average 9.9 cm (𝜎=3.9) for banana and 22.7 cm (𝜎=14.09) for trees. The species diversity of shade is detailed in the next section.
Figure 10. Density of cocoa, banana and trees in the sampled farms (n=40). The diamond represents the mean.
3.3. Provision of ecosystem services As expected, the studied cocoa farms support varying levels of ecosystem services. As shown in Figure 11 the farms have an average cocoa yield of 282 kg ha-1yr-1 (𝜎=153.7). Moreover, yield changes through the year in accordance with precipitation (Figure 4), during the dry season (Jun-Sep) most of the farms have none or very low harvest. The peak yield is achieved between January and April, but also the highest variation in yield among farms is evident in this period.
Figure 11. Mean cocoa yield per year (2015-2018) of the sampled farms (n=39). The diamond represents the mean.

32
Figure 12 shows the difference between the mean yield of the sampled farms and a total of 756 farms belonging to CFV. As can be seen, the sample yield considerably resembles the cooperative farms’ yield. The biggest difference is found in the months of January, February and March. However, the high standard deviation suggests this is an effect of outliers, which were excluded when the sample farms were selected.
Figure 12. Monthly cocoa yield. Above: average yield per month (2015-2018) for the sampled farms (n=39). Below:
comparison of average monthly yield (2015-2018) between the sampled farms in blue (n=39) and the farms from
CFV in red (n=756), error bars show the standard deviation.
Regarding disease regulation, Figure 13 reveals that both diseases were present in almost all the farms, but most of the trees were not infected by moniliasis (�̅�= 60%) or had a low infection level by witches’ broom (�̅�= 51%). Overall, only three farms were not infected by moniliasis, whereas all the farms were infected by witches’ broom. The mean percentage of infected trees per farm was 39% (𝜎=22.7) for moniliasis and 87% (𝜎=15.8) for witches’ broom. Witches’ broom disease was more prevalent in severe infection levels than moniliasis. The percentage of trees with high infection level was in average 6% for moniliasis and 16% for witches’ broom.

33
Figure 13. Variation in disease infection levels by moniliasis (n=35) and witches’ broom (n=40) among the sampled
farms. The diamond represents the mean.
Biodiversity was measured as the species richness of shade species across the farms. As illustrated by Figure 14, the number of species ranged from one to eleven, the farms had in average 5.6 species of shade trees. In general, the farms with low diversity were dominated by banana trees, and the farms with high diversity were dominated by fruit and timber trees.
Carbon storage by the farms was in average 65.5 t C ha-1(𝜎= 54.6). Displayed in Figure 15 is the carbon storage by cocoa trees (�̅�= 41 t C ha-1, 𝜎= 51.2), and shade divided by trees (�̅�= 24.4 t C ha-1, 𝜎= 21.2) and banana (�̅�= 0.11 t C ha-1, 𝜎= 0.17). It is evident that both cocoa and shade trees contribute to carbon storage, while banana has a very low contribution.

34
Figure 14. Variation in number of shade species across farms (n=40). The diamond represents the mean.
Figure 15. Carbon storage by cocoa, shade trees and banana across farms (n=40). The diamond represents the mean.

35
Figure 16. Soil quality indicators and their distribution across farms (n=40).
Finally, soil quality was assessed through a series of indicators (Table 2). Figure 16 presents the results of selected soil indicators that inform about soil life and structure. The number of earthworms, roots and the rooting depth serve as a proxy for soil life and indirectly for soil structure. In average farms had 4 earthworms (𝜎= 3.9), 110 roots (𝜎= 55.7), and a mean rooting depth of 31 cm (𝜎= 3.7). Soil structure is reflected by the aggregate size distribution score and the percentage of big aggregates, and from Figure 16 it is evident that both indicators are related. 27.5% of the farms were scored as good for aggregate size distribution, 55% as moderate and 17.5% as poor. Regarding the distribution of soil texture in the sampled farms, most of the farms have a fine clay soil texture (52.5%), followed by heavy clay (20%), clayey loam (7.5%), silty loam (5%) and sandy loam (5%), other soil textures where not found.
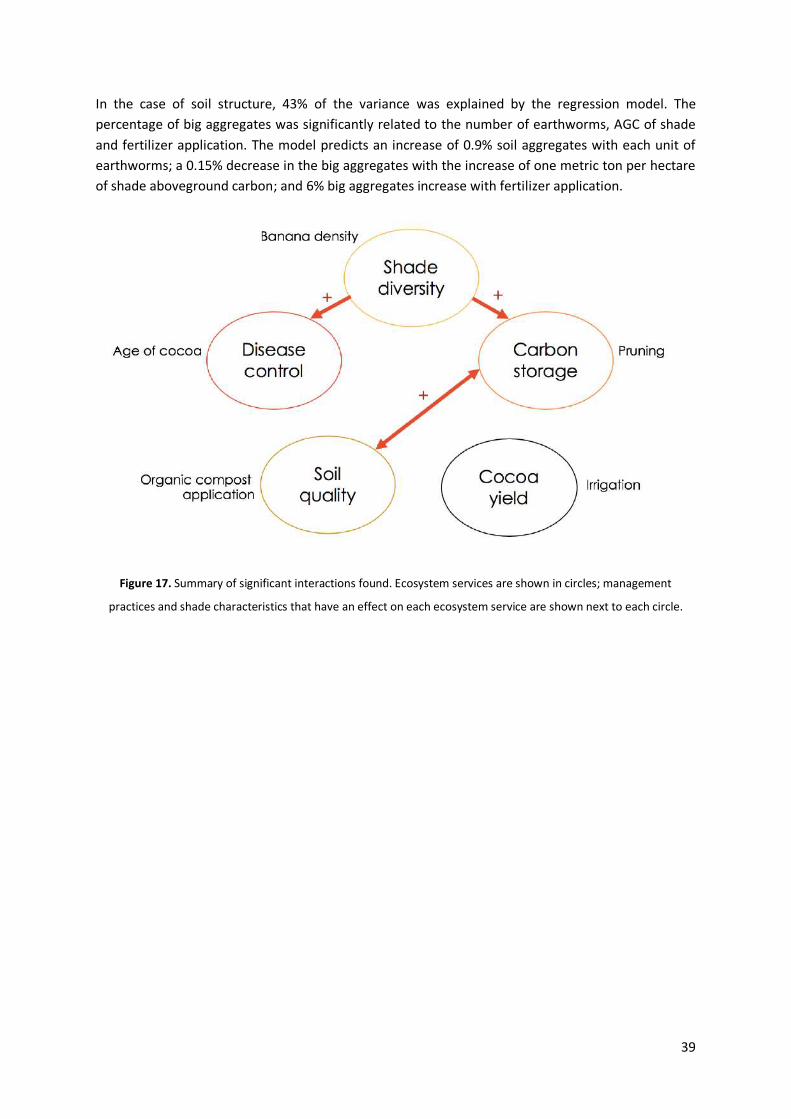
3.4. Interactions between ecosystem services, management practices and shade
The results of the multiple linear regression analyses are presented in Table 4. Figure 17 gives a summary of the significant interactions found. As it was explained in the methodology, the explanatory variables included in each model were selected because of their contribution to explain the variance of the response variable. In some cases, variables that theoretically would contribute to

36
explain an ecosystem service are not included in the model, this is because they were included while selecting the models but were not contributing to explain the variance, and thus they were excluded to give space for variables that did.
Table 4. Results from multiple regression analyses for each ecosystem service. F = F statistic, B = regression
coefficient, SE B= standard error of B, β = standardized regression coefficient. R2 F B SE B β t p Yield 0.53 7.53 ***
irrigation (times yr-1) 13.57 3.97 0.43** 3.42 < .01 big aggregates (%) 2.36 1.54 0.22 1.53 .135 earthworms (n) 9.26 5.23 0.24 1.77 .086 witches’ broom control (%) 1.10 0.80 0.17 1.38 .176 fertilizer applied last year (kg ha-1) 0.08 0.07 0.15 1.14 .264 Disease control: witches’ broom (%) 0.29 2.64*
mean age of cocoa -0.78 0.23 -0.57** -3.32 < .01 shade diversity (n species) 3.37 1.53 0.35* 2.20 < .05 big aggregates (%) 0.55 0.36 0.26 1.56 .128 cocoa density (tr ha-1) -0.01 0.01 -0.18 -1.00 .325 pruning (y/n) -2.63 13.04 -0.03 -0.20 .841 Disease control: moniliasis (%) 0.46 4.00**
D30 cocoa (cm) -1.45 0.61 -0.43* -2.37 < .05 fertilizer applied last year (kg ha-1) -0.02 0.01 -0.39* -2.67 < .05 pruning (y/n) -27.78 13.02 -0.36* -2.13 < .05 number of roots 0.10 0.05 0.32* 2.27 < .05 cocoa density (tr ha-1) 0.03 0.01 0.41* 2.10 < .05 shade density (tr ha -1) 0.01 0.01 0.20 1.27 .214 Aboveground carbon: cocoa 0.28 2.53*
shade density (tr ha -1) 0.01 0.01 0.28 1.77 .086 pruning (y/n) -22.44 10.47 -0.33* -2.14 < .05 irrigation (times yr-1) -0.63 0.59 -0.17 -1.06 .296 big aggregates (%) -0.21 0.20 -0.16 -1.06 .299 number of roots 0.04 0.05 0.11 0.73 .468 Aboveground carbon: shade 0.28 3.36*
big aggregates (%) -0.62 0.22 -0.42** -2.86 < .01 depth H1 (cm) 0.82 0.57 0.21 1.44 .160 shade diversity (n species) 1.81 1.27 0.21 1.43 .161 irrigation (y/n) 7.61 6.18 0.18 1.23 .226 Diversity of shade (n species) 0.38 4.10**
banana density (tr ha -1) 0.00 0.00 -0.35* -2.10 < .05 tree density (tr ha -1) 0.01 0.00 0.28 1.95 .060 cocoa density (tr ha -1) 0.00 0.00 -0.27 -1.69 .100 number of earthworms 0.12 0.09 0.2 1.42 .165 rooting depth (cm) 0.15 0.09 0.22 1.58 .123

37
R2 F B SE B β t p Soil life: number of earthworms 0.28 2.60*
big aggregates (%) 0.11 0.04 0.40* 2.66 < .05 max. age of cocoa 0.03 0.02 0.27 1.70 .098 total aboveground carbon (Tm ha-1) -0.01 0.01 -0.14 -0.86 .395 shade diversity (n species) 0.15 0.24 0.09 0.61 .547 pruning (y/n) 1.00 2.14 0.07 0.47 .644 Soil structure: big aggregates (%) 0.43 4.94**
number of earthworms 0.90 0.38 0.32* 2.39 < .05 shade aboveground carbon (Tm C ha-1) -0.15 0.07 -0.29* -2.16 < .05 cocoa density (tr ha -1) 0.01 0.01 0.27 2.01 .053 fertilizer application (y/n) 5.96 2.92 -0.27* 2.05 < .05 number of roots -0.03 0.03 -0.17 -1.29 .207
The variables included in the models for management practices are irrigation, fertilizer application, pruning, age of cocoa, and cocoa density. To represent shade characteristics the variables shade density (banana and trees) and shade diversity were included. Finally, ecosystem services were represented as cocoa yield, aboveground carbon of cocoa and shade, diversity of shade species, the percentage of big aggregates to represent soil structure and the number of earthworms to represent soil life. For the case of disease, I used a variable named disease control because of the following reason. As it is shown in Figure 13 the percentage of infected farms was very high for both witches’ broom and moniliasis, but most of the trees were not infected or had low infection levels. Based on this result, I concluded that the prevalence of disease is not a good indicator for the ecosystem service of disease control and regulation. The incidence of trees not infected and with low infection level better reflects the effect of a disease on each farm. For the sake of ease, I call this variable disease control. Disease control is the added percentage of trees not infected and with low infection level of each farm. It is important to note that by using this term I do not imply that disease prevalence is a result of disease control, as I have no evidence to support this fact.
One observation (farm id = 30) considered an outlier was excluded from the regression analysis of the percentage of big aggregates and witches’ broom disease control. Additionally, other two farms (farm id=23, 32) were excluded from the aboveground carbon model for cocoa.
All of the regression models met the assumptions of multiple linear regression except two, which did not meet all of the assumptions of the residuals. These were the model for moniliasis disease control and for number of earthworms. Residual inspection plots for each model are presented in Annex IV. The model for moniliasis disease control did not meet the assumptions of homoskedascity, normal distribution of errors, and linear relationship between x and y variables. The model for number of earthworms did not meet the assumptions of normal distribution of errors, and linear relationship between x and y variables. The results from both models must be interpreted carefully.
Irrigation was the only significant predictor of yield, where yield is predicted to increase 14 kg yr -1 ha-
1 with the increase of one irrigation event per year. In total 53% of the variance of yield was explained by the model. The amount of organic compost applied was the other management practice that

38
contributed to this model. Soil quality and disease control contributed to explain the variance of yield. Soil quality was represented by the percentage of big aggregates (soil structure) and the number of earthworms (soil life).
For witches’ broom disease control, the regression model explained 29% of the variance. The mean age of cocoa showed a significant negative effect, the model predicts that for every one-year increase in the mean cocoa age, there will be a 0.78% decrease in witches’ broom control. Additionally, shade diversity is predicted to have a significant positive effect. In this case, the increase of one species of shade is expected to cause a 3% increase in witches’ broom control. Soil structure (% big aggregates), cocoa density, and pruning also contributed to explain the variance in witches’ broom disease control but were not significant.
On the other hand, 46% of the variance of moniliasis disease control was explained by the model. Five variables had a significant effect: pruning, cocoa trunk diameter (D30), number of roots in the soil, fertilizer application, and cocoa density. The model predicts a negative effect of pruning, cocoa trunk diameter, and fertilizer application on moniliasis disease control. And it predicts a positive effect of soil life (number of roots) and cocoa density on moniliasis control. Shade density contributed to the model but had no significant effect.
Cocoa density was not significantly correlated to cocoa AGC. This result is explained by the negative correlation between cocoa density and trunk diameter (R= -0.58, p < .001). The regression models explained 28% of the variation of aboveground carbon (AGC) for cocoa and 28% for shade. Age was excluded from the model because the best representation of coco age is trunk diameter, and this variable is used to calculate AGC. In the case of cocoa, pruning was the only significant factor; a decrease in 22.4 t C ha-1 yr-1 is predicted when cocoa is pruned. Shade density, irrigation and soil quality (% big aggregates and number of roots) contributed to the model but were not significant. In the case of shade AGC, soil structure was the only significant variable. The model predicts that for each unit increase in the percentage of big soil aggregates, a decrease of 0.6 t C ha-1 yr-1 in shade AGC is expected. Shade diversity, irrigation, and the depth of the first horizon also contributed to this model but were not significant.
Shade diversity – a measure of biodiversity – was significantly determined by banana density, both variables are also significantly correlated (R = -0.36, p <.05). The linear model explained 38% of the variance of shade diversity. Non-significant variables that contributed to the model are shade tree density, cocoa density and soil quality (number of earthworms, rooting depth). Even though shade tree density was not a significant predictor in the linear regression model, it is highly correlated to shade diversity (R = 0.40, p<.01).
Two variables were chosen to represent soil quality: soil life and soil structure respectively represented by the number of earthworms and percentage of big aggregates. In the case of earthworms, the regression model explained 28% of the variance, and the percentage of big aggregates was the only significant variable. The regression analysis predicts that for every increase of 1% of big aggregates, the number of earthworms increases by 0.11. Non-significant variables that contribute to this model were the maximum age of cocoa, shade diversity, pruning and total aboveground carbon.
39
In the case of soil structure, 43% of the variance was explained by the regression model. The percentage of big aggregates was significantly related to the number of earthworms, AGC of shade and fertilizer application. The model predicts an increase of 0.9% soil aggregates with each unit of earthworms; a 0.15% decrease in the big aggregates with the increase of one metric ton per hectare of shade aboveground carbon; and 6% big aggregates increase with fertilizer application.
Figure 17. Summary of significant interactions found. Ecosystem services are shown in circles; management
practices and shade characteristics that have an effect on each ecosystem service are shown next to each circle.

40

41
4. Discussion The goal of this study was to describe the level of ecosystem services provided by fine flavor cocoa agroforestry systems in Ecuador, relate them with farm management and shade characteristics, and look for trade-offs and synergies between ES. The results support some of the hypothesized interactions between ecosystem services (Figure 3) and are not conclusive regarding other hypothesized interactions. Regarding the effect of management practices: irrigation, pruning, and age of cocoa trees significantly influenced the provision of ecosystem services. With respect to shade characteristics, banana density showed significant effects on ecosystems services. Contrary to what was expected, no significant effect of woody tree density was found. Here I discuss the statistically significant evidences for trade-offs and synergies between ecosystem services and significant evidence of the influence of management and shade characteristics on the studied CAFS. Additionally, I discuss the role of non-significant variables that contributed to explain the variance of each ecosystem service. And finally, I explore possible explanations for why expected interactions were not found.
The management practices presented here indicate that although the studied farms are organically certified, most of their management practices are organic by default. Farm management practices are in general not consistent, and may have limited effects on cocoa yield and other ecosystem services.
Cocoa yield Sánchez-Mora et al. (2015) report cocoa yields of around 550 ha-1 yr-1 for selected clones of ‘Nacional’ cocoa cultivated in full-sun field trials with intensive management (use of herbicide, synthetic fertilizer application, pruning, irrigation during the dry season) in Ecuador. The farms studied here are organically cultivated and show a mean yield of 282 kg ha-1 yr-1 (𝜎=153.7). Considering that the management practices of the studied farms are generally limited, the difference with the studied farms is lower than could be expected, and three farms outperform the field trials. ‘Nacional’ cocoa is believed to grow better under moderate shade, this could explain why the full-sun field trials showed lower yields that some farms.
The sampled farms with yield higher that the field trials were managed with consistent irrigation, compost application and pruning. These farmers performed pruning twice a year. Additionally, two of the farms were owned by resource endowed individuals and managed by paid workers (farm id= 26, 37), while the other farm (farm id= 30) was managed by a farmer with a long work experience in greenhouse cultivation and a high level of agronomic knowledge. The farmer of farm 30 was the only one who used other fertilization practices. He applied a high amount of organic compost (1080 kg ha-
1) together with cow manure and green manure, these are common practices of organic agriculture. Moreover, the three farms had a cocoa density close to the one of the field trials (1111 trees ha-1). These suggests that the improvement in the organic management of ‘Nacional’ cocoa could have important implications to increase yield. Optimal organic management might reach similar or even higher yields than conventionally cultivated cocoa of the same variety.
Irrigation was the only significant factor influencing yield, this result is to be expected given that cocoa is a drought sensitive crop (Carr & Lockwood, 2011). From the monthly variation in yield (Figure 12) we can see that it is highly influenced by rain seasonality (Figure 4). Farmers apply irrigation during the dry months, and thus it increases yield by reducing the water stress of the cocoa plants. Various studies reviewed by Carr & Lockwood (2011) report that well managed irrigation does cause an

42
increase in cocoa production. In the regression model, irrigation was included as the number of irrigation events per year, but no information was available about the amount of water applied in each event. For this reason, the predicted increase of 14 kg of dry cocoa beans yr -1 ha-1 for each increase in irrigation event needs to be interpreted with caution. Nonetheless, this result supports the evidence that irrigation is an effective strategy to increase cocoa yield in the region. The financial feasibility of this management practice in the context of small family farmers should be evaluated before making further recommendations to farmers.
The interaction of yield with soil quality, disease control, and carbon storage was expected. Soil quality and disease control contributed to explain the variance of yield in the regression model, but their effect was not significant.
Moniliasis and witches’ broom disease infections are without a doubt yield reducing factors, however the diseases are widespread and present in almost all of the farms. This is a possible explanation for why the variance in yield was not significantly affected by both diseases. Another option is the methodology used to measure disease infection, as the temporal variation and life cycles of diseases are not considered in this study. Farmer interviews revealed that the peak moniliasis infection is between January and April, during the wet season. Our sampling was done when moniliasis was starting to peak but most of the effect was expected in March and April.
The same applies to witches’ broom disease, the first phase of the disease happens by the infection of actively growing tissues (shoots, flower cushions and pods) of the cocoa plants, which then suffer accelerated senescence as the life cycle of M. perniciosa advances (De Souza et al., 2018). Most of the new infected shoots are produced mainly during the wet season. In accordance to this fact, almost all of the shoots infected with witches’ broom assessed in this study were old and dry, showing signs of the later stage of witches’ broom infection. The measurement of temporal variation in disease infection would be a better indicator of the effect of moniliasis and witches’ broom diseases on cocoa yield.
The effect of other management practices on yield was not evident. In the case of pruning and organic compost application, this might be because such events are occasional or insufficient. 67.5% of the farmers pruned in average once a year, while the rest of the farms had only one or zero pruning events. The recommended fertilizer application for cocoa is of 1-3 kg of organic compost per plant per year (Lutheran World Relief, 2013). Farmers who used fertilization applied in average 0.42 kg (𝜎= 0.33) of compost per cocoa plant, and half of them applied fertilizer only one time ever. For these reasons, the effect of pruning and fertilizer application on yield could be too small to measure or inexistent.
Blaser et al. (2018) and Waldron et al. (2012) report a trade-off between yield and canopy cover. Our results show no evidence of a relationship between both variables. Waldron et al. (2012) suggest a tipping point of 144 shade trees ha-1 (excluding banana) in which the best yield is achieved in similar CAFS from Ecuador. The density of shade trees (excluding banana) from the sampled farms ranges from 0 to 538 trees ha-1 with an average of 153 trees ha-1. The three farms with the highest yields (>600 kg dry beans ha-1) had 67, 112 and 172 shade trees ha-1, two of these farms have shade densities that closely resemble the tipping point proposed by Waldron et al. (2012). In spite of the variation in shade tree density the sampled farms represent, we found no significant relation between shade tree density and yield. This result supports the viability of maintaining high yields with some level of shade tree density. Nonetheless, our results also suggest that management practices might have a higher

43
effect on yield than shade tree density, and thus a selection of farms with more homogeneous management could better reflect the influence of tree density on yield.
Disease control The mean age of cocoa had a significant negative effect on witches’ broom disease control, in other words lower witches’ broom incidence is associated with younger cocoa trees. Spaggiari Souza et al. (2009) also found an effect of cocoa age on the incidence of witches’ broom disease during a 14-year trial in Brazil. They argue that older and larger trees have more meristematic fluid, which favors the inoculum production and dissemination of witches’ broom (Moniliophthera perniciosa). The results of my research are consistent with this hypothesis. The sampled farms display a large variation in cocoa age with a range of 99 years, so the effect of old trees on witches’ broom infection could be of great importance.
Furthermore, the diversity of shade trees had a significant positive effect on witches’ broom control. The results suggest that shade diversity is highly determined by farmer management, as the trees included in the farms are there because they provide mainly fruit and timber to the farmers. Bos et al. (2007) reported the reduction of pathogenic infections with more diverse tree layers in cocoa agroforestry systems from Indonesia. There is evidence of positive effects of shade tree diversity on the diversity natural predators of cocoa pests (Schroth et al., 2000; Sperber et al., 2004). Tree species richness might be reflecting resource heterogeneity, and thus allowing more functional diversity in the agroforestry systems (Ribas et al., 2003). The results of this study support the hypothesis that tree diversity has a synergic relationship with witches’ broom disease control.
Furthermore, shade tree density has been seen to have a positive effect on disease regulation (Evans, 1981; Schroth et al., 2000), but no significant effect was found in this study. In general, banana density was negatively correlated with shade species richness (R = - 0.36, p < .05), while tree density was positively correlated with shade diversity (R = 0.40, p < 0.01). So, the diversity of shade is determined primarily by farmer management strategies. However, our results suggest that shade diversity is more important for witches’ broom disease control than shade density.
Even so, cocoa density contributed to explain the variance of disease control in the model. Spaggiari Souza et al. (2009) found higher witches’ broom infection at high cocoa density (2500 trees ha-1). This study did not find statistical significance for this relation, which can be due to the fact that most of the farms had medium cocoa density (�̅� =848.8 trees ha-1). Still, after a certain threshold an effect of cocoa density on disease infection is to be expected.
Soil structure and pruning, although non-significant, also contributed to explain the variance in witches’ broom control. Soil structure reflects soil quality, and in general might be representing plant nutrition. On the other hand, pruning can help improve the microclimatic conditions for disease regulation, or it could also reflect a better control in the propagation of spores.
For the case of moniliasis many variables showed significant effects, but some of them were very small and counterintuitive. Because this model did not meet all of the assumption for multiple linear regression models, the results should be interpreted with caution. This is especially important for generalization of the model results. According to the model, cocoa trunk diameter has a negative effect on moniliasis control. As older trees have higher trunk diameters, this is consistent with the hypothesis of higher disease levels with the increase in cocoa age. Trunk diameter might represent

44
more accurately tree age as the density of trees is accounted for when calculating the average value of trunk diameter of each farm.
The practice of pruning also showed a strong negative effect on moniliasis control. Pruning is generally recommended to decrease the humidity of the cocoa stand, and prevent moniliasis. However, possible explanations for this result might be that pruning increases infection by disseminating M. roreri spores through pruning tools.
Fertilizer application, number of roots in the soil, and cocoa density showed a significant, but very small effect on moniliasis control. In the case of fertilization and soil quality (number of roots), the results indicate that plant nutrition is a key aspect of disease resistance, but as we saw before the amount of fertilizer applied in the farms is insufficient to see a large effect. The same pattern makes sense for the case of cocoa density. As with witches’ broom disease, the farms represent medium levels of cocoa density and thus the negative effect of high cocoa densities is not evident.
Finally, consistent with the case of witches’ broom, no significant effect of shade density was found on moniliasis disease incidence. But in contrary, shade diversity did not influence moniliasis control. Contrary to the results, a recent study in cocoa agroforestry systems from Panama found a significant negative effect between plant diversity and moniliasis disease incidence (Eckberg, 2017).
Our results support the hypothesis of the positive effect of biodiversity on disease control of witches’ broom. Jacobi et al. (2015) found lower infestations of witches’ broom in CAFS compared to monoculture. This study supports the idea that more complex agroecosystems have reduced disease incidence. Yet, more biodiversity-focused studies are needed to effectively determine the role of functional diversity on disease control and regulation. Studies of cocoa pests have shown that a complex network of interactions determine pest regulation through functional diversity (Bisseleua et al., 2017; Gras et al., 2016b; Van Bael et al., 2007). Determining the ecological interactions affecting fungal disease control and regulation promises to be a lot harder than with insect pests. Nonetheless, it is possible to conclude that evidence suggests that biodiversity reduces the incidence of witches’ broom disease in CAFS.
Aboveground carbon storage The farms store an average of 65.5 t C ha-1 aboveground carbon, this is an intermediate value compared to 38.3 t C ha-1 reported by Blaser et al. (2018) for CAFS in Ghana, and 103.42 t C ha-1 reported by Santhyami et al. (2018) from Indonesia. Both studies also reported aboveground carbon of 10 t C ha-1 for cocoa monoculture. In the case of Ecuador, it was estimated that an intensive full-sun cocoa monoculture stores between 8 t C ha-1 (6 years old cocoa) and 14.7 t C ha-1 (11 years old cocoa) (Fischer, 2018). The potential of carbon storage in different regions is determined by soil and climatic characteristics, thus a higher carbon storage potential is expected in tropical rainforest ecosystems compared to deciduous forest ecosystems. The semideciduous native forests close to the study area were estimated to store 33.5 t C ha-1 (𝜎=13.3) (Salas Macías et al., 2017). In comparison, carbon storage by cocoa agroforestry shows a great potential as a climate change mitigation strategy. Additionally, it is clear that cocoa monocultures store less carbon than CAFS. In order to support the maintenance of CAFS, farmers should receive payment for their role in climate change mitigation (Waldron et al., 2012). The carbon storage by CAFS found in this study can serve as a start point to explore the feasibility and mechanisms for farmers to receive a payment for the provision of this ecosystem service.

45
Cocoa density was not significantly correlated to cocoa AGC. Although it is counterintuitive, this result is explained by the negative correlation between cocoa density and trunk diameter (R= -0.58, p < .001). From the carbon stored by the studied CAFS, cocoa stores in average 62.5%, shade trees store 37.3%, whereas banana stores barely 0.2%. In accordance with Harvey et al. (2014) (Figure 2) our data shows a trade-off between CAFS with high banana density and climate change mitigation through carbon storage.
Pruning was the only significant factor that determined aboveground carbon storage by cocoa. This is an expected result as pruning reduces the biomass of the cocoa trees. Shade density, irrigation and soil quality indicators also contributed to the model. The results suggest that management practices are especially important to determine the amount of carbon stored by cocoa trees.
With respect to aboveground carbon storage by shade, soil structure was the only significant variable. In this case poor soil structure, represented by soils with a high percentage of large soil aggregates, affects negatively carbon storage. As the shade trees are not managed, the importance of soil quality makes sense because it determines the growing potential of the trees. The variables that contributed to the regression model but were not significant are rooting depth -another measure of soil quality-, the diversity of shade trees, and irrigation. These results shed light into a synergy between carbon storage and soil quality. They also suggest that improved management of shade trees can improve their growing rates and their potential for carbon storage.
In summary, CAFS are important multifunctional agroecosystems which can support high levels of carbon storage, even when compared to native ecosystems in the study region. The inclusion of high densities of banana is one of the strategies of farmers and results in lower carbon capture, but might represent higher economic benefit to the farmers.
Shade diversity I found a negative correlation of shade species richness with banana density, and a positive correlation with tree density. Banana density was the only significant variable in the linear regression model. Shade diversity was not explained by other ecosystem services. These findings show that shade tree diversity is highly determined by farmers’ strategies. Farmers who include high banana densities in their farms have a lower diversity of shade, while farmers that include higher densities of trees for fruit, timber and firewood support higher diversity.
According to the shade canopy typologies proposed by Somarriba et al. (2018) the studied CAFS classify as productive cocoa shade canopy. These systems are characterized by moderate cocoa productivity, shade tree diversity, and carbon storage. The moderate shade diversity is achieved through a few woody species or banana dominated canopies.
I hypothesized an influence of soil quality and carbon storage in shade tree diversity. The significant effect of banana density shows that the strategy of having high density of banana, translated in low carbon storage, does have an effect in the diversity of shade. On the other hand, the variables that contributed to explain the variance in shade diversity were the densities of trees and cocoa, and soil quality indicators (number of earthworms and rooting depth). These results suggest that the diversity of shade is influence by carbon storage, and by soil quality, or the other way around.

46
Blaser et al. (2018) measured the ecosystem service of biodiversity by determining the species richness of trees, ants, birds and frogs. They found a clear increase in biodiversity with increasing canopy cover. As our results point out, shade tree diversity is highly influenced by farmer management. So, measuring diversity of other taxonomical groups would give a better indication of the level of biodiversity supported by CAFS.
Soil quality This study used visual soil assessment as a methodology to assess soil quality. This approach gives a good amount of information that can be associated to the results of chemical soil analyses, and requires less resources (Leeuwen et al., 2018). The visual soil analysis proved to be a good methodology to obtain soil information like texture, soil structure and soil life. The indicators like number of earthworms, soil texture, and % of big aggregates were meaningful for this research. Nonetheless, chemical soil analyses can serve to identify more subtle differences in soil quality. A combination of both methods can be used to refine the observations and identify hidden patterns in soil quality across CAFS.
Regression analyses for soil quality showed that the number of earthworms and the percentage of big soil aggregates have a high influence on each other. Nonetheless, the direction of this influence is not as expected. Which means that soils with poor soil structure have more earthworms, however the predicted strength of the influence is quite small. Another counterintuitive result is that the increase of fertilizer application is predicted to increase the percentage of big aggregates. It is important to note that the regression model for number of earthworms did not meet all the assumptions and conclusions drawn from those results should be considered with caution.
Additionally, soil structure is projected to improve with higher aboveground shade biomass. Higher biomass of shade trees means more organic matter will be incorporated to the soil through dead plant matter in the form of litterfall, roots, etc. (Pérez-Flores et al., 2018; Tscharntke et al., 2011). This finding supports the hypothesis of a synergy between carbon storage and soil quality. No effect of shade diversity was found.

47
5. Concluding remarks The average yield of organic CAFS is closer than expected to the yield of the same variety (‘Nacional’) cultivated under conventional practices. Additionally, from all the current management practices carried by the farmers in the study area, only irrigation had a significant effect improving cocoa yield. Most of the farmers follow ‘organic by default’ management practices which can be inconsistent or insufficient to have an effect on yield. These reasons show that there is room for improvement in the organic management of the farms. Farmers from CFV would greatly benefit from support and training on common management practices of organic agriculture.
No evidence of a trade-off between shade level and yield was found in this study. This result supports the idea that high yields can be supported under complex CAFS that at the same time support other ecosystems services.
Disease incidence was positively influenced by the age of cocoa trees. Appropriate management of older cocoa trees might be an important factor to reduce the incidence of both moniliasis and witches’ broom diseases.
A synergy between diversity of shade and disease regulation in CAFS was found. Lower disease incidence in complex CAFS might be caused by greater functional diversity. However, since shade diversity is mostly determined by farmer management, the study of other taxonomic groups is necessary in order to unveil this hypothesis.
The results also support the idea that soil fertility is an important driver of disease control and regulation, as plant nutrition can reduce the vulnerability of cocoa plants to diseases. The improvement in the organic management of the farms might help improve the incidence of diseases.
Moreover, small CAFS in Ecuador contribute to climate change mitigation by storing an average of 65.5 t C ha-1. The carbon stored by the farms is comparable and might be greater than the carbon stored by native ecosystems in the area. The contribution of cocoa farmers to climate change mitigation should be paid for as an ecosystem service for common good. Additionally, some management practices like pruning, irrigation, and soil management influence carbon storage by CAFS.
In accordance to what was proposed by Harvey et al. (2014), the management strategies used by farmers influence the synergies and trade-offs in the provision of ecosystem services. When farmers plant high densities of banana trees, there is a trade-off with carbon storage and shade diversity.
Finally, the results show evidence of a synergy between soil quality and carbon storage, a positive feedback loop between both ecosystem services is to be expected. Higher soil quality leads to higher carbon storage, and higher carbon storage contribute to nutrient cycling improving soil quality.
In conclusion, this research was able to identify some of the hypothesized interactions between ecosystem services. The direction of the interactions was the same as intially hypothesized. Aditionally, specific mangement practices that influence the provision of ES were identified. The structure of shade in CAFS proved to be important; banana density and shade diversity being important factors to determine the provision of ecosystem services by CAFS.

48

49
6. References Andrade, H., Segura, M. A., Somarriba Chávez, E., & Villalobos Rodríguez, M. (2008). Valoración
biofísica y financiera de la fijación de carbono por uso del suelo en fincas cacaoteras indígenas de Talamanca, Costa Rica. Agroforestería En Las AméricasNúmero 46 (2008).
Andreotti, F., Mao, Z., Jagoret, P., Speelman, E. N., Gary, C., & Saj, S. (2018). Exploring management strategies to enhance the provision of ecosystem services in complex smallholder agroforestry systems. Ecological Indicators, 94, 257–265. https://doi.org/10.1016/j.ecolind.2018.06.048
ANECACAO. (n.d.). Cacao ecuatoriano es reconocido como producto fino de aroma. Retrieved November 3, 2018, from http://www.anecacao.com/es/noticias/cacao-ecuatoriano-es-reconocido-como-producto-fino-de-aroma.html
Anglaaere, L. C. N., Cobbina, J., Sinclair, F. L., & McDonald, M. A. (2011). The effect of land use systems on tree diversity: Farmer preference and species composition of cocoa-based agroecosystems in Ghana. Agroforestry Systems, 81(3), 249–265. https://doi.org/10.1007/s10457-010-9366-z
Asase, A., & Tetteh, D. A. (2016). Tree diversity, carbon stocks, and soil nutrients in cocoa-dominated and mixed food crops agroforestry systems compared to natural forest in southeast Ghana. Agroecology and Sustainable Food Systems, 40(1), 96–113. https://doi.org/10.1080/21683565.2015.1110223
Avelino, J., ten Hoopen, G. M., & DeClerck, F. A. J. (2012). Ecological mechanisms for pest and disease control in coffee and cacao agroecosystems of the neotropics. In Ecosystem Services from Agriculture and Agroforestry (pp. 125–152). Routledge.
Barrios, E., Sileshi, G. W., Shepherd, K., & Sinclair, F. (2012). Agroforestry and soil health: linking trees, soil biota and ecosystem services. In Soil ecology and ecosystem services (pp. 315–330). Oxford University Press Oxford, UK.
Barrios, E., Valencia, V., Jonsson, M., Brauman, A., Hairiah, K., Mortimer, P. E., & Okubo, S. (2018). Contribution of trees to the conservation of biodiversity and ecosystem services in agricultural landscapes. International Journal of Biodiversity Science, Ecosystem Services and Management, 14(1), 1–16. https://doi.org/10.1080/21513732.2017.1399167
Bennett, E. M., Peterson, G. D., & Gordon, L. J. (2009). Understanding relationships among multiple ecosystem services. Ecology Letters, 12(12), 1394–1404. https://doi.org/10.1111/j.1461-0248.2009.01387.x
Bisseleua, D. H. B., Begoude, D., Tonnang, H., & Vidal, S. (2017). Ant-mediated ecosystem services and disservices on marketable yield in cocoa agroforestry systems. Agriculture, Ecosystems and Environment, 247(December 2016), 409–417. https://doi.org/10.1016/j.agee.2017.07.004
Blaser, W. J., Oppong, J., Hart, S. P., Landolt, J., Yeboah, E., & Six, J. (2018). Climate-smart sustainable agriculture in low-to-intermediate shade agroforests. Nature Sustainability, 1(5), 234–239. https://doi.org/10.1038/s41893-018-0062-8
Blaser, W. J., Oppong, J., Yeboah, E., & Six, J. (2017). Shade trees have limited benefits for soil fertility in cocoa agroforests. Agriculture, Ecosystems and Environment, 243, 83–91. https://doi.org/10.1016/j.agee.2017.04.007
Bos, M. M., Steffan-Dewenter, I., & Tscharntke, T. (2007). Shade tree management affects fruit abortion, insect pests and pathogens of cacao. Agriculture, Ecosystems and Environment,

50
120(2–4), 201–205. https://doi.org/10.1016/j.agee.2006.09.004
Bretagnolle, V., Berthet, E., Gross, N., Gauffre, B., Plumejeaud, C., Houte, S., … Gaba, S. (2018). Towards sustainable and multifunctional agriculture in farmland landscapes: Lessons from the integrative approach of a French LTSER platform. Science of the Total Environment. https://doi.org/10.1016/j.scitotenv.2018.01.142
Bunning, S., McDonaugh, J., & Woodfine, A. (2011). Part 2: Field methodology and tools. In A. Woodfine (Ed.), Manual for local assessment of land degradation and sustainable land management (pp. 67–125). Retrieved from http://www.fao.org/fileadmin/templates/nr/kagera/Documents/LADA_manuals/MANUAL2_final_draft.pdf
Canty, A., & Ripley, B. (2019). boot: Bootstrap R (S-Plus) Functions. R package version 1.3-23.
Carr, M. K. V., & Lockwood, G. (2011). The water relations and irrigation requirements of cocoa (Theobroma cacao L.): A review. Experimental Agriculture, 47(4), 653–676. https://doi.org/10.1017/S0014479711000421
Cerda, R., Deheuvels, O., Calvache, D., Niehaus, L., Saenz, Y., Kent, J., … Somarriba, E. (2014). Contribution of cocoa agroforestry systems to family income and domestic consumption: looking toward intensification. Agroforestry Systems, 88(6), 957–981. https://doi.org/10.1007/s10457-014-9691-8
Dagar, J. C., & Tewari, V. P. (2017). Agroforestry. In J. C. Dagar & V. P. Tewari (Eds.), Agroforestry. https://doi.org/10.1007/978-981-10-7650-3
De Beenhouwer, M., Aerts, R., & Honnay, O. (2013a). A global meta-analysis of the biodiversity and ecosystem service benefits of coffee and cacao agroforestry. Agriculture, Ecosystems & Environment, 175, 1–7.
De Beenhouwer, M., Aerts, R., & Honnay, O. (2013b). A global meta-analysis of the biodiversity and ecosystem service benefits of coffee and cacao agroforestry. Agriculture, Ecosystems & Environment, 175, 1–7. https://doi.org/10.1016/J.AGEE.2013.05.003
de Souza, J. C., Pereira, M. A., da Costa, E. N. D., & da Silva, D. M. L. (2018). Nitrogen dynamics in soil solution under different land uses: Atlantic forest and cacao–cabruca system. Agroforestry Systems, 92(2), 425–435. https://doi.org/10.1007/s10457-017-0077-6
De Souza, J. T., Pereira Monteiro, F., Ferreira, M. A., Peres Gramacho, K., & Martins Newman Luz, E. D. (2018). Cocoa diseases: witches’ broom. In P. Umaharan (Ed.), Achieving sustainable cultivation of cocoa (pp. 239–269). https://doi.org/10.19103/as.2017.0021.14
Deheuvels, O., Avelino, J., Somarriba, E., & Malezieux, E. (2012). Vegetation structure and productivity in cocoa-based agroforestry systems in Talamanca, Costa Rica. Agriculture, Ecosystems & Environment, 149, 181–188.
Eckberg, K. (2017). Prevalence of Moniliophthora roreri in Theobroma cacao in relation to clone variety, community composition, environmental factors in an organic cacao farm in Charagre, Bocas del Toro, Panamá: A case study.
Evans, H. C. (1981). Pod rot of cacao caused by Moniliophthora (Monilia) roreri. Phytopathological Papers, (24).
FAO. (2011). The state of the world’s land and water resources for food and agriculture (SOLAW) –

51
Managing systems at risk. In Lecture Notes in Computer Science (including subseries Lecture Notes in Artificial Intelligence and Lecture Notes in Bioinformatics). https://doi.org/10.1007/978-3-319-92049-8_31
FAO. (2017). The future of food and agriculture: Trends and challenges. https://doi.org/10.4161/chan.4.6.12871
Fischer, D. (2018). Biomass, nutrient content and allometric relations of intensively grown cocoa (Theobroma cacao) trees in Ecuador. Wageningen University.
Fox, J., & Weisberg, S. (2011). An {R} Companion to Applied Regression (Second). Retrieved from http://socserv.socsci.mcmaster.ca/jfox/Books/Companion
Gladek, E., Fraser, M., Roemers, G., Sabag Muñoz, O., Kennedy, E., & Hirsch, P. (2016). The global food system: An analysis. Metabolic, (January), 1–180. Retrieved from http://www.metabolic.nl/publications/global-food-system-analysis/
Goodman, R. C., Phillips, O. L., Torres, C., Freitas, L., Tapia, S., Monteagudo, A., & Baker, T. R. (2013). Forest Ecology and Management Amazon palm biomass and allometry. Forest Ecology and Management, 310, 994–1004. https://doi.org/10.1016/j.foreco.2013.09.045
Gras, P., Tscharntke, T., Maas, B., Tjoa, A., Hafsah, A., & Clough, Y. (2016a). How ants, birds and bats affect crop yield along shade gradients in tropical cacao agroforestry. Journal of Applied Ecology, (August). https://doi.org/10.1111/1365-2664.12625
Gras, P., Tscharntke, T., Maas, B., Tjoa, A., Hafsah, A., & Clough, Y. (2016b). How ants, birds and bats affect crop yield along shade gradients in tropical cacao agroforestry. Journal of Applied Ecology, 53(3), 953–963. https://doi.org/10.1111/1365-2664.12625
Harvey, C. A., Chacón, M., Donatti, C. I., Garen, E., Hannah, L., Andrade, A., … Wollenberg, E. (2014). Climate-Smart Landscapes: Opportunities and Challenges for Integrating Adaptation and Mitigation in Tropical Agriculture. Conservation Letters, 7(2), 77–90. https://doi.org/10.1111/conl.12066
Herzog, F. (1994). Multipurpose shade trees in coffee and cocoa plantations in Côte d’Ivoire. Agroforestry Systems, 27(3), 259–267. https://doi.org/10.1007/BF00705060
Howe, C., Suich, H., Vira, B., & Mace, G. M. (2014). Creating win-wins from trade-offs? Ecosystem services for human well-being: A meta-analysis of ecosystem service trade-offs and synergies in the real world. Global Environmental Change, 28(1), 263–275. https://doi.org/10.1016/j.gloenvcha.2014.07.005
Jacobi, J., Schneider, M., Bottazzi, P., Pillco, M., Calizaya, P., & Rist, S. (2015). Agroecosystem resilience and farmers’ perceptions of climate change impacts on cocoa farms in Alto Beni, Bolivia. Renewable Agriculture and Food Systems, 30(2), 170–183. https://doi.org/10.1017/S174217051300029X
Jagoret, P., Kwesseu, J., Messie, C., Michel-Dounias, I., & Malezieux, E. (2014). Farmers’ assessment of the use value of agrobiodiversity in complex cocoa agroforestry systems in central Cameroon. Agroforestry Systems, 88(6), 983–1000. https://doi.org/10.1007/s10457-014-9698-1
Jaimez, R. E., & Franco, W. (1999). Producción de hojarasca, aporte en nutrientes y descomposición en sistemas agroforestales de cacao y frutales. Agrotrópica, 11(1), 1–8.

52
Lavorel, S., & Grigulis, K. (2012). How fundamental plant functional trait relationships scale-up to trade-offs and synergies in ecosystem services. Journal of Ecology, 100(1), 128–140. https://doi.org/10.1111/j.1365-2745.2011.01914.x
Leeuwen, M. M. W. J. Van, Heuvelink, G. B. M., Wallinga, J., Boer, I. J. M. De, Dam, J. C. Van, Essen, E. A. Van, … Stoof, C. R. (2018). Visual soil evaluation : reproducibility and correlation with standard measurements. 178(November 2017), 167–178. https://doi.org/10.1016/j.still.2017.11.012
Leissle, K. (2018). Cocoa. Medford, MA: Polity Press.
Limon, S. H., Hossain, M., & Spiecker, H. (2018). Nutrients leaching from green leaves of three potential agroforestry tree species. Agroforestry Systems, 92(2), 389–395. https://doi.org/10.1007/s10457-016-9996-x
Loor Solorzano, R. G., Fouet, O., Lemainque, A., Pavek, S., Boccara, M., Argout, X., … Lanaud, C. (2012). Insight into the Wild Origin, Migration and Domestication History of the Fine Flavour Nacional Theobroma cacao L. Variety from Ecuador. PLoS ONE, 7(11). https://doi.org/10.1371/journal.pone.0048438
Lutheran World Relief. (2013). Caja de Herramientas para el Cacao: Aprendiendo e Innovando sobre el Manejo Sostenible del Cultivo de Cacao en Sistemas Agroforestales. Retrieved August 1, 2019, from http://cacaomovil.com/
Martinez-Harms, M. J., Bryan, B. A., Balvanera, P., Law, E. A., Rhodes, J. R., Possingham, H. P., & Wilson, K. A. (2015). Making decisions for managing ecosystem services. Biological Conservation, 184, 229–238. https://doi.org/10.1016/j.biocon.2015.01.024
Millenium Ecosystem Assessment. (2005). Ecosystems and human well-being. https://doi.org/10.1196/annals.1439.003
Nadège, M. T., Louis, Z., Cédric, C. D., Louis-Paul, K. B., Funwi, F. P., Ingrid, T. T., … Julliete Mancho, N. (2018). Carbon storage potential of cacao agroforestry systems of different age and management intensity. Climate and Development, 0(0), 1–12. https://doi.org/10.1080/17565529.2018.1456895
Nath, C., Pélissier, R., & Garcia, C. (2010). Comparative efficiency and accuracy of variable area transects versus square plots for sampling tree diversity and density. Agroforestry Systems, 79(2), 223–236. https://doi.org/10.1007/s10457-009-9255-5
Niether, W., Armengot, L., Andres, C., Schneider, M., & Gerold, G. (2018). Shade trees and tree pruning alter throughfall and microclimate in cocoa (Theobroma cacao L.) production systems. Annals of Forest Science. https://doi.org/10.1007/s13595-018-0723-9
Noordwijk, M. Van, Rahayu, S., Hairiah, K., Wulan, Y. C., Farida, A., & Verbist, B. (2002). Carbon stock assessment for a forest-to-coffee conversion landscape in Sumber-Jaya (Lampung , Indonesia): from allometric equations to land use change analysis. Science in China (Series C), 45(October).
Nygren, P., & Leblanc, H. A. (2015). Dinitrogen fixation by legume shade trees and direct transfer of fixed N to associated cacao in a tropical agroforestry system. 1–14. https://doi.org/10.1093/treephys/tpu116
Pena, E. A., & Slate, E. H. (2019). gvlma: Global Validation of Linear Models Assumptions. Retrieved from https://cran.r-project.org/package=gvlma

53
Pérez-Flores, J., Pérez, A. A., Suárez, Y. P., Bolaina, V. C., & Quiroga, A. L. (2018). Leaf litter and its nutrient contribution in the cacao agroforestry system. Agroforestry Systems, 92(2), 365–374. https://doi.org/10.1007/s10457-017-0096-3
Porter, J. R., Xie, L., A.J. Challinor, K., Cochrane, S. M., Howden, M. M. I., Lobell, D. B., & Travasso, M. I. (2014). Food security and food production systems. In C. B. Field, V. R. Barros, D. J. Dokken, K. J. Mach, M. D. Mastrandrea, T. E. Bilir, … and L. L. W. (eds. . P.R. Mastrandrea (Eds.), Climate Change 2014: Impacts, Adaptation, and Vulnerability. Contribution of Working Group II to the Fifth Assessment Report of the Intergovernmental Panel on Climate Change (pp. 485–533). Cambridge, United Kingdom and New York, NY, USA: Cambridge University Press.
Power, A. G. (2010). Ecosystem services and agriculture: tradeoffs and synergies. Philosophical Transactions of the Royal Society of London B: Biological Sciences, 365(1554), 2959–2971.
R Core Team. (2017). R: A Language and Environment for Statistical Computing. Retrieved from https://www.r-project.org/
Rajab, Y. A., Leuschner, C., Barus, H., Tjoa, A., & Hertel, D. (2016). Cacao Cultivation under Diverse Shade Tree Cover Allows High Carbon Storage and Sequestration without Yield Losses. 1–22. https://doi.org/10.1371/journal.pone.0149949
Ribas, C. R., Schoereder, J. H., Pic, M., & Soares, S. M. (2003). Tree heterogeneity, resource availability, and larger scale processes regulating arboreal ant species richness. Austral Ecology, 28(3), 305–314. https://doi.org/10.1046/j.1442-9993.2003.01290.x
Salas Macías, C. A., Alegre Orihuela, J. C., & Iglesias Abad, S. (2017). Estimation of above-ground live biomass and carbon stocks in different plant formations and in the soil of dry forests of the Ecuadorian coast. Food and Energy Security, 6(4), 1–7. https://doi.org/10.1002/fes3.115
Sánchez-Mora, F. D., Mariela Medina-Jara, S., Díaz-Coronel, G. T., Ramos-Remache, R. A., Vera-Chang, J. F., Vásquez-Morán, V. F., … Onofre-Nodari, R. (2015). Potencial sanitario y productivo de 12 clones de cacao en ecuador. Revista Fitotecnia Mexicana, 38(3), 265–274.
Santhyami, Basukriadi, A., Patria, M. P., & Abdulhadi, R. (2018). The comparison of aboveground C-stock between cacao-based agroforestry system and cacao monoculture practice in West Sumatra, Indonesia. Biodiversitas Journal of Biological Diversity, 19(2), 472–479. https://doi.org/10.13057/biodiv/d190214
Schroth, G., Krauss, U., Gasparotto, L., Duarte Aguilar, J. A., & Vohland, K. (2000). Pests and diseases in agroforestry systems of the humid tropics. Agroforestry Systems, 50(3), 199–241. https://doi.org/10.1023/A:1006468103914
Segura, M., Kanninen, M., & Suárez, D. (2006). Allometric models for estimating aboveground biomass of shade trees and coffee bushes grown together. Agroforestry Systems, 68, 143–150. https://doi.org/10.1007/s10457-006-9005-x
Sheil, D., & Sidiyasa, K. (2003). a New Type of Sample Unit for the Efficient Assessment of Diverse Tree Communities in Complex Forest Landscapes. 15(1), 1–19.
Sistema de Información Agrícola y Agropecuaria. (2018). Boletín de Precipitación y Temperatura - Zona 4. Retrieved from http://sipa.agricultura.gob.ec
Somarriba, E., Orozco-Aguilar, L., Cerda, R., & López Sampson, A. (2018). Analysis and design of the shade canopy of cocoa-based agroforestry systems. https://doi.org/10.19103/AS.2017.0021.29

54
Somarriba, E., Suárez-Islas, A., Calero-Borge, W., Villota, A., Castillo, C., Vílchez, S., … Cerda, R. (2014). Cocoa–timber agroforestry systems: Theobroma cacao–Cordia alliodora in Central America. Agroforestry Systems, 88(6), 1001–1019. https://doi.org/10.1007/s10457-014-9692-7
Sonwa, D. J., Weise, S. F., Nkongmeneck, B. A., Tchatat, M., & Janssens, M. J. J. (2017). Structure and composition of cocoa agroforests in the humid forest zone of Southern Cameroon. Agroforestry Systems, 91(3), 451–470. https://doi.org/10.1007/s10457-016-9942-y
Spaggiari Souza, C. A., Dos Santos Dias, L. A., Galeas Aguilar, M. A., Sonegheti, S., Oliveira, J., & Andrade Costa, J. (2009). Cacao Yield in Different Planting Densities. Brazilian Archives of Biology and Technology, 52(December), 1313–1320.
Sperber, C. F., Nakayama, K., Valverde, M. J., & De Siqueira Neves, F. (2004). Tree species richness and density affect parasitoid diversity in cacao agroforestry. Basic and Applied Ecology, 5(3), 241–251. https://doi.org/10.1016/j.baae.2004.04.001
Toledo-Hernández, M., Wanger, T. C., & Tscharntke, T. (2017). Neglected pollinators: Can enhanced pollination services improve cocoa yields? A review. Agriculture, Ecosystems and Environment, 247, 137–148. https://doi.org/10.1016/j.agee.2017.05.021
Tscharntke, T., Clough, Y., Bhagwat, S. A., Buchori, D., Faust, H., Hertel, D., … Wanger, T. C. (2011). Multifunctional shade-tree management in tropical agroforestry landscapes - A review. Journal of Applied Ecology, 48(3), 619–629. https://doi.org/10.1111/j.1365-2664.2010.01939.x
Vaast, P., & Somarriba, E. (2014). Trade-offs between crop intensification and ecosystem services: the role of agroforestry in cocoa cultivation. Agroforestry Systems, 88(6), 947–956. https://doi.org/10.1007/s10457-014-9762-x
Van Bael, S. A., Bichier, P., & Greenberg, R. (2007). Bird predation on insects reduces damage to the foliage of cocoa trees (Theobroma cacao) in western Panama. Journal of Tropical Ecology, 23(06), 715–719. https://doi.org/10.1017/S0266467407004440
van Vliet, J. A., & Giller, K. E. (2017). Mineral Nutrition of Cocoa: A Review. In Advances in Agronomy (1st ed., Vol. 141). https://doi.org/10.1016/bs.agron.2016.10.017
Waldron, A., Garrity, D., Malhi, Y., Girardin, C., Miller, D. C., & Seddon, N. (2017). Agroforestry Can Enhance Food Security While Meeting Other Sustainable Development Goals. Tropical Conservation Science, 10, 194008291772066. https://doi.org/10.1177/1940082917720667
Waldron, A., Justicia, R., & Smith, L. E. (2015). Making biodiversity-friendly cocoa pay: Combining yield, certification, and REDD for shade management. Ecological Applications, 25(2), 361–372. https://doi.org/10.1890/13-0313.1.sm
Waldron, A., Justicia, R., Smith, L., & Sanchez, M. (2012). Conservation through Chocolate: A win-win for biodiversity and farmers in Ecuador’s lowland tropics. Conservation Letters, 5(3), 213–221. https://doi.org/10.1111/j.1755-263X.2012.00230.x
Wickham, H. (2016). ggplot2: Elegant Graphics for Data Analysis. Retrieved from https://ggplot2.tidyverse.org
WWF. (2018). Living planet report 2018 (M. Grooten & R. E. A. Almonf, Eds.). Gland, Switzerland: WWF.
Zeileis, A., & Hothorn, T. (2002). Diagnostic Checking in Regression Relationships. R News, 2(3), 7–10. Retrieved from https://cran.r-project.org/doc/Rnews/

55
Zhang, L., & Schwärzel, K. (2017). Multifunctional land-use systems for managing the nexus of environmental resources. In Multifunctional Land-Use Systems for Managing the Nexus of Environmental Resources. https://doi.org/10.1007/978-3-319-54957-6

56

57
7. Annexes
7.1. Annex I Table 5. Topics for semi-structured interview with farmers.
Land use history of the plot
Cocoa age, tree density and planting pattern
Main harvest season
Main pest and diseases and pest and disease management
Fertilizer application: type, quantity, timing and frequency
Pesticide application: type, quantity, timing and frequency
Pruning: type, timing and frequency
Application of soil amendments: type, quantity, timing and frequency
Use of irrigation
Species of shade trees and given use
Management of shade trees: pruning, pest and disease control, fertilizer application

58
7.2. Annex II
Figure 18. Visual soil analysis sampling process. A. Assessment of percentage of soil cover. B. Excavation of soil block.
C. Extraction and placement of soil block over a plastic sheet. D. Ordering of aggregates by size.
A B
C D
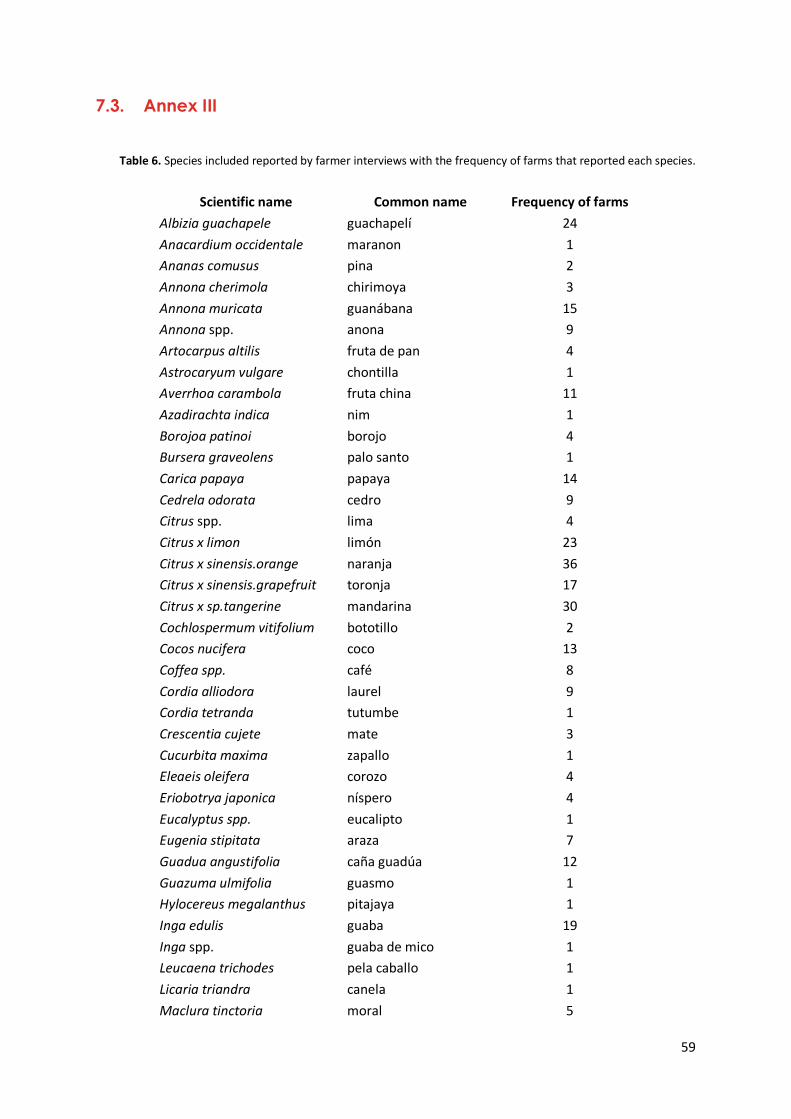
59
7.3. Annex III
Table 6. Species included reported by farmer interviews with the frequency of farms that reported each species.
Scientific name Common name Frequency of farms Albizia guachapele guachapelí 24 Anacardium occidentale maranon 1 Ananas comusus pina 2 Annona cherimola chirimoya 3 Annona muricata guanábana 15 Annona spp. anona 9 Artocarpus altilis fruta de pan 4 Astrocaryum vulgare chontilla 1 Averrhoa carambola fruta china 11 Azadirachta indica nim 1 Borojoa patinoi borojo 4 Bursera graveolens palo santo 1 Carica papaya papaya 14 Cedrela odorata cedro 9 Citrus spp. lima 4 Citrus x limon limón 23 Citrus x sinensis.orange naranja 36 Citrus x sinensis.grapefruit toronja 17 Citrus x sp.tangerine mandarina 30 Cochlospermum vitifolium bototillo 2 Cocos nucifera coco 13 Coffea spp. café 8 Cordia alliodora laurel 9 Cordia tetranda tutumbe 1 Crescentia cujete mate 3 Cucurbita maxima zapallo 1 Eleaeis oleifera corozo 4 Eriobotrya japonica níspero 4 Eucalyptus spp. eucalipto 1 Eugenia stipitata araza 7 Guadua angustifolia caña guadúa 12 Guazuma ulmifolia guasmo 1 Hylocereus megalanthus pitajaya 1 Inga edulis guaba 19 Inga spp. guaba de mico 1 Leucaena trichodes pela caballo 1 Licaria triandra canela 1 Maclura tinctoria moral 5

60
Mammea americana mamey serrano 24 Manguifera indica mango 37 Manihot esculenta yuca 15 Mimosa pigra dormilón 1 Muntingia calabura frutillo, cerezo 3 Musa paradisiaca.banana guineo 32 Musa paradisiaca.orito orito 1 Musa paradisiaca.plantain plátano 39 Nectandra sp. jigua 4 Nephelium lappaceum achotillo 4 Passiflora quadrangularis badea 3 Persea americana aguacate 27 Phyllanthus acidus grosella 9 Phythelephas aequatorialis tagua* 5 Pouteria caimito caimito 2 Pouteria sapota mamey colorado 13 Prosopis juliflora algarrobo 1 Prunus dulcis almendra 1 Pseudobombax millei beldaco 1 Psidium guajava guayaba 8 Psidium spp. guayabo de monte 1 Quararibea cordata sapote 19 Saccharum officinarium cana dulce 1 Spondias purpurea ovo, ciruelo 6 Swietenia macrophylla caoba 7 Syzygium jambos pomarosa 5 Tamarindus indica tamarindo 5 Tectona grandis teca 4 Triplaris cumingiana mugin, fernan sanchez 6 Ziziphus thyrsiflora tillo 1 Vitex cymosa pechiche 10 NA yafri 1 NA lechero 1 NA quiebra fierro 1 NA 7 pepas 1

61
7.4. Annex IV Residuals of the multiple linear regression models that didn’t meet the assumptions of the residuals.
Figure 15. Residual inspection graphs for the linear regression model of moniliasis disease control (n=35).
Figure 16. Residual inspection graphs for the linear regression model of number of earthworms (n=40).

62
7.5. Annex V R script used for data analysis. The script for the linear regression model for number of earthworms is presented as an example. The same scrip was used for the calculation of all the linear regression models by changing the names of the variables to specify each model where necessary.
# Regression analyses for soil life: number of earthworms #Set working directory setwd("~/Documents/WUR/Thesis PPS Cocoa/r_thesis") #Install packages install.packages("car"); install.packages("ggplot2"); install.packages("pastecs"); install.packages("psych"); install.packages("lm.beta"); install.packages("QuantPsyc"); install.packages("tidyverse"); install.packages("lmtest"); install.packages("boot"); install.packages("onewaytests"); install.packages("gvlma") # Load packages library(car); library(ggplot2); library(pastecs); library(psych); library(boot); library(QuantPsyc); library(ggplot2); library(lmtest); library(boot); library(onewaytests); library(gvlma) #----------------------------------------------------------------- #Read file es<- read.delim("es_r.txt", header=TRUE) es$agc.tot <- es$agc.cocoa.Tm.ha + es$agc.shade.t.ha str(es) #Run regression analyses ## number of earthworms - soil life rgr_earthworms <- lm(formula = avg.n.earthworms ~ avg..big.elem + max.age.cocoa + agc.tot + n.species + prunning, data = es, na.action = na.exclude) # summarize results from regression analysis summary(rgr_earthworms) AIC(rgr_earthworms) # calculate the standardized regression coefficients (how many stdev does the response variable changes with the change of 1 stdev of the explanatory variable) lm.beta(rgr_earthworms)
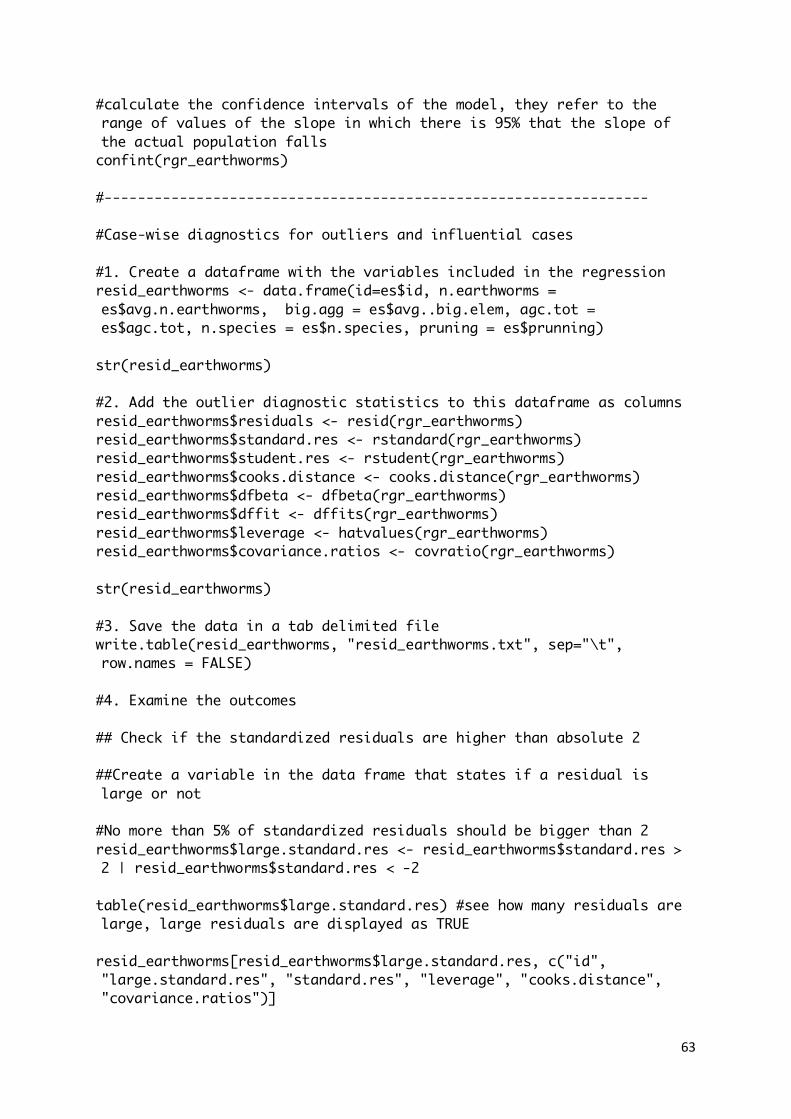
63
#calculate the confidence intervals of the model, they refer to the range of values of the slope in which there is 95% that the slope of the actual population falls confint(rgr_earthworms) #----------------------------------------------------------------- #Case-wise diagnostics for outliers and influential cases #1. Create a dataframe with the variables included in the regression resid_earthworms <- data.frame(id=es$id, n.earthworms = es$avg.n.earthworms, big.agg = es$avg..big.elem, agc.tot = es$agc.tot, n.species = es$n.species, pruning = es$prunning) str(resid_earthworms) #2. Add the outlier diagnostic statistics to this dataframe as columns resid_earthworms$residuals <- resid(rgr_earthworms) resid_earthworms$standard.res <- rstandard(rgr_earthworms) resid_earthworms$student.res <- rstudent(rgr_earthworms) resid_earthworms$cooks.distance <- cooks.distance(rgr_earthworms) resid_earthworms$dfbeta <- dfbeta(rgr_earthworms) resid_earthworms$dffit <- dffits(rgr_earthworms) resid_earthworms$leverage <- hatvalues(rgr_earthworms) resid_earthworms$covariance.ratios <- covratio(rgr_earthworms) str(resid_earthworms) #3. Save the data in a tab delimited file write.table(resid_earthworms, "resid_earthworms.txt", sep="\t", row.names = FALSE) #4. Examine the outcomes ## Check if the standardized residuals are higher than absolute 2 ##Create a variable in the data frame that states if a residual is large or not #No more than 5% of standardized residuals should be bigger than 2 resid_earthworms$large.standard.res <- resid_earthworms$standard.res > 2 | resid_earthworms$standard.res < -2 table(resid_earthworms$large.standard.res) #see how many residuals are large, large residuals are displayed as TRUE resid_earthworms[resid_earthworms$large.standard.res, c("id", "large.standard.res", "standard.res", "leverage", "cooks.distance", "covariance.ratios")]

64
# No more than 1% of standardized residuals should be bigger than 2.58 stand.res <- resid_earthworms$standard.res > 2.58 | resid_earthworms$standard.res < -2.58 table(stand.res) ## Cooks distance: values above 1 indicate a case that might be influencing the model cooksd <- resid_earthworms$cooks.distance > 1 table(cooksd) ## Leverage (hat values): values two or three times higher than the average leverage have too much influence # Average leverage = (k+1)/n = # k = number of predictorsresid_earthworms # n = number of observations avg.leverage <- (k + 1)/ n { k <- 6 # number of predictors n <- 40 # number of observations } avg.leverage leverage.threshold2 <- resid_earthworms$leverage > (2*avg.leverage) #results were too many, I prefer the other threshold table(leverage.threshold2) resid_earthworms$leverage > (3*avg.leverage) #some true values were found, I will create a column to identify the values resid_earthworms$large.leverage <- resid_earthworms$leverage > (3*avg.leverage) #results were too many, I prefer the other threshold table(resid_earthworms$large.leverage) resid_earthworms[resid_earthworms$large.leverage, c("id","leverage", "cooks.distance", "covariance.ratios")] ## Covariance ratios: calculate covariance boundaries and look for values that deviate too much from the boundries cvb1a <- 1+(3*(k + 1)/n) cvb2a <- 1-(3*(k + 1)/n) cvb1a ; cvb2a

65
resid_earthworms$covariance.large <- resid_earthworms$covariance.ratios > cvb1a | resid_earthworms$covariance.ratios < cvb2a table(resid_earthworms$covariance.large) resid_earthworms[resid_earthworms$covariance.large, c("id", "covariance.ratios", "leverage", "cooks.distance")] #this command prints the rows of the selected variables when covariance.large is true #Save again the file with all the columns created write.table(resid_earthworms, "rgr_earthworms.txt", sep="\t", row.names = FALSE) #----------------------------------------------------------------- #Checking if assumptions are met ## 1. Independence: the Durbin Watson test must be <1 and >3, the closer the value is to 2 it is better. P values must be non-significant p> 0.05 dwtest(rgr_earthworms) ## 2. No multicolinearity # Variance Inflation Factor VIF: these are the rules # largest VIF >10 there is a cause for concern # average VIF >1 (substantially) regression may be biased vif(rgr_earthworms) mean(vif(rgr_earthworms)) # Tolerance: # < 0.1 serious problem # < 0.2 potential problem 1/vif(rgr_earthworms) ## 3. Checking assumptions about the residuals # To look if the assumptions of homoscedacity and random errors are met we can create plots of the residuals resid_earthworms$fitted.values <- fitted(rgr_earthworms, na.action = na.exclude) #add the predicted values for y to the data.frame # plot the studentized residuals against the predicted values

66
ggplot(resid_earthworms, aes(fitted.values, student.res))+ geom_point() + geom_smooth(method= "lm", colour= "Blue")+ labs(x="fitted values", y="studentized residual") # Non-constant Variance Score Test to see if there is heterocedascity, there is evidence of heterosckedascity if p<0.05... if the result is not significant, the assumption of homocedascity is met ncvTest(rgr_earthworms) # plot a density histogram of the studentized residuals ggplot(resid_earthworms, aes(student.res)) + theme(legend.position = "none") + geom_histogram(aes(y= ..density..), colour = "black", fill = "white") + labs(x= "studentized residuals", y= "density")+ stat_function(fun = dnorm, args= list(mean = mean(resid_earthworms$student.res, na.rm = TRUE), sd = sd(resid_earthworms$student.res, na.rm = TRUE)), colour = "red", size = 1) # plot a qqplot of the studentized residuals to see how normal they are qplot(sample = resid_earthworms$student.res, stat = "qq") + labs(x = "theoretical values", y = "observed values") # Shapiro-Wilk is a test of normality, if the result is non-siginificant then the data is normal shapiro.test(resid_earthworms$student.res) # Global test of model assumptions gvmodel # Global stat: are the relations between x and y roughly linear? # Skewness: is the distribution skewed? then normality is not met # Kurtosis: is the distribution kurtotic (high or low peak) normality not met # Link function: is the dependent variable truly continuous or categorical? # Hetersocedascity: is the variance of the residuals constant across the range of x? gv_earthworms <- gvlma(rgr_earthworms) summary(gv_earthworms) #Plot the three residual inspections graphs together (script by Joost van Heerwaarden) resid.inspect<-function(lmm1,col="black"){

67
par(mfrow=c(1,3)) hist(residuals(lmm1)/sd(residuals(lmm1),na.rm=T),30,main="") plot(fitted(lmm1),residuals(lmm1)/sd(residuals(lmm1),na.rm=T),col=col) qqnorm(residuals(lmm1)/sd(residuals(lmm1),na.rm=T)) abline(coef=c(0,1)) return(residuals(lmm1)/sd(residuals(lmm1),na.rm=T)) } t=resid.inspect(rgr_earthworms) #----------------------------------------------------------------- #Since some of the assumptions of the residuals are not met, I will do a robust regression, which means that I will bootstrap the regression to obtain the statistical significance and confidence intervals, in this way I can relax the distributional assumptions ## Create a function for the bootstrap boot_earthworms <- function(formula, data, indices) { d <- data [indices,] fit <- lm(formula, data = d) return(coef(fit)) } bootResults_earthworms <- boot(data = es, statistic = boot_earthworms , formula = avg.n.earthworms ~ avg..big.elem + max.age.cocoa + agc.tot + n.species + prunning, R = 2000 ) # check the results print(bootResults_earthworms) # get the confidence intervals for each variable, if the confidence intervals are close to the ones from the lm, this suggests that we did not have a problem of non-normal distribution in the model boot.ci(bootResults_earthworms, type = "bca", index = 1) # intercept boot.ci(bootResults_earthworms, type = "bca", index = 2) # big aggregates boot.ci(bootResults_earthworms, type = "bca", index = 3) # max age cocoa boot.ci(bootResults_earthworms, type = "bca", index = 4) # agc total boot.ci(bootResults_earthworms, type = "bca", index = 5) # n species boot.ci(bootResults_earthworms, type = "bca", index = 6) # pruning #compare with the confidence intervals of the regression confint(rgr_earthworms) #Plot the bootstrap results

68
plot(bootResults_earthworms, index = 1) # intercept plot(bootResults_earthworms, index = 2) # big aggregates plot(bootResults_earthworms, index = 3) # max age cocoa plot(bootResults_earthworms, index = 4) # agc total plot(bootResults_earthworms, index = 5) # n species plot(bootResults_earthworms, index = 6) # pruning

69
7.6. Annex VI R script for the creation of graphs for exploration and report of the results.
## R script to create graphs #set working directory setwd("~/Documents/WUR/Thesis PPS Cocoa/r_thesis") #install packages install.packages("ggplot2") install.packages("cowplot") install.packages("reshape") #load packages library(ggplot2); library(cowplot); library(reshape) #read data from tab delimited text file es<- read.delim("es_r.txt", header=T) #see structure of the data str(es) #Create boxplots about the densities of trees dens<- read.delim("density.txt") str(dens) ggplot(dens, aes(species, density))+ geom_boxplot()+ stat_summary(fun.y=mean, geom="point",shape=23, size=1)+ labs(x="",y="Density (trees/ha)")+ scale_x_discrete(limits=c("cocoa","banana","trees"))+ theme(legend.position="none")+ theme_gray() ggsave("boxplot_density.jpeg") #create a line plot about the monthly yield variation yield_month <- read.delim("yield_month.txt") str(yield_month) #convert the boxplot from wide format into long format library(reshape)
70
yield_month2 <- melt(yield_month, id = c("id"), measured = c("Jan", "Feb", "Mar", "Apr", "May", "Jun", "Jul", "Aug", "Sep", "Oct", "Nov", "Dec") ) str(yield_month2) #plot line graph yieldm<- ggplot(yield_month2, aes(x= variable, y= value, group= id, color=as.factor(id)))+ geom_point(size=0.4, aes(alpha=0.4))+ geom_line(aes(alpha=0.4))+ labs(x="", y= expression(paste("cocoa yield (kg dry beans ha"^-1,")")))+ theme(legend.position="none") ggsave("line_yield_month.jpeg") # create a line plot about the yield of the sample (n=39) and farmer's cooperative (n=748) yield_comp <- read.delim("yield_sample_cfv.txt", header= TRUE) str(yield_comp) yield_comp2 <- melt(yield_comp, id = c("month", "from"), measured = c("mean.yield") ) str(yield_comp2) yield_comp2 #plot point graph yieldc<- ggplot(yield_comp, aes(x= month, y= mean.yield, group= from, color=from))+ geom_point(size=0.4, stat=)+ geom_line()+ scale_alpha(guide= "none")+ scale_x_discrete(limits=c("Jan", "Feb", "Mar", "Apr", "May", "Jun", "Jul", "Aug", "Sep", "Oct", "Nov", "Dec"))+ geom_errorbar(aes(ymin=mean.yield - stdv, ymax= mean.yield + stdv), width=0.2, alpha=0.7, position="dodge", linetype="dashed")+ labs(x="", y= expression(paste("mean cocoa yield (kg dry beans ha"^-1,")")))+ theme(legend.position="none")+ expand_limits(x=0, y=0)

71
ggsave("line_yield_comparison.jpeg") # align yield month data in one graph with ABC names library(cowplot) ggdraw()+ draw_plot(yieldm, x=0, y=0.5, width=1, height=0.5)+ draw_plot(yieldc, x=0, y=0, width=1, height=0.5) ggsave("facet_yield_month.jpeg") #------------------------------------------------------------- #boxplot graphs of each ecosystem service #Yield ##yield by irrigation ggplot(es,aes(x=irrigation, y=cocoa.yield.kg.ha)) + theme(legend.position="none")+ geom_boxplot()+ stat_summary(fun.y=mean, geom="point",shape=23, size=1)+ labs(x="Irrigation", y="Cocoa yield (kg/ha.yr)") ##save the graph ggsave("boxplot_yield_irrigation.jpeg") ## yield alone yield <- ggplot(es,aes(x="", y=cocoa.yield.kg.ha)) + geom_boxplot()+ stat_summary(fun.y=mean, geom="point",shape=23, size=1)+ labs(x="",y=expression(paste("cocoa yield (kg dry beans ha"^-1,"yr"^-1,")")))+ theme_gray() ##save the graph ggsave("boxplot_yield.jpeg") # yield sample vs. yield CFV boxplot yield_comp_b <- read.delim("yield_comp_box.txt") str(yield_comp_b) ggplot(yield_comp_b,aes(x=source, y=yield, color=source)) + theme(legend.position="none")+ geom_boxplot()+ stat_summary(fun.y=mean, geom="point",shape=23, size=1)+ labs(x="", y="cocoa yield (kg/ha.yr)")

72
ggsave("boxplot_yield_comp.jpeg") # yield histogram yield_h <- ggplot(es,aes(x=cocoa.yield.kg.ha)) + geom_histogram(binwidth=100, fill = "White", colour="Black") + scale_y_continuous(breaks= c(2,4,6,8,10,12,14))+ scale_x_continuous(breaks= c(0,50,150,250,350,450,550, 650, 750, 850))+ labs( x = expression(paste("cocoa yield (kg dry beans ha"^-1,"yr"^-1,")")), y = "number of farms")+ theme_gray() # facet yield boxplot and histogram graphs in one library(cowplot) ggdraw()+ draw_plot(yield_h, x=0.5, y=0, width=0.5, height=1)+ draw_plot(yield, x=0, y=0, width=0.5, height=1) ggsave("facet_yield_freq.jpeg") #Pest regulation ## Faceting graphs of the level of both diseases disease <- read.delim("disease.txt") str(disease) ggplot(disease,aes(x=level, y=percentage))+ geom_boxplot()+ scale_x_discrete(limits=c("no","low","medium","high"))+ facet_wrap(~disease)+ labs(x="infection level", y="% cocoa trees")+ stat_summary(fun.y=mean, geom="point",shape=23, size=1) ggsave("boxplot_disease.jpeg") # Carbon agc <- read.delim("carbon.txt") str(agc) ggplot(agc, aes(species, AGC))+

73
geom_boxplot()+ scale_x_discrete(limits=c("cocoa", "trees", "banana"))+ labs(x="", y=expression(paste("aboveground carbon (t C ha"^-1,")")))+ stat_summary(fun.y=mean, geom="point",shape=23, size=1)+ theme_gray() ggsave("boxplot_agc.jpeg") # Biodiversity species_box <- ggplot(es,aes(x="", y=n.species))+ geom_boxplot()+ labs(x="", y="number of species")+ stat_summary(fun.y=mean, geom="point",shape=23, size=1)+ theme_gray()+ scale_y_continuous(breaks= c(2,4,6,8,10,12)) ggsave("boxplot_species.jpeg") # biodiversity histogram species_hist <- ggplot(es,aes(x=n.species)) + geom_histogram(binwidth=2, fill = "White", colour="Black") + scale_x_continuous(breaks= c(1,3,5,7,9,11))+ theme_gray()+ scale_y_continuous(breaks= c(4,8,12))+ labs( x = expression(paste("number of species")), y = "number of farms") # facet diversity boxplot and histogram graphs in one library(cowplot) ggdraw()+ draw_plot(species_hist, x=0.5, y=0, width=0.5, height=1)+ draw_plot(species_box, x=0, y=0, width=0.5, height=1) ggsave("facet_species.jpeg") # Soil ## depth first horizon h1.depth <- ggplot(es, aes(x="", y=avg.depth.h1))+ geom_boxplot()+ labs(x="", y="depth of first horizon (cm)")+

74
stat_summary(fun.y=mean, geom="point",shape=23, size=1) ggsave("boxplot_depth_h1.jpeg") ## number of earthworms earthworms <- ggplot(es, aes(x="", y=avg.n.earthworms))+ geom_boxplot()+ labs(x="", y="number of earthworms")+ stat_summary(fun.y=mean, geom="point",shape=23, size=1) ggsave("boxplot_earthworms.jpeg") ## number of roots n.roots <- ggplot(es, aes(x="", y=avg.n.roots))+ geom_boxplot()+ labs(x="", y="number of roots")+ stat_summary(fun.y=mean, geom="point",shape=23, size=1) ggsave("boxplot_n_roots.jpeg") ## root depth root.depth <- ggplot(es, aes(x="", y=avg.root.depth))+ geom_boxplot()+ labs(x="", y="rooting depth (cm)")+ stat_summary(fun.y=mean, geom="point",shape=23, size=1) ggsave("boxplot_root_depth.jpeg") ## % of big elemenents big.elem <- ggplot(es, aes(x="", y=avg..big.elem))+ geom_boxplot()+ labs(x="", y="% of big aggregates")+ stat_summary(fun.y=mean, geom="point",shape=23, size=1) ggsave("boxplot_big_agg.jpeg") # # arrange all the soil graphs in one image library(cowplot) ggdraw()+ draw_plot(earthworms, x=0, y=0.5, width=0.33, height=0.5)+ draw_plot(n.roots, x=0.33, y=0.5, width=0.33, height=0.5)+

75
draw_plot(root.depth, x=0.66, y=0.5, width=0.33, height=0.5)+ draw_plot(soil_str, x=0, y=0, width=1, height=0.5) ggsave("boxplot_soil.jpeg") # create boxplot of aggregate size distribution & % big aggregates soil_str <- ggplot(es, aes(x=agg.size.distr, y=avg..big.elem))+ geom_boxplot()+ labs(x="aggregate size distribution score", y="% of big aggregates")+ stat_summary(fun.y=mean, geom="point",shape=23, size=1)+ scale_x_discrete(limits=c("poor", "moderate", "good")) # boxplot of aggregate size distribution & rooting depth #### not a good graph soil_str_root <- ggplot(es, aes(x=agg.size.distr, y=avg.root.depth))+ geom_violin()+ labs(x="aggregate size distribution score", y="% of big aggregates")+ stat_summary(fun.y=mean, geom="point",shape=23, size=1)+ scale_x_discrete(limits=c("poor", "moderate", "good")) # create boxplot of soil texture & the other soil characteristics ## number of earthworms tx_earthworms <- ggplot(es, aes(x=texture.h1, y=avg.n.earthworms))+ geom_boxplot()+ labs(x="soil texture", y="number of earthworms")+ stat_summary(fun.y=mean, geom="point",shape=23, size=1)+ scale_x_discrete(limits=c("sandy loam", "silty loam", "loam", "clayey loam", "fine clay", "heavy clay")) ggsave("boxplot_tx_earthworms.jpeg") ## number of roots tx_roots <- ggplot(es, aes(x=texture.h1, y=avg.n.roots))+ geom_violin()+ labs(x="soil texture", y="number of roots")+ stat_summary(fun.y=mean, geom="point",shape=23, size=1)+ scale_x_discrete(limits=c("sandy loam", "silty loam", "loam", "clayey loam", "fine clay", "heavy clay"))

76
## rooting depth tx_root_depth <- ggplot(es, aes(x=texture.h1, y=avg.root.depth))+ geom_violin()+ labs(x="soil texture", y="rooting depth (cm)")+ stat_summary(fun.y=mean, geom="point",shape=23, size=1)+ scale_x_discrete(limits=c("sandy loam", "silty loam", "loam", "clayey loam", "fine clay", "heavy clay")) # Create an histogram of soil texture texture <- ggplot(es, aes(x=texture.h1))+ geom_bar(fill= "White", colour= "Black")+ scale_x_discrete(limits=c("sandy loam", "silty loam", "loam", "clayey loam", "fine clay", "heavy clay"))+ labs(x="", y="number of farms")+ theme(legend.position="none") ggsave("bar_texture.jpeg") #---------------------------------------------------------------------- #Create graphs for management practices ## Density of cocoa, banana and trees # Melt the data to create boxplots density0 <- data.frame(id = es$id, cocoa = es$cocoa.dens.tr.ha, banana = es$banana.dens.tr.ha, trees = es$tree.dens.tr.ha, shade= es$dens.shade) str(density0) density <- melt(density0, id= c("id"), measured = c("cocoa", "shade", "banana", "trees") ) str(density) ##density by species ggplot(density,aes(x=variable, y=value)) + geom_boxplot()+ labs(x="", y=expression(paste("density (trees ha"^-1,")")))+ scale_x_discrete(limits = c("cocoa", "banana", "trees"))+ theme_gray()+ stat_summary(fun.y=mean, geom="point",shape=23, size=1)

77
ggsave("boxplot_density.jpeg") ## DBH of cocoa, banana and trees # Melt the data to create boxplots dbh0 <- data.frame(id = es$id, cocoa = es$cocoa.avg.dbh, banana = es$banana.avg.dbh, trees = es$trees.avg.dbh, total= es$avg.dbh.tot) str(dbh0) dbh <- melt(dbh0, id= c("id"), measured = c("cocoa", "trees", "banana", "total") ) str(dbh) ##dbh boxplots ggplot(dbh,aes(x=variable, y=value)) + geom_boxplot()+ labs(x="", y="mean trunk diameter (cm)")+ scale_x_discrete(limits = c("cocoa", "banana", "trees")) ggsave("boxplot_trunk_diameter.jpeg") ## Max, min and average age of cocoa of the sampled farms # Melt the data to create boxplots age0 <- data.frame(id = es$id, min = es$min.age.cocoa, max = es$max.age.cocoa, mean = es$mean.age.cocoa) str(age0) age <- melt(age0, id= c("id"), measured = c("min", "max", "mean") ) str(age) ##cocoa age ggplot(age,aes(x=variable, y=value)) + geom_boxplot()+ labs(x="", y="age of cocoa trees (years)")+ scale_x_discrete(limits = c("min", "max"))+ stat_summary(fun.y=mean, geom="point",shape=23, size=1)+ theme_gray() ggsave("boxplot_age_cocoa.jpeg")