ecosystem size, but not disturbance, determines food …
TRANSCRIPT
Ecology, 89(11), 2008, pp. 3001–3007� 2008 by the Ecological Society of America
ECOSYSTEM SIZE, BUT NOT DISTURBANCE, DETERMINES FOOD-CHAINLENGTH ON ISLANDS OF THE BAHAMAS
GAKU TAKIMOTO,1,3,4 DAVID A. SPILLER,2 AND DAVID M. POST3
1Department of Biology, Faculty of Science, Toho University, Funabashi, Chiba 274-8510 Japan2Section of Evolution and Ecology, One Shields Avenue, University of California, Davis, California 95616-8755 USA
3Department of Ecology and Evolutionary Biology, Yale University, New Haven, Connecticut 06511 USA
Abstract. Ecologists have long struggled to explain variation in food-chain length amongnatural ecosystems. Food-chain length is predicted to be shorter in ecosystems subjected togreater disturbance because longer chains are theoretically less resilient to perturbation.Moreover, food-chain length is expected to be longer in larger ecosystems because increasingecosystem size increases species richness and stabilizes predator–prey interactions, or increasestotal resource availability. Here we test the roles of disturbance and ecosystem size indetermining the food-chain length of terrestrial food webs on Bahamian islands. We foundthat disturbance affected the identity of top predators, but did not change food-chain lengthbecause alternative top predators occupied similar trophic positions. On the other hand, a 106-fold increase in ecosystem size elevated food-chain length by one trophic level. We suggest thatthe effect of disturbance on food-chain length is weak when alternate top predators are trophicomnivores and have similar trophic positions. This and previous work in lakes suggest thatecosystem size may be a strong determinant of food-chain length in both aquatic andterrestrial ecosystems.
Key words: Anolis lizards; Bahamian islands; disturbance; ecosystem size; food-chain length; food web;omnivory; orb spiders; predation; stable isotope; trophic position.
INTRODUCTION
Food-chain length is an important characteristic of
biological communities. Variation in food-chain length
influences primary and secondary productivity (Carpen-
ter and Kitchell 1993), nutrient cycling and community
stability (DeAngelis et al. 1989), and the bioaccumula-
tion of contaminants in top predators including many
consumed by humans (Cabana and Rasmussen 1994,
Kidd et al. 1998). Ecologists have proposed several
hypotheses to explain natural variation in food-chain
length (Pimm 1982, Lawton 1989, Post 2002a), but no
clear answer has been reached. Among potential
determinants in previous hypotheses, disturbance and
ecosystem size have attracted considerable recent
attention (Post 2002a). In the dynamic constraints
hypothesis, more frequent or more intense disturbance
is predicted to shorten food-chain length because simple
theoretical models suggest that longer chains are less
resilient, and thus unlikely to persist in disturbed
habitats (Pimm and Lawton 1977). Except for a few
experiments that lend indirect support (Jenkins et al.
1992, Lawler and Morin 1993), there is little direct
evidence for an effect of disturbance on food-chain
length in natural systems (Post 2002a). The ecosystem
size hypothesis (Post et al. 2000) predicts that food-chain
length will be longer in larger ecosystems because larger
space can retain more individuals and thus more species
(Cohen and Newman 1991), foster metapopulation
persistence of higher trophic levels (Holt 1996), and
stabilize predator–prey interactions (Spencer and War-
ren 1996, Holt 2002). The productive space hypothesis
also predicts that increasing ecosystem size will increase
food-chain length because larger ecosystems provide
greater total primary production (local primary produc-
tion 3 ecosystem size) that can support longer food
chains (Schoener 1989). Several studies have found an
effect of ecosystem size on food-chain length in aquatic
food webs (Spencer and Warren 1996, Post et al. 2000,
Thompson and Townsend 2005), but there exists only
indirect evidence from terrestrial food webs that higher-
order predators tended to occur on larger ecosystems
(Schoener and Schoener 1983a, Schoener 1989).
Trophic omnivory, defined as feeding on more than
one trophic level, can have profound influences on food-
chain length. Growing empirical evidence suggests that
both the presence/absence of predators on the top of
food webs and shifts in the top predator’s trophic
position are fundamental causes for natural variation in
food-chain length (Post et al. 2000, Post and Takimoto
2007). Trophic position is a continuous index averaging
the number of trophic levels from basal species to a
consumer through all trophic pathways. When top
predators are trophic omnivores, changing their primary
diets from lower trophic levels to higher trophic levels
will increase their trophic position, leading to an
increase in food-chain length (Diehl and Feissel 2001,
Manuscript received 4 December 2007; revised 15 May 2008;accepted 28 May 2008. Corresponding Editor: B. P. Kotler.
4 E-mail: [email protected]
3001
Rep
orts
Post and Takimoto 2007). Moreover, adding higher-
order predators to the top of food webs does notnecessarily cause an increase in food-chain length, if they
are trophic omnivores feeding on multiple lower trophiclevels.
Here we test the effects of disturbance and ecosystemsize on food-chain length of terrestrial food webs found
on Bahamian islands. Storm surges that inundate smallislands, typically caused by hurricanes and winterstorms, have profound influences on food-web structure
and dynamics because they extirpate spider and lizardpopulations (Spiller et al. 1998), and alter plant–animal
interactions (Spiller and Agrawal 2003). Ecosystem size,in this case island area, can strongly affect species
membership of insular food webs (Schoener andSchoener 1983b) and modify the strength of local species
interactions (Schoener and Spiller 1987). These obser-vations suggest that both disturbance and ecosystem size
may jointly affect food-chain length on islands in theBahamas.
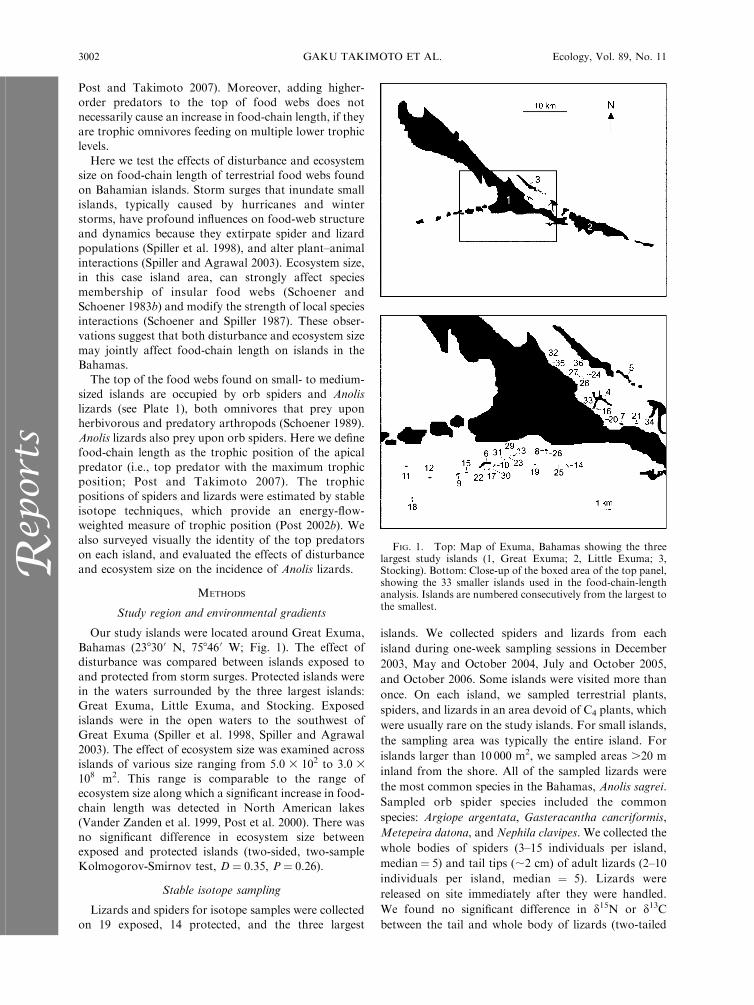
The top of the food webs found on small- to medium-sized islands are occupied by orb spiders and Anolis
lizards (see Plate 1), both omnivores that prey uponherbivorous and predatory arthropods (Schoener 1989).
Anolis lizards also prey upon orb spiders. Here we definefood-chain length as the trophic position of the apical
predator (i.e., top predator with the maximum trophicposition; Post and Takimoto 2007). The trophic
positions of spiders and lizards were estimated by stableisotope techniques, which provide an energy-flow-weighted measure of trophic position (Post 2002b). We
also surveyed visually the identity of the top predatorson each island, and evaluated the effects of disturbance
and ecosystem size on the incidence of Anolis lizards.
METHODS
Study region and environmental gradients
Our study islands were located around Great Exuma,
Bahamas (238300 N, 758460 W; Fig. 1). The effect ofdisturbance was compared between islands exposed to
and protected from storm surges. Protected islands werein the waters surrounded by the three largest islands:Great Exuma, Little Exuma, and Stocking. Exposed
islands were in the open waters to the southwest ofGreat Exuma (Spiller et al. 1998, Spiller and Agrawal
2003). The effect of ecosystem size was examined acrossislands of various size ranging from 5.0 3 102 to 3.0 3
108 m2. This range is comparable to the range ofecosystem size along which a significant increase in food-
chain length was detected in North American lakes(Vander Zanden et al. 1999, Post et al. 2000). There was
no significant difference in ecosystem size betweenexposed and protected islands (two-sided, two-sample
Kolmogorov-Smirnov test, D¼ 0.35, P ¼ 0.26).
Stable isotope sampling
Lizards and spiders for isotope samples were collected
on 19 exposed, 14 protected, and the three largest
islands. We collected spiders and lizards from each
island during one-week sampling sessions in December
2003, May and October 2004, July and October 2005,
and October 2006. Some islands were visited more than
once. On each island, we sampled terrestrial plants,
spiders, and lizards in an area devoid of C4 plants, which
were usually rare on the study islands. For small islands,
the sampling area was typically the entire island. For
islands larger than 10 000 m2, we sampled areas .20 m
inland from the shore. All of the sampled lizards were
the most common species in the Bahamas, Anolis sagrei.
Sampled orb spider species included the common
species: Argiope argentata, Gasteracantha cancriformis,
Metepeira datona, and Nephila clavipes. We collected the
whole bodies of spiders (3–15 individuals per island,
median¼ 5) and tail tips (;2 cm) of adult lizards (2–10
individuals per island, median ¼ 5). Lizards were
released on site immediately after they were handled.
We found no significant difference in d15N or d13Cbetween the tail and whole body of lizards (two-tailed
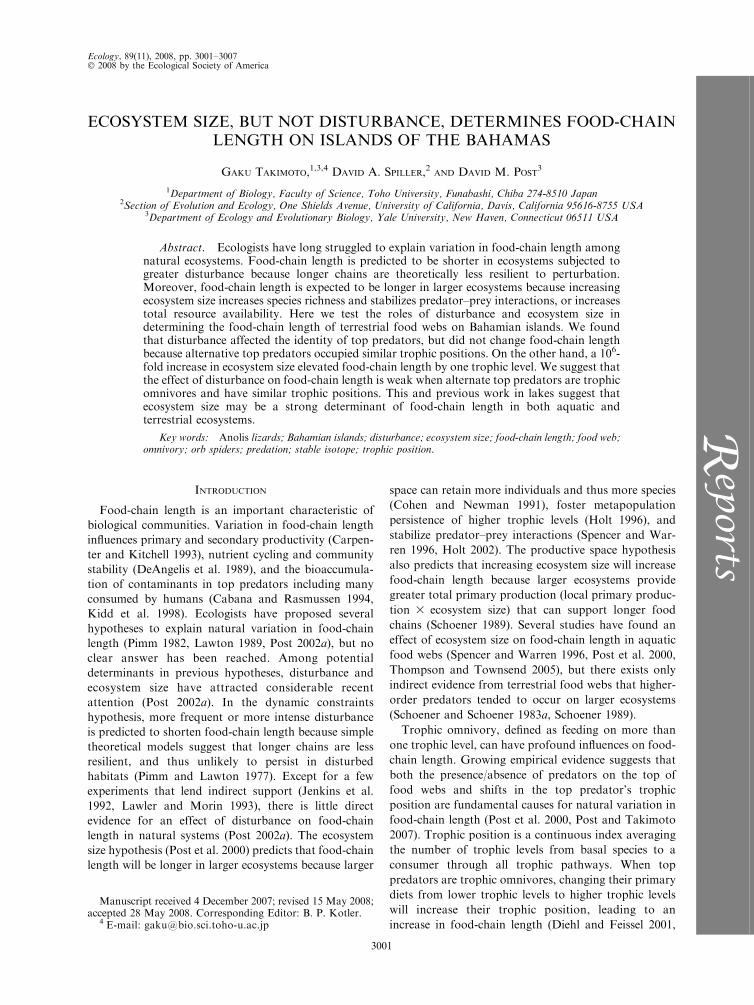
FIG. 1. Top: Map of Exuma, Bahamas showing the threelargest study islands (1, Great Exuma; 2, Little Exuma; 3,Stocking). Bottom: Close-up of the boxed area of the top panel,showing the 33 smaller islands used in the food-chain-lengthanalysis. Islands are numbered consecutively from the largest tothe smallest.
GAKU TAKIMOTO ET AL.3002 Ecology, Vol. 89, No. 11R
epor
ts
paired t test: t9¼ 0.30 and P¼ 0.77 for d15N; t9¼ 1.2 and
P ¼ 0.28 for d13C).Because lizards and spiders on our study islands can
receive a significant amount of carbon and nitrogen
from both terrestrial and marine sources, we sampled
terrestrial plant leaves for the terrestrial isotopic
baseline, and marine-derived detritus (particulate or-
ganic matter, POM) for the marine isotopic baseline, of
our study food webs. Isotopic baselines are the isotopic
signatures of producers (or primary consumers) to
account for spatial and temporal variation in isotopic
signatures at the base of food chains when calculating
the trophic positions of secondary consumers (Post
2002b). For the terrestrial isotopic baseline, we haphaz-
ardly sampled plant leaves within a 20 m radius from the
area where spiders and lizards were collected. We
decided that 20 m was an appropriate scale for capturing
spatial variation in the isotope signature of terrestrial
plants because orb spiders are sedentary and lizard
territories average ;10 m2 (Schoener and Schoener
1982). From each of five plants on small islands and 10
plants on large islands, we collected and combined five
leaves into a single isotope sample. Major plant species
included Borrichia arborescens, Coccoloba uvifera, Coc-
coloba diversifolia, Conocarpus erectus, and Pithecel-
lobium keyense. Marine POM was sampled at two
locations in the low-littoral zone of each island by
filtrating up to 6 L of seawater through 1-lm mesh glass
fiber filters. Because marine POM collected in this way
provides a short temporal snapshot of the marine
isotopic baseline, we averaged the d15N and d13C of
marine POM across all sampling sessions to obtain
d15Nmar and d13Cmar. Macro green algae (probably
Neomeris or Batophora) in the low-littoral zone of each
island could also be a source of marine-derived material
to spiders and lizards, but using green algae as the
marine isotopic baseline did not change our conclusions
(see Appendix).
Sample preparation and stable isotope measurements
All samples were dried at 558C for 48 h. Plant leaves,
spider bodies, and lizard tails were ground to fine
powder. The POM filters were cut into halves; one-half
was used to estimate d15N and the other was used to
estimate d13C after fumigation with hydrochloric acid to
eliminate carbonates. Isotope analysis was performed
with a Delta Plus Advantage stable isotope mass
spectrometer (Thermo Electron, Bremen, Germany) at
Earth Systems Center for Stable Isotope Studies
(ESCSIS) at Yale Institute for Biospheric Studies. The
standard deviation of replicates of ESCSIS animal
standard was 0.14ø for d13C and 0.22ø for d15N,
and of ESCSIS plant standard 0.06ø for d13C and
0.15ø for d15N. All stable-isotope values were reported
in the d notation: d13C or d15N ¼ ([Xsam/Xstd] � 1) 3
1000, where X is 13C/12C or 15N/14N. d13C values of
spider bodies and lizard tails were corrected for lipids
following Post et al. (2007) using the relationship
PLATE 1. Top predators on small to medium-sized Bahamian islands. (Left) Argiope argentata (orb spider). (Right) Anolissagrei (lizard). Photo credits: G. Takimoto (left) and D. A. Spiller (right).
November 2008 3003DETERMINANTS OF FOOD-CHAIN LENGTHR
eports
between C:N ratio and lipid-caused d13C change
established for our study organisms (d13Ccor¼ d13Cuncor
þ 0.99 3 [C/N ratio] � 2.5).
Estimates of food-chain length and statistical analysis
We estimated food-chain length as the trophic
position of the apical predator (Post et al. 2000, Post
and Takimoto 2007). Trophic position is calculated as kþ (d15Norg � d15Nbase)/DN, where k is the trophic
position of the organism used to estimate d15Nbase (k ¼1 in our case), d15Norg is measured directly, and DN is theaverage trophic fractionation in d15N per trophic level.
For all but the largest islands, we estimated the trophic
position of each spider and lizard using a two-end-
member mixing model for isotopic-baseline correction
(Post 2002b). For the three largest islands, spiders and
lizards were collected from the center of the island where
marine inputs were minimal; therefore, we used terres-trial plants as the single isotopic baseline for calculating
trophic position. We employed as the nominal values the
standard trophic fractionation of 3.4ø for d15N and 0øfor d13C, and also confirmed that deviation from these
values did not alter our conclusion (Appendix). All
statistical analyses were performed in R version 2.4.1 (RDevelopment Core Team 2006).
RESULTS
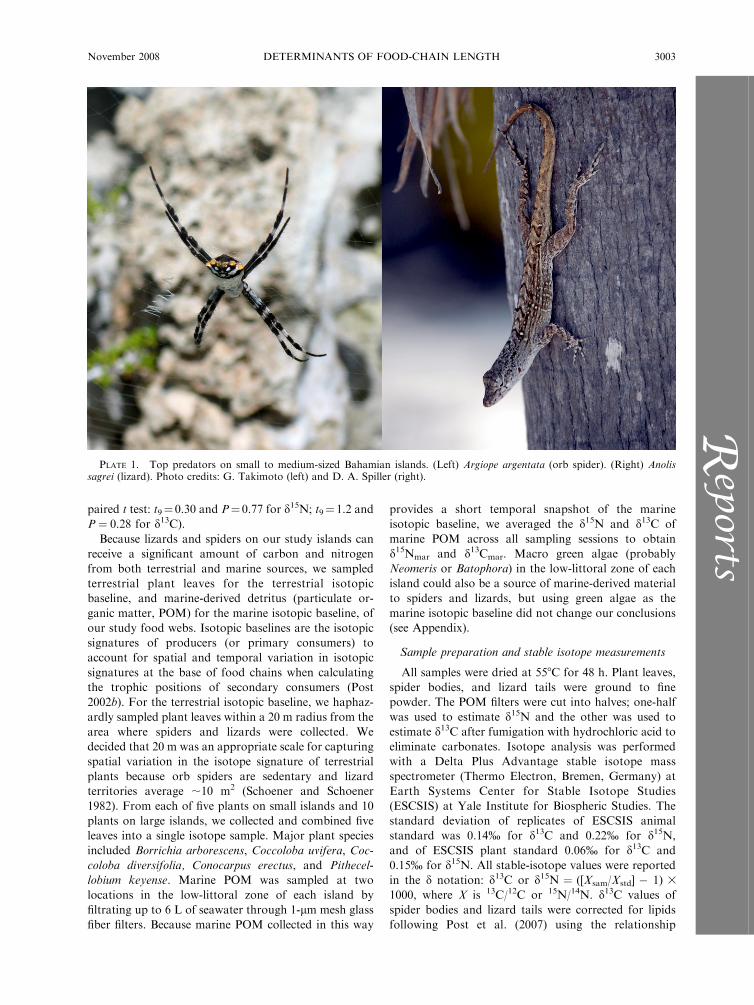
We found a strong significant positive relationship
between ecosystem size and food-chain length among
protected and exposed islands without the largest islands(ANCOVA, F1,31¼ 20.1, P , 10�4, food-chain length¼0.270 log(area)þ 0.831, R2¼ 0.39; plotting residuals vs.
fitted values showed no trend), but no effect of
disturbance on the intercept (F1,30 ¼ 0.80, P ¼ 0.38) or
the slope (the ecosystem size 3 disturbance interaction,
F1,29 ¼ 0.82, P ¼ 0.37) of the relationship between
ecosystem size and food-chain length. Because distur-
bance had no effect, we included data from the three
largest islands to further investigate the relationship
between food-chain length and ecosystem size. The
relationship for all islands combined was best represent-
ed by the asymptotic model (2.99 [1 � exp(�0.26 log
area)]; Fig. 2), which explained 55% of the variation in
food-chain length (R2 ¼ 0.55). Food-chain length
increased by about one trophic level from the smallest
to the largest islands.
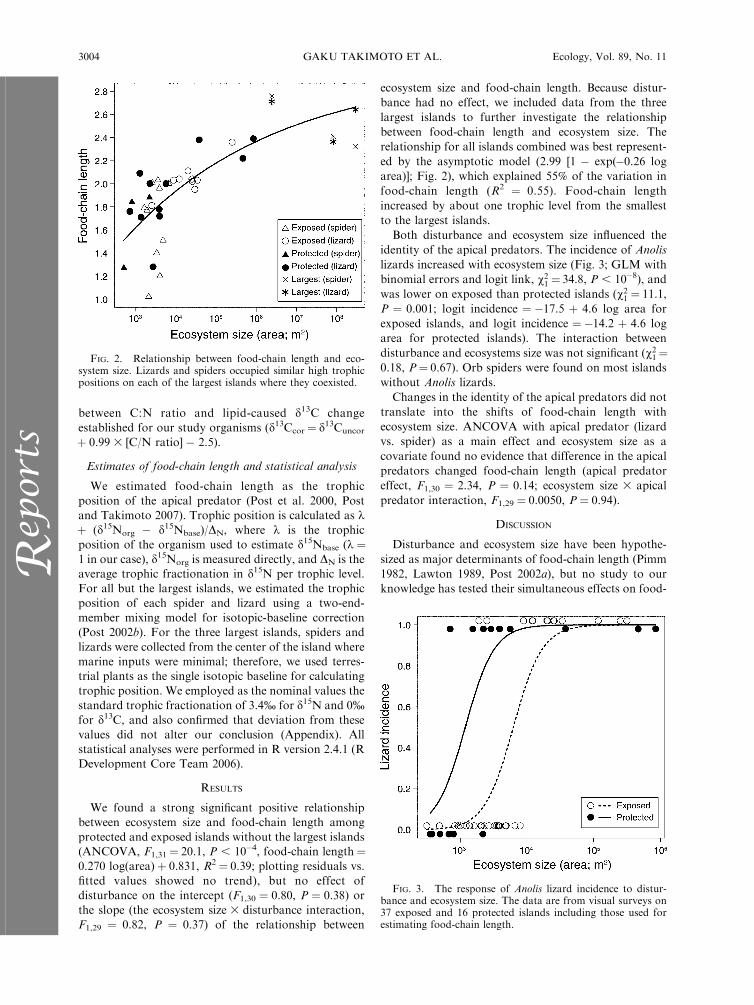
Both disturbance and ecosystem size influenced the
identity of the apical predators. The incidence of Anolis
lizards increased with ecosystem size (Fig. 3; GLM with
binomial errors and logit link, v21 ¼ 34.8, P , 10�8), and
was lower on exposed than protected islands (v21 ¼ 11.1,
P ¼ 0.001; logit incidence ¼ �17.5 þ 4.6 log area for
exposed islands, and logit incidence ¼�14.2 þ 4.6 log
area for protected islands). The interaction between
disturbance and ecosystems size was not significant (v21¼
0.18, P¼ 0.67). Orb spiders were found on most islands
without Anolis lizards.
Changes in the identity of the apical predators did not
translate into the shifts of food-chain length with
ecosystem size. ANCOVA with apical predator (lizard
vs. spider) as a main effect and ecosystem size as a
covariate found no evidence that difference in the apical
predators changed food-chain length (apical predator
effect, F1,30 ¼ 2.34, P ¼ 0.14; ecosystem size 3 apical
predator interaction, F1,29 ¼ 0.0050, P ¼ 0.94).
DISCUSSION
Disturbance and ecosystem size have been hypothe-
sized as major determinants of food-chain length (Pimm
1982, Lawton 1989, Post 2002a), but no study to our
knowledge has tested their simultaneous effects on food-
FIG. 2. Relationship between food-chain length and eco-system size. Lizards and spiders occupied similar high trophicpositions on each of the largest islands where they coexisted.
FIG. 3. The response of Anolis lizard incidence to distur-bance and ecosystem size. The data are from visual surveys on37 exposed and 16 protected islands including those used forestimating food-chain length.
GAKU TAKIMOTO ET AL.3004 Ecology, Vol. 89, No. 11R
epor
ts
chain length in natural ecosystems. While disturbance
was shown to strongly affect food-web structure and
dynamics on small islands of the Bahamas (Spiller and
Agrawal 2003), we found no evidence that disturbance
influenced food-chain length. On the other hand, the
effect of ecosystem size on food-chain length was highly
significant. Our results support the hypothesis that
ecosystem size, but not disturbance, affects food-chain
length on these islands.
Why did we not find an effect of disturbance on food-
chain length? We did find that disturbance affected the
identity of the apical predators; orb spiders were the
apical predators on small exposed islands and Anolis
lizards were the apical predator on small protected
islands. However, this difference in the identity of the
apical predators did not change food-chain length;
lizards on small protected islands occupied a low trophic
position similar to that of orb spiders on small exposed
islands (Fig. 2). Previous observational and experimen-
tal studies on Bahamian islands suggest that the
coexistence of orb spiders and Anolis lizards is difficult
on small islands (Schoener and Toft 1983, Schoener and
Spiller 1996, Spiller and Schoener 1998), and in this
study we rarely observed orb spiders on small protected
islands that had Anolis lizards (D. A. Spiller and G.
Takimoto, personal observation). The pattern on small
islands is caused by very intense lizard predation on orb
spiders. Field experiments revealed that lizard predation
on orb spiders was devastating on small islands
(Schoener and Spiller 1996), but weaker on a large
island (Spiller and Schoener 1998). This suggests that
strong predation by lizards extirpated or drastically
reduced orb spiders and other predatory arthropods on
small protected islands, shifting the diet of lizards
toward organisms at lower trophic levels such as
herbivorous arthropods, and effectively lowering the
trophic position of lizards. Therefore, the presence of
lizard populations on small protected islands did not
cause an increase in food-chain length. On the other
hand, an increase in ecosystem size promotes coexistence
of lizards and predatory arthropods. This allows lizards
to feed on predatory arthropods on larger islands,
increasing the trophic position of lizards, and thus
promoting longer food chains.
We note that our exposed and protected islands were
spatially clustered, which might have confounded the
effect of disturbance. Apart from the levels of distur-
bance, the protected and exposed islands may differ in at
least two other respects (Spiller and Agrawal 2003).
First, the exposed islands are generally more distant
from the largest island, Great Exuma (Fig. 1). This
might result in some predators being absent from
exposed islands and shorten food-chain length, poten-
tially exaggerating the expected negative effect of
disturbance. Yet this seems to have had little influence
given that we found no disturbance effect. Second,
exposed islands might receive higher rainfall when the
predominant eastern trade winds blow across the
warmer land mass of Great Exuma, causing rainfall on
these islands but not on the protected ones. This could
counter the expected disturbance effect by enriching and
therefore lengthening food chains on exposed islands in
accordance with the productive space hypothesis. The
second possibility might partially explain the lack of a
disturbance effect in our system.
This study provides the first quantitative evidence for
the effect of ecosystem size on food-chain length in a
terrestrial ecosystem. Our finding is consistent with
related evidence that food-chain length was truncated in
fragmented landscapes (Komonen et al. 2000, Kruess
and Tscharntke 2000), although fragmentation may not
always reduce food-chain length (Mikkelson 1993).
Beyond terrestrial systems, our result parallels the
finding from North American lakes in which increases
in food-chain length strongly correlated with increases in
ecosystem size (Vander Zanden et al. 1999, Post et al.
2000). On the other hand, a recent meta-analysis of
aquatic food-chain length across the globe did not
generally find evidence for the relationship between
ecosystem size and food-chain length (Vander Zanden
and Fetzer 2007). Arguably, biogeographic and coevo-
lutionary histories play important roles in determining
food-chain length (Kitching 2000, Post 2002a). Our
results and that of others suggest that ecosystem size is
an important determinant of food-chain length for food
webs sharing the same regional species pool.
The ecosystem size hypothesis (Post et al. 2000)
suggests that an increase in ecosystem size enhances
species richness (Cohen and Newman 1991), stabilizes
predator–prey interactions (Spencer and Warren 1996),
and fosters metapopulation persistence of higher trophic
levels (Holt 1996); all of these favor a longer food chain.
Our results suggest that, unlike the original suggestion
of disturbance by Pimm and Lawton (1977), ecosystem
size is a rather important driver that determines the
effects of dynamic constraints on food-chain length.
Large islands provide spiders and other carnivorous
arthropods with spatial refuges from lizard predation
where lizards are temporally or permanently absent. It is
also possible that the species–area relationship (Connor
and McCoy 1979, Rosenzweig 1995) dictates higher
species richness on larger islands; this may provide
alternative prey for lizards and carnivorous arthropods,
potentially stabilizing intraguild predation (Daugherty
et al. 2007, Holt and Huxel 2007, Namba et al. 2008).
These suggest that ecosystem size may act to alleviate
dynamic constraints in our system. Although the
productive space hypothesis, emphasizing the effect of
resource availability, predicts longer chains in larger
ecosystems (Schoener 1989), our study was not designed
to test between the ecosystem size vs. productive space
hypotheses because we did not measure primary
production (such a test would require independent
gradients of ecosystem size and local productivity as in
Post et al. [2000]).
November 2008 3005DETERMINANTS OF FOOD-CHAIN LENGTHR
eports
Changes in food-chain length on our islands were
driven primarily by shifts in the trophic position of top
predators rather than differences in the identity of top
predators, suggesting that structural changes at the
middle of food webs are important. Shifts in the top
predator’s trophic position can occur either by changing
the proportions in their diet from different trophic levels
(without changing the number of species in food webs),
or by inserting new intermediate predators (Post et al.
2000, Post and Takimoto 2007). Both mechanisms may
be at play on our islands. Anolis lizards feed on a wide
trophic spectrum (Schoener 1968), possibly changing the
degree of trophic omnivory as ecosystem size changes.
However, at least on the largest islands where lizards
and orb spiders coexisted, lizards and spiders showing
similar trophic positions (Fig. 2) suggest that the
incidence of spiders in lizard diets was not large enough
to make their trophic position higher than that for
spiders. On the other hand, larger islands tend to
contain a greater number of intermediate predators such
as parasitoids (Schoener et al. 1995) and other carniv-
orous arthropods (M. Murakami and T. Hirao, un-
published data), as is expected from the species–area
relationship. These would insert new intermediate
trophic levels, increasing the top predator’s trophic
position. Altogether, the combination of opportunistic
feeding by lizards and spiders and higher prey diversity
following from the species–area relationship appears to
play a large role in increasing their trophic position with
increasing ecosystem size. Unlike our results, both the
trophic position and alternation of top predators are
similarly important in the North American lakes (Post et
al. 2000). For the Bahamian islands, Schoener (1989)
suggested that in addition to spiders and Anolis lizards,
higher-order predators, such as birds, snakes, and larger
lizards capable of preying upon Anolis lizards, might
elevate food-chain length on larger islands. Whether the
addition of these higher-order predators can actually
increase food-chain length on the Bahamian islands will
depend on their trophic position.
In conclusion, we suggest that a simple relationship
between disturbance and food-chain length may be
obscured by complex responses of natural food webs
with trophic omnivory to perturbations (Menge and
Sutherland 1987, Power et al. 1996, Post 2002a). On the
other hand, a shift in the diet of omnivorous top
predators can be a major structural mechanism causing
a positive effect of ecosystem size on food-chain length.
Our results support the growing evidence for a positive
effect of ecosystem size on food-chain length in aquatic
ecosystems (Spencer and Warren 1996, Vander Zanden
et al. 1999, Post et al. 2000, Thompson and Townsend
2005) and now in a terrestrial ecosystem.
ACKNOWLEDGMENTS
We thank M. Hasegawa, M. Hori, R. Holt, M. Kagami, J.Piovia-Scott, M. Spencer, A. Wright, L. Yang, and ananonymous reviewer for helpful comments on the manuscript.
Assistance in the field or in the laboratory by G. Olack, H.Kurokawa, and M. Spiller was invaluable. This work wassupported by Japan Society for the Promotion of Science(KAKENHI 03J09516 and 19870022) and the U.S. NationalScience Foundation (DEB-0316679, DEB-9904121, and DEB-0516431).
LITERATURE CITED
Cabana, G., and J. B. Rasmussen. 1994. Modeling food chainstructure and contaminant bioaccumulation using stablenitrogen isotopes. Nature 372:255–257.
Carpenter, S. R., and J. F. Kitchell, editors. 1993. The trophiccascade in lakes. Cambridge University Press, Cambridge,UK.
Cohen, J. E., and C. M. Newman. 1991. Community area andfood-chain length: theoretical predictions. American Natu-ralist 138:1542–1554.
Connor, E. F., and E. D. McCoy. 1979. The statistics andbiology of the species–area relationship. American Naturalist113:791–833.
Daugherty, M. P., J. P. Harmon, and C. J. Briggs. 2007.Trophic supplements to intraguild predation. Oikos 116:662–677.
DeAngelis, D. L., S. M. Bartell, and A. L. Brenkert. 1989.Effects of nutrient recycling and food-chain length onresilience. American Naturalist 134:778–805.
Diehl, S., and M. Feissel. 2001. Intraguild prey suffer fromenrichment of their resources: a microcosm experiment withciliates. Ecology 82:2977–2983.
Holt, R. D. 1996. Food webs in space: an island biogeographicperspective. Pages 313–323 in G. A. Polis and K. O.Winemiller, editors. Food webs: integration of patterns anddynamics. Chapman and Hall, New York, New York, USA.
Holt, R. D. 2002. Food webs in space: on the interplay ofdynamic instability and spatial processes. Ecological Re-search 17:261–273.
Holt, R. D., and G. R. Huxel. 2007. Alternative prey and thedynamics of intraguild predation: theoretical perspectives.Ecology 88:2706–2712.
Jenkins, B., R. L. Kitching, and S. L. Pimm. 1992. Productivity,disturbance and food web structure at a local spatial scale inexperimental container habitats. Oikos 65:249–255.
Kidd, K. A., D. W. Schindler, R. H. Hesslein, and D. C. G.Muir. 1998. Effects of trophic position and lipid onorganochlorine concentrations in fishes from subarctic lakesin Yukon Territory. Canadian Journal of Fisheries andAquatic Sciences 55:869–881.
Kitching, R. L. 2000. Food webs and container habitats.Cambridge University Press, Cambridge, UK.
Komonen, A., R. Penttila, M. Lindgren, and I. Hanski. 2000.Forest fragmentation truncates a food chain based on an old-growth forest bracket fungus. Oikos 90:119–126.
Kruess, A., and T. Tscharntke. 2000. Species richness andparasitism in a fragmented landscape: experiments and fieldstudies with insects on Vicia sepium. Oecologia 122:129–137.
Lawler, S. P., and P. J. Morin. 1993. Food web architecture andpopulation dynamics in laboratory microcosms of protists.American Naturalist 141:675–686.
Lawton, J. H. 1989. Food webs. Pages 43–78 in J. M. Cherrett,editor. Ecological concepts. Blackwell Scientific, Oxford,UK.
Menge, B. A., and J. P. Sutherland. 1987. Communityregulation: variation in disturbance, competition, and preda-tion in relation to environmental stress and recruitment.American Naturalist 130:730–757.
Mikkelson, G. M. 1993. How do food webs fall apart? A studyof changes in trophic structure during relaxation on habitatfragments. Oikos 67:539–547.
Namba, T., K. Tanabe, and N. Maeda. 2008. Omnivory andstability of food webs. Ecological Complexity 5:73–85.
GAKU TAKIMOTO ET AL.3006 Ecology, Vol. 89, No. 11R
epor
ts
Pimm, S. L. 1982. Food webs. Chapman and Hall, London,UK.
Pimm, S. L., and J. H. Lawton. 1977. The number of trophiclevels in ecological communities. Nature 275:542–544.
Post, D. M. 2002a. The long and short of food-chain length.Trends in Ecology and Evolution 17:269–277.
Post, D. M. 2002b. Using stable isotopes to estimate trophicposition: models, methods, and assumptions. Ecology 83:703–718.
Post, D. M., C. A. Layman, D. A. Arrington, G. Takimoto, J.Quattrochi, and C. G. Montana. 2007. Getting to the fat ofthe matter: models, methods, and assumptions for dealingwith lipids in stable isotope analysis. Oecologia 152:179–189.
Post, D. M., M. L. Pace, and N. G. Hairston. 2000. Ecosystemsize determines food-chain length in lakes. Nature 405:1047–1049.
Post, D. M., and G. Takimoto. 2007. Proximate structuralmechanisms for variation in food-chain length. Oikos 116:775–782.
Power, M. E., M. S. Parker, and J. T. Wootton. 1996.Disturbance and food chain length in rivers. Pages 286–297in G. A. Polis and K. O. Winemiller, editors. Food webs:integration of pattern and dynamics. Chapman and Hall,New York, New York, USA.
R Development Core Team. 2006. R: a language andenvironment for statistical computing. R Foundation forStatistical Computing, Vienna, Austria.
Rosenzweig, M. L. 1995. Species diversity in space and time.Cambridge University Press, Cambridge, UK.
Schoener, T. W. 1968. The Anolis lizards of Bimini: resourcepartitioning in a complex fauna. Ecology 49:704–726.
Schoener, T. W. 1989. Food webs from the small to the large.Ecology 70:1559–1589.
Schoener, T. W., and A. Schoener. 1982. Intraspecific variationin home-range size in some Anolis lizards. Ecology 63:809–823.
Schoener, T. W., and A. Schoener. 1983a. Distribution ofvertebrates on some very small islands. I. Occurrence
sequences of individual species. Journal of Animal Ecology52:209–235.
Schoener, T. W., and A. Schoener. 1983b. Distribution ofvertebrates on some very small islands. II. Patterns in speciesnumber. Journal of Animal Ecology 52:237–262.
Schoener, T. W., and D. A. Spiller. 1987. Effect of lizards onspider populations: manipulative reconstruction of a naturalexperiment. Science 236:949–952.
Schoener, T. W., and D. A. Spiller. 1996. Devastation of preydiversity by experimentally introduced predators in the field.Nature 381:691–694.
Schoener, T. W., D. A. Spiller, and L. W. Morrison. 1995.Variation in the hymenopteran parasitoid fraction onBahamian islands. Acta Oecologica 16:103–121.
Schoener, T. W., and C. A. Toft. 1983. Spider populations:extraordinarily high densities on islands without top preda-tors. Science 219:1353–1355.
Spencer, M., and P. H. Warren. 1996. The effects of habitat sizeand productivity on food web structure in small aquaticmicrocosms. Oikos 75:419–430.
Spiller, D. A., and A. A. Agrawal. 2003. Intense disturbanceenhances plant susceptibility to herbivory: natural andexperimental evidence. Ecology 84:890–897.
Spiller, D. A., J. B. Losos, and T. W. Schoener. 1998. Impact ofa catastrophic hurricane on island populations. Science 281:695–697.
Spiller, D. A., and T. W. Schoener. 1998. Lizards reduce spiderspecies richness by excluding rare species. Ecology 79:503–516.
Thompson, R. M., and C. R. Townsend. 2005. Energyavailability, spatial heterogeneity and ecosystem size predictfood-web structure in streams. Oikos 108:137–148.
Vander Zanden, M. J., and W. W. Fetzer. 2007. Global patternsof aquatic food chain length. Oikos 116:1378–1388.
Vander Zanden, M. J., B. J. Shuter, N. Lester, and J. B.Rasmussen. 1999. Patterns of food chain length in lakes: astable isotope study. American Naturalist 154:406–416.
APPENDIX
A table showing the sensitivity of the relationship between food-chain length and ecosystem size to different assumptions abouttrophic fractionation and isotopic baseline (Ecological Archives E089-174-A1).
November 2008 3007DETERMINANTS OF FOOD-CHAIN LENGTHR
eports