ecosystems - phoenix college 04-17... · spheres of organization • biosphere • lithosphere ......
TRANSCRIPT

Ecosystems
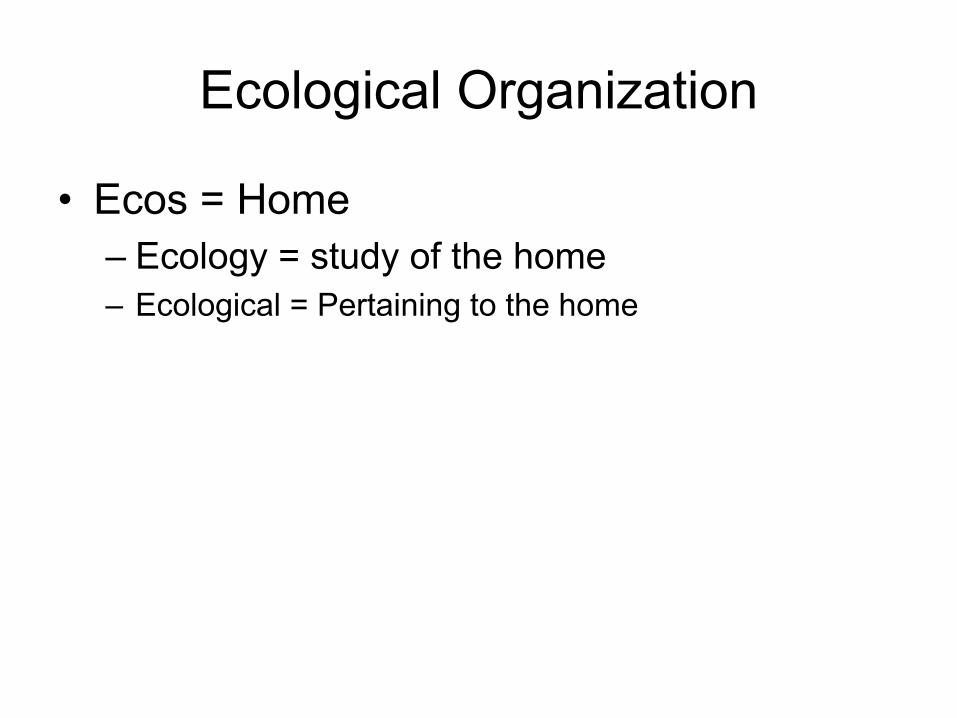
Ecological Organization
• Ecos = Home– Ecology = study of the home– Ecological = Pertaining to the home

Spheres of Organization
• Biosphere • Lithosphere
• Hydrosphere • Atmosphere
–Sphere of Life–Life cycle
–Sphere of Rocks–Rock cycle
–Sphere of Water–Water cycle
–Sphere of Air–Weather cycle

Biosphere
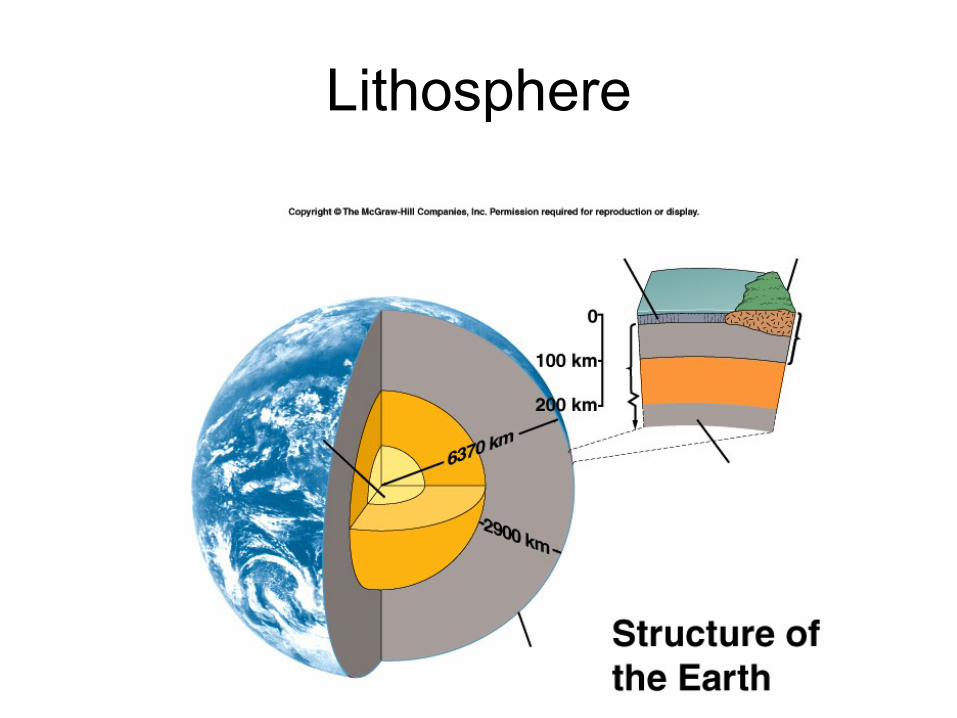
Lithosphere
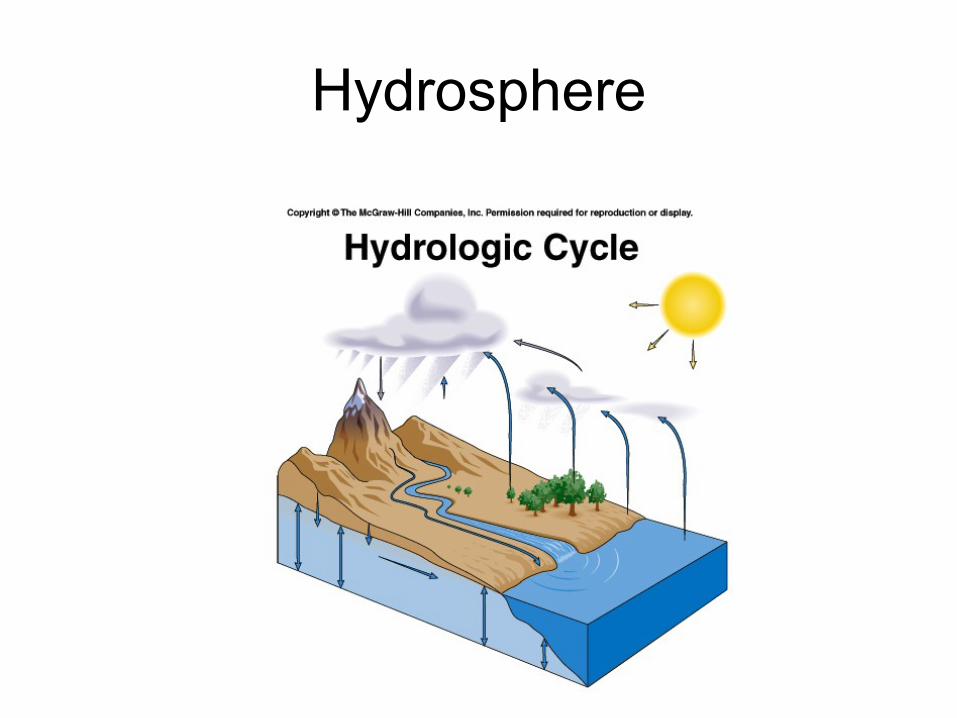
Hydrosphere

Atmosphere
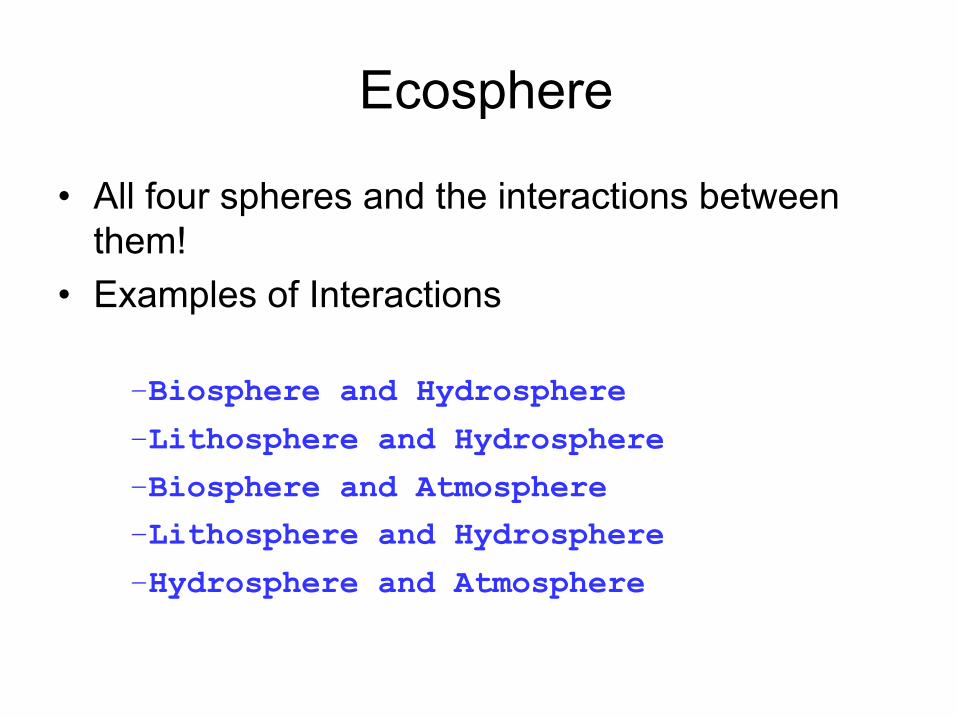
Ecosphere
• All four spheres and the interactions between them!
• Examples of Interactions
–Biosphere and Hydrosphere–Lithosphere and Hydrosphere–Biosphere and Atmosphere–Lithosphere and Hydrosphere–Hydrosphere and Atmosphere
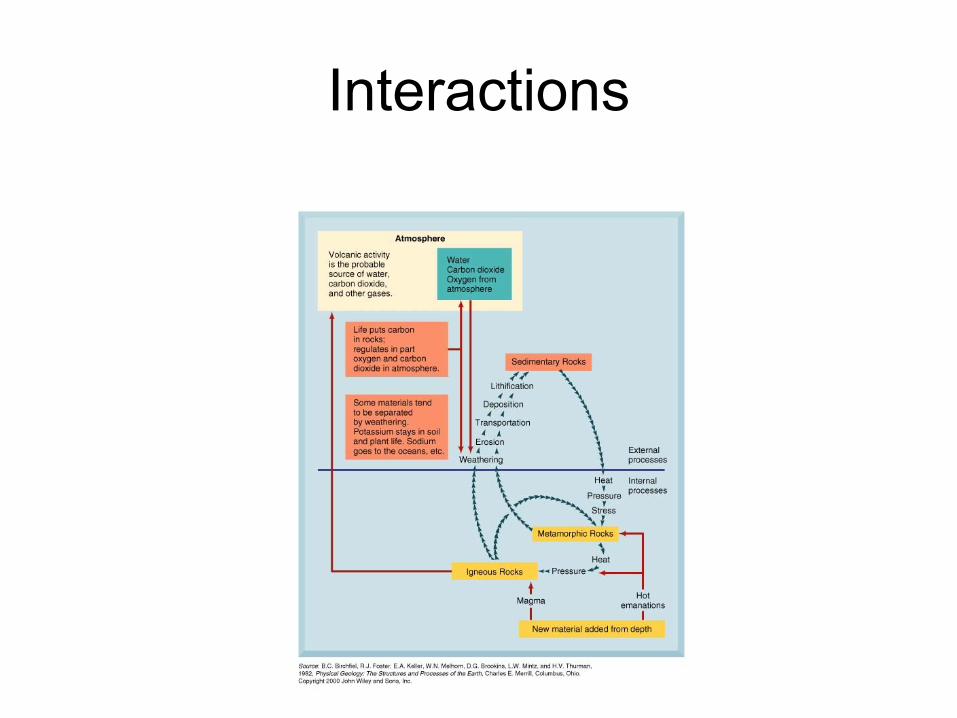
Interactions
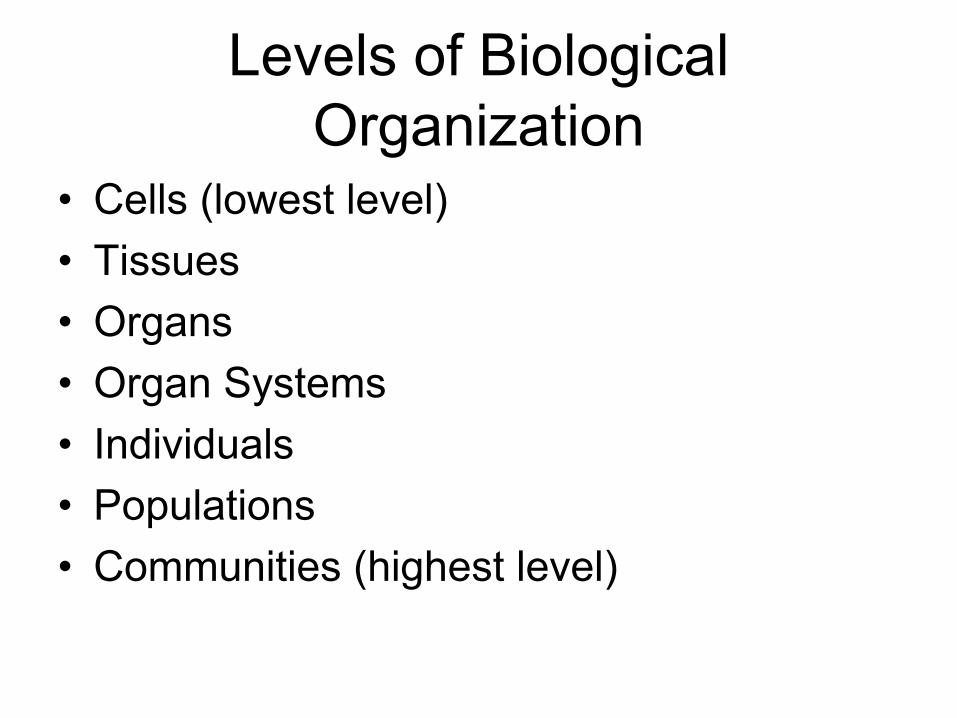
Levels of Biological Organization
• Cells (lowest level)• Tissues• Organs• Organ Systems• Individuals• Populations• Communities (highest level)

BiosphereBiosphere
Ecosystems
Communities
Populations
Organisms
Ecosystems
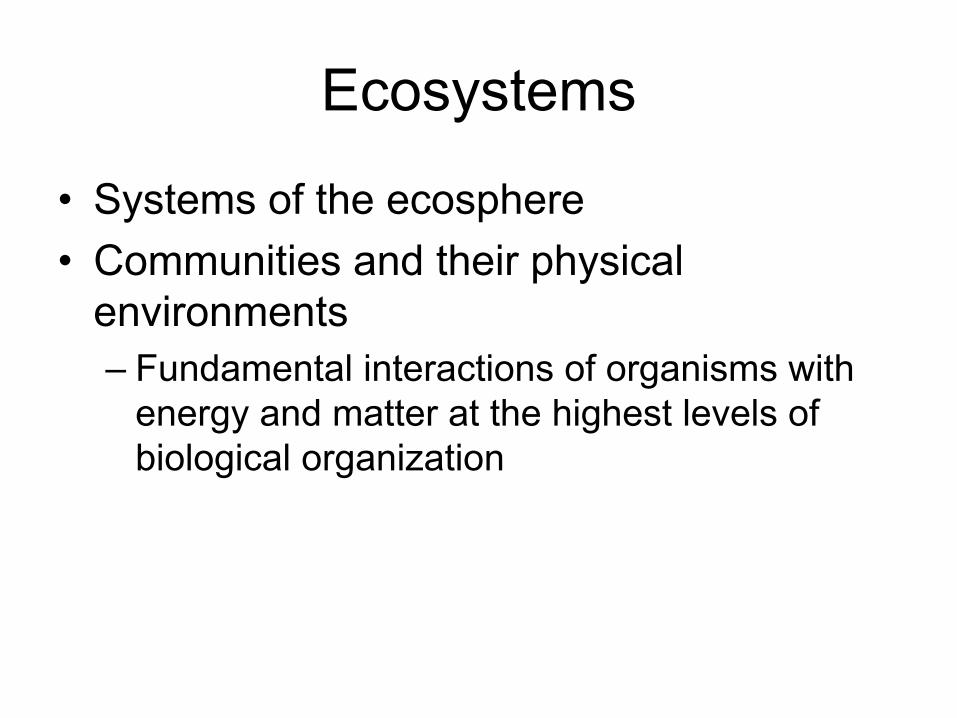
• Systems of the ecosphere• Communities and their physical
environments– Fundamental interactions of organisms with
energy and matter at the highest levels of biological organization
Ecosystems
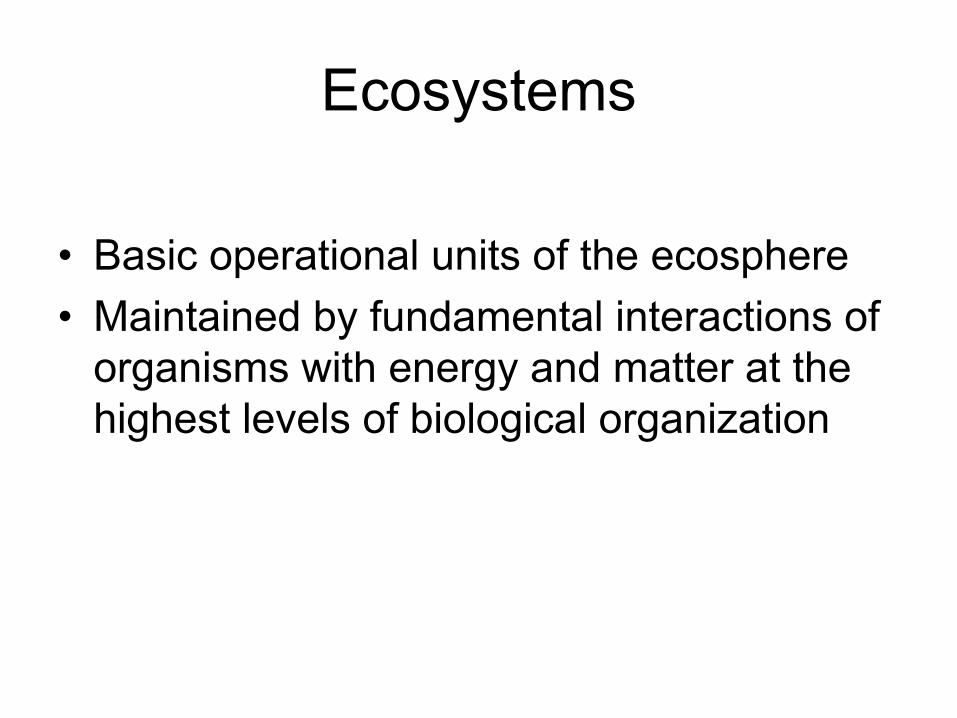
• Basic operational units of the ecosphere• Maintained by fundamental interactions of
organisms with energy and matter at the highest levels of biological organization
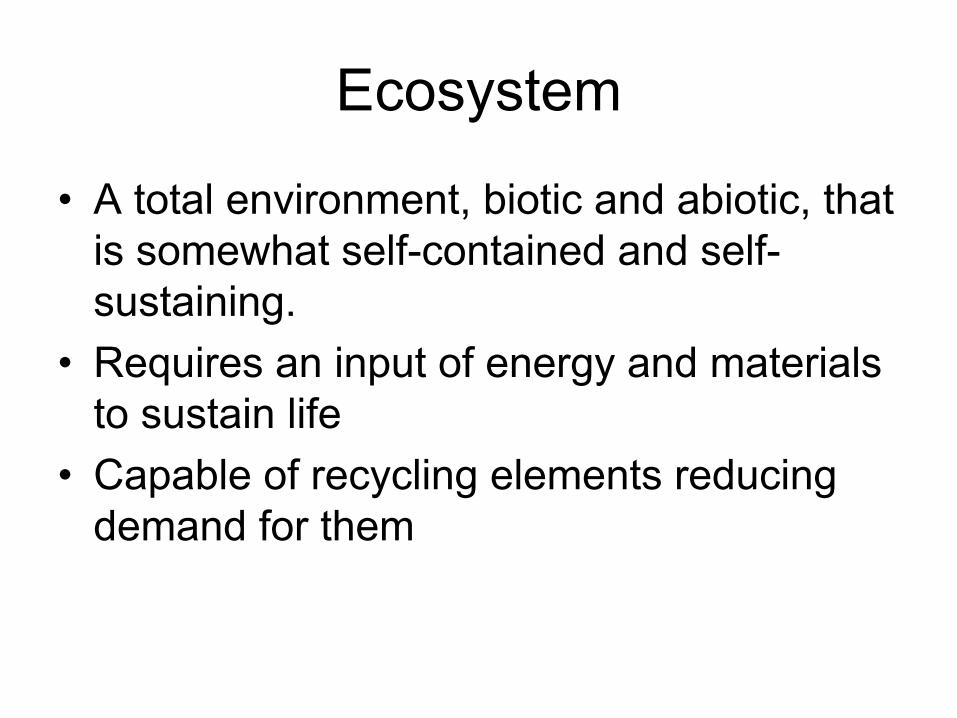
Ecosystem
• A total environment, biotic and abiotic, that is somewhat self-contained and self-sustaining.
• Requires an input of energy and materials to sustain life
• Capable of recycling elements reducing demand for them

Ecosystem Trophic Structure
• Feeding relationships influence the passage of energy and materials within ecosystems
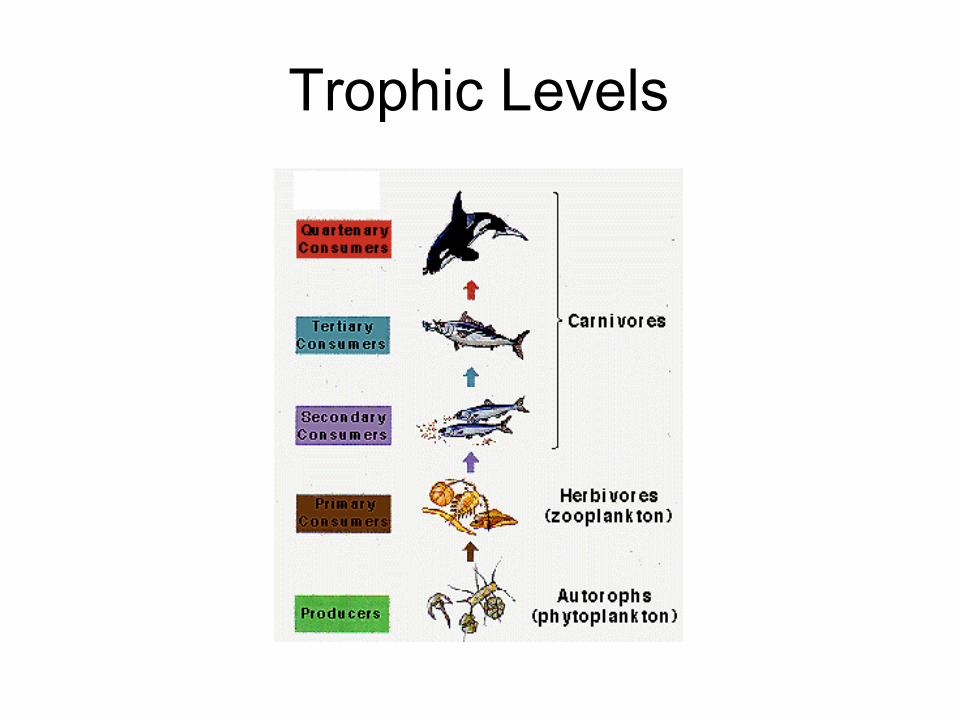
Trophic Levels

Producers
• Photoautotrophs• Energy and materials both enter the biotic
portion of ecosystems by the action of producers

Consumers
• Heterotrophs• Energy and materials are both transferred
between species in ecosystems by the action of consumers

Levels of Consumption
• 1o Consumers= eat producers– Includes all herbivores
• 2o and higher level Consumers= eat other consumers– Includes all carnivores
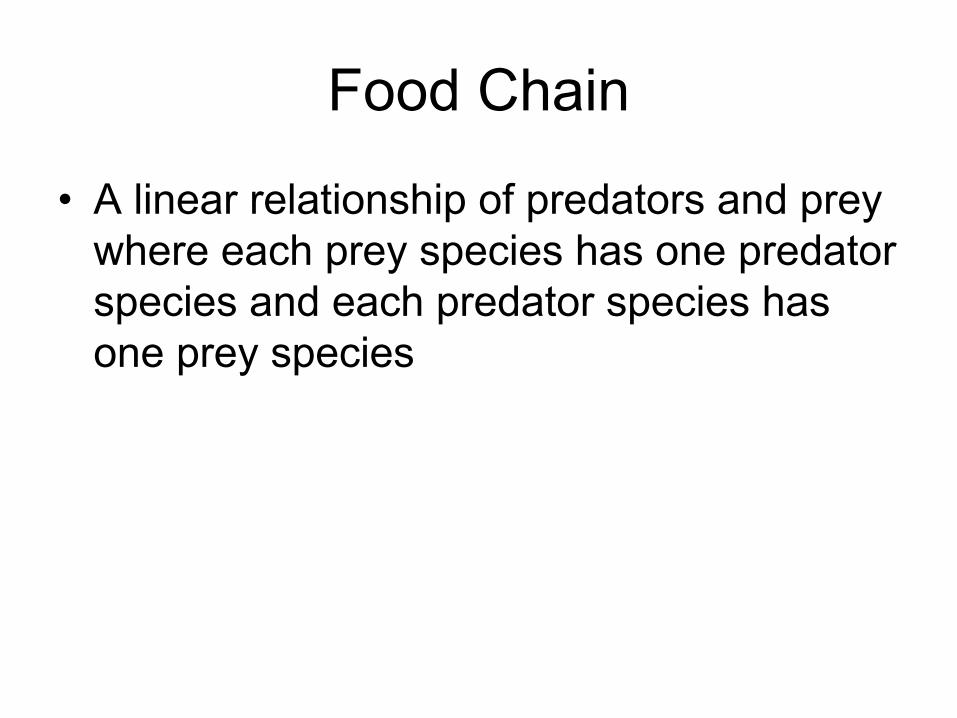
Food Chain
• A linear relationship of predators and prey where each prey species has one predator species and each predator species has one prey species
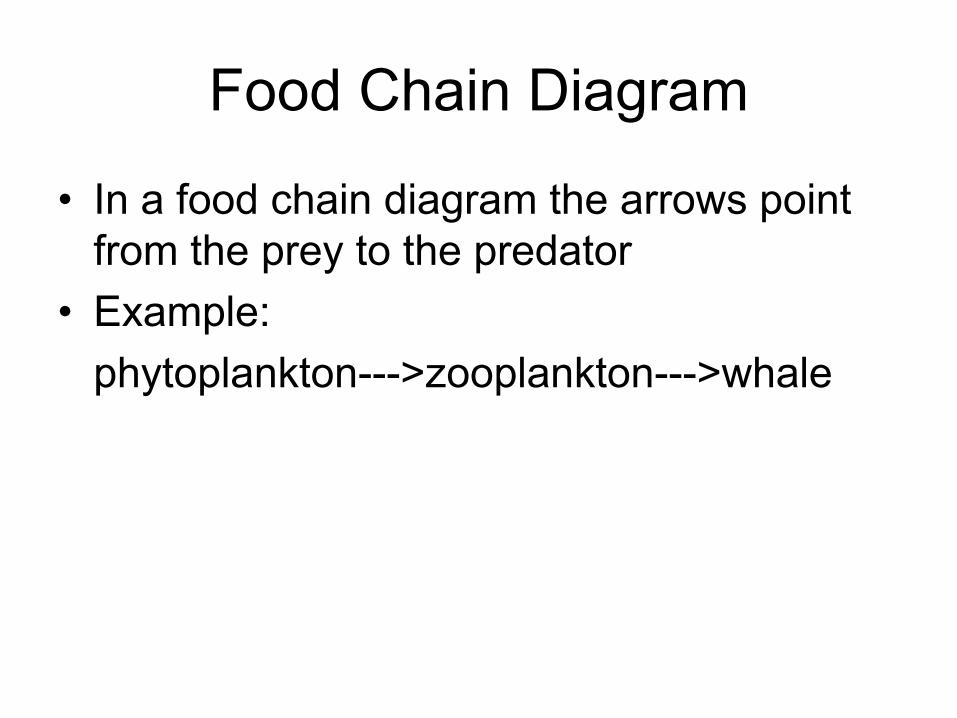
Food Chain Diagram
• In a food chain diagram the arrows point from the prey to the predator
• Example: phytoplankton--->zooplankton--->whale
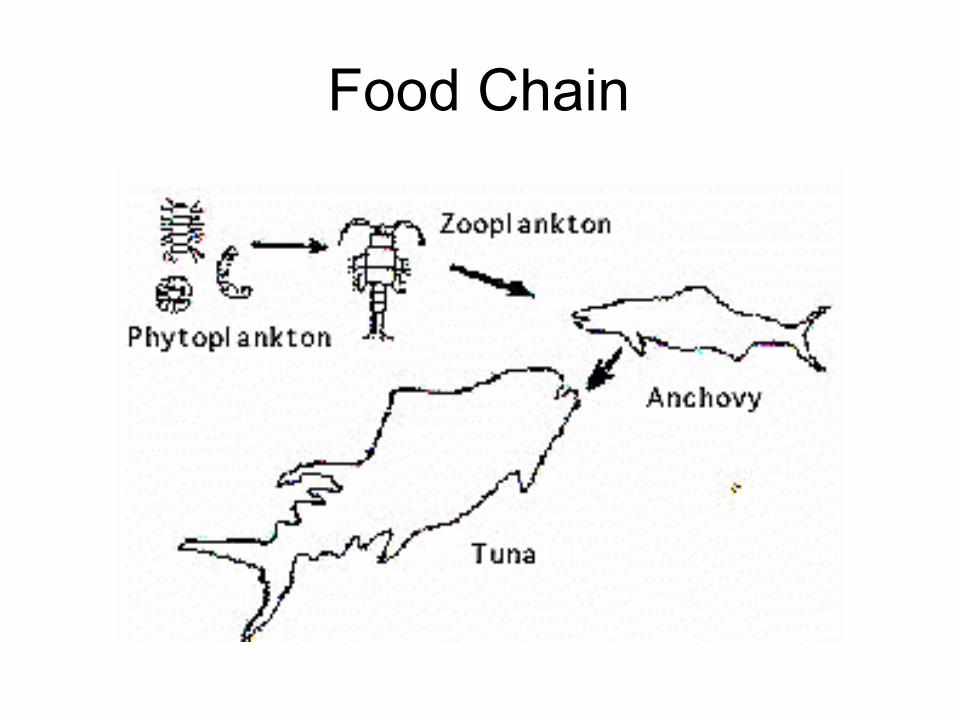
Food Chain
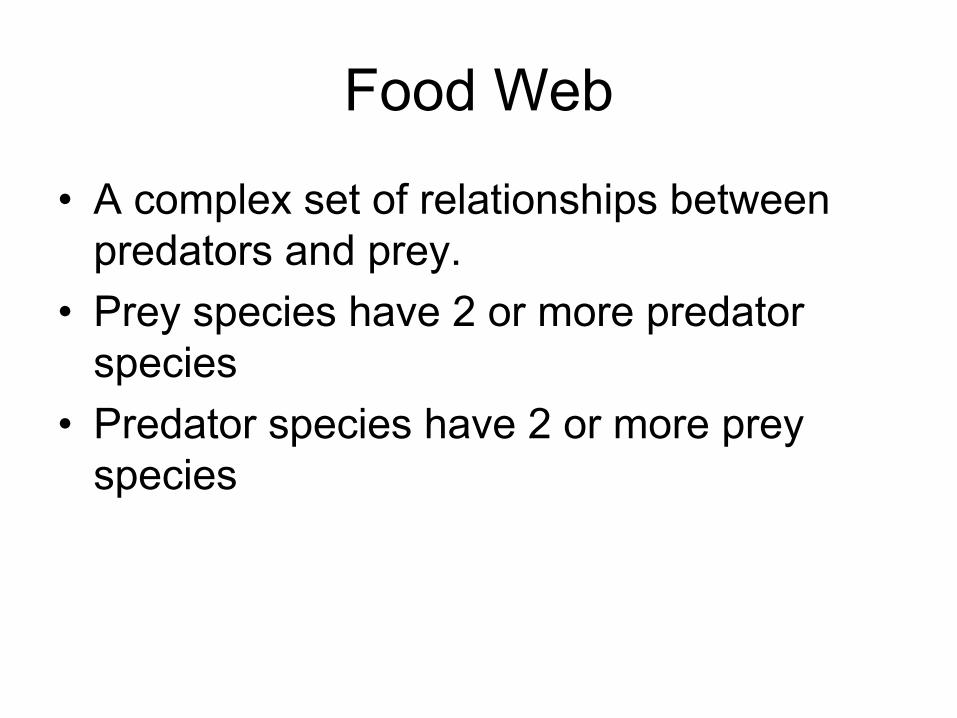
Food Web
• A complex set of relationships between predators and prey.
• Prey species have 2 or more predator species
• Predator species have 2 or more prey species

Food Web Diagram
• The arrows point from the prey to the predator.
• The producers are placed at the bottom with the herbivores just above them, and the carnivores at the top

Food Web
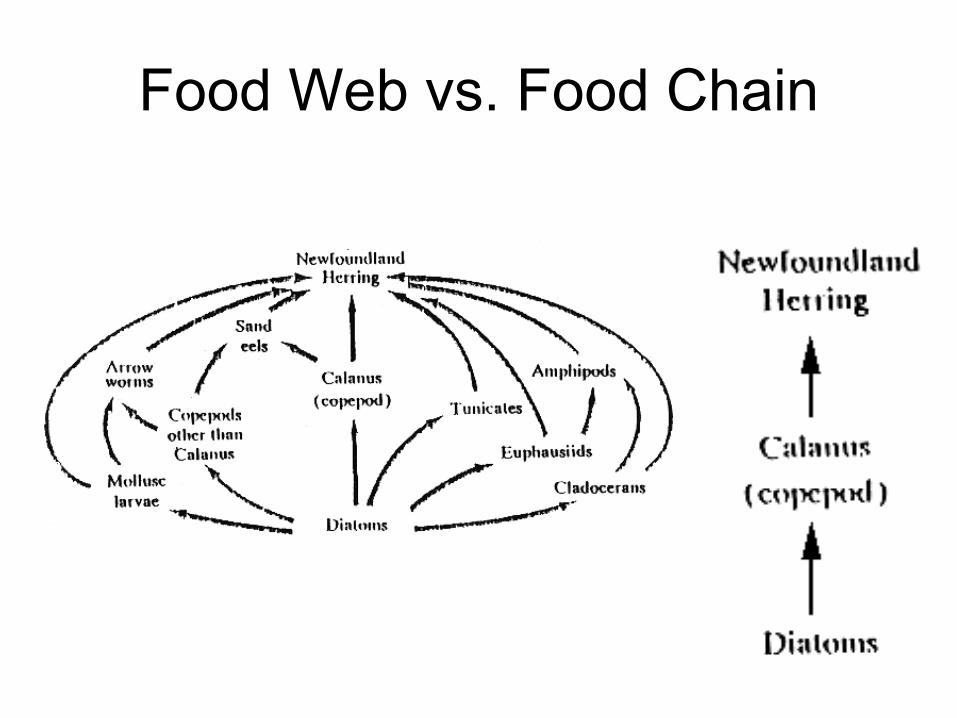
Food Web vs. Food Chain

Energy and Ecosystems
• Energy flows through an ecosystem• Open system with a continuous input and
an equivalent continuous output

Energy Passes Along the Chain
Energy Supply
• Most ecosystems rely on the unlimited supply of sunlight capturing it by photosynthesis
• Energy captured during photosynthesis is stored in the chemical bonds of the molecules synthesized during the process

Idealized diagram illustrating photosynthesis for a green plant (tree) and generalized reaction.
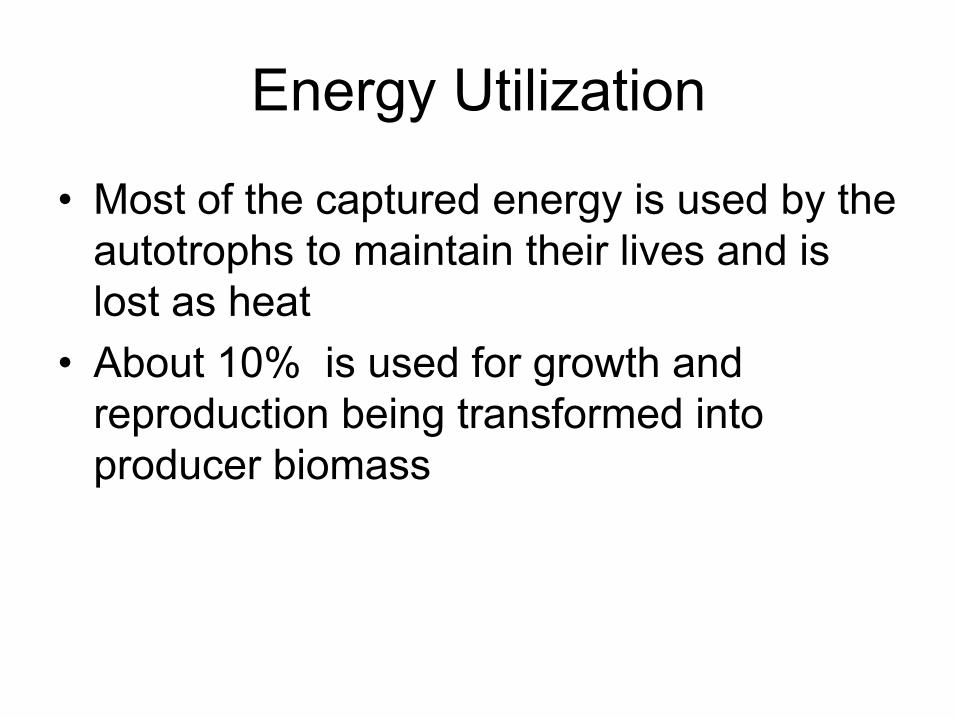
Energy Utilization
• Most of the captured energy is used by the autotrophs to maintain their lives and is lost as heat
• About 10% is used for growth and reproduction being transformed into producer biomass
Biomass
• Weight of living tissues• Wet weight or Dry weight

Available Energy
• The energy in producer biomass is transferred to herbivores and then to carnivores.
• Energy transfers are by ingestion, digestion, absorption and assimilation.
Energy Losses
• Energy is lost from an ecosystem in the form of heat and the chemical energy in wastes and dead organisms that are transported out of the ecosystem
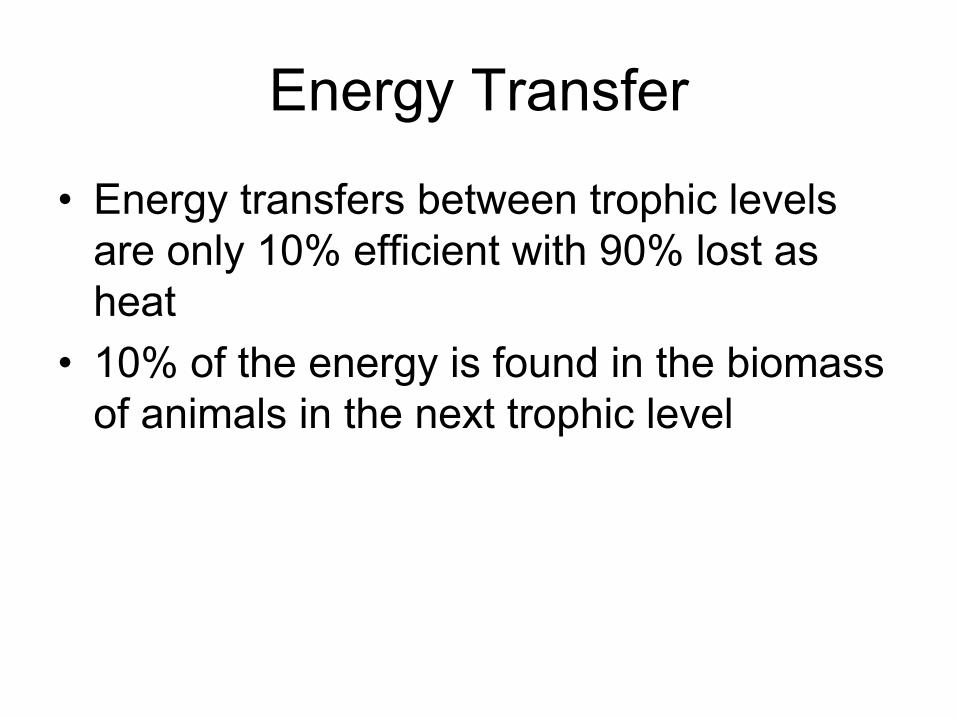
Energy Transfer
• Energy transfers between trophic levels are only 10% efficient with 90% lost as heat
• 10% of the energy is found in the biomass of animals in the next trophic level

Energy Losses
• Not all prey items are eaten some die and about 10% of their energy goes into decomposer biomass
• Digestion and absorption is not complete
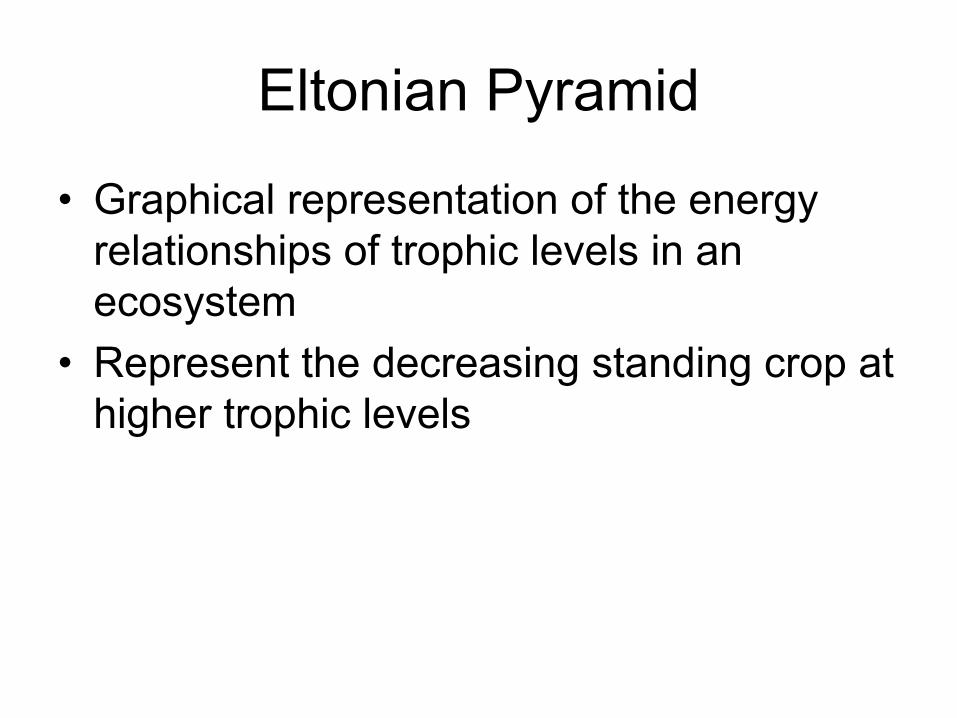
Eltonian Pyramid
• Graphical representation of the energy relationships of trophic levels in an ecosystem
• Represent the decreasing standing crop at higher trophic levels
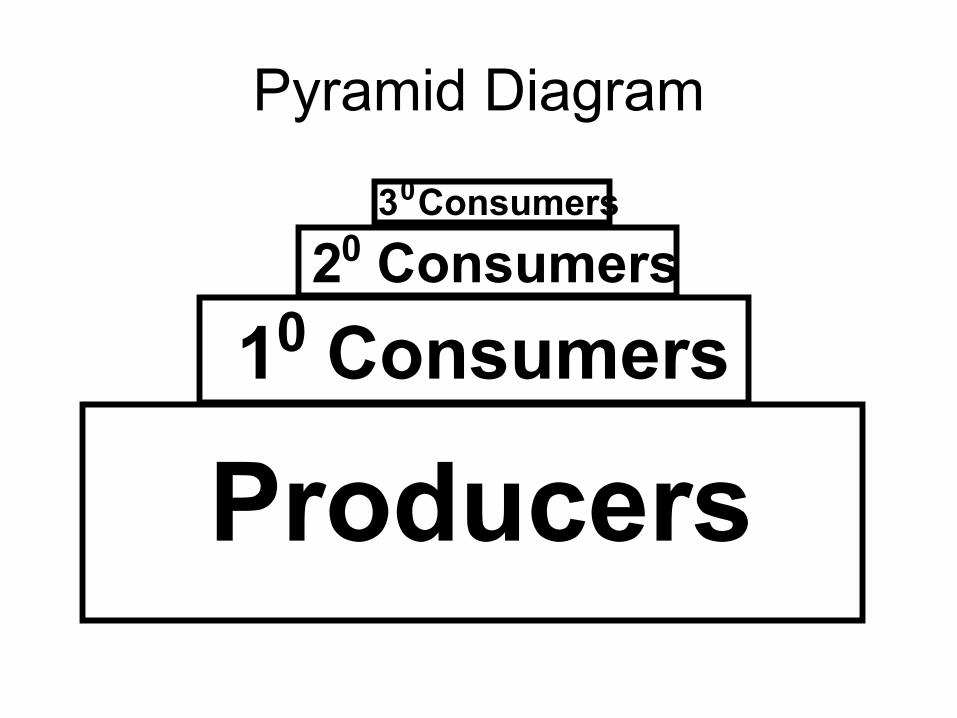
Pyramid Diagram
Producers10 Consumers
20 Consumers30Consumers

Standing Crop
• The amount (of individuals, biomass, or energy) present at any one moment in time
Pyramid Diagrams
• Trophic levels are arranged with the producers at the base of the pyramid and the consumers in increasingly higher levels up the pyramid
• The width of the pyramid at any trophic level indicates the size of the standing crop

Pyramid Types
• Numbers: Represents the number of individuals of each trophic level
• Biomass: Represents the weight of living tissue of each trophic level in kilograms
• Energy: Represents the energy content of each trophic level in calories
Pyramid Relationships
• The energy content and biomass of a single individual increases moving up the pyramid although the total energy and biomass of the trophic level decreases

Materials and Ecosystems
• Materials cycle in an ecosystem• Semi-closed system with limited input and
output of elements and continuous recycling between the biotic and abiotic portions
• The degree of recycling determines how closed the system is.

Basic parts of a cycle.
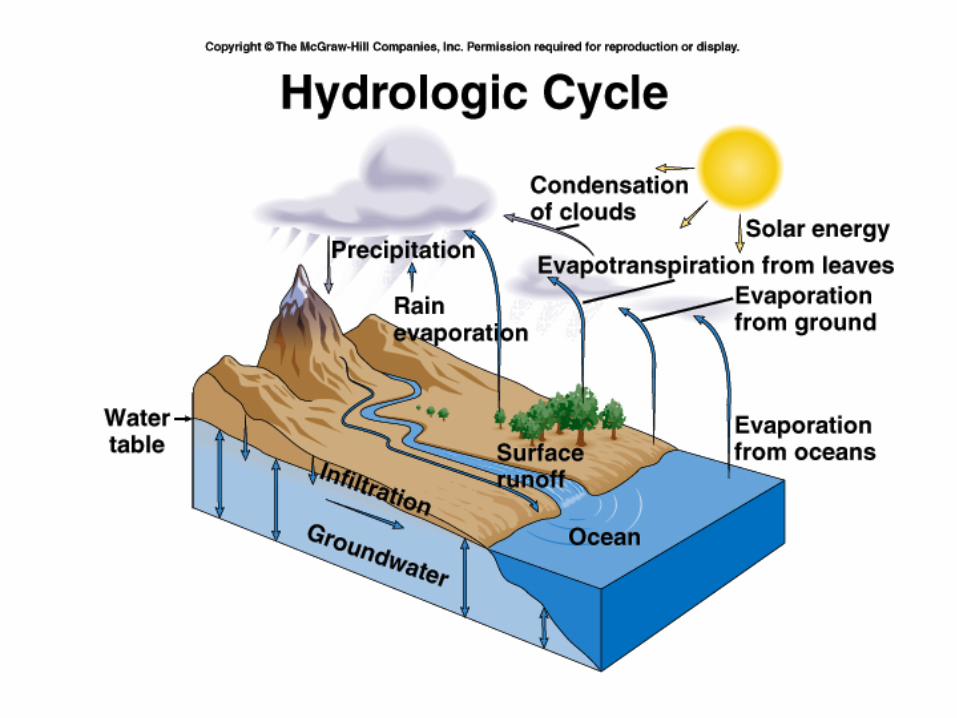
Hydrologic Cycle
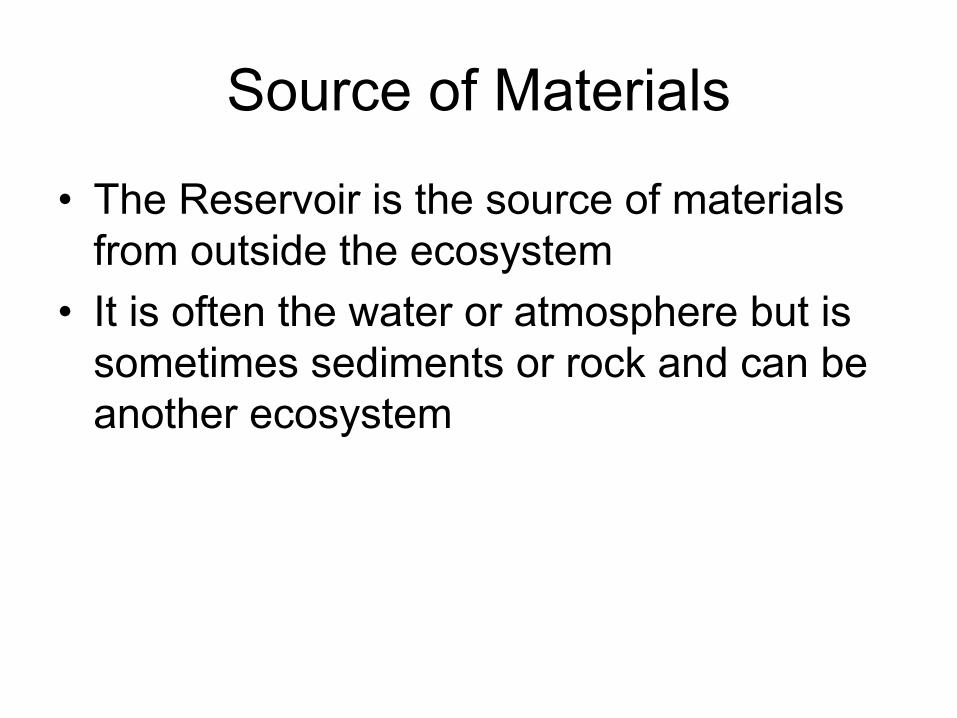
Source of Materials
• The Reservoir is the source of materials from outside the ecosystem
• It is often the water or atmosphere but is sometimes sediments or rock and can be another ecosystem
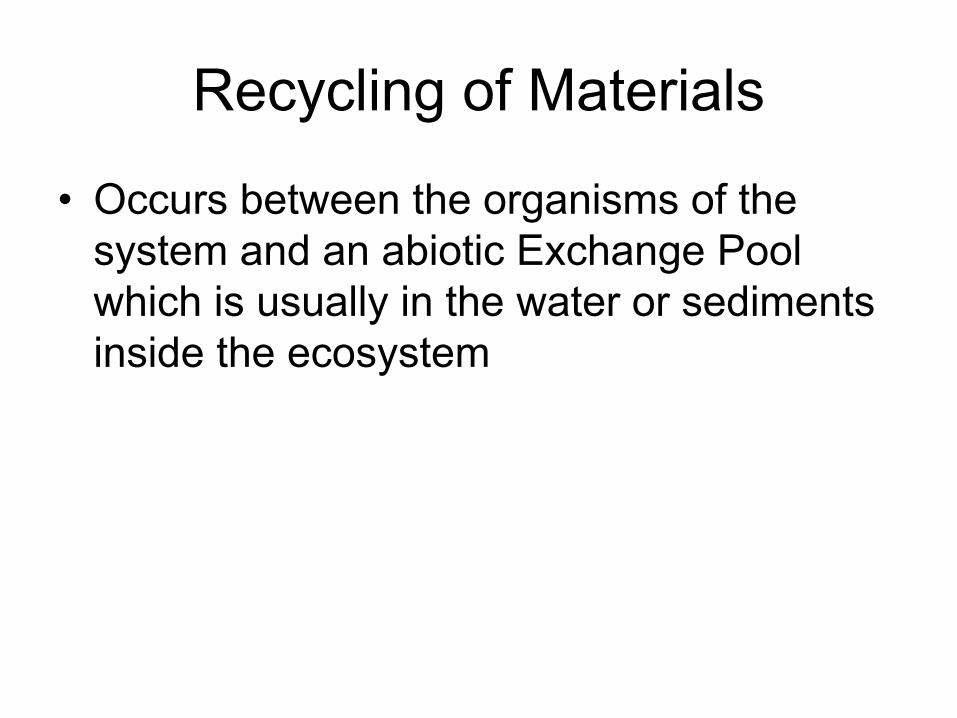
Recycling of Materials
• Occurs between the organisms of the system and an abiotic Exchange Pool which is usually in the water or sediments inside the ecosystem
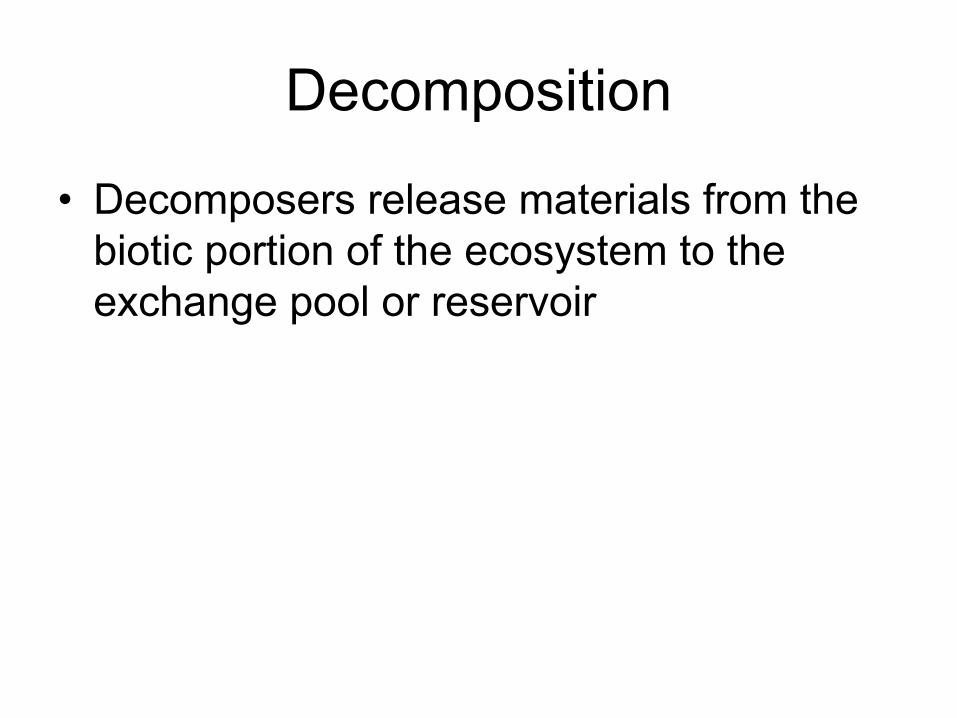
Decomposition
• Decomposers release materials from the biotic portion of the ecosystem to the exchange pool or reservoir
Regeneration
• Mineralizing bacteria regenerate inorganic materials by transforming released materials in a way that makes them available to photoautotrophs
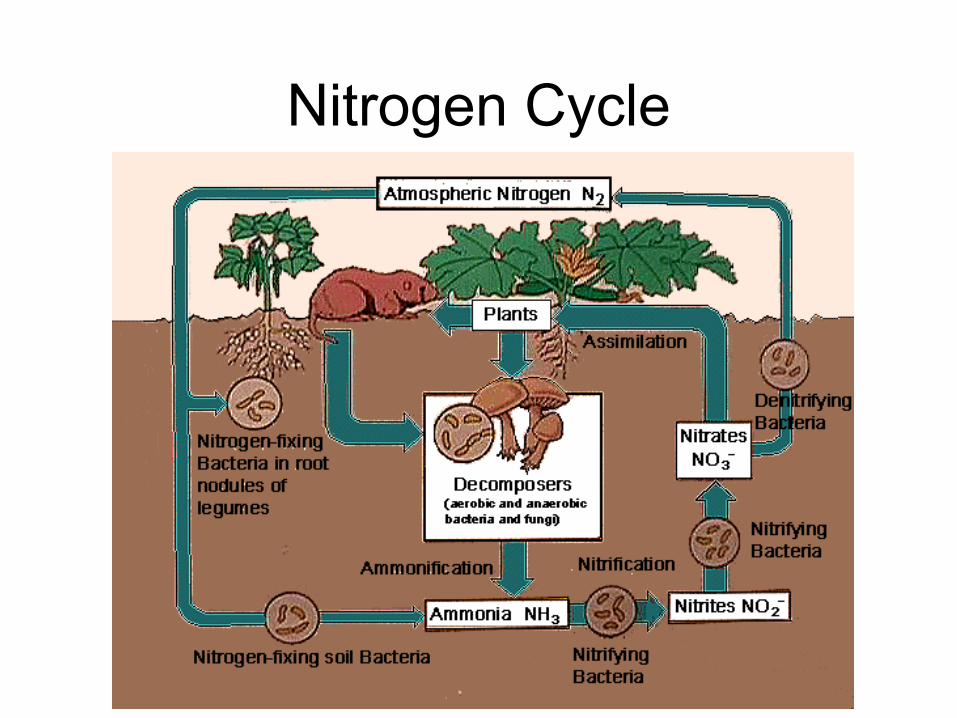
Nitrogen Cycle
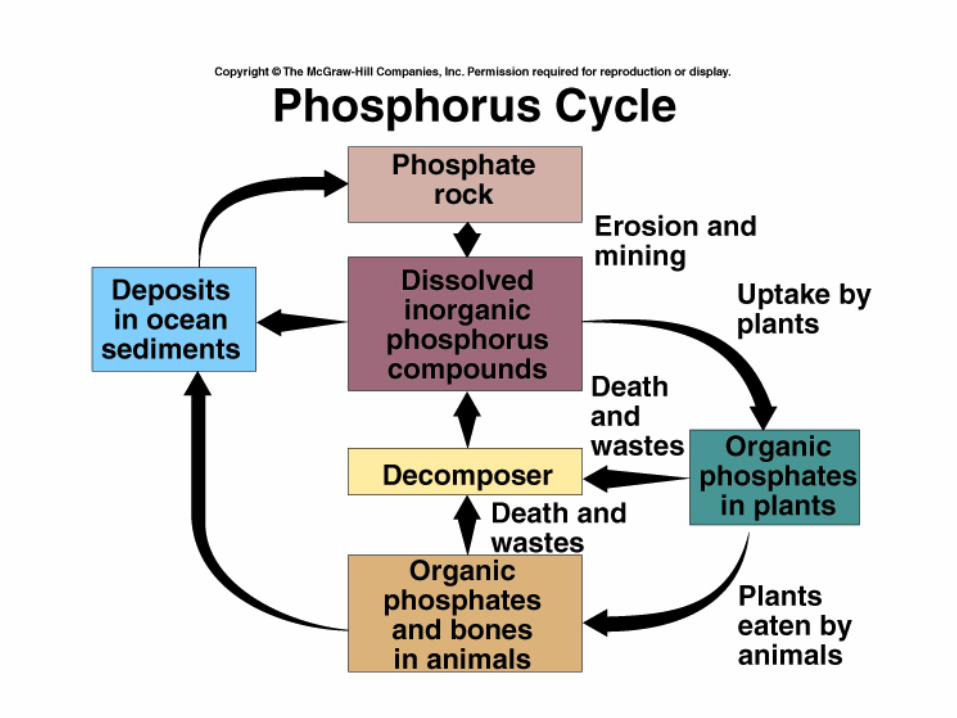
Phosphorus Cycle
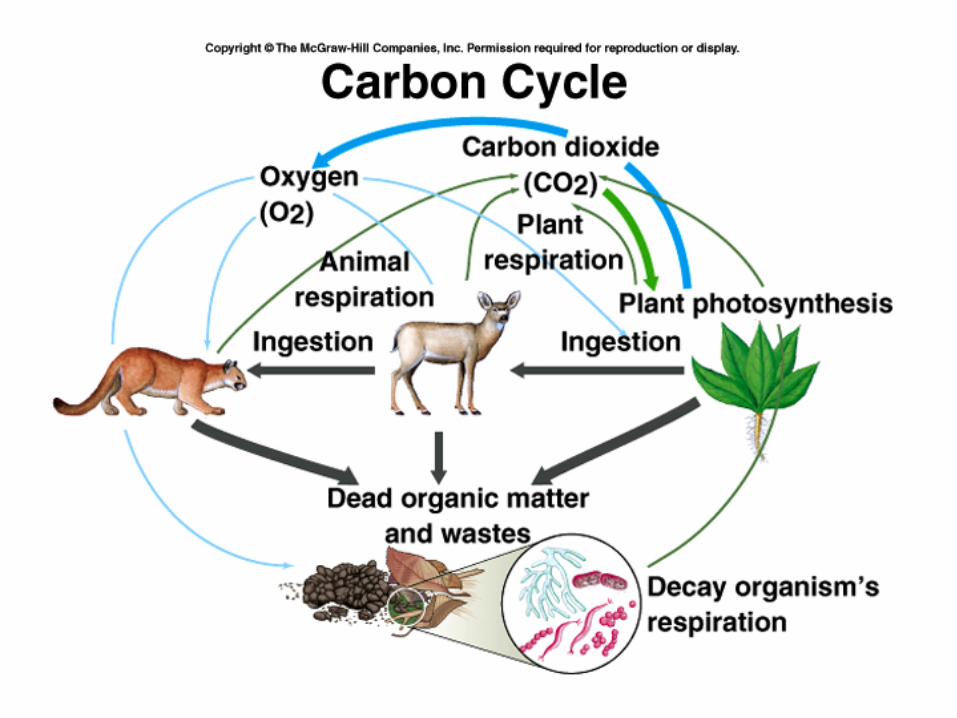
Carbon Cycle