ecowas monetary cooperation programme€¦ · 5 5 executive summary ecowas countries faced...
TRANSCRIPT
WEST AFRICAN MONETARY AGENCY (WAMA)
ECOWAS MONETARY COOPERATION
PROGRAMME
MACROECONOMIC CONVERGENCE REPORT FIRST
HALF 2009
Freetown, November 2009
2
2
TABLE OF CONTENTS
Introduction…………………………………………………………..4
Executive Summary…………………………………………………5
1. 1 International Developments……………………………………..7 1.1.1 Recent Economic and Financial Developments…………...7
1.1.1.1 World Economic Growth…………………………………………….7 1.1.1.2 Inflation and Prices…………………………………………………..8 1.1.1.3 Currency and Exchange Rate Policies……………………..……8
1.1.1.4 Public Finance……………………………………………………….11 1.1.1.5 External Sector………………………………………………………11
1.1.2 Prospects………………………………………………………………12 1.2 ECONOMIC, FINANCIAL AND MONETARY SITUATION OF
ECOWAS………………………………………………………………12 2.0 SITUATION OF MACROECONOMIC CONVERGENCE……18
2.1 Overview………………………………………………………………18 2.2 Performance Analyses by Criteria……………………………….20
2.2.1 Primary Criteria……………………………………………………20 2.2.1.1 Budget Deficit/GDP Ratio ≤ 4%..........................................20
2.2.1.2 Inflation Rate ≤ 5 %...........................................................20 2.2.1.3 Central Bank Financing of Budget Deficit/Previous Year’s
Tax Revenue ≤ 10%...........................................................21 2.2.1.4 Gross External Reserves………………………………………….22
2.2.2 Secondary Criteria………………………………………………..22 2.2.2.1 Domestic Arrears…………………………………………………...22 2.2.2.2 Tax Revenue/GDP Ratio ≥ 20 %.........................................22
2.2.2.3 Wage Bill /Tax Revenue ≤ 35 %.........................................23 2.2.2.4 Public Investment /Tax Revenue ≥ 20 %............................24
2.2.2.5 Positive Real Interest Rates………………………………………25 2.2.2.6 Real Exchange Rate Stability ± 5%.....................................26
3. MACROECONOMIC CONVERGENCE AND POLICY HARMONISATION………………………………………………………………….25
3.1 WEST AFRICAN ECONOMIC AND MONETARY UNION (UEMOA) COUNTRIES………………………………………………………………………….28
3.1.1 BENIN………………………………………………………………………….29 3.1.2 BURKINA FASO……………………………………………………………..34
3.1.3 IVORY COAST………………………………………………………………..39
3
3
3.1.4 GUINEA-BISSAU…………………………………………………………….44 3.1.5. MALI……………………………………………………………………………49
3.1.6 NIGER………………………………………………………………………….54 3.1.7 SENEGAL……………………………………………………………………..61
3.1.8 TOGO…………………………………………………………………………..67
3.1.9 Harmonization of policies within UEMOA………………..…….72
3.2 THE WEST AFRICAN MONETARY ZONE (WAMZ) COUNTRIE…73
3.2.1 THE GAMBIA…………………………………………………………………73 3.2.2 GHANA………………………………………………………………………..81
3.2.3 GUINEA………………………………………………………………………..91 3.2.4 NIGERIA……………………………………………………………………….97 3.2.5 SIERRA LEONE………………………………………………………..…104
3.3 OTHER COUNTRIES…………………………………………………….114
3.3.1 CAPE VERDE……………………………………………………………….114 3.3.2 LIBERIA………………………………………………………………………119

4
4
Introduction
This report covers macroeconomic developments in fifteen (15) ECOWAS member countries during the first half of 2009. Section 1 contains a review of international economic and financial developments during the period as a background to the assessment of the performance of ECOWAS countries. In section 2 a review and appraisal of the macroeconomic convergence is undertaken based on the established convergence criteria as detailed below.
Primary Criteria :
1. Budget Deficit/GDP Ratio ≤ 4%
2. Inflation Rate ≤ 5%
3. Central Bank Financing of Budget Deficit/Previous Year’s Tax Revenue ≤ 10%.
4. Gross External Reserves ≥ 6 months of imports cover
Secondary Criteria
5. Domestic Arrears (prohibition of accumulation of new arrears and liquidation of existing arrears)
6. Tax Revenue/GDP Ratio ≥ 20%
7. Wage Bill/Tax Revenue ≤ 30%
8. Public Investment/Tax Revenue ≥ 20%
9. Positive Real Interest Rates
10. Real Exchange Rate Stability ±5% Finally, section 3 highlights the country-specific macroeconomic developments and status of convergence.

5
5
Executive Summary
ECOWAS countries faced significant challenges in the first half of 2009 and performance on the convergence criteria was mixed. Budget deficits deteriorated, reserves were much lower but there was some improvement in the inflation. Some of the outturn reflected developments in the international economy. On the international economic developments and their impact for ECOWAS member States, the review shows that the world economy continues to experience significant challenges as a result of the financial crisis and an acute loss of confidence. The repatriation of foreign assets by investors and the tightening of credit terms have compelled companies across the world to reduce production and postpone their investment plans. As a result, world Gross Domestic Product (GDP) declined by 1.7 percent in 2009 compared to an increase of 3.3 percent in 2008. The economic recession had a high impact on countries that specialized in capital goods production such as Germany, United States, Japan and Taiwan (China). Low and middle income countries were equally affected and therefore experienced slowdown in economic activity. Growth in developing countries was estimated to decline from 5.8 percent in 2009 to 2.1 percent by the end of 2009. However, economic growth in ECOWAS was less affected as shown by a slight decline from 5.8 percent in 2008 to 4.9 percent. While economic activity in UEMOA slightly declined from 3.8 percent in 2008 to 3.5 percent in 2009, economic growth in the WAMZ significantly declined from 6.4 percent to 5.3 over the same period. The high inflationary pressures that originated from the high oil prices as well as the food crises experienced downward trends at the level of ECOWAS in 2009, although the rates of inflation were still high in few of the countries by community standards. Inflationary pressures in ECOWAS decreased from 13.6 percent in 2008 to 9.2 percent in 2008. In UEMOA, inflation rates significantly reduced from 8.5 percent in 2008 to 0.9 percent during the review period, as the effects of the oil prices, drought and food crises eased off. Inflation rate, which declined from 15.3 percent in 2008 to 11.7 percent by mid-2009, was still relatively high in the WAMZ. Similarly, ECOWAS Member countries also experienced fiscal challenges, which were linked to the decline in performance of the external sector. Regarding the situation of macroeconomic convergence in the first half of 2009, the review shows that performance under inflation generally improved in the first half of 2009 compared with the position in the corresponding period of 2008, with eight countries meeting this criterion, compared to one in 2008. On the other hand, performance with respect to the budget deficit criterion deteriorated from 10 to 8 countries over the same period. Fourteen countries met the required target for central bank financing of the budget deficit, compared to 13 in 2008. Regarding gross external reserves, nine countries (Nigeria and the eight UEMOA countries) met the target during the period, thus

6
6
maintaining the same level attained in the first half of 2008. Performance under the secondary criteria was generally below expectation. Two countries met the tax receipts/GDP target during the period under consideration. Performance on the wage bill was relatively better, as nine countries achieved this target during the period; an improvement of one country compared to the first half of 2008.There was prevalence of negative real interest rates in a majority of countries as at end-June 2009. In general, real exchange rates remained stable in member countries and the criterion was satisfied by 14 countries by mid 2009, compared to 13 in 2008.
In addition, a summary of the total number of criteria (primary and secondary) satisfied by each country indicates that none of the countries was able to meet all the primary and secondary convergence criteria. As at Mid-2009, the best
performance of 8 targets was recorded by Senegal. Benin, Guinea and Mali followed with 7 targets each, while Nigeria and Togo attained 6 benchmarks each. Burkina Faso and Cote d’Ivoire met 5 targets each, while The Gambia, Guinea-Bissau, Liberia and Niger met 4 benchmarks each. Cape Verde, Ghana and Sierra Leone achieved 2 targets each. Finally the details in country analyses epitomise the key macroeconomic developments that accounted for the non-observance of the criteria and policy recommendations proffered to improve their performance. In the area of policy harmonisation and institutional arrangements the report shows that there still remain some major challenges. Formation and effective functioning of National Coordinating Committees in WAMZ member countries remain a formidable challenge that needs to be addressed to facilitate multilateral surveillance especially at the level of the WAMA-ECOWAS Joint Secretariat. In addition, there is still the need to deepen the level of payments system development and interconnectivity, capital account liberalisation, implementation of the ECOWAS Common External Tariff, Statistical Harmonisation as well as to eliminate all other barriers to free movement of people, capital and goods within the community.

7
7
1.1 International Developments
The world economy is still experiencing difficult times as a result of a financial crisis and an acute loss of confidence. The reduction of leverage on financial markets reflected in a sharp fall in world demand in the first quarter of 2009. The repatriation of foreign assets by investors and the tightening of credit terms have compelled companies across the world to reduce production and postpone their investment plans. Faced with the unprecedented depreciation of their properties and rapid decline on the job market, consumers have cut their expenditures, especially the acquisition of consumer goods.
1.1.1 Recent economic and financial trends
The review of projections in the World Economic perspective published by the
World Bank reveals a rapid deterioration of economic and financial conditions and increasingly negative nature of interdependence links which binds failing economies and weakened financial systems. These have been the leading concern for almost all countries since the end of 2008.
1.1.1.1 World economic growth
In 2009, world GDP declined by 1.7%, indicating a drastic fall in world production. This figure reflects a significant deterioration of 2.6% compared to previous projections in the World Economic Outlook.
The worldwide nature of the recession had a major impact on economic performance in high income countries. Economies that specialized in capital goods production, especially Germany, United States, Japan and Taiwan (China) were hardest hit by cutbacks in capital investments. The decline was particularly pronounced in Asia. In Japan, for instance, the volume of goods exported fell by 40% in January compared to the previous year.
The drop was 30% in Taiwan (China) and 25% in Singapore. The extent of decline in industrial production was comparable in all these countries. Logically, GDP dropped by 12.1% on annual basis in Japan, (with seasonal variations in the last quarter of 2008), 21% in Korea and 25% in Taiwan (China). Currently, it is expected that there would be a 5.3% decline in Japan’s economy, (a figure reduced by 5.2 percentage points compared to November) double the decline expected in Europe and the United States. In all high income countries, GDP is expected to shrink by 2.9% in 2009 while World Economic Outlook projects a less pronounced decline of 2.8 percentage points.
In low and middle income countries, taken collectively, economic activity is expected to slow down at the same rate as in high income countries. Growth in developing countries would reduce from 5.8% in 2008 to 2.1% in 2009, representing a drop of 3.7 percentage points comparable to the decline recorded in high income countries. The correlation between the two phenomena cannot be attributed solely to trade links but shows that the financial crisis has a direct impact on economies of developing countries. The outflow of foreign
8
8
capital, the collapse of stock markets and the general deterioration of financing conditions have dealt a severe blow to investment growth in developing countries and reduced significantly investments in many of these countries.
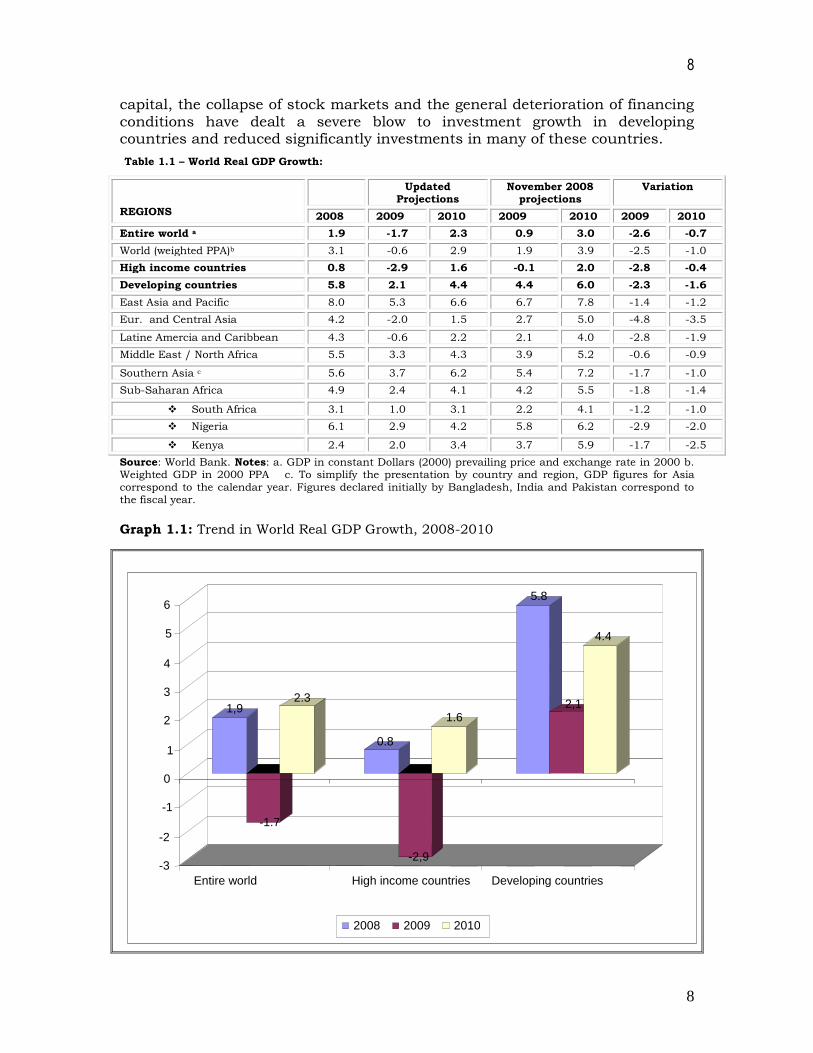
Table 1.1 – World Real GDP Growth:
REGIONS
Updated Projections
November 2008 projections
Variation
2008 2009 2010 2009 2010 2009 2010
Entire world a 1.9 -1.7 2.3 0.9 3.0 -2.6 -0.7
World (weighted PPA)b 3.1 -0.6 2.9 1.9 3.9 -2.5 -1.0
High income countries 0.8 -2.9 1.6 -0.1 2.0 -2.8 -0.4
Developing countries 5.8 2.1 4.4 4.4 6.0 -2.3 -1.6
East Asia and Pacific 8.0 5.3 6.6 6.7 7.8 -1.4 -1.2
Eur. and Central Asia 4.2 -2.0 1.5 2.7 5.0 -4.8 -3.5
Latine Amercia and Caribbean 4.3 -0.6 2.2 2.1 4.0 -2.8 -1.9
Middle East / North Africa 5.5 3.3 4.3 3.9 5.2 -0.6 -0.9
Southern Asia c 5.6 3.7 6.2 5.4 7.2 -1.7 -1.0
Sub-Saharan Africa 4.9 2.4 4.1 4.2 5.5 -1.8 -1.4
South Africa 3.1 1.0 3.1 2.2 4.1 -1.2 -1.0
Nigeria 6.1 2.9 4.2 5.8 6.2 -2.9 -2.0
Kenya 2.4 2.0 3.4 3.7 5.9 -1.7 -2.5
Source: World Bank. Notes: a. GDP in constant Dollars (2000) prevailing price and exchange rate in 2000 b. Weighted GDP in 2000 PPA c. To simplify the presentation by country and region, GDP figures for Asia
correspond to the calendar year. Figures declared initially by Bangladesh, India and Pakistan correspond to the fiscal year.
Graph 1.1: Trend in World Real GDP Growth, 2008-2010
1,9
-1.7
2.3
0.8
-2,9
1.6
5.8
2,1
4.4
-3
-2
-1
0
1
2
3
4
5
6
Entire world High income countries Developing countries
2008 2009 2010
9
9
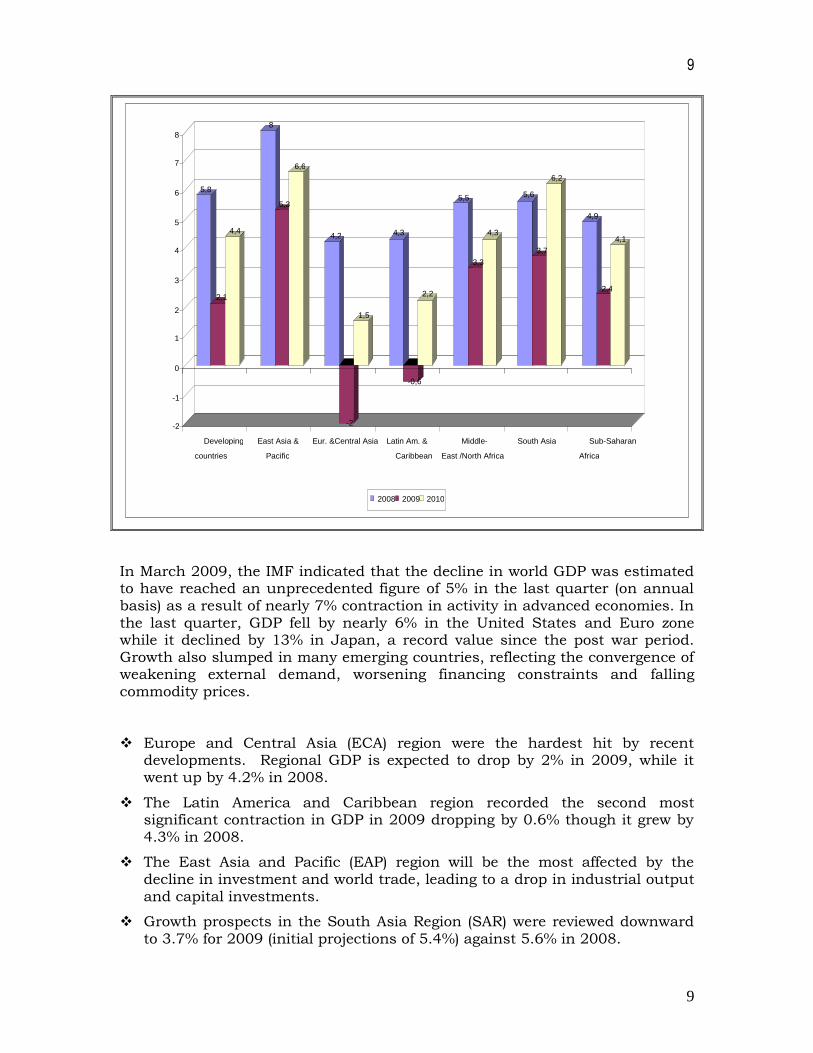
In March 2009, the IMF indicated that the decline in world GDP was estimated to have reached an unprecedented figure of 5% in the last quarter (on annual basis) as a result of nearly 7% contraction in activity in advanced economies. In the last quarter, GDP fell by nearly 6% in the United States and Euro zone while it declined by 13% in Japan, a record value since the post war period. Growth also slumped in many emerging countries, reflecting the convergence of weakening external demand, worsening financing constraints and falling commodity prices. Europe and Central Asia (ECA) region were the hardest hit by recent
developments. Regional GDP is expected to drop by 2% in 2009, while it went up by 4.2% in 2008.
The Latin America and Caribbean region recorded the second most significant contraction in GDP in 2009 dropping by 0.6% though it grew by 4.3% in 2008.
The East Asia and Pacific (EAP) region will be the most affected by the decline in investment and world trade, leading to a drop in industrial output and capital investments.
Growth prospects in the South Asia Region (SAR) were reviewed downward to 3.7% for 2009 (initial projections of 5.4%) against 5.6% in 2008.
5,8
2,1
4,4
8
5,3
6,6
4,2
-2
1,5
4,3
-0,6
2,2
5,5
3,3
4,3
5,6
3,7
6,2
4,9
2,4
4,1
-2
-1
0
1
2
3
4
5
6
7
8
Developing countries
East Asia & Pacific
Eur. &Central Asia Latin Am. & Caribbean
Middle- East /North Africa
South Asia Sub-Saharan Africa
2008 2009 2010

10
10
The Middle East and North Africa Region (MENA) seemed to have played its game well by recording in 2009 a growth of 3.3%, representing a shortfall of only 0.6 percentage point from initial projections against 5.5% in 2008. However, when contrasted with the robust performance in the previous year, the results marked a net decline.
In Sub-Saharan Africa (SSA), GDP growth rate in 2009 was halved compared to the robust performance recorded in 2008 (4.9%). The drastic fall in commodity prices had adverse effects on all countries of the region and oil exporting countries saw their activities slumped to 3.3% against 6.8% in 2008. At the same time, international demand and prices of commodities would continue to fall in 2009, dampening activity in economies that depend on these commodities.
1.1.1.2 Inflation and prices
The effects of the current recession, which is spreading across the world economy, go beyond a major contraction in GDP, production and trade. Commodities prices fell by 50%, leading to a significant deterioration in terms of trade and current account balances as well a deceleration in domestic inflation in all countries.
In G-7 countries, and developing economies, inflation measured in terms of CPI would reduce significantly in 2009 and 2010. For the first group of countries, the rate would drop from 2.9% in 2008 to 0.4%, with falling commodity prices, weak demand and the steady rise in unemployment curbing pressures on prices. The sustained injection of liquidity in economies through stimulus packages and financial support measures should allay fears of deflation. For developing countries, it is estimated that the median value of deflator of individuals’ consumption would drop from 8.5% in 2007-08 to 5% by 2010. Even under the assumption of a provisional decline in prices in some developing countries, the risk of widespread deflation remains low. The slump in commodities prices is in fact considered as a timely phenomenon and following the escalation of food prices in 2008, inflation until recently was on an upward trend.
1.1.1.3 Currency and exchange rates
World imbalances were slightly reduced, with the United States current account deficit falling from a record rate of 6.5% of GDP in 2006 to 4.9% in 2008. This improvement is reflected partly in the renewed competitiveness of American exports compared to the Euro zone and Japan as well as the weakening of the dollar from 2002 to 2004 and its stabilization throughout 2005 followed by a new episode of erosion in 2006 and 2007. In January 2008, the Euro was worth 55% more than its value against the dollar in January 2001. Nevertheless, the dollar firmed up throughout 2008 (and particularly, at the end of the year, the euro zone and Japan were also affected by the crisis) against the Euro and
11
11
virtually all the other hard currencies, a sign of its status as a reserve currency and the attractive nature of the extremely liquid US treasury bonds in times of uncertainty. Even if the fundamentals behind of the current balance suggest a significant depreciation of the dollar, its position as the leading international reserve currency limit the risk of a free fall in relation to other major currencies (such as the Euro, Pound or Yen) in the short run. The reduction in world imbalances also affected speculative currencies such the Yen which appreciated sharply against the dollar since end 2008.
Many countries may see their currencies weaken further, thus alleviating deflationary pressures. The dollar and Yen continued to appreciate in real terms with a significant firming up of the yen. The renminbi also continued to appreciate over the past year. However, several currencies of emerging economies depreciated. These include the Brazilian Real, Russian Rouble, Korean Won, Mexican Peso, Polish Zloty, Indonesian Roupie and Naira.
1.1.1.4 Public finances
Budgets were also subjected to rapidly growing pressures even in countries which had a surplus at the beginning of the crisis.
In view of dwindling tax revenue (resulting from international trade and collapse of manufacturing sectors), rising cost of credits and increased transfers required to preserve the social safety nets, all developing countries are now running the risk of seeing their budget balances worsen significantly. Stimulus packages and other measures aimed at reducing pressures that the private sector is experiencing increasingly can only worsen further budget difficulties in the coming years.
1.1.1.5 External Sector
World trade in goods and services shrunk by 6.1% in terms of volume in 2009 and by a higher percentage for manufactured products. External funding needs of developing countries, as a whole, increased and reached probably 1 300 billion dollars in 2009, including current deficits (330 billion) and repayment of due private debt principals (970 billion). With the outflow of external funding, financing needs that are not covered amounted to between $270 to $700 billion dollars. This amount may vary depending on refinancing needs and the extent of capital flight. The most significant financing deficits were observed in
Europe, Central Asia, Latin America and Sub-Saharan Africa. Judging from current projections, 66 out of 109 developing countries would face financing gaps that would be most often too high to be financed solely with resources from reserves. There is every indication that in the absence of adequate international aid, some countries would see their current balance sink into the red, dampening further internal demand and imports.
12
12
1.1.2 Prospects
The form the recovery would take at the end of the crisis continues to be subject for debate. It is without doubt that prospects for the second half of 2009 are the most uncertain and the recovery in economic activity will depend on the array of measures that will be taken by public authorities and other variables. As the decline in investments tapers off and acquisition of consumer durables resumed, the world investment cycle may become promising enough to bring back world growth on a positive path by end 2009. This trend, coupled with monetary and fiscal stimulus measures could trigger the projected world recovery.
1.2 ECONOMIC, FINANCIAL AND MONETARY SITUATION WITHIN ECOWAS
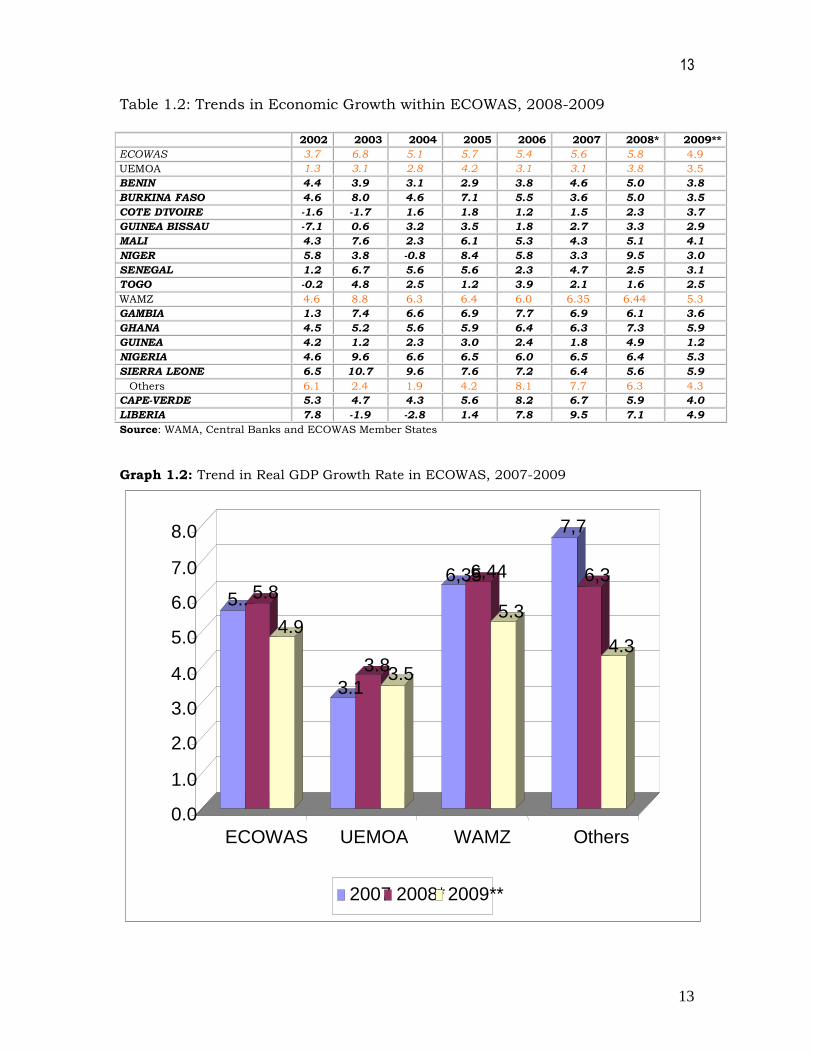
Economic growth in the West African region decelerated to settle at 4.9% in 2009 against 5.8% in 2008.
In five out of the eight UEMOA countries (Benin, Burkina Faso, Guinea-Bissau, Mali, Niger), economic activity shrunk while it improved in Cote d’Ivoire, Senegal and Togo. Cote d’Ivoire and Togo seemed to be resolutely on the path of renewed growth contrary to the downward trend observed in these two countries over the past few years. Political consolidation in Cote d’Ivoire – the leading economy in UEMOA – is partly behind this improvement in the Union. Sustained growth in agricultural production in most member countries of UEMOA was one of the major positive results of the year.
With regard to the other seven countries (Cape Verde, Gambia, Ghana, Guinea, Liberia, Nigeria, and Sierra Leone), Nigeria’s economic growth dropped to 5.3% mainly due to OPEC production quotas and a slow down in investments. In spite of the world crisis, Liberia recorded for the third consecutive year a robust growth fuelled by expenditures on infrastructure and resumption in agricultural production since the end of the conflict. Most of the countries experienced a slow down in activity, stagnation in public and private investments, falling commodities prices and reduction in foreign remittances.
13
13
Table 1.2: Trends in Economic Growth within ECOWAS, 2008-2009
2002 2003 2004 2005 2006 2007 2008* 2009**
ECOWAS 3.7 6.8 5.1 5.7 5.4 5.6 5.8 4.9
UEMOA 1.3 3.1 2.8 4.2 3.1 3.1 3.8 3.5
BENIN 4.4 3.9 3.1 2.9 3.8 4.6 5.0 3.8
BURKINA FASO 4.6 8.0 4.6 7.1 5.5 3.6 5.0 3.5
COTE D'IVOIRE -1.6 -1.7 1.6 1.8 1.2 1.5 2.3 3.7
GUINEA BISSAU -7.1 0.6 3.2 3.5 1.8 2.7 3.3 2.9
MALI 4.3 7.6 2.3 6.1 5.3 4.3 5.1 4.1
NIGER 5.8 3.8 -0.8 8.4 5.8 3.3 9.5 3.0
SENEGAL 1.2 6.7 5.6 5.6 2.3 4.7 2.5 3.1
TOGO -0.2 4.8 2.5 1.2 3.9 2.1 1.6 2.5
WAMZ 4.6 8.8 6.3 6.4 6.0 6.35 6.44 5.3
GAMBIA 1.3 7.4 6.6 6.9 7.7 6.9 6.1 3.6
GHANA 4.5 5.2 5.6 5.9 6.4 6.3 7.3 5.9
GUINEA 4.2 1.2 2.3 3.0 2.4 1.8 4.9 1.2
NIGERIA 4.6 9.6 6.6 6.5 6.0 6.5 6.4 5.3
SIERRA LEONE 6.5 10.7 9.6 7.6 7.2 6.4 5.6 5.9
Others 6.1 2.4 1.9 4.2 8.1 7.7 6.3 4.3
CAPE-VERDE 5.3 4.7 4.3 5.6 8.2 6.7 5.9 4.0
LIBERIA 7.8 -1.9 -2.8 1.4 7.8 9.5 7.1 4.9
Source: WAMA, Central Banks and ECOWAS Member States
Graph 1.2: Trend in Real GDP Growth Rate in ECOWAS, 2007-2009
5.. 5.8
4.9
3.1
3.8 3.5
6,35 6,44
5.3
7,7
6,3
4.3
0.0
1.0
2.0
3.0
4.0
5.0
6.0
7.0
8.0
ECOWAS UEMOA WAMZ Others
2007 2008* 2009**

14
14
Concerning inflation, a number of factors1 which caused the surge in commodities prices disappeared in the middle of 2008. As most reductions have materialized, the remaining months in 2009 would be marked by prices that, on the whole, would not fluctuate significantly. Since demand would not really pick up before 2010 at the earliest, prices would remain low in view of unutilized capacities in the oil and metal sectors that could be reactivated and capacities available in the agricultural sector. Inflation would return more or less to 2006 levels in 2009, and drop again in 2010. The number of West African countries with inflation rate above 10% increased from four in 2007 to eight in 2008. There were three such cases in 2009.
Thus, projections for 2009 were based on a gradual reversal for the entire region even if figures continue to hover around 10% for some countries. End of period inflation rate for the community stood at 9.2% as at end June 2009. This rate will settle at 7.9% at end of 2009 against 13.8% in 2008. Even in countries in the CFAF zone where inflation rate went beyond the 10% bar, projections are banking on a moderate tightening on monetary policy as commodities prices have already collapsed and domestic demand weakened in line with gloomy economic prospects resulting from the world financial and economic crisis.
Regarding member countries of the West African Monetary Zone (WAMZ), three out of five recorded rate below 10%. Inflation remained high in Ghana at 20.7% as at end June 2009.
Table 1.3: Trend in end of period inflation in ECOWAS
2002 2003 2004 2005 2006 2007 2008* 2009**
H1 2009**
ECOWAS 9.0 15.3 8.3 9.0 7.1 6.3 13.6 9.2 7.8
UEMOA 2.9 -0.7 3.8 2.9 2.7 2.9 8.5 0.9 2.5
BENIN 2.4 1.5 0.9 3.8 5.2 0.3 9.9 2.9 3.4
BURKINA FASO 2.4 1.5 0.9 4.5 1.5 2.3 11.6 -0.6 3.9
COTE D'IVOIRE 3.1 3.3 1.4 2.6 2.0 1.5 8.9 0.8 3.0
GUINEE BISSAU 3.9 -3.5 0.9 0.3 3.2 9.3 8.7 -1.2 3.8
MALI 5.0 -1.3 -3.1 3.4 3.6 2.2 7.8 0.4 2.6
NIGER 2.6 -1.6 0.2 4.2 0.3 4.7 13.6 7.1 3.9
SENEGAL 2.3 0.0 0.5 1.4 4.0 6.1 4.3 -1.2 3.6
TOGO 3.1 -0.9 0.4 5.5 1.5 3.4 10.2 2.4 4.3
ZMAO 12.1 23.4 10.5 12.1 9.2 7.3 15.3 11.7 9.4
GAMBIA 13.0 17.6 8.0 1.8 1.4 6.0 6.8 5.4 5.0
GHANA 15.2 23.6 11.8 13.9 10.9 12.8 18.1 20.7 29.8
GUINEA 6.1 12.9 27.6 29.7 39.1 12.8 13.5 1.8 7.7
NIGERIA 12.1 23.8 10.0 11.6 8.5 6.6 15.1 11.2 7.7
SIERRA LEONE -1.3 11.3 14.4 13.1 7.3 13.8 13.2 7.8 10.0
Others 5.8 0.2 5.3 3.5 6.1 6.9 7.7 6.4 6.4
CAPE-VERDE 3.0 -2.3 -0.3 1.7 4.7 4.4 6.8 5.8 5.0
LIBERIA 11.1 5.0 16.1 7.0 8.9 11.7 9.4 7.6 9.1
Source: WAMA, Central Banks and ECOWAS Member States
1 Particularly, the weakness of the dollar, the low level of investment in the extractive industry before the
surge in prices, disruption in supply, the use of commodities to produce bio-fuels, activities of investment
funds in 2008 and public policies aimed at taxing exports and prohibiting exports of several food stuffs.
15
15
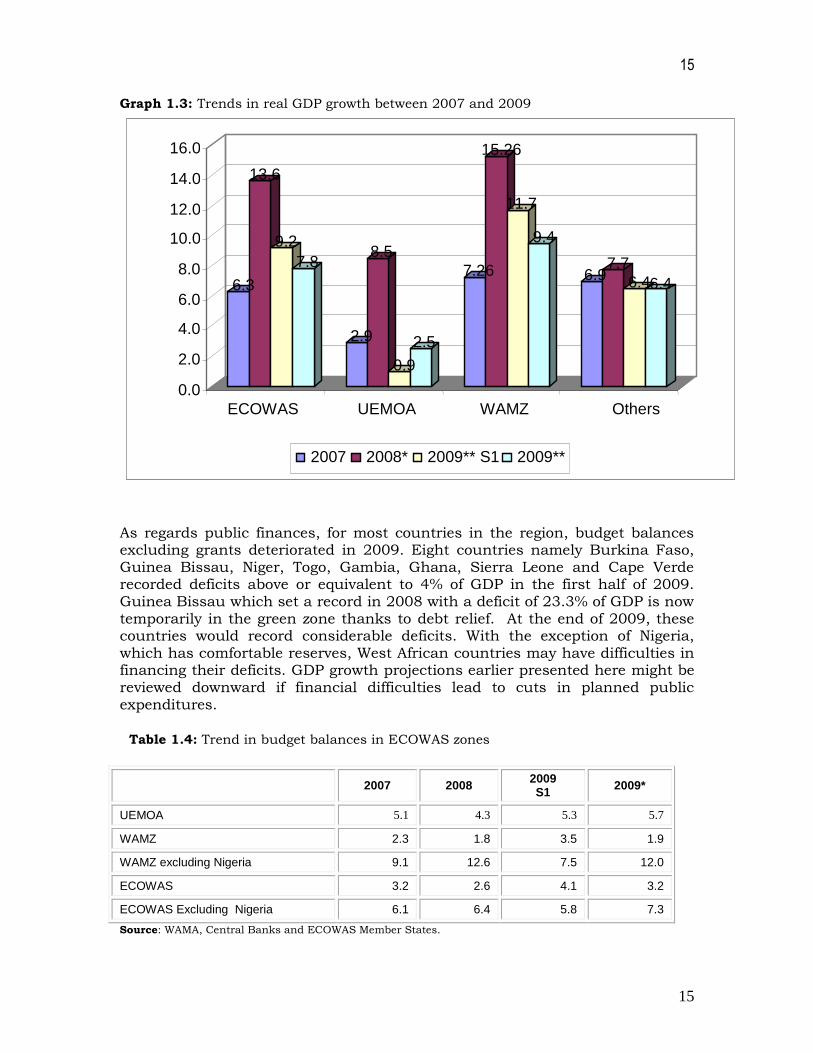
Graph 1.3: Trends in real GDP growth between 2007 and 2009
As regards public finances, for most countries in the region, budget balances excluding grants deteriorated in 2009. Eight countries namely Burkina Faso, Guinea Bissau, Niger, Togo, Gambia, Ghana, Sierra Leone and Cape Verde recorded deficits above or equivalent to 4% of GDP in the first half of 2009. Guinea Bissau which set a record in 2008 with a deficit of 23.3% of GDP is now temporarily in the green zone thanks to debt relief. At the end of 2009, these countries would record considerable deficits. With the exception of Nigeria, which has comfortable reserves, West African countries may have difficulties in financing their deficits. GDP growth projections earlier presented here might be reviewed downward if financial difficulties lead to cuts in planned public expenditures.
Table 1.4: Trend in budget balances in ECOWAS zones
2007 2008 2009 S1
2009*
UEMOA 5.1 4.3 5.3 5.7
WAMZ 2.3 1.8 3.5 1.9
WAMZ excluding Nigeria 9.1 12.6 7.5 12.0
ECOWAS 3.2 2.6 4.1 3.2
ECOWAS Excluding Nigeria 6.1 6.4 5.8 7.3
Source: WAMA, Central Banks and ECOWAS Member States.
6.3
13.6
9.2
7.8
2.9
8.5
0.9
2.5
7.26
15.26
11.7
9.4
6.9 7.7
6.4 6.4
0.0
2.0
4.0
6.0
8.0
10.0
12.0
14.0
16.0
ECOWAS UEMOA WAMZ Others
2007 2008* 2009** S1 2009**
16
16
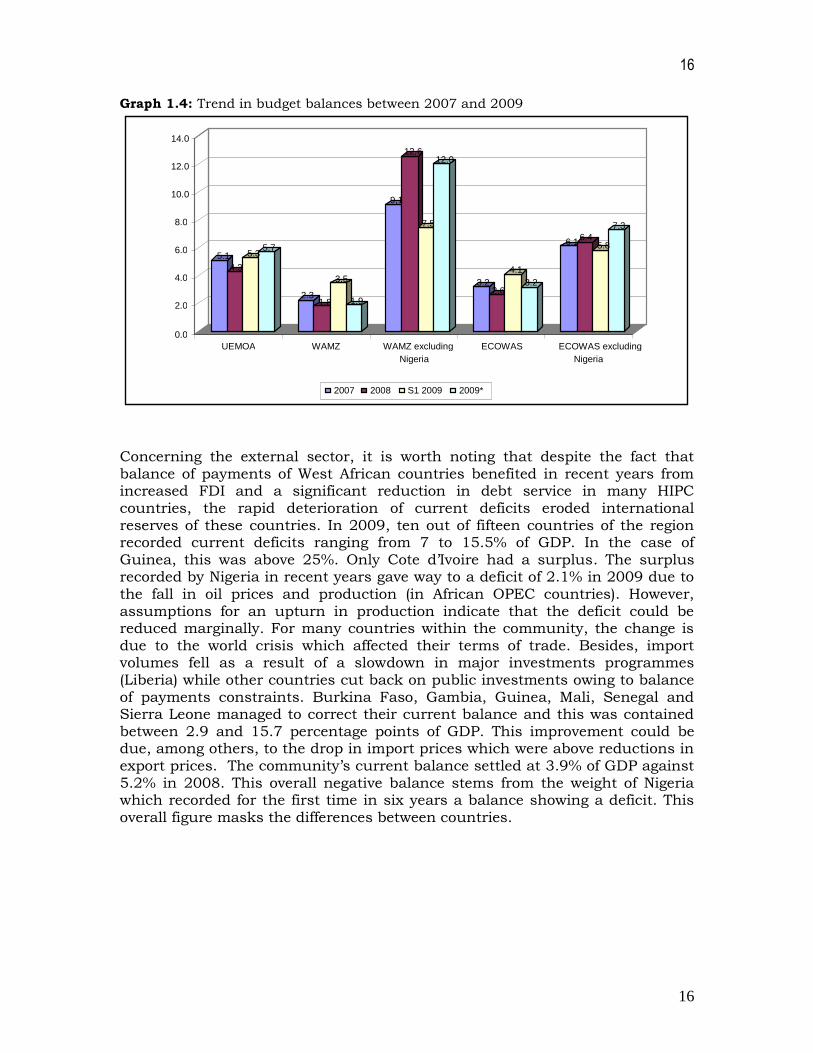
Graph 1.4: Trend in budget balances between 2007 and 2009
Concerning the external sector, it is worth noting that despite the fact that balance of payments of West African countries benefited in recent years from increased FDI and a significant reduction in debt service in many HIPC countries, the rapid deterioration of current deficits eroded international reserves of these countries. In 2009, ten out of fifteen countries of the region recorded current deficits ranging from 7 to 15.5% of GDP. In the case of Guinea, this was above 25%. Only Cote d’Ivoire had a surplus. The surplus recorded by Nigeria in recent years gave way to a deficit of 2.1% in 2009 due to the fall in oil prices and production (in African OPEC countries). However, assumptions for an upturn in production indicate that the deficit could be reduced marginally. For many countries within the community, the change is due to the world crisis which affected their terms of trade. Besides, import volumes fell as a result of a slowdown in major investments programmes (Liberia) while other countries cut back on public investments owing to balance of payments constraints. Burkina Faso, Gambia, Guinea, Mali, Senegal and Sierra Leone managed to correct their current balance and this was contained between 2.9 and 15.7 percentage points of GDP. This improvement could be due, among others, to the drop in import prices which were above reductions in export prices. The community’s current balance settled at 3.9% of GDP against 5.2% in 2008. This overall negative balance stems from the weight of Nigeria which recorded for the first time in six years a balance showing a deficit. This
overall figure masks the differences between countries.
5.1 4.3
5.3 5.7
2.3 1.8
3.5
1.9
9,1
12,6
7.5
12.0
3.2 2,6
4.1 3.2
6.1 6.4 5.8
7.3
0.0
2.0
4.0
6.0
8.0
10.0
12.0
14.0
UEMOA WAMZ WAMZ excluding Nigeria
ECOWAS ECOWAS excluding Nigeria
2007 2008 S1 2009 2009*
17
17
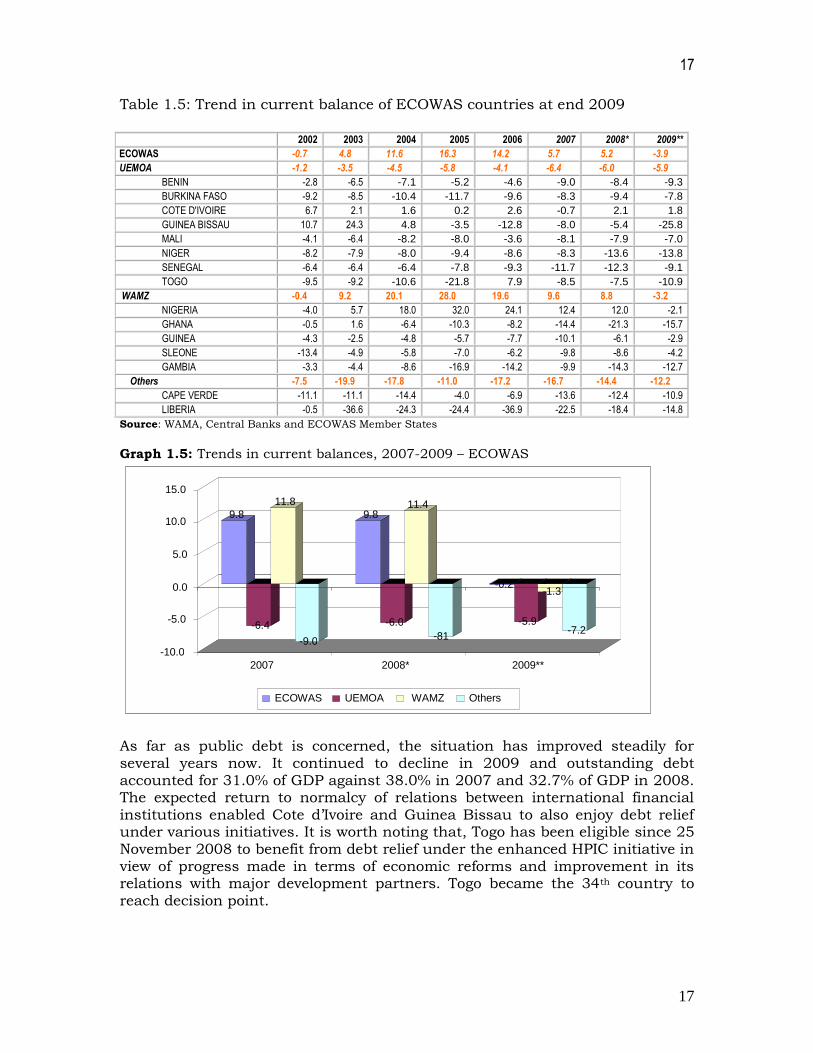
Table 1.5: Trend in current balance of ECOWAS countries at end 2009
2002 2003 2004 2005 2006 2007 2008* 2009**
ECOWAS -0.7 4.8 11.6 16.3 14.2 5.7 5.2 -3.9
UEMOA -1.2 -3.5 -4.5 -5.8 -4.1 -6.4 -6.0 -5.9
BENIN -2.8 -6.5 -7.1 -5.2 -4.6 -9.0 -8.4 -9.3
BURKINA FASO -9.2 -8.5 -10.4 -11.7 -9.6 -8.3 -9.4 -7.8
COTE D'IVOIRE 6.7 2.1 1.6 0.2 2.6 -0.7 2.1 1.8
GUINEA BISSAU 10.7 24.3 4.8 -3.5 -12.8 -8.0 -5.4 -25.8
MALI -4.1 -6.4 -8.2 -8.0 -3.6 -8.1 -7.9 -7.0
NIGER -8.2 -7.9 -8.0 -9.4 -8.6 -8.3 -13.6 -13.8
SENEGAL -6.4 -6.4 -6.4 -7.8 -9.3 -11.7 -12.3 -9.1
TOGO -9.5 -9.2 -10.6 -21.8 7.9 -8.5 -7.5 -10.9
WAMZ -0.4 9.2 20.1 28.0 19.6 9.6 8.8 -3.2
NIGERIA -4.0 5.7 18.0 32.0 24.1 12.4 12.0 -2.1
GHANA -0.5 1.6 -6.4 -10.3 -8.2 -14.4 -21.3 -15.7
GUINEA -4.3 -2.5 -4.8 -5.7 -7.7 -10.1 -6.1 -2.9
SLEONE -13.4 -4.9 -5.8 -7.0 -6.2 -9.8 -8.6 -4.2
GAMBIA -3.3 -4.4 -8.6 -16.9 -14.2 -9.9 -14.3 -12.7
Others -7.5 -19.9 -17.8 -11.0 -17.2 -16.7 -14.4 -12.2
CAPE VERDE -11.1 -11.1 -14.4 -4.0 -6.9 -13.6 -12.4 -10.9
LIBERIA -0.5 -36.6 -24.3 -24.4 -36.9 -22.5 -18.4 -14.8
Source: WAMA, Central Banks and ECOWAS Member States
Graph 1.5: Trends in current balances, 2007-2009 – ECOWAS
As far as public debt is concerned, the situation has improved steadily for several years now. It continued to decline in 2009 and outstanding debt accounted for 31.0% of GDP against 38.0% in 2007 and 32.7% of GDP in 2008. The expected return to normalcy of relations between international financial
institutions enabled Cote d’Ivoire and Guinea Bissau to also enjoy debt relief under various initiatives. It is worth noting that, Togo has been eligible since 25 November 2008 to benefit from debt relief under the enhanced HPIC initiative in view of progress made in terms of economic reforms and improvement in its relations with major development partners. Togo became the 34th country to reach decision point.
9.8
-6.4
11.8
-9.0
9.8
-6.0
11.4
-81
-0.2
-5.9
-1.3
-7.2
-10.0
-5.0
0.0
5.0
10.0
15.0
2007 2008* 2009**
ECOWAS UEMOA WAMZ Others

18
18
2.0 SITUATION OF MACROECONOMIC CONVERGENCE This section describes the performance of various ECOWAS member States with regard to the convergence criteria as at end-June 2009 and the projections for the end of the year. It shows that continued macroeconomic convergence among the Member countries remained difficult during the period. 2.1 Overview Movement towards macroeconomic convergence in recent years remained mixed as there was no significant improvement in overall performance. Some member countries found it difficult to sustain their performance in respect of targets realized in preceding years. Table 2.1 below provides an overview of the number of countries that complied with the convergence criteria. Table 2.1: Number of Countries that Met the Convergence Criteria in ECOWAS
2001 2002 2003 2004 2005 2006 2007 H1
2008 2008 H1
2009 2009*
Budget Deficit 6 5 5 4 4 6 7 10 8 8 5
Inflation 9 10 10 9 9 9 7 1 1 8 10
Reserves 10 9 9 9 1 1 9 9 1 9 9
Central Bank Financing 13 11 11 14 15 13 15 13 14 14 14
Domestic Arrears 5 4 5 5 4 5 5 8 6 7 8
Tax Revenue 0 0 0 2 2 2 3 2 2 2 3
Salary Mass 6 5 8 6 7 8 9 8 7 9 5
Public Investments 6 5 6 8 6 6 7 5 7 5 6
Real Interest Rate 6 8 9 7 7 6 6 0 0 6 3
Real Exchange Rate 11 12 7 12 10 11 12 13 6 14 15
Source: WAMA H1= First Half *=Projection
Graph 2.1: Convergence Performance in ECOWAS 2008-2009
Source: WAMA
Performance under inflation generally improved with respect to the position in the corresponding period of 2008, with eight countries meeting this criterion, compared to one in 2008. On the other hand, performance with respect to the budget deficit criterion deteriorated from 10 to 8 countries over the same period. Fourteen countries met the required target for central bank financing of the budget deficit, compared to 13 in 2008. Regarding gross external reserves,
19
19
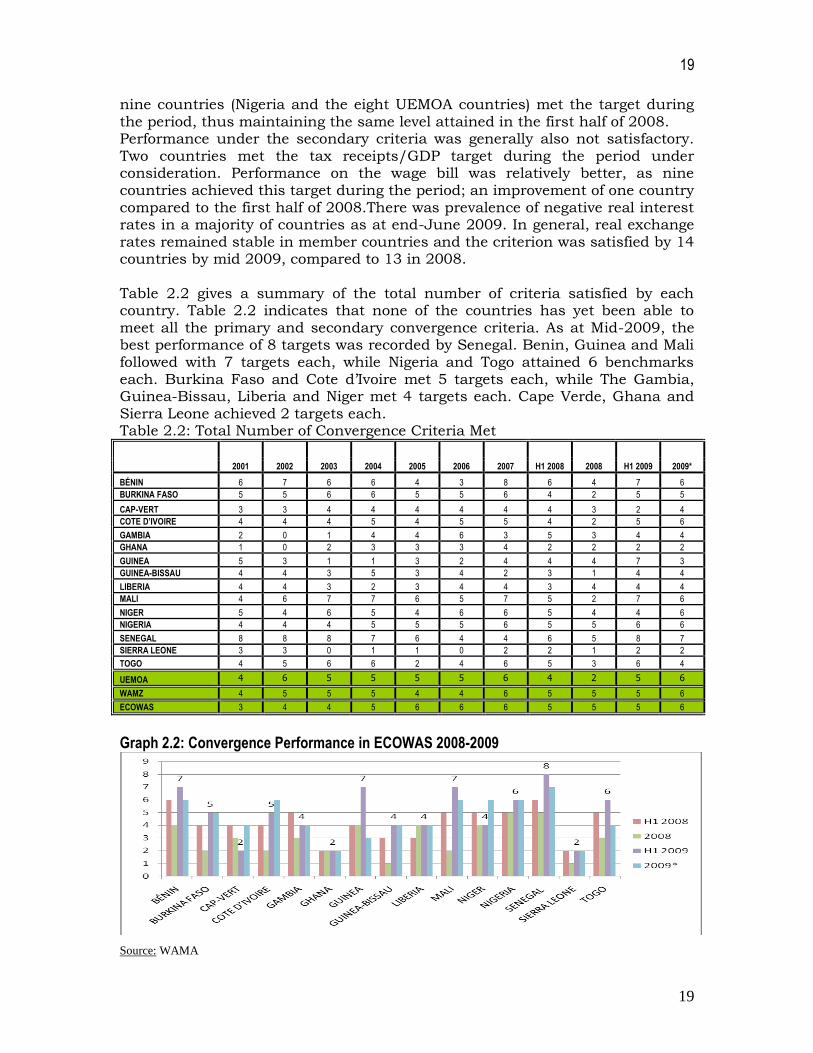
nine countries (Nigeria and the eight UEMOA countries) met the target during the period, thus maintaining the same level attained in the first half of 2008. Performance under the secondary criteria was generally also not satisfactory. Two countries met the tax receipts/GDP target during the period under consideration. Performance on the wage bill was relatively better, as nine countries achieved this target during the period; an improvement of one country compared to the first half of 2008.There was prevalence of negative real interest rates in a majority of countries as at end-June 2009. In general, real exchange rates remained stable in member countries and the criterion was satisfied by 14 countries by mid 2009, compared to 13 in 2008. Table 2.2 gives a summary of the total number of criteria satisfied by each country. Table 2.2 indicates that none of the countries has yet been able to meet all the primary and secondary convergence criteria. As at Mid-2009, the best performance of 8 targets was recorded by Senegal. Benin, Guinea and Mali followed with 7 targets each, while Nigeria and Togo attained 6 benchmarks each. Burkina Faso and Cote d’Ivoire met 5 targets each, while The Gambia, Guinea-Bissau, Liberia and Niger met 4 targets each. Cape Verde, Ghana and Sierra Leone achieved 2 targets each. Table 2.2: Total Number of Convergence Criteria Met
2001 2002 2003 2004 2005 2006 2007 H1 2008 2008 H1 2009 2009*
BÉNIN 6 7 6 6 4 3 8 6 4 7 6
BURKINA FASO 5 5 6 6 5 5 6 4 2 5 5
CAP-VERT 3 3 4 4 4 4 4 4 3 2 4
COTE D’IVOIRE 4 4 4 5 4 5 5 4 2 5 6
GAMBIA 2 0 1 4 4 6 3 5 3 4 4
GHANA 1 0 2 3 3 3 4 2 2 2 2
GUINEA 5 3 1 1 3 2 4 4 4 7 3
GUINEA-BISSAU 4 4 3 5 3 4 2 3 1 4 4
LIBERIA 4 4 3 2 3 4 4 3 4 4 4
MALI 4 6 7 7 6 5 7 5 2 7 6
NIGER 5 4 6 5 4 6 6 5 4 4 6
NIGERIA 4 4 4 5 5 5 6 5 5 6 6
SENEGAL 8 8 8 7 6 4 4 6 5 8 7
SIERRA LEONE 3 3 0 1 1 0 2 2 1 2 2
TOGO 4 5 6 6 2 4 6 5 3 6 4
UEMOA 4 6 5 5 5 5 6 4 2 5 6
WAMZ 4 5 5 5 4 4 6 5 5 5 6
ECOWAS 3 4 4 5 6 6 6 5 5 5 6
Graph 2.2: Convergence Performance in ECOWAS 2008-2009
Source: WAMA
20
20
2.2 Performance Analyses by Criteria
2.2.1 Primary Criteria
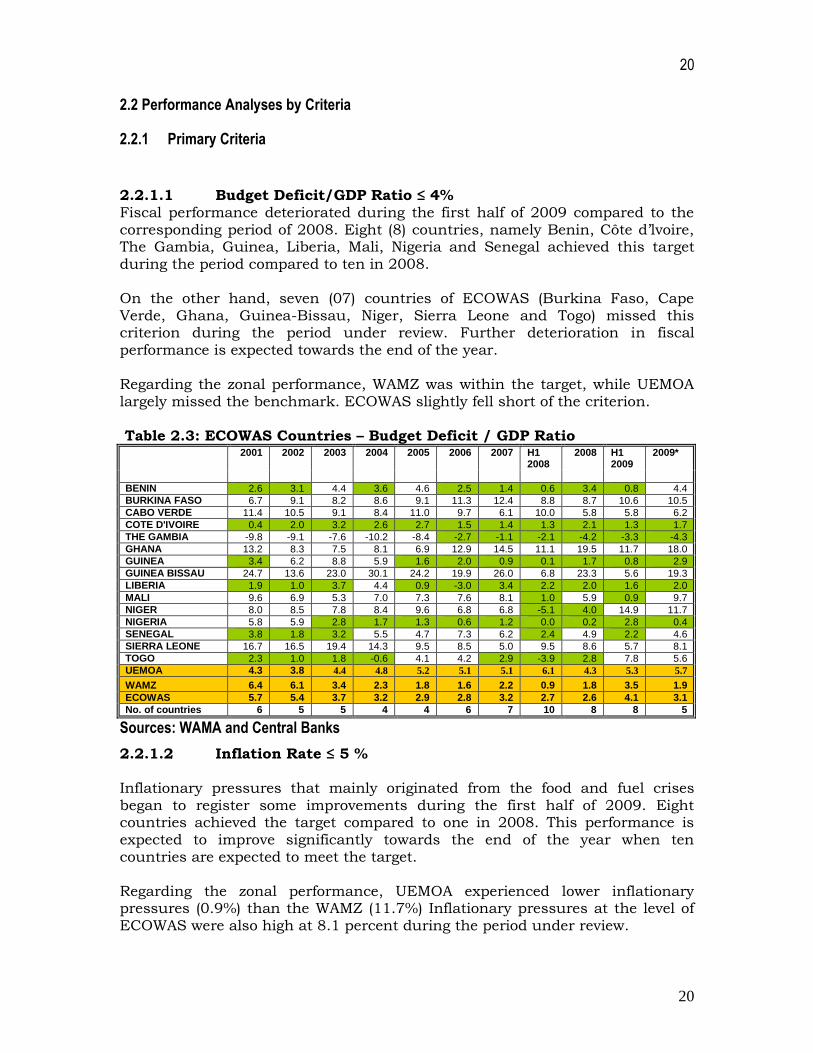
2.2.1.1 Budget Deficit/GDP Ratio ≤ 4% Fiscal performance deteriorated during the first half of 2009 compared to the corresponding period of 2008. Eight (8) countries, namely Benin, Côte d’lvoire, The Gambia, Guinea, Liberia, Mali, Nigeria and Senegal achieved this target during the period compared to ten in 2008. On the other hand, seven (07) countries of ECOWAS (Burkina Faso, Cape Verde, Ghana, Guinea-Bissau, Niger, Sierra Leone and Togo) missed this criterion during the period under review. Further deterioration in fiscal
performance is expected towards the end of the year. Regarding the zonal performance, WAMZ was within the target, while UEMOA largely missed the benchmark. ECOWAS slightly fell short of the criterion. Table 2.3: ECOWAS Countries – Budget Deficit / GDP Ratio 2001 2002 2003 2004 2005 2006 2007 H1
2008 2008 H1
2009 2009*
BENIN 2.6 3.1 4.4 3.6 4.6 2.5 1.4 0.6 3.4 0.8 4.4
BURKINA FASO 6.7 9.1 8.2 8.6 9.1 11.3 12.4 8.8 8.7 10.6 10.5
CABO VERDE 11.4 10.5 9.1 8.4 11.0 9.7 6.1 10.0 5.8 5.8 6.2
COTE D'IVOIRE 0.4 2.0 3.2 2.6 2.7 1.5 1.4 1.3 2.1 1.3 1.7
THE GAMBIA -9.8 -9.1 -7.6 -10.2 -8.4 -2.7 -1.1 -2.1 -4.2 -3.3 -4.3
GHANA 13.2 8.3 7.5 8.1 6.9 12.9 14.5 11.1 19.5 11.7 18.0
GUINEA 3.4 6.2 8.8 5.9 1.6 2.0 0.9 0.1 1.7 0.8 2.9
GUINEA BISSAU 24.7 13.6 23.0 30.1 24.2 19.9 26.0 6.8 23.3 5.6 19.3
LIBERIA 1.9 1.0 3.7 4.4 0.9 -3.0 3.4 2.2 2.0 1.6 2.0
MALI 9.6 6.9 5.3 7.0 7.3 7.6 8.1 1.0 5.9 0.9 9.7
NIGER 8.0 8.5 7.8 8.4 9.6 6.8 6.8 -5.1 4.0 14.9 11.7
NIGERIA 5.8 5.9 2.8 1.7 1.3 0.6 1.2 0.0 0.2 2.8 0.4
SENEGAL 3.8 1.8 3.2 5.5 4.7 7.3 6.2 2.4 4.9 2.2 4.6
SIERRA LEONE 16.7 16.5 19.4 14.3 9.5 8.5 5.0 9.5 8.6 5.7 8.1
TOGO 2.3 1.0 1.8 -0.6 4.1 4.2 2.9 -3.9 2.8 7.8 5.6
UEMOA 4.3 3.8 4.4 4.8 5.2 5.1 5.1 6.1 4.3 5.3 5.7
WAMZ 6.4 6.1 3.4 2.3 1.8 1.6 2.2 0.9 1.8 3.5 1.9
ECOWAS 5.7 5.4 3.7 3.2 2.9 2.8 3.2 2.7 2.6 4.1 3.1
No. of countries 6 5 5 4 4 6 7 10 8 8 5
Sources: WAMA and Central Banks
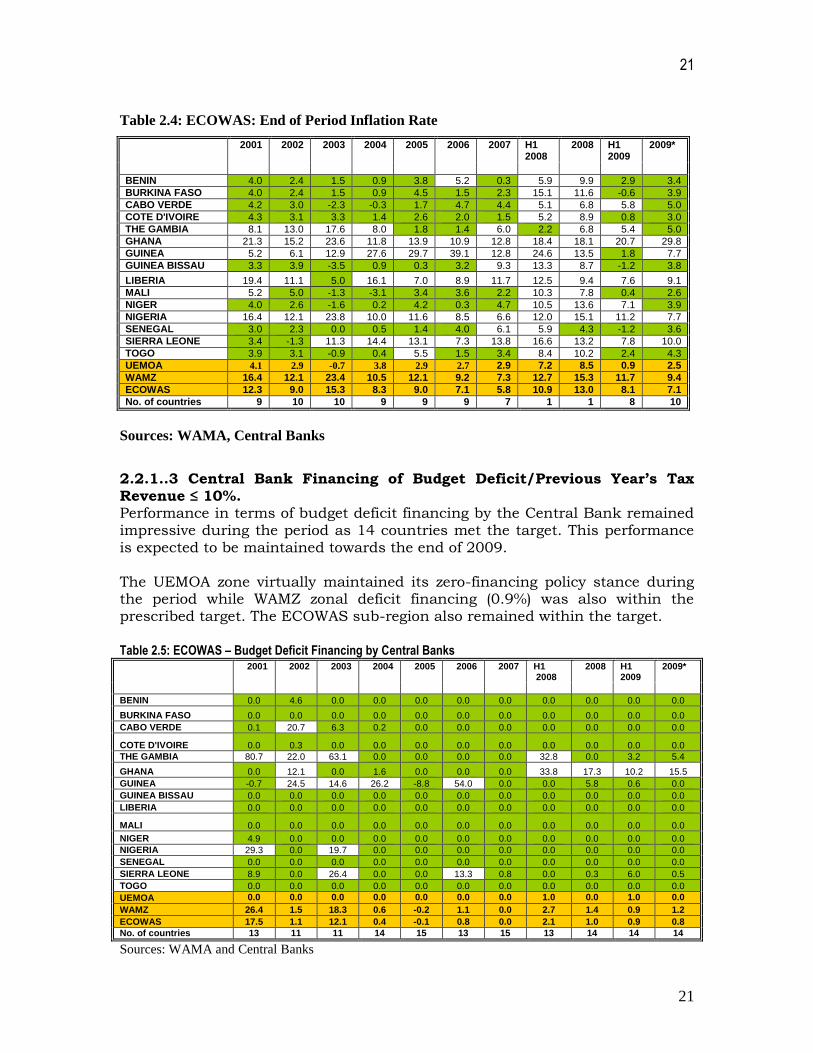
2.2.1.2 Inflation Rate ≤ 5 % Inflationary pressures that mainly originated from the food and fuel crises
began to register some improvements during the first half of 2009. Eight countries achieved the target compared to one in 2008. This performance is expected to improve significantly towards the end of the year when ten countries are expected to meet the target. Regarding the zonal performance, UEMOA experienced lower inflationary pressures (0.9%) than the WAMZ (11.7%) Inflationary pressures at the level of ECOWAS were also high at 8.1 percent during the period under review.
21
21
Table 2.4: ECOWAS: End of Period Inflation Rate
2001 2002 2003 2004 2005 2006 2007 H1 2008
2008 H1 2009
2009*
BENIN 4.0 2.4 1.5 0.9 3.8 5.2 0.3 5.9 9.9 2.9 3.4
BURKINA FASO 4.0 2.4 1.5 0.9 4.5 1.5 2.3 15.1 11.6 -0.6 3.9
CABO VERDE 4.2 3.0 -2.3 -0.3 1.7 4.7 4.4 5.1 6.8 5.8 5.0
COTE D'IVOIRE 4.3 3.1 3.3 1.4 2.6 2.0 1.5 5.2 8.9 0.8 3.0
THE GAMBIA 8.1 13.0 17.6 8.0 1.8 1.4 6.0 2.2 6.8 5.4 5.0
GHANA 21.3 15.2 23.6 11.8 13.9 10.9 12.8 18.4 18.1 20.7 29.8
GUINEA 5.2 6.1 12.9 27.6 29.7 39.1 12.8 24.6 13.5 1.8 7.7
GUINEA BISSAU 3.3 3.9 -3.5 0.9 0.3 3.2 9.3 13.3 8.7 -1.2 3.8
LIBERIA 19.4 11.1 5.0 16.1 7.0 8.9 11.7 12.5 9.4 7.6 9.1
MALI 5.2 5.0 -1.3 -3.1 3.4 3.6 2.2 10.3 7.8 0.4 2.6
NIGER 4.0 2.6 -1.6 0.2 4.2 0.3 4.7 10.5 13.6 7.1 3.9
NIGERIA 16.4 12.1 23.8 10.0 11.6 8.5 6.6 12.0 15.1 11.2 7.7
SENEGAL 3.0 2.3 0.0 0.5 1.4 4.0 6.1 5.9 4.3 -1.2 3.6
SIERRA LEONE 3.4 -1.3 11.3 14.4 13.1 7.3 13.8 16.6 13.2 7.8 10.0
TOGO 3.9 3.1 -0.9 0.4 5.5 1.5 3.4 8.4 10.2 2.4 4.3
UEMOA 4.1 2.9 -0.7 3.8 2.9 2.7 2.9 7.2 8.5 0.9 2.5
WAMZ 16.4 12.1 23.4 10.5 12.1 9.2 7.3 12.7 15.3 11.7 9.4
ECOWAS 12.3 9.0 15.3 8.3 9.0 7.1 5.8 10.9 13.0 8.1 7.1
No. of countries 9 10 10 9 9 9 7 1 1 8 10
Sources: WAMA, Central Banks
2.2.1..3 Central Bank Financing of Budget Deficit/Previous Year’s Tax Revenue ≤ 10%. Performance in terms of budget deficit financing by the Central Bank remained impressive during the period as 14 countries met the target. This performance is expected to be maintained towards the end of 2009. The UEMOA zone virtually maintained its zero-financing policy stance during the period while WAMZ zonal deficit financing (0.9%) was also within the prescribed target. The ECOWAS sub-region also remained within the target.
Table 2.5: ECOWAS – Budget Deficit Financing by Central Banks 2001 2002 2003 2004 2005 2006 2007 H1
2008 2008 H1
2009 2009*
BENIN 0.0 4.6 0.0 0.0 0.0 0.0 0.0 0.0 0.0 0.0 0.0
BURKINA FASO 0.0 0.0 0.0 0.0 0.0 0.0 0.0 0.0 0.0 0.0 0.0
CABO VERDE 0.1 20.7 6.3 0.2 0.0 0.0 0.0 0.0 0.0 0.0 0.0
COTE D'IVOIRE 0.0 0.3 0.0 0.0 0.0 0.0 0.0 0.0 0.0 0.0 0.0
THE GAMBIA 80.7 22.0 63.1 0.0 0.0 0.0 0.0 32.8 0.0 3.2 5.4
GHANA 0.0 12.1 0.0 1.6 0.0 0.0 0.0 33.8 17.3 10.2 15.5
GUINEA -0.7 24.5 14.6 26.2 -8.8 54.0 0.0 0.0 5.8 0.6 0.0
GUINEA BISSAU 0.0 0.0 0.0 0.0 0.0 0.0 0.0 0.0 0.0 0.0 0.0
LIBERIA 0.0 0.0 0.0 0.0 0.0 0.0 0.0 0.0 0.0 0.0 0.0
MALI 0.0 0.0 0.0 0.0 0.0 0.0 0.0 0.0 0.0 0.0 0.0
NIGER 4.9 0.0 0.0 0.0 0.0 0.0 0.0 0.0 0.0 0.0 0.0
NIGERIA 29.3 0.0 19.7 0.0 0.0 0.0 0.0 0.0 0.0 0.0 0.0
SENEGAL 0.0 0.0 0.0 0.0 0.0 0.0 0.0 0.0 0.0 0.0 0.0
SIERRA LEONE 8.9 0.0 26.4 0.0 0.0 13.3 0.8 0.0 0.3 6.0 0.5
TOGO 0.0 0.0 0.0 0.0 0.0 0.0 0.0 0.0 0.0 0.0 0.0
UEMOA 0.0 0.0 0.0 0.0 0.0 0.0 0.0 1.0 0.0 1.0 0.0
WAMZ 26.4 1.5 18.3 0.6 -0.2 1.1 0.0 2.7 1.4 0.9 1.2
ECOWAS 17.5 1.1 12.1 0.4 -0.1 0.8 0.0 2.1 1.0 0.9 0.8
No. of countries 13 11 11 14 15 13 15 13 14 14 14
Sources: WAMA and Central Banks
22
22
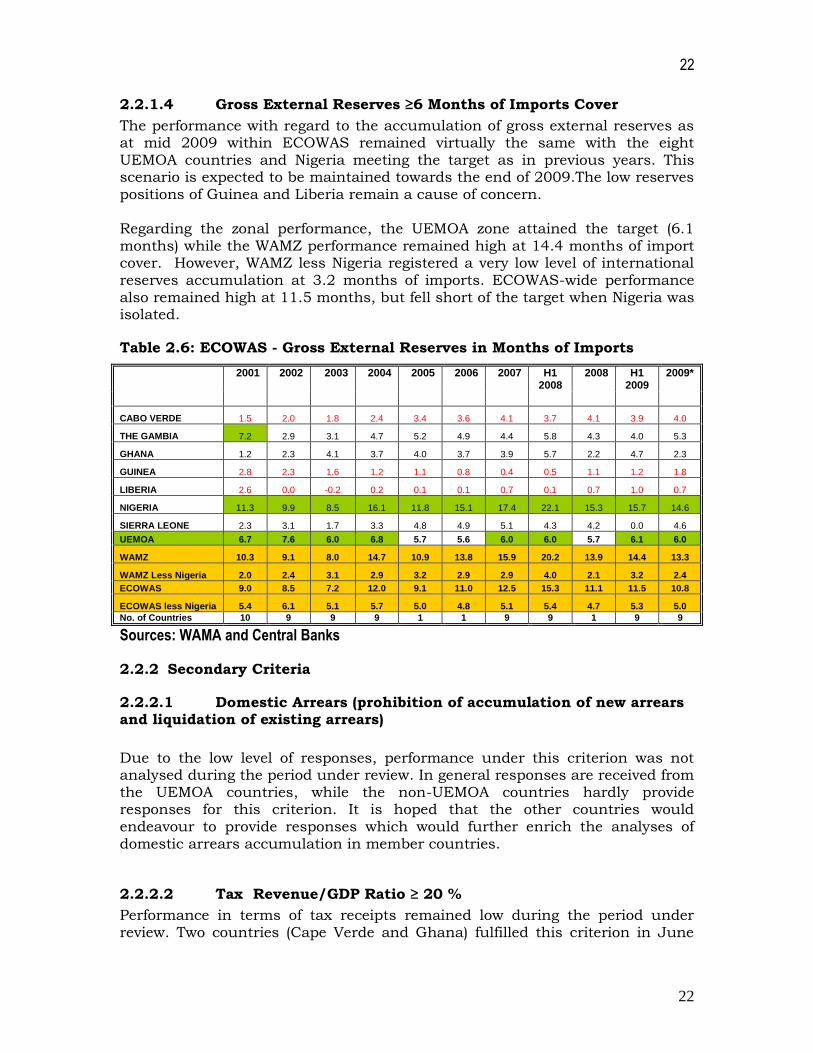
2.2.1.4 Gross External Reserves ≥6 Months of Imports Cover
The performance with regard to the accumulation of gross external reserves as at mid 2009 within ECOWAS remained virtually the same with the eight UEMOA countries and Nigeria meeting the target as in previous years. This scenario is expected to be maintained towards the end of 2009.The low reserves positions of Guinea and Liberia remain a cause of concern. Regarding the zonal performance, the UEMOA zone attained the target (6.1 months) while the WAMZ performance remained high at 14.4 months of import cover. However, WAMZ less Nigeria registered a very low level of international reserves accumulation at 3.2 months of imports. ECOWAS-wide performance also remained high at 11.5 months, but fell short of the target when Nigeria was isolated.
Table 2.6: ECOWAS - Gross External Reserves in Months of Imports
2001 2002 2003 2004 2005 2006 2007 H1 2008
2008 H1 2009
2009*
CABO VERDE 1.5 2.0 1.8 2.4 3.4 3.6 4.1 3.7 4.1 3.9 4.0
THE GAMBIA 7.2 2.9 3.1 4.7 5.2 4.9 4.4 5.8 4.3 4.0 5.3
GHANA 1.2 2.3 4.1 3.7 4.0 3.7 3.9 5.7 2.2 4.7 2.3
GUINEA 2.8 2.3 1.6 1.2 1.1 0.8 0.4 0.5 1.1 1.2 1.8
LIBERIA 2.6 0.0 -0.2 0.2 0.1 0.1 0.7 0.1 0.7 1.0 0.7
NIGERIA 11.3 9.9 8.5 16.1 11.8 15.1 17.4 22.1 15.3 15.7 14.6
SIERRA LEONE 2.3 3.1 1.7 3.3 4.8 4.9 5.1 4.3 4.2 0.0 4.6
UEMOA 6.7 7.6 6.0 6.8 5.7 5.6 6.0 6.0 5.7 6.1 6.0
WAMZ 10.3 9.1 8.0 14.7 10.9 13.8 15.9 20.2 13.9 14.4 13.3
WAMZ Less Nigeria 2.0 2.4 3.1 2.9 3.2 2.9 2.9 4.0 2.1 3.2 2.4
ECOWAS 9.0 8.5 7.2 12.0 9.1 11.0 12.5 15.3 11.1 11.5 10.8
ECOWAS less Nigeria 5.4 6.1 5.1 5.7 5.0 4.8 5.1 5.4 4.7 5.3 5.0
No. of Countries 10 9 9 9 1 1 9 9 1 9 9
Sources: WAMA and Central Banks
2.2.2 Secondary Criteria
2.2.2.1 Domestic Arrears (prohibition of accumulation of new arrears and liquidation of existing arrears)
Due to the low level of responses, performance under this criterion was not analysed during the period under review. In general responses are received from the UEMOA countries, while the non-UEMOA countries hardly provide responses for this criterion. It is hoped that the other countries would endeavour to provide responses which would further enrich the analyses of domestic arrears accumulation in member countries.
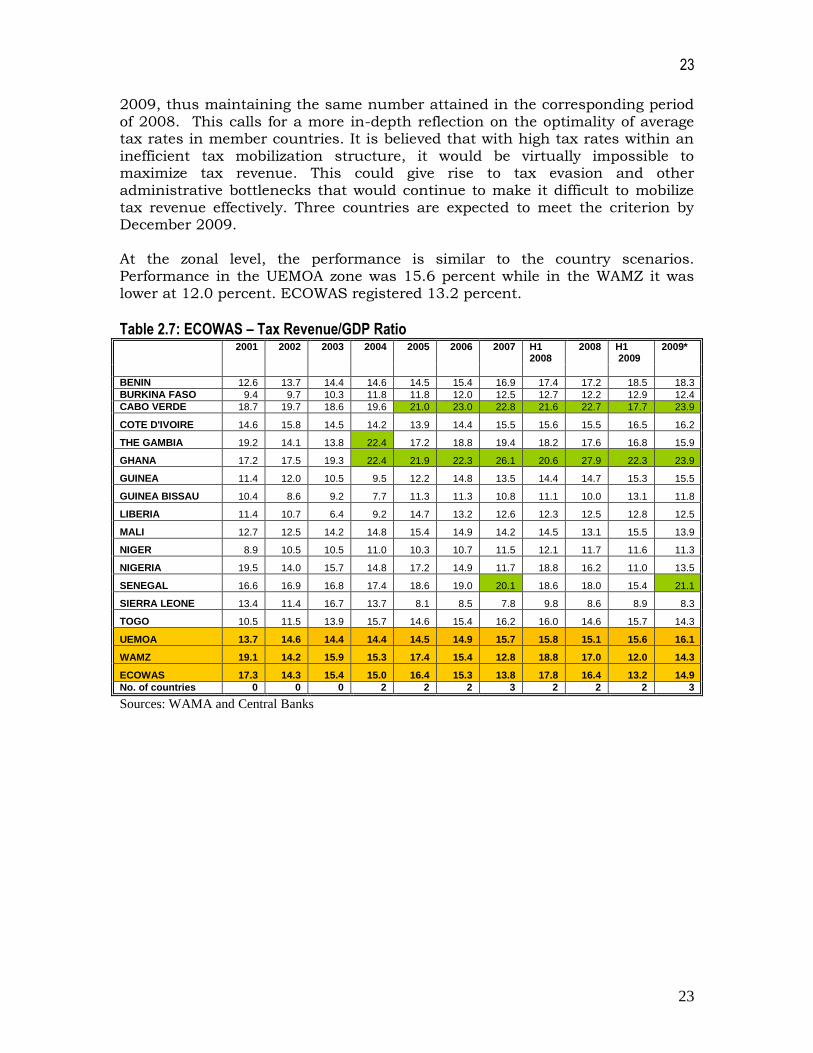
2.2.2.2 Tax Revenue/GDP Ratio ≥ 20 %
Performance in terms of tax receipts remained low during the period under review. Two countries (Cape Verde and Ghana) fulfilled this criterion in June
23
23
2009, thus maintaining the same number attained in the corresponding period of 2008. This calls for a more in-depth reflection on the optimality of average tax rates in member countries. It is believed that with high tax rates within an inefficient tax mobilization structure, it would be virtually impossible to maximize tax revenue. This could give rise to tax evasion and other administrative bottlenecks that would continue to make it difficult to mobilize tax revenue effectively. Three countries are expected to meet the criterion by December 2009. At the zonal level, the performance is similar to the country scenarios. Performance in the UEMOA zone was 15.6 percent while in the WAMZ it was lower at 12.0 percent. ECOWAS registered 13.2 percent.
Table 2.7: ECOWAS – Tax Revenue/GDP Ratio 2001 2002 2003 2004 2005 2006 2007 H1
2008 2008 H1
2009 2009*
BENIN 12.6 13.7 14.4 14.6 14.5 15.4 16.9 17.4 17.2 18.5 18.3
BURKINA FASO 9.4 9.7 10.3 11.8 11.8 12.0 12.5 12.7 12.2 12.9 12.4
CABO VERDE 18.7 19.7 18.6 19.6 21.0 23.0 22.8 21.6 22.7 17.7 23.9
COTE D'IVOIRE 14.6 15.8 14.5 14.2 13.9 14.4 15.5 15.6 15.5 16.5 16.2
THE GAMBIA 19.2 14.1 13.8 22.4 17.2 18.8 19.4 18.2 17.6 16.8 15.9
GHANA 17.2 17.5 19.3 22.4 21.9 22.3 26.1 20.6 27.9 22.3 23.9
GUINEA 11.4 12.0 10.5 9.5 12.2 14.8 13.5 14.4 14.7 15.3 15.5
GUINEA BISSAU 10.4 8.6 9.2 7.7 11.3 11.3 10.8 11.1 10.0 13.1 11.8
LIBERIA 11.4 10.7 6.4 9.2 14.7 13.2 12.6 12.3 12.5 12.8 12.5
MALI 12.7 12.5 14.2 14.8 15.4 14.9 14.2 14.5 13.1 15.5 13.9
NIGER 8.9 10.5 10.5 11.0 10.3 10.7 11.5 12.1 11.7 11.6 11.3
NIGERIA 19.5 14.0 15.7 14.8 17.2 14.9 11.7 18.8 16.2 11.0 13.5
SENEGAL 16.6 16.9 16.8 17.4 18.6 19.0 20.1 18.6 18.0 15.4 21.1
SIERRA LEONE 13.4 11.4 16.7 13.7 8.1 8.5 7.8 9.8 8.6 8.9 8.3
TOGO 10.5 11.5 13.9 15.7 14.6 15.4 16.2 16.0 14.6 15.7 14.3
UEMOA 13.7 14.6 14.4 14.4 14.5 14.9 15.7 15.8 15.1 15.6 16.1
WAMZ 19.1 14.2 15.9 15.3 17.4 15.4 12.8 18.8 17.0 12.0 14.3
ECOWAS 17.3 14.3 15.4 15.0 16.4 15.3 13.8 17.8 16.4 13.2 14.9
No. of countries 0 0 0 2 2 2 3 2 2 2 3
Sources: WAMA and Central Banks
24
24
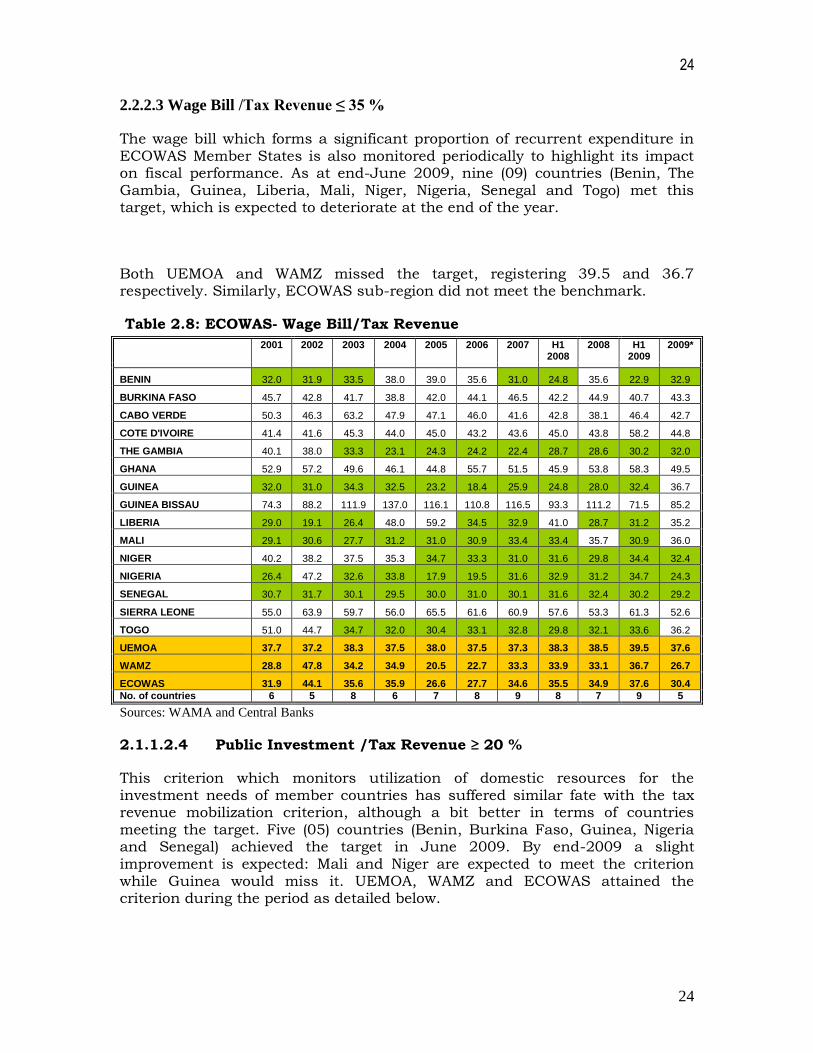
2.2.2.3 Wage Bill /Tax Revenue ≤ 35 %
The wage bill which forms a significant proportion of recurrent expenditure in ECOWAS Member States is also monitored periodically to highlight its impact on fiscal performance. As at end-June 2009, nine (09) countries (Benin, The Gambia, Guinea, Liberia, Mali, Niger, Nigeria, Senegal and Togo) met this target, which is expected to deteriorate at the end of the year.
Both UEMOA and WAMZ missed the target, registering 39.5 and 36.7 respectively. Similarly, ECOWAS sub-region did not meet the benchmark.
Table 2.8: ECOWAS- Wage Bill/Tax Revenue
2001 2002 2003 2004 2005 2006 2007 H1 2008
2008 H1 2009
2009*
BENIN 32.0 31.9 33.5 38.0 39.0 35.6 31.0 24.8 35.6 22.9 32.9
BURKINA FASO 45.7 42.8 41.7 38.8 42.0 44.1 46.5 42.2 44.9 40.7 43.3
CABO VERDE 50.3 46.3 63.2 47.9 47.1 46.0 41.6 42.8 38.1 46.4 42.7
COTE D'IVOIRE 41.4 41.6 45.3 44.0 45.0 43.2 43.6 45.0 43.8 58.2 44.8
THE GAMBIA 40.1 38.0 33.3 23.1 24.3 24.2 22.4 28.7 28.6 30.2 32.0
GHANA 52.9 57.2 49.6 46.1 44.8 55.7 51.5 45.9 53.8 58.3 49.5
GUINEA 32.0 31.0 34.3 32.5 23.2 18.4 25.9 24.8 28.0 32.4 36.7
GUINEA BISSAU 74.3 88.2 111.9 137.0 116.1 110.8 116.5 93.3 111.2 71.5 85.2
LIBERIA 29.0 19.1 26.4 48.0 59.2 34.5 32.9 41.0 28.7 31.2 35.2
MALI 29.1 30.6 27.7 31.2 31.0 30.9 33.4 33.4 35.7 30.9 36.0
NIGER 40.2 38.2 37.5 35.3 34.7 33.3 31.0 31.6 29.8 34.4 32.4
NIGERIA 26.4 47.2 32.6 33.8 17.9 19.5 31.6 32.9 31.2 34.7 24.3
SENEGAL 30.7 31.7 30.1 29.5 30.0 31.0 30.1 31.6 32.4 30.2 29.2
SIERRA LEONE 55.0 63.9 59.7 56.0 65.5 61.6 60.9 57.6 53.3 61.3 52.6
TOGO 51.0 44.7 34.7 32.0 30.4 33.1 32.8 29.8 32.1 33.6 36.2
UEMOA 37.7 37.2 38.3 37.5 38.0 37.5 37.3 38.3 38.5 39.5 37.6
WAMZ 28.8 47.8 34.2 34.9 20.5 22.7 33.3 33.9 33.1 36.7 26.7
ECOWAS 31.9 44.1 35.6 35.9 26.6 27.7 34.6 35.5 34.9 37.6 30.4
No. of countries 6 5 8 6 7 8 9 8 7 9 5
Sources: WAMA and Central Banks
2.1.1.2.4 Public Investment /Tax Revenue ≥ 20 %
This criterion which monitors utilization of domestic resources for the investment needs of member countries has suffered similar fate with the tax revenue mobilization criterion, although a bit better in terms of countries meeting the target. Five (05) countries (Benin, Burkina Faso, Guinea, Nigeria and Senegal) achieved the target in June 2009. By end-2009 a slight improvement is expected: Mali and Niger are expected to meet the criterion while Guinea would miss it. UEMOA, WAMZ and ECOWAS attained the criterion during the period as detailed below.

25
25
Table 2.9: ECOWAS – Public Investment/Tax Revenue
2001 2002 2003 2004 2005 2006 2007 H1 2008
2008 H1 2009
2009*
BENIN 18.9 19.3 23.2 20.0 22.8 12.8 21.0 23.5 23.2 25.8 25.5
BURKINA FASO 24.6 36.0 32.7 42.7 40.8 43.4 35.6 41.2 44.8 32.8 35.7
CABO VERDE 4.2 4.8 3.4 3.3 2.9 2.9 2.0 7.8 1.9 2.5 2.4
COTE D'IVOIRE 7.5 11.6 10.5 12.3 10.7 15.5 12.5 7.3 13.6 9.1 17.9
THE GAMBIA 6.1 7.5 11.0 14.2 4.8 3.1 6.3 8.6 16.3 14.0 10.0
GHANA 16.4 13.2 18.8 18.4 18.8 25.0 27.3 23.9 35.8 17.5 6.0
GUINEA 5.5 10.2 12.1 16.1 12.6 12.0 11.9 14.5 12.9 20.0 16.9
GUINEA BISSAU 16.9 5.9 4.2 4.2 6.0 2.2 11.7 3.8 10.7 1.9 5.3
LIBERIA 46.1 47.3 0.0 25.6 18.3 14.9 13.8 12.5 12.5 15.1 14.7
MALI 22.0 20.5 24.5 22.8 21.8 23.4 34.5 13.3 25.0 12.3 29.4
NIGER 20.0 18.7 26.6 20.3 28.1 25.3 31.6 17.5 38.8 11.2 24.9
NIGERIA 40.3 30.7 21.4 20.3 20.6 20.0 31.2 28.6 24.6 36.5 26.4
SENEGAL 20.5 23.5 24.1 30.0 33.7 36.6 35.9 27.7 32.8 38.7 29.1
SIERRA LEONE 6.6 9.4 11.3 8.2 7.9 10.6 9.1 15.9 13.4 8.0 11.8
TOGO 2.5 2.6 1.7 1.9 8.4 3.6 4.1 5.6 12.9 6.2 14.3
UEMOA 14.7 15.3 19.5 21.7 23.2 23.9 24.6 25.6 47.7 48.7 50.1
WAMZ 37.4 28.7 20.9 19.9 20.1 20.1 30.3 27.8 25.1 34.4 24.5
ECOWAS 29.8 24.3 20.2 20.5 21.1 21.2 28.2 26.9 32.4 38.9 32.8
No. of countries 6 5 6 7 6 6 7 5 7 5 6
Sources: WAMA and Central Banks
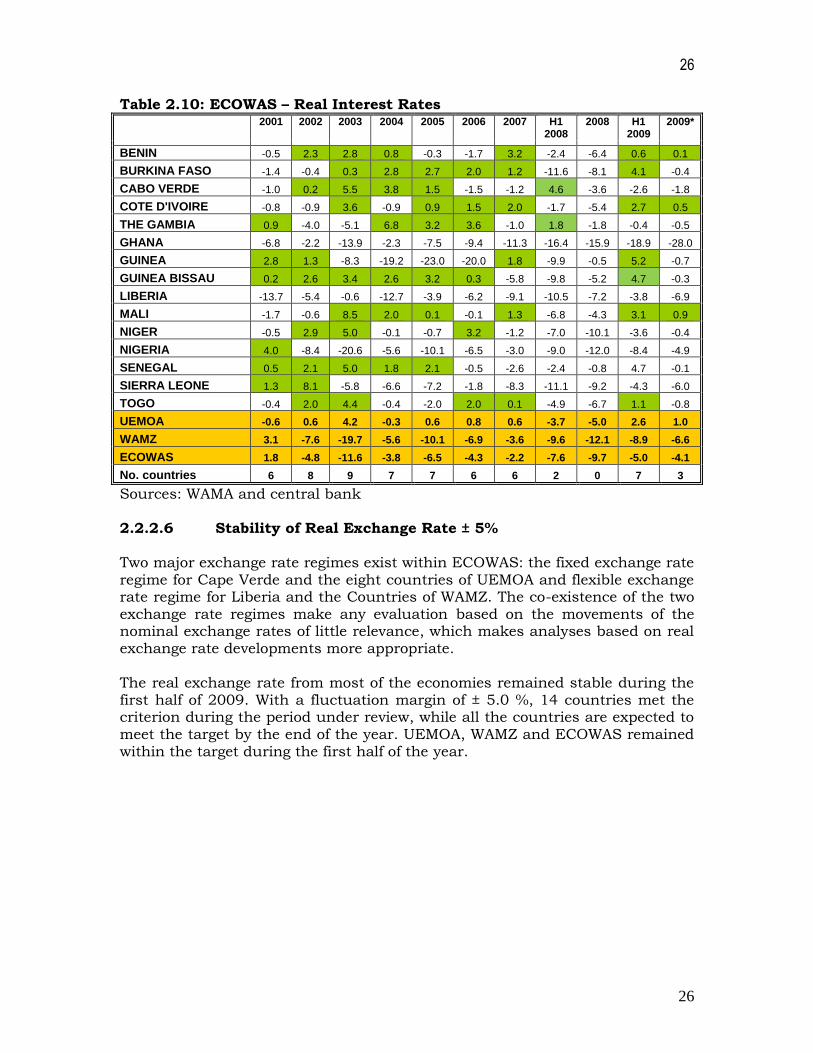
2.2.2.5 Positive Real Interest Rates
In recent years, the real interest rates have been constantly negative in a majority of the countries, due to high inflationary pressures experienced. Prevalence of negative real interest rates is inimical to domestic savings mobilization and financial intermediation which underscores the importance of the observance of this criterion. Significant improvements were registered during the period; with seven (07) countries (Benin, Burkina Faso, Cote d’Ivoire, Guinea, Guinea Bissau, Mali and Togo) meeting the target compared to two (02) countries (Cape Verde and The Gambia) in June 2008. However, this performance is expected to decline by end-2009 when three countries would meet the target. Regarding the zonal and sub-regional levels, UEMOA performance was far better than those of ECOWAS and WAMZ. ECOWAS, UEMOA and WAMZ registered real interest rates of -5.0, 2.6 and -8.9 respectively as at June 2009.
26
26
Table 2.10: ECOWAS – Real Interest Rates 2001 2002 2003 2004 2005 2006 2007 H1
2008 2008 H1
2009 2009*
BENIN -0.5 2.3 2.8 0.8 -0.3 -1.7 3.2 -2.4 -6.4 0.6 0.1
BURKINA FASO -1.4 -0.4 0.3 2.8 2.7 2.0 1.2 -11.6 -8.1 4.1 -0.4
CABO VERDE -1.0 0.2 5.5 3.8 1.5 -1.5 -1.2 4.6 -3.6 -2.6 -1.8
COTE D'IVOIRE -0.8 -0.9 3.6 -0.9 0.9 1.5 2.0 -1.7 -5.4 2.7 0.5
THE GAMBIA 0.9 -4.0 -5.1 6.8 3.2 3.6 -1.0 1.8 -1.8 -0.4 -0.5
GHANA -6.8 -2.2 -13.9 -2.3 -7.5 -9.4 -11.3 -16.4 -15.9 -18.9 -28.0
GUINEA 2.8 1.3 -8.3 -19.2 -23.0 -20.0 1.8 -9.9 -0.5 5.2 -0.7
GUINEA BISSAU 0.2 2.6 3.4 2.6 3.2 0.3 -5.8 -9.8 -5.2 4.7 -0.3
LIBERIA -13.7 -5.4 -0.6 -12.7 -3.9 -6.2 -9.1 -10.5 -7.2 -3.8 -6.9
MALI -1.7 -0.6 8.5 2.0 0.1 -0.1 1.3 -6.8 -4.3 3.1 0.9
NIGER -0.5 2.9 5.0 -0.1 -0.7 3.2 -1.2 -7.0 -10.1 -3.6 -0.4
NIGERIA 4.0 -8.4 -20.6 -5.6 -10.1 -6.5 -3.0 -9.0 -12.0 -8.4 -4.9
SENEGAL 0.5 2.1 5.0 1.8 2.1 -0.5 -2.6 -2.4 -0.8 4.7 -0.1
SIERRA LEONE 1.3 8.1 -5.8 -6.6 -7.2 -1.8 -8.3 -11.1 -9.2 -4.3 -6.0
TOGO -0.4 2.0 4.4 -0.4 -2.0 2.0 0.1 -4.9 -6.7 1.1 -0.8
UEMOA -0.6 0.6 4.2 -0.3 0.6 0.8 0.6 -3.7 -5.0 2.6 1.0
WAMZ 3.1 -7.6 -19.7 -5.6 -10.1 -6.9 -3.6 -9.6 -12.1 -8.9 -6.6
ECOWAS 1.8 -4.8 -11.6 -3.8 -6.5 -4.3 -2.2 -7.6 -9.7 -5.0 -4.1
No. countries 6 8 9 7 7 6 6 2 0 7 3
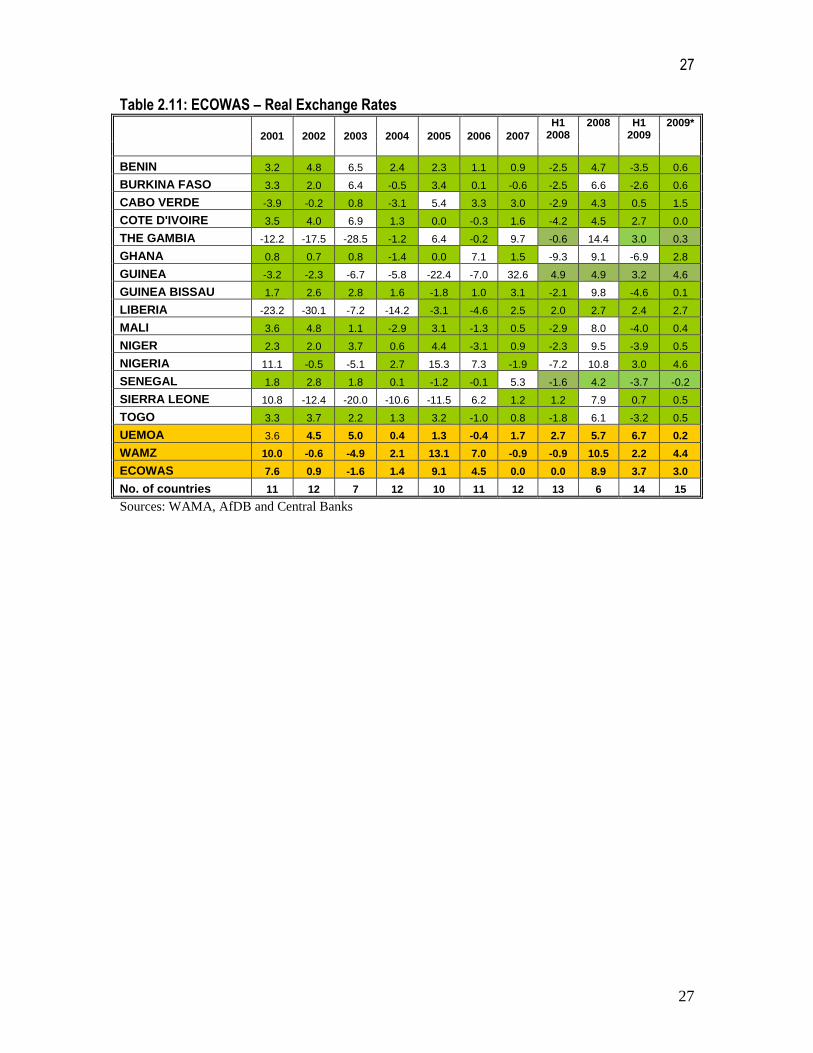
Sources: WAMA and central bank 2.2.2.6 Stability of Real Exchange Rate ± 5% Two major exchange rate regimes exist within ECOWAS: the fixed exchange rate regime for Cape Verde and the eight countries of UEMOA and flexible exchange rate regime for Liberia and the Countries of WAMZ. The co-existence of the two exchange rate regimes make any evaluation based on the movements of the nominal exchange rates of little relevance, which makes analyses based on real exchange rate developments more appropriate. The real exchange rate from most of the economies remained stable during the first half of 2009. With a fluctuation margin of ± 5.0 %, 14 countries met the criterion during the period under review, while all the countries are expected to meet the target by the end of the year. UEMOA, WAMZ and ECOWAS remained within the target during the first half of the year.
27
27
Table 2.11: ECOWAS – Real Exchange Rates
2001 2002 2003 2004 2005 2006 2007
H1 2008
2008 H1 2009
2009*
BENIN 3.2 4.8 6.5 2.4 2.3 1.1 0.9 -2.5 4.7 -3.5 0.6
BURKINA FASO 3.3 2.0 6.4 -0.5 3.4 0.1 -0.6 -2.5 6.6 -2.6 0.6
CABO VERDE -3.9 -0.2 0.8 -3.1 5.4 3.3 3.0 -2.9 4.3 0.5 1.5
COTE D'IVOIRE 3.5 4.0 6.9 1.3 0.0 -0.3 1.6 -4.2 4.5 2.7 0.0
THE GAMBIA -12.2 -17.5 -28.5 -1.2 6.4 -0.2 9.7 -0.6 14.4 3.0 0.3
GHANA 0.8 0.7 0.8 -1.4 0.0 7.1 1.5 -9.3 9.1 -6.9 2.8
GUINEA -3.2 -2.3 -6.7 -5.8 -22.4 -7.0 32.6 4.9 4.9 3.2 4.6
GUINEA BISSAU 1.7 2.6 2.8 1.6 -1.8 1.0 3.1 -2.1 9.8 -4.6 0.1
LIBERIA -23.2 -30.1 -7.2 -14.2 -3.1 -4.6 2.5 2.0 2.7 2.4 2.7
MALI 3.6 4.8 1.1 -2.9 3.1 -1.3 0.5 -2.9 8.0 -4.0 0.4
NIGER 2.3 2.0 3.7 0.6 4.4 -3.1 0.9 -2.3 9.5 -3.9 0.5
NIGERIA 11.1 -0.5 -5.1 2.7 15.3 7.3 -1.9 -7.2 10.8 3.0 4.6
SENEGAL 1.8 2.8 1.8 0.1 -1.2 -0.1 5.3 -1.6 4.2 -3.7 -0.2
SIERRA LEONE 10.8 -12.4 -20.0 -10.6 -11.5 6.2 1.2 1.2 7.9 0.7 0.5
TOGO 3.3 3.7 2.2 1.3 3.2 -1.0 0.8 -1.8 6.1 -3.2 0.5
UEMOA 3.6 4.5 5.0 0.4 1.3 -0.4 1.7 2.7 5.7 6.7 0.2
WAMZ 10.0 -0.6 -4.9 2.1 13.1 7.0 -0.9 -0.9 10.5 2.2 4.4
ECOWAS 7.6 0.9 -1.6 1.4 9.1 4.5 0.0 0.0 8.9 3.7 3.0
No. of countries 11 12 7 12 10 11 12 13 6 14 15
Sources: WAMA, AfDB and Central Banks
28
28
3. MACROECONOMIC CONVERGENCE AND STATUS OF POLICY
HARMONIZATION ON ZONAL AND COUNTRY BASIS IN 2009
3.1 WEST AFRICAN MONETARY AND ECONOMIC UNION (UEMOA2) COUNTRIES Projections on economic activity within the Union indicate a growth rate of 3.5% in 2009 against 3.8% in 2008. In most member states, a lower growth rate is expected. Concerning inflation, in 2009, a favourable trend was expected in view of prospects of good grain harvest as well as the easing of oil and food prices observed in the international market. With regard to projected public finances in 2009, major budget balances worsened. Revenue grew by 7.7% and accounted for 17.8% of GDP while total expenditures expanded by 14.2%,
representing 23.4% of GDP. On the whole, overall deficit excluding grants would be 5.8% of GDP. As regards the external sector, for 2009, prospects for the union show an upturn in exports under the assumption of an increase in agricultural production (cocoa, cotton, and cashew). This increase was due to better organization of the sub-sectors and commissioning of new gold mines in Mali and Burkina Faso. On the whole, projections of member states on their current transactions account seemed to be in line with trend in their economic activity. However, the mobilization of external resources within the context of financial crisis is a threat to the achievement of balance of payments targets.
On the monetary front, according to 2009 projections, external assets were expected to expand by CFAF 105.0 billion, money supply to grow by 5.0% and internal credit would increase by 4.7%. The increase in internal credit would be fuelled by a 5.0% expansion in ordinary credits. The net credit to the government (NCG)is expected to deteriorate by CFAF 12.8 billion.
Concerning the convergence status as at end of June 2009, it is worth indicating that none of the countries except cote d’Ivoire met the four primary criteria mainly due to institutional, governance as well as exogenous factors. The ratio of budget deficit excluding grants over GDP could not be observed at the community level. This failure is largely attributed to the low tax pressure rate and an increase in current expenditures especially, salaries and operational expenditures. End of period inflation was expected to follow a favourable trend in line with prospects of good grain harvest as well as the
easing of oil and food prices observed on the international market.
In 2009, UEMOA met criterion on import coverage by reserve and as a result all member countries observed this criterion. The criterion regarding financing of budget deficit by the Central Bank was also observed. Since 2003, BCEAO has stopped financing the budget deficit of member state. It is worth noting that these two criteria are given as indication for individual countries of the
2 All amounts concerning the UEMOA zone are expressed in CFAF

29
29
Union. UEMOA has a common reserve and common monetary policy for all Members States. Thus, contrary to other criteria that are specific to each country, these two criteria would not be covered under the country analysis.
3.1.1 BENIN
Benin’s economic targets for 2009 fall under the implementation of the Multi-annual Programme 2008 -2010 which aims basically to accelerate economic growth, sustain budgetary performance, control prices and improve competitiveness in the external sector. However, there was a slowdown in economic activity due to the financial crisis. This contributed to the weakening of major economic indicators.
3.1.1.1 MAJOR MACROECONOMIC DEVELOPMENTS
Real sector
Reviewed projections were based on a 3.8% growth in 2009 compared to an initial target of 6.1%. This downward review of the growth target is mainly attributed to the impact of the financial crisis on Benin’s economy which reflected in a sharp drop in re-exports to Nigeria, a fall in cotton price and remittances from immigrants.
In 2009, the expected growth in the primary sector was mainly driven by the projected growth in food production due to support measures adopted by the Government. These measures include mechanization, supply of fertilizer at subsidized prices and the implementation of the emergency program to boost rice production.
Similarly, activity in the secondary sector was sustained by performance in the Building and Public Work sub sector which would continue to benefit from the execution of housing and road construction projects. On the other hand, the tertiary sector was adversely affected by the decline in re-export to Nigeria. This was to some extent compensated for by the dynamism in the “Transport and Telecommunication” subsector.
Table 3.1: Trends in GDP BENIN
2007* 2008* 2009** 2007* 2008* 2009**
DEMAND COMPONENT TRENDS IN % VARIATION IN % OF GDP
Public Consumption -19.0 20.5 19.2 9.1 9.8 10.9
Private Consumption 17.2 10.6 5.9 83.8 82.3 81.8
Gross Fixed Capital Formation 9.3 14.9 9.6 19.9 20.3 20.9
Stocks Variation -10.8 -40.3 0.0 0.8 0.4 0.4
Exports of Goods and Services 20.6 27.8 -5.4 20.0 22.7 20.2
Import of goods and services 32.6 18.7 2.6 33.7 35.5 34.2
COMPOSITION OF GDP
Primary Sector 4.1 16.3 4.6 31.4 32.5 31.9
Secondary sector 7.6 8.5 8.8 13.0 12.6 12.8
Tertiary sector and non market services 9.3 11.5 7.2 55.5 55.0 55.3
GDP DISTRIBUTION
Consumption 4.5 -1.0 0.7 92.94 92.04 92.71
Investments 0.9 0.1 2.7 20.75 20.76 21.31
Domestic savings -36.3 12.7 -8.4 7.06 7.96 7.29
Source : BCEAO/WAMA

30
30
With regard to prices, year-on-year inflation settled at 2.9% and on the average at 4.1% against 9.9% and 9.4% at the end of 2008. The drop in inflation is due to a bumper food harvest resulting from the rice maize programme as well as the easing of food and petroleum prices observed on the international market.
Public finances
Concerning public finances, 2009 saw a significant growth in total budget revenue which settled at 22.1% of GDP against a ratio of 19.5% in 2008. A 13% growth in internal revenue was envisaged thanks to the positive effects of measures taken in recent years to strengthen collection capacities of financial authorities as well as mechanism against fiscal fraud. As regards grants, they more than doubled, due to donor’s contribution to the execution of several infrastructure projects.
On the use of resources, the year 2009 was marked by a rise in total expenditures and net loans which reached 27.4% of GDP against a ratio of 22.9% the previous year. This considerable expansion in expenditures stems mainly from the execution of major economic and social infrastructure projects.
On the whole, 2009 was marked by a worsening of major budget balances. Thus, the overall deficit excluding grants stood at 4.4% of GDP against 3.4% in 2008.
Achievements as end of June 2009 showed an improvement in the main budget balances. Consequently, the overall deficit settled at 0.8% of GDP on annual basis. The delay in the execution of some expenditure explains this situation.
Table 3.2: Trends of some budget items (Variation in %)
2006 2007 2008 2009
REVENUE AND GRANTS 9.6% 34.3% -1.0% 22.7%
BUDGET REVENUE 8.7% 31.4% 6.1% 13.0%
Tax Revenue 13.4% 17.9% 14.7% 13.0%
Non Tax Revenue -22.9% 165.8% -31.8% 12.9%
GRANTS 16.3% 55.8% -45.4% 141.9%
TOTAL EXPENDITURES -2.7% 22.8% 8.8% 25.0%
CURRENT EXPENDITURES 5.1% 4.1% 18.6% 12.4%
Salaries and wages 3.6% 6.0% 27.5% 4.3%
CAPITAL EXPENDITURE -21.4% 82.4% -9.1% 55.0%
Externally Funded -36.3% 92.7% 26.7% 24.5%
Internally Funded 22.8% 12.8% 21.0% 23.2%
OVERALL BALANCE (Commitment basis excluding grants) -42.1% -38.5% 168.2% 37.9% Source : BCEAO/WAMA

31
31
External sector
As regards external transactions, the current account deficit was projected to deteriorate at 11.4% of GDP. This expected deterioration in the current account was attributed to the decline in cotton exports and an increase in imports sustained by huge infrastructure projects. The current deficit would be partly offset by a net inflow of official project/programme grants and loans.
Table 3.3: Some Balance of Payments Indicators of Benin (in % of GDP)
ITEMS 2,006 2,007 2008* 2009**
1 - Trade balance -6.6% -10.1% -9.6% -10.3%
Export FOB 15.6% 19.0% 17.4% 15.9%
Import FOB -22.2% -29.1% -27.0% -26.2%
2-Balance of services -2.9% -3.6% -3.2% -3.7%
3-Balance of revenues -0.6% -0.2% -0.2% -0.1%
4-Balance of current transfers 5.5% 4.9% 4.5% 4.8%
a-BALANCE OF CURRENT TRANSANCTIONS ACCOUNT (1+2+3+4) -4.6% -9.0% -8.4% -9.3%
b-CAPITAL AND FINANCIAL OPERATIONS ACCOUNT (5+6+7) 9.4% 13.8% 9.5% 9.7%
5-Capital Transfers 24.6% 3.2% 1.4% 3.1%
6-Acquisitions /transfers of non-produced financial assets 0.0% 0.0% 0.0% 0.0%
7- Financial Operations -15.1% 10.6% 8.2% 6.6%
Direct Investments 1.2% 4.7% 2.7% 2.5%
Portfolio investments 0.1% 1.2% 0.8% 0.5%
Other investments -16.4% 4.6% 4.7% 3.5%
d - OVERALL BALANCE (a+b+c) 5.3% 5.4% 1.1% 0.3%
Coverage rate : Export Imports(%) 68.1 64.1 64.0 59.0
Degree of openness: (import + export)/GDP (%) 50.0 62.6 58.3 54.4
Current balance/GDP (%) -4.6 -9.0 -8.4 -9.3
Current Balance net of grants/GDP(%) -4.9 -10.0 -9.4 -11.4
Overall Balance/GDP (%) 5.3 5.4 1.1 0.3
(*) Estimates (**) Projections
3.1.1.1.3 Monetary Sector
In the monetary sector, M2 grew by 4.2% in the first half of 2009 to settle at 1 156 billion. This money creation is solely from internal sources. In fact net internal assets increased by 21.1% as at end June 2009. The impact of this increase in broad money supply was offset by a 6.6% drop in net external assets.
This expansion in net domestic assets was beneficial to the State which had drawn down CFAF 48.4 billion from its deposit with the Central Bank.
The decline in external assets stems exclusively from the Central Bank which saw its foreign assets drop by 11%. This drop was somewhat compensated for by a 14.3% rise in foreign exchange assets in commercial banks. Compared to June 2008, main monetary aggregates followed the same trends but in much more pronounced way as indicated in the graph below.

32
32
Table 3.4: Trends in major monetary aggregates
2 0 0 6 2 0 0 7 2 0 0 8 2009
June Dec June Dec June Dec June
LIABILITIES
Money supply (M2) 3.7% 13.8% -1.1% 21.1% 11.8% 13.9% 4.5%
Money supply (M1) 1.1% 15.5% -6.1% 25.0% 12.1% 14.4% -1.2%
Currency in circulation 10.1% 17.7% -18.5% 15.8% 19.8% 26.4% -3.2%
Demand deposits -6.4% 13.4% 6.5% 32.2% 6.9% 5.2% 0.7%
Quasi-money 9.7% 10.0% 10.2% 13.4% 11.1% 12.8% 16.7%
Other items (net) -49.0% 142.4% -40.2% -34.0% 109.8% -32.9% -5.5%
ASSETS -15.0% 7.4% -8.2% -1.0% 25.3% 52.2% 21.1%
Net Government Credit 38.2% 21.7% 29.6% 38.3% -9.8% -29.9% -49.9%
Central Bank 207.1% 27.8% 8.4% 66.4% -8.5% -28.7% -41.5%
Commercial banks -22.6% 12.9% 63.9% 8.3% -11.9% -32.0% -64.9%
Private sector credit -1.4% 12.5% 6.4% 17.5% 5.8% 13.5% 0.4%
Net foreign assets
Banking system 11.9% 23.6% -1.2% 27.9% 9.9% -4.2% -6.6%
Central Banks 21.5% 12.1% 5.1% 13.6% 3.4% 5.9% -11.0%
Commercials banks -43.2% 165.9% -34.5% 147.7% 34.9% -33.9% 14.3%
Source: BCEAO/WAMA
MACROECONOMIC CONVERGENCE STATUS
The overall improvement in macroeconomic fundamental due mainly to the easing of inflationary pressures reflected in the level of performance in terms of convergence. Nine (9) targets were met in June 2009 against five (5) in 2008.
Table 3.5: BENIN: CONVERGENCE STATUS
All the primary criteria were met in the first half of 2009. The trend towards the end of 2009 was a slight deterioration with regard to sustaining an appropriate
Standard June Dec June* Dec**
Primary criteria: i) Budget Deficit/GDP ≤ 4% 3.6 2.6 3.1 4.4 3.6 4.6 2.5 1.4 0.6 3.4 0.8 4.4 ii) Inflation Rate ≤ 5% 4.2 4.0 2.4 1.5 0.9 3.8 5.2 0.3 5.9 9.9 2.9 3.4 iii) CB Financing ≤10% RF n-1 4.3 0.0 4.6 0.0 0.0 0.0 0.0 0.0 0.0 0.0 0.0 0.0 iv) UEMOA Reserves ≥6 months Imports
B/S 6.1 6.7 7.6 6.0 6.8 5.7 5.6 6.0 6.0 5.7 6.1 5.9
Country reserves (indicative) 6.5 6.7 7.0 7.2 7.8 9.3 7.4 7.1 8.3 7.6 6.8
Secondary criteria i) Domestic Arrears 0 0.0 0.0 0.0 0.0 0.0 0.0 0.0 0.0 0.0 0.0 0.0 0.0
ii) Tax Revenue/GDP ≥ 20% 12.8 12.6 13.7 14.4 14.6 14.5 15.4 16.9 17.4 17.2 18.5 18.3 iii) Wage bill/Tax Revenue ≤ 35% RF 31.1 32.0 31.9 33.5 38.0 39.0 35.6 31.0 24.8 35.6 22.9 32.9 iv) Int. Investment/Tax Revenue v) Real Interest Rates
≥20% RF 12.4 18.9 19.3 23.2 20.0 22.8 12.8 21.0 23.5 23.2 25.8 25.5 > 0 -0.7 -0.5 2.3 2.8 3.6 -0.3 -1.7 3.2 -2.4 -6.4 0.6 0.1 vi) Real Exchange Rate Stability ± 5% - 3.2 4.8 6.5 2.4 2.3 1.1 0.9 -2.5 4.7 -3.5 0.6
Number of criteria met 6 7 8 7 7 5 4 9 7 5 9 8 Source : BCEAO, UEMOA and WAMA * Estimates** Projections
2008 2005 2006 2007 2000 2001 2002 2003 2004 2009

33
33
level of public deficit. This is due to the decline in the performance of the tax authorities and the lack of control over current expenditures. Thanks to the easing of pressures on the international food and oil markets, the inflation rate was on a downward trend at the end of June 2009 (2.9%) but would record a slight increase at the end of the year (3.4%).
With regard to secondary criteria, five (5) were observed in the first half of 2009 against three (3) in 2008. Only the criterion on tax revenue/GDP ratio was not met. However, some improvement was observed in this ratio which was 18.5% against 17.2% in 2008. Public expenditure structure was also in line with requirements of the convergence programme. The control of current expenditures especially the wage bill helps to guarantee adequate level of capital expenditures funded with internal resources. Besides, the moderate increase in consumer prices ensured the return to a positive real interest and a stable real effective exchange rate.
If projections materialize, the performance achieved as at 1st June 2009 could be maintained at the end of the year, with the exception of the ratio budget deficit excluding grant over GDP which would deviate slightly in relation to the target due to the building of some infrastructure with external funding.
3.1.1.4 Conclusion and recommendations
Economic activity was very dynamic in 2008, with a real GDP growth rate of 5.0%. However, this activity occurred within the context of high inflationary pressures. This had an enormous effect on performance in terms of achieving macroeconomic convergence targets.
For 2009, the impact of the international financial crisis led to a slowdown in economic activity and a deterioration in the public finance situation. However, performance in terms of convergence improved thanks to the easing of inflationary pressures. Trends observed at the end of June 2009 confirm this trend.
In order to consolidate gains and ensure in the medium term the sustainability of the country’s performance in terms meeting convergence targets, the measures below are essential:
- Pursue on-going efforts to improve tax revenue by and strengthening tax administration;
- Stem the widening of the budget deficit by rationalizing public expenditure especially operational expenditures which account for 60% of recurrent expenditures;
- Ensure food security in the country by diversifying agricultural production and improving the food distribution channels.
34
34
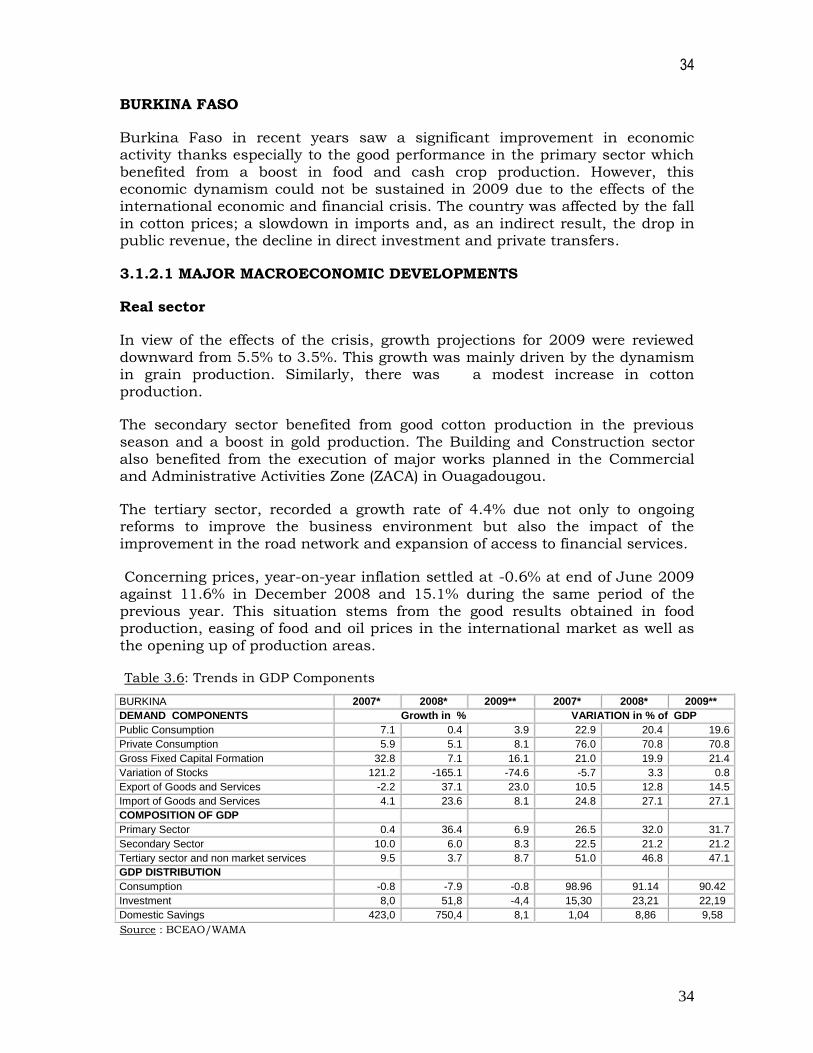
BURKINA FASO
Burkina Faso in recent years saw a significant improvement in economic activity thanks especially to the good performance in the primary sector which benefited from a boost in food and cash crop production. However, this economic dynamism could not be sustained in 2009 due to the effects of the international economic and financial crisis. The country was affected by the fall in cotton prices; a slowdown in imports and, as an indirect result, the drop in public revenue, the decline in direct investment and private transfers.
3.1.2.1 MAJOR MACROECONOMIC DEVELOPMENTS
Real sector
In view of the effects of the crisis, growth projections for 2009 were reviewed
downward from 5.5% to 3.5%. This growth was mainly driven by the dynamism in grain production. Similarly, there was a modest increase in cotton production.
The secondary sector benefited from good cotton production in the previous season and a boost in gold production. The Building and Construction sector also benefited from the execution of major works planned in the Commercial and Administrative Activities Zone (ZACA) in Ouagadougou.
The tertiary sector, recorded a growth rate of 4.4% due not only to ongoing reforms to improve the business environment but also the impact of the improvement in the road network and expansion of access to financial services.
Concerning prices, year-on-year inflation settled at -0.6% at end of June 2009 against 11.6% in December 2008 and 15.1% during the same period of the previous year. This situation stems from the good results obtained in food production, easing of food and oil prices in the international market as well as the opening up of production areas.
Table 3.6: Trends in GDP Components
BURKINA 2007* 2008* 2009** 2007* 2008* 2009**
DEMAND COMPONENTS Growth in % VARIATION in % of GDP
Public Consumption 7.1 0.4 3.9 22.9 20.4 19.6
Private Consumption 5.9 5.1 8.1 76.0 70.8 70.8
Gross Fixed Capital Formation 32.8 7.1 16.1 21.0 19.9 21.4
Variation of Stocks 121.2 -165.1 -74.6 -5.7 3.3 0.8
Export of Goods and Services -2.2 37.1 23.0 10.5 12.8 14.5
Import of Goods and Services 4.1 23.6 8.1 24.8 27.1 27.1
COMPOSITION OF GDP
Primary Sector 0.4 36.4 6.9 26.5 32.0 31.7
Secondary Sector 10.0 6.0 8.3 22.5 21.2 21.2
Tertiary sector and non market services 9.5 3.7 8.7 51.0 46.8 47.1
GDP DISTRIBUTION
Consumption -0.8 -7.9 -0.8 98.96 91.14 90.42
Investment 8,0 51,8 -4,4 15,30 23,21 22,19
Domestic Savings 423,0 750,4 8,1 1,04 8,86 9,58
Source : BCEAO/WAMA
35
35
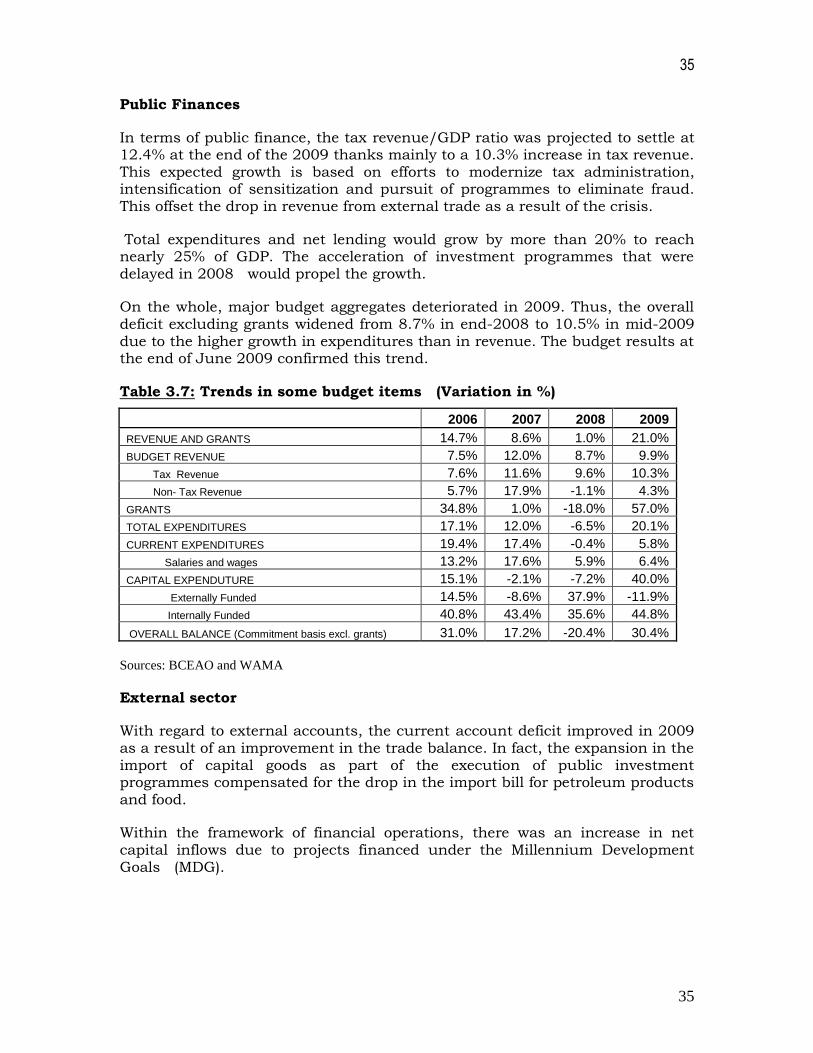
Public Finances
In terms of public finance, the tax revenue/GDP ratio was projected to settle at 12.4% at the end of the 2009 thanks mainly to a 10.3% increase in tax revenue. This expected growth is based on efforts to modernize tax administration, intensification of sensitization and pursuit of programmes to eliminate fraud. This offset the drop in revenue from external trade as a result of the crisis.
Total expenditures and net lending would grow by more than 20% to reach nearly 25% of GDP. The acceleration of investment programmes that were delayed in 2008 would propel the growth.
On the whole, major budget aggregates deteriorated in 2009. Thus, the overall deficit excluding grants widened from 8.7% in end-2008 to 10.5% in mid-2009
due to the higher growth in expenditures than in revenue. The budget results at the end of June 2009 confirmed this trend.
Table 3.7: Trends in some budget items (Variation in %)
2006 2007 2008 2009
REVENUE AND GRANTS 14.7% 8.6% 1.0% 21.0%
BUDGET REVENUE 7.5% 12.0% 8.7% 9.9%
Tax Revenue 7.6% 11.6% 9.6% 10.3%
Non- Tax Revenue 5.7% 17.9% -1.1% 4.3%
GRANTS 34.8% 1.0% -18.0% 57.0%
TOTAL EXPENDITURES 17.1% 12.0% -6.5% 20.1%
CURRENT EXPENDITURES 19.4% 17.4% -0.4% 5.8%
Salaries and wages 13.2% 17.6% 5.9% 6.4%
CAPITAL EXPENDUTURE 15.1% -2.1% -7.2% 40.0%
Externally Funded 14.5% -8.6% 37.9% -11.9%
Internally Funded 40.8% 43.4% 35.6% 44.8%
OVERALL BALANCE (Commitment basis excl. grants) 31.0% 17.2% -20.4% 30.4%
Sources: BCEAO and WAMA
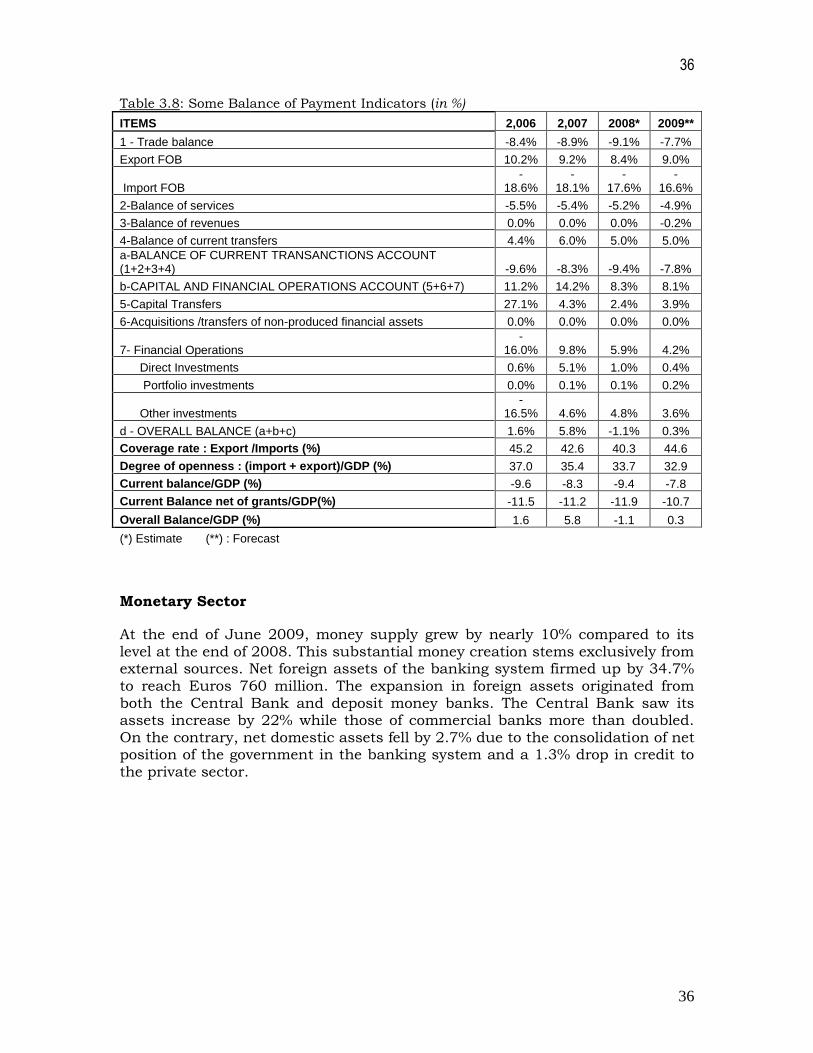
External sector
With regard to external accounts, the current account deficit improved in 2009 as a result of an improvement in the trade balance. In fact, the expansion in the import of capital goods as part of the execution of public investment programmes compensated for the drop in the import bill for petroleum products and food.
Within the framework of financial operations, there was an increase in net capital inflows due to projects financed under the Millennium Development Goals (MDG).
36
36
Table 3.8: Some Balance of Payment Indicators (in %)
ITEMS 2,006 2,007 2008* 2009**
1 - Trade balance -8.4% -8.9% -9.1% -7.7%
Export FOB 10.2% 9.2% 8.4% 9.0%
Import FOB -
18.6% -
18.1% -
17.6% -
16.6%
2-Balance of services -5.5% -5.4% -5.2% -4.9%
3-Balance of revenues 0.0% 0.0% 0.0% -0.2%
4-Balance of current transfers 4.4% 6.0% 5.0% 5.0%
a-BALANCE OF CURRENT TRANSANCTIONS ACCOUNT (1+2+3+4) -9.6% -8.3% -9.4% -7.8%
b-CAPITAL AND FINANCIAL OPERATIONS ACCOUNT (5+6+7) 11.2% 14.2% 8.3% 8.1%
5-Capital Transfers 27.1% 4.3% 2.4% 3.9%
6-Acquisitions /transfers of non-produced financial assets 0.0% 0.0% 0.0% 0.0%
7- Financial Operations -
16.0% 9.8% 5.9% 4.2%
Direct Investments 0.6% 5.1% 1.0% 0.4%
Portfolio investments 0.0% 0.1% 0.1% 0.2%
Other investments -
16.5% 4.6% 4.8% 3.6%
d - OVERALL BALANCE (a+b+c) 1.6% 5.8% -1.1% 0.3%
Coverage rate : Export /Imports (%) 45.2 42.6 40.3 44.6
Degree of openness : (import + export)/GDP (%) 37.0 35.4 33.7 32.9
Current balance/GDP (%) -9.6 -8.3 -9.4 -7.8
Current Balance net of grants/GDP(%) -11.5 -11.2 -11.9 -10.7
Overall Balance/GDP (%) 1.6 5.8 -1.1 0.3
(*) Estimate (**) : Forecast
Monetary Sector
At the end of June 2009, money supply grew by nearly 10% compared to its level at the end of 2008. This substantial money creation stems exclusively from external sources. Net foreign assets of the banking system firmed up by 34.7% to reach Euros 760 million. The expansion in foreign assets originated from both the Central Bank and deposit money banks. The Central Bank saw its assets increase by 22% while those of commercial banks more than doubled. On the contrary, net domestic assets fell by 2.7% due to the consolidation of net position of the government in the banking system and a 1.3% drop in credit to the private sector.

37
37
Table 3.9: Trends in main monetary aggregates
2 0 0 6 2 0 0 7 2 0 0 8 2009
June Dec June Dec June Dec June
LIABILITIES
Money supply (M2) 7.8% 2.1% 18.4% 3.8% -0.3% 12.3% 9.7%
Money supply (M1) 1.4% 2.8% 19.2% 5.1% -9.2% 18.3% 10.6%
Currency in circulation -5.2% -2.6% 38.4% 3.0% -22.3% 35.8% 12.0%
Demand deposits 5.6% 5.8% 9.2% 6.6% -0.7% 9.6% 9.7%
Quasi-money 20.3% 1.0% 17.0% 1.6% 15.2% 4.1% 8.2%
Other items (net) 6.2% 26.1% -47.2% 29.4% -1.6% 30.1% 39.5%
ASSETS -1.4% 7.3% -24.3% 16.5% 13.6% 17.6% -2.7%
Net Government Credit -398.9% 10.7% 345.1% -29.9% -22.5% -17.9% 12.7%
Central Bank -121.5% -105.0% -20925.0% -15.7% -38.5% -46.5% 150.6%
Commercial banks -31.7% 58.9% 66.1% -53.3% 24.7% 24.1% -74.3%
Private sector credit 6.2% 7.4% -3.8% 4.6% 7.4% 13.2% -1.3%
Net foreign assets
Banking system 33.7% -2.8% 95.5% -5.3% -15.6% 7.0% 34.7%
Central Banks 38.6% -10.9% 93.2% -9.5% -17.9% 8.4% 22.0%
Commercials banks -107.0% 4625.0% 122.1% 35.1% 0.0% -0.6% 108.9%
Source : BCEAO/AMAO
3.1.2.2 MACROECONOMIC CONVERGENCE STATUS
The convergence status improved significantly in the first half of 2009 as Burkina Faso met 7 compared to 3 criteria achieved in 2008. This is attributed to the good performance in terms controlling consumer price which ensured a better stability in the real exchange rate.
Table 3.10: BURKINA FASO CONVERGENCE STATUS
In the first half of 2009, all the primary criteria were met with the exception of the budget deficit excluding grants. The latter remained high in view of the predominance of budgetary assistance in the financing of public projects. As
Standard June Dec June* Dec**
Primary criteria: i) Budget Deficit/GDP ≤ 4% 11.7 6.7 9.1 8.2 8.6 9.1 11.3 12.4 8.8 8.7 10.6 10.5 ii) Inflation Rate ≤ 5% -3.0 4.0 2.4 1.5 0.9 4.5 1.5 2.3 15.1 11.6 -0.6 3.9 iii) BC Financing ≤ 10% RF n-1 9.0 0.0 0.0 0.0 0.0 0.0 0.0 0.0 0.0 0.0 0.0 0.0 iv) UEMOA Reserves ≥6 months Imports
B/S 6.1 6.7 7.6 6.0 6.8 5.7 5.6 6.0 6.0 5.7 6.1 6.0
Country Reserves (indicative) 6.0 6.7 7.6 6.0 6.8 4.5 4.8 8.0 6.7 6.0 7.2 6.7
Secondary criteria i) Domestic Arrears 0 0.0 0.0 0.0 0.0 0.0 0,0 0.0 0.0 0.0 0.0 0.0 0.0
ii) Tax revenue/GDP ≥ 20% 11.8 9.4 9.7 10.3 11.8 11.8 12.0 12.5 12.7 12.2 12.9 12.4 iii) Wage Bill/Tax Revenue ≤ 35% TR 43.7 45.7 42.8 41.7 38.8 42.0 44.1 46.5 42.2 44.9 40.7 43.3 iv) Int. Investments/Tax Revenue v) Real Interest Rate
≥20% TR 23.4 24.6 36.0 32.7 42.7 40.8 43.4 35.6 41.2 44.8 32.8 35.7 > 0 6.5 -1.4 -0.4 0.3 2.8 2.7 2.0 1.2 -11.6 -8.1 4.1 -0.4 vi) Real Exchange Rate Stability ± 5% - 3.3 2.0 6.4 -0..5 3.4 0.1 -0.6 -2.5 6.6 -2.6 0.6
Number of criteria met 6 6 6 7 7 6 6 7 5 3 7 6 Source : BCEAO, UEMOA and WAMA * Estimates ** Projections
2008 2005 2006 2007 2003 2004 2000 2001 2002 2009
38
38
regards inflation, there were some adjustments after the upsurge of prices in 2008. The general level of consumer prices on annual basis went down by 0.6%.
Concerning secondary criteria, the low level of the tax revenue/GDP ratio and sizeable salary component in the public expenditure structure continue to be a source of concern. These two criteria have never been met since 2000. On the other hand, the State continued to allocate considerable resource to investment and the prevailing deflation helped in restoring positive real interest rates. The same factor made it possible to maintain low fluctuations in the real effective exchange rate.
The performance recorded in the first half of 2009 was expected to be maintained at end of the year, with the exception of real interest rate which could be slightly negative if fears for renewed inflation are confirmed.
3.1.2.4 Conclusions and Recommendations
Besides inflationary pressures resulting from the food and energy crisis, the macroeconomic situation in 2009 was satisfactory. However, the situation in the cotton sector remained fragile due especially to the trends in prices on the international market. This situation coupled with the financial crisis could affect the macroeconomic framework and increase poverty among the populations most of whom depend on the cotton sector. However, the performance recorded in terms of convergence in the first half could be sustained to the end of the year.
To strengthen the financial and economic situation, the following measures are necessary:
1. Improve the performance of the tax administration through capacity
building and the implementation of programmes that would sensitize tax payers to develop better tax awareness;
2. Ensure a better control over salaries which continue to absorb the bulk of mobilized resources;
3. Pursue the restructuring of the cotton sub-sector to strengthen the competitiveness of the sector;
4. Strengthen food security through the diversification of production and improvement in marketing channels.

39
39
3.1.3 COTE D’IVOIRE
With a growth rate of 2.3%, the economic situation in Cote d’Ivoire improved significantly in 2008. Prospects for 2009 remained optimistic due largely to the limited impact of the crisis on the country’s economy, especially the main export sectors, reaching of decision point under the HIPC initiative and results expected from the implementation of the Poverty Reduction and Growth Facility (PRGF) programme which was concluded in March 2009.
3.1.3.1 MAJOR MACROECONOMIC DEVELOPMENTS
Primary sector
For 2009, authorities targeted a 3.7% growth rate in economic activity against
an initial projection of 4.3%. This relatively high growth target was set taking into account the limited impact of the international financial crisis on the Ivorian economy. In fact, cocoa prices are doing well. Thus, the expected growth in 2009 was driven mainly by the primary sector.
This strong growth prospect could essentially be explained by value added in primary sector which was to grow by 4.9%. This prospect is based on the assumption of a good performance in the agricultural sector, especially export crop thanks to the boost in cotton production, a sector that has experienced difficulties over the past few years. In addition, food production expanded by 3.4% in line with the implementation of measures planned under the programme for revamping rice production through which the Government intends to achieve food self-sufficiency by 2012.
The secondary and tertiary sectors continued to benefit from State support in the form of tax incentives. However, value added growth in the Building and Construction sector went down in view of delays in the execution of some major projects due to lack of resources. The expected growth in the tertiary sector was propelled by telecommunication, commerce, transport and recovery in services.
As regards prices, year-on-year inflation rate settled at 0.8% against 9.0% in 2008. Average inflation fell from 8.8% in December 2008 to 2.2% in June 2009. The reduction in inflationary pressures is due to the decline in fuel and food prices on the international market. Year-on-year inflation could settle at 3.0% by the end of the year.
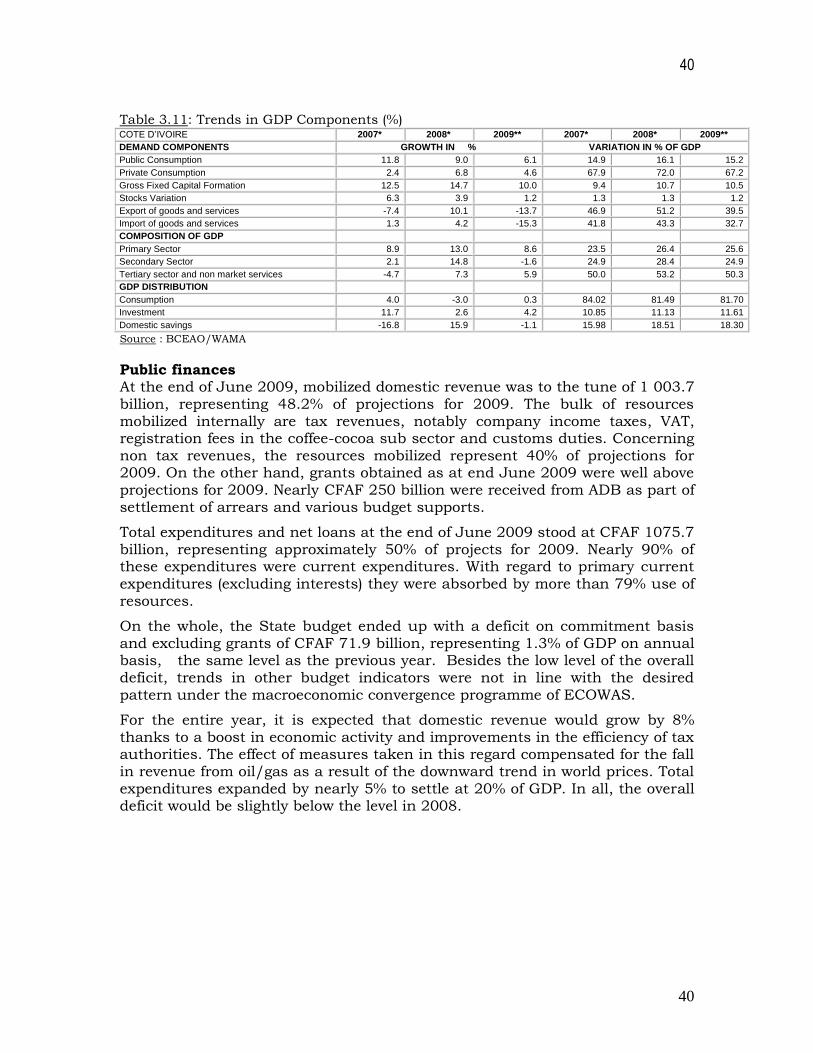
40
40
Table 3.11: Trends in GDP Components (%) COTE D’IVOIRE 2007* 2008* 2009** 2007* 2008* 2009**
DEMAND COMPONENTS GROWTH IN % VARIATION IN % OF GDP
Public Consumption 11.8 9.0 6.1 14.9 16.1 15.2
Private Consumption 2.4 6.8 4.6 67.9 72.0 67.2
Gross Fixed Capital Formation 12.5 14.7 10.0 9.4 10.7 10.5
Stocks Variation 6.3 3.9 1.2 1.3 1.3 1.2
Export of goods and services -7.4 10.1 -13.7 46.9 51.2 39.5
Import of goods and services 1.3 4.2 -15.3 41.8 43.3 32.7
COMPOSITION OF GDP
Primary Sector 8.9 13.0 8.6 23.5 26.4 25.6
Secondary Sector 2.1 14.8 -1.6 24.9 28.4 24.9
Tertiary sector and non market services -4.7 7.3 5.9 50.0 53.2 50.3
GDP DISTRIBUTION
Consumption 4.0 -3.0 0.3 84.02 81.49 81.70
Investment 11.7 2.6 4.2 10.85 11.13 11.61
Domestic savings -16.8 15.9 -1.1 15.98 18.51 18.30
Source : BCEAO/WAMA
Public finances At the end of June 2009, mobilized domestic revenue was to the tune of 1 003.7 billion, representing 48.2% of projections for 2009. The bulk of resources mobilized internally are tax revenues, notably company income taxes, VAT, registration fees in the coffee-cocoa sub sector and customs duties. Concerning non tax revenues, the resources mobilized represent 40% of projections for 2009. On the other hand, grants obtained as at end June 2009 were well above projections for 2009. Nearly CFAF 250 billion were received from ADB as part of settlement of arrears and various budget supports.
Total expenditures and net loans at the end of June 2009 stood at CFAF 1075.7 billion, representing approximately 50% of projects for 2009. Nearly 90% of these expenditures were current expenditures. With regard to primary current expenditures (excluding interests) they were absorbed by more than 79% use of resources.
On the whole, the State budget ended up with a deficit on commitment basis and excluding grants of CFAF 71.9 billion, representing 1.3% of GDP on annual basis, the same level as the previous year. Besides the low level of the overall deficit, trends in other budget indicators were not in line with the desired pattern under the macroeconomic convergence programme of ECOWAS.
For the entire year, it is expected that domestic revenue would grow by 8% thanks to a boost in economic activity and improvements in the efficiency of tax authorities. The effect of measures taken in this regard compensated for the fall in revenue from oil/gas as a result of the downward trend in world prices. Total expenditures expanded by nearly 5% to settle at 20% of GDP. In all, the overall deficit would be slightly below the level in 2008.

41
41
Table 3.12: Trends in some budget items (Variation in %)
2006 2007 2008 2009
REVENUE AND GRANTS 3.2% 15.8% 15.4% 0.0%
BUDGET REVENUE 8.8% 13.6% 8.7% 8.0%
Tax Revenue 9.0% 7.6% 10.8% 9.3%
Non-Tax Revenue 0.0% 58.7% 3.5% -7.2%
GRANTS -84.0% 255.0% 242.0% -85.8%
TOTAL EXPENDITURES 0.6% 12.7% 11.3% -0.2%
CURRENT EXPENDITURES 1.6% 11.7% 14.3% 4.8%
Salaries and wages 4.6% 8.7% 11.2% 11.9%
CAPITAL EXPENDUTURE 1.6% 6.1% 26.0% 26.2%
Externally Funded 58.0% -13.3% 21.2% 43.3%
Internally Funded 10.7% 15.5% 12.5% 13.6%
OVERALL BALANCE (Commitment basis excluding grants) -41.5% -6.9% 70.9% -18.7%
Source : BCEAO/WAMA
External sector
Concerning the external sector, Cote d’Ivoire would have a surplus after a high deficit of the previous year. An overall surplus of CFAF 60 million was projected (0.5 % of GDP) against a deficit of CFAF 15.6 billion (-0.1 % of GDP) in 2008. This improved performance was based on expected increase on the capital and financial account balance and enhanced resource mobilization under the PRGF. On the contrary, the current account is expected to have a slight decline mainly as a result of the reduction in petroleum prices, which would translate into a reduction in export income of 14.6%. This reduction would be due to the decline in price of certain imported goods mainly primary products.
Table 3.13: Some Balance of Payments Indicators (in %)
2,006 2,007 2008* 2009**
1 - Trade balance 17.1% 13.0% 14.2% 12.6%
Export FOB 46.7% 43.8% 43.1% 35.2%
Import FOB -29.6% -30.8% -28.9% -22.7%
2-Balance of services -7.7% -7.8% -6.8% -5.9%
3-Balance of revenues -3.9% -4.1% -3.8% -3.6%
4-Balance of current transfers -2.9% -1.7% -1.5% -1.4%
a-BALANCE OF CURRENT TRANSANCTIONS ACCOUNT (1+2+3+4) 2.6% -0.7% 2.1% 1.8%
b-CAPITAL AND FINANCIAL OPERATIONS ACCOUNT (5+6+7) -1.2% 2.8% -2.2% -1.3%
5-Capital Transfers 0.2% 0.5% 0.4% 0.1%
6-Acquisitions /transfers of non-produced financial assets 0.0% 0.0% 0.0% 0.0%
7- Financial Operations -1.4% 2.3% -2.6% -1.4%
Foreign Direct Investments 1.8% 2.2% 1.7% 1.8%
Portfolio investments 0.1% 0.5% 0.1% -0.8%
Other investments -3.3% -0.3% -4.4% -2.4%
d - OVERALL BALANCE (a+b+c) 1.2% 2.2% -0.1% 0.5%
Coverage rate : Export /Imports (%) 122.6 111.8 118.4 120.6
Degree of openness: (import + export)/GDP (%) 93.3 91.9 87.5 71.6
Current balance/GDP (%) 2.6 -0.7 2.1 1.8
Current account Balance, excluding grants/GDP(%) 2.6 -1.3 0.7 0.2
Overall Balance/GDP (%) 1.2 2.2 -0.1 0.5
Source : BCEAO/WAMA, NB; (*) Estimates (**): Projections

42
42
Monetary Sector
As regards the monetary sector, M2 as at 30th June 2009 reduced by 5.2% in relation to its level at the end of 2008. This disturbing situation stems from both internal and external sources. Net external assets in the banking system shrunk by 12.6% and settled at the equivalent of 1.4 billion Euros. The decline in external assets is caused by both the State and Central Bank. In both cases, external assets went down by over 60 billion. At the internal level, domestic credit dropped by 2.3% as a result of a reduction of credits to the State and private sector.
Table 3.14: Variations in main monetary aggregates
2 0 0 6 2 0 0 7 2 0 0 8 2009
June Dec June Dec June Dec June
LIABILITIES
Money supply (M2) -1.6% 12.1% 2.3% 20.8% -3.1% 9.0% -5.2%
Money supply (M1) -3.1% 14.5% -1.0% 29.2% -7.7% 9.3% -9.0%
Currency in circulation -9.1% 18.9% -7.0% 37.6% -11.5% 16.9% -17.9%
Demand deposits 4.0% 10.0% 5.5% 21.0% -3.5% 1.5% 1.3%
Quasi-money 1.4% 7.3% 9.2% 5.0% 7.8% 8.5% 2.4%
Other items (net) 3.7% -17.9% -6.0% 5.9% -16.9% -5.5% -14.6%
ASSETS -6.3% 11.3% -8.4% 30.9% -0.3% 7.5% -2.3%
Net Government Credit 1.7% -10.5% -11.4% 40.8% 0.4% -7.6% 10.8%
Central Bank -9.7% -17.0% -6.2% -3.8% 1.1% 20.6% 14.3%
Commercial banks 36.9% 3.0% -20.0% 126.7% -0.1% -30.9% 5.7%
Private Sector Credit -8.9% 19.1% -7.6% 28.3% -0.5% 11.8% -5.3%
Net Foreign Assets
Banking system 10.3% 5.8% 21.8% 3.6% -10.5% 10.0% -12.6%
Central Banks 8.1% 16.1% 21.9% 5.1% -6.9% 2.7% -7.1%
Commercials banks 25.9% -57.8% 19.9% -22.8% -93.6% 2533.3% -85.9%
Source : BCEAO/AMAO
3.1.3.2 MACROECONOMIC CONVERGENCE STATUS
An analysis of the status of convergence of Cote d’Ivoire’s economy showed that the country’s performance improved significantly in the first half of 2009, with six targets achieved, including four primary criteria.

43
43
Table 3.15: COTE D’IVOIRE CONVERGENCE STATUS
The downward trend in inflationary pressures combined with the accumulation of foreign reserves by BCEAO paved the way for compliance with all the primary criteria. It must be indicated that aside the inflationary pressures in 2008, Cote d’Ivoire has always managed to meet all primary criteria.
Unlike the primary criteria, achieving the secondary criteria continued to be fraught with difficulties. In the first half of 2009, only two secondary criteria, namely, real positive interest rate and real effective exchange rate stability were met thanks to the easing of inflationary pressures on food and fuel prices. All the other criteria are yet to be satisfied. Tax revenue expanded but remained far below the community minimum. The wage bill continued to absorb the bulk of tax revenues. However, the State was still accumulating domestic arrears. This does not allow the State to make adequate investments.
If projections materialize the country could meet an additional criteria i.e. non accumulation of domestic arrears.
3.1.3.4 Conclusions and recommendations
Having attained the completion point under the HIPIC initiative which enables countries to benefit from a substantial reduction in the debt burden the country should be able strengthen the economic situation which saw a significant improvement in 2008. Thus, the programme supported by the Poverty Reduction and Growth Facility (PRGF) would contribute to the consolidation of the macroeconomic framework. This prospect could be consolidated through the stabilization of the political situation in view of the organization of
presidential elections scheduled for the end of the year. However, the effects of the international financial crisis could compromise the improvement in the economic situation.
Standard June Dec June* Dec**
Primary criteria: i) Budget Deficit/GDP ≤ 4% 1.5 0.4 2.0 3.2 2.6 2.7 1.5 1.4 1.3 2.1 1.3 1.7 ii) Inflation Rate ≤ 5% 2.5 4.3 3.1 3.3 1.4 2.6 2.0 1.5 5.2 8.9 0.8 3.0 iii) CB Financing ≤10% RF n-1 0.0 0.0 0.3 0.0 0.0 0.0 0.0 0.0 0.0 0.0 0.0 0.0 iv) UEMOA Reserves ≥6 months Imports
B/S 6.1 6.7 7.6 6.0 6.8 5.7 5.6 6.0 6.0 5.7 6.1 6.0
Country Reserves (indicative) 5.8 6.7 7.6 6.0 3.9 3.0 3.4 4.0 3.5 3.7 4.1 3.5
Secondary criteria i) Domestic Arrears 0 0.0 0.5 22.1 141.8 72.9 17.5 29.7 43.8 0.0 107.9 11.3 0.0
ii) Tax Revenue/GDP ≥ 20% 14.3 14.6 15.8 14.5 14.2 13.9 14.4 15.5 15.6 15.5 16.5 16.2 iii) Wage Bill/Tax Revenue ≤ 35% RF 42.1 41.4 41.6 45.3 44.0 45.0 43.2 43.6 45.0 43.8 58.2 44.8 iv) Int. investment /Tax Revenue v) Real Interest Rate
≥20% RF 10.6 7.5 11.6 10.5 12.3 10.7 15.5 12.5 7.3 13.6 9.1 17.9 > 0 1.0 -0.8 -0.9 1.0 2.1 0.9 1.5 2.0 -1.7 -5.4 2.7 0.5 vi) Real Exchange Rate Stability ± 5% - 3.5 4.0 6.9 1.3 0.0 -0.3 1.6 -4,2 4.5 2.7 0.0
Number of criteria met 5 5 5 5 6 5 6 6 5 3 6 7 Source: BCEAO, UEMOA and WAMA * Estimates** Projections
2008 2005 2006 2007 2003 2004 2000 2001 2002 2009
44
44
These explain why the implementation of the following recommendations is necessary:
Consolidate the socio- political stability by ensuring compliance with peace accords and holding of free and fair presidential elections;
Improve tax collection by strengthening and modernizing tax administration;
Improve the structure of public expenditures by rationalising the wage bill in order to increase the share of investments;
Pursue structural reforms, particularly in the cocoa, coffee, cotton, oil and other energy sub-sectors so as to remove structural constrains weighing down on these sectors.
3.1.4 GUINEA-BISSAU
Economic activity witnessed significant growth in 2008, as a result of the implementation of the government’s economic and financial programme, which is still being pursued with the help of funds mobilized under the Post-Conflict Emergency Aid Programme.
For 2009, the authorities are determined to maintain a growth rate that is consistent with their goals to reduce poverty. However, the plummeting of cashew nut prices, the main export product of the country, could affect the country’s economic and public finance situation.
3.1.4.1 MAJOR MACROECONOMIC DEVELOPMENTS
The Real Sector
In 2009, GDP is expected to grow 3.2% against 3.1% in 2008. The expected upturn would be driven by contributions from all the sectors, was due to the Government’s commitment to stimulating economic growth. To this end, the Government envisaged the development of a number of infrastructure projects, notably the construction of dykes to increase rice production as well as implementation of activities planned under the Agricultural and Rural Rehabilitation Project (PRESAR). The modernisation of the Bissau fishing
harbour under the fishery sector Support Project (PASP), on the other hand, boosted production levels.
Growth in the secondary sector exceeded 5.0%, as a result of the standardisation of production and distribution of electric power in line with reforms efforts in the sector, and for which funding was sourced from the World Bank (5,750 billion CFA) and BOAD (2,725 billion CFA).

45
45
Growth in the tertiary sector was essentially driven by development of activities in the telecommunications, trade, hotels and restaurants and transportation sectors.
On prices, the year-on-year inflation rate declined to -1.2% at end June, 2008. The fall in food prices are responsible for this trend.
Table 3.16: GDP Performance (data in %) GUINEA BISSAU 2007* 2008* 2009** 2007* 2008* 2009**
COMPONENTS OF DEMAND PERFORMANCE IN % CHANGE IN% OF GDP
Government Consumption 41.2 4.4 42.6 27.4 25.6 34.5
Private Consumption -4.8 12.9 6.5 82.5 83.2 83.8
Gross Fixed Capital formation 12.2 11.6 46.5 16.3 16.3 22.6
Variation of stocks - - - 0.0 0.0 0.0
Exports of goods and services 27.9 7.1 -5.4 32.8 31.4 28.1
Imports of goods and services 12.9 7.0 29.1 59.1 56.5 69.0
COMPOSITION OF GDP
Primary sector 6.3 9.8 6.3 54.6 53.6 53.9
Secondary sector 7.8 18.6 5.4 30.6 32.5 32.4
Tertiary sector and non-market services 4.3 5.8 4.2 14.7 13.9 13.7
GDP DISTRIBUTION
Consumption -2.6 -1.0 8.7 109.95 108.82 118.33
Investment 5.4 -0.3 38.6 16.33 16.28 22.56
Domestic Savings -22.9 -11.3 107.8 (9.95) (8.82) (18.33)
Source : BCEAO/WAMA
Public Finance
Concerning public finance, the projections show a slight improvement in the main budget aggregates. Domestic revenues are projected to increase by 12.2%, while total expenditure would drop by 2.2%. This situation led to an improvement in the overall budget deficit excluding grants. This would settle at 19.3% of GDP against 23.3% in 2008.
Table 3.17: Trends in some budget items ( in %)
2006 2007 2008 2009
REVENUE AND GRANTS 9.2% 2.1% 18.6% 4.1%
BUDGET REVENUE 12.6% -15.6% 23.3% 12.2%
Tax Revenue 0.9% 1.6% 4.3% 24.0%
Non Tax Revenue 34.9% -40.0% 69.2% -5.3%
GRANTS 3.9% 28.4% 14.0% -4.5%
TOTAL EXPENDITURES -4.5% 12.2% 8.9% -2.2%
CURRENT EXPENDITURES
Salaries and wages -3.8% 6.8% -0.5% -5.0%
CAPITAL EXPENDITURE -22.7% 37.9% 14.2% 2.9%
Externally Funded -63.6% 450.0% -4.5% -38.1%
Internally Funded 6.0% 2.2% 11.7% 10.7%
OVERALL BALANCE (Commitment basis excluding grants) -16.6% 38.5% 0.4% -12.5% Source : BCEAO/WAMA

46
46
External sector
With regard to external accounts, a worsening of the current account situation was expected, since completion of the public investment programme requires massive importations of capital goods and intermediate products. This combined with the decline in value of exports caused by the dwindling prices of cashew nuts would contribute to the worsening of the deficit on goods. Also trade in services and current transfers are expected to be in deficit.
The deterioration of the current account was largely cushioned by increased donor support. The doubling of project grants helped draft a surplus of CFAF 303.3 billion on capital account and financial operations. Overall, the balance of the balance of payments is expected to be in a surplus of about 10 billion CFA francs, representing 1% of GDP.
Table 3.18: Selected balance of payment indicators (in %)
ITEMS 2,006 2,007 2008* 2009**
1 - Trade balance -16.8% -16.7% -16.3% -27.3%
Export FOB 23.7% 29.4% 28.7% 25.5%
Import FOB -40.5% -46.1% -45.0% -52.8%
2-Balance of services -11.5% -9.6% -8.8% -13.6%
3-Balance of revenues -2.8% -2.7% -2.8% -2.4%
4-Balance of current transfers 18.4% 20.6% 22.5% 17.5%
a-BALANCE OF CURRENT TRANSANCTIONS ACCOUNT (1+2+3+4) -12.7% -8.4% -5.4% -25.8%
b-CAPITAL AND FINANCIAL OPERATIONS ACCOUNT (5+6+7) 14.2% 13.9% 11.6% 26.8%
5-Capital Transfers 10.2% 8.8% 8.3% 32.4%
6-Acquisitions /transfers of non-produced financial assets 0.0% 0.0% 0.0% 0.0%
7- Financial Operations 4.0% 5.1% 3.3% -5.6%
Direct Investments 5.5% 5.2% 2.6% 2.2%
Portfolio investments 0.4% 0.3% 0.3% 0.2%
Other investments -2.0% -0.3% 0.4% -8.0%
d - OVERALL BALANCE (a+b+c) 1.1% 6.9% 7.7% 1.0%
Coverage rate : Export /Imports (%) 46.6 59.5 61.0 43.7
Degree of openness: (import + export)/GDP (%) 77.9 103.3 103.4 104.4
Current balance/GDP (%) -12.7 -8.4 -5.4 -25.8
Current account Balance excluding grants/GDP(%) -19.0 -18.1 -13.8 -36.3
Overall Balance/GDP (%) 1.1 6.9 7.7 1.0
Source: BCEAO/WAMA NB: (*) estimate (**): Forecast
Monetary sector
At the end of June 2009, broad money supply (M2) increased by 8.6% over its level at-end December 2008. The factors accounting for this money creation were both internal and external. Indeed, net foreign assets of the banking system, over the period, strengthened by 4.1%. This accumulation of reserves concerns only the Central Bank, which saw its foreign assets increase by about 14.0%. On the other hand, the foreign currency assets deposit money banks fell by more than 35%. The net domestic credit, for its part grew by 21.3% mainly

47
47
credit to the private sector. During the first half of 2009, credit to the private sector increased by 42.5%. The impact of this increase on the expansion of domestic credit was offset by a decline of 22% credit to the State. The receipt of foreign funds cushioned the position of the State in the coffers of the Central Bank and improved the reserve levels.
Table 3.19: Evolution of main monetary aggregates
2 0 0 6 2 0 0 7 2 0 0 8 2009
June Dec June Dec June Dec June
LIABILITIES
Money supply (M2) 4.6% 0.7% 12.9% 10.6% 54.1% -16.0% 8.6%
Money supply (M1) 4.5% 0.4% 10.7% 7.7% 58.1% -19.7% 10.3%
Currency in circulation -0.2% -1.7% -2.5% 12.4% 56.6% -21.7% 13.9%
Signt deposits 23.3% 7.1% 49.4% -1.3% 61.5% -15.4% 3.3%
Quasi-money 6.2% 11.8% 72.7% 62.9% 6.7% 49.1% -7.1%
Other items (net) 3200.0% 45.5% -4.2% -28.3% -118.2% -966.7% 15.4%
ASSETS 3.8% 1.8% 40.1% -11.5% 143.3% -45.0% 21.3%
Net Government Credit -19.4% 4.0% 4.8% -6.2% 52.7% -41.7% -22.0%
Central Bank -6.9% -13.9% -4.8% -6.0% 3.2% -16.5% -9.9%
Commercial banks 214.3% -95.5% -996.0% -8.9% 623.0% -83.1% -120.0%
Private sector credit 88.2% -1.6% 98.4% -16.0% 231.4% -46.6% 42.5%
Net foreign assets
Banking system 14.0% 4.1% 0.0% 18.9% 7.4% 20.4% 4.1%
Central Banks -7.3% -0.3% 9.4% 19.4% 44.1% -17.0% 14.1%
Commercials banks -2600.0% 24.0% -34.4% 16.4% -222.5% -255.2% -35.6%
Source: BCEAO/AMAO
3.1.4.2 STATUS OF MACROECONOMIC CONVERGENCE
In terms of convergence, the first half of 2009 was characterised by a significant improvement in the level of performance. The number of criteria met was 6 as against (01) criterion during the last assessment in December, 2008.
Table 3.20: GUINEA BISSAU STATUS OF CONVERGENCE
Standard June Dec June* Dec**
Primary criteria: i) Budget Deficit/GDP ≤ 4% 24.9 24.7 13.6 23.0 30.1 24.2 19.9 26.0 6.8 23.3 5.6 19.3 ii) Inflation Rate ≤ 5% 8.6 3.3 3.9 -3.5 0.9 0.3 3.2 9.3 13.3 8.7 -1.2 3.8 iii) CB Financing ≤ 10% TR n-1 0.0 0.0 0.0 0. 0.0 0. 0.0 0.0 0.0 0.0 0.0 0.0 iv) UEMOA Reserves ≥6 months Imports
B/S 6.1 6.7 7. 6.0 6.8 5.7 5.6 6.0 6.0 5.7 6.1 6,0
Country Reserve (Indicative) 5.8 6.7 7.6 6.0 6.6 8.3 6.3 6.5 10,6 7.1 6.1 8.1
Secondary criteria i) Domestic Arrears 3.4 5.3 15.8 0.0 4.2 5.5 2.6 0.0 3.1 0.0 0.0
ii) Tax Revenue/GDP ≥ 20% 11.4 10.4 8.6 9.2 7.7 11.3 11.3 10.8 11.1 10.0 13.1 11.8 iii) Wage Bill/Tax Revenue ≤ 35% TR 60.0 74.3 88.2 111.9 137.0 116.1 110.8 116.5 93.3 111.2 71.5 85.2 iv) Intern. Investment/Tax Revenue v) Real Interest Rate
≥20% TR 20.0 16.9 5.9 4.2 4.2 6.0 2.2 11.7 3.8 10.7 1.9 5.3 > 0 -5.1 0.2 2.6 3.4 2.6 3.2 0.3 -5.8 -9.8 -5.2 4.7 -0.3 vi) Real Exchange Rate Stability ± 5% - 1.7 2.6 2.8 1.6 -1.8 1.0 3.1 -2.1 9.8 -4.6 0.1
Number of criteria met 3 5 5 5 6 4 5 3 4 1 6 5 Source : BCEAO, UEMOA et AMAO * Estimates ** Projections
2009 2003 2004 2000 2001 2002 2007 2005 2006 2008
48
48
Although the country has been experiencing strong inflationary pressures since 2007, this was brought under control during the first half of 2009, following the easing off of commodity and energy prices. The year-on-year price levels went down by 1.2% at-end June 2009. The budget deficit fell drastically on annualised basis to 5.6% of GDP against 23.3% in 2008. This situation is due to low capital expenditure undertaken during the period.
For the secondary criteria, the following three objectives were achieved: non accumulation of domestic arrears, real exchange rate stability and the maintenance of a positive real interest rate. The level of inflation largely contributed to the achievement of the last two criteria. On the contrary, the low tax revenue/GDP and structure of government expenditure were serious challenge to the authorities, though there was some improvement in these indicators.
Apart from a slight deviation in the real interest rate, due to rising inflation, the performance recorded during the first half of 2009 could be maintained till the end of 2009.
3.1.4.4 Conclusions and Recommendations
Guinea Bissau’s macroeconomic framework remains fragile due, especially, to significant and recurrent fiscal imbalances. Prospects for do not appear to be very bright, especially due to the fallen prices of cashew nuts, the chief export product. Performance in terms of convergence, however, improved against the poor performance in 2008.
In this context, the implementation of the following recommendations could give rise to better macroeconomic stability and conformity to the convergence criteria:
1. consolidate socio-political stability in order to facilitate the pursuit of necessary reforms in the energy, water, telecommunications and transport sectors;
2. see to the efficient implementation of the Post-conflict Emergency Assistance Programme to allow for increased external resource mobilisation, necessary for financing government investment projects ;
3. increase efficiency in revenue administration with a view to ensuring
increased mobilisation of domestic resources;
4. to take bold measures aimed at better control of the wage bill in the civil and public service;

49
49
3.1.5. MALI
The economic objectives for 2009 fall under the implementation of the 2008-2010 MAP, which also derives from strategic directions for the fight against poverty. The actual growth rate in 2008 was 5.1%. This growth was essentially driven by the performance of the primary sector, as a result of the extraordinary efforts deployed at ensuring a record production of rice (+48.5%) and a significant increase in cotton production (17.0%).
3.1.5.1 MAIN MACROECONOMICS DEVELOPMENTS
Real sector
For 2009, the growth rate shrunk to 4.1% against an initial estimate of 5.0%. This downward revision is notably on account of the impact of the global financial crisis
For the primary sector, projections are banking on a 5.8% growth. This growth was propelled by forecasts of a normal and well distributed rainfall pattern, as well as the rice initiative undertaken in 2008 and implementation of a number of rural development support projects.
On activities in the secondary sector, their added value to increased by 0.9%, due essentially to performance in the energy sector. Production in the extractive sector, on the other hand, would decrease by 2.4%. The public works and building sub-sector received a booster from the start of construction works on the third bridge in Bamako.
Value addition in the tertiary sector is expected to register a 4.2% growth, essentially driven by dynamism in the trade and «transport and telecommunication» branches, which should increase by 7.2% and 8.5% respectively. Activity in the «transport and telecommunications » branches was stimulated by the continued extension of the mobile telephone network and the arrival of a new private telephone operator, following the privatization of SOTELMA. Regarding prices, the year-over-year inflation rate was at 0.4% at the end of the1st half of 2009, against 7.8% in 2008 and 10.3% at the same period the previous year. The decreased rate of price change is primarily related to easing
of prices of energy and food products on the international market.
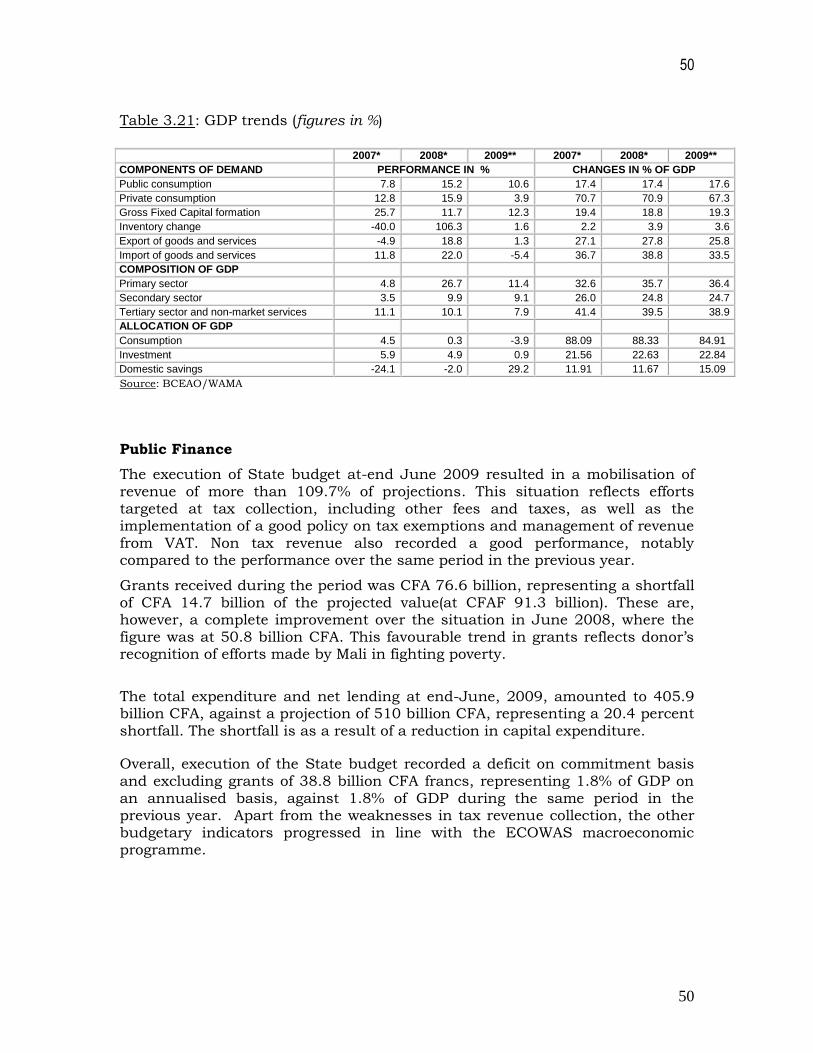
50
50
Table 3.21: GDP trends (figures in %)
2007* 2008* 2009** 2007* 2008* 2009**
COMPONENTS OF DEMAND PERFORMANCE IN % CHANGES IN % OF GDP
Public consumption 7.8 15.2 10.6 17.4 17.4 17.6
Private consumption 12.8 15.9 3.9 70.7 70.9 67.3
Gross Fixed Capital formation 25.7 11.7 12.3 19.4 18.8 19.3
Inventory change -40.0 106.3 1.6 2.2 3.9 3.6
Export of goods and services -4.9 18.8 1.3 27.1 27.8 25.8
Import of goods and services 11.8 22.0 -5.4 36.7 38.8 33.5
COMPOSITION OF GDP
Primary sector 4.8 26.7 11.4 32.6 35.7 36.4
Secondary sector 3.5 9.9 9.1 26.0 24.8 24.7
Tertiary sector and non-market services 11.1 10.1 7.9 41.4 39.5 38.9
ALLOCATION OF GDP
Consumption 4.5 0.3 -3.9 88.09 88.33 84.91
Investment 5.9 4.9 0.9 21.56 22.63 22.84
Domestic savings -24.1 -2.0 29.2 11.91 11.67 15.09
Source: BCEAO/WAMA
Public Finance
The execution of State budget at-end June 2009 resulted in a mobilisation of revenue of more than 109.7% of projections. This situation reflects efforts targeted at tax collection, including other fees and taxes, as well as the implementation of a good policy on tax exemptions and management of revenue from VAT. Non tax revenue also recorded a good performance, notably compared to the performance over the same period in the previous year.
Grants received during the period was CFA 76.6 billion, representing a shortfall of CFA 14.7 billion of the projected value(at CFAF 91.3 billion). These are, however, a complete improvement over the situation in June 2008, where the figure was at 50.8 billion CFA. This favourable trend in grants reflects donor’s recognition of efforts made by Mali in fighting poverty.
The total expenditure and net lending at end-June, 2009, amounted to 405.9 billion CFA, against a projection of 510 billion CFA, representing a 20.4 percent shortfall. The shortfall is as a result of a reduction in capital expenditure.
Overall, execution of the State budget recorded a deficit on commitment basis and excluding grants of 38.8 billion CFA francs, representing 1.8% of GDP on an annualised basis, against 1.8% of GDP during the same period in the previous year. Apart from the weaknesses in tax revenue collection, the other budgetary indicators progressed in line with the ECOWAS macroeconomic programme.

51
51
Table 3.22: Performance of some budgetary items (variations in %)
2006 2007 2008 2009
REVENUE AND GRANTS 9.5% 7.1% 1.3% 19.3%
BUDGET REVENUE 9.4% 2.8% 6.6% 3.6%
Tax Revenue 7.5% 1.8% 6.7% 16.1%
Non Tax Revenue 59.9% -14.3% -5.9% 24.4%
GRANTS 10.0% 25.4% -17.3% 89.9%
TOTAL EXPENDITURES 15.6% 11.3% -6.9% 24.1%
CURRENT EXPENDITURES 9.6% 6.1% 4.9% 20.0%
Salaries and wages 7.3% 10.1% 13.9% 17.0%
CAPITAL EXPENDUTURE 24.7% 16.1% -22.7% 57.3%
Externally Funded 15.3% 49.9% -22.7% 36.7%
Internally Funded 21.8% 23.4% 34.5% 25.0%
OVERALL BALANCE (Commitment basis excluding grants) 14.7% 13.9% -15.9% 80.1%
Source : BCEAO/WAMA
External sector
In relation to external transactions, there was a reduction in current account deficit relative to GDP, which stood at 7.0% against 7.9% in 2008. This improvement occurred thanks to the favourable trend of the balance of trade. Indeed, the deficit on the income account widened as net transfers declined due to dwindling private remittances. However, the capital and financial transactions account saw significant improvement arising from drawings on external borrowings. Table 3.23: Selected indicators of Mali’s balance of payment (in %)
ITEMS 2,006 2,007 2008* 2009**
1 - Trade balance 1.2% -4.1% -5.5% -2.4%
Export FOB 25.3% 21.8% 22.4% 21.4%
Import FOB -24.1% -25.8% -27.9% -23.8%
2-Balance of services -5.9% -5.6% -5.5% -5.4%
3-Balance of revenues -4.2% -4.1% -2.8% -3.4%
4-Balance of current transfers 5.3% 5.6% 5.8% 4.2%
a-BALANCE OF CURRENT TRANSANCTIONS ACCOUNT (1+2+3+4) -3.6% -8.1% -7.9% -7.0%
b-CAPITAL AND FINANCIAL OPERATIONS ACCOUNT (5+6+7) 7.0% 7.4% 7.2% 7.1%
5-Capital Transfers 36.9% 4.5% 3.8% 4.5%
6-Acquisitions /transfers of non-produced financial assets 0.0% 0.0% 0.0% 0.0%
7- Financial Operations -29.9% 2.9% 3.4% 2.7%
Direct Investments directs 1.3% 0.9% 2.1% 0.7%
Portfolio investments -0.1% -0.1% 0.1% 0.1%
Other investments -31.1% 2.1% 1.2% 1.9%
d - OVERALL BALANCE (a+b+c) 2.7% -0.3% -0.8% 0.2%
Coverage rate: Exports/Imports (%) 86.7 73.7 71.8 76.9
Degree of openness: (import + export)/GDP (%) 65.6 63.8 66.6 59.3
Current balance/GDP (%) -3.6 -8.1 -7.9 -7.0
Current Balance net of grants/GDP(%) -4.9 -9.0 -8.5 -7.8
Overall Balance/GDP (%) 2.7 -0.3 -0.8 0.2
Source : BCEAO/AMAO (*) Estimate (**) Projections
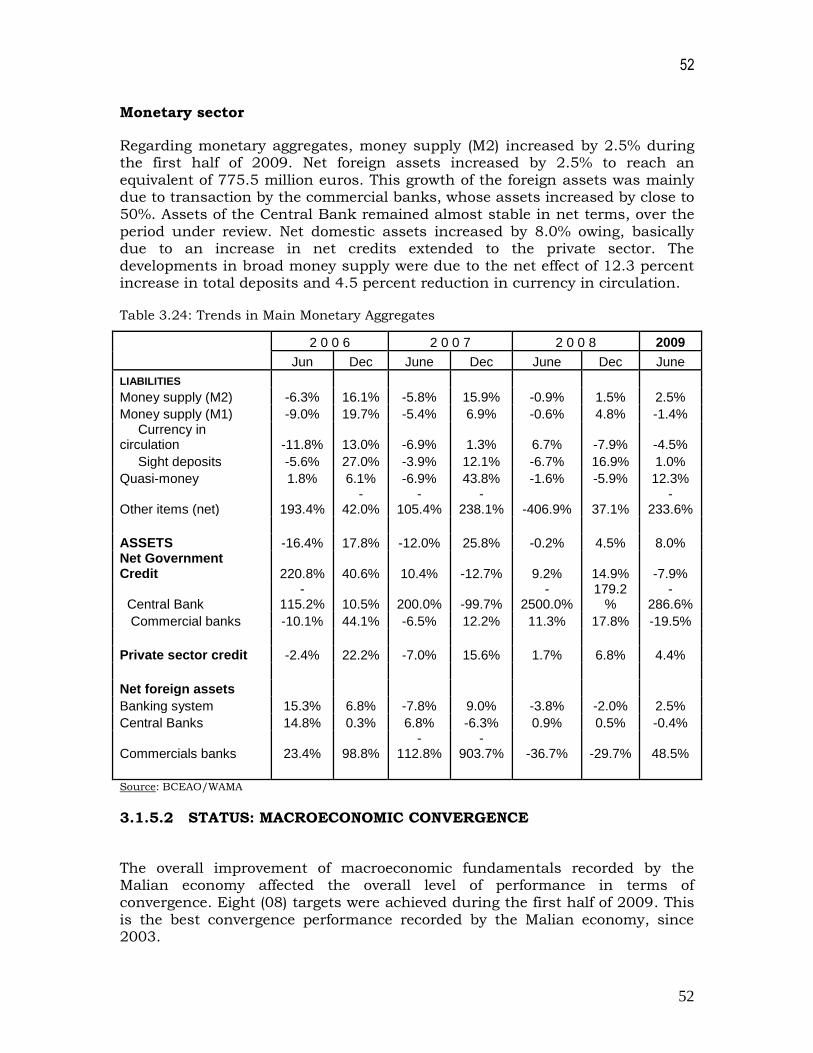
52
52
Monetary sector
Regarding monetary aggregates, money supply (M2) increased by 2.5% during the first half of 2009. Net foreign assets increased by 2.5% to reach an equivalent of 775.5 million euros. This growth of the foreign assets was mainly due to transaction by the commercial banks, whose assets increased by close to 50%. Assets of the Central Bank remained almost stable in net terms, over the period under review. Net domestic assets increased by 8.0% owing, basically due to an increase in net credits extended to the private sector. The developments in broad money supply were due to the net effect of 12.3 percent increase in total deposits and 4.5 percent reduction in currency in circulation.
Table 3.24: Trends in Main Monetary Aggregates
2 0 0 6 2 0 0 7 2 0 0 8 2009
Jun Dec June Dec June Dec June
LIABILITIES
Money supply (M2) -6.3% 16.1% -5.8% 15.9% -0.9% 1.5% 2.5%
Money supply (M1) -9.0% 19.7% -5.4% 6.9% -0.6% 4.8% -1.4% Currency in circulation -11.8% 13.0% -6.9% 1.3% 6.7% -7.9% -4.5%
Sight deposits -5.6% 27.0% -3.9% 12.1% -6.7% 16.9% 1.0%
Quasi-money 1.8% 6.1% -6.9% 43.8% -1.6% -5.9% 12.3%
Other items (net) 193.4% -
42.0% -
105.4% -
238.1% -406.9% 37.1% -
233.6%
ASSETS -16.4% 17.8% -12.0% 25.8% -0.2% 4.5% 8.0% Net Government Credit 220.8% 40.6% 10.4% -12.7% 9.2% 14.9% -7.9%
Central Bank -
115.2% 10.5% 200.0% -99.7% -
2500.0% 179.2
% -
286.6%
Commercial banks -10.1% 44.1% -6.5% 12.2% 11.3% 17.8% -19.5%
Private sector credit -2.4% 22.2% -7.0% 15.6% 1.7% 6.8% 4.4%
Net foreign assets
Banking system 15.3% 6.8% -7.8% 9.0% -3.8% -2.0% 2.5%
Central Banks 14.8% 0.3% 6.8% -6.3% 0.9% 0.5% -0.4%
Commercials banks 23.4% 98.8% -
112.8% -
903.7% -36.7% -29.7% 48.5%
Source: BCEAO/WAMA
3.1.5.2 STATUS: MACROECONOMIC CONVERGENCE
The overall improvement of macroeconomic fundamentals recorded by the Malian economy affected the overall level of performance in terms of convergence. Eight (08) targets were achieved during the first half of 2009. This is the best convergence performance recorded by the Malian economy, since 2003.
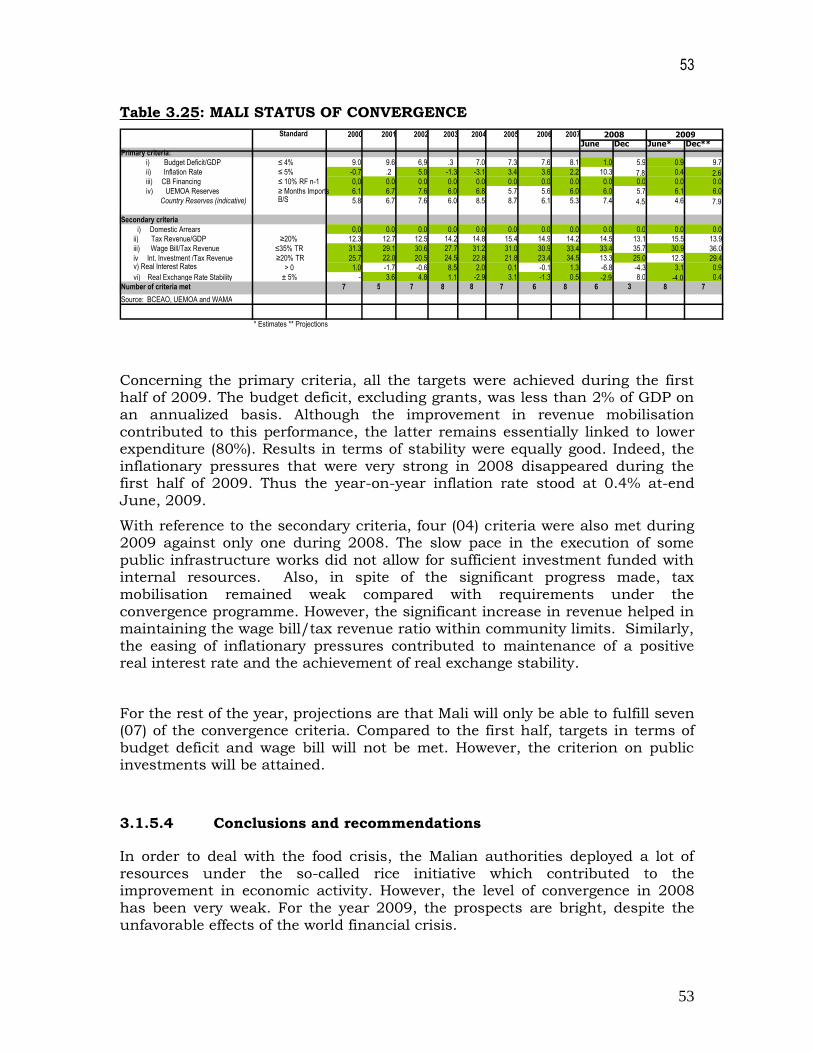
53
53
Table 3.25: MALI STATUS OF CONVERGENCE
Concerning the primary criteria, all the targets were achieved during the first half of 2009. The budget deficit, excluding grants, was less than 2% of GDP on an annualized basis. Although the improvement in revenue mobilisation contributed to this performance, the latter remains essentially linked to lower expenditure (80%). Results in terms of stability were equally good. Indeed, the inflationary pressures that were very strong in 2008 disappeared during the first half of 2009. Thus the year-on-year inflation rate stood at 0.4% at-end June, 2009.
With reference to the secondary criteria, four (04) criteria were also met during 2009 against only one during 2008. The slow pace in the execution of some public infrastructure works did not allow for sufficient investment funded with internal resources. Also, in spite of the significant progress made, tax mobilisation remained weak compared with requirements under the convergence programme. However, the significant increase in revenue helped in maintaining the wage bill/tax revenue ratio within community limits. Similarly, the easing of inflationary pressures contributed to maintenance of a positive real interest rate and the achievement of real exchange stability.
For the rest of the year, projections are that Mali will only be able to fulfill seven (07) of the convergence criteria. Compared to the first half, targets in terms of budget deficit and wage bill will not be met. However, the criterion on public investments will be attained.
3.1.5.4 Conclusions and recommendations
In order to deal with the food crisis, the Malian authorities deployed a lot of resources under the so-called rice initiative which contributed to the improvement in economic activity. However, the level of convergence in 2008 has been very weak. For the year 2009, the prospects are bright, despite the unfavorable effects of the world financial crisis.
Standard June Dec June* Dec**
Primary criteria: i) Budget Deficit/GDP ≤ 4% 9.0 9.6 6,9 .3 7.0 7.3 7.6 8.1 1.0 5.9 0.9 9.7 ii) Inflation Rate ≤ 5% -0.7 .2 5.0 -1.3 -3.1 3.4 3.6 2.2 10.3 7.8 0.4 2.6 iii) CB Financing ≤ 10% RF n-1 0,0 0.0 0.0 0.0 0.0 0.0 0.0 0.0 0.0 0.0 0.0 0.0 iv) UEMOA Reserves ≥ Months Imports
B/S 6.1 6.7 7.6 6.0 6.8 5.7 5.6 6.0 6.0 5.7 6.1 6.0
Country Reserves (indicative) 5.8 6.7 7.6 6.0 8.5 8.7 6.1 5.3 7.4 4.5 4.6 7.9 Secondary criteria i) Domestic Arrears 0,0 0.0 0.0 0.0 0.0 0.0 0.0 0.0 0.0 0.0 0.0 0.0
ii) Tax Revenue/GDP ≥20% 12.3 12.7 12.5 14.2 14.8 15.4 14.9 14.2 14.5 13.1 15.5 13.9 iii) Wage Bill/Tax Revenue ≤35% TR 31.3 29.1 30.6 27.7 31.2 31.0 30.9 33.4 33.4 35.7 30.9 36.0 iv Int. Investment /Tax Revenue v) Real Interest Rates
≥20% TR 25.7 22.0 20.5 24.5 22.8 21.8 23.4 34.5 13.3 25.0 12.3 29.4 > 0 1.0 -1.7 -0.6 8.5 2.0 0.1 -0.1 1.3 -6.8 -4.3 3.1 0.9 vi) Real Exchange Rate Stability ± 5% - 3.6 4.8 1.1 -2.9 3.1 -1.3 0.5 -2.9 8.0 -4.0 0.4
Number of criteria met 7 5 7 8 8 7 6 8 6 3 8 7 Source: BCEAO, UEMOA and WAMA
* Estimates ** Projections
2009 2003 2004 2000 2001 2002 2007 2006 2005 2008
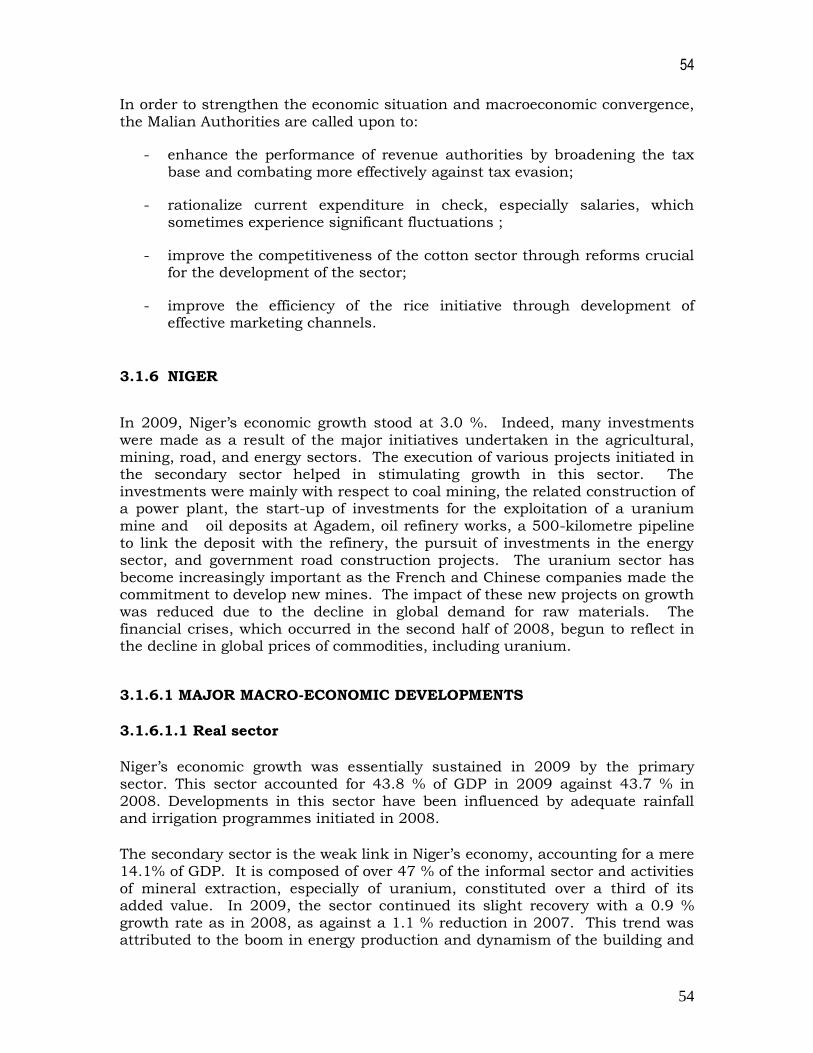
54
54
In order to strengthen the economic situation and macroeconomic convergence, the Malian Authorities are called upon to:
- enhance the performance of revenue authorities by broadening the tax base and combating more effectively against tax evasion;
- rationalize current expenditure in check, especially salaries, which sometimes experience significant fluctuations ;
- improve the competitiveness of the cotton sector through reforms crucial for the development of the sector;
- improve the efficiency of the rice initiative through development of effective marketing channels.
3.1.6 NIGER
In 2009, Niger’s economic growth stood at 3.0 %. Indeed, many investments were made as a result of the major initiatives undertaken in the agricultural, mining, road, and energy sectors. The execution of various projects initiated in the secondary sector helped in stimulating growth in this sector. The investments were mainly with respect to coal mining, the related construction of a power plant, the start-up of investments for the exploitation of a uranium mine and oil deposits at Agadem, oil refinery works, a 500-kilometre pipeline to link the deposit with the refinery, the pursuit of investments in the energy sector, and government road construction projects. The uranium sector has become increasingly important as the French and Chinese companies made the commitment to develop new mines. The impact of these new projects on growth was reduced due to the decline in global demand for raw materials. The financial crises, which occurred in the second half of 2008, begun to reflect in the decline in global prices of commodities, including uranium.
3.1.6.1 MAJOR MACRO-ECONOMIC DEVELOPMENTS
3.1.6.1.1 Real sector
Niger’s economic growth was essentially sustained in 2009 by the primary sector. This sector accounted for 43.8 % of GDP in 2009 against 43.7 % in
2008. Developments in this sector have been influenced by adequate rainfall and irrigation programmes initiated in 2008.
The secondary sector is the weak link in Niger’s economy, accounting for a mere 14.1% of GDP. It is composed of over 47 % of the informal sector and activities of mineral extraction, especially of uranium, constituted over a third of its added value. In 2009, the sector continued its slight recovery with a 0.9 % growth rate as in 2008, as against a 1.1 % reduction in 2007. This trend was attributed to the boom in energy production and dynamism of the building and

55
55
construction. However, just as the past two years, notwithstanding the positive trend in price of uranium, mineral production recorded a regression in volume, thereby reducing the growth of the secondary sector. Niger is supposed to begin its oil extraction activities in 2009.
In 2009, the tertiary sector accounted for 42.2 % of GDP and recorded a 6.5 % growth, as against 9.6 % in 2008. The trend is mainly due to the performances of transport and communication activities which grew by 4.9 % and 6 % respectively.
Growth in demand was propelled by a substantial increase in consumption. Private final consumption remained the largest component of labour absorption with respect to GDP and accounted for 77.5 % in 2009. This does not foster the mobilization of sufficient savings to finance productive investments. This
private final consumption recorded a 9.5 % increase in 2009, as against 21.8 % in 2008. The final consumption of the administrative authorities was on an upward trend, with a 6.9 % rise in 2009 as against 11.7 % in 2008, in relation to the increase of capital expenditure.
There was also an expansion in investments with a rate of 6.4 % in 2009. This increase is due, among other things, to continued investments in the areas of exploration, particularly, uranium and oil, energy and communications.
In 2009, foreign trade was marked by a 12.2 % increase in imports, which account for 38.1 % of GDP. This growth is linked to the increase in demand for capital goods and a 6.9 % rise in the exports of uranium and agro-pastoral products – which represents a 18.7 % of GDP. This trend led to a regression of the import coverage rate by exports, which stood at 49.2 % in 2009, as against 51.7 % in 2008.
Table 3.26: Trends in the real sector between 2007 and 2009
ITEMS 2007* 2008* 2009** 2007* 2008* 2009**
DEMAND COMPONENTS EVOLUTION IN % VARIATION IN % OF GDP
Public consumption 12.5 11.7 6.9 15.8 15.0 15.0
Private consumption 4.8 21.8 9.5 73.2 75.7 77.5
Gross capital formation 10.1 29.9 6.4 23.3 25.7 25.6
Stock variation -65.5 306.9 13.4 0.3 1.1 1.2
Export of goods and services 17.1 22.5 6.9 18.0 18.7 18.7
Import of goods and services 10.7 39.4 12.2 30.6 36.3 38.1
COMPOSITION OF GDP
Primary sector 1.6 26.1 7.1 40.8 43.7 43.8
Secondary sector 31.1 20.0 7.2 13.8 14.1 14.1
Tertiary sector 5.6 9.6 6.5 45.4 42.2 42.1
GDP ALLOCATION
Consumption -0.6 1.9 2.0 89.01 90.70 92.53
Investment 0.1 13.6 -0.1 23.61 26.82 26.79
Domestic savings 5.0 -15.4 -19.7 10.99 9.30 7.47
Sources: WAMA, BCEAO (*) estimates (**): Forecast
The rise in the prices of food products (20.5 %) in 2008 abated in 2009 as a result of the easing of the inflationary pressures on food and fuel prices on the

56
56
world market. As at end June 2009, inflation stood at 7.1 % against 13.6 % at the end of 2008, and could further reduce before the end of the year.
3.1.6.1.2 PUBLIC FINANCES
In late 2008, Niger enjoyed a substantial 53.5 percent increase in grants, which was about 35.2% of total revenue (tax revenue and grants). Tax revenues went up by 20.6 % as compared to the previous year. The supplementary budget of 2 June 2008 reviewed downward customs revenue projections after the adoption of the measure for the suspension of import duties and taxes on rice and milk, and the 17 % reduction in the taxable value of sugar and wheat flour. In 2009, there was a 31.1 % decline in budget revenue which accounted for 12.2 % of GDP as against 17.5 % in 2008, owing to the decline in the level of non-tax revenues.
In the case of expenditures, capital expenditure accounted for 47.2 % of total expenditures and 22.2 % of GDP. Financing of capital expenditures largely relied on external resources, a situation that may well impinge on the sustainability of expenditures not controlled by the Government. This risk was even higher in 2009 probably, given the decline in transfers and international aid induced by the financial crisis. In 2009, total expenditures expanded by 12.7 % to reach 26.2 % of GDP against 21.9 % in 2008. This trend stemmed from two expenditure components but mainly capital expenditures which recorded a 23.7 % growth as against 11.3 % for current expenditures.
Budget balance excluding grants deteriorated and settled at -11.7 % of GDP in 2009, as against -4.0 % in 2008. This is due, among other things, to the increase in expenditures and a decline in budget revenues as a result of the generalized financial crisis.
Table 3.27: Trends in public finance, 2006-2009
2006 2007 2008 2009
REVENUE AND GRANTS 5.1% 25.9% 36.6% -16.8%
BUDGET REVENUE 30.8% 24.9% 43.1% -31.1%
Tax Revenue 12.5% 14.4% 20.6% 2.6%
Non -Tax Revenue 685.7% 84.9% 123.0% -91.1%
GRANTS -31.2% 28.5% 19.7% 27.7%
TOTAL EXPENDITURES 5.0% 18.6% 20.2% 12.7%
CURRENT EXPENDITURES 5.4% 37.4% 17.3% 2.6%
Salaries and wages 7.9% 6.2% 16.1% 11.3%
CAPITAL EXPENDITURE 4.7% 2.4% 23.7% 23.7%
Externally Funded 1.0% 43.1% 46.1% -33.2%
Internally Funded 28.1% 25.3% 31.6% 38.3%
OVERALL BALANCE (Committment basis excluding grants) -23.7% 6.4% -31.1% 216.6% Sources: WAMA, BCEAO (*) estimate (**): Projections

57
57
3.1.6.1.3 EXTERNAL SECTOR
Niger’s trade balance deteriorated in 2009, recording a deficit of -8.8 % of GDP in 2009, as against 8.5 % in 2008, a situation that reflects the rise in imports (25.5 %) despite the good performance of the export sectors (16.7 %). Furthermore, there is a pessimistic outlook on global demand in 2009. Expected exports of uranium could further reduce, leading to a higher deterioration in trade balance.
Balance of services and revenues worsened in 2009, by -10.5 % and -0.3 % of GDP respectively. Current transfers grew by 5.8 % of GDP. This flow reflected mainly in budget supports. In 2009, there was no improvement in the current deficit, which settled at 13.8 % of GDP against 13.6 % in 2008.
Table 3.28: Evolution of the balance of payments of Niger (in % of GDP)
ITEMS 2 006 2 007 2008* 2009**
Trade balance -6.6 -5.9 -8.5 -8.8
Export FOB 13.9 15.6 16.6 16.7
Import FOB -20.5 -21.5 -25.1 -25.5
Balance of services -6.5 -6.7 -9.1 -10.5
Balance of revenues 0.0 0.0 -0.3 -0.3
Balance of current transfers 4.5 4.4 4.2 5.8
BALANCE OF CURRENT TRANSANCTIONS -8.6 -8.3 -13.6 -13.8
CAPITAL AND FINANCIAL OPERATION ACCOUNTS 13.7 12.0 16.4 14.0
Capital Transfers 46.1 5.0 4.7 4.9
Financial operations 1.6 1.3 5.1 0.0
Direct investments -34.0 5.7 6.5 9.1
Portfolio investments 1.4 2.8 5.2 6.6
Other investments -0.1 -0.1 -0.1 0.4
GLOBAL BALANCE -35.3 3.0 1.5 2.1
Cover rate: Export b&s/Imports b&s 55.6 58.8 51.7 49.2
Degree of opening: (import b&s+ export b&s)/GDP 45.9 48.6 55.0 56.8
Current balance/GDP -8.6 -8.3 -13.6 -13.8
Current balance net of grants/GDP -9.6 -9.6 -15.1 -17.2
Global balance/GDP 4.6 3.4 2.4 0.2
Sources: WAMA, BCEAO (*) estimate (**): Forecast
3.1.6.1.4 MONETARY SITUATION
In June 2009, there was a 12.6 % decline in net foreign assets of the banking
system, as against 2008 when they rose by 47.2 %. The exceptional increase in 2008 was mainly attributed to the mobilization of three hundred million dollars (USD 300 million) revenue from an oil exploration license issued to China National Oil and Gas Exploration and Development Corporation.
The period under review was characterized by an improvement of the Government’s Net Position with the banking system and an increase in credits to the private sector. Consequently, money supply recorded a 14.1 % expansion due mainly to a significant growth in credits extended to the private

58
58
sector. This development resulted in increases in both total deposits (31.7%) and currency in circulation (11.8%)
Table 3.29: Half-yearly trends of the monetary situation of Niger (in %)
ITEMS
2 0 0 6 2 0 0 7 2 0 0 8 2009
June Dec. June Dec. June Dec. June
LIABILITIES
Money supply(M2) 11.4 4.3 3.7 18.9 3.3 8.5 14.1
Money supply(M1) 13.1 5.2 0.7 17.0 1.3 6.9 21.7
Currency in circulation 20.5 1.8 -6.5 7.2 1.4 9.3 11.8
Sight deposits 3.6 10.3 10.7 28.3 1.3 4.5 31.7
Quasi-money 5.7 1.0 14.9 25.2 9.3 13.4 -6.7
Foreign exchange deposits - - - - - - -
Other items (nets) -14.9 44.4 -26.4 -17.9 59.1 91.4 -54.0
ASSETS -12.7 -9.5 3.6 -9.6 -62.3 175.7 50.2
Net Government credits -67.0 -133.9 168.6 135.0 254.4 -35.1 -32.1
Central Bank -58.0 -98.1 -1733.3 213.3 416.0 -39.3 -41.4
Foreign exchange banks 80.4 2.4 34.4 67.9 -4.1 1.6 16.0
Private sector credit 19.1 10.6 11.8 7.6 20.1 14.0 14.2
Central Bank - - - - - - -
Foreign exchange banks 19.1 10.6 11.8 7.6 20.1 14.0 14.2
Net foreign assets
Banking system 70.3 27.4 0.3 44.5 47.2 -14.0 -12.6
Central Bank 123.4 20.7 10.1 31.9 44.6 -12.2 -2.7
Foreign exchange banks -196.6 -49.6 274.1 -58.5 -20.0 70.8 228.5
Use of IMF credits
Sources: WAMA, BCEAO (*) estimate (**): Forecast
3.1.6.2 STATUS OF MACRO-ECONOMIC CONVERGENCE
Niger’s performance level remained unchanged in 2009 as compared to that of 2008. The country achieved seven (07) criteria, including three primary ones.
3.1.6.2.1 Primary criteria
By the end of 2009, Niger would have achieved three (3) primary goals, namely, the coverage of the imports of goods and services with gross reserves, inflation, and budget deficit financing by the Central Bank.
The public deficit ratio excluding grants increased from 4.0 % in 2008 to 11.7 % in 2009. This deterioration in public finance was mainly attributable to the global crisis which caused a decline in revenue and an increase in
expenditures. There was a 31.1 % reduction in budget revenue, accounting for 12.2 % of GDP as against 17.5 % in 2008, due to the decline in the level of non tax revenues whilst expenditures, especially capital expenditures, went up by 23.7 %.
Niger was also affected by the global inflation spiral in 2008. This situation however improved in 2009. The inflation rate was 3.9 % in 2009 as against 13.6 in 2008 although the criterion settled at 7.1 % in June 2009.
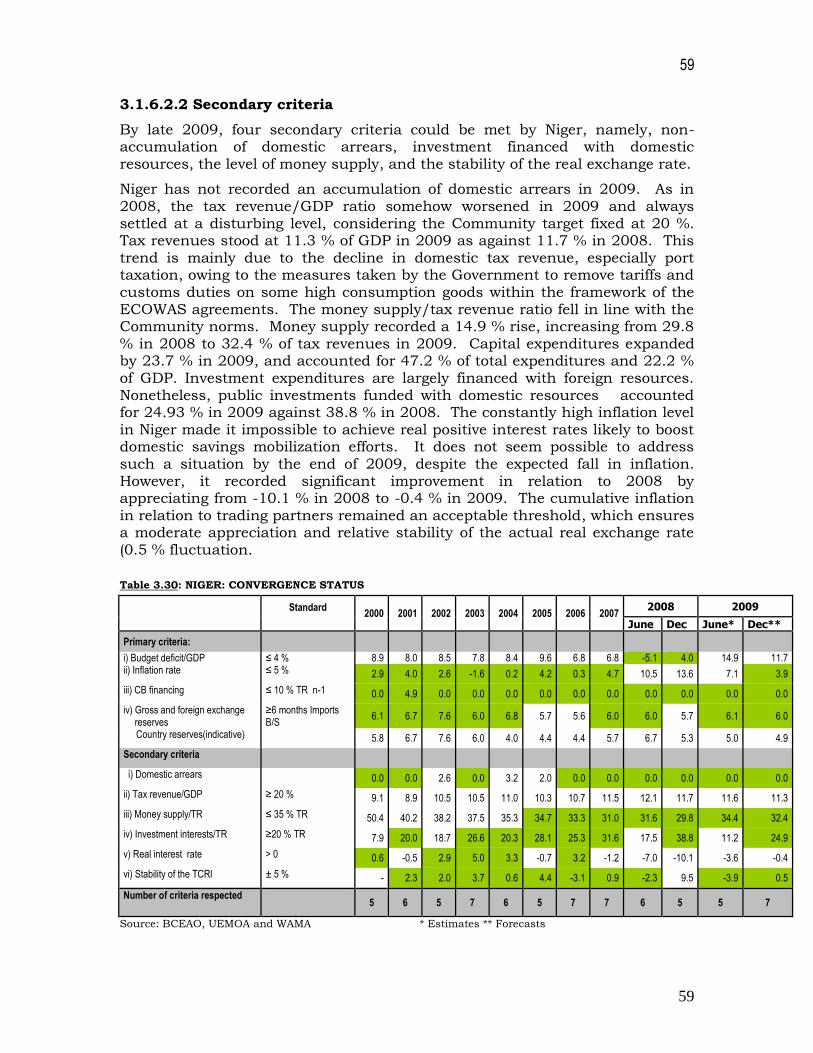
59
59
3.1.6.2.2 Secondary criteria
By late 2009, four secondary criteria could be met by Niger, namely, non-accumulation of domestic arrears, investment financed with domestic resources, the level of money supply, and the stability of the real exchange rate.
Niger has not recorded an accumulation of domestic arrears in 2009. As in 2008, the tax revenue/GDP ratio somehow worsened in 2009 and always settled at a disturbing level, considering the Community target fixed at 20 %. Tax revenues stood at 11.3 % of GDP in 2009 as against 11.7 % in 2008. This trend is mainly due to the decline in domestic tax revenue, especially port taxation, owing to the measures taken by the Government to remove tariffs and customs duties on some high consumption goods within the framework of the ECOWAS agreements. The money supply/tax revenue ratio fell in line with the Community norms. Money supply recorded a 14.9 % rise, increasing from 29.8
% in 2008 to 32.4 % of tax revenues in 2009. Capital expenditures expanded by 23.7 % in 2009, and accounted for 47.2 % of total expenditures and 22.2 % of GDP. Investment expenditures are largely financed with foreign resources. Nonetheless, public investments funded with domestic resources accounted for 24.93 % in 2009 against 38.8 % in 2008. The constantly high inflation level in Niger made it impossible to achieve real positive interest rates likely to boost domestic savings mobilization efforts. It does not seem possible to address such a situation by the end of 2009, despite the expected fall in inflation. However, it recorded significant improvement in relation to 2008 by appreciating from -10.1 % in 2008 to -0.4 % in 2009. The cumulative inflation in relation to trading partners remained an acceptable threshold, which ensures a moderate appreciation and relative stability of the actual real exchange rate (0.5 % fluctuation.
Table 3.30: NIGER: CONVERGENCE STATUS
Standard
2000 2001 2002 2003 2004 2005 2006 2007
2008 2009
June Dec June* Dec**
Primary criteria:
i) Budget deficit/GDP ≤ 4 % 8.9 8.0 8.5 7.8 8.4 9.6 6.8 6.8 -5.1 4.0 14.9 11.7 ii) Inflation rate ≤ 5 % 2.9 4.0 2.6 -1.6 0.2 4.2 0.3 4.7 10.5 13.6 7.1 3.9
iii) CB financing ≤ 10 % TR n-1 0.0 4.9 0.0 0.0 0.0 0.0 0.0 0.0 0.0 0.0 0.0 0.0
iv) Gross and foreign exchange reserves
≥6 months Imports B/S
6.1 6.7 7.6 6.0 6.8 5.7 5.6 6.0 6.0 5.7 6.1 6.0
Country reserves(indicative) 5.8 6.7 7.6 6.0 4.0 4.4 4.4 5.7 6.7 5.3 5.0 4.9
Secondary criteria
i) Domestic arrears 0.0 0.0 2.6 0.0 3.2 2.0 0.0 0.0 0.0 0.0 0.0 0.0
ii) Tax revenue/GDP ≥ 20 % 9.1 8.9 10.5 10.5 11.0 10.3 10.7 11.5 12.1 11.7 11.6 11.3
iii) Money supply/TR ≤ 35 % TR 50.4 40.2 38.2 37.5 35.3 34.7 33.3 31.0 31.6 29.8 34.4 32.4
iv) Investment interests/TR ≥20 % TR 7.9 20.0 18.7 26.6 20.3 28.1 25.3 31.6 17.5 38.8 11.2 24.9
v) Real interest rate > 0 0.6 -0.5 2.9 5.0 3.3 -0.7 3.2 -1.2 -7.0 -10.1 -3.6 -0.4
vi) Stability of the TCRl ± 5 % - 2.3 2.0 3.7 0.6 4.4 -3.1 0.9 -2.3 9.5 -3.9 0.5
Number of criteria respected 5 6 5 7 6 5 7 7 6 5 5 7
Source: BCEAO, UEMOA and WAMA * Estimates ** Forecasts

60
60
3.1.6.3 Conclusions and recommendations
The negative impact of global economic and financial activity has considerable impact on Niger’s economic activity. The real growth rate of GDP fell from 9.5 % in 2008 to 3.0 % in 2009. Indeed, despite the prospect of a good agricultural harvest and continued investments in energy, Building and Public Works, transport, telecommunications and mining sectors, there was a significant downturn in economic performance. Public finances also deteriorated, with a budget deficit of 11.7 % of GDP.
As regards macro-economic convergence, Niger’s overall performance level in 2009 was constant as compared to 2008. As in 2008, the country achieved seven (07) targets, three of them primary. The public finance situation worsened significantly mainly due to the global financial crisis. This situation is especially visible at the level of the disproportionate trends of revenues and expenditures. Non-tax revenues, which were used to a large extent in improving public finances in 2008, reduced considerably in 2009 while expenditures, especially capital expenditures, expanded. Similarly, current transactions deficit excluding grants worsened by 13.8 % of GDP. Thus, Niger’s macro-economic performance remains mixed. Additional efforts should be made towards strengthening the current macro-economic situation. In particular, the authorities should:
1. pursue the specific measure bearing on the enlargement of the tax base and improvement of budget resource recovery by consolidating the measures recommended in the action plans of financial corporations;
2. pursue and strengthen structural and sector reforms with a view to promoting the achievement of high and sustainable economic growth;
3. encourage local food production in order to reducing the country’s dependence on external sources and exposure to pressures on the world market;
4. promote export products through a policy of sensitization and incentives to production diversification with a view to increasing the sources of balance-of-payments improvements.
5. pursue the implementation of irrigation and hydro-agricultural improvement programmes to boost agricultural production with a view to ensuring food security and combating inflation; and
6. diversify production by developing food product and export product
networks with so as to consolidate the bases of economic growth.
61
61
3.1.7. SENEGAL
Senegal’s medium and long-term economic and financial development is aimed at increasing the contribution of exports to economic growth and achieving, in the long-term, a current external account balance (excluding grants) below the 5 % threshold. Senegal intends to consolidate economic and financial stability by maintaining a positive basic budget balance in the short-term and a low inflation rate. The macro-economic prospects in 2009 are based on the pursuit of growth objectives and a series of measures envisaged in the Poverty Reduction Strategy Paper (PRSP). Real GDP growth initially projected at 3.5 % was later reviewed downwards to 3.1%. This growth rate is based on assumptions relating to a
consolidation of primary sector performance, secondary sector recovery, delays in settlement of outstanding arrears, continued decline in the price of oil, and maintenance of the dynamism of the tertiary sector.
3.1.7.1 MAJOR MACROECONOMIC DEVELOPMENTS
3.1.7.1.1 Real sector
The provisional indicators at the end of June 2009 show that the primary sector performed satisfactorily despite certain difficulties in the livestock farming and fishery sub-sectors which declined by 5.5% and 6.9% respectively. Nonetheless, the secondary sector recorded a slight rise of 0.7% over the period, due to the rebound of extractive activities, especially oil production. These performances were mitigated by the decline observed in the energy and building and construction sub-sectors. The main constraints cited by companies in the industrial sector were in respect of electricity supply, low global prices of some products, and counterfeiting. The growth of industrial activities was affected by inadequate domestic and foreign demand as a result of the global crisis. In the tertiary sector whose share of GDP in 2009 was 65.2 %, telecommunications was an important activity with a high expansion in mobile telephone services phones and trade. It is expected that in 2009, the tertiary sector will record a 5.6 % growth, mainly spurred on by trade, transport and post and telecommunications activities.
The share of gross fixed capital formation (GFCF) in GDP went up slightly from 26.6 % in 2008 to 27.0 % in 2009. This positive trend is due to the implementation of the urban mobility improvement programme (Pamu) and the infrastructures improvement programme. There is also the fact that the action of Arcelor Mittal group (number 1 iron and steel industry in the world) envisages investing Euro 1.67 billion to explore the iron ore mines of Falémé, in South-east Senegal. The project envisages the construction of a mineral port at
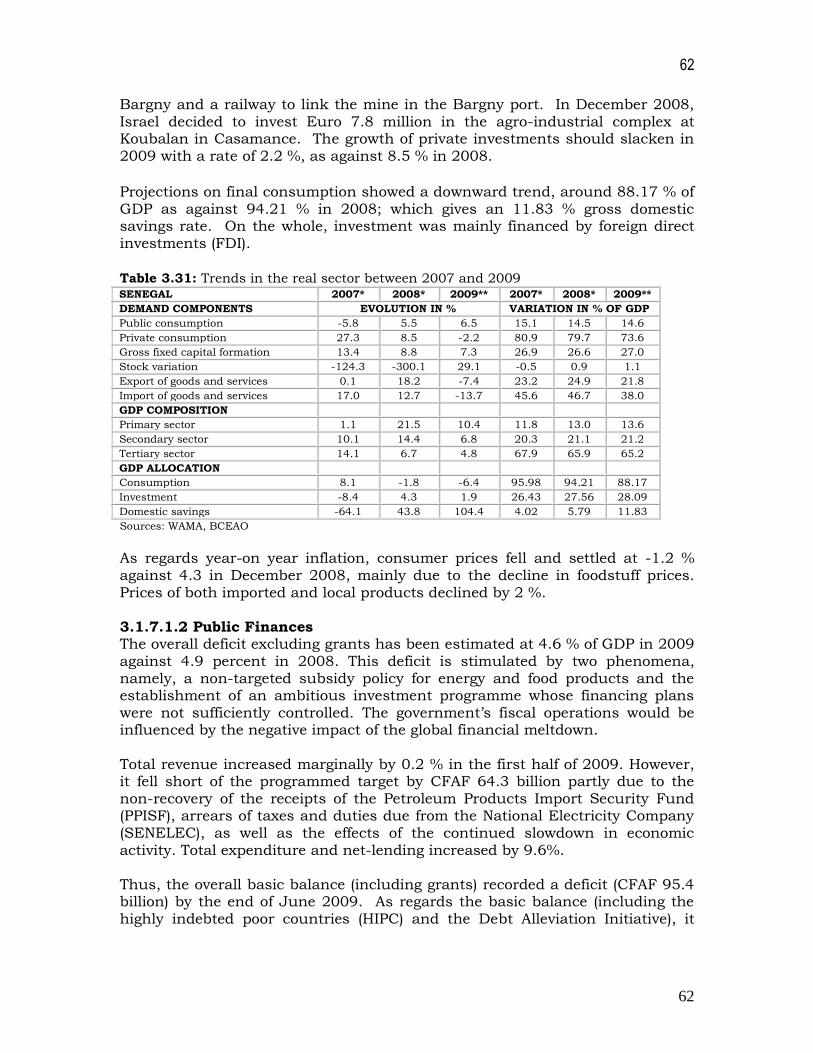
62
62
Bargny and a railway to link the mine in the Bargny port. In December 2008, Israel decided to invest Euro 7.8 million in the agro-industrial complex at Koubalan in Casamance. The growth of private investments should slacken in 2009 with a rate of 2.2 %, as against 8.5 % in 2008.
Projections on final consumption showed a downward trend, around 88.17 % of GDP as against 94.21 % in 2008; which gives an 11.83 % gross domestic savings rate. On the whole, investment was mainly financed by foreign direct investments (FDI).
Table 3.31: Trends in the real sector between 2007 and 2009 SENEGAL 2007* 2008* 2009** 2007* 2008* 2009**
DEMAND COMPONENTS EVOLUTION IN % VARIATION IN % OF GDP
Public consumption -5.8 5.5 6.5 15.1 14.5 14.6
Private consumption 27.3 8.5 -2.2 80.9 79.7 73.6
Gross fixed capital formation 13.4 8.8 7.3 26.9 26.6 27.0
Stock variation -124.3 -300.1 29.1 -0.5 0.9 1.1
Export of goods and services 0.1 18.2 -7.4 23.2 24.9 21.8
Import of goods and services 17.0 12.7 -13.7 45.6 46.7 38.0
GDP COMPOSITION
Primary sector 1.1 21.5 10.4 11.8 13.0 13.6
Secondary sector 10.1 14.4 6.8 20.3 21.1 21.2
Tertiary sector 14.1 6.7 4.8 67.9 65.9 65.2
GDP ALLOCATION
Consumption 8.1 -1.8 -6.4 95.98 94.21 88.17
Investment -8.4 4.3 1.9 26.43 27.56 28.09
Domestic savings -64.1 43.8 104.4 4.02 5.79 11.83
Sources: WAMA, BCEAO
As regards year-on year inflation, consumer prices fell and settled at -1.2 % against 4.3 in December 2008, mainly due to the decline in foodstuff prices. Prices of both imported and local products declined by 2 %. 3.1.7.1.2 Public Finances The overall deficit excluding grants has been estimated at 4.6 % of GDP in 2009 against 4.9 percent in 2008. This deficit is stimulated by two phenomena, namely, a non-targeted subsidy policy for energy and food products and the establishment of an ambitious investment programme whose financing plans were not sufficiently controlled. The government’s fiscal operations would be influenced by the negative impact of the global financial meltdown. Total revenue increased marginally by 0.2 % in the first half of 2009. However, it fell short of the programmed target by CFAF 64.3 billion partly due to the non-recovery of the receipts of the Petroleum Products Import Security Fund (PPISF), arrears of taxes and duties due from the National Electricity Company (SENELEC), as well as the effects of the continued slowdown in economic activity. Total expenditure and net-lending increased by 9.6%. Thus, the overall basic balance (including grants) recorded a deficit (CFAF 95.4 billion) by the end of June 2009. As regards the basic balance (including the highly indebted poor countries (HIPC) and the Debt Alleviation Initiative), it

63
63
showed a CFA 39.5 billion deficit against a target of CFAF 60 billion as at end June 2009. Table 3.32: Trends in public finance, 2006-2009 (percentage growth rate)
2006 2007 2008 2009
REVENUE AND GRANTS 8.4% 23.4% -4.2% 24.2%
BUDGET REVENUE 9.4% 18.3% -0.4% 20.5%
Tax Revenue 8.4% 18.0% -1.4% 24.1%
Non- Tax Revenue 38.4% 25.3% 19.6% -42.6%
GRANTS -2.9% 89.4% -35.3% 70.0%
TOTAL EXPENDITURES 19.8% 15.0% -3.3% 15.2%
CURRENT EXPENDITURES 31.2% 6.2% 5.7% 8.1%
Salaries and wages 12.2% 14.3% 6.4% 11.6%
CAPITAL EXPENDITURE 4.4% 27.2% -16.4% 28.3%
Externally Funded 17.5% 16.0% -10.0% 10.2%
Internally Funded 33.7% 36.6% 35.9% 32.8%
OVERALL BALANCE (Commitment basis excluding grants) 65.6% -5.9% -13.5% -0.1% Sources: WAMA, BCEAO; *projection
3.1.7.1.3 External sector The projections show that the current account deficit would improve by 24.7 % in 2009, representing 8.3 % of GDP. This improvement would be linked to a boost in exports especially that of agricultural and chemical products (ICS phosphoric acid). According to Senegal’s forecast department, the cumulative position over the first half of 2009 resulted in a 2.8 % increase in exports and 14 % reduction in imports. Thus, there was an improvement of the trade balance. The capital and financial operations account would record a 5.3 % increase in 2009 due to capital transfers and an upturn in foreign direct investments. On the whole, the overall balance of payments recorded a surplus of CFAF 15.0 billion against an 89.2 billion deficit in 2008.

64
64
Table 3.33: Trends in of Senegal’s balance of payments (in % of GDP)
ITEMS 2 006 2 007 2008* 2009**
1 - Trade balance -17.3 -22.1 -20.7 -15.5
Export FOB including: 17.2 14.8 15.4 13.6
Import FOB (1) -34.5 -36.9 -36.1 -29.0
2-Balance of services -0.4 -0.3 -1.0 -0.8
3-Balance of revenues -0.7 -0.7 -0.6 -0.7
4-Balance of current transfers 9.0 11.4 10.8 8.7
a-BALANCE OF CURRENT TRANSANCTIONS -9.3 -11.6 -11.6 -8.3
b- CAPITAL AND FINANCIAL OPERATIONS ACCOUNT 11.2 12.8 10.1 8.5
5- Capital transfers 24.5 1.8 1.3 1.7
6-Acquisitions /transfers of non-produced financial assets 0.0 1.2 0.0 0.0
7-Financial operations -13.2 9.9 8.9 6.8
Direct investments 2.3 2.4 2.2 1.2
Portfolio investments -0.3 0.5 0.0 0.0
Other investments -15.2 6.9 6.6 5.5
d -OVERALL BALANCE(a+b+c) 2.0 1.3 -1.5 0.2
Coverage rate: Export/Imports (%) 59.5 53.2 53.4 57.3
Degree of opening: (import + export)/GDP (%) 69.4 73.3 71.7 59.8
Current balance/GDP (%) -9.3 -11.6 -11.6 -8.3
Current balance net of grants/GDP (%) -9.5 -12.6 -12.3 -9.1
Global balance/GDP (%) 2.0 1.3 -1.5 0.2
Sources: WAMA, BCEAO (*) estimate (**): Forecast 3.1.7.1.4 Monetary sector As regards the monetary situation, the first half of 2009 was characterized by a slight increase in net foreign assets of 2.1%, an increase in net claims on Government of 142.7% and a 3.0 % rise in the banking systems claims on the private sector in relation to the same period in 2008 (ref. table below). Consequently, there was a 0.9 % expansion in money supply. Deposits increased by 12.2 % and currency in circulation declined by 1.0%. Table 3.34: Trends in the monetary situation of Senegal (in %)
2006 2007 2008 2009
LIABILITIES June Dec. June Dec. June Dec. June
Money supply(M2) 2.0 9.7 6.4 5.8 -3.1 5.0 0.9
Money supply(M1) 1.3 11.0 9.6 4.6 -4.1 3.1 7.2
Currency in circulation 0.7 15.7 -3.4 10.4 -13.4 13.3 -1.0
Sight deposits 1.7 8.0 18.7 1.3 1.7 -2.3 12.2
Quasi-money 3.2 7.4 0.8 8.2 -1.3 8.3 -9.7
Foreign exchange - - - - - - -
Other items (net) 6.2 14.3 0.1 34.3 18.1 -6.6 36.2
ASSETS -3.1 12.3 6.1 11.1 6.3 4.3 5.6
Net Government Credits 149.9 -112.4 82.5 359.8 -12.0 -65.7 142.7
Central Bank -60.6 36.8 -100.7 -18233.3 -19.7 -131.6 -389.9
Commercial banks 2.5 -72.2 -160.7 88.5 -1.2 9.4 -32.7
Private sector credit 2.0 2.1 5.3 5.1 7.7 8.7 3.0
Central Bank - - - - - - -
Commercial banks 2.0 2.1 5.3 5.1 7.7 8.7 3.0
Net foreign assets
Banking system 10.8 6.9 5.6 3.4 -12.6 2.4 2.1
Central Bank 20.1 -2.2 15.4 -1.9 -3.7 5.2 5.7
Commercial banks -15.1 42.9 -20.9 24.4 -40.4 -11.5 -19.9
IMF Credits
Sources: WAMA, BCEAO (*) estimate (**) Forecast
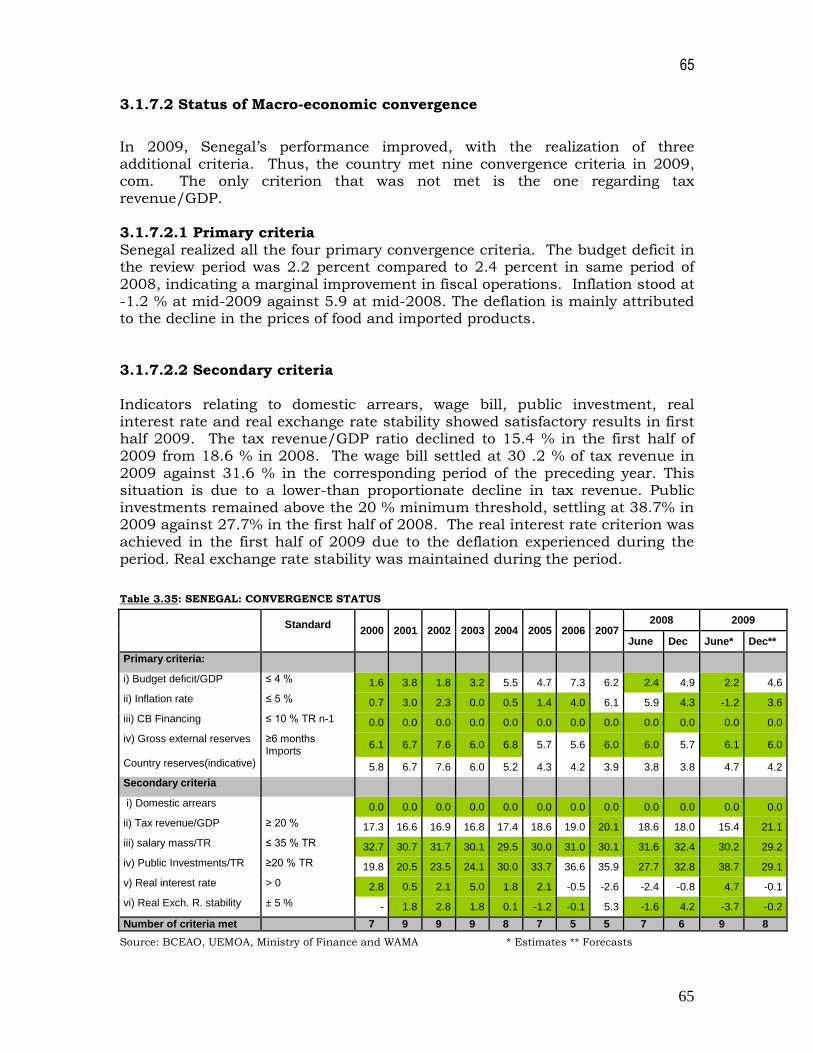
65
65
3.1.7.2 Status of Macro-economic convergence
In 2009, Senegal’s performance improved, with the realization of three additional criteria. Thus, the country met nine convergence criteria in 2009, com. The only criterion that was not met is the one regarding tax revenue/GDP. 3.1.7.2.1 Primary criteria Senegal realized all the four primary convergence criteria. The budget deficit in the review period was 2.2 percent compared to 2.4 percent in same period of 2008, indicating a marginal improvement in fiscal operations. Inflation stood at -1.2 % at mid-2009 against 5.9 at mid-2008. The deflation is mainly attributed to the decline in the prices of food and imported products. 3.1.7.2.2 Secondary criteria Indicators relating to domestic arrears, wage bill, public investment, real interest rate and real exchange rate stability showed satisfactory results in first half 2009. The tax revenue/GDP ratio declined to 15.4 % in the first half of 2009 from 18.6 % in 2008. The wage bill settled at 30 .2 % of tax revenue in 2009 against 31.6 % in the corresponding period of the preceding year. This situation is due to a lower-than proportionate decline in tax revenue. Public investments remained above the 20 % minimum threshold, settling at 38.7% in 2009 against 27.7% in the first half of 2008. The real interest rate criterion was achieved in the first half of 2009 due to the deflation experienced during the period. Real exchange rate stability was maintained during the period.
Table 3.35: SENEGAL: CONVERGENCE STATUS
Standard
2000 2001 2002 2003 2004 2005 2006 2007
2008 2009
June Dec June* Dec**
Primary criteria:
i) Budget deficit/GDP ≤ 4 % 1.6 3.8 1.8 3.2 5.5 4.7 7.3 6.2 2.4 4.9 2.2 4.6
ii) Inflation rate ≤ 5 % 0.7 3.0 2.3 0.0 0.5 1.4 4.0 6.1 5.9 4.3 -1.2 3.6
iii) CB Financing ≤ 10 % TR n-1 0.0 0.0 0.0 0.0 0.0 0.0 0.0 0.0 0.0 0.0 0.0 0.0
iv) Gross external reserves ≥6 months Imports
6.1 6.7 7.6 6.0 6.8 5.7 5.6 6.0 6.0 5.7 6.1 6.0
Country reserves(indicative) 5.8 6.7 7.6 6.0 5.2 4.3 4.2 3.9 3.8 3.8 4.7 4.2
Secondary criteria
i) Domestic arrears 0.0 0.0 0.0 0.0 0.0 0.0 0.0 0.0 0.0 0.0 0.0 0.0
ii) Tax revenue/GDP ≥ 20 % 17.3 16.6 16.9 16.8 17.4 18.6 19.0 20.1 18.6 18.0 15.4 21.1
iii) salary mass/TR ≤ 35 % TR 32.7 30.7 31.7 30.1 29.5 30.0 31.0 30.1 31.6 32.4 30.2 29.2
iv) Public Investments/TR ≥20 % TR 19.8 20.5 23.5 24.1 30.0 33.7 36.6 35.9 27.7 32.8 38.7 29.1
v) Real interest rate > 0 2.8 0.5 2.1 5.0 1.8 2.1 -0.5 -2.6 -2.4 -0.8 4.7 -0.1
vi) Real Exch. R. stability ± 5 % - 1.8 2.8 1.8 0.1 -1.2 -0.1 5.3 -1.6 4.2 -3.7 -0.2
Number of criteria met 7 9 9 9 8 7 5 5 7 6 9 8
Source: BCEAO, UEMOA, Ministry of Finance and WAMA * Estimates ** Forecasts

66
66
3.1.7.3 Policy harmonization and institutional arrangements
- Statistical harmonization Within the framework of the implementation of the ECOWAS statistical harmonization programme, Senegal is in the process of harmonizing the Consumer Price Index calculation method. The country has also performed the test of the PRIMA software and observed a difference between the method for
calculating IHPC by PRIMA and CHAPO which is used by the UEMOA countries.
- National Coordinating Committee (NCC) In the UEMOA zone, the NCC’s function is performed by the National Economic
Policy Committee (CNPE). In Senegal measures have been taken to enlarge through a legal measure, the composition of the CNPE to all the structures identified by the Decision of ECOWAS Heads of State and Government
establishing the NCC.
Free movement of persons and goods
According to the Senegalese authorities measures regarding the free movement of persons and goods will be strictly applied in their country. The same goes for the other UEMOA countries that maintain relations of free trade between them, but some difficulties still persist in the implementation of the ECOWAS protocols and agreements relating to that aspect.
3.1.7.4 Conclusions and recommendations
Senegal’s economic growth was estimated in 2009 at 3.1 %, as compared to a rate of 2.5 % in 2008 and an average of 4.9 % for the period 1996-2007. This recovery was due to the good rainy season with rainfall and the Goana (national comprehensive agriculture production for self-sufficiency) programme initiated by the Government.
As regards convergence, in 2009, the profile of the criteria improved with the respect of eight criteria. However, the country still has problems with the criterion on the budget deficit, which has not been observed since 2004. The
situation is mainly due to the budget overruns observed these past two years, sometimes stimulated by a non-targeted subsidy policy for energy and food products concerning 2006, 2007, and 2008, and the establishment of a far-reaching investment programme whose finance plans were not sufficiently controlled. On that score, the Senegalese authorities should give priority to the following measures:

67
67
1. Strengthen programmes, like Goana, in order to increase food production to ensure food self-sufficiency and consequently reduce dependence on imported commodities and encourage exports;
2. deepen the restructuring of ICS, SAR and SENELEC to make them more productive;
3. avoid the long delays is the settlement of private sector operators; 4. rationalize recurrent expenditure, especially, transfers and subsidies in
order to consolidate the benefits associated with good macroeconomic management;
5. maintain a prudent tax policy to preserve debt sustainability, control domestic and encourage private sector development.
3.1.8. Togo
Real GDP growth for 2009 was projected at 2.5%. It was expected that this growth would be driven mainly by major investments by the government in economic infrastructure. Inflation was projected at 4.3 percent taking in consideration the declining inflationary trends in the global economy. Concerning public finance, the budget deficit (excluding grants) has been estimated at 5.6 percent. The balance of payments would show a negative outturn of about 10.9 percent. In the monetary sector, the
3.1.8.1 MAJOR MACROECONOMIC DEVELOPMENTS
3.1.8.1.1 Real Sector
Economic activity bounced back in 2009 to settle at 2.5%, compared to 1.6% in 2008, thanks to the positive effects of the satisfactory implementation of a series of economic reforms contained in the PRGF Programme. All sectors of the economy would contribute to the growth in real GDP. It has been estimated that the primary sector, which represent 39.5% of GDP, would grow by 19.5 percent. In order to sustain agricultural production, the authorities implemented a number of programmes aimed at enhancing access to financing, irrigation, fertilizer and improved seeds.
The secondary sector, which accounts for 18.4% of GDP, would experience a 20.7 percent growth in 2009. Developments in this sector would be driven mainly the mining sector, especially in the production of phosphate, cement
nickel, chrome, copper, zinc and uranium. The building and construction and energy sectors would enjoy renewed donor support within the framework aimed at restoring infrastructure destroyed by the 2008 floods.
Growth in the tertiary sector, accounting for almost 50% of GDP, has been estimated at of 20.6 percent. This growth would be supported by favourable developments in transport and tourism sectors which benefits from advantages arising from the country’s geographical location.
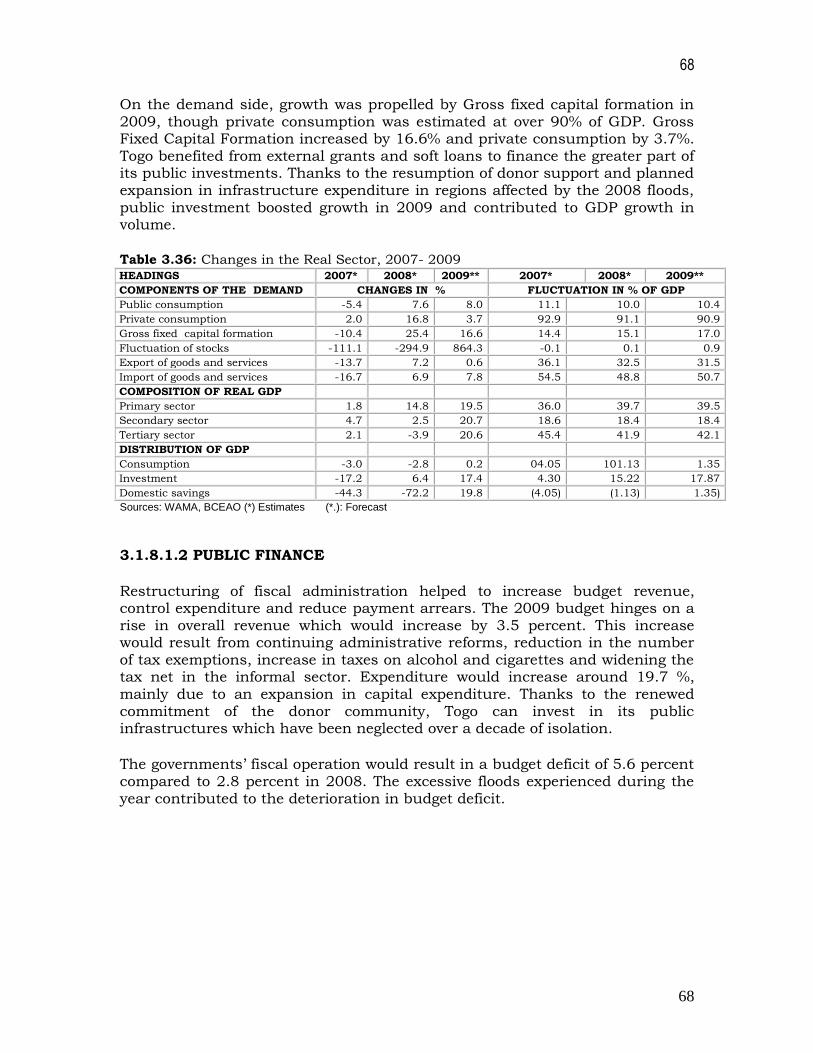
68
68
On the demand side, growth was propelled by Gross fixed capital formation in 2009, though private consumption was estimated at over 90% of GDP. Gross Fixed Capital Formation increased by 16.6% and private consumption by 3.7%. Togo benefited from external grants and soft loans to finance the greater part of its public investments. Thanks to the resumption of donor support and planned expansion in infrastructure expenditure in regions affected by the 2008 floods, public investment boosted growth in 2009 and contributed to GDP growth in volume.
Table 3.36: Changes in the Real Sector, 2007- 2009 HEADINGS 2007* 2008* 2009** 2007* 2008* 2009**
COMPONENTS OF THE DEMAND CHANGES IN % FLUCTUATION IN % OF GDP
Public consumption -5.4 7.6 8.0 11.1 10.0 10.4
Private consumption 2.0 16.8 3.7 92.9 91.1 90.9
Gross fixed capital formation -10.4 25.4 16.6 14.4 15.1 17.0
Fluctuation of stocks -111.1 -294.9 864.3 -0.1 0.1 0.9
Export of goods and services -13.7 7.2 0.6 36.1 32.5 31.5
Import of goods and services -16.7 6.9 7.8 54.5 48.8 50.7
COMPOSITION OF REAL GDP
Primary sector 1.8 14.8 19.5 36.0 39.7 39.5
Secondary sector 4.7 2.5 20.7 18.6 18.4 18.4
Tertiary sector 2.1 -3.9 20.6 45.4 41.9 42.1
DISTRIBUTION OF GDP
Consumption -3.0 -2.8 0.2 04.05 101.13 1.35
Investment -17.2 6.4 17.4 4.30 15.22 17.87
Domestic savings -44.3 -72.2 19.8 (4.05) (1.13) 1.35)
Sources: WAMA, BCEAO (*) Estimates (*.): Forecast
3.1.8.1.2 PUBLIC FINANCE
Restructuring of fiscal administration helped to increase budget revenue, control expenditure and reduce payment arrears. The 2009 budget hinges on a rise in overall revenue which would increase by 3.5 percent. This increase would result from continuing administrative reforms, reduction in the number of tax exemptions, increase in taxes on alcohol and cigarettes and widening the tax net in the informal sector. Expenditure would increase around 19.7 %, mainly due to an expansion in capital expenditure. Thanks to the renewed commitment of the donor community, Togo can invest in its public infrastructures which have been neglected over a decade of isolation.
The governments’ fiscal operation would result in a budget deficit of 5.6 percent compared to 2.8 percent in 2008. The excessive floods experienced during the year contributed to the deterioration in budget deficit.
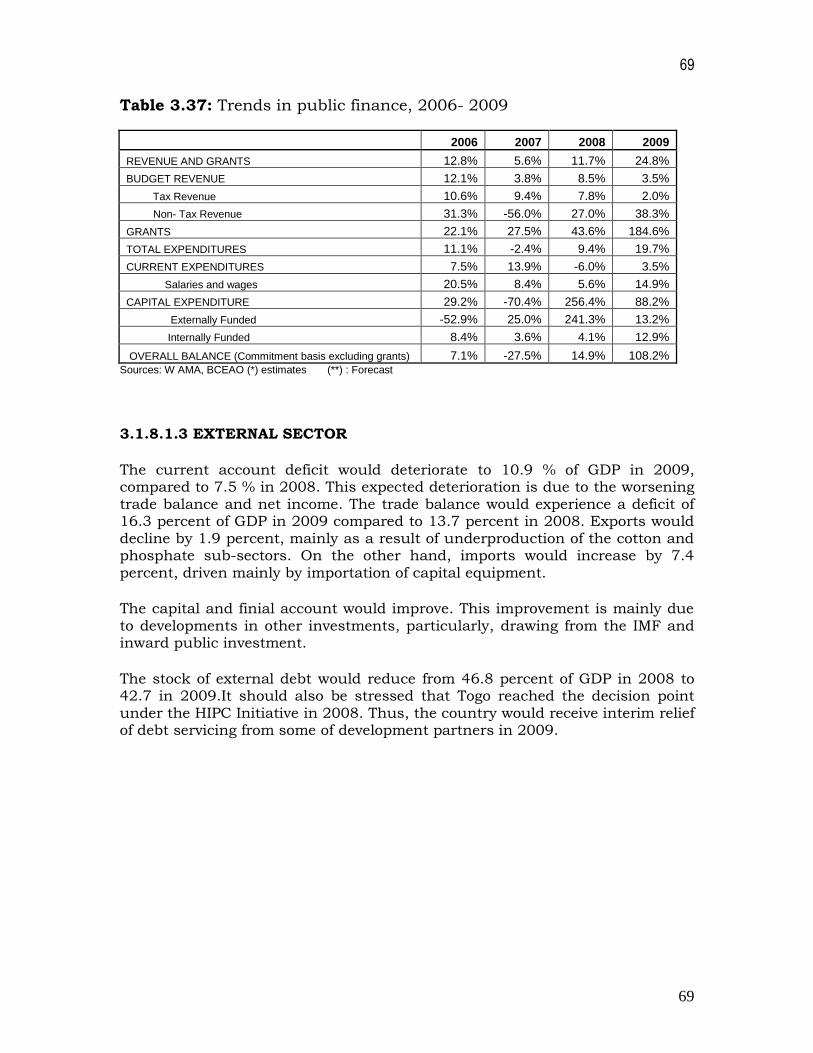
69
69
Table 3.37: Trends in public finance, 2006- 2009
2006 2007 2008 2009
REVENUE AND GRANTS 12.8% 5.6% 11.7% 24.8%
BUDGET REVENUE 12.1% 3.8% 8.5% 3.5%
Tax Revenue 10.6% 9.4% 7.8% 2.0%
Non- Tax Revenue 31.3% -56.0% 27.0% 38.3%
GRANTS 22.1% 27.5% 43.6% 184.6%
TOTAL EXPENDITURES 11.1% -2.4% 9.4% 19.7%
CURRENT EXPENDITURES 7.5% 13.9% -6.0% 3.5%
Salaries and wages 20.5% 8.4% 5.6% 14.9%
CAPITAL EXPENDITURE 29.2% -70.4% 256.4% 88.2%
Externally Funded -52.9% 25.0% 241.3% 13.2%
Internally Funded 8.4% 3.6% 4.1% 12.9%
OVERALL BALANCE (Commitment basis excluding grants) 7.1% -27.5% 14.9% 108.2% Sources: W AMA, BCEAO (*) estimates (**) : Forecast
3.1.8.1.3 EXTERNAL SECTOR
The current account deficit would deteriorate to 10.9 % of GDP in 2009, compared to 7.5 % in 2008. This expected deterioration is due to the worsening trade balance and net income. The trade balance would experience a deficit of 16.3 percent of GDP in 2009 compared to 13.7 percent in 2008. Exports would decline by 1.9 percent, mainly as a result of underproduction of the cotton and phosphate sub-sectors. On the other hand, imports would increase by 7.4 percent, driven mainly by importation of capital equipment.
The capital and finial account would improve. This improvement is mainly due to developments in other investments, particularly, drawing from the IMF and inward public investment.
The stock of external debt would reduce from 46.8 percent of GDP in 2008 to 42.7 in 2009.It should also be stressed that Togo reached the decision point under the HIPC Initiative in 2008. Thus, the country would receive interim relief of debt servicing from some of development partners in 2009.

70
70
Table 3.38: BALANCE OF PAYMENTS OF TOGO (in % of GDP) HEADINGS 2 006 2 007 2008* 2009**
Trade balance -14.3 -15.6 -13.7 -16.3
Export FOB 28.3 26.7 23.9 22.6
Import FOB -42.7 -42.4 -37.6 -38.9
Services balance -2.9 -2.7 -2.7 -2.9
Income balance -1.7 -1.2 -0.8 -0.8
Balance of current transfers 11.0 11.0 9.6 9.1
BALANCE OF CURRENT TRANSANCTIONS -7.9 -8.5 -7.5 -10.9
CAPITAL ACCOUNT AND FINANCIAL OPERATIONS 13.3 8.0 9.8 11.2
Capital transfers 2.9 2.9 19.6 4.9
Financial operations 10.5 5.1 -9.9 6.3
Direct investments 4.1 2.0 2.8 2.7
Portfolio investments 2.6 0.2 0.2 -0.2
Other investments 3.7 2.9 -12.8 3.7
OVERALL BALANCE 6.0 0.0 2.7 0.3
Rate of coverage: Export /Imports 69.0 67.0 66.5 62.1
Degree of openness: (import + export /GDP 94.0 92.9 81.3 82.1
Current balance/GDP -7.9 -8.5 -7.5 -10.9
Current balance excluding grants/GDP -9.4 -9.9 -8.9 -12.3
Overall balance/GDP 6.0 0.0 2.7 0.3
Sources: W AMA, BCEAO (*) estimates (**) :Forecast
3.1.8.1.4 MONETARY SECTOR
Owing to economic difficulties and tightening of monetary policy in the first half of 2009, growth of money supply slowed down considerably (0.4% compared to 5.3% the same period in 2008). This slowdown is evident in changes in money in circulation and demand deposits which were negative. The net claims on government increased slightly by 1.3 %, whereas credits extended to the private sector went up by 7.4 %. Net foreign assets of the banking system reduced by 9.2 % during the first half of 2009.
Table 3.39: Half-year trends in the monetary situation of Togo (in %)
HEADINGS
2 0 0 6 2 0 0 7 2 0 0 8* 2009**
June Dec June Dec June Dec June
LIABILITIES
Stock of money (M2) 8.1 13.6 10.7 5.5 5.3 12.3 0.4
Stock of money (M1) 11.0 21.0 11.5 -0.1 1.7 18.7 -12.1
Currency in circulation 11.1 42.8 7.7 13.2 -5.2 11.7 -15.9
Demand deposit 10.9 9.8 14.0 -8.5 7.0 23.5 -9.8
Quasi money 3.8 2.0 9.2 16.1 11.2 2.8 21.9
Foreign currency deposits - - - - - - -
Other (net) items 17.9 -25.4 -75.8 190.9 -28.9 218.7 -16.6
ASSETS -14.9 17.8 7.5 23.0 -3.5 26.7 5.9
Net credits to the government 6.2 -20.6 -129.9 -1108.4 -151.5 -1971.4 1.3
Central bank -408.5 -37.9 8.8 -47.3 230.8 -39.9 21.3
Deposit money bank -748.7 -35.6 -14.2 14.0 35.4 335.6 4.6
Credit to private sector -15.2 18.6 9.4 18.8 1.2 -5.8 7.4
Central bank - - - - - - -
Money creating banks -15.2 18.6 9.4 18.8 1.2 -5.8 7.4
Net external assets
Banking system 43.2 5.0 6.1 -8.1 14.7 4.6 -9.2
Central bank 74.2 5.7 11.4 -4.8 1.7 14.3 -16.5
Money creating banks -5.9 3.0 -10.0 -20.3 72.7 -20.9 18.6
Use of IMF credits
Sources: WAMA, BCEAO (*) estimates (**): Forecast
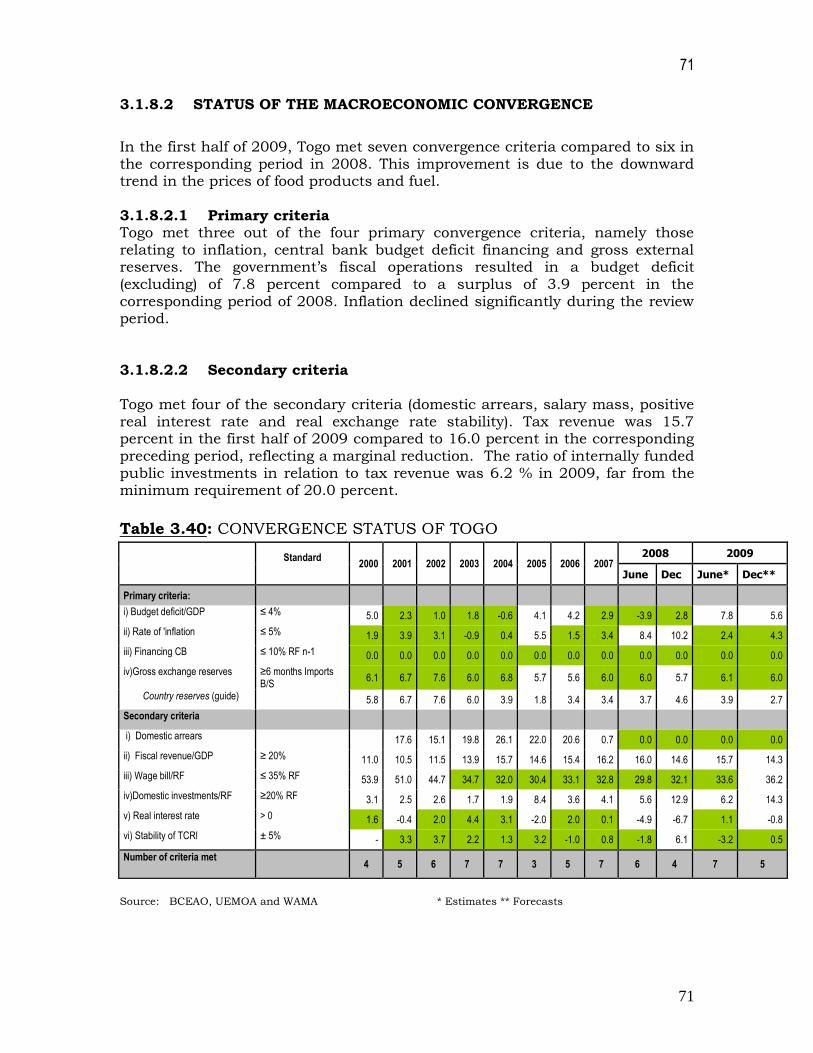
71
71
3.1.8.2 STATUS OF THE MACROECONOMIC CONVERGENCE
In the first half of 2009, Togo met seven convergence criteria compared to six in the corresponding period in 2008. This improvement is due to the downward trend in the prices of food products and fuel. 3.1.8.2.1 Primary criteria Togo met three out of the four primary convergence criteria, namely those relating to inflation, central bank budget deficit financing and gross external reserves. The government’s fiscal operations resulted in a budget deficit (excluding) of 7.8 percent compared to a surplus of 3.9 percent in the corresponding period of 2008. Inflation declined significantly during the review period. 3.1.8.2.2 Secondary criteria Togo met four of the secondary criteria (domestic arrears, salary mass, positive real interest rate and real exchange rate stability). Tax revenue was 15.7 percent in the first half of 2009 compared to 16.0 percent in the corresponding preceding period, reflecting a marginal reduction. The ratio of internally funded public investments in relation to tax revenue was 6.2 % in 2009, far from the minimum requirement of 20.0 percent.
Table 3.40: CONVERGENCE STATUS OF TOGO
Standard
2000 2001 2002 2003 2004 2005 2006 2007
2008 2009
June Dec June* Dec**
Primary criteria:
i) Budget deficit/GDP ≤ 4% 5.0 2.3 1.0 1.8 -0.6 4.1 4.2 2.9 -3.9 2.8 7.8 5.6
ii) Rate of 'inflation ≤ 5% 1.9 3.9 3.1 -0.9 0.4 5.5 1.5 3.4 8.4 10.2 2.4 4.3
iii) Financing CB ≤ 10% RF n-1 0.0 0.0 0.0 0.0 0.0 0.0 0.0 0.0 0.0 0.0 0.0 0.0
iv)Gross exchange reserves ≥6 months Imports B/S
6.1 6.7 7.6 6.0 6.8 5.7 5.6 6.0 6.0 5.7 6.1 6.0
Country reserves (guide) 5.8 6.7 7.6 6.0 3.9 1.8 3.4 3.4 3.7 4.6 3.9 2.7
Secondary criteria
i) Domestic arrears 17.6 15.1 19.8 26.1 22.0 20.6 0.7 0.0 0.0 0.0 0.0
ii) Fiscal revenue/GDP ≥ 20% 11.0 10.5 11.5 13.9 15.7 14.6 15.4 16.2 16.0 14.6 15.7 14.3
iii) Wage bill/RF ≤ 35% RF 53.9 51.0 44.7 34.7 32.0 30.4 33.1 32.8 29.8 32.1 33.6 36.2
iv)Domestic investments/RF ≥20% RF 3.1 2.5 2.6 1.7 1.9 8.4 3.6 4.1 5.6 12.9 6.2 14.3
v) Real interest rate > 0 1.6 -0.4 2.0 4.4 3.1 -2.0 2.0 0.1 -4.9 -6.7 1.1 -0.8
vi) Stability of TCRl ± 5% - 3.3 3.7 2.2 1.3 3.2 -1.0 0.8 -1.8 6.1 -3.2 0.5
Number of criteria met 4 5 6 7 7 3 5 7 6 4 7 5
Source: BCEAO, UEMOA and WAMA * Estimates ** Forecasts

72
72
3.1.8.3 CONCLUSION AND RECOMMENDATIONS
In 2009, the economy of Togo grew by 2.5%, thanks to the positive effects of the satisfactory implementation of a series of economic reforms contained in the PRGF Programme, a major rescheduling of external debt. Togo has made significant advancement in relation to the number of convergence criteria realized. However, the progress made in the review period was marginal. However, Togo has to make efforts to improve fiscal policy Consequently, the following recommendations could be implemented by the Togolese authorities:
1. continuation of structural reforms necessary for the modernization of the
tax mobilization mechanisms, particularly their computer networking in order to increase revenue;
2. continuation of fiscal and customs administration reforms, by taking steps to reduce tax and customs exemptions and increase excise duties on alcohol and cigarettes;
3. adopt appropriate measures with the view of boosting food production in order to reduce dependence on external sources;
4. accelerate the restructuring of public enterprises in the cotton (SOTOCO), phosphate (SNPT) and energy (CEET) sectors to maintain economic growth, improve exports and enhance foreign exchange earning capacity;
3.1.9 Harmonization of policies within UEMOA
With regard to harmonization of policies within UEMOA countries, it should be stressed that during the first six months of 2009, only payment systems have recorded a major change. Aside the success achieved in the harmonization and proper functioning of its payment system, the UEMOA zone continues to consolidate its gains through the adoption of the merger programme for the components of the electronic banking system (GIM and CTMI), with the shift from version 2 to version 3 of the electronic clearing which is currently being test-run and which will facilitate the electronic tracking of cheques according to international standards. A guarantee fund has been set up to address possible weaknesses of certain participants in the payment system. The other challenge facing the monetary authorities of the UEMOA zone is with respect to clearing in real time instead of 24 hours as at now, enhancement of control and supervision to comply with procedures and proper functioning of the system. Raising awareness is the other major challenge in order to make
increasingly popular the use of electronic payment systems instead of cash.
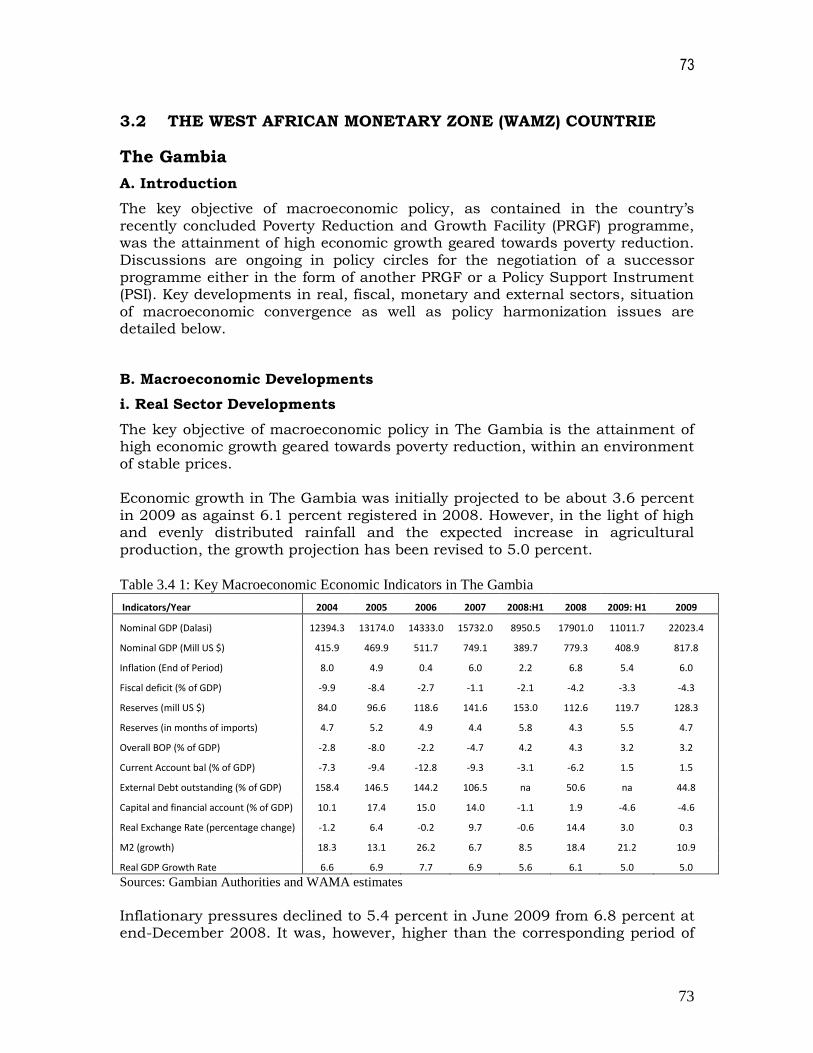
73
73
3.2 THE WEST AFRICAN MONETARY ZONE (WAMZ) COUNTRIE
The Gambia
A. Introduction
The key objective of macroeconomic policy, as contained in the country’s recently concluded Poverty Reduction and Growth Facility (PRGF) programme, was the attainment of high economic growth geared towards poverty reduction. Discussions are ongoing in policy circles for the negotiation of a successor programme either in the form of another PRGF or a Policy Support Instrument (PSI). Key developments in real, fiscal, monetary and external sectors, situation of macroeconomic convergence as well as policy harmonization issues are detailed below.
B. Macroeconomic Developments
i. Real Sector Developments
The key objective of macroeconomic policy in The Gambia is the attainment of high economic growth geared towards poverty reduction, within an environment of stable prices. Economic growth in The Gambia was initially projected to be about 3.6 percent in 2009 as against 6.1 percent registered in 2008. However, in the light of high and evenly distributed rainfall and the expected increase in agricultural production, the growth projection has been revised to 5.0 percent.
Table 3.4 1: Key Macroeconomic Economic Indicators in The Gambia
Indicators/Year 2004 2005 2006 2007 2008:H1 2008 2009: H1 2009
Nominal GDP (Dalasi) 12394.3 13174.0 14333.0 15732.0 8950.5 17901.0 11011.7 22023.4
Nominal GDP (Mill US $) 415.9 469.9 511.7 749.1 389.7 779.3 408.9 817.8
Inflation (End of Period) 8.0 4.9 0.4 6.0 2.2 6.8 5.4 6.0
Fiscal deficit (% of GDP) -9.9 -8.4 -2.7 -1.1 -2.1 -4.2 -3.3 -4.3
Reserves (mill US $) 84.0 96.6 118.6 141.6 153.0 112.6 119.7 128.3
Reserves (in months of imports) 4.7 5.2 4.9 4.4 5.8 4.3 5.5 4.7
Overall BOP (% of GDP) -2.8 -8.0 -2.2 -4.7 4.2 4.3 3.2 3.2
Current Account bal (% of GDP) -7.3 -9.4 -12.8 -9.3 -3.1 -6.2 1.5 1.5
External Debt outstanding (% of GDP) 158.4 146.5 144.2 106.5 na 50.6 na 44.8
Capital and financial account (% of GDP) 10.1 17.4 15.0 14.0 -1.1 1.9 -4.6 -4.6
Real Exchange Rate (percentage change) -1.2 6.4 -0.2 9.7 -0.6 14.4 3.0 0.3
M2 (growth) 18.3 13.1 26.2 6.7 8.5 18.4 21.2 10.9
Real GDP Growth Rate 6.6 6.9 7.7 6.9 5.6 6.1 5.0 5.0
Sources: Gambian Authorities and WAMA estimates
Inflationary pressures declined to 5.4 percent in June 2009 from 6.8 percent at end-December 2008. It was, however, higher than the corresponding period of
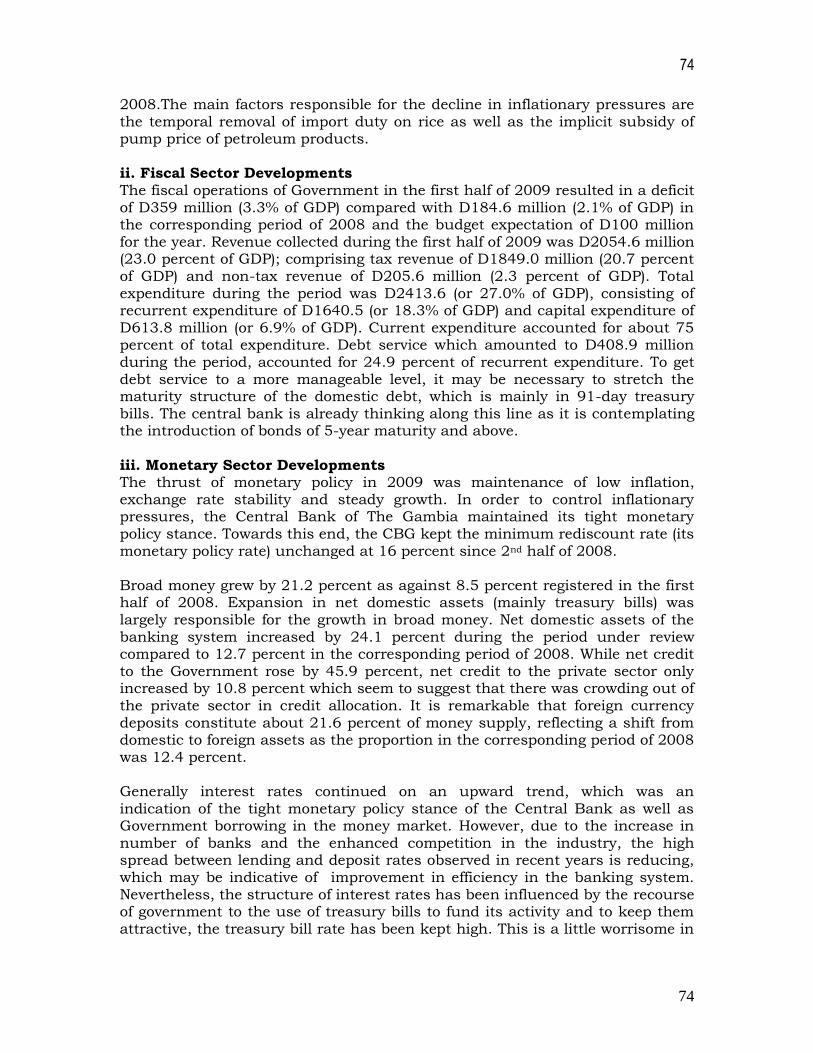
74
74
2008.The main factors responsible for the decline in inflationary pressures are the temporal removal of import duty on rice as well as the implicit subsidy of pump price of petroleum products. ii. Fiscal Sector Developments The fiscal operations of Government in the first half of 2009 resulted in a deficit of D359 million (3.3% of GDP) compared with D184.6 million (2.1% of GDP) in the corresponding period of 2008 and the budget expectation of D100 million for the year. Revenue collected during the first half of 2009 was D2054.6 million (23.0 percent of GDP); comprising tax revenue of D1849.0 million (20.7 percent of GDP) and non-tax revenue of D205.6 million (2.3 percent of GDP). Total expenditure during the period was D2413.6 (or 27.0% of GDP), consisting of recurrent expenditure of D1640.5 (or 18.3% of GDP) and capital expenditure of D613.8 million (or 6.9% of GDP). Current expenditure accounted for about 75 percent of total expenditure. Debt service which amounted to D408.9 million during the period, accounted for 24.9 percent of recurrent expenditure. To get debt service to a more manageable level, it may be necessary to stretch the maturity structure of the domestic debt, which is mainly in 91-day treasury bills. The central bank is already thinking along this line as it is contemplating the introduction of bonds of 5-year maturity and above. iii. Monetary Sector Developments The thrust of monetary policy in 2009 was maintenance of low inflation, exchange rate stability and steady growth. In order to control inflationary pressures, the Central Bank of The Gambia maintained its tight monetary policy stance. Towards this end, the CBG kept the minimum rediscount rate (its monetary policy rate) unchanged at 16 percent since 2nd half of 2008. Broad money grew by 21.2 percent as against 8.5 percent registered in the first half of 2008. Expansion in net domestic assets (mainly treasury bills) was largely responsible for the growth in broad money. Net domestic assets of the banking system increased by 24.1 percent during the period under review compared to 12.7 percent in the corresponding period of 2008. While net credit to the Government rose by 45.9 percent, net credit to the private sector only increased by 10.8 percent which seem to suggest that there was crowding out of the private sector in credit allocation. It is remarkable that foreign currency deposits constitute about 21.6 percent of money supply, reflecting a shift from domestic to foreign assets as the proportion in the corresponding period of 2008 was 12.4 percent. Generally interest rates continued on an upward trend, which was an
indication of the tight monetary policy stance of the Central Bank as well as Government borrowing in the money market. However, due to the increase in number of banks and the enhanced competition in the industry, the high spread between lending and deposit rates observed in recent years is reducing, which may be indicative of improvement in efficiency in the banking system. Nevertheless, the structure of interest rates has been influenced by the recourse of government to the use of treasury bills to fund its activity and to keep them attractive, the treasury bill rate has been kept high. This is a little worrisome in
75
75
view of the fact that inflation has been wrestled to the lower single digit. Furthermore, high treasury bill rate may hamper credit to the private sector. The central bank is also increasing its regulatory and supervisory mechanisms, as it recently opened a credit reference bureau and the Financial Intelligence Unit (FIU). There are serious efforts to provide these units with the requisite human and financial resources to enhance their operations. iv. External Sector Developments The external sector of the economy was affected by the recent developments in the international economy, especially the global economic crisis that led to recession in the industrial countries. Although the country recorded a current account surplus of D163.48 million or 1.5 percent of GDP compared to a deficit of D276.09 million (or -3.1 percent of GDP), the capital and financial account worsened to a deficit of D511.92 million (-4.6 % of GDP) in the first half of 2009 from a deficit of D100 million (-1.1% of GDP). There was a noticeable reduction in the inflow of remittances, foreign direct investment (FDI) as well as tourism-related receipts. For instance, foreign direct investment reduced to D525.45 million in the first half of 2009 from D822.82 million in the corresponding period of 2008 (a 36 percent reduction). As at end June 2009, external debt outstanding stood at USD 366.5 million. This was made up mainly of multilateral debt owed to Bretton Woods institutions as well as the African Development Bank. Overall balance of payments marginally deteriorated to a surplus of D348.45 million (3.2% of GDP) during the period from a surplus of D376.53 (4.2 % of GDP). v. Situation of Macroeconomic Convergence The Gambia met four criteria during the period under review, compared to five in the corresponding period of 2008. This comprised of two primary criteria and two secondary criteria as detailed below. Performance under the Primary Criteria Fiscal deficit, which was 3.3 percent during the first half of 2009, compared to 2.1 percent in the corresponding period of 2008, was within the established benchmark. Inflationary pressures increased from 2.2 in June 2008 to 5.4 percent, thus missing the required target.

76
76
Table 3.42: Status of Convergence in The Gambia Target 2003 2004 2005 2006 2007 2008 2009
June Dec June Dec
Primary Criteria: i) Budget Deficit/GDP ii) Inflation Rate iii) Budget Deficit Financing iv) Gross External Reserves
Secondary Criteria: i) Domestic Arrears ii) Tax Revenue/GDP iii) Salary Mass/Tax Revenue iv) P. Invest/Tax Receipts v) Positive Real Interest Rate vi) Real Exchange Rate
≤4%
≤5 ≤10%
≥6m
=0
≥20% ≤35% ≥20%
≥0 ±5%
-5.2 17.6 63.1 3.1
n/a 13.8 33.3 11.0 -5.1
-28.5
-9.9 8.0 0.0 4.7
n/a 22.4 23.1 14.2 6.8
-1.2
-8.4 1.8 0.0 5.2
n/a 17.2 24.3 4.8 3.2 6.4
-2.7 1.4 0.0 4.9
n/a 18.8 24.2 3.1 3.6
-0.2
-1.1 6.0 0.0 4.4
n/a 19.4 22.3 6.3
-1.0 9.7
-2.1 2.2
27.5 5.8
n/a 18.2 27.6 8.6 1.8
-0.6
-4.2 6.8 0.0 4.3
n/a 17.7 31.2 16.3 -1.8 14.4
-3.3 5.4 0.0 5.5
n/a 16.8 28.7 14.0 -0.4 3.0
-4.3 5.0 0.0 4.7
n/a 15.9 30.2 20.7 0.0 0.3
Total No. Of Criteria Met 1 4 4 6 3 5 2 4 6
Source: WAMA, Central Bank of The Gambia,
Apparently the central bank did not finance the budget deficit during the first half of 2009. However, there are indications that the central bank provided substantial overdraft to the Government during the course of the review period. This is not reflected in the highly aggregated central bank balance sheet and must have been subsumed under other items net. Gross external reserves in terms of months of imports were 5.5 during the review period, compared to 5.8 in the first half of 2008. This could be attributable to the decline in export performance, lower worker remittances and tourism receipts. Performance under the Secondary Criteria Tax revenue performance criterion (tax revenue/GDP) during the period was 16.8, which was slightly lower than that of the corresponding period of 2008(18.2 %), and below the required benchmark. The Gambia needs to deepen its private sector-led development strategy in order to increase its performance on this criterion. Gambia’s performance on the salary mass/tax revenue benchmark was encouraging as the country has consistently met the required maximum target of 35.0 percent in recent years. It was 28.7 percent. However, the level of investments financed from domestic resources remained low by the community standard, at 14.0 percent during the period, despite a significant improvement on the 8.6 percent achieved in the first half of 2008.
There was prevalence of negative real interest rate (-0.4), which is inimical to domestic savings mobilization. With a fluctuation band of ± 5.0 percent, the real exchange rate remained stable during the period under review at 3.0 percent.

77
77
vi. Institutional Arrangements and Policy Harmonisation Issues
a) National Coordinating Committee (NCC) The National coordinating committee in the Gambia has been officially launched and efforts are being made to man the NCC with the required staff. Specifically the processes of recruiting a macroeconomist and a bilingual secretary have been started. b) Payments System Development The settlement system for both retail and large value payments are still manual. Inter-bank money market transactions are carried out with Central Bank payment instruments, thus offering same day value in central bank funds. On average, it takes about three days to clear local cheques while it takes seven days to clear non-urban cheques. At the level of the WAMZ, an AfDB-funded Payments systems development project, with some counterpart contribution, is currently being implemented for The Gambia, Guinea and Sierra Leone. The proposed project involves the improvement of the payment systems of the three countries to a level that would largely be comparable with Ghana and Nigeria.
The selected consultant has already commenced work on the project which is expected to be completed by 2011. Having undertaken preliminary studies and subsequent specification of relevant infrastructure, the national payments system committee is currently awaiting proposals from prospective bidders for supplies of the required equipment and software. Work is also in progress to establish the Gambia National Switch, which is expected to be completed by end of 2009. With the completion of the national switch, it will be possible for customers to use their cards to withdraw money from any ATM. c) Statistical Harmonisation The Gambia is fully compliant with classification of Individual Consumption by Purpose (COICOP) and is progressing from System of National Accounts 1968 to SNA 1993. The country has recently released new GDP estimates covering 2004-2007 in both current and constant prices, using 2004 as base year. Efforts are also ongoing to compile employment data by the end of 2009. The
coverage of the CPI has also been widened to twenty four market (24) outlets distributed all over the country as well as to 207 items in the consumer basket. d) Capital Account Liberalisation, ECOWAS Common External Tariff (CET) and EPAs The Gambia has fully liberalised its capital accounts and has also taken important strides towards implementation of the free movement of goods, and persons and rights of residency as enshrined in ECOWAS protocols.

78
78
By end of 2007, the Gambia largely adopted the ECOWAS Common External Tariff and aligned some tariff lines with the CET. However, the country has still some other tariff lines that require alignment with the ECOWAS Common External Tariff. ECOWAS was to organise a meeting (for negotiation) on the type B list of exemptions that would help finalise alignment with the CET. The Gambia is currently preparing for the negotiation of the products that would be included in the fifth band that will attract a duty of 35 percent with the other ECOWAS countries. e) Conclusion and Recommendations In conclusion, the Gambian economy remained strong despite some key challenges that emanated from the global crisis, and the effects of which are yet to subside. Thus macroeconomic stability, which had been preserved in recent years, deteriorated slightly in first half of 2009, compared to the same period in 2008. The reduction in foreign direct investment may continue to affect the services and construction sectors. In the light of the above developments, the government needs to adhere to the prudent fiscal and monetary policies adopted in recent years in order to sustain the level of economic activity and overall macroeconomic stability. In addition, the real sector lacks adequate infrastructure such as irrigation dams, storage facilities and other inputs to encourage higher production for both domestic consumption as well as for exports, which would boost the foreign exchange earning capacity of the country. It is also necessary for The Gambia to accelerate its policy harmonization measures, particularly, in the area of payments system development and interconnectivity. The following recommendations may be considered: 1) Enhance tax revenue further by introducing value added tax (VAT),
continue to strengthen the tax collection apparatus and widen the tax base;
2) facilitate private sector development by enhancing access to capital and
upgrading infrastructural development in roads, utilities, and telecommunications;
3) make conscious efforts to increase the level of public investments financed
from domestic sources;
4) diversify the production base to address the country’s over-reliance on a
few primary commodity export products;
5) improve foreign exchange earning capacity through exports promotion;
6) develop a workable agreement with the Government of Senegal to facilitate cross-border trade and accelerate implementation of all aspects of the ETLS and CET; and
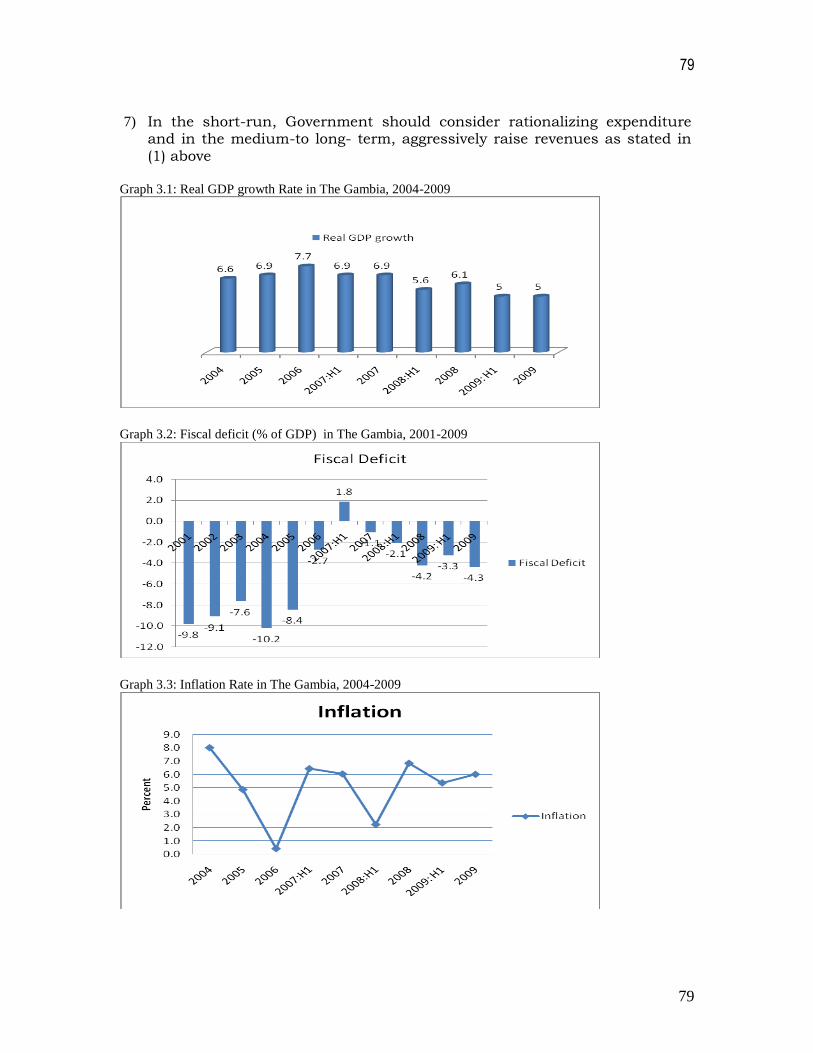
79
79
7) In the short-run, Government should consider rationalizing expenditure
and in the medium-to long- term, aggressively raise revenues as stated in (1) above
Graph 3.1: Real GDP growth Rate in The Gambia, 2004-2009
Graph 3.2: Fiscal deficit (% of GDP) in The Gambia, 2001-2009
Graph 3.3: Inflation Rate in The Gambia, 2004-2009

80
80
Graph 3.4: Current account balance (as % of GDP) in The Gambia, 2004-2009
Table 3.5: Trends in Exchange Rates in The Gambia, 2005-2009
Graph 3.6: Final Consumption in The Gambia, 2004-2008
81
81
GHANA
Introduction
The new government that took power in January 2009 has committed itself to establishing macroeconomic stability whilst sustaining the current momentum in economic growth and development. The government intends to achieve these objectives through effective resource mobilization and proper policy coordination, modernization of agriculture, resuscitation of manufacturing activities and expansion of infrastructure especially in, energy, transport, water and communications. This strategy will be accomplished through fiscal discipline hinged on prudent public expenditure management, strict adherence to public procurement rules, efficient and effective domestic revenue mobilization. Monetary policy will support fiscal policy, focusing on sharply reducing inflationary pressures and stabilizing price and exchange rates.
On the basis of these broad objectives the government proposed the following macroeconomic targets in its 2009 budget statement:
real GDP growth of 5.9 per cent;
average inflation target of 15.3 per cent;
end period inflation of 12.5 per cent;
an overall budget deficit equivalent to 9.4 per cent of GDP;
gross international reserves of more than two months of import cover .
The provisional data show that of Ghana encountered significant challenges in
the first half of 2009 with macroeconomic instability and a slowdown in
economic activity. Ghana experienced a worsening macroeconomic situation
characterised by large fiscal deficits, rising public debt and high inflation. The
inflationary pressures that surged in the preceding year remained strong, with
the end-period inflation reaching 20.7 percent by mid-2009. The exchange rate
fluctuated widely against the major international currencies.3 Interest rates also
trended upwards in the review period, reflecting the increasing inflationary
trends and expectations.
Developments in the Real Sector
Real GDP growth was estimated at 5.9 percent compared to the growth rate of
7.3 percent recorded in the preceding year. The provisional data and analyses
based on the composite economic activity index confirm the slowdown in
economic activity, influenced partly by drops in business and consumer
demand. In real terms, the annualized growth in the index declined by 2.2
percent compared to the growth of 25.6 recorded for the same period in 2008.
Some of the sectors that continue to weigh down on economic activity are
3 The domestic currency (the cedi) depreciated by 18.8%, 15.6% and 12.6% against the pound sterling, US
dollar and euro respectively in the six-month period. It depreciated by 6.3%, 8.8% and 19.1% against these
currencies in the same period of 2008.

82
82
construction, industrial production and tourism. However, external trade
contributed positively to the growth of the index.
Headline inflation accelerated from 18.4 percent at end-2008 to 20.7 percent by
mid-2009, significantly above the 15.3 percent target for the end of the year.
The inflationary pressures were attributed to the rapid depreciation of the
domestic currency and partly to an upward adjustment in the prices of
petroleum products, especially in the second quarter of the year.
The new government intends to emphasize agricultural production. In this
regard, the government has provided financial support to the youth who are in
farming. Other incentives and programmes in this sector include the provision
of subsidies on fertilizer and fuel for fishing as well as other inputs such as
machinery and equipment for planting and harvesting. In addition, the
government has also embarked on extensive programmes relating to the
rehabilitation of irrigation dams and production of rice and maize in some
strategic locations in the country.
Developments in the Fiscal Sector
One of the main objectives of the 2009 budget was to address the excessive spending witnessed in 2008 and bring the economy back on the path of fiscal consolidation. In this regard, fiscal policy sought to improve tax revenue collections by introducing reforms in tax administration and rationalize expenditure management with a view to minimizing unproductive spending. The provisional data show that total domestic revenue in the first half of 2009 was equivalent to 22.3 percent of GDP compared to 23.5 percent in the corresponding period of 2008. Tax revenue represented 89.7 percent of total domestic revenue. Total grants received from the country’s development partners was 5.5 percent of GDP compared to 6.1 percent in the same period of 2008. On the other hand, total expenditure declined in relative terms from 39.4 of GDP in the first half of 2008 to 33.8 percent in the review period. The reduction in total expenditure was mainly attributed to a cut-back in capital expenditure which constituted 28.8 percent of total commitments compared to 32.6 percent in the preceding period. Interest payments and the public sector wage burden, which represented a large proportion of recurrent expenditure, continued to pose a significant challenge to the fiscal authorities.4 Consequently, the government’s financial operations resulted in an overall budget deficit (excluding grants on commitment basis) of 11.7 percent, which showed a relative improvement over the deficit position of 15.8 percent recorded
4 Interest payments represented about 12.4 percent of total expenditure, increasing by 22.2 percent over
outlays made on this item in the first half of 2008. Similarly, the salary mass, which represented 30.4 percent of total outlays, rose by 14.0 percent during the review period.
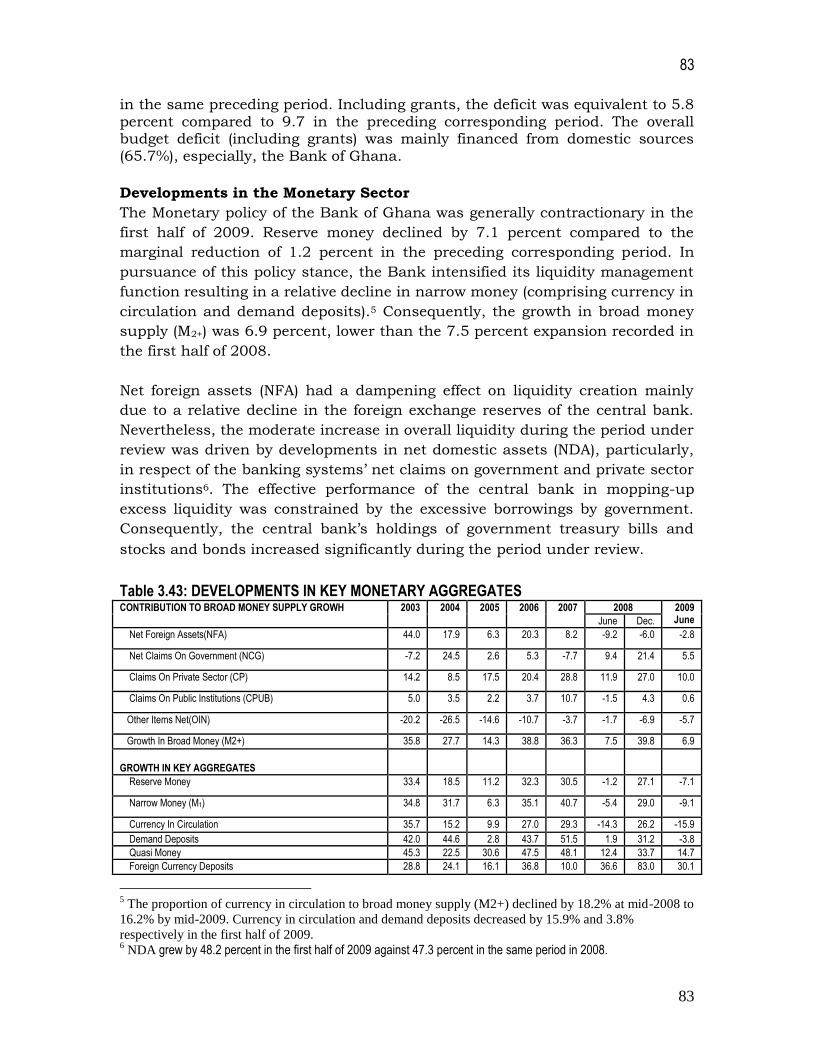
83
83
in the same preceding period. Including grants, the deficit was equivalent to 5.8 percent compared to 9.7 in the preceding corresponding period. The overall budget deficit (including grants) was mainly financed from domestic sources (65.7%), especially, the Bank of Ghana.
Developments in the Monetary Sector
The Monetary policy of the Bank of Ghana was generally contractionary in the
first half of 2009. Reserve money declined by 7.1 percent compared to the
marginal reduction of 1.2 percent in the preceding corresponding period. In
pursuance of this policy stance, the Bank intensified its liquidity management
function resulting in a relative decline in narrow money (comprising currency in
circulation and demand deposits).5 Consequently, the growth in broad money
supply (M2+) was 6.9 percent, lower than the 7.5 percent expansion recorded in
the first half of 2008.
Net foreign assets (NFA) had a dampening effect on liquidity creation mainly
due to a relative decline in the foreign exchange reserves of the central bank.
Nevertheless, the moderate increase in overall liquidity during the period under
review was driven by developments in net domestic assets (NDA), particularly,
in respect of the banking systems’ net claims on government and private sector
institutions6. The effective performance of the central bank in mopping-up
excess liquidity was constrained by the excessive borrowings by government.
Consequently, the central bank’s holdings of government treasury bills and
stocks and bonds increased significantly during the period under review.
Table 3.43: DEVELOPMENTS IN KEY MONETARY AGGREGATES CONTRIBUTION TO BROAD MONEY SUPPLY GROWH 2003 2004 2005 2006 2007 2008 2009
June June Dec.
Net Foreign Assets(NFA) 44.0 17.9 6.3 20.3 8.2 -9.2 -6.0 -2.8
Net Claims On Government (NCG) -7.2 24.5 2.6 5.3 -7.7 9.4 21.4 5.5
Claims On Private Sector (CP) 14.2 8.5 17.5 20.4 28.8 11.9 27.0 10.0
Claims On Public Institutions (CPUB) 5.0 3.5 2.2 3.7 10.7 -1.5 4.3 0.6
Other Items Net(OIN) -20.2 -26.5 -14.6 -10.7 -3.7 -1.7 -6.9 -5.7
Growth In Broad Money (M2+) 35.8 27.7 14.3 38.8 36.3 7.5 39.8 6.9
GROWTH IN KEY AGGREGATES
Reserve Money 33.4 18.5 11.2 32.3 30.5 -1.2 27.1 -7.1
Narrow Money (M1) 34.8 31.7 6.3 35.1 40.7 -5.4 29.0 -9.1
Currency In Circulation 35.7 15.2 9.9 27.0 29.3 -14.3 26.2 -15.9
Demand Deposits 42.0 44.6 2.8 43.7 51.5 1.9 31.2 -3.8
Quasi Money 45.3 22.5 30.6 47.5 48.1 12.4 33.7 14.7
Foreign Currency Deposits 28.8 24.1 16.1 36.8 10.0 36.6 83.0 30.1
5 The proportion of currency in circulation to broad money supply (M2+) declined by 18.2% at mid-2008 to
16.2% by mid-2009. Currency in circulation and demand deposits decreased by 15.9% and 3.8%
respectively in the first half of 2009. 6 NDA grew by 48.2 percent in the first half of 2009 against 47.3 percent in the same period in 2008.
84
84
It was also observed that in spite of the buoyant liquidity creating activities of
the banking system and relative reduction in the currency in circulation
(outside the banking system), demand deposits decreased by 3.8 percent during
the first half of 2009. This follows a slowdown in the growth rate in demand
deposits from 51.5 percent in 2007 to 31.2 percent in 2008, a development that
was attributed to a substitution of local currency denominated demand
deposits for foreign currency deposits owing to apprehensions surrounding the
2008 elections.7 However, the analysis in the review period indicated an
increasing preference for investments by both financial and private sector
institutions (including the general public) in short-term financial assets,
especially, in 91 days and 180 days treasury bills and time deposits. Total
credits to the private sector grew by 43.0 percent even though at a lower rate
than the growth record in the preceding period.
Interest rates trended upwards during the period under review. The prime rate
of the Bank of Ghana increased from 17.0 percent to 18.5 percent. The
discount rate on the 91-day government treasury bills also increased further
from 24.7 percent to 25.8 percent, reflecting an increasing government
borrowing from banking and non-bank private sector. The time deposit rate also
rose by 75.0 basis points to 16.3 percent. Similarly, the interbank rate also
increased from 19.0 percent to 22.5 percent. Nonetheless, the average savings
rate dipped marginally by 20.0 basis points to 8.9 percent whilst the average
lending rate increased by 550.0 basis points to 32.8 percent, thereby,
worsening the already large interest rate spread.
The increasing interest rates, dollarization and substitution of deposits for
short-term financial assets provide downside risks to financial stability. The
risks relate to the possibilities of increasing exposure of the deposit money
banks, depreciation of the domestic currency, capital outflows deteriorating
financial intermediation and an increasing government commitment in respect
of higher interest payments. These are issues that require the immediate
attention of the monetary authorities.
External Sector Developments The pressure in the balance of payments eased marginally during the review period in spite of favourable developments on the current account. Transactions on the external accounts resulted in an overall deficit balance equivalent to 8.2 percent of GDP compared to 8.7 percent in the corresponding period in 2008. The current account deficit improved significantly from 16.1 percent of GDP to 3.8 percent. This improvement was attributed to a moderate increase in exports and a significant reduction in imports. Total exports in the first half of 2009
7 Foreign currency deposits constituted 27.8% of broad money supply (M2+) at mid-2009 compared to
21.8% at mid-2008.

85
85
amounted to US$ 3,056.3 million compared to US$ 2,845.8 million in the same preceding period, representing an increase of 7.4 percent. Both traditional and non traditional exports accounted for this positive development. On the other hand, total imports decreased from US$ 5,000.9 million in the first half of 2008 to US$ 4,002.7 million in the corresponding period of 2009. Non-oil imports, which accounted for 85.7 percent of total imports, also declined by 6.7 percent to US$3,428.6 million. Oil imports declined drastically from US$ 1,326.5 million to US$574.1 million on account of a combination of factors, including, lower prices on the international market, change in the production mix in electricity generation from thermal in favour of hydro as well as a contraction in demand. Private inward remittances during the first half of the year remained high at US$ 4,226.0 million, albeit, the inflows to individuals experienced a downward trend. The balance on the capital account declined in the review period as the net capital transfers totalled US$ 145.4 million compared to US$ 248.2million in the preceding period. In particular, the financial account experienced a net outflow of US$ 194.23 million compared to the net inflow of US$ 596.9 million recorded in the corresponding period in 2008, arising mainly from reversals in portfolio and other investments (net) due to investor apprehensions in connection with the global financial turmoil. Transactions on the balance of payments during the period resulted in a reduction in the stock of external reserves from US$ 2,036.2 million at end-2008 to US$1,705.22 million by mid-2009, representing about 2.4 months of imports cover. The declining foreign exchange reserves impacted adversely on the domestic currency (the cedi), which depreciated by 18.8 percent, 15.6 percent and 12.6 percent against the pound sterling, US dollar and euro respectively during the review period.8 With a debt service payment constituting 3.5 percent of GDP, against the IMF threshold of 25.0 percent the country’s external debt position is sustainable.
STATUS OF CONVERGENCE The review indicated that the country’s performance under the macroeconomic
convergence deteriorated during the first half of 2009. As in 2008, Ghana met
none of the primary convergence and missed the required benchmark on public
investments financed from domestic sources. Thus Ghana met only one target
in respect of the secondary criterion on tax revenue relative to GDP.
Primary Criteria
Although the restraints in fiscal excesses resulted in a relative decline in the budget deficit, it was still high by about 7.7 percentage points above the required maximum benchmark of 4.0 percent. The high inflationary pressures accelerated further. Central Bank financing of government budget deficit was 25.7 percent gross external reserves was 2.4 months of imports cover, below the 6.0 months benchmark.
8 The cedi depreciated by 6.3%, 8.8% and 12.6% against the pound sterling, US dollar and euro in the
corresponding period in 2008.

86
86
Performance under the secondary criteria was also not encouraging as the outcome on the various benchmarks showed divergences from the established benchmarks. Data on the domestic arrears was not available. Nevertheless, a review of the government’s financial operations indicated conscious efforts towards liquidation of the existing arrears as the cash payments exceeded the commitments incurred during the period. Even though the country realized the target on tax revenue relative to GDP, it marked a reduction in returns compared to the performance in the same period in 2008. The public sector wage burden continued to worsen owing to the decline in tax returns. At 17.8 percent of the level of investments was below the 20.0 percent benchmark.
Table 3.44: GHANA: STATUS OF CONVERGENCE target 2003 2004 2005 2006 2007 2008 2009
JUNE DEC JUNE DEC
Primary Criteria: v) Budget Deficit/GDP vi) Inflation Rate vii) Budget Deficit Financing viii) Gross External Reserves
Secondary Criteria: vii) Domestic arrears viii) Tax Revenue/GDP ix) Salary Mass/Tax Revenue x) P. Invest/Tax Revenue xi) Positive Real Interest Rate xii) Real Exchange Rate**
≤4% ≤5%
≤10% ≥6m
=0 ≥20% ≤35% ≥20%
≥0 ±5%
7.7
23 .6 0.0 4.1
n/a 19.3 44.4 18.8
-13.9 0.8
9.5
11.8 1.6 3.7
n/a 22.4 38.9 18.4 -2.3 -1.4
6.9
13.9 0.0 4.0
n/a 20.8 44.4 18.8 -7.5 0.0
12.6 10.9 0.0 3.7
n/a 21.1 53.1 26.5 -6.2 7.1
14.5 12.8 0.0 3.9
n/a 23.7 51.5 27.3
-11.8 1.5
15.8 18.4 33.8 2.9
n/a 21.2 52.7 33.5
-16.4 4.5
19.5 18.4 36.0 2.2
n/a 25.4 53.8 35.8
-16.2 9.1
11.7 20.7 25.7 2.4
n/a 20.4 58.3 17.8
-18.7 5.6
18.0 29.8 15.5 2.3
n/a 23.9 49.5 6.0
-19.8 7.6
Total No. Of Criteria Met 2 3 3 3 4 3 2 1 1
Prospects for the Second Half of 2009 The outlook for the second half of the year appears quite challenging. It is expected that the investments injected into the real sector would help reinvigorate the economy towards a higher than projected growth in output. The data shows that the authorities are on course to realize the 5.9 percent real GDP growth rate projected for the year. In spite of the relative improvement in the management of fiscal policy, the authorities still face a number of challenges. The fiscal position is excessively high and the projections show that the situation would worsen in the second half of the year. The prevailing constraints relate to the high public sector wage burden, increasing interest payments and the liquidation of outstanding arrears arising from commitments made in the preceding year.
Ceteris paribus, the outlook shows that the inflationary pressures observed in the first half of the year may persist during the second half. The consumer price index increased significantly by 15.9 percent in the review period, indicating a projected inflation above 21.0 percent for the year. The relative improvement in fiscal operations in the first half of the year would also facilitate the deceleration process. However, the existence of certain risk factors would pose as major challenges to the authorities. Firstly, inflationary pressures may linger on in the third quarter of 2009 owing to the lagged effects of the fiscal accommodation

87
87
undertaken in the first half of the year. Secondly, uncertainties about the short-term trends in crude oil prices may provide a downside risk to efforts towards price stabilization. Thirdly, the inflationary pressures may be worsened by further depreciation of the domestic currency, to be influenced by two major factors relating to the declining gross external reserves and emerging currency substitution phenomenon. The acute foreign exchange position would ease marginally in the second half of the year owing to the increasing volume of exports and prudent fiscal policies being put in place to minimize the deficit on the current account. However, the constraints on the capital and financial accounts are major issues of concern that need to be addressed as soon as possible. With regard to the convergence criteria, the projections for the second half of the year indicate that performance would continue to be difficult as the country would sustain the secondary criterion on tax revenue. The budget deficit and inflation would remain high on account of the emerging fiscal challenges. Despite an expected easing in the foreign exchange earning capacity, the prevailing constraints in the external sector would not permit realization of the required benchmarks on gross external reserves. Meeting the targets on the wage burden and public investments from domestic sources would also be difficult. STATUS OF INSTITUTIONAL AND POLICY HARMONIZATION ARRANGEMENTS The National Coordinating Committee (NCC) The WAMA surveillance team received confirmation on the establishment of the National Coordinating Committee (NCC) of Ghana under the Chairmanship of the Director of Economic Policy Analysis and Research Division, Ministry of Finance and Economic Planning. In this regard, a bank account has opened into which the ECOWAS Commission remits an annual subvention of USD 7,500.00. In addition, the Chairman has established a Secretariat at the Ministry of Finance and Economic Planning and has received desktop computer equipment and accessories from the ECOWAS Commission. The Chairman is currently making arrangements to recruit a Macroeconomist and a Bilingual Secretary to manage the day-to-day operations of the Secretariat, in accordance with a directive from the ECOWAS Commission.
However, the NCC has not been active since its establishment as it is yet to organize a formal meeting and develop a programme of activities and perform other functions in accordance with in the decision (A.DEC.17/12/01 of 2001) of the Authority of ECOWAS Heads of States and Government. Following discussions with key officials of identifiable members of the Committee, including the Ministry of Foreign Affairs and Regional Integration, the Bank of Ghana and the Ghana, Statistical Service, the institutions concerned have agreed to activate the NCC to enable it play its role effectively under the
88
88
Multilateral Surveillance Mechanism. The Deputy Minister for Foreign Affairs and Regional Integration pledged to support the Ministry of Finance in making the necessary contacts with all the relevant member institutions and make other arrangements to ensure effective functioning of the NCC. Payments System Development Ghana has advanced in its payments system reforms in 2007 and 2008. The country established the Real Time Gross Settlement (RTGS) system and the Securities Settlement System (SSS) to provide platforms for high value and time critical payments. In addition, the Bank of Ghana established the Ghana Interbank Payment & Settlement Systems Limited (GhIPSS) in 2007 as a subsidiary body to manage interbank payments and settlements. The Bank of Ghana also upgraded the MICR clearing technology with the aim of enhancing its efficiency and processing speed. In May 2009, GhIPPS launched a biometric ATM to complement the single point of sale (POS) terminal of the national electronic switch system that was introduced in 2008. This device is intended to enhance interoperability among the service providers as it would allow National switch cardholders to access banking and payment services at any POS owned by any bank or merchant. Following the establishment of the national switch, a lot of POS devices have been rolled out in schools, hospitals, pharmacy shops, restaurants, supermarkets, shops etc to encourage card-based payments and funds transfers. Furthermore, a Central Securities Depository Bill was passed into law (Act 733) during the period under review to provide the legal and regulatory framework for the establishment, operation and regulation of central depositories for the development and promotion of vibrant primary and secondary money and capital markets in Ghana. Work on the Automated Clearing House and Cheque Codeline Clearing and Truncation System (to replace the current cheques clearing system) and are also far advanced. These projects have currently reached the pilot phase with the expectation that they would become fully operational by end-September 2009. When completed, these systems would enable payments systems operators to reduce processing time and shorten the clearing cycle from the current maximum of T+2 to T+1. The systems would also facilitate the exchange of files among the deposit money banks possible for banks for bulk debits and credit payments through an electronic clearing system.
Other on-going projects include the establishment of regional clearing zones, inter-regional settlement links and the collaterization of exposures in clearing banks. Arrangements are also underway to solve certain challenges relating to telecommunication and disaster recovery plan. ECOWAS Trade Liberalization Scheme (ETLS) and Common External Tariff
(CET) Ghana has fully implemented the provisions under the ETLS by 2007 and has fully complied with the protocol on free movement of goods and services.

89
89
However, the main obstacles and challenges facing the country are in respect of the complex rules of origin, cumbersome procedures for industrial goods, ineffective compensation schemes, the continued existence of trade barriers, including unnecessary road blocks other time-consuming border procedures, imposition of packaging and special health requirements and in other ECOWAS countries, unilateral anti-trade decisions by certain ECOWAS countries and the existence of two trade liberalization (the ECOWAS and UEMOA) schemes. With regard to the CET, Ghana has not yet implemented its basic principles required under the scheme. The Authorities are currently engaged in negotiations with the ECOWAS-UEMOA Management Committee on the list of commodities under the Type B Exceptions. The Authorities are also making necessary arrangements to align the Type A Exceptions with the appropriate CET rates, adopt the relevant legal framework and the proposed 5th hand of 35.0 percent and undertake necessary sensitization programmes to facilitate implementation of the CET structure. Statistical Harmonization Ghana is far advanced on the statistical harmonization programme. The country has since 2006 been compliant with the common platform for determination and calculation of the Consumer Price Index (CPI) which is nationwide in coverage and based on a consumer basket comprising 273 commodities. The Statistical Service has also reviewed the weighting methodology using information obtained from the 2006 living standards survey. Following completion of relevant studies, the Statistical Service has changed the base year of the CPI from 1997 to 2004. The Statistical Service is currently engaged in the harmonization of the National Accounts. The COICOP method of classification has been adopted and arrangements are underway to transit from the current SNA 68 method of presentation to SNA 93 by end-2009. Regarding the ECOMAC database, the Statistical Service has updated the CPI, National Accounts and Trade Statistics up to 2007. Furthermore, the Statistical Service intends to develop a database on informal trade. To achieve this objective, a Consultant has been contracted to establish the necessary framework. The absence of an optical fibre creates difficulties in downloading data using telephone system. To address this problem, arrangements are underway to establish a modem to be known as ‘the Ghana Community Network Services’ based on the optical fibre technology. The Statistical Service also faces a few other challenges relating to difficulties in data generation such as: inadequate
data on the activities of certain service providers, poor classification of transactions of items between investment and consumption expenditure, intermediate and final consumption, wholesale and retail trading transactions etc. Arrangements are however are underway to step up training in these areas. The Service also underscored the problem of data coordination among various institutions and expressed the need for a central data collection point.

90
90
Conclusion and Recommendations
The economy of Ghana which had been buoyant in recent years slowed down in
the period under review in line with expectations arising from the global
turmoil. In spite of a relative decline in business and consumer confidence, the
authorities have indicated that the growth rate of 5.9 percent projected for the
year would be realized.
However the government faces significant challenges in stabilizing the economy.
The inflationary pressures that surged in 2008 continued to persist, driven by a
combination of factors including the lagged effects of the recent fiscal excesses,
accommodation of the government’s financial operations by the central bank,
increasing dollarization of the economy and continued depreciation of the
domestic currency. The fiscal dominance constrained the effectiveness of
monetary policy in spite of efforts of the Bank of Ghana in mopping up excess
liquidity. Interest rates trended upwards in the period under review, reflecting
the high inflationary trends and increasing borrowing requirement of
government. In spite of a relative improvement in the current account, the
external sector also experiences some constraints due to inadequate reserves
arising from dwindling foreign exchange inflows, including private remittances
and reversals in portfolio investments.
The macroeconomic difficulties affected the country’s performance on most of
the convergence criteria, especially, on budget deficit, deficit financing,
inflation, gross external reserves, positive real interest rates and real exchange
rate stability. The outlook indicated that the country would continue to grapple
with criteria in the second half of 2009. Nevertheless, the statistical
harmonization programme and ECOWAS Trade Liberalization scheme is
gradually progressing. The authorities need to strengthen the institutional
arrangement, particularly, the NCC, to facilitate speedy realization of relevant
programmes.
It is recommended that the country should implement policies that would sustain aggregate demand in the economy, without engendering excessive fiscal expansion, high inflation rates and external disequilibrium. This underscores the need for a proper policy mix, while the country aspires to attain high growth geared towards poverty reduction in a bid to attain the millennium development goals.
1. Adopt cash-based budgeting and prioritize discretionary expenditure as a
means for controlling expenditure overruns;
2. Encourage investment in long-term foreign denominated financial assets
so as to minimize the spate of reversals in foreign portfolio investments
that would affect the stability of the financial system;
3. Monitor strict compliance with the prudential requirements of the
banking systems in order to forestall a possible build-up in
nonperforming assets of deposit money banks;
91
91
4. Take appropriate steps to reduce the public sector wage bill by
rationalizing the size of the public sector whilst enhancing productivity;
5. The central bank should avoid the accommodation of fiscal deficits by
exploring external financing through grants and concessional borrowings
given the current fiscal space provided by the current sustainable
external debt position;
6. In addition to policy measures outlined in the annual budget statements,
the government of Ghana should draw up a comprehensive short-to-
medium term programme outlining strategies aimed at meeting the
established macroeconomic convergence criteria;
7. The Ministries of Finance and Foreign Affairs and Regional Integration
should ensure effective operationalization of the NCC to facilitate effective
handling of the technical aspects of the Economic and Monetary
Cooperation Programme in Ghana.
GUINEA
For the year 2009, the Government’s macroeconomic policy aims to boost economic activity and maintain price and exchange rate stability in order to achieve poverty reduction targets. However, in view of the impact of the financial crisis which was very pronounced in the mining sector, public finance and the balance of payments as well as wait-and-see attitude resulting from the political transition, the growth target were reviewed significantly downward. GDP is expected grow by 0.7% in real terms against the initial target of 5.0%. In spite of this difficult environment, economic activity was conducted within a context of price stability due particularly to the downward trend in food and fuel prices on the international market, coupled with stringent monetary and budgetary policies which ensured a better stability of the national currency.
1. Major macroeconomic developments
Real Sector In the first half of 2009, economic activities were affected by the wait-and-see attitude resulting from the change in regime and the impact of the international crisis on strategic sectors. In fact, the entire economic programme of the government was based on reaching completion point under the HIPC initiative
on 31st December 2008, which should lead to a substantial reduction of the debt burden. Besides, the mining sector which constitutes the hub of the national economic was adversely affected by the slump in world demand and falling prices of exports. In addition, the running of the country was affected by the change in leadership. In view of the leading role of the State in the orientation of national economic activity, this situation had serious repercussions on the private sector.
92
92
Nevertheless, low domestic demand coupled with the easing of food and fuel prices led to a substantial reduction in inflation. Year-on-year inflation fell from 24.6% in June 2008 to 1.8% in June 2009. The implementation of a stringent monetary policy combined with a rigorous budgetary policy also contributed to the decline in inflation.
Public finances
The execution of the State Budget ended up with a deficit (on a commitment basis and excluding grants) of 0.4% of GDP in the first half
of 2009. Total expenditure, which was 79% of projections, helped in compensating for the shortfall in revenues (12% of below projections). Current expenditures were the most subjected to substantial cutbacks.
The State had to deploy substantial resources to build some infrastructures. Consequently, expenditures funded with internal resources were twice the projections during the first half of the year.
This situation affected the running of some state departments.
Monetary situation
Concerning the monetary situation, M2 aggregate shrunk by 6.4% compared to end December 2008. This reduction in money supply is due to the net effect of a 10.6% drop in net domestic assets and 11.2 %
increase in net foreign assets. The decline in net domestic assets stems from the simultaneous decrease in credit to the State and private sector.
With regard to the firming of net foreign assets, it is attributed to the Central Bank which saw its international reserves grow from $64.07 million to $ 129.50 million. In fact, during the first half, BCRG received
US$71.8 million as tax adjustments revenues from some companies, especially in the mining sector.
External sector
In the first half of the year, the balance of payments recorded a current account deficit of $194.1 million, representing 4.5% of GDP against 4.7 percent in the same period of 2008. Given that the trade balance
recorded a surplus of $US 103.5 million, the deficit was at the level of services and revenues. The current deficit was offset by net capital
inflows to the tune of US$ 230 million. These inflows were mainly due to direct investments in the mining sector. Thanks to this flow of capital, the overall position of the balance of payments recorded a surplus. This
contributed to the replenishment of external assets.
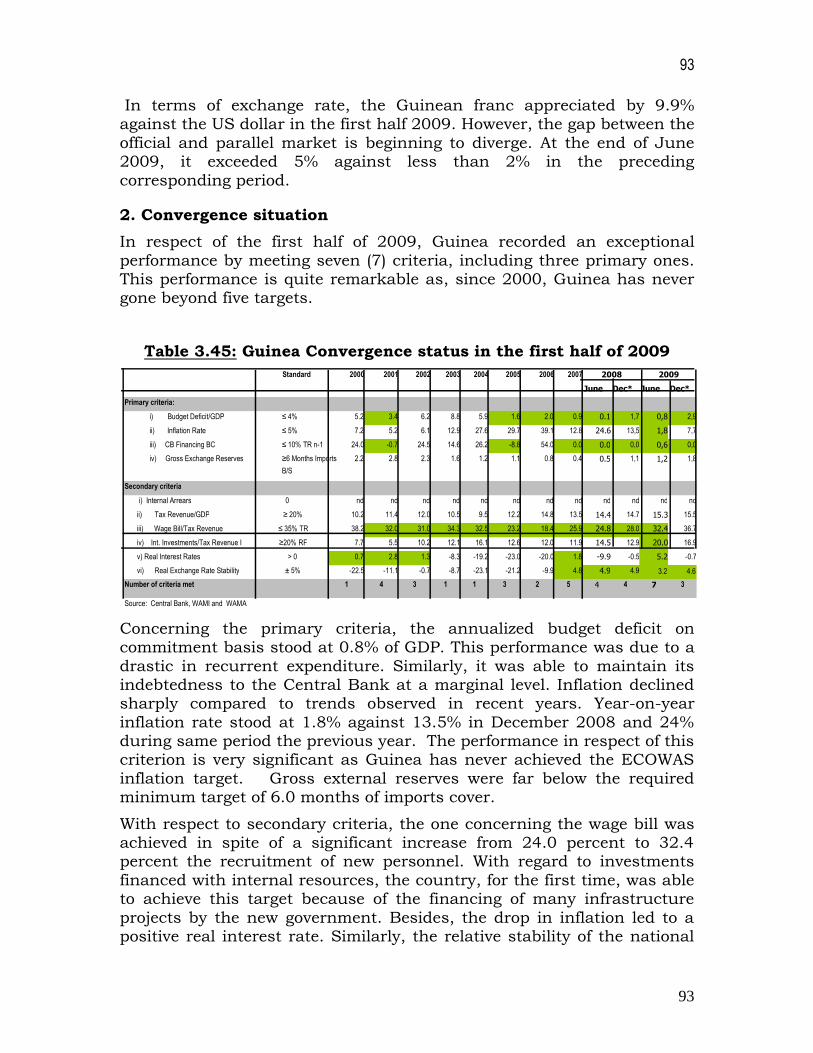
93
93
In terms of exchange rate, the Guinean franc appreciated by 9.9% against the US dollar in the first half 2009. However, the gap between the
official and parallel market is beginning to diverge. At the end of June 2009, it exceeded 5% against less than 2% in the preceding
corresponding period.
2. Convergence situation
In respect of the first half of 2009, Guinea recorded an exceptional
performance by meeting seven (7) criteria, including three primary ones. This performance is quite remarkable as, since 2000, Guinea has never gone beyond five targets.
Table 3.45: Guinea Convergence status in the first half of 2009
Concerning the primary criteria, the annualized budget deficit on commitment basis stood at 0.8% of GDP. This performance was due to a
drastic in recurrent expenditure. Similarly, it was able to maintain its indebtedness to the Central Bank at a marginal level. Inflation declined sharply compared to trends observed in recent years. Year-on-year
inflation rate stood at 1.8% against 13.5% in December 2008 and 24% during same period the previous year. The performance in respect of this criterion is very significant as Guinea has never achieved the ECOWAS
inflation target. Gross external reserves were far below the required minimum target of 6.0 months of imports cover.
With respect to secondary criteria, the one concerning the wage bill was achieved in spite of a significant increase from 24.0 percent to 32.4 percent the recruitment of new personnel. With regard to investments
financed with internal resources, the country, for the first time, was able to achieve this target because of the financing of many infrastructure
projects by the new government. Besides, the drop in inflation led to a positive real interest rate. Similarly, the relative stability of the national
Standard 2005 2006 June Dec* June Dec*
Primary criteria: i) Budget Deficit/GDP ≤ 4% 5.2 3.4 6.2 8.8 5.9 1.6 2.0 0.9 0.1 1,7 0,8 2,9 ii) Inflation Rate ≤ 5% 7.2 5.2 6.1 12.9 27.6 29.7 39.1 12.8 24.6 13,5 1,8 7,7 iii) CB Financing BC ≤ 10% TR n-1 24.0 -0.7 24.5 14.6 26.2 -8.8 54.0 0.0 0.0 0,0 0,6 0,0 iv) Gross Exchange Reserves ≥6 Months Imports
B/S 2.2 2.8 2.3 1.6 1.2 1.1 0.8 0.4 0.5 1,1 1,2 1,8
Secondary criteria i) Internal Arrears 0 nd nd nd nd nd nd nd nd nd nd nd nd
ii) Tax Revenue/GDP ≥ 20% 10.2 11.4 12.0 10.5 9.5 12.2 14.8 13.5 14.4 14.7 15.3 15.5 iii) Wage Bill/Tax Revenue ≤ 35% TR 38.2 32.0 31.0 34.3 32.5 23.2 18.4 25.9 24.8 28.0 32.4 36.7 iv) Int. Investments/Tax Revenue I
≥20% RF 7.7 5.5 10.2 12.1 16.1 12.6 12.0 11.9 14.5 12.9 20.0 16.9 v) Real Interest Rates > 0 0.7 2.8 1.3 -8.3 -19.2 -23.0 -20.0 1.8 -9.9 -0.5 5.2 -0.7 vi) Real Exchange Rate Stability ± 5% -22.5 -11.1 -0.7 -8.7 -23.1 -21.2 -9.9 4.8 4.9 4.9 3.2 4.6
Number of criteria met 1 4 3 1 1 3 2 5 4 4 7 3
Source: Central Bank, WAMI and WAMA
2009 2008 2003 2004 2000 2001 2002 2007

94
94
currency ensured the stability of the real effective exchange rate. On the other hand, compared to the minimum requirement, the tax revenue
relative to GDP remained weak in spite of efforts made in recent years. In spite of some progress made in this area, the absence of an official
budget constitutes an obstacle to the consolidation of this performance.
Despite the positive trends recorded in the first half of the year, the country’s performance could decline at the end of the year given the
assumptions contained in the macroeconomic framework of July 2009. In fact, inflation is expected to be slightly above the target. This would reflect in a slightly negative real interest rate. In addition, the wage bill
would be above the 35% target. In addition, the level of internally funded investments in relation to tax revenue would reduce significantly.
3. Harmonization of policies and institutional arrangements
a- Development of payment systems
The execution of the project initiated by WAMI and financed by ADB is at its operational phase. The tender documents prepared by the consultant
were reviewed recently during a meeting in Accra. The invitation to bid covers the following lots:
1) RTGS and settlement system and delivery of securities ; 2) The automatic clearing house and the automatic processing of
cheques ; 3) Banking application (CBA). 4) Infrastructure and energy
For these first three lots, only one operator would be retained for the
three countries involved in this project namely: Gambia, Guinea and Sierra Leone.
With regard to the fourth lot which covers infrastructure and energy, the tender is local. The terms of reference have been prepared and include: - Upgrading and reconfiguration ;
- Energy and security in computer rooms; - Internet.
All the contracts should be signed before 4th December 2009.
95
95
b- National Coordinating Committee All the regulatory texts for the establishment and functioning of the NCC
have been signed by the Prime Minister in May 2009. The macroeconomist and bilingual secretary have also been recruited. The
premises and equipment are available for the secretariat. The State has also made provision for a budget line for the operations of the NCC.
c- Common External Tariff (CET)
Guinea aligned its tariff with that of UEMOA as far back as July 2005, in
accordance with recommendations by ECOWAS. However, some exceptions were maintained to protect priority sectors such as
agriculture livestock and fisheries. With regard to the ECOWAS CET, discussions are currently going on
products to be covered under the 5th band. Guinea has prepared a provisional list which will be submitted to the ECOWAS Commission
after discussions and amendments by various institutions involved.
d- Community levy
Between January 2004 and July 2009, the National Customs Directorate collected a total amount of Guinean Francs 34.8 billion in respect of community levies. These funds were transferred to the National Treasury
in accordance with national procedures.
e- Free movements of persons and their goods According to estimates, Guinea has a very dynamic trading relation with its neighbouring countries. There are 20 entry points with the six
neighbours. However, the problem is that the bulk of trading activities is conducted through informal channels. The authorities met intimated that the country is observing ECOWAS directives on the free movement
of persons and goods.
For 2008 and the first eight months of 2009, transactions that required application for export and import at the Ministry of Trade were as follows :
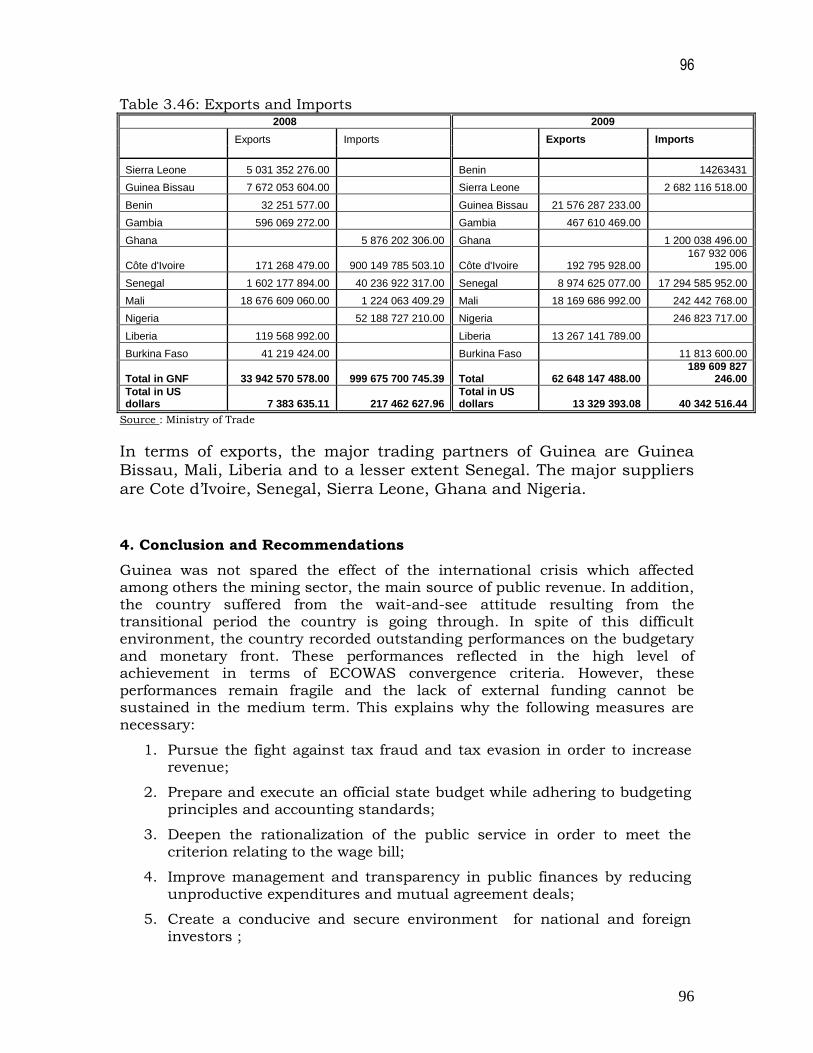
96
96
Table 3.46: Exports and Imports 2008 2009
Exports Imports Exports Imports
Sierra Leone 5 031 352 276.00 Benin 14263431
Guinea Bissau 7 672 053 604.00 Sierra Leone 2 682 116 518.00
Benin 32 251 577.00 Guinea Bissau 21 576 287 233.00
Gambia 596 069 272.00 Gambia 467 610 469.00
Ghana 5 876 202 306.00 Ghana 1 200 038 496.00
Côte d'Ivoire 171 268 479.00 900 149 785 503.10 Côte d'Ivoire 192 795 928.00 167 932 006
195.00
Senegal 1 602 177 894.00 40 236 922 317.00 Senegal 8 974 625 077.00 17 294 585 952.00
Mali 18 676 609 060.00 1 224 063 409.29 Mali 18 169 686 992.00 242 442 768.00
Nigeria 52 188 727 210.00 Nigeria 246 823 717.00
Liberia 119 568 992.00 Liberia 13 267 141 789.00
Burkina Faso 41 219 424.00 Burkina Faso 11 813 600.00
Total in GNF 33 942 570 578.00 999 675 700 745.39 Total 62 648 147 488.00 189 609 827
246.00
Total in US dollars 7 383 635.11 217 462 627.96
Total in US dollars 13 329 393.08 40 342 516.44
Source : Ministry of Trade
In terms of exports, the major trading partners of Guinea are Guinea Bissau, Mali, Liberia and to a lesser extent Senegal. The major suppliers
are Cote d’Ivoire, Senegal, Sierra Leone, Ghana and Nigeria.
4. Conclusion and Recommendations
Guinea was not spared the effect of the international crisis which affected among others the mining sector, the main source of public revenue. In addition, the country suffered from the wait-and-see attitude resulting from the transitional period the country is going through. In spite of this difficult environment, the country recorded outstanding performances on the budgetary and monetary front. These performances reflected in the high level of achievement in terms of ECOWAS convergence criteria. However, these performances remain fragile and the lack of external funding cannot be sustained in the medium term. This explains why the following measures are necessary:
1. Pursue the fight against tax fraud and tax evasion in order to increase revenue;
2. Prepare and execute an official state budget while adhering to budgeting principles and accounting standards;
3. Deepen the rationalization of the public service in order to meet the criterion relating to the wage bill;
4. Improve management and transparency in public finances by reducing unproductive expenditures and mutual agreement deals;
5. Create a conducive and secure environment for national and foreign investors ;
97
97
6. Pursue the policy of readjusting interest rates based on the level of inflation in order to maintain a positive real interest rate;
7. Build capacities in the mining sector in order to derive maximum benefits from the country’s potentials in this sector;
8. Enforce strict regulations on the repatriation of export earnings in order to build up foreign exchange assets;
9. Develop an effective sensitization programme in terms of developing rapid payments systems, an important factor in the promotion of trade;
10. Take necessary steps to organize, in due course, free and transparent elections to ensure the quick return to constitutional order and for that matter the return of donors.
NIGERIA
The thrust of the 2009 Federal Budget is to reduce poverty, develop physical infrastructure (especially in the power and road transportation sectors) and improve the capacity in the non-oil sectors (agriculture and manufacturing) with the aim of contributing to a more sustainable and enduring economic growth. In this regard, the 2009 Federal Budget focuses on enhancing investment in critical physical infrastructure and human capital development. The 2009 Budget is predicated on the following targets, among others:
Oil production of 2.292 million barrels per day (mbpd) (2008b:2.245 mbpd)
Benchmark oil price of US$ 45/barrel (2008b:US$59)
Real GDP growth rate of 8.9 percent (2008b:9.3%
Inflation rate of 8.2 percent (2008b:8.5%) Provisional data indicated that in spite of the global financial turmoil, the Nigerian economy remained buoyant, recording a real GDP growth rate of 5.7 percent in the first half of 2009. The inflationary pressures experienced in 2008 abated considerable, influenced jointly by a contraction in aggregate demand and a relative expansion in output, reflecting the prudent fiscal and effective monetary policy implemented during the review period. Interest rates on short-term deposits continued to trend upwards, reflecting tight liquidity conditions in the financial market. However, depreciation of the domestic currency accelerated due to unfavourable global financial developments, dwindling foreign exchange reserves and an increasing substitution of foreign
currency denominated assets for domestic currency denominated assets.
98
98
Developments in the Real Sector
To enhance output in the real sector, the Federal Government outlined a number of projects in the 2009 Budget for implementation in key sectors of the economy. In agriculture, the government facilitated expansion of the acreage of land under cultivation, increased use of irrigated land and introduced other measures aimed at enhancing the yield in crop and fish production. The government also sought to improve transportation in the hinterlands through construction of new and rehabilitation of existing road networks. Other policy measures concerned the development of the Niger delta, including the enhancement of security, accessibility and provision of relevant skills to the youth. The level of economic activity increased by 5.6 percent during the first half of 2009 compared with the 5.2 percent growth recorded in the corresponding period of 2008. The growth was driven mainly by the non-oil sector which expanded by 7.6 percent. Output in the oil sector dipped by 2.9 percent against the fall of 5.9 percent recorded the first half of 2008. This performance was partly attributed to measures being undertaken by the government to address the socio-economic disturbances in the Niger Delta and partly to higher demand for crude oil exports. At the growth rate of 7.6 percent, performance of the non-oil sector was quite encouraging although it was below the 8.1 percent growth recorded in the same period in 2008. The agricultural sub-sector, which constituted about 40.1 percent of total GDP, remained buoyant with a growth rate of 5.9 percent against 6.0 percent in the preceding period. Wholesale and retail trade also grew by 11.4 percent compared to 10.8 percent. However, the level of activity in the industrial sub-sector, comprising mining and manufacturing slowed down considerably, recording a growth rate of 3.2 percent compared to 8.7 percent in the same period of 2008. Similarly, performance in the building and construction and services sub-sectors recorded declines in economic activity. The sub-optimal performance in the industrial, building and construction and services sectors was due to deficient infrastructural facilities, especially, electricity supplies. Headline inflation dropped consistently throughout the review period from 15.1 percent at December 2008 to 11.2 percent by June 2009. Inflation at mid-2008 was 12.0 percent. Core inflation, comprising all items excluding farm produce and energy, was 9.3 percent whilst the index on food and non-alcoholic beverages rose by 13.0 percent.
Developments in the Fiscal Sector Total revenue for the first half of 2009 was equivalent to 18.1 percent of GDP compared to 32.7 percent in the corresponding period in 2008. This decline in revenue was due to a shortfall in the oil-based revenue arising from disruptions in domestic oil production and the declining crude oil prices. Oil-based revenue contributed about 69.2 percent of total revenue. In line with the oil-based fiscal rule, 60.7 percent of the total revenue was retained to finance the government’s fiscal operations. It should be underscored that the Federal Inland Revenue Service had initiated a number of policy measures aimed at enhancing the level

99
99
of non-oil revenue, including the strengthening of tax enforcement, intensification of recovery in arrears and monitoring mechanisms and computerization of tax operations. On the other hand, total expenditure relative to GDP increased from 12.2 to 13.8 percent, exceeding the 2008 outlays by 18.2 percent. Recurrent expenditure, which constituted 64.8 percent of total expenditure, rose by 14.4 percent above the level incurred in the first half of 2008. Increases in personnel costs and overheads mainly accounted for the expansion in recurrent expenditure. The Government’s fiscal operations in the review period resulted in a notional overall budget deficit of (on commitment basis excluding grants) 2.8 percent compared to the marginal deficit of 1.1 percent recorded in the same period of 2008. This deficit, which was within the target estimated for the first half of the year, was financed from domestic sources (particularly from the non-bank public). Developments in the Monetary Sector The liquidity management operations were anchored on the monetary policy rate, open market operations, reserve requirements as well as interventions in the foreign exchange market. The monetary policy decisions produced the anticipated results as reserve money declined by 16.6 percent in the review period compared to the 27.0 percent growth recorded in the corresponding period of the preceding year. Consequently broad money supply (M²+) decreased by 1.0 percent against the 36.8 percent expansion recorded in the preceding period. The reduction in overall liquidity was driven by a significant decline in net foreign assets of the banking system, which was however softened by liquidity creating activities of the deposit money banks through credits extended to the private sector. In spite of a 7.3 percent increase in the net claims on government, the federal government remained a net creditor to the banking system. The liquidity management operations of the central bank resulted in a reduction in the components of narrow money, especially, in currency with the non-bank public. However quasi-money and foreign currency deposits recorded growth rates of 6.6 percent and 19.0 percent respectively compared to the significant expansions of 34.4 and 43.7 percent recorded in the same period in 2008. Following recent significant increases in foreign currency deposits, the proportion of foreign currency deposits in broad money supply increased consistently from 8.2 percent at end-2007 to 12.1 percent by mid-2009. Even
though the increasing dollarization does not currently raise concerns regarding its possible implications on the economy, it may be necessary for the authorities to monitor this development closely. To help maintain the liquidity position of the banking system, the central bank decreased its monetary policy rate from 9.75 percent to 8.0 percent during the period under review. Developments on the financial market implicated differently on various financial assets and interest rates with a general preference for investments in short-term instruments. The deposit rate on
100
100
short-term instruments (from one-month to over twelve months) rose on an average by 50.0 basis points. On the other hand, the rate on savings, call and seven-days deposits all declined by 75.0, 47.0 and 99.0 basis points respectively. Consequently the spread between the average term deposit and maximum lending rates widened to 10.5 percentage points from 8.0 percentage points in the corresponding half of 2008. Developments in the External Sector The pressures in the external sector accentuated in the review period as the overall surplus balance narrowed considerable from 15.0 percent of GDP in the first half of 2008 to 6.7 percent in the review period. Adverse developments on the current account accounted for this deteriorating performance. The current account balance fell sharply from a surplus of 24.3 percent of GDP to a deficit of 2.1 percent in the first half of 2009. This worsening performance was explained by unfavorable developments on the merchandise trade account induced by a slump in total exports. Oil exports declined by 68.6 percent to USD 14,430.2 million whilst non-oil exports also dropped by 20.9 percent to USD 916.2 million. On the other hand, imports increased by 3.0 percent driven mainly by an increasing demand for non-oil imports. The services account also worsened by 57.3 percent due to services rendered in the domestic economy, especially, in transportation, communication, information technology and financial services. Current transfers to the economy continued its upward trend on account of workers’ remittances which increased by 22.3 percent to USD 11,254.3 million. The capital and financial account turned positive as a result of a significant drawdown in external reserves. Foreign direct investments, portfolio investments and other investments continued to decline, reflecting the impact of the global financial crisis9. The increasing constraints external account resulted in a further decline in the stock of external reserves to USD 43,462.7 million (representing 15.7 months of imports cover) from USD 53,000.4 million at end-2008. The external debt stock as at mid-2009 was USD 3,719.2 million, representing 5.4 percent of GDP. The Naira was under serious pressure during the period under review. It depreciated by 21.5 percent, 10.6 percent against the pound sterling, US dollar and euro respectively. In the corresponding period of 2008, it fluctuated marginally against these currencies.10 The upward pressure on the domestic currency was partly due to the global financial crisis, reflected in the declining trends in foreign exchange inflows and increasing currency substitution.
9 Foreign direct investments declined by 23.9% to USD 1,779.9m, portfolio investment by 46.2% to USD
742.5m and other investments by 61.1% to USD 764.8m.
10
The Naira appreciated 0.8% and 0.1% against the pound sterling and US dollar respectively whilst it
depreciated by 6.5% against the euro.

101
101
Performance under Macroeconomic Convergence
Nigeria has been one of the best performing countries in recent years under the macroeconomic convergence programme. However, the country’s performance deteriorated during the review period as it sustained four targets compared to five in 2008. Performance under the primary and secondary criteria was as follows: Primary Criteria Nigeria met three out of the four primary criteria, namely, those relating to budget deficit, budget deficit financing and gross external reserves. The country has consistently met these targets since 2003. Given the high total revenue, notional nature of the budget deficit and high external reserves, it is likely that Nigeria would continue to meet these targets in the foreseeable future. Even though the inflationary pressures declined, the end-period inflation was still quite high at 11.2 percent, about 6.2 percentage points above the required maximum target of 5.0 percent. Secondary Criteria Performance on the secondary criteria was not very encouraging as the country met the required target on only one criterion (public investment). The domestic arrears criterion could not be assessed due to inadequate data. Tax revenue declined by 6.0 percentage points to 9.0 percent of GDP. The reduction in tax revenue and increase in personnel costs contributed to a further worsening of the salary mass ration from 24.0 percent to 42.5 percent, thus, missing the required maximum target of 35.0 percent. Even with the reduction in revenue base, the level of public investments financed from domestic sources was maintained resulting in an increase in the ration from 20.4 percent to 45.3 percent. Real interest rates remained negative in spite of the decline in inflationary pressures. The country also missed the target on real exchange rate stability. Table 3.47:NIGERIA: STATUS OF MACROECONOMIC CONVERGENCE
Target 2004 2005 2006 2007 2008 2009
June Dec. June Dec. *
Primary Criteria: i) Budget Deficit/GDP ii) Inflation Rate
iii) Budget Deflict Financing iv) Gross External Reserves
Secondary Criteria:
i) Domestic arrears ii) Tax Revenue/GDP iii) Salary Mass/Tax Revenue iv) P. Invest/Tax Receipts
v) Real Interest Rate vi) Real Exchange Rate**
<4% <5
<10% > 6m
=0 >20% >35% >20%
>0 +5%
1.7 10.0
0.0 16.1
n/a 19.8 33.8 18.7
-5.6 2.7
1.3 11.6
0.0 13.1
n/a 17.2 17.9 20.6
-10.1 15.3
0.6 8.5
0.0 15.1
n/a 14.9 19.5 20.0
-6.5 7.3
0.6 6.6
0.0 17.4
n/a 12.0 30.6 30.6
-3.0 -1.9
1.1 12.0
0.0 22.1
n/a 16.0 24.0 20.4
-9.0 -7.2
0.2 15.1
0.0 15.3
n/a 16.0 24.2 24.6
-12.0 10.8
2.8 11.2
0.0 15.7
n/a 9.0 42.5 45.3
-8.4 5.2
0.4 7.7
0.0 14.6
n/a 13.5 24.3 26.4
-4.9 4.6
Total No. of Criteria Met 5 5 5 6 5 5 4 6
Source: CBN; * = Projection
102
102
Prospects for the Second Half of 2009
The 5.7 real GDP growth realized in the first half of the year was below the 8.9 percent outlined in the 2009 budget. However, there are indications that Nigeria would realize this target due to an expected rise in output in agriculture and crude oil production resulting from the government’s huge investment initiatives and efforts towards resolution of the social unrest in the Niger Delta. Sustenance of the prudent fiscal policy and aggressive mopping up of excess liquidity undertaken by the Central Bank of Nigeria would facilitate the containment of inflationary pressures during the second half of the year. The expected increase in agriculture production would spur moderate reduction in the prices of food items. However, the increasing cost of capital and lagged effects of the significant depreciation of the naira experienced in the first half of the year would provide a downside risk to the falling inflation. The prospects of increased foreign exchange inflows arising from increased exports would help ease the constraints in the balance of payments, thereby slowing down rapid depreciation of the domestic currency. In spite of the expected improvement in macroeconomic stability, the projections show that performance under the convergence programme would improve marginally in the second half of the year. The country would sustain its performance on the three primary criteria relating to budget deflect, central bank budget deficit financing and gross external reserves. Ceteris paribus, inflationary pressure would decline to single digit, although the end-period inflation would still be above the required maximum benchmark of 5.0 percent. Nigeria would still have to grapple with its performance on the secondary criteria. However, the country may realize the criterion on real exchange rate stability, given the expectations of a more stable currency, lower inflation and improving external trade conditions.
INSTITUTIONAL AND POLICY HARMONIZATION ISSUES National Coordinating Committee The National Coordinating Committee has not been active in Nigeria as no meetings were organized during the first half of the year. Officials of the Federal Ministry of Finance in Abuja indicated that necessary procedures had been initiated towards the recruitment of a Macroeconomist and a Bilingual Secretary to run the NCC Secretariat, which is located in the ministry. The WAMA team urged officials of the Federal Ministry of Foreign Affairs and Regional Integration to organize the relevant institutions to ensure effective functioning of the NCC in Nigeria. Payments System Development The National Payments Systems Development Programme (Vision 2020) initiated in 2007 progressed steadily in the first half of 2009. The central bank operationalized the automated clearing system in the Kano area. The authorities also approved the guidelines on transaction switching and regulatory framework of mobile payments services in Nigeria. In addition, the Bank rolled out the integrated personnel payroll information system following

103
103
the successful pilot-run in 2008. This system affords the payment of salaries and other contractual obligations electronically. Indeed, the Bank had directed that salaries of civil servants and payments to contractors should be done electronically. Statistical Harmonization The statistical harmonization programme is advancing steadily. Nigeria has since 2006 adopted the classification of individual consumption by purpose (COICOP) nomenclature. Determination of the consumer price index (CPI) covers the whole country with price collections outlets spread throughout the rural and urban areas. The National Bureau of Statistics is currently reviewing the weights of items in the consumer basket and plans to re-base the index using the result of the 2003/4 Living Standards Survey. Regarding the presentation of National Accounts, Nigeria has adopted the SNA 93 methodology and is currently working on the 2007 GDP data update using the new format. The Bureau also produces quarterly GDP data. ECOWAS Trade Liberalization Scheme (ETLS), Common External Tariff (CET) and Economic Partnership Agreement (EPA) The ETLS is advancing steadily in Nigeria. The authorities initiated an agenda to reduce the number of authorized road blocks to one-stop checkpoints for immigration, customs and security inspection along each of the country’s entry routes. Completion of this agenda would facilitate the free movement of goods across the country’s borders. The Nigeria Customs Service has also launched a programme aimed at modernizing customs clearance procedures at the border posts and ports.11 To enhance cooperation among ECOWAS member countries, the authorities at the Federal Ministry of Commerce and Industry called for the creation of a forum to discuss pertinent issues on the ETLS. Furthermore, the authorities called for relocation of the ETLS schedule from the Federal Ministry of Foreign Affairs to the Ministry of Commerce and Industry to ensure effective coordination and implementation. Concerning the common external tariff, Nigeria has adopted the ECOWAS four-band structure (0.0% for basic social goods, 5.0% for raw materials, capital goods and specific imports, 10.0% for intermediate goods and 20.0% for final consumer goods). Following the conclusion of relevant studies, the country proposed a 5th band of 35.0 percent for certain commodities. The authorities are negotiating with the ECOWAS Commission for all member countries to realign their tariff lines to this five-band nomenclature. Negotiations are also underway to harmonize the country’s classification with that recommended by ECOWAS. In achieving this objective, the authorities intends to synchronize
the trade and tariff regimes and achieve policy coherence by ensuring that the CET structure reflects the product classifications, especially, the sensitive products. The officials in the Ministry of Commerce and Industry also indicated that they were reviewing the contents of the EU-ECOWAS Economic Partnership
11
To do away with delays associated with delays associated with the ASYCUDA 2.7 software, the service
has migrated to the current ASYCUDA 3.0 version which is relatively more efficient.

104
104
Agreement to determine the desirability of entering into the trade agreements. Whilst undertaking to abide by a regional agreement, they called on ECOWAS countries to address supply-side constraints before encouraging trade with the EU in order to enhance their capacity to trade on equal terms and control any possible adverse impact on the unemployment level in member countries. Conclusions and Recommendations Given her reliance on crude oil, Nigeria experienced a downturn in its revenue reflecting a reduction in output and a lower crude oil price. Nevertheless, fiscal policy remained prudent, allowing compliance with a fiscal rule aimed at stabilizing aggregate demand. Monetary policy was effective during the period, contributing to a slowdown in inflationary pressures. However, emerging phenomena relating to substantial depreciation of the domestic currency, rising cost of capital and an increasing currency substitution provide downside risks to the declining inflationary trends. Negative interest rates persisted during the period under review, providing further risks to financial intermediation and the government’s investment drive. In light of the above observations, the following recommendations are relevant: 1. Nigeria should expedite action in developing alternative tradable commodities for exports in order to diversify the sources of the country’s foreign exchange earnings, in line with the Vision 2020 document; 2. Nigeria should step up infrastructure development, especially, electricity so as to facilitate activities in the real sector, especially in mining, service and manufacturing; 3. Nigeria should ensure effective functioning of the National Coordinating Committee to help strengthen the multilateral surveillance mechanism; 4. Nigeria should show commitment to the economic and monetary cooperation programme by developing a medium-term programme aimed at meeting the prescribed macroeconomic convergence criteria and compliance, agreed protocols and policy harmonization initiatives; and 5. The Central Bank of Nigeria should ensure the maintenance of adequate
liquidity in the financial system so as to moderate the increasing cost of capital.
SIERRA LEONE
Introduction
The government projected the following targets for 2009: a decline in the real
GDP growth rate to about 4.0 percent, a reduction in inflation from 12.2
percent to 9.0 percent, a rise in current account deficit to 12.3 percent of GDP.
An analysis of the available data and information indicates that the economic
performance in the first half of 2009 was quite encouraging given the
unfavourable global crises. Output was estimated to grow by about 5.1 percent,

105
105
above the projected growth rate of 4.0 percent but below the 5.6 percent growth
rate recorded in 2008. Inflationary pressures moderated at 7.8 percent in June
2009 from 12.3 percent in December 2008. However, the domestic currency
experienced depreciated against some of the major international currencies.
Interest rate generally trended downwards with the exception of the government
91 day Treasury bills discount rate.
Developments in the Real Sector
It is expected that the estimated growth of 5.1 percent in output would be
driven by activities in the agricultural and services sectors. During the review
period, the government provided incentives to farmers in the hinterland through
the provision of tractors, power tillers, high-yielding seedlings and extension
services. The government also invested in the services sector, especially, in
trade, tourism, transport, communication, finance, real estate, education and
health.
The available data from the agriculture sector shows that the output of cocoa
and coffee in the period January-April 2009 was 7,734.0 metric tons, showing a
39.4 percent increase in output over that recorded in the same period in 2008.
However, the mining sector underperformed due to suspension of operations of
the major mining company (Koidu holdings) and a collapse of a dredge at the
Sierra Rutile Mines. Diamond production in the first half of the year declined by
4.3 percent to 199,000.0 carats. Similar reductions in output were also
recorded in the production of gold, bauxite and rutile.
Developments in the manufacturing sector was mixed as the output of some
commodities increased (cement and paint) on account of increased building and
construction activities whilst others (beverages) decreased due to falling
domestic demand for these commodities amidst an increasing competition from
imported brands.
Inflation declined from 12.3 percent at end-2008 to a minimum level of 5.4
percent in April, but resurged moderately to 7.8 percent by mid-2009. At mid-
2008, the level of headline inflation was 16.6 percent. The relative moderation
in inflationary pressures was partly attributed to the declining prices in global
food and petroleum products. However the resurgence experienced during the
months of May and June 2009 was driven by the depreciation of the domestic
currency (the leone) against the major international currencies. It should be
underscored that the aggressive open market operation conducted by the Bank
of Sierra Leone during the period under review also helped to contain the
inflationary pressures.
106
106
Developments in the Fiscal Sector
Fiscal policy remained a major challenge to the authorities during the first half
of 2009 even though the outturn showed a relative improvement. The
government’s financial operations resulted in a budget deficit (commitment
basis excluding grants) of 5.6 percent of GDP compared 8.0 percent in the same
preceding period12. This deficit was mainly financed from domestic sources
(especially by the Bank of Sierra Leone) and non-bank borrowings as well as
from external sources (drawdown on loans).
In comparative terms, total domestic revenue, which constituted about 87.0
percent of total domestic revenue, improved from 9.8 percent of GDP to 12.2
percent. Total tax revenue increased by 10.8 percent whilst non-tax revenue
(composed mainly of administrative charges and duties) declined by 4.5
percent. On the other hand, total expenditure was 17.8 percent of GDP
compared to 15.8 percent in the corresponding preceding period. Thus, the
relative improvement in fiscal policy was mainly due to a cut-back in capital
expenditure which accounted for 17.1 percent of total expenditure during the
review period compared to 23.7 percent in the same period of 2008. The
authorities received grants totalling Le.134, 392.0 million in the half of 2009,
which was about 65.9 percent higher than the amount received during the
corresponding period in 2008. With the exception of interest payments and
other unspecified expenditure13, all the other recurrent expenditure items
increased, resulting in a net increase of 0.5 percent over the corresponding
period of 2008.
Developments in the Monetary Sector
Difficulties in fiscal policy during the review period provided significant
challenges to monetary policy implementation as the Bank of Sierra Leone (BSL)
had to accommodate the government’s fiscal operations, occasioned by delays
in the disbursement of programmed donor budgetary support. Nevertheless the
central bank dealt with the challenge by undertaking an aggressive mopping-up
through its open market operations. To help strengthen liquidity management,
the BSL introduced repurchase and reverse repurchase agreements (REPOS) as
a way of enhancing its control on the reserve structure of the banking system.
Consequently, reserve money (the operating target of the central bank)
contracted by 1.4 percent compared to the growth rate of 1.7 percent recorded
in the corresponding period of 2008. Broad money supply (M2+) grew marginally
by 1.5 percent. As in the preceding year, the growth in liquidity was driven by
credits extended by the deposit money banks to the private sector, which
contributed about 6.3 percent. As in the preceding year, developments in Net
12
Including grants, the budget deficit was 1.7% compared to 5.6% in the first half of 2008. 13
interest payments and other unspecified expenditure declined by 35.9% and 4.9% respectively.
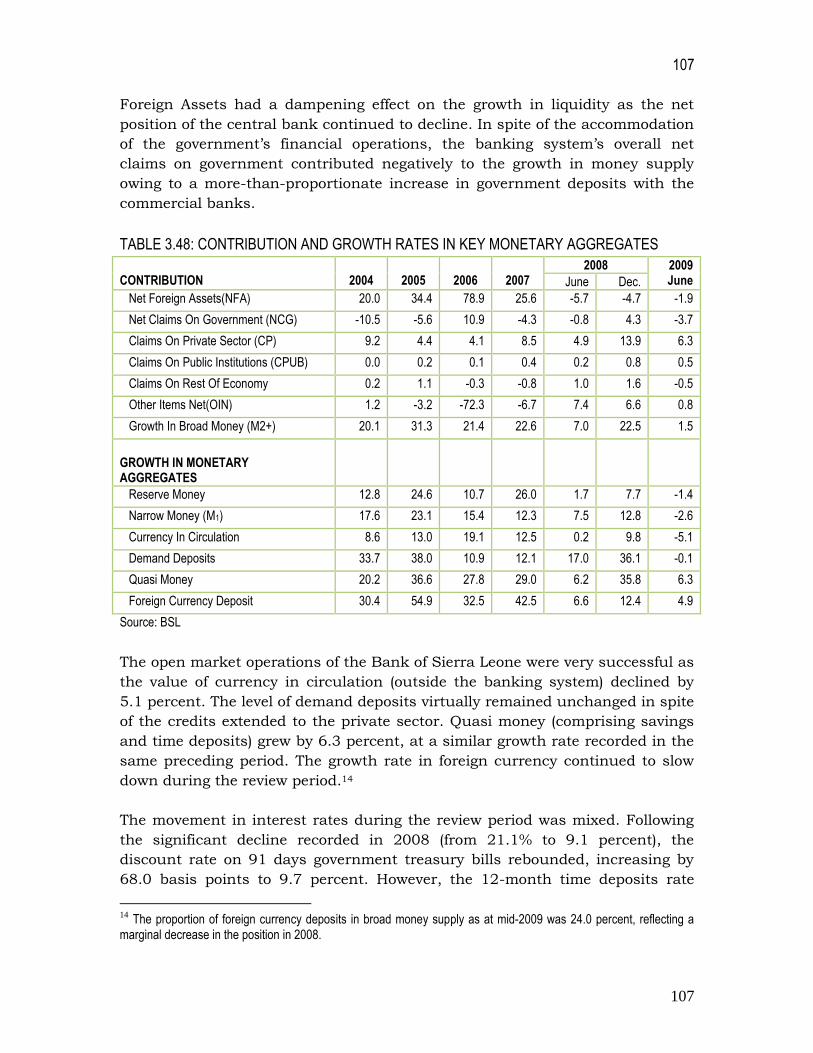
107
107
Foreign Assets had a dampening effect on the growth in liquidity as the net
position of the central bank continued to decline. In spite of the accommodation
of the government’s financial operations, the banking system’s overall net
claims on government contributed negatively to the growth in money supply
owing to a more-than-proportionate increase in government deposits with the
commercial banks.
TABLE 3.48: CONTRIBUTION AND GROWTH RATES IN KEY MONETARY AGGREGATES
CONTRIBUTION
2004
2005
2006
2007
2008 2009 June June Dec.
Net Foreign Assets(NFA) 20.0 34.4 78.9 25.6 -5.7 -4.7 -1.9
Net Claims On Government (NCG) -10.5 -5.6 10.9 -4.3 -0.8 4.3 -3.7
Claims On Private Sector (CP) 9.2 4.4 4.1 8.5 4.9 13.9 6.3
Claims On Public Institutions (CPUB) 0.0 0.2 0.1 0.4 0.2 0.8 0.5
Claims On Rest Of Economy 0.2 1.1 -0.3 -0.8 1.0 1.6 -0.5
Other Items Net(OIN) 1.2 -3.2 -72.3 -6.7 7.4 6.6 0.8
Growth In Broad Money (M2+) 20.1 31.3 21.4 22.6 7.0 22.5 1.5
GROWTH IN MONETARY AGGREGATES
Reserve Money 12.8 24.6 10.7 26.0 1.7 7.7 -1.4
Narrow Money (M1) 17.6 23.1 15.4 12.3 7.5 12.8 -2.6
Currency In Circulation 8.6 13.0 19.1 12.5 0.2 9.8 -5.1
Demand Deposits 33.7 38.0 10.9 12.1 17.0 36.1 -0.1
Quasi Money 20.2 36.6 27.8 29.0 6.2 35.8 6.3
Foreign Currency Deposit 30.4 54.9 32.5 42.5 6.6 12.4 4.9
Source: BSL
The open market operations of the Bank of Sierra Leone were very successful as
the value of currency in circulation (outside the banking system) declined by
5.1 percent. The level of demand deposits virtually remained unchanged in spite
of the credits extended to the private sector. Quasi money (comprising savings
and time deposits) grew by 6.3 percent, at a similar growth rate recorded in the
same preceding period. The growth rate in foreign currency continued to slow
down during the review period.14
The movement in interest rates during the review period was mixed. Following
the significant decline recorded in 2008 (from 21.1% to 9.1 percent), the
discount rate on 91 days government treasury bills rebounded, increasing by
68.0 basis points to 9.7 percent. However, the 12-month time deposits rate
14
The proportion of foreign currency deposits in broad money supply as at mid-2009 was 24.0 percent, reflecting a marginal decrease in the position in 2008.

108
108
inched downwards from 12.0 percent to 11.2 percent. Similarly, the average
savings and lending rates trended downwards. The average savings rate dipped
marginally by 25.0 basis points to 6.3 percent whilst the average lending rate
decreased by 400.0 basis points to 23.0 percent, thus, narrowing the large
spread between the savings and lending rates.
Developments in the External Sector
The provisional estimates for the first half of 2009 indicate that the balance of
payments continues to experience significant deteriorated. The overall deficit
has been estimated at 7.1 percent compared to 0.1 percent in the preceding
period. It has also been estimated that the current account deficit increased to
13.3 percent of GDP from 11.6 percent. The deterioration in the current
account is attributable to adverse developments on the trade account due to a
26.5 percent reduction in exports, particularly, in respect of diamonds, rutile
and bauxite. The mining sector, which serves as the major export base for the
country, faces certain problems relating to domestic administrative and
operational problems and dwindling demand for the country’s export
commodities. However, the imports bill eased moderately owing to the fall in the
prices of petroleum products. The income and transfers accounts are also
experiencing net foreign exchange outflows in investment income and private
remittances. Shortfalls in foreign direct investment, grants and net capital
transfers are also having an adverse impact on the capital and financial
accounts.
The development in the balance of payments during the period under review
contributed to a depreciation of the domestic currency against the some of the
major international currencies, especially, the pound sterling and US dollar and
a net foreign exchange outflow15. Gross external reserves decreased from USD
209.5 million (4.2 months of imports cover) at end 2008 to USD 204.6 million
(3.7 months of imports cover) at mid-2009.
STATUS OF MACROECONOMIC CONVERGENCE
The performance of Sierra Leone under the macroeconomic convergence
programme remained poor as the country met only the secondary criterion on
real exchange rate stability. The country improved its performance on certain
criteria whilst others deteriorated.
15
The currency depreciated by 18.6 percent against the pound sterling compared with an appreciation of 3.4 percent in the preceding period. Against the US dollar, it depreciated moderately by 6.5 percent whilst it remained stable against the euro with a marginal depreciation of 1.0 percent.
15 The domestic currency
had depreciated by 2.1% against the US dollar and appreciated by 1.3% and 39.4 percent against the pound sterling respectively in 2008.

109
109
Primary Criteria
Thus, Sierra Leone met none of the primary convergence criteria in the first half
of 2009. Fiscal operations in 2008 resulted in a budget deficit (on commitment
basis excluding grants) of 5.6 percent, indicating an improvement compared to
the performance recorded in the corresponding period of 2008. The
contractionary monetary policy yielded dividends as the end-period headline
inflation declined further from 12.3 percent to 7.8 percent. The Bank of Sierra
Leone accommodated 12.4 percent of the government’s fiscal operations, due to
delays in the disbursement of budgetary support from the country’s
development partners in the period under review.16 The level of gross external
reserves, measured in number of months of imports cover, experienced a
downward pressure on account of net foreign exchange outflows arising from an
increasing imports bill and declining exports and remittances.
Table 3.49: SIERRA LEONE: STATUS OF CONVERGENCE target 2003 2004 2005 2006 2007 2008 2009*
June Dec June Dec
Primary Criteria: Budget Deficit/GDP Inflation Rate Budget Deficit Financing Gross External Reserves
Secondary Criteria: Domestic Arrears Tax Revenue/GDP Salary Mass/Tax Revenue P. Invest/Tax Receipts Positive Real Interest Rate Real Exchange Rate**
≤4%
≤5 ≤10%
≥6m
=0
≥20% ≤35% ≥20%
≥0 ±5%
9.3
11.3 26.4 2.0
n/a 8.3
56.0 11.3 -7.3
-20.0
8.6
14.4 0.0 3.3
n/a 8.3
65.5 8.2
-8.4 -10.6
9.6
13.1 0.0 4.5
n/a 8.2
61.6 7.9
-7.6 -11.5
8.5 8.3
13.3 4.9
n/a 8.5
61.6 10.6 -1.8 6.2
5.0
13.8 0.8 4.7
n/a 7.8
60.9 9.1
-8.3 1.2
8.0
16.6 0.0 4.0
n/a 8.3
57.6 15.8
-12.6 8.0
7.0
12.3 1.1 4.2
n/a 8.7
56.4 13.2 -9.2 7.9
5.6 7.8
12.4 3.7
n/a 8.9
61.3 8.0
-4.3 3.0
8.1
10.0 0.5 4.6
n/a 8.3
52.9 11.8 -9.5 0.5
Total No. Of Criteria Met 0 1 1 0 2 1 1 1 2
Source: BSL * projections
Secondary Criteria
Performance on the secondary criteria was also not encouraging as the
achievement on all the prescribed benchmarks was below expectation. The
country’s performance on domestic arrears was not assessed due to inadequate
data.17 Tax revenue improved marginally, although the volume relative to GDP
stills remained relatively low, hovering below 10.0 percent. The wage burden
continues to be a challenge for the fiscal authorities, with the position
worsening further from 57.6 percent of tax revenue at mid-2008 to 61.3
percent. Contrary to expectation, the level of public investments financed from
domestic sources represented 8.0 percent of total tax revenue, which compared
unfavourably with the 15.9 percent recorded in the corresponding period of the
16
It is the policy of the central bank to convert outstanding claims on government into securities at the end
of every year. 17
This criterion requires the prohibition of new arrears and the liquidation of existing ones. it is expected that the Ministry of Finance and Development would provide the relevant data in subsequent periods.
110
110
preceding year. As usual, real interest rates, measured as the difference
between the minimum savings rate and inflation, remained negative, much
against the requirement for positive real interest rates. With a fluctuation band
of ±5.0 percent, the real exchange rate of the domestic currency (measured by
movements in real effective exchange rate) was stable.
Prospects for the second half of 2009
According to the authorities, the estimated growth of 5.1 percent would be
driven by the agriculture and mining sectors. However, the authorities would
face challenges in maintaining macroeconomic stability (particularly, inflation,
exchange rate depreciation and interest rates), which are likely to dampen the
growth prospects. The inflationary pressures that rebounded in April 2009 may
intensify towards the end of the year owing to the increasing domestic aggregate
demand and accelerated depreciation of the domestic currency. Although the
government made frantic efforts aimed at enhancing foreign exchange earnings,
the possibility of pessimistic business expectations may impact negatively on
the stability of the domestic currency. With the 91 days treasury bills being the
main financial asset in the financial market, an expected increase in the
discount rate arising from the increasing government borrowing requirement
may lead to increases in interest rates, especially, the lending rates of the
domestic money banks. This raises further concerns, for the probability of high
interest rates may provide downside risks to the growth prospects.
With regards to the convergence criteria, the analysis shows that the
performance of Sierra Leone would not improve significantly in the second half
of the year, although the country may realize the primary criterion on central
bank budget deficit financing in addition to that on real exchange rate stability.
The budget deficit is expected to be high at 8.1 percent in spite of a
programmed reduction in capital expenditure. The projection shows that
inflation will increase further to about 10.0 percent by end-2009. Exogenous
developments relating to an expected disbursement of donor funds and
securitization of credits extended to government would enable the country to
meet the target on central bank budget deficit financing. Everything being
equal, the foreign exchange reserves would increase moderately following an
expected resolution of the administrative and operational problems in the
mining sector and subsequent resumption of the export of diamonds and other
primary commodities. The tax revenue returns would remain low owing to the
undue dependence on direct taxation mechanisms. As a result of the weak tax
revenue base, the country’s performance on the wage burden and public
investments from domestic sources would still be issues of concern requiring
urgent attention. The projections further show that real interest rates would
remain negative, the persistence of which raises concerns about the continued
effectiveness of the financial intermediation function of the banking system.

111
111
STATUS OF POLICY HARMONIZATION INITIATIVES
Statistical Harmonization
Following the successful migration of Sierra Leone to the standard classification
of individual consumption by purpose (COICOP) in 2007 (with the adoption of a
revised base year of 2003), Sierra leone devoted the period 2008 and first half of
2009 to improvements in the quality of statistical data. To this end, the CPI
coverage, which had hitherto concentrated on four main urban centres
(Freetown, Bo, Kenema and Makeni), was extended to cover the Kono District.
These five urban centres constitute 80.0 percent of urban household
consumption in Sierra Leone. With adequate capacity, Statistics Sierra leone,
intends to extend coverage to the entire country. Currently, the authorities are
considering harmonization of the methodology with the ECOWAS standard,
which would involve the use of the PRIMA software. In this regard, responsible
officials are receiving the requisite training through courses and attachments in
other countries. Furthermore, the authorities intend to develop a harmonized
national CPI index, in conformity with the methodology suggested by the
ECOWAS Commission. Other projects relate to the enlargement of the CPI
basket from the current 251 commodities to about 400 items.
With regard to harmonization of GDP presentation, Sierra Leone has adopted
the ECOWAS platform based on SNA 93. To help improve the quality of
statistics further, Statistics Sierra Leone intends to improve data
administration, introduce producer price index in 2008 and consider the
possibility of getting information on certain transactions which had hitherto not
been recorded (informal sector transactions). Currently an integrated household
survey is being conducted to collect relevant data on informal economic
activities in order to facilitate expansion of the database for accurate GDP
determination and recording.
The authorities have made significant progress in the installation of the
ASYCUDA software to complement the EUROTRACE software facility. The
authorities are also exploring the possibility of centralizing the production of
trade statistics. Currently, the National Revenue Authority, Ministry of Trade,
Bank of Sierra Leone and Statistics Sierra Leone share the responsibility for the
production of statistics in this area. Negotiations aimed at harmonizing the
relevant methodologies have already commenced. Consequently, the
management of the Statistical office are sourcing funds from donor agencies to
build the requisite capacity. Successful implementation and computerization of
this project would eliminate discrepancies in data generated separately from
these institutions.

112
112
Payments System Development
Sierra Leone has made significant progress in its payments system development
programme. Following the release of funding in 2008 by the African
development bank under the WAMZ project, the Bank of Sierra Leone initiated
an elaborate programme aimed at upgrading its payments system
infrastructure.18 The programme started with the establishment of a National
Payments Systems Committee and creation of a division in the banking
department to oversee efficient functioning, management and efficient
payments delivery. Some of the activities during the period under review include
the recruitment of a Consultant (Logica Paris) and subsequent signing of an
implementation contract in April 2009, the promulgation of a payments
systems act in May 2009 and the successful organization of regular meetings of
stakeholders on the payments systems development project in June 2009.
The Consultant has already commenced work on the project which is expected
to be completed by 2011. Having undertaken preliminary studies and
subsequent specification of relevant infrastructure, the Committee is currently
awaiting proposals from prospective bidders for supplies of the required
equipments and software. The Bank of Sierra Leone has requested all
commercial banks to migrate to the recently adopted WAMZ cheque standards
by end-December 2009.
The Bank of Sierra Leone is also developing guidelines to regulate the activities
of the commercial banks, including transactions in electronic payments so as to
mitigate systemic and other risks associated with such transactions.
Discussions are currently ongoing among the financial institutions exploring
the possibilities and interconnectivity and establishment of common points of
sale access for customers. In addition, a law reform committee is currently
reviewing the bills of exchange act and a payments systems bill.
ECOWAS Trade Liberalization Scheme
According to the authorities at the Ministry of Trade, the ETLS has not
benefitted Sierra Leone as the country last received compensation from the
ECOWAS Commission in 2006 for loss of revenue in respect of tax exemptions.
Subsequent negotiations for re-imbursements under the scheme have been
difficult as the process is elaborate and bureaucratic. The authorities have also
introduced the harmonized customs documents, including the certificate of
origin, the customs nomenclature and declaration forms. However, Sierra Leone
18
This would involve the acquisition of real time gross settlement (RTGS) system, an automated clearing house (ACH), seamless securities settlement (SSS) and banking applications, establishment of a wide and metropolitan area networks including the provision of fibre-link interconnectivity among the payment systems operators.

113
113
has not yet introduced the road transit certificate required to facilitate free
movement across countries.
CONCLUSION AND RECOMMENDATIONS
The review showed that fiscal dominance remains a serious problem in Sierra
Leone. The weak infrastructure does not support robust revenue mobilization.
The desire to resuscitate the economy contributed to the growth in government
spending, resulting in high budget deficits. Monetary policy is most often
constrained by fiscal excesses which are periodically accommodated by the
central bank. The country experiences intermittent inflationary pressures
driven largely by adverse developments in the global economy. The current
account is under considerable stress due to an under-performing exports sector
and a high domestic demand for imports. A shortage in foreign reserves placed
undue pressure on the domestic currency, a development that has encouraged
a shift in foreign currency deposits. The country is generally vulnerable to
external shocks due to the weak infrastructure and foreign exchange earning
capacity.
The above developments have impacted negatively on the performance of Sierra
Leone under the convergence criteria. Nevertheless, the country is making
significant progress in the policy harmonization programmes relating to
statistics and payments systems development. However, the authorities should
streamline its records on intra-regional trade.
In the light of the above developments, the following recommendations may be
relevant:
1. strengthen the capacity of revenue mobilization agencies by
automating revenue collection and extending the range of taxable
activities;
2. expedite (re-open) action on introduction of the value added tax (VAT)
to enhance the volume of taxes;
3. develop a monitoring mechanism to ensure strict compliance with the
cash-based budgeting system adopted in 2007 aimed at improving
public expenditure management;
4. improve the foreign exchange earning capacity by diversifying
exports.
5. Continue to rehabilitate productive infrastructure and encourage
investment in the real sector to support higher productivity;
6. liberalize the financial market and create necessary conditions for a
flexible interest rate regime that would reflect market interactions;
7. introduce additional financial assets to enhance liquidity
management;

114
114
3.3 OTHER COUNTRIES
3.3.1 CAPE VERDE
Cape Verde is no longer a member of the group of Least Developed Countries (LDC), having been ranked by the United Nations as a Middle Income Country. This is certainly a remarkable achievement, but it does not prevent the country from depending massively on international aid. Cape Verde faces multiple challenges. Several factors call for more prudence in a world of crisis, slowing down of growth, a still high level of indebtedness, the currency pegging and a heavy balance of payments deficit. The Bank of Cape Verde (BCV) has reviewed downwards the growth rate of the Gross Domestic
Product (GDP) for 2009 from 5.5 % to 4.7 %. Beyond uncertainties in the year 2009, the country seems to be on a good path in the medium term. A strong recovery is expected in the tourism sector, as well as investments in road and port infrastructure. The investments should free a little more the productive potential.
3.3.1.1 Major macroeconomic developments
3.3.1.1.1 Real sector
It has been estimated that Real GDP growth would slowed down to 4.7 % in 2009 from 5.9 percent in 2008. The tertiary sector, in which tourism is the main component, is the principal contributor to GDP. This sector is the main source of foreign exchange earnings. In the first half of 2009, the government facilitated investment into the building industry of the secondary sector. For instance, A US$55 million cement project aimed at meeting both domestic and export demand was initiated by Chinese investors. The contribution of the primary sector (agriculture) is minimal, even with external aid because of the arid nature of the climate and the infertile soil.
In spite of the volatile nature of the prices of food products and oil in 2008, the country was able to sustain real GDP growth without high inflation. The pegging of the Cape Verde escudo (CVE) to the euro (EUR) partly explains this result, likewise the halt in indexing salaries on inflation. Inflation at 6.7%, remained moderate.
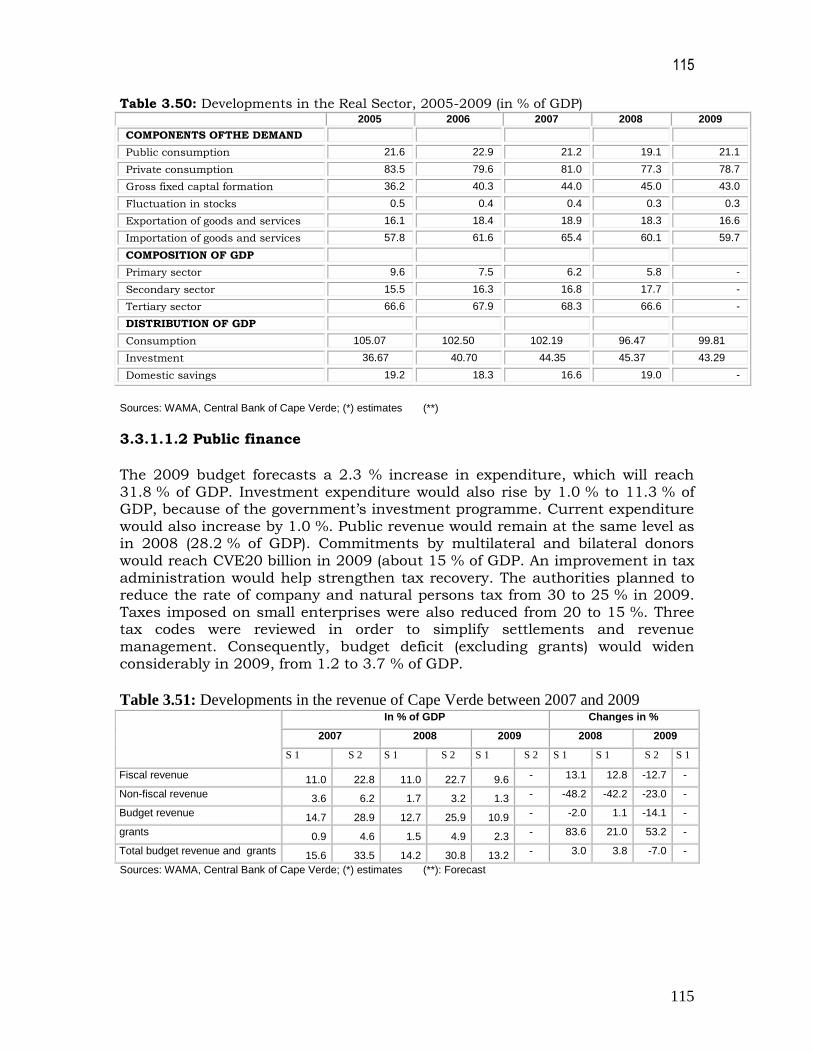
115
115
Table 3.50: Developments in the Real Sector, 2005-2009 (in % of GDP) 2005 2006 2007 2008 2009
COMPONENTS OFTHE DEMAND
Public consumption 21.6 22.9 21.2 19.1 21.1
Private consumption 83.5 79.6 81.0 77.3 78.7
Gross fixed captal formation 36.2 40.3 44.0 45.0 43.0
Fluctuation in stocks 0.5 0.4 0.4 0.3 0.3
Exportation of goods and services 16.1 18.4 18.9 18.3 16.6
Importation of goods and services 57.8 61.6 65.4 60.1 59.7
COMPOSITION OF GDP
Primary sector 9.6 7.5 6.2 5.8 -
Secondary sector 15.5 16.3 16.8 17.7 -
Tertiary sector 66.6 67.9 68.3 66.6 -
DISTRIBUTION OF GDP
Consumption 105.07 102.50 102.19 96.47 99.81
Investment 36.67 40.70 44.35 45.37 43.29
Domestic savings 19.2 18.3 16.6 19.0 -
Sources: WAMA, Central Bank of Cape Verde; (*) estimates (**)
3.3.1.1.2 Public finance
The 2009 budget forecasts a 2.3 % increase in expenditure, which will reach 31.8 % of GDP. Investment expenditure would also rise by 1.0 % to 11.3 % of GDP, because of the government’s investment programme. Current expenditure would also increase by 1.0 %. Public revenue would remain at the same level as in 2008 (28.2 % of GDP). Commitments by multilateral and bilateral donors would reach CVE20 billion in 2009 (about 15 % of GDP. An improvement in tax administration would help strengthen tax recovery. The authorities planned to reduce the rate of company and natural persons tax from 30 to 25 % in 2009. Taxes imposed on small enterprises were also reduced from 20 to 15 %. Three tax codes were reviewed in order to simplify settlements and revenue management. Consequently, budget deficit (excluding grants) would widen considerably in 2009, from 1.2 to 3.7 % of GDP.
Table 3.51: Developments in the revenue of Cape Verde between 2007 and 2009 In % of GDP Changes in %
2007 2008 2009 2008 2009
S 1 S 2 S 1 S 2 S 1 S 2 S 1 S 1 S 2 S 1
Fiscal revenue 11.0 22.8 11.0 22.7 9.6 - 13.1 12.8 -12.7 -
Non-fiscal revenue 3.6 6.2 1.7 3.2 1.3 - -48.2 -42.2 -23.0 -
Budget revenue 14.7 28.9 12.7 25.9 10.9 - -2.0 1.1 -14.1 -
grants 0.9 4.6 1.5 4.9 2.3 - 83.6 21.0 53.2 -
Total budget revenue and grants 15.6 33.5 14.2 30.8 13.2 - 3.0 3.8 -7.0 -
Sources: WAMA, Central Bank of Cape Verde; (*) estimates (**): Forecast

116
116
3.3.1.1.3 Monetary sector
With regard to the monetary situation, the Central Bank of Cape Verde (Banco Central de Cabo Verde – BCV), continues to supervise the stability and credibility of pegging the escudo to the euro. Currently, the risks are minimal, in view of the small size of the economy and low exposure to international capital flow. Parity, controlled by a commission, is covered by a credit facility of EUR150 million granted by Portugal – which could be raised to 250 million, if it becomes necessary.
The financial system of Cape Verde seems relatively robust in the face of the global crisis, owing to its limited interaction with international capital markets and the relatively higher commercial bank deposits, compared to their
outstanding loans. The BCV plans to enhance its supervision of external inflows in 2009, including deposits of non residents. The Central Bank is ready to intervene on interest rates to avoid destabilizing capital flow.
3.3.1.1.4 External sector
Food imports reduced in 2009, thanks to a good agricultural season and a fall in international prices.
Cape Verde has nevertheless reduced her level of external indebtedness over the past few years. External debt remains relatively high (63 % of GDP compared to 70 % in 2007), but it is renegotiable. Among her creditors are especially multilateral organizations and governments, led by Portugal. External debt reduced to 48 % of GDP in 2009.
The banking system was exposed to a sudden drop in the deposits of non residents (40 % of total deposits), because of the crisis. The bulk of these deposits come from remittances from non residents; this limits the risks of capital flight since they are less volatile than portfolio investments. Transfer of funds motivated by investment opportunities is highly improbable at the moment, and a phenomenon of repatriation, even a restricted one, is not excluded.
For the moment, the global crisis has not affected the flow of foreign direct investment into Cape Verde. A slowdown may probably be felt in 2009, as large construction projects in the tourism sector have already been put off. Besides,
migrant investments in the country (also included in FDI) seem to slow down.
3.3.1.2 Macroeconomic convergence situation
The overall level of performance deteriorated by meeting two convergence criteria in the review period compared to four in the preceding corresponding period. The state of convergence is as follows:
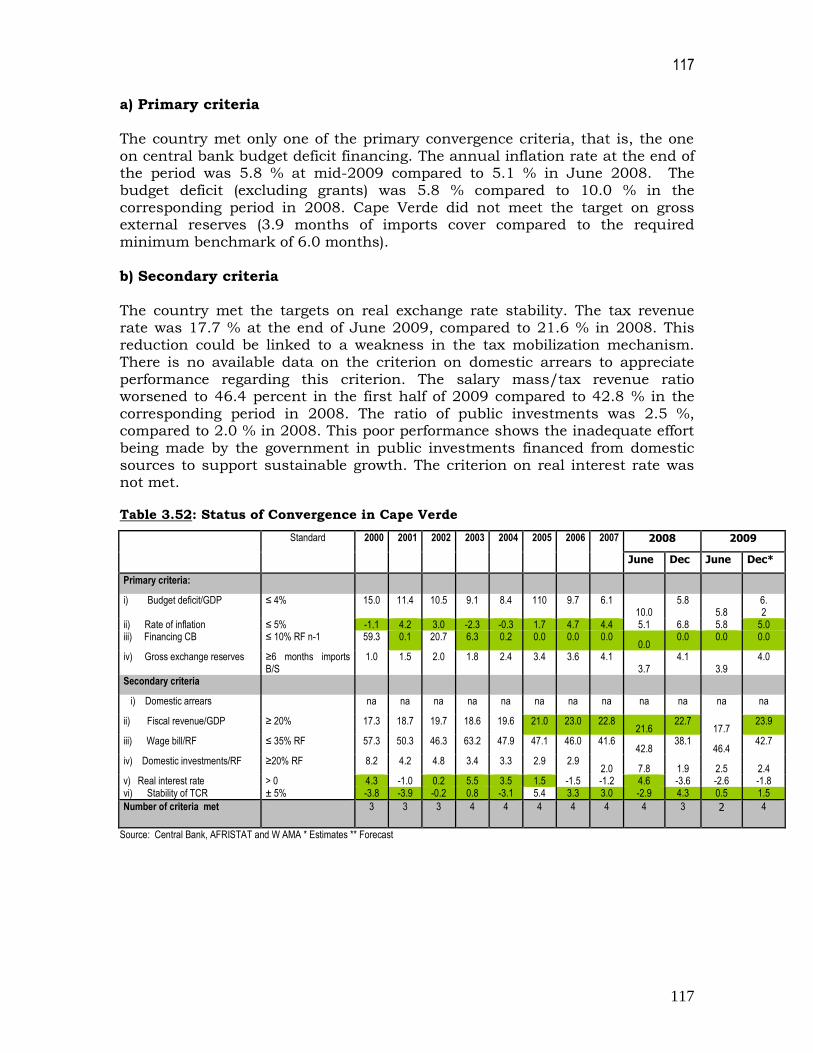
117
117
a) Primary criteria
The country met only one of the primary convergence criteria, that is, the one on central bank budget deficit financing. The annual inflation rate at the end of the period was 5.8 % at mid-2009 compared to 5.1 % in June 2008. The budget deficit (excluding grants) was 5.8 % compared to 10.0 % in the corresponding period in 2008. Cape Verde did not meet the target on gross external reserves (3.9 months of imports cover compared to the required minimum benchmark of 6.0 months). b) Secondary criteria The country met the targets on real exchange rate stability. The tax revenue rate was 17.7 % at the end of June 2009, compared to 21.6 % in 2008. This reduction could be linked to a weakness in the tax mobilization mechanism. There is no available data on the criterion on domestic arrears to appreciate performance regarding this criterion. The salary mass/tax revenue ratio worsened to 46.4 percent in the first half of 2009 compared to 42.8 % in the corresponding period in 2008. The ratio of public investments was 2.5 %, compared to 2.0 % in 2008. This poor performance shows the inadequate effort being made by the government in public investments financed from domestic sources to support sustainable growth. The criterion on real interest rate was not met.
Table 3.52: Status of Convergence in Cape Verde
Standard
2000 2001 2002 2003 2004 2005 2006 2007 2008 2009
June Dec June Dec*
Primary criteria:
i) Budget deficit/GDP ≤ 4% 15.0 11.4 10.5 9.1 8.4 110 9.7 6.1 10.0
5.8 5.8
6. 2
ii) Rate of inflation ≤ 5% -1.1 4.2 3.0 -2.3 -0.3 1.7 4.7 4.4 5.1 6.8 5.8 5.0 iii) Financing CB ≤ 10% RF n-1 59.3 0.1 20.7 6.3 0.2 0.0 0.0 0.0
0.0 0.0 0.0 0.0
iv) Gross exchange reserves ≥6 months imports B/S
1.0 1.5 2.0 1.8 2.4 3.4 3.6 4.1 3.7
4.1 3.9
4.0
Secondary criteria
i) Domestic arrears na na na na na na na na na na na na
ii) Fiscal revenue/GDP ≥ 20% 17.3 18.7 19.7 18.6 19.6 21.0 23.0 22.8 21.6
22.7 17.7
23.9
iii) Wage bill/RF ≤ 35% RF 57.3 50.3 46.3 63.2 47.9 47.1 46.0 41.6 42.8
38.1 46.4
42.7
iv) Domestic investments/RF ≥20% RF 8.2 4.2 4.8 3.4 3.3 2.9 2.9 2.0 7.8 1.9 2.5 2.4
v) Real interest rate > 0 4.3 -1.0 0.2 5.5 3.5 1.5 -1.5 -1.2 4.6 -3.6 -2.6 -1.8 vi) Stability of TCR ± 5% -3.8 -3.9 -0.2 0.8 -3.1 5.4 3.3 3.0 -2.9 4.3 0.5 1.5
Number of criteria met 3 3 3 4 4 4 4 4 4 3 2 4
Source: Central Bank, AFRISTAT and W AMA * Estimates ** Forecast

118
118
3.3.1.3 Harmonization of policies and Institutional Arrangements
The national unit of ECOWAS in Cape Verde has confirmed that the country’s authorities have decided to ratify all ECOWAS Protocols and Agreements that have not been ratified. To that end, contacts have been made with the Legal Department of the ECOWAS Commission to identify all non ratified community acts for translation into Portuguese and ratification. National Coordination Committee (NCC) The National Coordination Committee has just been set up. The head of the Committee is being nominated and an account has been opened to receive grants for its operations. Common External Tariff (CET) Implementation of the Common External Tariff is under study by the BENED Consultancy Firm of Côte d’Ivoire. The study which began on 9 September 2009 would help to determine the advantages and costs of moving from seven (7) bands (currently in force in Cape Verde) to five (5) bands under negotiation at the level of member States of the Community. Economic Partnership Agreement (EPA) The impact of signing the Economic Partnership Agreement (EPA) is also under study to assess the level of customs revenue losses and how to offset these. However, although Cape Verde is negotiating this agreement within the global framework defined by ECOWAS, she dreads the effect of this agreement and its common tariffs on her insular economy which is import- dependent. The loss of fiscal revenue due to the drop in tariffs would represent a significant loss of earnings. Cape Verde would like to obtain a special status before she signs. The free movement of persons envisaged in this EPA is not without impact. Harmonization of statistics Harmonization of statistics is also progressing satisfactorily. Thus, work on the preparation of the comparable GDP has begun with the help of AFRISAT, and the assistance of Sweden has been sought for the quarterly calculation of GDP; ECOMAC data base poses a problem regarding control of its information methodology; external trade statistics are captured according to EUROTRACE software. PRIMA software has not been tested in Cape Verde, as the authorities
think that the software being used by their country processes correctly and fully all sorts of statistical information. 3.3.1.4 Conclusion and recommendations In a worsening international economic and financial context, all forecasts by Cape Verde for 2009 have been reviewed downwards. Real value GDP growth is estimated to be around 4.7 %. Inflationary pressures remained moderate in the review period. Fiscal policy improved although the level was still high.
119
119
Thus, the monetary authorities of Cape Verde could take into account the following recommendations:
1. diversify tourist sites and establish policies that will enhance the effects of tourism at the local level for, until now, this activity is concentrated on a few large sites and products consumed by tourists are mainly imported, to the extent that local markets do not gain much from them;
2. improve the level of tax revenue recovery by minimizing exemptions and modernizing revenue agencies in order to guarantee the expansion of the fiscal administration base, so as to enhance its performance and identify measures that would help control current expenditure, particularly salaries ;
3. continue to review the general tax code, with a view to adopting a new tax exemptions code that would end dysfunction due to reliefs granted by the government in 2007.
3.3.2 LIBERIA Introduction In 2008, the Government of Liberia introduced a broad set of policies under Poverty Reduction Strategy (PRS) to accelerate reconstruction and development, and build strong systems of governance. This strategy, which covers the period 2008-2011, is of critical importance as Liberia shifts from post-conflict stabilization to laying the foundation for sustainable growth, poverty reduction, and progressing towards the Millennium Development Goals (MDGs). To achieve these objectives, the Government’s main macroeconomic goals aim at sound fiscal, monetary, trade and exchange rate policies that would foster competition, generate revenues, maintain price stability, create employment opportunities, and encourage private sector investment. In particular, the PRS programme aims at reducing consumer price inflation to 7.0 percent, increasing total revenues to 27.0 percent of GDP, maintaining broad stability in the exchange rate and reducing the external debt overhang in the medium term. In this regard, the government of Liberia outlined the following targets for 2009: a real GDP growth rate of 10.3 percent, end-period headline inflation of 8.5 percent, an overall budget deficit of 12.1 percent, a negative trade account balance of 53.0 percent of GDP and gross external reserves equivalent to 1.1 months of imports. After the good performance in 2008, preliminary data indicates that the economy of Liberia slowed down during the first half of 2009 as real GDP growth was estimated at 4.9 percent. This slowdown has been attributed partly to the global meltdown and partly to sub-optimal performances in agriculture, manufacturing and the extractive industry. The general consumer price inflation has generally been contained in single-digit figures below the end-2008 figure of 9.4 percent, although it exhibited slight upward pressure during the period under review. The average lending rates declined whilst savings rates upped moderately, suggesting an increasing competition in the financial sector. Nevertheless, the external sector is reeling under the unfavourable effects of the
120
120
global financial crisis and an increasing domestic aggregate demand as the trade deficit widened and gross external reserves declined. Real Sector Developments It had been expected that the real sector would be characterized by positive developments in the mining, forestry, agriculture and services sectors. The available data indicates that output from the agricultural and manufacturing sectors remained sluggish. Rubber production fell by about 8.0 percent as a result of shortage in the supplies of inputs and sporadic skirmishes on major concession farms. Similarly, shortfall in production has been reported in sawn timber production. However, cocoa production continued to regenerate owing to a gradual return of displaced farmers to their farming communities. The manufacturing sector is still constrained by inadequate electric power supply, poor economic infrastructure and rising cost of factor inputs. The preliminary reports also indicate that performance in the mining sector is also constrained by declining demand for the country’s exports. Developments in the Fiscal Sector The Government of Liberia has over the past three years embarked on a wide range of fiscal reforms aimed at rebuilding the public financial management system. In addition to instituting a sound controls to avoid the accumulation of domestic arrears and ensure regular reporting, the government has proposed the enactment of a law to govern public financial management. Given the financial constraints the country faces, the Government has adopted a strict cash-based budgeting system aimed at controlling public expenditure by matching spending with revenue, thereby, contributing to low inflation and a sustainable balance of payments. The available data show that fiscal policy continued to improve during the first half of 2009. The government’s financial operations resulted in an overall budget surplus (including grants) of 6.0 percent of GDP compared to a surplus of 1.8 percent in the corresponding period of 2008. The budget surplus excluding grants was 1.0 percent, which was still better than the surplus position of 0.4 percent recorded in the corresponding period of 2008. Derived mainly from taxes on income and profits, goods and services, internal levies, customs and excise, the total domestic revenue of Liberia increased moderately from 28.7 percent to 30.5 percent of GDP. Total tax revenue grew by 9.6 percent, driven by enhancements in individual taxes on income and profits, specific services and customs on international trade. The improvement in tax revenue partly is in response to efforts aimed at expanding the tax net
and plugging leakages in the revenue collection systems. However, non-tax revenue underperformed due to reductions in the returns from stumpage, fees and administrative charges. Grants more than tripled to USD 23.5 million, representing 16.6 percent of total revenue. Total expenditure declined from 26.9 percent of GDP to 24.4 percent as a result of reductions in the outlays on certain recurrent expenditure items, especially,
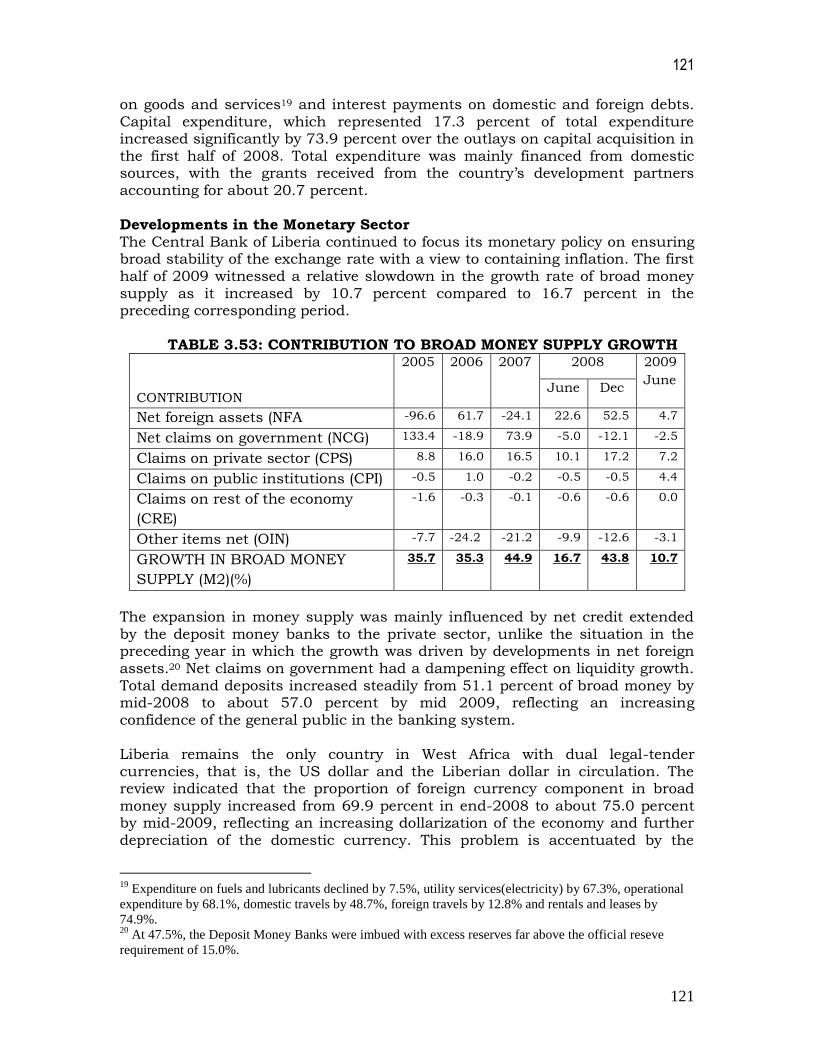
121
121
on goods and services19 and interest payments on domestic and foreign debts. Capital expenditure, which represented 17.3 percent of total expenditure increased significantly by 73.9 percent over the outlays on capital acquisition in the first half of 2008. Total expenditure was mainly financed from domestic sources, with the grants received from the country’s development partners accounting for about 20.7 percent. Developments in the Monetary Sector The Central Bank of Liberia continued to focus its monetary policy on ensuring broad stability of the exchange rate with a view to containing inflation. The first half of 2009 witnessed a relative slowdown in the growth rate of broad money supply as it increased by 10.7 percent compared to 16.7 percent in the preceding corresponding period.
TABLE 3.53: CONTRIBUTION TO BROAD MONEY SUPPLY GROWTH
CONTRIBUTION
2005 2006 2007 2008 2009
June June Dec
Net foreign assets (NFA -96.6 61.7 -24.1 22.6 52.5 4.7
Net claims on government (NCG) 133.4 -18.9 73.9 -5.0 -12.1 -2.5
Claims on private sector (CPS) 8.8 16.0 16.5 10.1 17.2 7.2
Claims on public institutions (CPI) -0.5 1.0 -0.2 -0.5 -0.5 4.4
Claims on rest of the economy
(CRE)
-1.6 -0.3 -0.1 -0.6 -0.6 0.0
Other items net (OIN) -7.7 -24.2 -21.2 -9.9 -12.6 -3.1
GROWTH IN BROAD MONEY
SUPPLY (M2)(%)
35.7 35.3 44.9 16.7 43.8 10.7
The expansion in money supply was mainly influenced by net credit extended by the deposit money banks to the private sector, unlike the situation in the preceding year in which the growth was driven by developments in net foreign assets.20 Net claims on government had a dampening effect on liquidity growth. Total demand deposits increased steadily from 51.1 percent of broad money by mid-2008 to about 57.0 percent by mid 2009, reflecting an increasing confidence of the general public in the banking system. Liberia remains the only country in West Africa with dual legal-tender currencies, that is, the US dollar and the Liberian dollar in circulation. The review indicated that the proportion of foreign currency component in broad
money supply increased from 69.9 percent in end-2008 to about 75.0 percent by mid-2009, reflecting an increasing dollarization of the economy and further depreciation of the domestic currency. This problem is accentuated by the
19
Expenditure on fuels and lubricants declined by 7.5%, utility services(electricity) by 67.3%, operational
expenditure by 68.1%, domestic travels by 48.7%, foreign travels by 12.8% and rentals and leases by
74.9%. 20
At 47.5%, the Deposit Money Banks were imbued with excess reserves far above the official reseve
requirement of 15.0%.

122
122
absence of adequate monetary policy instruments for liquidity management as the weekly foreign exchange auction remains the only policy instrument for liquidity management. However, the limited foreign exchange reserves of the country provide a downside risk to the continued maintenance of exchange rate and price stability. The movements in interest rates during the period under review pointed to an increasing desire of the deposit money banks to enhance financial intermediation. Whilst the average savings and time deposit rates increased by 200.0 basis points and 20.0 basis points to 4.1 percent and 4.3 percent respectively whilst the average lending rate declined by 15.0 basis points to 14.2 percent. Consequently, the spread between the average savings and lending rates narrowed, reflecting in part, an increasing competition in the financial sector as two commercial banks, Access Bank and Global Bank, commenced operations during the period under review. Developments in the External Sector The trade account continued to deteriorate as the deficit balance as at mid-2009 widened by 12.0 percent above the position at mid-2008 to USD 260.7 million. The deterioration was attributed to reductions in the value of the country’s major export commodities, particularly, rubber, diamonds, gold, round logs and other commodities. Developments in the financial account were also not very encouraging. Inward private remittances dipped under the period under review by 18.6 percent to USD 406.3 million whilst outflows during the same period was USD 417.4 million, resulting in a net outflow of USD11.1 percent. The domestic currency, the Liberian dollar, depreciated by 10.6 percent during the first half of 2009 compared to 0.4 percent in the same period of 2008.21 The loss in value was attributed to an increasing business and consumer demand for foreign currencies as foreign exchange became scarce owing to the increasing net outflows, dwindling credit lines to importers and declining export receipts. The external debt position of Liberia improved significantly during the period under review as the total debt stock declined from USD 3163.4 million at end-2008 to 1782.1 million by mid-2009.22 This drop was partly due to a buy-back of an amount of USD 1,200.0 million from commercial creditors at a discount of 97.0 percent of the book value. Most of the remaining external debt would be cancelled when the country reaches the Completion Point under the Heavily
Indebted Poor Countries (HIPC) Initiative by the end-2009. Performance under Macroeconomic Convergence The strict macroeconomic policy measures adopted by the government enabled Liberia to sustain the total five targets met in 2008, comprising two of the
21
The currency was relatively stable in 2008, having depreciated by 3.1% during the year. 22
The government owed 60.1 percent of the total debt to multilateral institution, 38.8 percent to bilateral
institutions and 1.2 percent to commercial financial institutions.
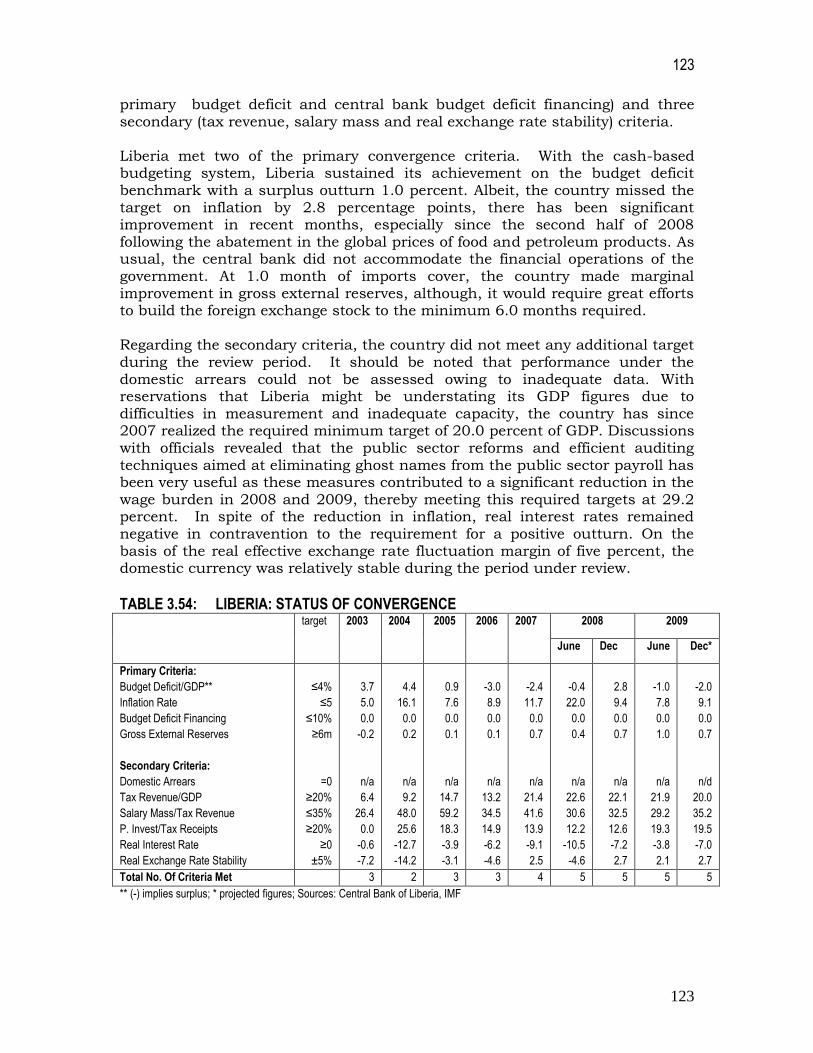
123
123
primary budget deficit and central bank budget deficit financing) and three secondary (tax revenue, salary mass and real exchange rate stability) criteria. Liberia met two of the primary convergence criteria. With the cash-based budgeting system, Liberia sustained its achievement on the budget deficit benchmark with a surplus outturn 1.0 percent. Albeit, the country missed the target on inflation by 2.8 percentage points, there has been significant improvement in recent months, especially since the second half of 2008 following the abatement in the global prices of food and petroleum products. As usual, the central bank did not accommodate the financial operations of the government. At 1.0 month of imports cover, the country made marginal improvement in gross external reserves, although, it would require great efforts to build the foreign exchange stock to the minimum 6.0 months required. Regarding the secondary criteria, the country did not meet any additional target during the review period. It should be noted that performance under the domestic arrears could not be assessed owing to inadequate data. With reservations that Liberia might be understating its GDP figures due to difficulties in measurement and inadequate capacity, the country has since 2007 realized the required minimum target of 20.0 percent of GDP. Discussions with officials revealed that the public sector reforms and efficient auditing techniques aimed at eliminating ghost names from the public sector payroll has been very useful as these measures contributed to a significant reduction in the wage burden in 2008 and 2009, thereby meeting this required targets at 29.2 percent. In spite of the reduction in inflation, real interest rates remained negative in contravention to the requirement for a positive outturn. On the basis of the real effective exchange rate fluctuation margin of five percent, the domestic currency was relatively stable during the period under review.
TABLE 3.54: LIBERIA: STATUS OF CONVERGENCE target 2003 2004 2005 2006 2007 2008 2009
June Dec June Dec*
Primary Criteria:
Budget Deficit/GDP**
Inflation Rate
Budget Deficit Financing
Gross External Reserves
Secondary Criteria:
Domestic Arrears
Tax Revenue/GDP
Salary Mass/Tax Revenue
P. Invest/Tax Receipts
Real Interest Rate
Real Exchange Rate Stability
≤4%
≤5
≤10%
≥6m
=0
≥20%
≤35%
≥20%
≥0
±5%
3.7
5.0
0.0
-0.2
n/a
6.4
26.4
0.0
-0.6
-7.2
4.4
16.1
0.0
0.2
n/a
9.2
48.0
25.6
-12.7
-14.2
0.9
7.6
0.0
0.1
n/a
14.7
59.2
18.3
-3.9
-3.1
-3.0
8.9
0.0
0.1
n/a
13.2
34.5
14.9
-6.2
-4.6
-2.4
11.7
0.0
0.7
n/a
21.4
41.6
13.9
-9.1
2.5
-0.4
22.0
0.0
0.4
n/a
22.6
30.6
12.2
-10.5
-4.6
2.8
9.4
0.0
0.7
n/a
22.1
32.5
12.6
-7.2
2.7
-1.0
7.8
0.0
1.0
n/a
21.9
29.2
19.3
-3.8
2.1
-2.0
9.1
0.0
0.7
n/d
20.0
35.2
19.5
-7.0
2.7
Total No. Of Criteria Met 3 2 3 3 4 5 5 5 5
** (-) implies surplus; * projected figures; Sources: Central Bank of Liberia, IMF

124
124
Prospects for the Second Half Of 2009
The government of Liberia has indicated its commitment to coordinate its fiscal and monetary policies with the view of reducing inflationary pressures and maintaining overall exchange rate stability. Against the backdrop, prospects for the second half of the year appears promising. The government is on course to realize the real GDP growth of 4.9 percent estimated for the year. In this regard, a number of investment initiatives have been instituted especially in agriculture and industry to stimulate the economy and address the problems associated with the financial crisis. The government has allocated funds to meet the growing demand for agriculture inputs and extension services, support small and medium-size businesses and improve infrastructure, especially in the transport and energy sectors. It is expected that the economy would remain relatively stable during the second half of the year. Albeit, the economy would experience moderate inflationary pressures, inflation would remain in single digit levels owing to a higher growth in output and stabilization of the prices of petroleum products. Interest rate would also continue to decline owing to increased completion arising from the entry into the financial sector of more banks and non-banking financial institutions. Thus, the macroeconomic condition would remain favourable to the investment drive being facilitated by the country’s development partners. However, the exchange rate would continue to experience and upward pressure owing to the increasing dollarization, inadequate financial assets, net foreign exchange outflows (including the declining remittances), increasing demand for imports and weak foreign exchange earning capacity. A possible shortage of foreign exchange would provide a downside risk to the perceived stability of the economy if short-term measures are not introduced to enhance the level of gross external reserves. With regard to the convergence criteria, the data shows that everything being equal, the performance of the country will not improve in the second half of the year as the country would maintain the same number of criteria realized during the first half of the year. Fiscal policy would continue to improve owing to the ongoing expenditure rationalization, improving revenue expectations and strict adherence to the cash-based budgeting system which would facilitate continued compliance with the non-accommodating stance of the central bank. Inflation would increase moderately above the maximum requirement of 5.0 percent. The already low gross external reserves would be expected to decline further, given the expected unfavourable developments in the balance of payments. Liberia is likely to meet the target on tax revenue. However, the country would miss the wage burden narrowly owing to a programmed reduction in income tax
and an increase in minimum salary for civil servants. Public investments financed from domestic sources would improve marginally, albeit, the level would be slightly below the minimum requirement of 20.0 percent. The upward inflationary pressures would accentuate the prevalence of negative real interest rates and worsen real exchange rate stability.
125
125
Institutional Arrangements and Policy Harmonization Issues
The Liberia National Coordinating Committee Inaugurated in May 2007, The NCC of Liberia has not been running effectively owing to problems relating to coordination between the Ministry of Finance and Central Bank of Liberia. The meetings of the body are not regular as the last meeting was held in September 2008. It was also observed that the Central Bank, which serves as the operational centre of the NCC, plays a more active role in the activities of the NCC in Liberia. In spite of this problem, arrangements are far advanced for the recruitment of two key officials, a Macroeconomist and an Administrative Officer, who would facilitate the reporting and operational responsibilities of the NCC. In addition, the NCC has prepared the economic report for the first quarter of 2009, awaiting validation by members. Furthermore the NCC is currently preparing, in collaboration with a Consultant, a work programme that would outline relevant activities requiring immediate implementation in Liberia. It was indicated that the NCC has received the two-year subvention for 2008 and 2009 from the ECOWAS Commission and arrangements are underway to present a status financial report to the current Chairperson of the NCC in Liberia. Statistical Harmonization Liberia is advancing steadily on the statistical harmonization front. Efforts are underway to establish the relevant infrastructure that would facilitate extension of the Consumer Price Index (CPI) coverage from the Monrovia metropolis to cover the entire country. Studies are also underway to increase the items in the CPI basket which currently comprises 234 items and determine new weights for its components. The determination and method of calculating the CPI is also being modernized with the view of transiting from the use of excel spreadsheet to the PRIMA software that has been recommended for ECOWAS countries. Officials of the Liberia Institute of Statistics and Geo-Information Services (LISGIS) have already received training on the proposed software. With regard to the harmonization of National Accounts statistics, the authorities are taking steps to adopt the SNA 93 standards. Following a survey on population, household and commercial economic entities conducted in 2008, the Statistics Services is making relevant arrangements to improve data collection to facilitate accurate determination of GDP, which is currently being determined on the basis of production. With sufficient human resource capacity, the Service intends to adopt the methodology based on expenditure
returns. Payments Systems Development Liberia currently has banks with several branches throughout the country. The main system of payments of large value amounts is through the SWIFT system whilst cheques are largely utilized for small value amounts. The central bank of Liberia maintains a clearing house which operates manually. In addition to these major modes of payments, a few commercial banks operate western union
126
126
and money transfer schemes as well as the visa card and automatic teller machine systems which are not interoperable. At the moment, there is no payments system law in Liberia and the clearing house guidelines are not complaint with the standards of Bank of International Settlements (BIS). However, the central bank Act authorizes it to operate a payments system in Liberia. The monetary authorities are putting in place a framework to modernize the payment systems in accordance with international standards. In this regard, the payment systems committee and work groups have been created to oversee various aspects of the programme. In addition, the central bank has taken stock of the existing infrastructure, organized several workshops on the electronic and card systems, offered training to selected officials, and formulated a strategy paper for implementation in due course. However, the central bank faces a number of challenges in the payment systems development agenda, including funding, capacity building in the form of international exposure and the establishment of a payments systems section. In spite of these challenges, prospects for the future are promising as some commercial banks have already initiated modernization programmes in payments systems at the institutional level. Conclusions and Recommendations Liberia faces a myriad of economic problems ranging from weak physical infrastructure to inadequate revenue, fragile financial system, and balance of payments constraints with weak foreign exchange earning capacity and high external debt position. Notwithstanding these limitations the government of Liberia is pursuing an economic revitalization programme under the PRS aimed at rebuilding the socio-economic infrastructure so as to create the congenial environment for sustained growth and development. The adopted prudent macroeconomic policies have contributed to macroeconomic stability. Prudent fiscal policies have contributed to favourable outturns in the government’s financial operations, albeit there is an increasing demand for higher capital and other expenditure. The economy has been characterized by significant expansion in broad money supply, accounted for by intermittent increases in net foreign assets and net claims on government. The apparent absence of adequate monetary policy instruments create significant challenges to the Central Bank of Liberia, which depends on the weekly foreign exchange auction for liquidity
management under an exchange rate targeting framework. With a weak export base and an increasing demand for imports, the balance of payments faces significant constraints which have been worsened by a declining global demand for the country’s exports. In spite of the difficult macroeconomic environment, Liberia met two of the primary benchmarks during the period under review. The projection further show that the country’s performance would be sustained in the second half of 2009.
127
127
In the light of the above developments, the following recommendations are important:
1. Continue to strengthen the revenue mobilization agencies and extend the
tax net;
2. Consider the introduction of value added tax as an efficient indirect
taxation mechanism;
3. Expedite action on making the Liberian dollar the only legal tender in the
country;
4. Enhance the foreign exchange earning capacity by developing the
production of tradable non-traditional export commodities;
5. strengthen the capacity of the statistical agency to enable the institution
play its role effectively and facilitate the statistical harmonization
programme;
6. operationalize the NCC facilitate to the compilation, collection and
analysis of data.