ed 330 241 title - eric · ed 330 241 he 024 317 ... nia colleges and universities to enroll more...
TRANSCRIPT
DOCUMENT RESUME
ED 330 241 HE 024 317
TITLE Technical Background Papers to Higher Education atthe Crossroads: Planning for the Twenty-FirstCentury. Six Commission Staff Reports Prepared forthe Commission's 1989-90 Long-Range Planning Project.Report 90-2.
INSTITUTION California State Postsecondary Education Commission,Sacramento.
PUB DATE Jan 90NOTE 156p.; For the related Commission report, see HE 024
318.
AVAILABLE FROM Publications Office of the Commission, 1020 TwelfthStreet, Third Floor, Sacramento, CA 95814-3985.
PUB TYPE Reports General (140) -- Collected Works - General(020)
EDRS PRICE MF01/PC07 Plus Postage.DESCRIPTORS Building Plans; Cost Estimates; Educational Finance;
*Educational Planning; Enrollment; *Futures (ofSociety); *Higher Education; *Long Range Planning;Planning Commissions; Population Trends;Postsecondary Education; State Colleges; StateUniversities; Trend Analysis
IDENTIFIERS *Call'ornia
ABSTRACT
This report contains six papers prepared for theCalifornia State Postsecondary Education Commission as part of theCommission's long-range planning responsibilities during 89-90 and asbackground for the Commission's January 1990 report, "HigherEducation at the Crossroads. Planning for the Twenty-First Century."The first paper explains the Commission's role in long-range planningfor education beyond high school in California and then reviews howenrollment and rlapital outlay planning is currently conducted. Thesecond paper describes how California's three public segments ofhigher education and the Commission have estimated the cost ofbuilding new campuses. The third paper explains how the Commissionhas calculated annual per-student costs of operating California'spublic colleges and universities. The fourth paper reviews nationaland State evidence about the financial and educational impact ofyear-round operation through State-supported summer-quarter programs.The fifth paper reports on the capacity of member institutions of theAssociation of Independent California Colleges and Universities toenroll more California students and the cost implications for theState of encouraging this enrollment. The last paper describesexamples in several states of two-year and four-year colleges anduniversities sharing sites and facilities. Papers are usuallyreferenced and contain supplementary materials where appropriate.(GLR)
***********************************************************************
Reproductions supplied by EDRS are the best that can be madefrom the original document.
***********************************************************************

:.
U II DEPARTMENT OF EDUCATIONOthce or Educational Research and Improvement
EDUCATIONAL RESOURCES INFORMATIONCENTER (ERIC)
fii-Uus document has been reproduced asreceived from the persOn Or organizahonoriginating it
0 Minor changes have been made to improvereproduction Quality
Points ol view or opiniona siled in thiS dOCument do not necessarily represent officialOERI position or policy
"PERMISSION TO REPRODUCE THISMATERIAL HAS BEEN GRANTED BY
CA Postsecondary
Educa tiov rommi q'i 0
TO THE EDUCATIONAL RESOURCESINFORMATION CENTER (ERIC)"

SummaryThese six papers were prepared by staff members of the Califor-nia Postsecondary Educatio-. Commission as part of the Commis-sion's long-range planning responsibilities during 1989-90 and asbackground for the Commission's January 1990 report, HigherEducation at the Crossroads. Planning for the Twenty-First Cen-tury.
The first paper, "Planning Our Future," explains the Commis-sion's role in long-range planning for education be;:ond the highschool in California and then reviews how enrollment and capitaloutlay planning is currently conducted by California's three pub-lic segments of higher education and affected by the executiveand legislative branches of government. For more informationabout it, please contact Kirk L. Knutsen of the Commission staffat (916) 322-8013.
The second paper, "Cost Estimates and Simulations for CapitalOutlay Planning," describes how Califot nia's public segments ofhigher education ahd the Commission 1-ive estimated the cost ofbuilding new campuses. For inforatation about it, contact Kirk L.Knutsen or Wanda N. Yanez at 322-8013.
"Cost Estimates and Simulations for Operating Budgets" thethird paper -- explains how the Commission has calculated annu-al per-student costs of operating California's public colleges anduniversities. For more information, contact Kevin G. Woolfork at322-8007.
"Issues Related to Year-Round College and University Opera-tion" reviews national and State evidence about the financial andeducational impact of year-round operation through State-supported summer-quarter programs. For information: JaneWellman at 322-8017.
"The Role of Accredited Independent Institutions in MeetingCalifornia's Future Enrollment Demand" reports on the capacityof member institutions of the Association of Independent Califor-nia Colleges and Universities to enroll more California students,and the cost implications for the State of encouraging this enroll-ment. For information: Karl M. Engelbach at 322-7331.
"Joint or Shared Use of Facilities in Higher Education in SelectedStates" describes examples in saveral states of two-year and four-year colleges and universities sharing sites and facilities. For in-formation: Dorothy M. Knoell at 322-8015.
Additional copies of thiq document may be obtained from the Pub-lications Office of the Cummission at (916) 324-4991 or by writingthe Commission, Third Floor, 1020 Twelfth Street, Sacramento,California 95814-3985.

Technical Background Papers toHigher Education at the Crossroads:Planning for the Twenty-First Century
Six Commission Staff ReportsPrepared for the Commission's
1989-90 Long-Range Planning Project
CALIFORNIA POSTSECONDARY EDUCATION COMMISSIONThird Floor 1020 Twelfth Street Sacramento, California 95814-3985 0 COMMISSION 0
POSTSECOND AR Y<
ZfX
0tr.
J<U
macn>-i
0Z

laarslaida a
COMMISSION REPORT 90-2PUBLISHED JANUARY 1990
THIS is one in a 9eries of staff reports on important issues affecting California post-secondery education. These reports are brought to the California Postsecondary Edu-cation Commission for discussion rather than for action, and they represent theinterpratation rf the staff rather than the formal position of the Commission as ex-pressed in its adopted resolutions and reports containing policy recommendations.
Like other publications of the Commission, this repart is not copyrighted. It may bereproduced in the public interest, but proper attribution to Report 90-2 of the Cali-fornia Postsecondary Education Commission is recitiested.

Contews
1. Planning Our Future: A Staff Background Paperon Long-Range Enrollment and Facilities Planningin California Public Higher Education 1
Introduction 1
A Policy Context for the Commission's Planning Priorities 5
Population Projections 8
Long-Range Enrollment Projections 10
Segmental Enrollment Planning 12
Capital Outlay Planning 22
State Budgeting 33
Conclusions 45
Appendix A: Prospectus for a Study of Long-Range Enrollmentand Facilities Planning in California Public Higher Education 46
Appendix B: Differences in Mission and Size Among the ThreePublic Segments 49
Appendix C: MethoiLiogy for Projecting California Populationby Race/ Ethnicity with Age/Sex Detail, 1980 to 2020 50
Appendix D: California State University ana University of CaliforniaEnrollment Projections conducted by the Demographic Research Unit 51
Appendix E: Methodology for the Preliminary Enrollment Projectionfor the California State University Growth Plan, 2005-06 52
Appendix F: K-12 Enrollment and High School GraduationProjections Conducted by the Demographic Research Unit 52
Appendix G: Community College Enrollment Projections for CapitalOutlay Purposes Conducted by the Demographic Research Unit 53
Appendix H: Estimates of Community College District DemographicFactors and Annual Percent Change in Adult Population
Appendix I: California State University Enrollment ProjectionMethodology for Setting Campus Enrollment Allocations
55
57
2. Cost Estimates and Simulationsfor Capital Outlay Planning 59
Scope and Issues of the Paper 59
California Community Colleges 60
The California State University 64
University of California 68
California Postsecondary Education Commission 75
References 77
Attachment A: Policy on Long-Range Capital Outlay Planning 79
Attachment B: Community College Long-Range CapitalOutlay Planning Model 93
3. Cost Estimates and Simulationsfor Operating Budgets 99
Introduction 99
Sources of Cost Information 100
Explanation of Vle Cost Categories 101
Calculation of Cost Information per Student 102
Current Operations Costs of California Public Higher Education 103
Summary 116
7
4. Issues Related to Year-Round Collegeand University Operation 119
Differences Between Summer-Quarter and Summer-Term Instruction 119
Current Summer-Quarter Programs 119
The State's History with Year-Long Operation 119
The Fiscal Impact of Year-Round Operation 120
Programmatic Benefits and Costs of Year-Round Operation 122
Conclusions 122
Bibliography 123
5. The Role of Accredited IndependentInstitutions in Meeting California'sFuture Enrollment Demand 125
Introduction 125
California's Private Postsecondary Institutions 126
Enrollment Trends in the Comparable Institutions and FactorsAffecting Them 127
Impact of Increases in the Maximum Cal Grant A Award onUniversity-Comparable Independent Institution Enrollment Levels 128
Capacity Available in Both the University- and State University-Comparable Independent Institutions 129
Cost-effectiveness of Using the Independent Institutions 131
Conclusion 134
Methodological Note 134
References 135

6, Joint or Shared Use of Facilities inHigher Education in Selected States ii
Major Approaches 137
Scope of the Paper 137
The Higher Education Cent(Ir Model 137
Joint or Shared-Use Facilities 140
California's Past and Present Experience witb Shared Facilities 143
Concl usions 144
Bibliography 145

Displays
1. Planning Our Future
1. Section 66903, California Education Code 2-3
2. Supplemental Budget Language 45
3. Ethnic Population Chauge in California, 1970-2020 9
4. Projected Thtal State Population by Race/Ethnic Group, 1985-2020 10
5, Projected Enrollment Growth in California Public Education, 1988-2005 11
6 Enrollment Projection Methodologies of the Segments and theDepartment of Finance 13
7. Timeline for the California State University's Annual EnrollmentPlanning Process, 1989-90 Through 1993-94 15
8. The California State University Allocated Annual Full-Time-EquivalentStudents, 1988-89 to 1993-94 16
9. University of California Model-Based Undergraduate EnrollmentProjections, 1988-89 Through 2005-06 18
10. University of California Graduate Enrollment Estimates, 1988-89Through 2005-06 19
11. Timeline for the California Community Colleges' Annual CapitalOutlay Planning Process 24
12. Timeline for the California State University's 1990-91 CapitalOutlay Planning Cycle, 1988 Through 1990 30
13. Calendar of the University of California's Process for Developingthe Capital Improvement Budget in a Typical Year 34
14. State General Fund Expenditures, 1987-88 35
15. State Operations and Local Assistance 36

2. Cost Estimates and Simulations for Capital Outlay Planning
1. Capital Outlay Costs for New Education Centers, CaliforniaCommunity Colleges 61
2. Capital Outlay Cost Estimates for Construction of New Off-CampusCenters and Built-out Campuses of California Community Colleges,in 1988 Dollars 62
3. Capital Outlay Cost Estimates, California Community Colleges, 1988to 2005 62
4. Planning Rules and Assumptions, Community College Long-RangeCapital Outlay Planning Model 63-64
5. Capital Outlay Program for the Contra Costa Off-Campus Centerof the California State University, Hayward, 1989-90 65
6. Capital Outlay Program for the California State University,San Marcos,1989-90 66
7. Projected Costs, State-Funded Capital Improvement Program,San Marcos Campus, (ENR 4665) 67
8. Summary of Projected Costs, State-Funded Capital ImprovementProgram, California State University, San Marcos (ENR 4665, 1989) 68
9. Projected Capital Outlay Needs of the California State University,1990-2005 68
10. Capital Outlay Cost Estimates for Transition From an Off-CampusCenter to a Full- Service California State University Campus,in 1988 Dollars 68
11. Revised Restudy Standards for the Resource Requirements Study 69
12. Cost Methodology for New Construction, University of California 70
13. Core Campus Assumptions 71
14. Estimated Annual Capital Costs for a Tenth University of CaliforniaCampus (New Construction Only), in Thousands of Dollars 72-74
15. Estimated Additional General Fund and Student Fee-FundedAnnual Operating Needs for a Tenth University of CaliforniaCampus with 7,000 Students, in Thousands of Dollars
1
'75

16. University of California Start-Up Costs Estimates (ENR = 4828, 1990) 76
17. University of California Assumptions Used in Calculating CostEstimates for New Campuses 76
18. University of California Capital Outlay Cost Estimates forConstruction and Build-Out of a New Campus (1988 Dollars) 76
19. University of California Build-Out Cost Estimates (ENR= 4828, 1990) 76
N. Capital Outlay Cost Estimates for Construction of New Campusesin Each of California's Public Segments of Higher Education, in1988 Dollars
3. Cost Estimates and Simulations for Operating Budgets
1. Current Fund Educational and General Expenditures and Transfersfor Campuses of the University of California, Fiscal Years 1986and 1987
2. Current Fund Educational and General Expenditures and Transfersfor Campuses of the University of California, with Health Sciences-Related "Instruction" and "Academic Support" ExpendituresExcluded, Fiscal Years 1986 and 1987
3. Current Fund Educational and General Expenditures and Transfersfor Campuses of the University of California, with Healta Sciences.Related "Instruction" and "Academic Support" ExpendituresExcluded and with "Student Services" Health Sciences-RelatedExpenditures Discounted, Fiscal Years 1986 and 1987
4. Current Fund Educational and General Expenditures an0 Transfersfor Campuses of the University of California, with Heal th SciencRelated Expenditures Excluded from the Direct Instruction andAdministrative Categories Discounted, Fiscal Years 1980, and 1987
78
104.105
108-109
110.111
1.12-11:0
5. Current Fund Educational and General Expendicures and Transfersfor the California State University, Fiscal Years 1986 and 1987 1114-115
6. Current Fund Educational and General Expenditures and Transfersfor the California Community Colleges, Fiscal Years 1987 and 1986 116

5. The Role of Accredited Independent Institutionsin Meeting California's Future EnroPment Demand
1. Independent California Institutions with Admissions StandardsComparable to Those of the University of California and theCalifornia State University
2. Annual Percentage Change in the Number of California High SchoolGraduates and in the Participation Rate Of California Residents inIndependent Institutions Comparable to the University of Californiaand the California State University, 1977-1988
126
127
3. Indexed Percentage Change in Participation Rates for California'sFour-Year Postsecondary Education Segments, 1977 Through 1988 128
4. Potential Capacity Available at Independent Institutions withAdmission Standards Comparable to the University of California 130
5. Potential Capacity Available at Independent Institutions withAdmission Standards Comparable to the California State University 131
6. Costs to the State of Increasing the Maximum Cal Grant A Awardto the Level Called for by Le Adjustment Policy to Redirect 1,500Students Each Year to Independent Institutions 132
7. Costs to the State of Supporting 1,500 New Students Each Year atthe University of California 133

Planning Our FutureA Staff Background Paper on Long-Range Enrollment
and Facilities Planning in California Public Higher Education
Introduction
Background to the Commission'sinvolvement in long- range planning
Section 66903 of the California Education Code(Display 1, pp. 2-3) authorizes the California Post-secondary Education Commission to collaboratewith the public segments on long-range planningand requires the segments to develop long-rangeplans that identify the need for and location of newfacilities. The Commission also has responsibilityfor approving sites for new campuses and off-cam-pus centers.
In addition to this statutory authorization for theCommission's involvement in long-range planning,both the Commission for the Review of the MasterPlan and the Legislature's Joint Committee for Re-view of the Master Plan have recently recommendeda reinvigorated statewide planning process to bemanaged by the Postsecondary Education Commis-sion. The Master Plan Review Commission, in its1987 final report, recommended:
24. The California Postsecondary EducationCommission shall have the following respon-sibilities with regard to long-range planning inconsultation with the segments: (1) devel-opment of a common definition of long-rangeplanning; (2) development of a common set ofassumptions upon which such planning is to bebased; (3) review of segmental activities to ver-ify that they periodically prepare and updatelong-range plans based upon the common set ofassumptions; and (4) annual preparation of de-tailed 20-year projections of postsecondary en-rollment in the public and private sectors at alllevels of instruction, built upon the projectionsprepared by the Department of Finance (p. 40).
Note: The Commission originally published this paper inApril 1989 as Report 89-18. In this version, the enrollmentprojections on pages 10-12 have been updated from the compa-rable statistics in the previous version.
Response of the Commission
In order to more fully examine these issues anddefine its own role in long-range planning, in Sep-tember 1987, the Commission formed an Ad HocCommittee on Long-Range Planning to review therecommendations of the Master Plan Review Com-mission within the context of the PostsecondaryCommission's overall planning pricrities. The AdHoc Committee presented its final report to the Post-secondary Commission on May 2, 1988, in whicli itconcluded that the urgency of the planning pri-orities facing the State requires the Commission toassume an active role in long-range planning, al-though one somewhat different than that suggestedby the Master Plan Review Commission. The AdHoc Committee viewed this as necessary because itcame to the conclusion that uniformity of enroll-ment projection methodologies and long-range plan-ning approaches, while relevant, is less importantthan ensuring that the segments' projection meth-odologies are reasonable, compatible where appro-priate, and that their planning capacities are ade-quate and geared to the particular needs of the seg-ments. The Committee also sensed that a pro-tracted debate about methodology and definitionswould not be the most efficient or effective way tolead the process
The Ad Hoc Committee identified three major rolesfor the Commission to play in the area of long-rangeenrollment and facilities planning -- rescdarch, co-ordination, and leadership.
Its research responsibility centers on the integra-tion of existing information as well as the devel-opment of new data, as necessary, relating tolong-range enrollment and facilities planning.
Its coordination responsibility centers on estab.lishing a dialogue between the segments thr.will allow a careful examination of the cumula-tive effects of individual segmental plans, in astatewide context.
; 1

DISPLAY 1 Section 66903, California Education Code
The commission shall have the following functions and responsibilities in its capacity as the statewide post-secondary education planning and coordinating agency and adviser to the Legislature and Governor:
1. It shall require the governing boards of the segments of public poasecondary education to develop andsubmit to the commission institutional and systemwide long-range plans in a form determined by thecommission after consultation with the segments
2. It shall prepare a five-year state plan for pi,st secondary education hich shall integrate the planningefforts of the public segments and other pertinent plans. The commission shall seek to resolve conflictsor inconsistencies among segmental plans in consultation with the segments. If such consultations areunsuccessful the commission shall report the unresolved issues to the Legislature with rec-ommendations for resolution. In developing such plan, the commission shall consider at least the fol-lowing factors: (a) the need for and location of new facilities, (b) the range and kinds of programs appro-priate to each institution or system., (c) the budgetary priorities of the institutions and systems of post-secondary education, (d) the impact of various types and levels of student charges on students and onpostsecondary educational programs and institutions, (e) appropriate levels of state-funded studentfinancial aid, (f) access and admission of students to postsecondary education, (g) the educational pro-grams and resources of private postsecondary institutions, and (h) the provisions of this division dif-
'ntiating the functions of the public systems of higher education.
3. 1 ! all update the state plan annually.
4. It shall participate in appropriate stages of the executive and legislative budget processes as requestedby the executive and legislative branches and shall advise the executive and legislative branches as towhether segmental programmatic budgetary requests are compatible with the state plan It is not in-tended that the commission hold independent budget hearings.
5. It shall advise the Legislature and Governor regarding the need for and location of new institutionsand campuses of public higher education.
6. It shall review proposals by the public segments for new programs and make recommendations regard-ing such proposals to the Legislature and the Governor.
7. It shall, in consultation with the public segments, establish a schedule for segmental review of selectededucational programs, evaluate the program review processes of the segments, and report its findingsand recommendations to the Governor and the Legislature.
8. It shall serve as a stimulus to the segments and institutions of postsecondary education by projectingand identifying societal and educational needs and encouraging adaptability to change
9. It shall develop and submit plans to the Legislature and the Governor for the funding and administra-tion of a program to encourage innovative educational programs by institutions of postsecondary edu-cation.
10. It shall collect or conduct or both collect and conduct studies of projected manpower supply and de-mand, in cooperation with appropriate state agencies, and disseminate the results of such studies to in-stitutions of postsecondary education and to the public in order to improve the information base uponwhich student choices are made.
11. It shall periodically review and make recommendations concerning the need for and availability ofpostsecondary programs for adult and continuing education.
(continued)
2

DISPLAY 1 (continued)
12. It shall develop criteria for evaluating the effectiveness of all aspects of postsecondary education
13. It shall maintain and update annually an inventory of all off-campus programs and facilities for edu-cation, research, and community service operated by public and private institutiGns of postsecondaryeducation.
14. It shall act as a clearinghouse for postsecondary education information and as a primary source ofinformation for the Legislature, the Governor, and other agencies, and develop a comprehensivedata base insuring comparability of data from diverse sources.
15. It shall establish criteria for state support of new and existing programs, in consultation with thepublic segments, the Department of Finance, and the Joint Legislative Budget Committee,
16. It shall comply with the appropriate provisions of the Education Amendments of 1972 (P.L. 92-318) as specified in Section 67000.
17. It shall consider the relationships between academic and occupational and vocational educationprograms and shall actively encourage the participation of state and local and public and privatepersons and agencies with a direct interest in these areas.
Its coordination responsibility centers on estab-lishing a dialogue between the segments thatwill allow a careful examination of the cumula-tive effects of individual segmental plans, in astatewide context.
Its responsibility of leadership centers on stimu-lating a focused and productive statewide debateover the major planning and policy issues sur-rounding long-range enrollment and facilitiesplanning.
It is the Commission's view that in this leadershiprole, it should seek to support a dynamic and multi-dimensional planning capacity among the seg-ments. .1iis stems from the presumption that anadequate and effective planning capacity is centralto the ability of the segments to perform a variety ofother management functions, including the abilityto effectively articulate current and future needs.
Adding to the call for the Commission to take a leadrole in long-range enrollment and facilities plan-ning, the Legislature enacted Supplemental BudgetLanguage in June 1988 directing the Commissionto initiate its long-range planning process by devel-oping recommendations for the Legislature and theGovernor on policy variables that will influence the
need for and costs of new facilities through the year2005 (Display 2, pp. 4-5).
Origins of the background paper
As a result of these internal and external calls foran expanded planning role for the Commission, inJune 1988 the Commission embarked on a majorstudy of long-range enrollment and facilities plan-ning to:
1. Identify the factors that will influence demandfor new postsecondary education facilities overthe next 20 years;
2. Identify and analyze those variables which aresusceptible to State-level policy control; and
3. Provide the Legislature and the Governor withrecommendations on the direction the Stateshould take with respect to the major factorsthat will shape the need and cost of new facilitiesthrough the year 2005.
The Commission authorized staff to proceed withthe project based on the staff's "Prospectus for aStudy of Long-Range Enrollment and FacilitiesPlanning in California Higher Education" of June1988 (Appendix A, pages 46-49 below). As a fir3t
3

DISPLAY 2 Supplemental Budget Language
Item 6420-001-001 (California Postsecondary Education Commission- Support)
In order to ensure that State decisions about new postsecondary facilities are consistent with State policyon access, equity, and choice and take into account total demand and total resource availability, the Statehereby directs the California Postsecondary Education Commission, in cooperation with the public and private postsecondary segments and in conjunction with the appropriate State fiscal agencies, to develop recommendations to the Legislature and the Governor on policy variables that will influence State costs fornew facilities through the year 2005. For the purpose of this item, new facilities shall be defined as expansion of individual campuses, construction of new campuses, off-campus centers, or other such expan-sion to accommodate increased enrollments.
The California Postsecondary Education Commission shall, by December 1989 develop recommendationsto the Governor and the Legislature on major policy variables that will shape the costs of new facilities.These shall include recommendations on the following:
1. Educational and fiscal policy variables to be used in selecting locations for new facilities, including ananalysis of the relative costs of accommodating expansion on facilities at new sites relati ve to expansionof existing campuses, as well as the costs of expanding access to public postsecondary education
2. Educational and fiscal policy variables influencing need for new facilities by age of stucknt and academic program type, including when traditional campus facilities are academically required, whennontraditional facilities can best meet demands for access and quality, and whether expanded access toinstructional computing or other emerging or nontraditional technologies can replace need for on-siteinstructional facilities;
3. Space and utilization standards for publi , postsecondary all ,tation;
4. Cost savings possible through use of year-round operatiors% and
5. Priorities for construction of new sites by geographic regien of the State.
These criteria shall be developed pursuant to the review by the Commission of enrollment projections forpublic postsecondary education through the year 2005. The review shall include available enrollment pro-jections from the Department of Finance and those developed by the public segments. The Commissionshall convene a facilities planning advisory group, to include representatives from the Department of Fi-nance, the University of California, the California State University, the California Community Colleges,the Association for Independent California Colleges and Universities, the Department of Finance and theOffice of the Legislative Analyst, for the purpose of consultation and advice on these recommendations.
Item 6440-001-001 (University of California, Main Support)
The Re gents of the University of California are requested to prepare stat6wide projections of demand forundergraduate and graduate enrollments through the year 2005. These projections shall then become thebasis for the development of a statewide plan for accommodating enrollment demand through the year2005, including plans for expansion of individual campuses and construction of new campuses, off-campuscenters, or other such expansion to accommodate increased enrollments. These plans are to be submittedby December 1990 to the State Department of Finance and 6he Legislative Analyst for comment andreview as well as to the California Postsecondary Education Commission for review and comment beforebeing submitted to the Governor and the Legislature.
Item 6610-001-001 (California State University, Main Support Budget)
The Trustees of the Califnrnia State University are requested to prepare statewide projections of demand
(continued)
4 1

DISPLAY 2 (continued)
for unaergraduate and graduate enrollments through the year 2005. These projections shall then becomethe basis for the development of a statewide plan for accommodating enrollment demand through the year2005, including plans for expansion of individual cariipuses and construction of new campuses, off-campuscenters or other such expansion to accommodate increased enrollments. These plans are to be submittedby December 1990 to the State Department of Finance and the Legislative Analyst for comment and re-view as well as to the California Postsecondary Education Commission for review and comment before be-ing submitted to the Governor and the Legislature.
Item 6870-001-001 (Community Colleges Board of Governors, Main Support Item)
The Board of Governors is requested to prepare statewide projections of demand for Community Collegecredit and non-credit enrollments through the year 2005. These projections shall then become the basisfor the development of a statewide plan for accommodating enrollment demand through the year 2005, in-cluding plans for growth at individual districts, as well as construction of new centers, campuses, or othersuch expansion to accommodate increased enrollments. These plans are to be submitted by December 1990to the State Department of Finance and the Legislative Analyst for comment and review as well as to theCalifornia Post:,acondary Education Commission for review and comment before being submitted to theGovernor and the Legislature.
step in the project, the staff sought to compile themost accurate and recent information available onthe methodologies and processes currently employ-ed by the relevant government and educationalentities with respect to enrollment and facilitiesplanning in California postsecondary education.
As the product of that initial background work, thispaper aims to establish a common understanding ofthe framework within which enrollment and facili-ties planning currently occurs in the public seg-ments of California's postsecondary education sys-tem. Specifically, the purposes of this backgroundpaper are two:
1. To establish a policy framework within whichthe Commission will examine and assess the plan-ning processes of the segments; and
2. To describe the processes and identify the majordifferences among the segments for (1) short-term enrollment planning, as utilized for the an-nual State budgeting process, (2) long-range en-rollment planning, as utilized for State capitaloutlay and institutional long-range planningpurposes, and (3) ongoing capital outlay plan-ning.
A policy context for theCommission's planning priorities
In order to establish a policy context within whichthe Commission can identify and evaluate the simi-larities and differences in the planning processes ofthe segments, the following paragraphs outline thegeneral uses to which institutional planning canand should be put, as well as some of the character-istics of effective short- and long-range planning.This discussion should not be considered prescrip-tive or definitive, however; in fact, to do so wouldrun contrary to the fluid and responsive approachesnecessary for effective planning. Rather, the follow-ing discussion should be viewed as a general ex-position of the importance of planning tl the abilityof a segment to set and meet its short- and long-range goals.
Caveats about planning
Certain dangers are inherent in overreliance on the"plans" generated by long-range planning activi-ties. No matter how effective and comprehensivethe planning process, the plans it generates will(and should) evolve as time goes on, when betterand more recent information is introduced into theprocess. The essential frame of reference, therefore,
I s

is the view that the planning process itself, ratherthan the plans it generates, is the essential productof good planning. As Dwight D. Eisenhower said:"Plans are nothing. Planning is everything."
While self-evident, one additional factor must becarefully considered when examining and makingjudgments about segmental planning efforts: Thesegments differ dramatically with regard to size,clientele, and institutional mission (Appendix B,pp. 49-50 below). These differences in size andmission may appropriately manifest themselves insubstantial disparities in the specific planningapproaches pursued by the segments.
For example, it may be that the managementcomplexities associated with administering the 70-district, 107-campus Community College system re-quire a somewhat more centralized planning ap-proach than is necessary in the nine-campus Uni-versity of California system. These differencesmust be recognized by State level policymakers,and in some cases encouraged.
As noted earlier, uniformity of approach in plan.ning is not nearly so important as ensuring thateach segment possesses an adequate planning capa-city that is structured to address and articulate theunique needs and goals of that system. As a resultof these fundamental differences, the Commissionmust be careful in its analysis to avoid the trap ofmaking comparisons of planning processes acrosssegmental lines that may not be appropriate oruseful.
Commonalities of planning
With these caveats firmly in mind, the Commissionstill believes that adequate and effective planningcapacities are central to the ability of all the seg-ments to perform a wide variety of managementfunctions, including the capacity to effectively articulate current and future needs. For this to occur,ard regardless of the specific structure employed toachieve it, planning must take place on severalinstitutional levels, and the information gleanedfrom planning should be utilized in a variety ofways to support and augment numerous aspects ofinstitutional management.
Starting from this premise, several commonalitiesbecome evident when examining successful institu-tional planning efforts. These similarities are not
6
specific prescriptions on how to plan, but rather rep-reseat the general features of a planning processthat serve to encourage and reinforce the sort ofintegrated, multiclimensional perspective towardplanning mentioned above:
1. Projection of future trends In its simplest form,planning is an affective tool for establishing quanti-tativu estimates of a variety of important factorssuch as future enrollmr,nts, future physical plantneeds, personnel trends, and the like This sort ofinstitutional research is central to the planningprocess, not only because of the value of the infor-mation it generates, but often beca we of the itera-tive process employed to determine which questionsshould be asked.
The Commission examines this portion of the seg-ments' planning activities to ensure that the seg-mental projections being conducted are reasonableand, where appropriate, comparable between seg-ments.
2. Establishment and evaluation of program andinstitution-wide goals: The merging of departmen-tal and institutional academic objectives with quan-titative trend data allows those involved in plan-ning to establish realistic and attainable goals andobjectives. In this dimension of planning, the proc-ess of goal-setting operates on a broad conceptuallevel, distinct from the specific strategies designedto accomplish the goals.
The Commission examines this aspect of the seg-ments' plauning processes to ensure that an ap-propriate linkage exists to integrate major state-wide educational goals (e.g., accommodation of eli-gible applicants, achievement of educational equitygoals, maintenance of educational excellence, etc 1into the goal setting processes of both individual de-partments and entire institutions. Conversely, thisexamination will also review and comment on theextent to which institutional goal-setting rec-ognizes and supports the unique local objectives ofindividual campuses and departments.
3. Institutional assessment in relation to goals: It isdifficult, if not impossible to plan for the future if anins,itution does not know where it is in the present.Planning is therefore an important mechanism notonly for assessing future needs and articulating fu-ture plans but also for evaluating and defining

where an institution currently stands, Planningcan and liould be viewed as an important mecha-nism through which institutions can integrate asystematic assessment of current needs and priori-ties with State and institutional policy directionsfor the future.
Similar to Item 2, the Commission examines thisaspect of institutional planning in order to deter-mine the extent to which program review and in-stitutional assessment is being informed and guidedby the broad educational goals and objectives oper-ating at the systemwide and statewide levels, whileat the same time preserving the degree. of localautonomy and discretion necessary to ensure thatindividual programs and campuses are cognizant of,responsive to, and supported in addressing theunique circumstances in which they find them-selves.
4. Assessment and articulation of present and futureresource needs: It is the Commission's view that themost effective planning processes create a vital ana-lytic base on which the program and resource needsof individual departments and entire institutionscan be grounded. The justification for present pro-gram and resource needs is sounder and more per-suasive when placed in a context, not only of what isnecessary to provide current levels of service, butalso of what is required in the present to ensure thatthe department or institution is where dezipion-makers want them to be at some point in the future.In addition, effective planning allows institutions toprovide "advance warning" to decisionmakers aboutlikely future resource requirements, enhancing thecredibility of proposals when they are made andhence, increasing the likelihood of their eventualadoption.
In this area, the Commission examines the plan-ning efforts of the segments to determine the extentto which both the short- and long-range resourceneeds of the segments are integrated and justifiedas a means of achieving clearly articulated long-range institutional and statewide goals. Accommo-dating projected enrollments, increasing student re-tention, achiev .. g educational equity, and improv-ing educationai quality are examples of broad insti-tutional goals which can and should be directly in-corporated into short- and long-range assessmentsof the resource, needs of the segments.
5. Strategy se, q: 1..frective institutional plan-ning often comprises the crucial link between broad-ly stated academic and other institutional goals andthe development of specific strategies needed toachieve them. Strategy setting can also serve as thesetting in which departments and institutions planon how to narrow the gap betweon program and in-stitutional goals and the resources required toachieve them. In this context, the planning processalso serves as the hub around which the differentprogram and administrative components of an insti-tution (faculty, finance, facility planning, etc.) cometogether to ensure that the translation of goals intostrategies occurs in an integrated environment,with all relevant operational and administrativeunits playing important roles.
The Commission examines this aspect of institu-tional planning in order to assess the extent towhich the development of specific program and in-stitutional strategies is linked to broad program, in-stitutional, and statewide goals of the kind outlinedpreviously. Further, the staff will attempt to assessthe extent to which the process of strategy settinginvolves the wide variety of campus and system-wide constituencies necessary to ensure that abroad-based, institutionwide perspective is broughtto bear on this critical phase of the planning proc-ess.
6. Planning as an integrated management tool:Through integration of planning with ongoing pro-gram review and evaluation and the short-termbudgetary and management processes of an institu-tion, long-range planning is informed by the latestassessment of the status of the institution, and theevaluative and short-term management processesare informed by a better understanding of the long-range goals of the institution. The integrated plan-ning approach also helps ensure that the plannersare aware, as soon as possible, of any deviations inprojected enrollment, budgetary, arid personneltrends.
This aspect of the Commission's analysis focuses onthe level of integration achieved in the segments'individual planning processes, with special empha-sis placed on documenting the extent to which state-wide planning is informed by the local circum-stances of individual departments and campuses,and the extent to which local departmental and in-
7

stitutional planning is informed by broad system-wide and statewide goals of the type outlined above.
7. State-level influences on instituti:onal planningactivities: While the e.'cter al influences brought tobear on institutions by the State Legislature, theGovernor, and various State agencies are not part ofthe planning processes of the segments per se, theystand as a stark reminder that institutional plan-ning 43 not conducted in a vacuum. With this inmind, the Commission's examination of the plan-ning activities of the segments is proceeding along-side of a careful assessment of the statutes, policies,practices, and traditions imposed at the statewide.level that may have positive or detrimental effcctson the planning processes of the segments.
In this area, the Commission seeks to identify anyofficial or unofficial constraints on segmental be-havior, imposed at the statewide level, which serveto compel or encourage institutional activity whichis inconsistent with either effective planning or theachievement of broadly accepted educational goals.For example, if some aspect of the State budgetprocess creates disincentives for a segment to con-duct long-range fiscal planning, the staff wouldhope to identify those factors in this portion of itsanalysis.
Summary
From the Commission's view, it is not essential, andmaybe not even possible, for all three segments toundertake planning for all the purposes previouslyoutlined. But as the Commission examines the spe-cific enrollment and facilities planning processes ofthe segments, it assumes that, especially in an eraof growth, the segments should have a roughlyequivalent capacity, or at least the choice to havethe capacity, to perform integrated planning in amanner similar to that described above. To do anyless would be to cheat both the segments and theState's educational policymakers out of importantinsights into the possible options for Californiapostsecondary education in the twenty-first cen-tury.
8
Population projections
The crucial building block for almost all enrollmentprojections conducted in Califorma is State popula-tion estimates. Since elmost all Aspects of in-stitutional planning eventually rely to some degreeon projections of future enrollments, it is essentialthat the Commission and segments have a high lev-el of understanding and confidence in the popula-tion estimates on which those enrollment pro-jections are based.
California's population projecting unit
Section 13073.5 cf the Government Code declaresthat:
(1) population size and distribution patterns inCalifornia exert a nisior inflmnce on the phys-ical, social, and eeonomic structure of the stateand on the quality of the environment general-ly; (2) sound and current data and methods toestimate population trends are necessary to en-able state, regional, and local agencies to planand function properly; and (3) there is a criticalneed for a proper study of the implicetions ofpresent and future population trends in orderthat state, regional, and local agencies mightdevelop or reexamine policies and actions basedthereon.
The Legislature has charged the Demographic Re-search Unit within the Department of Finance tofill these needs as the State's single official demo-graphic agency. Under Section 13073 of the Gov-ernment Code, the Unit is to provide adequatedemographic data to aid effective State and localplanning and policymaking and to serve all levels ofgovernment and the private sector as the central-ized source of demographic data. Thus the Unit isnamed es the primary State government liaisonwith the U.S. Bureau of the Census in the acqui-sition and distribution of census data and relateddocumentation to State agencies, in addition to itsmany other duties.
Appendix C on page 50 describes the methodologyemployed by the Unit to prepare its statewide popu-lation estimates.
Population projections through 2020
The most recent population projections released bythe Demographic Res, rch Unit reconfirm that thewatchwords for California's changing populationare diversity and growth. The State is continuingits already well-documented march toward becom-ing the first mainland state with no ethnic/racialmajority population. Already, Black, Hispanic, andAsian/Pacific children combined comprise the ma-jority of the State's school students from kinder-garten through eighth grade. The State is on athreshold of a time (currently projected to occur inthe year 2003) when no ethnic subgroup will consti-tute more than 50 percent of the population -- quiteliterally a time whan there will no longer be any"minority" or "majority" groups.
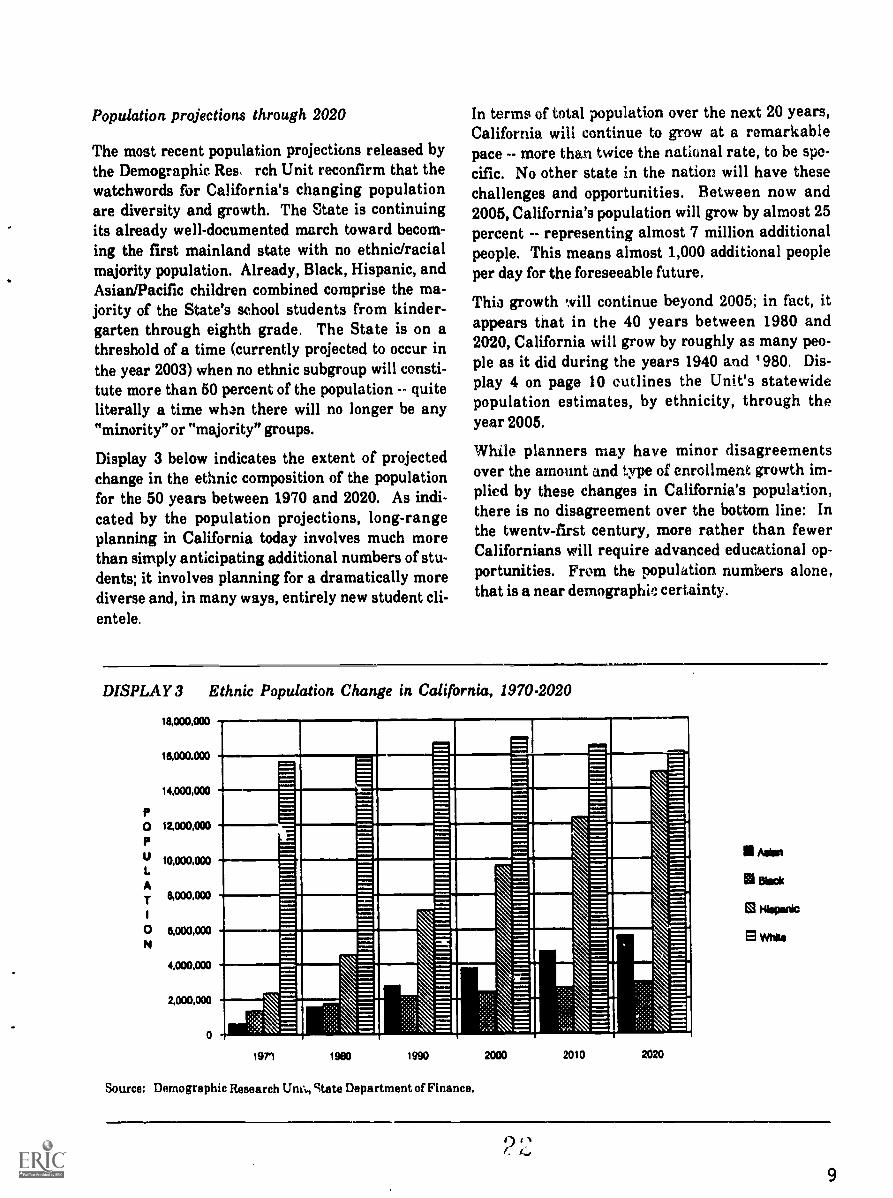
Display 3 below indicates the extent of projectedchange in the ethnic composition of the populationfor the 50 years between 1970 and 2020. As indi-cated by the population projections, long-rangeplanning in California today involves much morethan simply anticipating additional numbers of stu-dents; it involves planning for a dramatically morediverse and, in many ways, entirely new student cli-entele.
In terms of total population over the next 20 years,California will continue to grow at a remarkablepace -- more than twice the national rate, to be spe-cific. No other state in the nation will have thesechallenges and opportunities. Between now and2005, California's population will grow by almost 25percent -- representing almost 7 million additionalpeople. This means almost 1,000 additional peopleper day for the foreseeable future.
This growth will continue beyond 2005; in fact, itappears that in the 40 years between 1980 and2020, California will grow by roughly as many peo-ple as it did during the years 1940 and ' 980. Dis-play 4 on page 10 outlines the Unit's statewidepopulation estimates, by ethnicity, through theyear 2005.
While planners may have minor disagreementsover the amount and type of enrollment growth im-plied by these changes in California's population,there is no disagreement over the bottom line: Inthe twenty-first century, more rather than fewerCalifornians will require advanced educational op-portunities. From the popuhition numbers alone,that is a near demographic certainty.
DISPLAY 3 Ethnic Population Change in California, 1970-2020
L.
A
1
0
18,000,000
16,000.000 ----
14,000,000
12.000000
10,000,000
8,000,000
6,000,000
4,C00,000
2,000,000
111
1911 1980 1990
Source: Demographic Research Unk.., state Department of Finance.
=
:::
2000 2010 2020
0 I 111. k",,
9

DISPLAY 4 Projected Total State Population by Race/Ethnic Group, 1985-2020
Year Asian/OtE sr Black Hispanic White Total*
1985 2,228,100 1,984,100 5,844,900 1 6,308,000 26,365,1001990 2,799,200 2,157,000 7,099,100 16,715,900 28,771,2001995 3,324,400 2,301,300 8,368,000 16,962,000 30,955,7002000 3,805,300 2,424,300 9,664,800 16,958,100 32,852,6002005 4,255,000 2,545,900 10,985,700 16,759,800 34,546,3002010 4,713,600 2,683,100 12,343,500 16,537,300 36,277,4002015 5,176,200 2,824,300 13,672,800 16,331,000 38,004,3002020 5,615,200 2,962,500 14,948,300 16,092,500 39,618,500
*Sum of race/ethnic groups do not add to Total due to independent rounding.
&Name: Demographic Research Unit, State Department of Finance.
Long-range enrollment projections
Background
Enrollment projections in California postsecondaryeducation represent the essential foundations forannual operating and capital outlay budgets, facil-ities planning, academic planning, personnel re-cruitment, admissions policies, and nearly everyother facet of the management and administrationof higher education.
« Projected enrollments, in terms of average dailyattendance, weekly student contact hours, full-time egnivalents, and headcount are the basicbuilding blocks in the budget formulas that drivethe preparation of the annual operating budgetsat the segmental, district, and campus levels.
In the context of long-range planning, enroll-ment projections represent the single most im-portant factor in determining the need for newfacilities, and in so-ne cases, entirely new cam-puses. Very literally, the expenditure of hun-dreds of millions of dollars can swing on the ac-curacy of enrollment projections.
It is essential, therefore, that policymakers rec-ognize the limitations inherent in projecting long-range enrollments, and at the same time do all they
10
can to ensure that these estimates are calculatedwith extreme care and with professional judgment.
Three entities are currently involved in producingenrollment projections for California's public post-secondary education segments -- (1) the Demo-graphic Research Unit of the State Department ofFinance, (2) the University of California, and (3) theCalifornia State University. The Chancellor's Of-fice of the California Community Colleges currentlydoes not prepare enrollment projections for that seg-ment and thus it relies exclusively on official es-timates from the Demographic Research Unit forcapital outlay planning.
The Demographic Research Unit prepares enroll-ment projections for the University of Californiaand the Californi!: State University, but its projec-tions are advisory to these two segments and serveas a check on the projections they prepare and uti-lize for their own planning purposes. (Appendix Don page 51 presents a detailed description of theUnit's method for projecting their enrollments.)
Recent projections
Based on the projections currently being used by thesegments for long-range planning purposes, indi-cations are that enrollm6nts for all of public edu-cation will grow through 2005 by approximately 31percent, with the California Community Collegesand the University of California growing by 30 per-

cent and 44 percent, respectively, and the StateUniversity by 54 percent.
Within these totals, the State University projectsthat its undergraduate population will grow at asubstantially faster rate than its graduate enroll-ment (66 percent to 7 percent), while just the oppo-site is true for the University of California, whichprojects that its undergraduate enrollment willgrow by 34 percent while its graduate enrollmentwill increase by 80 percent (Display 5).
It should be noted that the State University's long-range enrollment projections are preliminary esti-mates generated in the very early stages of its ownlong-range planning process. The substantial in-creases in these projections, as compared to pre-vious Demographic Research Unit and State Uni-versity estimates, can be attributed to the fact thatthey incorporate optimistic assumptions on prog-ress in providing access to historically underrep-resented students. Specifically, the State Univer-sity's projections assume that by 2005 the partici-pation rates for Black and Hispanic students willequal those of their white counterparts. These pro-jections were prepared by the Office of the Chan-cellor and precede a request to the campuses to out-
line the extent to which they can individually ac-commodate growth through the year 2005. As a re-sult of the preliminary and ongoing nature of theState University's planning process, it is likely thatthese enrollment projections w ii undergo revisionover time, as a result of refinements in the projec-tion model and discussions with the campuses. Solong as policymakers have a clear understanding ofwhere demographic influences stop and where pol-icy objectives begin, this projection approach is en-tirely consistent with the notion that the segments'planning figures should reflect more than just trenddata, but should also incorporate the effects ofachieving institutional goals to which the State andthe segments are committed. A more detaileddescription of the methodology employed in theseprojections can be found in Appendix E on pp. 51-52.
It should also be noted that the University's grad-uate enrollment estimates are not, and never havebeen, driven by demographic trends. Rather, theyflow from a variety of policy considerations, such asthe need to replenish the faculty ranks and the needto maintain an appropriate graduate/undergradu-ate student balance on campuses.
DISPLAY 5 Projected Enrollment Growth in California Public Education, 1988-2005
1988 2005Percentage
Growth
California Community Colleges Total 1,321,007 1,714,000 30%
California State University Undergraduates 280,800 465,500 66%California State University Graduate and Postbaccalaureate 70,900 75,800 7%California State University Total 351,700 541,300 54%
University of California Undergraduates 117,809 158,425 34%University of California Graduate and Professional 25,851 46,431 80%University of California Total* 142,070 204,856 44%
K-12 Total 4,509,504 5,979,000 33%
Total Growth in Public Postsecondary Education 1,814,777 2,460,156 36%Total Growth in Public Education 6,324,281 8,439,156 33%
*Excludes University ofCalifornia Health Science Enrollments.
Source: Projections for the California Community Colleges and K-12 from the Demographic Research Unit, State Department ofFinance. University of California projections from the University, and California State University projections from CSU.
11

With respect to growth in the public school system,the numbers are just as dramatic. Between 1988and 2005, that system will likely add more than 1.4million new students, representing growth of 33pereent. Compared to projected State populationgrowth of 24 percent, it is clear that quality im-provement will not be the only issue on the reformagenda for the schools, but that accommodation ofsubstantially higher enrollments will also be a ma-jor factor driving their resource needs.
Demographic base
All three producers of enrollment projections utilizeeither directly or indirectly the baseline populationprojections prepared by the Demographic ResearchUnit discussed in Part Three. The Unit itself relieson the most recent population projections for Cali-fornia, stratified by age, sex, and county; the Uni-versity of California utilizes the Unit's projectionsof K-12 enrollments (which flow directly from thepopulation projections); and the California StateUniversity (for its long-range projections) employsthe Unit's projections of statewide population,stratified by age, sex, and county of origin.
The Unit updates its K-12 projections annually,based on the results of the Department of Educa-tion's annual census of schools. (Appendix F on pp.52-53 presents a detailed discussion of the K-12 en-rollment projection methodology.)
Enrollment projection methodologies
Display 6 offers a summary comparison of the en-rollment projection methodologies of the segmentsand the Unit. As can be seen, the Demographic Re-search Unit and the California State Universityboth produce their university-level enrollment pro-jections by applying observed and/or projected par-ticipation rates of specific categories of students(age, sex, and county of origin), to projected popula-tion estimates in those categories developed by theUnit.
The University of California applies anticipatedparticipation rates of California high school stu-dents to estimates of future high school enrollmentto project entering freshmen. It then applies antic-ipated continuation rates to the previous year's en-rollment estimates to generate its base demograph-ic projection.
12
In addition, the University's model allows, amongother factors, the addition of explicit assumptionsconcerning ethnic change and latent demand to thebase demographic projection. Since the capacity toincorporate different assumptions allows numerousvariations on the same basic model, the Universityhas usually presented its enrollment projections asa range of potential enrollment levels.
Community college enrollment estimates for capitaloutlay purposes are projected by the Cult throughuse of an age/sex participation rate model that uti-lizes historical and projected county populations byage and sex, and community college enrollmentdata by age, sex, and enrollment category. The pop-ulation base for each community college district isthe county or counties in which it is geographicallylocated, minus any population present in militarybarracks or State institutions and full-time stu-dents in local four-year colleges. (Appendix G onpage 53-55 contains a more specific description ofthis methodology.)
The Unit also prepares statewide adult populationestimates that are used to calculate annual budgetallocations for the community colleges, but neitherthe Unit nor the community colleges prepare enroll-ment estimates that can be used for short-term"next year" enrollment planning.
Segmental enrollment planning
California Community Colleges
There is general agreement that the current enroll-ment planning and annual budgeting mechanismfor the California Community Colleges is inade-quate and in naed of substantial change. In fact, re-cently enacted reform legislation (Assembly Bill1725, Vasconcellos) and the voter-approved Propo-sition 98, have set the stage for the community col-leges to undergo dramatic reform in the way theirannual needs are calculated for budgeting purposes.While it is too early to comment on the pace andform in which these reforms will proceed, it is likelythat the next flve years will see a major transitionby the community colleges away from the enroll-ment planning and budgeting process describedhere.

DISPLAY 6
EnrollmentForecasters
Universityof California
-/......paar.=vons r ..........mts.......m.Enrollment Projection Methodologies of the Segments. and the Department of Finance
DemographicBase End-Year
DemographicResearch UnitK-12 EnrollmentProjections(From StateDepartmentof EducationK-12 Census)
2005
CampusSoecific Methodology VariabAes
Yes Applies observedand projected enrollmentrates to DemographicResearch Unitestimates of high schoolstudents and their expectedcontinuation rates tolast year's enrollment.
Yes (ethnicchange, latentdemand,undothers)
The CaliforniaState University
DemographicResearch UnitPopulationEstimates (byage, sex, andcounty of origin)
200b No Applies observedand projectedenrollment ratesfor specific categoriesof students to projectedpopulation in thosecategories, as estimatedby the DemographicResearch Unit.
Yes (ethnicchange)
DemographicResearch Unit,California StateDepartmentof Finance
DemographicResearch UnitPopulationEstimates (byage, Fmx, andcounty of origin)
UC: 1996, 2010" UC: NoCSU: 1996, 2010" CSU: NoCCC: 1996° CCC: By
District
Applies observed -enrollment rates forspecific categories ofstudents to projectedpopulation in thosecategories, as estimatedby the DemogrtaphicResearch Unit.
No"
*Extended forecasts.
"These forecasters are currently in the process of reviewing and revising their methodologies to accommodate considerationof additional variables.
Source: California Postsecondary Education Commission.
The community colleges' annual budget appropri-ations, like those of the University and State Uni-versity, are largely enrollment driven. However,the manner in which the colleges' enrollments areprojected and defined is dramatically different thanthat found in either of the universities. To begin,annual enrollments in the community colleges aremeasured and budgeted in average daily atten-dance (ADA) -- the same enrollment measuring unitused in the public school system. Average daily at-tendance in the community colleges is measured bya statutory formula in which 478 hours of actualclass attendance or "seat time" equals one ADA.This 478-hour figure is derived by taking 525 hours-- a figure equal to one student taking a full ckssload for one year -- and multiplying by an "absencefactor" of .911, or the percentage of students whoare generally absent each day.
For budgeting purposes only, the Demographic Re-search Unit annually conducts a statutorily definedestimate of percentage movement in the statewideadult population. (Appendix H on pp. 55-56 offers amore detailed discussion on how the Unit estimatesthese population changes.) The annual estimatedpercentage change in adult population is then ap-plied strictly as a budgeting formula to calculatethe annual change in the community colleges' fund-able enrollments for the entire system. For exam-ple, and discounting adjustments for inflation, if theUnit prqjects a 2 percent increase in statewide adultpopulation for the next year, that translates forbudgeting purposes into a projected 2 percent in-crease in fundable average daily attendance for theent ire community college system.
Thi ; process is described in greater detail in PartSix below on the State budget, but it should be
I)1. °,'.1
1 3

noted here that this approach to projecting budget-ary needs does not allow "enrollment planning" inthe normal sense of the term. Its most obviousshortenming is that a shift in district adult popula-Um may or may not correspond to shifts in the sizeof the primary college-going age cohorts. In fact, incases where growth in the primary college-going co-horts have outstripped growth in adult populationas a whole, it is likely that ADA-based budgeting hashad the effect of underfunding enrollment demandto such a degree that the enrollment in some dis-tricts, at least in high-cost programs, has beencapped contrary to the intent of the Master Plan.As a result, this approach to annual budgeting inthe community colleges has come under increasingcriticism in recent years, resulting in the reform ef-forts mentioned above.
The California State University
The enrollment projections currently utilized for en-rollment planning in the California State Univer,sity are distinct and separate from the long-rangeprojections discussed in the previous part of this re-port, although we expect that as the State Uni-v6rei-ty moves further along in its long-range planningefforts, the campus enrollment allocations (and theprojections driving them) will more fully integratethe information and assumptions developed fromthe newer projections.
Initial five-year campus enrollment allocations foracademic planning, capital outlay planning, andthe annual support budget of the California StateUniversity are developed based on systemwide en-rollment projections generated by recent campusexperience and the State University's enrollmentprojection model, known as the California HigherEducation Enrollment Projection model or CHEEP.(Appendix I on pp.56-57 contains a methodologicaldescription of this model.)
These proposed allocations are reviewed in the Of-fice of the Chancellor by the Enrollment PlanningCouncil before being sent to the campuses. Thiscouncil is chaired by the vice chancellor for aca-dernic affairs and includes the vice chancellors forbusiness affairs, faculty and staff relations, and uni-versity affairs plus representatives from academicaffairs, resources, analytic studies, budget planningand administration, and physical planning and de-velopment divisions of the office. This composition
1 4
of the council aims to insure that the enrollment al-location process receives a thorough high-level re-view by all of the appropriate divisions.
The proposed allocations are distributed to the cam-puses in February. (Display 7 on the opposite pageprovides a timeline for the entire enrollment projec-tion/budget development process.) The campuses,using their own enrollment projection and planningtechniques independent of the CHEEP model, maypropose alternative enrollment allocations for thesame five-year projection period.
Differences in the proposed allocations become thebasis for discussions between the individual cam-puses and the Office of the Chancellor. The system-wide total enrollment projection is an overall con-straint on this process. Although individual cam-pus enrollments may be negotiated up or down, thetotal of all negotiations does not deviate substan-tially from the projected system total. The partic-ular situations and planning objectives of the indi-vAival campuses must be balanced with the need toellocate the systemwide enrollment projectionamong the 19 campuses. Campuses have substan-tial influence, but not complete control, in deter-mining enrollment allocations for budget purposes.The final allocations are agreed on by both the cam-pus and the Chance T.
The end result of th k. iegotiation process is the en-rollment allocations that are adopted as State Uni-versity policy. The enrollment allocation for thenext budget year becomes the official projection fordeveloping the support budget, and the five-year al-locations become the official figures used for aca-demic planning and developing the capital outlaybudget.
Allocations for the five-year projection period areupdated annually as one of the first steps in thebudget development process. The updates reflectthe most recent enrollment experience in the sys-tem. (Display 8 on page 16 shows the most recentcampus enrollment allocations available for the sys-tem.)
University of California
Enrollment planning at the University of Cali-fornia is an intensive effort between the Office ofthe President, which monitoes Universitywide in-terests, and the campuses, which establish academ-ic priorities. The distinguishing characteristic of
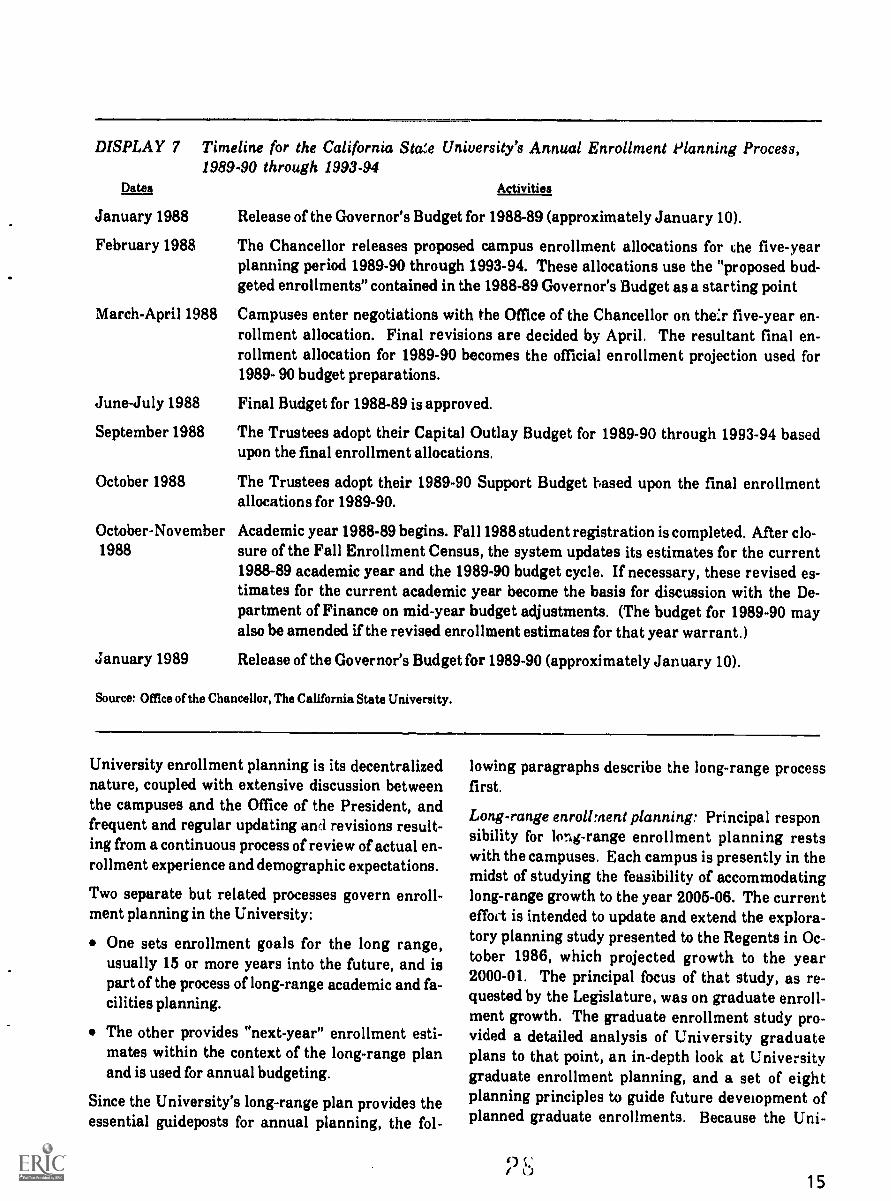
DISPLAY 7 Timeline for the California Stcee University's Annual Enrollment Planning Process,1989-90 through 1993-94
Dates Activities
January 1988 Release of the Governor's Budget for 1988-89 (approximately January 10).
February 1988 The Chancellor releases proposed campus enrollment allocations for che five-yearplanning period 1989-90 through 1993-94. These allocations use the "proposed bud-geted enrollments" contained in the 1988-89 Governor's Budget as a starting point
March-April 1988 Campuses enter negotiations with the Office of the Chancellor on the:r five-year en-rollment allocation. Final revisions are decided by April. The resultant final en-rollment allocation for 1989-90 becomes the official enrollment projection used for1989- 90 budget preparations.
June-July 1988 Final Budget for 1988-89 is approved.
September 1988 The Trustees adopt their Capital Outlay Budget for 1989-90 through 1993-94 basedupon the final enrollment allocations.
October 1988 The Trustees adopt their 1989-90 Support Budget based upon the final enrollmentallocations for 1989-90.
October-November Academic year 1988-89 begins. Fall 1988 student registration is completed. After clo-1988 sure of the Fall Enrollment Census, the system updates its estimates for the current
1988-89 academic year and the 1989-90 budget cycle. If necessary, these revised es-timates for the current academic year become the basis for discussion with the De-partment of Finance on mid-year budget adjustments. (The budget for 1989-90 mayalso be amended if the revised enrollment estimates for that year warrant.)
January 1989 Release of the Governor's Budget for 1989-90 (approximately January 10).
Source: Office of the Chancellor, The California State University.
University enrollment planning is its decentralizednature, coupled with extensive discussion betweenthe campuses and the Office of the President, andfrequent and regular updating and revisions result-ing from a continuous process of review of actual en-rollment experience and demographic expectations.
Two separate but related processes govern enroll-ment planning in the University:
One sets enrollment goals for the long range,usually 15 or more years into the future, and ispart of the process of long-range academic and fa-cilities planning.
The other provides "next-year" enrollment esti-mates within the context of the long-range planand is used for annual budgeting.
Since the University's long-range plan provides theessential guideposts for annual planning, the fol-
lowing paragraphs describe the long-range processfirst.
Long-range enrollment planning: Principal responsibility for long-range enrollment planning restswith the campuses. Each campus is presently in themidst of studying the feasibility of accommodatinglong-range growth to the year 2005-06. The currenteffoct is intended to update and extend the explora-tory planning study presented to the Regents in Oc-tober 1986, which projected growth to the year2000-01. The principal focus of that study, as re-quested by the Legislature, was on graduate enroll-ment growth. The graduate enrollment study pro-vided a detailed analysis of University graduateplans to that point, an in-depth look at Universitygraduate enrollment planning, and a set of eightplanning principles to guide future development ofplanned graduate enrollments. Because the Uni-
1 5

DISPLAY 8 The California State University Allocated Annual Full-Time Equivalent Students1988-89
cimpaa
to 1993-94'
Budget1987-88 1988-89 1989-90 1990-91 1991-92
Target Years 2
1992-93 1993-94
Bakersfield 3,250 3,425 3,500 3,600 3,500 3,500 3,500
Chico 13,300 13,500 13,600 13,700 13,700 13,700 13,600
Dominguez Hills 5,200 5,725 5,725 5,725 5,725 5,725 5,725
Fresno 14,400 14,800 15,000 15,100 15,100 15,100 15,000
Fullerton' 16,500 17,100 17,400 17,600 17,700 17,800 17,900
Hayward 8,750 8,850 9,050 9,150 9,150 9,050 9,050
Humboldt 5,500 5,535 5,540 5,540 5,540 5,440 5,340
Lor g Beach 23,200 23,600 23,600 23,600 23,600 23,600 23,600
Los Angeles 13,300 13,500 13,500 13,600 13,600 13,500 13,500
Northridge 20,600 20,850 21,000 21,100 21,200 21,300 21,400
Pomona 13,900 14,200 14,600 15,000 15,200 15,300 15,300
Sacramento 17,950 18,250 18,550 18,950 19,300 19,550 19,550
San Bernardino 5,900 6,400 6,550 6,900 7,200 7,400 7,500
San Diego' 25,800 26,100 26,300 26,300 26,600 27,000 27,100
San Francisco 18,400 18,700 18,800 18,900 18,800 18,750 18,700
San Jose 19,100 19,600 19,600 19,600 19,600 19,400 19,300
San Luis Obispo 14,300 14,300 14,300 14,700 15,100 15,100 15,100
Sonoma 4,450 4,500 4,500 4,500 4,500 4,450 4,400
Stanislaus 3,550 3,700 3,750 3,800 3,850 3,900 3,900
System Totals 247,350 252,635 254,865 257,365 258,965 259,565 259,465
1. Based upon the projections of enrollment prepared by the State Department of Finance, Demographic Reseamh Unit.
2. The target year 1992-93 is for projects previously funded for working drawings and the target year for new starts ic 1993.94.
3. Includes full-time-equivalent enrollment for South County Off-Campus Center.
4. Includes full-time-equivalent enrollment for Imperial Valley Campus, Calexico, and North County Off-Campus Center.
Source: The California State University Capital Outlay Program 1988-89.
versity viewed as essential that graduate enroll-ments be planned in the context of undergraduateenrollment growth, the earlier study included anundergraduate enrollment study to the year 200k:01.
In carrying out the study, individual campuses pur-sued a wide variety of approaches and took into con-sideration a variety of factors, many of which wereunique to their individual circumstances, including:
1. Local and regional demographic trends;
16
2. Local and regional economic conditions and fore-casts; and
3. Individual campus assumptions on recruitment,retention, affirmative action progress, additionof new academic programs, and completion ofplanned capital projects.
Upon receipt of the campus' individual enrollmentestimates, the Office of the President consideredeach proposal on its own merits and compared itwith campus and systemwide enrollment forecastsgenerated through demographic projectic ns pre-pared by the office. Upon further consultation with
or

the campuses, resulting in some cases in changes tocampus estimates, the office finalized a long-rangeenrollment plan and forwarded it to the campusesand the Academic Senate for review and comment.These campus plans are currently undergoing sub-stantial review and revision, as will be discussed be-low.The University's current study of long-range plan-ning to the year 2005-06 began when the Office ofthe President requested from the campuses detailedundergraduate, graduate, and health sciences aca-demic enrollment proposals for tile period 1988-89to 2005-06. The camrises submitted their propo-sals to the Office of the President in March, 1988.Campnges prepared their proposals to the year2005-104 in lig; it of their desired academic configar-ation and the ultimatc size to which they hoped togrow. Campuses also submitted proposed postbac-calaureate teaching credential enrollments and pro-posed graduate enrollments by the 11 disciplinarycategories used in the previous graduate curollmentstudy. Criteria for reviewing graduate enrollmentproposals included need for research, future de-mands for highly trained people (especially futurefaculty), various enrollment and programmatic bal-ance issues, affirmative action, selectivity and pro-gram quality, and financial support.
In the feasibility stages of the current long-rangeplanning effort, the University has assumed thatresources will be sufficient to construct the neces-sary buildings and hire the necessary faculty andstaff to accommodate growth.
UNDERGRADUATE ENROLLMENT ESTIMATES: A major
resource for projection of long-range undergraduateenrollment demand is the University's long-rangedemographic potential model. This model uses astandard cohort progression or survival methodol-ogy, which introduces new students at several lev-els (e.g., freshman, sophomore, etc.), the numbervarying according to a range of assumptions, andmoves them forward according to currently ob-served rates. The projections of K-12 enrollmentsdeveloped by the State Department of Finance's De-mographic Research Unit provide the demographicbase for projecting new University students. Spe-cifically, the model uses projected numbers of publicand private school tenth graders because these af-ford a demographic base that is less susceptiblethan numbers of high school graduates to fluctu-ations in the dropout rate. The model's basic rates
are derived from observed numbers of new Univer-sity enrollments and of corresponding tenth gradestudents an appropriate number of years earlier.The University extends the Demographic ResearchUnit's tenth-grade enrollment projections forwardan Liditional seven years using the Unit's lowergrade projections and grade progression ratios. Al-though projections become less reliable the furtherinto the future they go, the University feels that theextension is justified because it is based on birthsthat have already occurred in California and, as aresult, it affords a look at the general direction ofchange.
The University uses the Unit's K-12 projections forits model rather than its projections of the popu-lation by age for two reasons. First, is gt closercorrelation between th se oni, the pi tajected en-rollment potential becauss most new Universitystudents are recent California high school gradu-ates. Second, school data are reported annually tothe State Department of Education, whereas pro-jections of the population by age are based on thelast national census and are updated only every sev-eral years. (It should be noted that the advantagesof using K-12 projections are unique to the Uni-versity, owing to the homogeneous nature of the agecohort of its entering freshmen. It is unlikely thatK-12 projections could serve as an appropriate de-mographic base for either the State University orthe community colleges.)
Recent participation and continuation rates appliedto the demographic base generate results that areessentially projections of the University's demo-graphic pool. The model, however, also allows theinsertion of various assumptions relating to futureenrollment behavior. For example, the model con-tains projections of future proportions of tenth grad-ers in the major ethnic groups in the State -- non-Hispanic White, Asian, Black, and Hispanic -- de-veloped from ethnic censuses of the public schoolsby grade, which are taken every several years.These may be used in conjunction with varying as-sumptions concerning future participation rates forthese groups to ascertain the various potential ef-fects of ethnic change in the K-12 population on fu-ture University enrollments. (The University'smost recent long-range undergraduate enrollmentestimates are depicted in Display 9 on page 18.)
Other variations in the University's projections in-clude assumptions of latent demand for one or more
1 7

DISPLAY 9 University of CaliforniaModel-Based Undergraduate EnrollmentProjections. 1988-89 Through 2005-06
Year jjndergraduates
1988-83 116,2191989-90 120,621
1990-91 121,7371991-92 121,6741992-93 121,8761993-94 121,921
1994-95 122,3801995-96 123,796
1996-97 125,2241997-98 126,9941998-99 129,9641999-00 132,9152000-01 137,35r2001-02 141,58'2002-03 145,6222003-04 150,0362004-05 154,2822005-06 158,425
Source: Office of the President, University of California.
campuses and the level of future participation rates.Application of various assumptions that representprobable or possible changes in the future makesthe University's model useful for reviewing campusproposals.
Part of the result oi the University's feasibilityanalysis was the long-range projections of demandfor undergraduate enrollment to the year 2005-06presented to the Regents at their October 1988meeting. The process used to arrive at the projectedgraduate enrollments is described below.
GRADUATE ENROLLMENT PLANNING: While the deci-
sion-making processes are similar, feasibility anal-ysig for graduate enrollments at the University dis-plays several significant differences from under-graduate enrollment projection. For example, theUniversity has made a historical commitment to ac-cept all eligible undergraduate applicants and hasbeen funcied by the State to do so, whereas graduateenrollments are closely managed and funding forincreases is negotiated with the State. These differ-
18
ences contribute to differences in the feasibilityanalysis process.
Graduate enrollment planning follows a set of eightprinciples, articulated in the 1987 Graduate Enroll-ment Plan for 1985-86 Through 2000-01 (pp.23-46):
1. Need for research: Research is the means bywhich the University of California creates newknowledge and, in the long run, is a contributorto the economic, social, and cultural well-beingof the State. Graduate enrollment increasespermit expansion of this vital function both byproviding apprentice researchers in the preserv,to support ongoing University research and bytraining future ressarchers to serve society.
2. Future needs for advanced training: A majorelement in planning future graduate enroll-ments is an assessment of likely changes in thejob markets for individuals with advanced de-grees. Long-range predictions about openingsand areas of growth for individuals with ad-vanced academic and professional degrees arebuilt on a complcx array of elements: amongthem past and current trends, patterns of turn-over and expansion, and the economic futurepredicted for the State. Complicating these pre-dictions are variations in the depth of availabledata about the diverse job markets for ad-vanced degree holders and the substantial timerequired to complete many advanced degrees,doctorates in particular.
3. Placement: Placement represents the re-sponsiveness of University graduate programsto the job market for holders of advanced de-grees.
4. Balance: Balance is an art of institutionaldevelopment. The number of graduate stu-dents in doctoral and doctoral-track master'sprograms must be large enough to form a criti-cal mass for effectiveness and to attract and re-tain an excellent faculty. The mix of graduateand undergraduate students should be such thateffective education is possible at both levels.Within graduate education, there should be anappropriate mix of academic core (letters andscience) and professional programs.
5. Foreign student balance: Balance betweenforeign and domestic students weighs the obli-gations of a major American university to ex-
:4

tend its programs to the world as well as the na-tion and, in some cases, to attract the most gift-ed of the world's students to stay; against theobligation to assure a sufficient supply of do-mestic students with advanced degrees to meetAmerica's needs.
6. Affirmative action: The University of Cali-fornia has a continuing obligation to prepareindividuals with advaaced degrees in a patternthat reflects the diversity of the State's popula-tion.
7. Selectivity and program quality: Maintain-ing and raising the University of California'salready high admissions standards, and main-taining and increasing program quality are es-sential to assuring the continuing strength andpreeminence of its programs.
8. Financial support: The ability to attract thestrongest graduate students rests in part on theability to offer them suitable support whilethey complete the' - graduate programs.
As is the case with undergraduate enrollments, theOffice of the President and individual campuses en-gage in extensive consultation in planning for andassessing the feasibility of graduate enrollment lev-els according to these criteria.
The University's most recent graduate enrollmentfeasibility study to 2005-06 shows substantial pro-portional and numerical increases over the 1986 en-rollment study (Display 10 shows the most recentestimates). There is no direct link between the fac-tors implying a need for growth in graduate studentenrollments and the final enrollment estimates thathave been developed by the University. This is dueto the subjectivity inherent in long-range economicforecasting, as well as difficulties in estimating thenumber of graduate students necessary to replenisha retiring faculty. Since the University will supplyonly a portion of the advanced degree holders need-ed by the private sector and for future academic po-sitions, the precise need for growth in graduate edu-,:ation will be determined, in large part, by the ac-tions of other advanced-degree-granting institu-tions over which the University has limited knowl-edge and no control.
This process is fundamentally different than under-graduate enrollment planning, where the supplyand demand factors operate on the State rather
DISPLAY 10Graduate EnrollmentThrough 2005-06
ism
University of CaliforniaEstimates, 1988-89
Graduat4 Students
25,8511988-89
1989-90 27,3481990-91 28,120
1991-92 28,7101992-93 29,312
1993-94 29,8811994-95 30,559
1995-96 31,4881996-97 32,439
1997-98 33,295
1998-99 34,692
1999-00 36,5142000-01 38,213
2001-02 39,8602002-03 41,4602003-04 43,1542004-05 44,6262005-06 46,431
Note: Excludes Health Science enrollments.
Source: Office of the President, University of California.
than the national and even international levels.Further, undergraduate enrollments can be project-ed with a higher level of confidence since the keyfactors being considered are trends driven by demo-graphic shifts rather than economic forecasts, whichare much less predictable. Hence, the Universitymaintains that while it can discern from myriad in-dices that growth in graduate student enrollmentsis necessary, it is not possible to reach an exact en-rollment estimate which flows directly from the fac-tors implying the need for growth.
The limitations in precisely estimating the State'sfuture needs for graduate education are illustratedby two influences among the eight listed above thatwere particularly important in setting the new fea-sibility study figures: (1) the future market for hold-ers of advanced degrees and (2) institutional bal-ance. A third influence leading to increased num-bers was the University's new academic planning
9 11
19

activity concerning expansion of professional edu-cation.
1. Future market for holders of advanced degrees:When the 1986 graduate enrollment study was be-ing developed, key studies of faculty turnover andrelated changes in openings for academic jobs acrossall disciplines and in certain large professionspointed to the need to increase the numbers of grad-uate students at the University. It projected some6,000 faculty vacancies in the 15 years between1985 and 2000, while the State University antici-pated recruiting 8,100 new faculty during the sameperiod. By 1988, these figurtv had increased dra-matically in view of the fact that actual enrollmentswere substantially above those projected in 1986and future enrollments were likely to be correspon-dingly higher.
Looking to 2005-06, University officials now projectthe need for 9,400 faculty replacements, to whichmay be added as many as 770 new faculty for newcampuses built to accommodate growth. In addi-tion, in Spring 1988, State University officials re-ported to the Trustees a need for between 8,500 and11,000 faculty hires on existing campuses over theupcoming 15 years and expressed serious concernsabout the State University's ability under currentcircumstances to fill all those vacancies. Added tothese needs, the California Community Colleges arenow under legislative mandate to upgrade their fac-ulty. The University is cooperating with the Chan-cellor's Office of the community colleges in a specialstudy to determine the University's role in helpingto meet their faculty needs over the next severalyears.
Nationwide, there are other indicators of the in-creasing need for individuals with advanced de-grees. While California appears to be far ehead ofother states in projecting long-term faculty turn-over, professional association information has point-ed to continuing trends in several key academicfields. Both the American Historical Associationand the Modern Language Association continue topost annual increases in numbers of job openings.In 1988 alone, numbers of jobs advertised throughthe American Historical Association increased by32 percent. The Modern Language Association re-ported that its published job listings doubled in for-eign languages between 1983 and 1988 and doubledin English between 1984 and 1988.
20
Shortages of engineering and science Ph.D.s in a va-riety of fields continue -- as illustrated by a Feder-ation of American Societies for Experimental Bi-ology report that demand for biologists in researchis beginning to exceed supply, as numbers of po-sitions imrease and the new biotechnology compan-ies compete for advanced degree holders.
2. Institutional balance: Balance is a second majorplanning principle contributing to an increase inthe proportion of graduate students in the 1988feasibility study. The 1986 study pointed to the ser-ious erosion in the University's graduate studentbalance from 25.5 percent in 1970 to 19.2 percent in1985. In order to focus on how the University stoodin relation to its public comparison institutions, theOffice of the President analyzed comparable lettersand science disciplines. The University's averageproportion of graduate students in these disciplineswas 11.9 percent in 1985, while the public compari-son group averaged 18.1 percent. The 1988 feasi-bility study seeks to bring the University's propor-tion of graduate students into line with this com-parison-group average.
3. Expansion of professional education: An addedconsideration leading to an increased proportion ofgraduate students is the University's new majoracademic planning activity related to professionaleducation. Between 1980 and 1986, no new profes-sional schools opened at the University. Then insuccession, new schools received approval in thefields of Pacific Rim studies, engineering, and archi-tecture. To guide future development of profession-al education in the upcoming years, President Gard-ner called for a special planning effort by a new Ad-visory Committee on Professional Education, whichheld its first meeting in November 1988. Its workon identifying future needs for professional pro-grams will have a significant effect on the need toincrease numbers of graduate students.
The long-range enrollment estimates establishedthrough these undergraduate and graduate plan-ning processes will form one of Ur.: bases for thenext step in campus planning: creation of a long-range development plan for approval by the Re-gents.
Short-term undergraduate enrollment estimation:Short-term undergraduate enrollment estimationfor annual budgeting is highly decentralized at the

University. It is conducted between each campusand the Office of the President within a frameworkof broad consultation. Discussions center on com-patibility of expected enrollment levels with thelong-range campus plans. All parties understandthat the fulfillment of long-range projections doesnot necessarily follow a smooth curve and that an-nual perturbations are to be expected. Intensivediscussions take place between the Office of thePresident and the individual campuses to negotiateany differences that may arise during the review.
Enrollment estimates driven by broad demographictrends play a relatively minor role in setting annualenrollment levels. This is due both to the unreli-ability of demographic estimates in a one-year timeframe, as well as the superiority of other approacheswhich rely more, as any projection must, on individ-ual professional judgment made in the context of re-cent experience.
The annual undergraduate enrollment estimationprocess consists of three iterations:
FIRST UPDATE: The process begins with the Office ofthe President's request for updates, due in lateJune, of current enrollment information and forproposals for campus enrollments. These are to beused in developing the submission to the Regentsfor the upcoming budget cycle. The campus propo-sals are reviewed in light of compatibility with thecampuses' long-range projections and their feasibil-ity. The Office of the President monitors these en-rollment estimates and, where necessary, nego-tiates with the campuses to accommodate somemore students at the largin in an attempt to assurethat the University will meet its commitment to ac-cept all eligible California applicants.
In negotiating these annual campus enrollment lev-els, several factors have previously formed the basisfor discussions between campuses and the Office ofthe President:
1. Academic planning issues: Individual campusesplan for growth in a manner consistent with theirlong-range academic planning objectives. The ef-fort to implement academic planning priorities caninclude hiring new faculty, admitting more stu-dents, and expanding facilities in those disciplineswhere an institution is encouraging growth andseeking or sustaining academic prominence. Cam-puses generally encourage expansion in fields con-
sistent with their long-range academic goals.Matching a campus's long-range academic planninggoals with short-term student enrollment demandcan be especially difficult during periods of rapid,unexpected growth.
2. Accommodation of eligible applicants: The Uni-versity has historically maintained a commitmentto offer a place to all eligible California high schoolgraduates who apply for admission, although notnecessarily at the campus or in the program of firstchoice. The University strives to meet this commit-ment within the limits of each campus's feasibilityto grow and is now engaged in a planning processfor identifying what those limits are, when they willbe reached, and the consequent need for additionalcapacity. In an era of rapid or unexpected growth,as the University now finds itself, providing spacefor eligible applicants has previously tended tooverride other planning considerations.
3. Physical capacity: An important consideration inannual enrollment planning is the physical abilityof a campus to accommodate growth. This includesadequate classroom, laboratory, lecture space, andlibraries; as well as space for the additional supportservices, administration, and faculty required toserve the increased number of students. Physicalcapacity constraints necessitate separate admissiontargets for selected programs because of differingresource requirements for instruction. This is thecase in engineering, which has both high demandand high resource requirements in terms of labora-tory spece and special equipment. As evidenced bycurrent overcrowding on some campuses, adequatephysical capacity has sometimes been overshadow-ed by the University's commitment to admit all eli-gible applicants.
4. Faculty and other personnel resource issues: En-rollment growth requires more faculty, more aca-demic support personnel, mo-a student services per-sonnel, and often more administrative capacity. Animportant constraint on annual enrollment plan-ning is the availability of faculty and other p )r-sonnel, such as student services staff. It takes ti :neto recruit, hire, and bring new persons t ± in-stitution. With regard to new faculty, this problemis especially difficult given the extensive and metic-ulous nature of the hiring process. The futurepromises to make this constraint even more pro-nounced if labor shortages of qualified new facultymaterialize, as expected, over the next 20 years, due
21
to significant anticipated increases in the number offaculty retirements.
5. Recent problems leading to overcrowding: Theovercrowding that has occurred on a number of Uni-versity campuses has resulted, at least in part, fromtwo major causes. The first is the steady and unex-pectedly large increase in participation rates thatbegan in the late 1970s. University planners hadfactored some increases in participation rates intotheir enrollment projections because they believedlatent demAnd existed and would be manifestedwhen planned outreach and program improvementswere initiated. They felt that these improvementswould result in enrollment stability as the numberof high school graduates declined in the 1980s.However, between 1977 and 1987, the enrollmentrate of California high school graduates at the Uni-versity rose almost 50 percent, and retention alsoimproved. The result was sharp increases in en-rollment, even as the number of high school grad-uates declined.
A second contributor to overcrowding was the re-duction in capital funding in the University's bud-get during the strained State budget years of the1970s and early 1980s. Frota. 1970-71 to 1982-83,general campus capital outlay averaged just $18million a year for all eight general campuses; in1983-84 the University's total capital budget was $7million. In addition, between 1978-79 and 1983-84,$200 million was cut from the University's oper-ating budget. New building, improvements to ex-isting buildings, and even routine maintenancecame to a near standstill just as enrollment demandbeg to increase. The University budget improveddramatically starting in 1984-85, however, the im-provements have not yet been able to catch up withthe large backlog of deferred maintenance and obso-lete equipment built up over the previous decade,although the process of catching up is well begun.
6. Balancing campus growth with contntunity plan-ning goals: An important consideration in settingannual enrollment estimates is the local commu-nity's attitude toward growth. In the past severalyears, the tension between campus plans for growthand community desires to limit growth have be-come more pronounced.
The proposed undergraduate enrollments includedin the Regents' Budget are the result of these dis-cussions and negotiations.
22
SECOND UPDATE: The Office of the President re-quests a second update in the fall, due in early No-vember, so that the University's submission to theState for use in the Governor's Budget may take ad-vantage of the additional information provided bythe fall enrollment experience. The Office of thePresident reviews the updates and negotiates withthe campuses, if necessary, by the same process thatgoverns the updates submitted in late June forpreparation of the Regents' Budget.
THIRD UPDATE: The Office of the President requestsa third and final budget cycle update for mid to lateFebruary. The open application period for fall en-rollment takes place the prior November, but appli-cations continue to be accepted after November 30 ifcampus targets are not met a circumstance thathas become less and less frequent in recent years.(Should the applications received before Februaryindicate a substantial divergence from the expecta-tions underlying the fall submission, the Universitymay request an update of the enrollment estimatesincluded in the Governor's Budget.
Capital outlay planning
California Community Colleges
The capital outlay planning process for the Califor-nia Community Colleges occurs within a fairly rigidframework of separation of responsibility and au-thority between the various community college dis-tricts and the Chancellor's Office. The districts en-joy P I most complete autonomy in developing localcapital outlay priorities, but once the districts sub-mit their capital outlay requests, the Chancellor'sOffice exercises central authority for developingand stewarding a single statewide community col-lege capital outlay budget through the legislativeprocess.
Identification of capital improvement needs: Theneeds identification process for capital improve-ments in the community colleges occurs at the cam-pus and district levels, utilizing a wide variety ofprocesses. As is the case with the two universities,the persons responsible for capital planning at thedistrict level consult, to one degree or another, with

deans, department chairs, faculty and others toidentify perceived capital outlay needs.
While the identification of needed capital improve-ments is carried on throughout the campuses in adistrict, the manner in which these districts identi-fy these needs varies widely from highly consulta-tive to highly autocratic.
Preparation of program planning guides: Uponcompletion of the consultations with the campusesin a district, local facility planners translate identi-fied capital improvement needs into a formal dis-trict-wide capital outlay program. Individual dis-tricts then begin preparing Program PlanningGuides on those projects for which funding will berequested in the upcoming budget cycle. The dis-tricts find themselves at a substantial disadvantageto the University in this regard, in that like theState University, their staffing limitations do notallow them to rely on their own architects and engi-neering personnel to assist in developing these Pro-gram Planning Guides. Further, at both the state-wide and district levels, the community colleges ap-pear generally to have fewer staff working in facili-ties planning than either of the university seg-ments. In some cases, one or two persons may as-sume all planning responsibilities for a multi-campus district and may even have other respon-sibilities beyond facilities planning. As a result, lo-cal planners are almost solely responsible for devel-oping all Program Planning Guides for a district'sentire capital outlay program.
By February 1 of the year prior to which funding isbeing requested, the districts inform the Chancel-lor's Office of their capital outlay plans by submit-ting a Program Planning Guide for each capitalproject being proposed as well as a draft revision oftheir Five-Year Capital Outlay Plan, incorporatingall projects requested through the Program Plan-ning Guides as well as longer range projects thatthey expect to submit for funding in future years.
Chancellor's review of the proposcas: Upon receipt ofthe districts' Program Planning Guides, the Chan-cellor's Office reviews the proposals and prioritizesthem by pre-determined criteria, based on the typeof capital project (new construction, remodeling,providing access for handicapped persons, and thelike) and their space classification such as class-
rooms, lecture halls, instructional laboratory space,or faculty offices.
The requests falling within similar project type andspace classifications are ranked in comparison toother colleges' need for the same type of project.This intercampus need comparison is accomplishedby evaluating current utilization patterns for all ca-pacity space on a campus. The utilization rates areexpressed as a percentage. The Chancellor's Officethen analyzes a campus' five-year capital outlayplan in light of the expected completion of similarprojects that may already be receiving funding. Itjuxtaposes existing capacity plus anticipated new orrenovated space against the Department of Fi-nance's five-year enrollment projections for thecampus, and it derives a projected five-year spaceutilization rate, taking all of the above factors intoconsideration. This space utilization rate is calledthe "capacity-to-load ratio" and is expressed as apercentage, with rates under 100 percent indicatinga need for additional space, and rates over 100 per-cent indicating underutilization of existing or ex-pected new space capacity. The Chancellor's Officeuses the Demographic Research Unit's enrollmentestimates, which were discussed previously, in cal-culating the capacity-to-load ratio. This ratio is thefigure used to compare the relative need of differentdistricth for similar projects.
By performing this analysis for all similar projectsin the system, the Chancellor's Office is able to pri-oritize all proposed capital projects within a desig-nated project type or space category. Upon comple-tion of this process, and after consultation with thedistricts, the Chancellor's Office develops a compre-hensive capital outlay plan for all of the districts.This program is then forwarded to the Board of Gov-ernors for review and adoption.
(Display 11 on page 24 outlines the steps in the com-munity colleges' capital outlay process. The currentpriority criteria list for community college capitaloutlay projects is as follows:
Category A: To activate existing space.
1. To meet safety requirements and to correcthazardous conditions; to provide access forhandicapped persons under Federal Section 504regulations, providing these are categoricallynoted funds (federal or state) for such com-pliance.
2 3

DISPLAY 11 Timeline for the California Community Colleges' Annual Capital Outlay PlanningProcess
February
Districts provide theChancellor's Office withproposals on all newcapital outlay requests(in the form of programplanning guides), as wellas revisions in their five-year capital outlay plans.
September
Districts submit "fiscalhealth" reports to theChancellor's Office, foruse in setting eachdistrict's state/localfunding ratio.
The Board of Governors'considers and approvesthe CommunityColleges ' capital outlayrequest for the comingbudget year.
March-June
The Chancellor's Officerequests additional infor-mation on project propos-als, enters into negotia-tions with individualdistricts, and performscomparative needsanalysis on all campusprojects within similarspace and/or project typecategories.
October-November
Scope meetings are heldin selected districts forwhich major capitaloutlay projects arebeing proposed. Minorrevisions may be madein some projects, basedon the results of thescope meetings.
Source: California Postsecondary Education Commission.
July-August
The Chancellor's Office,based on the results ofdistrict negotiations andcomparative needs analysis,makes final decisions onwhich projects to include inthe Community Colleges'overall capital outlayrequest, and formulates thedraft capital outlay plan forthe Board of Governor'sconsideration in September.
December
The Chancellor's Officeincorporates anymodifications of projectsresulting from Scopemeetings and preparesthe final version of itsrequest for the comingbudget year fortransmittal to theGovernor.
January
The Governor's Budgetis released, includinghis/her proposal for theCommunity Colleges'capital outlay projects.
The formal legislativeportion of the processbegins.
2. Equipment funds for previously funded proj-ects.
3. Replacement or alterations of utility serviceunder specific critical conditions for facility op-erations.
4. Alterations, renovation, or remodeling, con-comitant to previously funded projects.
5. Alterations and remodeling (retrofit) for en-ergy conservation under specific conditions.
Category B: To provide for new or remodelingof existing space for instruction and foracademic and instructional support facilities.
6. Remodeling and new construction of class-rooms, teaching laboratories, libraries, and
24
learning resource centers. Projects in this clas-sification are prioritized based on existing ca-pacity and current and projected need (ca-pacity-to-load ratio). Projects with the same ca-pacity to need rating are ranked as follows:
(a) Remodeling project.
(b) New construction of classroom or teachinglaboratory.
(c) New construction of library or learning re-source space.
7. Remodeling and new construction of aca-demic and instructional support facilities (in-cludes office space). Projects within this classi-fication will be prioritized based on existing ca-pacity and current and projected need. Projects
:4 7

with the same capacity-to-need rating areranked as follows:
(a) Remodeling project.
(b) New construction of faculty office space.
(c) New construction of administrative officespace.
(d) New construction of other support facili-ties.
Category C: To provide noncapacity space.
8. Land acquisition funds to relieve demon-strated capacity deficiencies of an immediatenature. (This may be for an existing campus oran approved new campus, providing the districtratio of capacity to load is less than 100 percentin the target year.)
9. Construction funds for renewal work, in-cluding air cor ditioning, required to improveexisting instructional and/or library facilities.
10. Working drawings and/or constructionfunds for physical education facilities (whenphysical education is a program or degree re-quirement).
11. Working drawings and/or constructionfunds for theaters (if a theater arts program isoffered by the college) and food service facili-ties.
12. Working drawings and/or constructionfunds for site development projects which donot have a direct relationship to the construc-tion of a new building. (Site development thatis necessary in the construction of a new build-ing will be included with the category and itemnumber of tne priority criteria for which thebuilding qualifies.)
13. Working drawings and/or constructionfunds for maintenance shops, warehouses, andall other facilities not mentioned above.
The Board of Governors gives preference to projectsthat have already been approved and funded forworking drawings over other projects in the samecategory. The Board may also make exceptions tothese criteria when it determines that to do so willbenefit the students affected.
The Board earmarks the first available $20 millionof requested capital outlay funds (slightly more or
less, depending on the actual costs of particularprojects) for Category A projects and the highestranked Category B projects. It earmarks at least 20percent of the requested funds in excess of the first$20 million for Category C projects. These alloca-tions may be adjusted somewhat from year to year,depending on the amount of capital outlay fundsthat are likely to be appropriated to the communitycolleges.
Cost estimate and funding mix decisions: Cost esti-mates for proposed projects are made by local archi-tects, with the cooperation of the Chancellor's Officeand the Department of Finance. These estimatesare expressed in dollars per assignable square footand are based on historical experience with similarprojects. As with the two university segments, aninflation factor is applied to historical cost informa-tion through application of an ENR (EngineeringNews Record) index. (The Engineering NewsRecord annually publishes inflation factors for var-ious types of construction projects.) The Depart-ment of Finance designates an appropriate ENR in-dex that is then applied to the cost estimates for aspecific capital project. Uuing this information, atotal estimated cost is derived and is incorporatedinto the Program Planning Guide.
In mid-September in the year prior to the fundingrequest, each district in the system submits Form311 to the Chancellor's Office, outlining its generalfiscal health. The Chancellor's Office uses this in-formation to establish the State/local funding mixthat will be applied to capital outlay proposals ineach district. The current target funding mix is 90percent State and 10 percent local financing for allcapital outlay projects. However, match ratios of 95percent State and 5 percent local funding are notuncommon; and the State has previously provided100 percent of the capital outlay financing for somedistricts.
The Chancellor's Office, like the executive offices ofthe two universities, holds "scope" meetings in thefall prior to development of the Governor's Budgetfor the year in which the capital projects are beingrequested. It schedules these meetings in selecteddistricts for which major capital outlay projects arebeing proposed and does not necessarily hold themin each district or for all projects being proposed fora district. These campus meetings include staff fromthe Department of Finance, the Legislative Ana-lyst's Offirpt and legislative budget committee con-
k :4)
25

sultants, as well as key campus administrators, fac-ulty, and staff. The purpose of the meetings is toprovide State staff with the opportunity to ask ques-tions and talk with campus faculty and facilityplanners about specific project proposals.
Upon completion of the scope meetings, the Chan-cellor's Office may make minor revisions in the dis-tricts' capital outlay requests, in order to respond tosuggestions or concerns raised through the meet-ings. Upon completion of any changes in the plan, itforwards the community colleges' final capital out-lay request to the Governor for consideration in theupcoming budget cycle, with all requested projectsranked in priority order according to the criteriapreviously discussed. Once the request is finalized,the Chancellor's Office enters into discussions withthe Department of Finance, and the formal legisla-tive portion of the process begins.
The California State University
The development of the State University's capitaloutlay program is administered by the Division ofPhysical Planning and Development in the Office ofthe Chancellor. The division works with facilitiesplanners on the individual campuses in developingcapital outlay projects. The campuses have widediscretion to identify capital outlay needs. Theanalysis for assessing the relative need and priorityof individual projects is either conducted by the Of-fice of the Chancellor or by the campuses within aset of well-defined planning policies, procedures,and priorities.
Elements of the capital outlay program: The Califor-nia State University 1988-1989 Capital Outlay Pro-gram describes these planning policies and proce-dures as follows (pp. 103-104):
The primary objective of the Capital OutlayProgram for the California State University isto budget funds to meet approved educationalprograms, to provide facilities of equal qualityand quantity to serve the students at the nine-teen campuses, and to create an environmentconducive to learning.
Broad participation by those responsible hasbeen enlisted by the campuses and the Chan-cellor's Office in developing the Capital OutlayProgram. The following is the basis of theCapital Outlay Program 1988-89 and Five-
26
Y.ar Capital Improvement Program 1988-89thPflugh 1992-93, State Funded:
1. Approved academic master plans: In 1963,the Board of Trustees adopted dynamic plan-ning policies which were designed to regularizecurricular development and guide program dis-tribution in the rapidly expanding system, andfacilitate the progress of each individual cam-pus in meeting the primary function as ex-pressed in the statewide master plan. Thesepolicies, published in the 1963 Master Plan forthe California State Colleges, are still in effect.These have been summarized by EducationalPrograms and Resources as follows:
Curricula are to reflect the needs of studentsand of the State.The foundation program for all campuses in thesystem consists of the liberal arts and sciences,business administration, and teaching. (TheBoard of Trustees defined specific subject areaswhich would be regarded as the "Broad Foun-dation Program.")
Programs in applied fields and professions oth-er than those above are to be allocated withinthe system on the basis of (1) needs of the State;(2) needs of the campus service area; and (3)identification of employment opportunities.
"All campuses cannot be all things to all peo-ple." Curricula in the applied fields and pro-fessions are therefore to be located in a system-wide pattern which will achieve an equitableand educationally sound distribution of pro-grams throughout the State.
While all campuses may wish to offer the sameprograms, the Trustees exercise great selectivi-ty in the final approval of new criteria.
Specialized, high-cost programs are to be allo-cated on the basis of review and study of the in-dividual subject area.
Subsequent policies adopted by the Board ofTrustees include the following:
Degree programs are to be broadly based and ofhigh academic quality.
Unnecessary proliferation of degrees and ter-minologies is to be avoided.
A formal review of existing curricula is to beconducted by each campus as part of the overallplanning process.
g:4

The Academic Master Plans serve as the basisfor campus master planning (facilities).
2. Approved physical (campus) master plans:Soon after the Board of Trustees of the Califor-nia State University was established by theLegislature, it recognized the importance ofeach campus developing physical (campus)master plans in concert with the consulting ar-chitect and the community of each of the cam-puses. A physical master plan is required foreach of the campuses. It is intended to serve asa guide for the physical development of thecampus to accommodate a defined enrollmentat an estimated target date in accordance withapproved educational policies and objectives.The physical master plans encompass the ulti-mate physical requirements necessary to housethe approved academic programs and auxiliaryactivities of each campus. The physical masterplans consider functionally related disciplinesand activities, instructional support needs,costs benefits, vehicular and pedestrian trafficflow, and aesthetics.
3. Annual full-time equivalent student enroll-ment allocations: The (capital outlay) programis based on the annual full-time equivalent stu-dent (in Es) enrollment allocations prepared bythe Chancellor's Office, Division of AnalyticalStudies, in consultation with the campuseswithin the statewide projections prepared bythe Department of Finance, Demographic Re-search Unit. Annual FTEs enrollment alloca-tions reflect the impact of year-round oper-ations at Los Angeles, Hayward, San Luis Obis-po: and Pomona as adopted by the Board ofTrustees.
4. Approved space and utilization standards:The instructional space needs are calculated onthe basis of space and utilization standards ap-proved by the CCHE (now the California Post-secondary Education Commission) September1966 as modified March 1971 and June 1973.The following table lists the currently approvedutilization standards:
5. Faculty allocations: Faculty office spaceneeds for the budget year are based upon theirprojected number of FTE faculty for each cam-pus.
6. Space and facility data base (SFDB): All spaceneeds to be funded in the Capital Outlay Pro-gram have been calculated by deductinr the ex-isting space inventoried and reported in theSpace and Facility Data Base.
. Estimates of cost based upon the ENR (Engi-neering News Record) cost index: The projectedcost index is prepared by the Department of Fi-nance in cooperation with the State agencies.
8. Phasing out leased and temporary facilities:The Board of Trustees in November 1972 re-solved that all leased and temporary facilitiesshould be phased out as soon as State fundingcould be secured for the replacement of thestructures.
9. Energy conservation: Based upon ongoingaudits, studies and application of the state-of-the-art control equipment, funds are requestedto provide for energy conservation measureswhich will reduce campus energy requirementsand realize cost avoidance in the utilities allot-ment.
10. Alternate financing for cogeneration andoffer major energy efficiency improvement proj-ects. The Legislature introduced legislation topermit and to foster alternate financing, in-cluding tax exempt bond financing for fundingenergy projects or third-party financing. Thiswas necessary because of the limited State rev-enues available for cogeneration and other ma-jor capital outlay energy projects. The Board ofTrustees consents to these methods of financingwhich have been made necessary by limitedState funds. The Trustees encourage the cam-puses to search out alternative means of financ-ing cogeneration as a part of the csu programto conserve energy. Alternate financing will besought in the event that insufficient funding isavailable from the State Energy and ResourcesFund for energy projects.
11. Non-State funded projects are based uponfinancial feagbility and programmed within es-tablished planning guidelines: The funds re-quired to plan, construct, and operate new non-state funded facilities are other than State ap-propriations and ultimately come from manda-tory fees, user charges ,nd/or gifts. The Stateshare in non-state funded projects has includedproviding a land base for facilities, providing in
27

part the utilities to auxiliary facilities, and pro-viding the initial cafeteria. The primary typesof facilities provided from non-state sources areparking, student unions, health centers, stadi-ums, residence halls, food services, and book-stores.
The categories and criteria to be used in settingpriorities are listed in the same document and be-low. (This priority list is reviewed annually by theExecutive Council comprised of tho Chancellor, ViceChancellor, and the Presidents. It should be notedthat the priorities necessarily include various formsof maintenance of existing facilities as well as con-struction of new facilities.)
1. Funds for projects of systemwide benefit
Priorities will be assigned in the following or-der:
1.1 Funds for Campus Master Planning andfunds to ensure the implementation of a well-coordinated multi-year Capital ImprovementProgram. This includes architectural and engi-neering studies, feasibility analysis, benefit/cost studies, and various forms of alternativeproject studies.
1.2 Preliminary Planning for selected projectsin the next year's Capital Outlay Program.
1.3 The Systemwide Minor Capital Outlay Pro-gram (Preliminary Planning, Working Draw-ings, Construction, and Equipment).
1.3.1 Projects to correct hazardous code defi-ciencies, to meet contractual obligations or toreduce CSu legal liabilities.
1.3.2 Projects to meet retroactive code require-ments which are not part of a statewide pro-gram or to correct other health and safety defi-ciencies (includes handicapped accessibility).
1.3.3 Projects to maintain academic programsby ensuring continuation or current services orby reducing program deficiencies.
1.3.4 Projects to enhance academic programswhich will result in incorporating new or ad-ditional courses in campus curricula.
1.3.5 Projects to accomplish general improve-ments, including utility/site development and
28
improvements to non-instructional support fa-cilities.
1.4 Feasibility studies for energy conserva-tion projects (unless funding is available fromsources outside the Capital Outlay Program).
2. Funds to correct structural, health,and safety code deficiencies
Priorities will be assigned in the following or-der:
2.1 Emergency projects to remove hazards tolife and property and to correct code deficien-cies.
2.2 Structural strengthening projects re-quired to correct seismic hazards.
2.3 Projects required to correct health andsafety code deficiencies.
2.4 Functional rehabilitation projects inwhich at least 50 percent of the constructioncost, exclusive of any related building addition,is attributable to the correction of structural,health and/or safety code deficiencies.
3. Funds to make new andremodeled facilities operable
Priorities for purchase of equipment will be as-signed in the same sequence as when the proj-ect was prioritized for construction funding.
4. Funds for critical projects
Critical projects will be identified from Cate-gories 5, 6, or 7 by the Chancellor's staff in con-sultation with the Executive Council basedupon the merits of each individual project. Thismay include requests for any combination ofpreliminary planning, working drawings, con-struction, and/or equipment projects. Prioritieswill be assigned in the following order:
4.1 Critical projects for which state funding aaspreviously been acquired.
4.2 New critical projects which have not pre-viously been funded.
5. Funds for construction projects
All construction projects (including requests forconstruction (C) and/or working drawings and
41
construction (wc) funding] of the types includedin Categories 6 and 7 will be placed within thiscategory. The priority of construction projectrequests shall be determined first on the nrderof previous state funding, and then on the basisof space deficit as follows:
5.1 By campuswide space deficit for projectswhich will provide lecture classrooms, facultyoffices, libraries, or instructional noncapacityfacilities.
5.2 By space deficit within a campus' academ-ic program(s) for projects which will serve onlya related specific academic discipline.
6. Funds to eliminate existinginstructional deficiencies
Preliminary planning (0, or preliminary plan-ning and working drawings (Pw) funds for in-structional buildings, libraries, and studentservice facilities shall be included within thiscategory. This also includes innovative in-structional facilities to meet new modes andmethods of instruction. Priorities will be deter-mined based upon relative deficiency in campusspace for libraries, instruction and office needs,auditoriums and large lecture halls, includingconsideration of inadequate and leased space.The latest actual enrollment allocations for thecurrent year will be used in calculating the per-centages of space deficiency. If two or moreauditoriums or large lecture hall projects arewithin 10 percent of each other in their relativespace deficiency as compared to enrollment,priority shall be given to the project for which50 gercent or more of its funding will be fromnon-state sources. Generally, the following cri-teria wilt be used in setting priorities withinthis category:
6.1 A percent of deficiency in library and othernoncapacity instructional space, lecture capac-ity, teaching laboratory capacity, and facultyoffices.
6.2 Evaluation of the functional quality of fa-cilities.
6.3 Lecture and teaching laboratory utiliza-tion.
7. Funds to eliminate existingdeficiencies of support facilities
This category provides support facilities, in-cluding conversion and relocation projects oncampuses where existing facilities are belowthe campus needs. Also, this category includesutilities, site development and land acquisitionprojects not intended to result in the provisionof service to Off-Campus Centers. Prioritieswill be assigned in the following order based onpercentage of space deficiency within the fol-lowing subcategories:
7.1 Administration building projects.
7.2 Corporation yard projects.
7.3 Utility projects to correct existing deficien-cies.
7.4 Access projects to correct existing deficien-cies.
7.5 Land acquisitions.
7.6 General site development projects.
Process for developing the State University's capitaloutlay program: Campus facility planners beginthe process of developing the State University'scapital outlay program on individual campuses byconsulting with deans, department chairs, faculty,and others to identify perceived capital outlayneeds. This consultation is carried out program byprogram throughout the campus. The process typi-cally begins in the Fall for the budget cycle twoyears hence. For example, internal campus consul-tations began during Fall 1988 in preparation forcapital outlay requests in the 1990-91 budget cycle.Display 12 on page 30 shows a schedule for the an-nual capital outlay process.
Once the consultation process has commenced withthe various campus constituencies, campus facili-ties planners translate identified physical plantneeds into a specific capital outlay plan. At thispoint a determination is made as to whether reno-vation, expansion, or construction of new facilitiesis necessary to meet the physical plant require-ments. For each project, campus planners develop aProgram P1annir4, Guide containing the specifics ofeach proposal.
Costing of new construction projects is generallybased upon total square footage of the project and
29

DISPLAY 12 Timeline for the California State University's 1990-91 Capital Outlay Planning Cycle,1988 Through 1990
Dates
September-December 1988
January 1989
January-February 1989
March-June 1989
July 1989
August-September 1989
October-November 1989
November-December 1989
Je.nuary 1990
Activities
Campus planners begin process of identifying capital outlay projects that will be re-quested in the 1990-91 Capital Outlay Budget.
Release of Governor's Budget for 1989-90, including proposals for the State University's1989-90 Capital Outlay Program.
Campuses submit draft proposals to the Office of the Chancellor on capital projects tobe funded in 1990-91.
Campuses provide Program Planning guides for new projects and updated versions oftheir five-year capital outlay plans. The Office of the Chancellor reviews these guidesnegotiates with campuses, and performs comparative analysis of needs. Legislativehearings are completed on the 1989-90 budget.
The Office of the Chancellor develops a draft capital outlay request :or 1990-91 forreview at the July Trustees meeting. The final 1989-90 budget is released.
The Office of the Chancellor develops the 1990-91 Capital Outlay Program,which isreviewed and approved by the Trustees in September.
Scope meetings are held to provide on-site briefings for the Department of Financeand the Legislative Analyst on selected major capital projects.
The Office of the Chancellor incorporates any modifications of projects resulting fromthe scope meetings and prepares the final version of the 1990-91 Capital OutlayProgram for transmittal to the Governor.
Release of 1990-91 Governor's Budget.
Source: Office of the Chancellor, The California State University.
estimated cost per assignable square foot. The costvalues are contained in a "costing guide" developedby the Office of the Chancellor. The guide incor-porates information, based on experience, on thecosts of capital outlay projects by type of space (lec-ture, lower-division laboratory, etc.). The cost dataare adjusted annually for inflation using the ENR in-dex as published in the professional journal Engi-neering News Record. The Department of Finance,in consultation with other appropriate State agen-cies, designates the ENR index to be used for a giventype of project. These cost factors are included inthe "costing guide."
In January of each year, the campuses submit a pre-liminary draft five-year capital improvement pro-gram and draft Program Planning Guides for allcapital projects proposed for the next budget cycle.The revised five-year plan incorporates the projects
30
requested in the program planning guides plus newprojects that will be proposed in later years. The re-vision of the five-year plans is the mechanism bywhich the campuses formally notif) the Office of theChancellor ot their projected capital outlay needs.By April these proposals are reviewed and modifiedto become the capital improvements requested forthe next budget cycle.
The Division of Physical Planning and Develop-ment in th9. Offic of the Chancellor coordinates thereview of the ogram Planning Guides and may re-quest clarification or expansion of the proposals. Itthen prioritizes all capital projects (new construc-tion and renovation/maintenance) for the upcomingbudget cycle. It accompanies this ranking by com-paring projected enrollment against existing andplanned capacity and evaluating them on other

critical considerations such as structural, healthand safety code deficiencies.
After ranking the proposed projects within a cate-gory, the division ranks all projects according to thepriority list given above. There is extensive con-sultation at this point with the campuses, includinga revicw of the priority list itself, before the draftcapital outlay program is presented to the Trusteesfor their review and approval in September.
Following approval of' the program by the Trustees,the division holds "scope meetings" in the fall oncampuses for which major capital outlay projectsare being proposed. Scope meetings are not neces-sarily held on each campus nor for all projects beingproposed at a given campus. They are primarily in-formational for the Legislative Analyst's Office(LAO and the Department of Finance, and they rep-.recent an opportunity for them to look first hand atproposed sites and to talk directly to campus andcentral office personnel about specific aspects of aproposal.
Following completion of the scope meetings, the di-vision may make minor revisions in the draft cap-ital outlay program in order to respond to sug-gestions or concerns raised during the meetings.(Changes in a capital outlay request that do notchange its total cost by more than 10 percent do notrequire approval by the Trustees). After these revi-sions, the Office of the Chancellor forwards the finalcapital outlay program to the Governor for consider-ation in the upcoming budget cycle which includesthe Governor's Budget, released in January, andthe legislative hearings held during the spring.
University of California
Capital planning at the University of California is acomplex process that extends from the developmentof campus long-range development plans to the con-struction of specific projects. It is a highly decen-tralized process and aims to integrate the needs ofindividual campuses with the overall goals of theUniversity and the external communIty, and it in-vests heavily in early, upfront planning, extensiveanalys's, and widespread consultation and negotia-tion.
Development of campus long.range developmentplans: At the University, capital planning and indi-vidual project approval occur in the context of each
campus's long-range development plan. Approvalof a long-range development plan by the Universi-ty's Regents is a necessary condition for the siting ofnew construction projects. Each campus's develop-ment plan is based upon the academic goals of thatcampus and is a unique and comprehensive expres-sion of the physical development necessary to ac-commodate those goals. It is used to guide day-to-day decisions about land use and environmental im-pact. It does not include a list of specific projects,but rather addresses issues such as optimal enroll-ments, landscape, functional relationships, circula-tion patterns, and open space.
Long-range development plans are prepared whencampuses are new and are revised periodically ascircumstances change. lf, after approval of an plan,the desired siting of a specific project is not in accordwith the plan, that project must be separately ap-proved and the plan amended accordingly.
Under the law, the University -- like all the seg-ments -- is raluired to prepare an environmentalimpact report for all p. ,jects, including long-rangedevelopment plans, that are expected to have a sig-nificant impact on the environment. The process in-cludes assessment and classification of potential en-vironmental impact, internal consultation amongfaculty and administrators, and public review. Ad-ditional environmental review occurs whenever along-range development plan is amended or revised.Both these plans and environmental impact reportsare published documents that are available for cam-pus, University, and public use.
Development of projects: The process for planningand seeking approval for individual projects beginsat the campuses and stems from their academic pro-grams, enrollment projections, and space plans. Forprojects to be funded by the State, the approvalprocess includes the annual preparation by eachcampus of a capital improvement program and de-velopment by the Office of the President of the Re-gents' Budget for Capital Improvements. For proj-ects to be funded by non-State sources, the approvalprocess occurs on a project-by-project basis through-out a given year.
At the campuses, facilities planners work with fac-ulty and administrators within individual academicunits to identify facilities needs and to ..onsider theoptions for meeting them. The possible outcomesmay range from those that are not related to capi-
4 .;3 1

tal, to the reallocation or reassignment of space, tothe renovation, expansion, or construction of facili-ties.
Once specific needs are identified, campuses under-take initial studies to define the details of their proj-ects. These studies address a broad range of issuesfrom the overall scope and cost of a project to thespecific site conditions and design parameters.
As projects become more clearly defined, campusesinitiate discussions with staff in the Office of thePresident in an effort to develop and refine proposedprojects, to select those projects that should be pur-sued, to establish priorities among them, and to de-cide for which projects State funding should besought. These efforts require campuses to considercompeting needs, campus priorities, funding options,and development schedules. It means that theymust undertake careful specification of their aca-demic program needs through consultation with de-ans, department chairs, faculty, and senior admin-istrators; consideration of their existing facilitiesand space plan; an examination of options for meet-ing those needs by means of renovation or expan-sion of existing facilities, or construction of entirelynew facilities; and a number of preliminary studiesthat define the programmatic requirements for theproject, and address technical issues related to siteconditions, cost, and potential impact on the envi-ronment.
For projects to be funded by the State, each campusdevelops a capital improvement program proposalfor submission to the Office of the President. It in-cludes a general description of each new proposedproject and a list of the campus's priorities.
Once the campuses have finalized their capital im-provement programs. the Office of the Presidentworks with them to set University-wide prioritiesamong all of the project proposals and to determinethe highest priority projects to be included in theRegents' Budget for that year. In setting prioritiesamong the various project proposals, a number offactors are considered beyond the campus's own pri-orities. Among these are the relative needs of thecampuses for space and the relative condition of ex-isting facilities, issues of program quality that mayresult from technologically obsolete facilities or ma-jor health and safety deficiencies, special programinitiatives, such as the Graduate School of Interna-tional Relations and Pacific Studies at the San Die-
32
go campus, the cost-effectiveness and likelihood offunding of some project proposals compared to oth-ers, the degree of preparedness of proposals in termsof how clearly a project is defined and how well it isjustified, and the overall goal of constructing a bud-get that presents a balanced program of construc-tion, renovation, infrastructure development, andcode correction.
Preparation of project planning guides: Campusesprepare a project planning guide for each of theirproposed projects. The project planning guide pro-vides relevant information about enrollments andthe academic programs to be supported by the capi-tal project, analysis of facility requirements for theprogram, a detailed description of the proposedphysical improvements, and a detailed budget andfunding plan.
In many cases, up to two years of detailed planningis undertaken before a project proposal is ready andthe project planning guide is complete. This initialplanning requires a great deal of time and effort,but aims to ensure the programmatic justificationand cost-effectiveness of every project for whichState funds are requested.
As should be clear from this discussion, the internalprocess employed by the University for identifyingand prioritizing capital outlay projects is highly de-centralized, with substantial discretion left in thehands of the individual campuses. This level of de-centralization is possible, at least in part, becausethe University maintains substantially larger plan-ning staffs on the campus level than either theState University or the community colleges.
This intensive front-end planning also forms the ba-sis for the annual Regents' Budget for Capital Im-provements. This document constitutes the Univer-sity's formal request for capital funding from theState for the upcoming budget year and also identi-fies projects for which funding is expected to be re-quested in subsequent years. It is transmitted tothe Governor for consideration and inclusion in theGovernor's Budget.
Final versions of the project planning guides areprovided to the Department of Finance and the Leg-islative Analyst's Office in support of the fundingrequest at the same time the Regents' Budget issent to the State for consideration. In addition,background information on the University's capital
4 :^;

needs and funding requests is provided throughcampus visits. These campus meetings include stafffrom the Department of Finance, the LegislativeAnalyst's Office, and legislative budget committeeconsultants, as well as key campus administrators,faculty, and staff. The purpose of the meetings is toprovide State staff with the opportunity to ask ques-tions and talk with campus faculty and facilityplanners about specific project proposals. Universi-ty staff work closely with State staff to answer ques-tions and provide additional information before andduring formal legislative hearings on the Universi-ty's capital budget.
Although the process for identifying facilities needsand defining the scope of individual projects is si-milar for projects to be funded from either Statefunds or non-State funds, there are differences inthe ways individual projects are keviewed and ap-proved. The primary difference is that projects to befunded from non-State sources are approved, not aspart of a comprehensive annual program, but on aproject-by-project basis throughout the year.
Display 13 below shows a general timeline of theUniversity's process for planning and approvingState-funded projects.
State budgeting
One of the strongest instruments for exerting Statepolicy influence into public higher education is theState budget. The budget is one of the predominantpoints of focus for the Governor, the Legislature,and higher education leaders themselves. This im-portance is understandable: It is through the bud-get that new initiatives are often started, and it iswhere institutional performance is evaluated.These decisions can and do get made in other places,but there is no other place where all of the decisionscome together in the same way as in the State bud-get.
In the context of short- and long-range planning, anunderstanding of the structure and dynamics of theState budget process is important for several rea-sons:
1. The timeline of the budget process necessarilydictates the timetable of many institutional re-search and planning activities.
2. The formulae and entei ;:. applied in State bud-geting will dictate many of the issues and ana-lytic questions addressed through institutionalresearch and planning.
3. Institutional perceptions of the budget processwill likely shape the planning estimates of theavailability of State resources. These Agtimateson the availability of future resources w,tably affect which short- and long-range inscitu-tional goals come to be viewed as realistic.
4. The State budget process contains numerous fi-nancial incentives and disincentives for a widerange of the segments activities. Since any in-stitution will naturally gravitate toward wherethe money is, an understanding of the incentivesinherent in the various State funding formulaeand criteria gives important insights into a widevariety of institutional practices of the segments.
In this section of the report, Commission staff de-scribes the system of State budgeting used in Cali-fornia for public higher education in three parts:first, with an overview of the State budget process;second, with a description and an analysis of the ru-les of the support budget process as they apply tothe three systems; and finally, with a descriptionand analysis of the rules of the capital outlay bud-get process as they apply to the three segments.
Throughout this part of the report, the term publichigher education means the State-funded budgetsfor the University of California, the CaliforniaState University, and the California CommunityColleges. The analysis excludes discussion of fund-ing for medical education, teaching hospitals, andthe University's Department of Energy laborator-ies, as well as student financial aid, the CaliforniaMar'time Academy, Hastings College of the Law,and the California Postsecondary Education Com-mission.
Overview of the budget process
In California, almost all expenditures and revenuesare put into a single budget bill, which must be en-acted by the Legislature by June 15 of each year togo into effect on July 1. This means that appropria-tions fer all programs -- whether they are for high-ways, public schools, welfare, or higher education --go into a single piece of legislation. This budget sys-tem contrasts with most other states and with the
4 f;33

federal government, which generally pass severalseparate appropriations bills each year: a highwaybill, a health bill, an education bill, and the like.
The fact that California puts almost all of its expen-ditures into one big budget bill, coupled with thefact that California is required under its Constitu-tion to balance expenditures with revenues, hasmeant that the budget process in this State is gen-erally recognized to be one of the most sophisticatedin the country, because the process forces decisionsabout spending priorities and trade-offs betweenprograms.
General Fund revenues -- or funds that can be spentfor any purpose -- account for roughly 57 percent ofall State spending in California. The various activi-ties of State government vary widely, however, inthe extent to which they are dependent on GeneralFunds. For instance, highways are paid for with
special taxes that cannoL be used for anything else,whereas most health and welfare expenditures arematched dollar-for-dollar with federal funds. Onthe other hand, education (both 1(-12 and highereducation) is heavily dependent on General Funds.Even in the two university systems, which havemultiple sources of funds, they rely almost exclu-sively on General Funds for the core instructionalprogram.
In the early post-Proposition 13 )4ars (1978-1983),when the tax-cutting movement and a recession com-bined to force major cuts in General Fund programs,competition within the educational system for re-sources was fierce. Since that time, the Gann ap-propriations limit, and most recently the passage ofProposition 98, have contributed to limit even fur-ther the proportion of State General Funds that areavailable for expenditure in postsecondary edu-
DISPLAY 13 Calendar of the University of California's Process for Developing the CapitalImprovement Budget in a Typical Year
Month Regents' Budget (i.e., 1990-91 Budget)
February Office of the President (GO issues instructions to the campuses for preparation of new budgetfunding requests.
March Campuses submit requests for capital budget funding to OP.
April Campuses submit draft PPGs and related documentation for project funding requests to OP.
June Draft Regents' Budget is reviewed internally.
August Campuses submit final PPG9 and documentation for project funding requests to OP.Final decisions of Regents are made.
September Regents Budget for Capital Improvements is released.Supporting documentation is sent to State.
October OP conducts visits to campuses with State staff to review campus issues and discuss capitalfunding requests.
November OP engages in discussion with Department of Finance concerning Governor's BusAget.
December OP responds to questions raised by Legislative Analyst regarding projects.
Note: It is important to understand that this calendar outlines the fundamental steps in the process for developing the CapitalImprovement Budget in a typical year. The actual process is considerably more comples and less structured than the calendar maysuggest.
For example, the calendar addresses the approval process for new projects in theone year in which State funding is requested: it doesnot reflect either the multi-year nature of that funding process or the several years of planning and project development that precedethe request.
The calendar pertains only to capital projects to be State funded. It does not apply to projects to be funded from non-State sources.
Source: University of Crlifornia.
34

DISPLAY 14 State General Fund Expenditures 1987-88
K-12 - 37.25%
Source: Legislative Analyst's Office, Analysis of the 1988419 State Budget.
cation. An additional factor constraining the avail-ability of State General funds is the extent to whichannual baseline adjustments are set in statute forcertain major spending cc, Legories. This leaves theGovernor and the Legislature even less flexibilityin budgeting for those categories without statu-torily defined funding formulas. Display 14 on theopposite page shows the distribution of State Gener-al Funds by major funding category as well as thoseportions of the budget for which annual funding isrequired through statutory mandate.
California's budget is an incremental budget. Insti-tutions submit annual requests for funds to the De-partment of Finance. In general, for all programs(not just those in higher education), the Departmentuses agreed-on formulae to evaluate budgetary re-quirements. Formulae are either negotiated be-tween the institutions and the Department, or areset in statute. These formulae use readily accessi-ble yardsticks of workload (for example, miles offreeway, welfare caseload, or number of students)
that are objective measures of how much money isrequired for programs. Virtually all budget formu-lae are developed through studies of actual spend-ing patterns, which then serve as benchmarks fornegotiations upward or downward. Because of this,budget formulae tend to perpetuate status quospending patterns: a program that has receivedmoney in the past will continue to get it, and viceversa.
For State operations budgets, the formulae gener-ally translate workload into personnel -- or posi-tions -- required for the work to be done. For all pro-grams, each year's budget is made up of the pre-vious year's budget base, adjusted by formula forworkload, plus funds for inflation (price increases)and salary increases. Nt w program initiatives arethen added to the adjusted base. New program in-itiatives take many forms, and can include re-cal-culations of the budget formulae to enrich the exist-ing program. In most years, new program initi-atives comprise a very minor percentage of total
35

funds spent. The overwhelming majority of newfunds are computed as increases or decreases to theban budget.
Incremental budgeting strongly influences institu-tional behavior to maximize base funding, since vir-tually all new money emanates from the base. (It isa curious trait of budgetary behavior that baselineadjustments are rarely thought of as budget in-creases.)
State operations vs. local assistance
The process used to make "baseline adjustments" isdifferent for programs classified as State operationsand those known as local assistance. This categori-zation is a throwback to the pre-Proposition 13 era,when local government had the primary responsi-bility for managing and paying for these servicesand programs. The severe cutbacks in property tax-es that resulted from Proposition 13 have blurredthese distinctions, since the State now pays for themajority of local assistance programs. The majorexpenditure components of the two different budgetcategories are outlined in Display 15 below.
DISPLAY 15 State Operations and LocalAssistance
State Operations
Universityof California
izcal Assistance
Medi-Cal
SSUSSP
The California AFDC
K-12 Education
Community Colleges
Developmei. tal Services
All other Tax Relief
Public Health
Source: California Postsecondary Education Commission.
State University
Departmentof Corrections
State government
After the Department of Finance puts together itsbaseline budget, the Governor reviews the budget tosee if it fits his spending priorities. If the baseline
36
costs more than projected revenues (revenue pro-jections are also done by the Department), the Gov-ernor has the choice of making cuts or proposing atax increase (or revenue enhancements) to the Leg-islature. The Governor also will make the final de-cisions about new programs or initiatives.
The Governor submits his proposed expenditureplan to the Legislature in January of each year.The Legislature reviews the Governor's spendingplan in budget hearings held over the next fivemonths. The Legislature can rewrite the Gover-nor's Budget any way it sees fit (by adding, or de-leting programs, or changing the source of funds forthem). The Senate and Assembly versions of thebudget are adopted by a two-thirds vote of the re-spective houses, and any discrepancies between thetwo are resolved in a Joint Legislative ConferenceCommittee. After reconciling differences betweenthe two houses' version of the budget, the final bud-get is sent on a two-thirds vote to the Governor byJune 15.
The Governor has line-item veto pow and can re-duce or delete any item of expenditi. 1 may notincrease them. The budget that is signed into lawby the Governor on July 1 then goes into effect forthe next fiscal year.
The power of the executive
While the political dynamic of the budget process asit affects the relation between the Governor and theLegislature is an interesting and colorful one, it hasbeen extensively commented on elsewhere. Howev-er, one important fact about that dynamic is par-ticularly germane to this analysis. The Legislatureunder the Constitution has exclusive power over allappropriations, which means that everyone -- in-cluding the Governor -- has to get the Legislature topass a bill in order to get money. This means thattwo-thirds of the members or both houses have toagree in order to spend money. Because the Gover-nor has the power to propose a single spending pro-posal, the power of the executive over state spend-ing priorities is enormous. Unlike other states,California's single budget bill allows the Governorto confine his efforts to one piece of legislation. Infact, the Governor does not have to pay attention toany other legislative priorities until the budget billis signed into law. (Under the Constitution, no

spending bill -- except for emergencies -- can besigned by the Governor until the budget is enacted.)
This fact, coupled with the incremental budgetingapproach, in which baseline adjustments eat up vir-tually all new money, the two-thirds vote require-ment, and the line-item veto power, make the Cali-fornia budget one of the strongest executive budgetsin the country.
The annual support budget processfor postsecondary education
The baseline adjustment process for the two univer-sities is the same as for all state agencies. It is atwo-step process: salary increases (which i:Lcludecost-of-living adjustments and merit salary adjust-ments), and price increases.
Salary increases in the universities: For the salarycost of living increases, requests for faculty salaryincreases are separated from those for staff in-creases. For staff increases, the universities gener-ally ask to get the same amount that is made avail-able to all other state agencies. For faculty salaries,the California Postsecondary Education Commis-sion conducts an annual survey of faculty compen-sation for institutions across the country which arethought to be comparable to the University of Cali-fornia and the California State University systems.On the basis of this survey, the Commission thencomputes what percentage increase (or decrease) isneeded to bring salary levels to parity with those of-fered by comparison institutions. This parity figurethen becomes a benchmark for the two GoverningBoards in preparing their budget requests, as wellas for the Department of Finance in deciding whatamount to propose to the Governor. As always, thefinal decision about how much to propose for facultyand for staff increases rests with the Governor.
For merit salary adjustments, formulae which arenegotiated between the institutions and the Depart-ment of Finance are used to calculate the amount ofmoney which will be needed to pay for normal meritincreases and for promotions for faculty and staff.The formulae are based on studies done in the dis-tant past of institutional advancement and promo-tion patterns, and differ somewhat between the in-stitutions. The University of California gets meritand promotion funds as a percentage of the base,and the State University on a position-by-position
basis. Approximately 1 percent of the salary base isallocated for merit and promotion increases for eachof the two systems.
Once the Legislature is through with the budget,funds for cost-of-living adjustments ssid for meritincreases are generally lumped into a single budgetcategory to be spent by the institutions for employeecompensation. Pursuant to the collective bargain-ing process, it is up to the institution (in consul-tation with employee groups, if there is formal col-lective bargaining, or less formally if there is not) tofigure out how to allocate these funds.
Price increases in the universities: For non-salaryprice increases, the Department of Finance in thefall of each year sends to each State agency some-thing known as the price letter which gives thatyear's guidelines for how much the agencies can askfor inflationary adjustments. For items where in-flation has been particularly high, the Departmentwill create a separate price category that allowshigher-than-average inflationary adjustments. Ex-amples of things that have historically had sepa-rate price category status are utilities, travel, post-age, and library books. Items that are not in a sepa-rate price category are assigned an overall price lev-el, which is usually set to equal an inflationary in-dex known as the "Gross National Product price de-flator" -- a standard index published by the federalgovernment, which purports to measure cost in-creases for goods and services purchased by stateand local government.
Increases for the community colleges: Communitycolleges receive their inflationary adjustment in thesame way as local assistance budgets. A cost-of-living adjustment that is required to be given is setin statute for local assistance budgets. Unlike thetwo university segments, which separate salary,merit, and price-increase funding, community col-leges receive a lump-sum cost-of-living adjustmenton their entire base. The cost-of-living adjustmentfor community colleges is statutorily set to be theGross National Product price deflator, which in1988 was 3.8 percent. Once the institution receivesthe funds, it is up to the individual districts to deter-mine how to spend the money -- on across-the-boardraises, for promotions, or for non-salary increases.In most districts, these decisions are reachedthrough the collective bargaining process.
5 ;37
The result of the baseline inflationary adjustmentprocess is that there are funding disparities be-tween inflationary, cost-of-living adjustment, andmerit salary adjustments between the two univer-sities and the community colleges. In periods of in-flation, where there are separate price categoriesfor items of expenditure such as postage or utilitiesthat are greater than the Gross National Productdeflator, these disparities result in an apparent un-derfunding of the community colleges' budget. Inperiods of low inflation or during times when the de-flator is greater than the parity figure for uni-versity salaries, the opposite is true. This lattercondition where the disparities have advantagedthe community colleges -- has not occurred duringthe post-Proposition 13 years. The accumulated un-derfunding of community colleges budgets has oc-curred not because of an explicit policy decision, butbecause of technical glitches in the funding for-mulae.
Workload formulae
The second part of the baseline adjustment pro-cedure is a process for adding or taking away fundsfor workload. For all three systems, the workloadformulae are functions of enrollments -- full-time-equivalents in the university systems, and averagedaily attendance in the community colleges. Whatthis means is that the resources needed to fund allcategories of expenditures -- from instruction to ad-ministration -- are related to the number of stu-dents in the institution. The biggest difference be-tween full-time equivalents and average daily at-tendance as a measure is that full-time equivalentsare related to the academic credit ascociated with acourse, while average daily attendance is computedon the basis of seat-time or contact hours.
Building full-time equivalents:the credit-hour function
The critical measure for the universities that drivesfull-time equivalents are student credit hours (alsosometimes known as the student credit units andabbreviated as "SCH" or "scul. A student credithour is the credit (that counts toward graduation)that each student receives for taking a class.
Credit hours relate to the amount of time a studentspends in a class. (For instance, a class that meetsone hour a day five days a week is generally a five-
38
unit class.) Student credit hours translate into full-time-equivalent students without regard to differ-ences in discipline, or resources required to teach.For example, both universities earn the same num-ber of full-time-equivalent students for the follow-ing:
1. A five-unit upper-division chemistry class en-rolling 20 students;
2. A four-unit lower-division sociology class enroll-ing 25 students; or
3. A one-urit physical education class with 100 stu-dents.
A full-time-equivalent undergraduate student atboth universities takes an average of 15 units dur-ing each term of the academic year. (Quarter sys-tem units are counted as roughly 1.5 times semestersystem units.) Therefore, one full-time-equivalentundergraduate is one student who takes 45 quartercredit units of classes during the year, or two stu-dents who together take 45 units, etc. A full-timegraduate student at the University takes an aver-age of 12 credit units during a term, as opposed to15 at the State University.
The University, as a matter of policy, discouragespart-time enrollments for undergraduates andgraduates; 92 percent of its undergraduates and 96percent of its graduate students are full-time stu-dents. The State University system encouragespart-time students; only 72 percent of its under-graduates and 23 percent of its graduate studentsare enrolled full time. This means that there are al-most twice as many students in the California StateUniversity per full-time equivalent as in the Uni-versity of California.
The University's budget formulae
The enrollment-related budget formulae for theUniversity of California are very simple. The insti-tution gets one new faculty position, accompaniedby related support, for each 17.61 full-time equiv-alents in enrollments. (Once a position is in thebase, it automatically gets cost-of-living and meritsalary adjustments each year). The Universitycounts one full-time-equivalent enrollment for each15 undergraduate credit hours, and one full-timeequivalent for each 12 hours of class for first-stagegraduate students -- for example, master's degreestudents and first-stage doctoral students, For stu-
5 1

dents in Ph.D. programs, after they have advancedto candidacy, each of them is counted as one full-time equivalent for nine quarters, after which theycan no longer be counted for enrollment purposes.Teaching assistant positions are allocated on the ra-tio of one position for every 44.20 full-time-equiva-lent undergraduates. Once the Univenity gets themoney, it makes decisions about how to spend it --on faculty full-time equivalents, or staff, or on in-structional support. The formulae generate enoughmoney to pay for employee benefits and clerical sup-port for each new faculty full-time equivalents.
The State University budget formulae:mode and level
The State University's budget system is much moreelaborate. It has well over a hundred differentworkload formulae that are used to negotiate base-line adjustments with the Department of Finance.Virtually all of these formulae are enrollment re-lated. Like the University, the key academic com-ponents -- new faculty and staff positions, libraryresources, and the like, are all driven by full-timeequivalents and student credit hours. Unlike theUniversity, requirements for staff for student ser-vice expenditures are driven by headcount enroll-ments rather than full-time equivalents.
Like the University, most State University re-sources are tied to new faculty positions. For newfaculty positions, the State University and the De-partment of Finance calculate the number of posi-tions required using a system known as the mode-and-level approach. Under the mode-and-level ap-proach, the State University weights the studentcredit units by different levels and types of instruc-tion, to take into account differences in costs for dif-ferent kinds of instruction. The methodology isbased on three elements:
1. The staffmg categories, which consist of 16 modes(lecture, laboratory, physical education, etc.) andthree levels (lower division, upper division, andgraduate) of instruction;
2. Ratios of student credit units to full-time-equi-valent faculty in each of these categories; and
3. The distribution of student credit units amongthe staffing categories.
What this means as a practical matter is that thesystem uses historical information (from the 1973-
74 academic year) to evaluate how faculty time wasspent, and then projects the number of positions re-quired to continue that level of support against eachyear's enrollments. The weights that have been de-veloped earn more faculty full-time equivalents forupper-division and graduate courses than for lower-division coursework. The effect of the formulae onthe average is to allocate one new faculty positionfor each 18.00 full-time-equivalent students -- a ra-tio that historically has been very close to the oneused by the University. Because of the mode-and-level approach, however, the State University is of-ten in the position where its enrollment goes up andits budget goes down. Such was the case in 1985-86,when lower-division enrollments went up, causingan overall shift toward lower-cost instruction. Be-cause of the shift, the State University had its bud-get cut by 86 full-time-equivalent faculty.
Unlike the University, the State University doesnot receive positions for teaching assistants, andthe formulae separate allocations for new faculty po-sitions, staff positions, and support. For each 1,000new full-time equivalents in mode-and-level ad-justed enrollments, the State University gets 55.49new full-time-equivalent faculty, 15.25 new supportstaff, and 15.73 new administrative positions.
Internal allocation flexibility:internal distribution of resources
Once the universities receive funds from the State,they are free to allocate the resources in the waythat they see fit to meet current priorities and ac-commodate student demand. The reallocation canoccur in either of two places.
First, the central administration may make somereallocation decisions between the campuses.This generally happens when enrollment pat-terns are uneven between the campuses, and onecampus experiences declines while another grows.In both systems, done campus is in a period of en-rollment decline, resources are frequently pulledaway from other campuses in order to shore themup.
Reallocations also occur at the campus level. Fac-ulty and other resources that are earaed throughenrollments in one department will be allocatedto other areas, sometimes because they are under-enrolled and need the help, or because the campus
117 .t
39

wants extra money to go into that area. In gener-al terms, resources are reallocated away fromlower-division classes, to upper-division andgraduate areas.
The issue of internal flexibility for reallocation be-comes contentious primarily in periods of enroll-ment decline. If the enrollment declines are slightor temporary, or if demand in not uneven among de-partments, the problem can be accommodated.However, if enrollment declines continue, the polit-ical as well as the educational costs of protecting po-sitions in underenrolled areas becomes severe. Atthat point, decisions have to be made about whetherto try to increase enrollments or to take away posi-tions. Because tenured faculty positions are essen-tially owned by the department where tenure isearned, scaling down academic programs when stu-dent demand shifts is a very long and slow process.Because the process is such a slow one, and extractssuch costs from the institutions, the preferred man-agement option for both institutions is to keep somepercentage of total faculty resources in temporarypositions, assigned to faculty who cannot or will notbe tenured.
For the two university systems, the issue of internalreallocation and uneven demand is kept within theinstitutions, since overall enrollment has been sta-ble or growing.
Community college finance
The finance system for California's community col-leges differs significantly from that used for the twouniversity systems. The fundamental reason forthe difference is historical, in that the communitycollege system grew out of the public school system.The community colleges' finance system has gonethrough several upheavals in the last ten years, thebiggest being Proposition 13, the imposition of tui-tion in 1984, the passage of AB 1725 (Vasconcellos)in 1988, and the recent voter approval of Propo-sition 98. As noted earlier in this paper, there isnow a widespread recognition that the current sys-tern of community college finance is inadequate. Itis expected that the next five years will see substan-tial reform in the way the community colleges amfunded, as the provisions of AB 1725 and Prop-osition 98 are implemented.
Prior to Proposition 13, community colleges werefunded 53 percent with local property tax revenues
40
and 41 percent with State General Funds. At thattime, districts that choose to tax themselves at ahigh rate were able to keep their funds to pay forbetter colleges. State funds were layered on top ofthe district funds and were allocated in inverse rela-tion to district funds so as to equalize fundingamong districts. The relation of State and localproperty tax revenues has reversed since Proposi-tion 13, and the colleges are now funded 62 percentwith State General Funds and 27 percent with localproperty taxes. The fact that 27 percent of revenuescontinue to come from local property taxes may givea false impression that these funds are available forspecial, local purposes or are somehow susceptibleto local control. The fact of the matter is that Propo-sition 13 eliminated local fiscal control from com-munity colleges' local governing boards.
Appropricatioris to the system: On May 15 of eachyear, the Department of Finance notifies the Legis-lature and the Chancellor's Office of the communitycolleges of the amount of property tax revenue ex-pected to be available during the next fiscal year.The final budget act enacted by the Legislaturetakes that estimate into effect in figuring how muchGeneral Funds are needed to pay for the communitycolleges. If the Legislature and the Governor agreethat, for example, $1.5 billion will be needed to payfor the community colleges, and the May 15 esti-mate of property tax revenues is $500 million, thenthe budget act will appropriate $1 billion in GeneralFunds to make up the difTerence. Each March 15,actual property tax receipts are recorded, and ad-justments are again made in General Fund appro-priations if revenues are higher or lower than ex-pected.
Districts that were high property tax districts be-fore Proposition 13, and which contribute more inrevenues than other districts, simply get fewerState General Funds to make up the difference.(Districts that receive State equalization funds mayget more for other purposes.) If voters want to in-crease their taxes to enrich the core funding fortheir local colleges, they cannot do it currently,since existing law requires any extra local revenuesto be spent only for community service classes(which the won't pay for), capital outlay, orfurniture. Any imrease in the general property taxrate for t Immunity colleges would go straight to theState to offset the reed for General Funds, and not adime of it would be seen by the district. The funding
e
k)

system for community colleges can therefore beseen as a thinly disguised State system.
Unlike the two university systems, most funds forcommunity colleges are appropriated on a cashgrant basis, based on enrollment, and not tied tofull-time-equivalent faculty. With the exception ofcategorical aid programs (such as Education Oppor-tunity Programs and Services), each college is thenfree to take the funds and spend them on new fac-ulty positions, for counselors, travel, or utilities, orwhatever, depending on where the highest need is.Absent normal audit controls, the only expenditurecontrol on community colleges' main apportion-ments is the so-called 50-percent law, which re-quires that at least 50 percent of each districts'"Current Expense of Education" expenditures bespent on instructors' salaries. The quality of ex-penditure information available to compare the waythat money is spent in the community colleges tothe two university systems is very poor, since com-munity colleges have historically not required thedistricts to report expenditures in uniform cate-gories.
Allocation of statutory amounts among districts: Asnoted earlier in this paper, enrollment in communi-ty colleges is measured by average daily attendance(ADA). The amount of money that each district getsper ADA is sometimes known as the "foundation" or"revenue limit" level. The level is a function of var-ious formulae that try to equalize the funding be-tween districts and protect other legislative priori-ties. The "factors" that influence the amount perADA that a district gets are:
1. Credit or noncredit. (Noncredit ADA get lessmoney in most cases.)
2. Whether a district is growing or declining, andby how much. (In recent years, the Legislaturehas not allowed any growth money for commu-nity colleges. When growth was allowed, newADA were funded on an "incremental" rate --that is, at two-thirds on the dollar of the full ADArate. Incremental funding is a device used in theK-12 system as well, and is justified theoret-ically by the argument that short-term increasesin ADA can be accommodated by funding them atthe margin.)
3. The size of the district. Very small districts get alittle more per ADA than do larger districts, al-
legedly because the unit costs of administrationfor small districts are larger than for large dis-tricts.
4. The "wealth" of the district. Districts with lowoverall revenue per ADA get "equalization"funds. The equalization formula for communitycolleges is roughly analogous to the Serrano ad-justments in the K-12 system. It is intendedover time to reduce the funding disparities be-tween districts.
5. Declines in a district's enrollment. Districts inenrollment decline have, in the last few years,been protected from having their budgets cut fortwo years. If a district loses 10,000 ADA one yearand gets the ADA back in the second year, thenthe budgets are never adjusted downward.
Unlike the two university systems, there is very lit-tle room for reallocation of resources among dis-tricts by the Chancellor. The Chancellor's Officecomputes the effect of all of the "factors" for eachdistrict, and then allocates resources accordingly. Ifa district is short of funds, the Chancellor does nothave the statutory authority or the funding flexibil-ity to reallocate resources to make up for that short-fall. When such shortfalls occur, districts generallycome to the Legislature to ask for more money, ei-ther in the form of supplementary appropriations orloans.
The State capital outlay process
During the summer prior to the year in which capi-tal outlay funding is being requested, Cie segmentsprovide the Department of Finance and the Legisla-tive Analyst's Office with updates of campus long-range capital outlay plans, Program PlanningGuides for any projects being requested for the com-ing year, and the draft system capital outlay bud-get. The projects are reviewed by the LegislativeAnalyst and the Department of Finance for consis-tency with stated academic planning goals, consis-tency with existing space and utilization standards,and the cost-effectiveness of the proposal comparedto other alternatives. The relative priority of oneproject compared to other projects is not consideredat this phase of the process.
State agency review of proposals: Upon review ofthe five-year plans and the various program plan-ning guides, the Department of Finance and the
1. k 41
Legislative Analyst's Office arrange for and conductScope meetings on campuses requesting projects forwhich one or both agencies have questions or con-cerns. While attending Scope meetings, representa-tives of the Department and the Legislative Analystmeet with the deans, faculty, and planners most di-rectly involved with a proposal, as well as the cam-pus's senior administration, in order to gain a betterunderstanding of a project and answer any specificquestions they might have had. At this point, therepresentatives are looking for project justificationon two levels: First, they look to the deans and fac-ulty to ensure that a project is justified based onagreed-upon academic program goals and the mis-sion of the institution and/or segment; second, theylook to the chief campus planners and architects (ifapplicable for the segment) to ensure that the proj-ect meets agreed-upon space, utilization, and designpractices.
It is important to point out that not all the segmentsfollow all the space and utilization standards, andthe standards are not imposed on the segments forall the same purposes. For example, in the commu-nity colleges the State requires that the space andutilization standards be used to calculate existingspace inventory, the amount of new space requiredto accommodate the demonstrated need, and thepurposes to which the new space can be put. On theother hand, the University of California is only re-quirt to use the standards to calculate the amountof r),w space required to meet their demonstratedneed, and then only in certain space categories. APersuasive case wh4:th has been laid out by the Uni-versity indicates that the standards may be out ofdate and may no longer meet important academicneeds. The University is thus permitted to justifyits proposals using analytic approaches other thanthe space lnd utilizations standards applied to theother segments. The Postsecondary EducationCommission is currently undertaking a study to re-view the existing space and utilization standardsand will provide recommendations to the Legisla-ture and the Governor on how the standards shouldbe revised, if the study determines changes are nec-essary. This study is scheduled for completion bynext December.
Upon completion of a scope visit on a specific proj-ect, the appropriate campus or segmental facilitiesplanners will endeavor to provide any additional in-formation to the Department of Finance and the
42
Legislative Analyst on questions or concerns whichcould not be addressed on location in the Scopemeeting.
In September the segmental governing boards con-sider and approve the draft capital outlay budgetsprovided by the system's administration. Thesebudgets may reflect changes in the cost ef specificprojects as a result of changes agreed upon in Scopemeetings held before approval of the final budgets.
Upon adoption of the segments' final capital outlaybudgets, Scope meetings continue, covering addi-tional projects. At the same time, segmental repre-sentatives enter into extensive discussions with theDepartment of Finance on inclusion of their capitaloutlay requests into the Goven A)r's budget. Thesediscussions usually center on two basic issues:First, the total amount of funding likely to be madeavailable to the segment for capital outlay; and sec-ond, how far down an individual segment's prioritylist their share of the available funding will allowthem to cover. The Department of Finance does notusually dispute the Ppecific capital outlay prioritiesdefined by the segments, but rather focuses atten-tior. an the likely aggregate funding to be madeavailable to address those priorities.
Development and analysis of the Governor's budget:Upon completion of negotiations with the segments,the Department of Finance prepares the draft Statebudget for the Governor's review, revision, andeventual approval.
In mid-December the Department of Finance fur-nishes the Legislative Analyst with confidentialgalleys of the Governor's budget, allowing the Leg-islative Analyst to begin her analysis of the budgetas soon as possible after decisions are reached in theexecutive branch.
The Governut's budget is released publicly in earlyJanuary. This is also the general deadline by whichthe Legislative Analyst expects any unresolvedquestions on the specifics of a segment's capital out-lay project to be answered. This period signals thebeginning of the most frenzied time of the year forthe Legislative Analyst -- preparation of the Legis-lative Analyst's Analysis of the State Budget. TheAnalyst works intensively from the receipt of gal-leys in December through late February, when herAnalysis is released publicly. The Analyst analyzescapital outlay projects included in the Governor's

budget on three basic criteria: First, the project'scompliance with applicable State policy guidelines,such as the policy not to provide State funding stu-dent housing or student union facilities; second, theproject's compliance (depending on the segment)with applicable space and utilization standards; andfinally, the reasonableness of the project's estimat-ed cost.
Depending on the result of the analysis, the Analystmay recommend any of a number of options to theLegislature. These include:
1. Recommend adoption of the item.
2. Recommend adoption of the item, pending re-ceipt of add:tional information (such as prelim-inary plans for the project).
3. Recommend adoption of the item, contingent up-on adoption of budget language or supplementalreport language that further clarifies or definesan issue of concern to the Legislature.
4. Withhold recommendation, pending receipt ofadditional information.
5. Recommend deletion, reduction, or revision ofthe scope of the item.
6. Project raises policy issue to be resolved by theLegislature.
The final recommendation option for the Analystcovers policy issues or other contingencies not dealtwith in previous guidelines or agreements. One ex-ample of a policy issue raised by the Analyst in re-cent years is whether the University of Californiashould give higher priority to construction of re-search space as opposed to instructional space.
Legislative action on the budget: After release of theAnalyst's Analysis, legislative hearings are sched-uled by the appropriate subcommittees of the As-sembly Ways and Means Committee and the SenateBudget and Fiscal Review Committee. Legialativereview of the segments' capital outlay budgets cancover literally any aspect of any proposed projects,however, discussions generally revolve around theissues as defmed by the Legislative Analyst's Officeand the Department of Finance. After extensivehearings, in which some projects receive detailed re-view and other noncontroversial projects minimalreview, each house adopts its own version of theState budget, including the segments' respectivecapital outlay budgets.
After adoption of each house's version of the budget,the Legislature forms a Conference Committee,made up of the Chairs of the Senate and Assemblyfiscal committees and four other members. TheConference Committee meets with the sole purposeof resolving differences between each house's ver-sion of the budget. The Committee normally doesrot consider any item for which there is not a dis-crepancy between the two budgets. It should benoted also that once an item is thrown into Con-ference, the Committee considers the issue underself-imposed guidelines but has complete discretionto handle the item any way it sees fit. The Com-mittee can adopt one house's version of the item, itcan augment the item, delete it completely, or at-tach supplementary or budget control language.Further, during Conference Committee delibera-tions, the Committee generally relies on advicefrom the Legislative Analyst and the Department ofFinance on how to resolve specific issues.
Since segmental representatives are generally notpermitted to address the Conference Committeeduring its deliberations, this is one major point inthe process where the Legislative Analyst and/orthe Department of Finance can utilize the mechan-ics of the process to effect change in segmental bud-get requests. By recommending the creation of dis-crepancies on controversial items in the Assemblyand Senate versions of the budget, either controlagency can effectively cut the segments out of for-mal deliberations to resolve the issue at the Con-ference Committee level. Of course the segmentsare completely free to make their case on an item tomembers of the Conference Committee outside theconfines of the formal hearings.
After rE mciling all budget discrepancies in Con-ference, the Committee forwards a unified budgetback to each house for their adoption, on a two-thirds vote. Upon adoption by the Legislature, theBudget Bill is forwarded to the Governor for his re-view, revision, and adoption. The same blue penciloptions outlined in the State Budget section of thisdocument are operative here, except that so long asthe Legislature's capital outlay appropriation forpostsecondary education is within the aggregatelimit set by the Governor in his initial budget, hedoes not usually partake in rewriting appropriationamounts in the segments' specific capital outlayproposals.
43

Authority to spend funds: Contrary to what manybelieve, after enactment of the Budget Bill by theLegislature and Governor, the process is not over.While the segments have received their appropri-ation for the coining year, with capital outlay pro-grams they must still receive authority to spend themoney. This authority is granted by the State Pub-lic Works Board.
The Public Works Board was created, as the nameimplies, to provide oversight and control on publicworks projects being undertaken by the State. TheBoard is composed of the Director of Finance, theDirector of the Department of Transportation, andthe Director of the Department of General Services.The Board serves to provide an additional level ofadministrative control to ensure that capital outlaymonies are expended in a manner consistent withthe intent of the Legislature and the Governor.
Specifically with regard to postsecondary education,the Public Works Board reviews approved seg-mental plans to ensure that specific projects areconsistent with relevant budget and scope lan-guage, and other project parameters covering grosssquare footage, assignable square footage, primaryuse of the facility, and the space allocation plan en-visioned in the project. Board review generally cen-ters on certification of the appropriate completion ofthe previous phase of a project's development. Forexample, in the initial phase of a project's develop-ment, the Board does not require review in order toauthorize appropriations to undertake preliminaryplanning for a facility. However, in the next year ofthe project, a segment must undergo Board reviewof the preliminary plans before authorization offunding for working drawings. Likewise, workingdrawings must be reviewed by the Board beforefunding for construction can be authorized. TheBoard does not involve itself in authorizing spend-ing for equipment funds upon completion of a proj-ect's construction phase. The Board is also the bodythat reviews changes in the scope of specific capitaloutlay projects which may occur after the project'sappropriation is made. Scope changes sufficient totrigger potential Board review can occur as a resultof a e:oject's deviation from applicable budget orsupplemental report language, other agreed-uponproject parameters, or changes in the estimated costof the project.
44
Scope changes requiring Board review can cover is-sues as minor as substituting carpeting for hardfloors (budget control language specifically limitsthe segments' ability to make this change), to issuesas major as substantial design changes in a pro-posed facility. Further, cost-overruns more than$50,000 or 10 percent of a project's appropriation re-quire notificaLion of the Joint Legislative BudgetCommittee, notification of the relevant chairs of thelegislative fiscal committees, and Board approval.Cost-overruns under $50,000 or 10 percent of a proj-ect's appropriation do not require Board review, andoverruns over 20 percent require legislative approv-al in the Budget Act,
The Department of Finance serves as the chief Statecontrol agency monitoring progress on the seg-ments' capital outlay programs. In the event that asegment recognizes the need for Board review of aproject scope change, they inform the Director of Fi-nance. If necessitated by the proposed scope change,the Department of Finance notifies the chairman ofthe Joint Legislative Budget Committee and thechairs of the relevant legislative fiscal committeesof the impending review, and they then have 20days to review the scope change and advise theBoard on whether or not the change is at deviancewith the legislative intent of the capital outlay ap-propriation. If the Board receives no objection fromthe Joint Legislative Budget Committee after 20days, that is taken to represent support for the scopechange. After receiving input from the involvedsegment and the Budget Committee, the Depart-ment of Finance makes a determination as towhether or not the scope change is justiiied. Sincethe Director of Finance serves on :he Board, thtviews of the Department on proposed scope cha'.desare expressed through him. As an organizationalmatter, the Department of Finance serves as staff tothe Board and is charged with ensuring that legisla-tive intent is followed in the expenditure of capitaloutlay appropriations.
Upon review and approval by the Public WorksBoard of either a budgeted capital outlay appropria-tion or a scope change proposal, expenditure of thefunds is a-thorized, and the segment can proceedwith the project.

Conclusions
Long-range planning activitier of the segments
1. Overall planning capacity: The University ofCalifornia possesses a larger and more pervasiveplanning capacity than the State University.which in turn has a substantially larger plan-ning capacity than the community colleges.These differences appear to impact the amountand type of short- and long-range planningwhich can occur, as well as the ability of the seg-ments to articulate and analytically justify theirplans once developed. We have no indicationthat the University of California's planning ca-pacity is excessive, but rather that the other seg-ments, especially the community colleges, needexpanded planning capabilities. This need is es-pecially acute on the campus/district level.
2. Long-range planning efforts: The University ofCalifornia is well underway in a long-rangeplanning effort which aims to define the Univer-sity's likely enrollment demand and facilitiesneeds through the year 2005. The State Univer-sity has begun a parallel long-range planning ef-fort, and the community colleges have not to ourknowledge begun any sort of similar planningactivities. It is likely that the immediacy of pre-paring for implementation of AB 1725, the re-cent passage of Proposition 98, and the limitedplanning capacity outlined in the body of thisdocument have all contributed to limiting theability of the community colleges to undertakethis sort of effort at this time.
Enrollment planning and projections
3. Reasonableness of enrollment projections: Theenrollment projections conducted by the seg-ments and the Demographic Research Unit arecarefully prepared and all appear to be reason-able Any differences between individual projec-tions are minor, on the margin, and do notchange the policy implications that should bedrawn from them.
4. Community college enrollment projections: Thecommunity colleges do not prepare their own en-rollment projections, relying exclusively on theDemographic Research Unit. While the Unit's
long-range estimates are sound, the absence of aprocess in the community colleges which forcesan annual high level consideration of potentialfuture enrollments appears to contribute tolimiting the type and amount of other planningactivities which occur.
5. University of California graduate enrollmentprojections: The University of California, unlikethe State University, does not project graduatestudent enrollments based on demographictrends. Due to the overriding influence of na-tional and even international variables on fu-ture Ph.D. enrollments (relevant only for theUniversity of California), the University doesnot view it as useful to prepare estimates of fu-ture graduate enrollment levels based on demo-graphic trends. Rather, the University's gradu-ate enrollments are managed through applica-tion of a variety of academic, program, and Stateeconomic policy considerations, rather than de-mographic potentials. As a result, the Universi-ty's graduate enrollment projections should berecognized as necessarily inexact estimates offuture needs, based on inferences drawn from awide variety of unquantifiable variables. Themost direct quantitative link driving the Uni-versity's estimates is the application of theassumption that major research universitiesmust have a graduate/undergraduate studentmix of at least 20/80 percent to maintain top-flight programs.
6. California State University enrollment projec-tions: The State University's long-range enroll-ment projections are preliminary estimates gen-erated in the very early stages of its own long-range planning process. The substantial in-creases in these projections, as compared to pre-vious Demographic Research Unit and StateUniversity estimates, can be attributed to thefact that they incorporate optimistic assump-tions on progress in providing access to histori-cally underrepresented students. These projec-tions were prepared by the Office of the Chan-cellor and precede a request to the campuses tooutline the extent to which they can individuallyaccommodate growth through the year 2005 Asa result of the preliminary and ongoing nature ofthe State University's pl mning process, it is
that these enrollment projections will un-t
45

dergo revision over time, as a result of refine-ments in the projection model and discussionswith the campuses.
Capital outlay planning
7 . Differences in capital outlay planning: The seg-ments differ in the way in which campus capitaloutlay proposals are internally justified andprioritized. The University grants broad discre-tion to campuses to develop and justify projectsin a highly individualized manner. Likewise,projects between University campuses are pri-oritized at the systemwide level based on an in-dividual analysis of each project and its rela-tionship and contribution to meeting the uniqueacademic planning goals of the campus pro-posing the project. On the other hand, the StateUniversity and community colleges (with differ-ing levels of structure) assess the need for indi-vidual campus projects based on uniform sys-temwide need assessment guidelines. Similarly,individual campus proposals are prioritized intothe systems' systemwide capital outlay budgetsthrough explicitly defined statewide construc-tion priorities which prioritize projects by spacecategory and use of common "need standards."While the more centralized planning approachesutilized by the State University and the com-munity colleges may be a necessary manage-ment decision driven by the larger size of thesesegments, the University of California's moredecentralized approach provides a closer andmore direct linkage between campus capital out-lay proposals and the unique academic planningobjectives of the individual campuses.
State budget and capital outlay approval process
8. Differences in calculating workload formula:While the State University's workload formulasare far more detailed than the University ofCalifornia's, they are calculated on similar if notidentical workload units (projected enrollmenttranslated into faculty full-time equivalents).On the other hand, the community colleges'workload increases are calculated based on pro-jected shifts in adult population translated intoADA. There are strong indications that limitingcommunity college enrollment to adjusted shifts
46
in adult population has had the effect of artifi-cially "capping" community college enrollments.
9. Differences i flexibility of internal resource allo-cation: Unlike the two university systems, thereis very little room for reallocation of resourcesamong districts by the Chancellor's Office of thecommunity college system. If a district is shortof funds, the Chancellor's Office does not havethe statutory authority or the funding flexibilityto reallocate resources to make up for that short-fall.
10. Differences in criteria for approval of capital out-lay projects: In the past, through the Legisla-tive Analyst's Office the Legislature has at-tempted to apply roughly equivalent space andcost guidelines between segments in recom-mending adoption or rejection of specific capitaloutlay proposals. However, since there havebeen differing levels of success in getting thesegments to agree to these standards, and dif-fering levels of success in getting the Legisla-ture to enforce these standards equally on allsegments, a process has evolved in which cap-ital outlay proposals are analyzed and approvedunder different rules, depending on the segmentproposing the project. As noted earlier in thisreport, the validity of these guidelines have be-come subject to question in recent years and arecurrently undergoing extensive review andstudy by the Commission. This Commission ex-pects to complete this study by December 1989.
Appendix A: Prospectus for a studyof long-range enrollment and facilitiesplanning in California public highereducation
Background
Section 66903 of the California Education Code au-thorizes the California Nstsecondary EducationCommission to collaborate with the public segmentson long-range pimning and requires the segmentsto develop long-range plans that identify the needfor and location of new facilities. The Commissionalso has responsibility for approving sites for newcampuses or off-campus centers.
In addition to this statutory authorization for theCommission's involvement in long-range planning,the Commission for the Review of the Master Planrecently recommended a reinvigorated statewideplanning process to be managed by CPEC (1987, p.40):
24. The California Postsecondary EducationCommission shall have the following respon-sibilities with regard to long-range planning inconsultation with the segments: (1) develop-ment of a common definition of long-rangeplanning; (2) development of a common set ofassumptions upon which such planning is to bebased; (3) review of segmental activities to ver-ify that they periodically prepare and updatelong-range plans based upon the common set ofassumptions; and (4) annual preparation of de-tailed 20-year projections of postsecondary en-rollment in the public and private sectors at alllevels of instruction, built upon the projectionsprepared by the Department of Finance.
In September 1987, CPEC formed an Ad Hoc Com-mittee on Long-Range Planning to review therecommendations of the Master Plan Review Com-mission within the context of CPEC's overall plan-ning priorities. The Ad Hoc Committee met threetimes and presented its final report to the Com-mission this past May 2, in which it concluded thatthe urgency of the planning priorities facing theState requires the Commission to assume a more ac-tive role in long-range planning (see CommITiiiwminutes of the May 2, 1988, meeting under Tab 15).It suggested that the Commission could be most ef-fective by carving out several priority planningprojects on which work could be started immediate-ly. It presented a set of strategic planning princi-ples that were adopted by the Commission as a lit-mus test for judging planning priorities, and it iden-tified long-range enrollment and facilities planningas the highest priority project now facing the Com-mission. In this area, it suggested a slightly dif-ferent approach than that proposed by the MasterPlan Review Commission by recommending againstCPEC's developin anual statewide enrollmentforecasts independent from those developed by theDepartment of Finance.
The Ad Hoc Committee identified two major rolesfor the Commission to play in the area of long-rangeenrollment and facilities planning -- research and
leadership. Its research responsibility centers onthe integration of existing information as well asthe development of new data, as necessary, relatingto long-range enrollment and facility planning. Itsresponsibility of leadership centers on stimulating afocused and productive statewide debate over themajor planning and policy issues surrounding long-range enrollment and facilities planning
Adding to the call for the Commission to take a leadrole in long-range enrollment and facilities plan-ning, Supplemental Budget Language has recentlybeen introduced in the State Legislature requestingthat the Commission initiate its long-range plan-ning process by developing recommendations forthe Legislature and the Governor on policy vari-ables that will influence State costs for new facili-ties through the year 2005. (The SupplementalBudget Language, as well as this prospectus, de-fines new facilities as expansion of exiting facilitiesas well as construction of new campuses or off-cam-pus centers in order to accommodate increasedenrollments.)
Based largely on recent unexpected increases in theparticipation rates of eligible freshmen, the Univer-sity of California anticipates enrollment pressure torequire new campuses by the year 2006, and the Of-rice of the President has begun a planning process toidentify options for meeting that demand. The Cali-fornia State University is now operating seven sfr-campus centers -- most of which will probably ex-pand beyond their current size and scope, and one ortwo of which may become full-fledged campusei --and it is currently planning an additional off-cam-pus center in Salinas. Among the California Community Colleges, the Commission recently approv-ed major expansion of an off-campus center at Peta-luma in southern Sonoma County, and the River-side and San Jacinto Community College Districtshave developed plans for three new off-campus cen-ters in western Riverside County for Commissionapproval.
Project justification
Currently, there is no coordinated or integratedstatewide plan that determines how the State mightaccommodate and &once expected long-range in-creases in enrollment demand in public postsec-ondary edtication. At present, there are no officialenrolLeient forecasts that encompass all three seg..
t) is)
47

ments past the early 2000s. Although enrollmentdemand has been higher than expected for both theUniversity and State University, no decision hasbeen made as to whether these enrollments can beabsorbed within existing capacity or whether newcampuses will need to be built.
The decision-making, funding, and constructiontimelines inherent in the expansion or construction: f major new educational facilities by the turn of thecentury require that planning begin immediately.The cost differentials between renovation of olderbuildings, construction of new facilities, and expan-sion of existing facilities need to be identified -- withthe alternatives weighed in a cost-benefit context --and mechanisms for making choices and meetingthe associated costs must be developed. Transporta-tion and other site development problems need to beidentified and, when possible, integrated into localand statewide planning processes.
Finally, there is increasing State-level interest inlong-term infrastructure needs, as well as concernover admissions/enrollment pressures at the Uni-versity of California. Members of the Legislatureand the Governor have expressed concern about therising participation rates and the long-range costsassociated with accommodating increasing enroll-ments. As previously mentioned, the 1988-89 bud-get contains language requesting the Commissionto take a leadership role in this area. While it is notknown as of this writing whether the language willbe approved in the final Budget Act, the study out-lined in this prospectus has been designed to accom-modate the Legislature's mandate along with theCommission's planning priorities.
Project description
Commission staff will convene an Advisory Corn-mittee on Enrollment and Facilities Planning com-prised of representatives from the Department ofFinance, the University of California, the Califor-nia State University, the California Community Col-leges, the Association of Independent California Col-leges and Universities, and the Office of the Legis-lative Analyst. In consultation with this group, theCommission will identify the forces that will influ-ence demand for new educational facilities, includ-ing a review of available projections from the De-partment of Finance and the segments on expectedenrollments through the year 2005. These forces
48
will then be analyzed with respect to their suscepti-bility to State-level policy control. Based on thisanalysis, the Commission will submit a report byDecember 1989 to the Legislature and the Governoron the direction the State should take with respectto the major variables that will shape the costs ofnew facilities.
The report will, at minimum, include recommen-dations on:
1. The educational and fiscal policy variables influencing the need for new facilities by age ofstudent and academic program type, includingwhen traditional campus facilities are academically required and when nontraditional facilitiescan best meet demands for access and quality;
2. The relative State costs associated with con-struction of new space by segment, comparedwith the costs of renovation or expansion of ex-isting facilities;
3. Space and utilization standards for public post-secondary education facilities;
4. Year-round operation as an option to reduce newfacilities requirements; and
5. Priorities for construction of new sites by geo-graphic region of the State.
Following this effort, the Commission will requestthe public segments to prepare enrollment plansthrough the year 2005 and, based on these plans, toprepare plans for facilities needed to accommodateanticipated enrollments. The latter will includeplans for expansion of individual campuses and con-struction of new campuses or off-campus centers, asnecessary. These plans are to be submitted by De-cember 1990 to the Department of Finance, the Leg-islative Analyst, and the Postsecondary EducationCommission for comment and review.
Relationship to other Commissionplanning projects
Several Commission projects are anticipated in thecoming year, the results of which .11 lie integratedinto this long-range enrollment and facilities plan-ning study. Of particular interest are studies re-lated to space and utilization standards, the role ofindependent colleges and universities in postsec-ondary education, the development of revised guide-lines for the approval of off-tampus centers, and the
f3 1

review of admissions and transfer policies in publicpostsecondary education. While these projects aredefined as separate Commission studies, they arealso central to long-range enrollment and facilitiesplanning. All necessary steps will be taken, whenappropriate, to coordinate research efforts with thegoals of minimizing duplication as well as develop-ing a coherent and integrated Commission ap-proach to long-range planning.
Project schedule
Staff expects to follow this schedule:
June 13, 1988: Policy Development Committee con-sideration of this prospectus.
June-July 1988: Formation of the advisory com-mittee.
July-August 1988: Develop project workplan. Re-view and synthesis of previous State efforts in long-range educational facilities planning. Meet withsegmental planning personnel and inventory seg-mental planning efforts. Meet with segmental en-rollment planners and analyze segmental enroll-ment projection models. Prepare background paper.
September 1988: First meeting of the advisory com-mittee.
November 1988: Progress report to the Policy De-velopment Committee.
December 1988-September 1989: Draft Commis-sion report, including policy criteria, in consulta-tion with the advisory committee.
September 1989: Present the draft report as an in-formation item to the Policy Development Commit-tee.
November 1989: Present the draft report as an ac-tion item to the Policy Development Committee andthe Commission.
December 1989: Transmit the report to the Gover-nor and Legislature.
Reference
Commission for the Review of the Master Plan forHigher Education. The Master Plan Renewed: Uni-ty, Equity,, Q uality, and E fficiency in California Post-
secondary Education. Sacramento: The Commis-sion, July 1987.
Appendix B: Differences in missionand size among the three public segments
University of California
Mission: The University of California is Califor-nia's primary State-supported academic agency forresearch; it offers four-year undergraduate (bac-calaureate) programs and graduate programs in awide variety of fields; it has exclusive jurisdictionamong public institutions over graduate instructionin dentistry, law, medicine, and veterinary medi-cine; and among public institutions it has sole au-thority to award the doctoral degree, except in fieldswhere it awards joint doctorates with the CaliforniaState University.
Campuses: The University has eight general cam-puses throughout California and one health sciencecampus in San Francisco. Each campus has its owndistinct atmosphere and character. Some 150 labor-atories, extension centers, and research and fieldstations on campuses and in other parts of the Statestrengthen research and teaching while providingpublic service to California and the nation.
Enrollment: The nine campuses of the Universityhave a current enrollment of more than 161,400students, 90 percent of them residents of California.Almost 20 percent of the students are studying atthe graduate level.
Eligibility pool: The University's freshmen are se-lected from among the top one-eighth (12.5 percent)of California high school graduates. Every quali-fied student who is a 1-esident of California is eligi-ble for admission at one of the University's cam-puses, although not necessarily at the campus or inthe program of first choice. To be eligible for admis-sion, students must meet the subject, examination,and scholarship requirements specified in the Uni-versity's Undergraduate Application Packet.
The California State University
Mission: The primary function of the CaliforniaState University is instruction of undergraduate
49

and master's degree students in the liberal arts andsciences, applied fields, and professions, includink;teaching. Its faculty are authorized to undertakeresearch to the extent that is consistent with thisprimary function. In addition, the State Universityoffers joint doctoral programs with the University ofCalifornia and with independent institutions inCalifornia.
Campuses: The California State University has 19campuses throughout California. Each campus inthe system has its own unique geographic and cur-ricular character, as multipurpose institutions.
Enrollments: The system enrollments total ap-proximately 355,000 students, who are taught bysome 19,000 faculty. Last year the system awardedover 50 percent of the bachelor's degrees and 30 per-cent of the master's degrees granted in California.More than one million persons have graduated fromthe 19 campuses since 1960.
Eligibility pool: The system admits its freshmenfrom the top third of California high school gradu-ates.
California Community Colleges
Mission: California Community Colleges offer in-struction through but not beyond the second year ofcollege. The primary mission of the colleges is voca-tional education and preparation for universitytransfer. They grant vocational and technical cer-tificates and the associate in arts and associate inscience degrees. Through their community serviceand adult education programs, they offer noncreditclasses in literacy, health, civic, technical, and gen-eral education. Many colleges offer apprenticeshiptraining in a variety of vocational fields. All col-leges offer programs fulfilling the requirements forthe first two years of work at a four-year college oruniversity. Forty-five percent of all community col-lege courses are eligible for fransfer to four-year in-stitutions. The community colleges also offer a widerange of community service courses.
Enrollments: In 1988, enrollment in the communi-ty colleges was over 1.3 million students.
Campuses: The California Community Collegeshave 107 campuses that operate under 71 districtsthroughout the State of California.
50
Eligibility pool: Any person who possesses a highschool diploma o equivalent or who is of the age of18 and can benelt from instruction is eligible foradmission to a California community college. Also,California community colleges allow a limited num-Lrr of students of any grade level to enroll with theconsent of their school principal and acceptance bythe community college president.
Appendix C: Methodology for projectingCalifornia population by race/ethnicitywith age/sex detail, 1980 to 2020
The Department of Finance used a baseline cohortcomponent method to project the population byrace/ethnicity. A baseline projection assumes nofundamental institutional changes or major changesto policies and practices related to fertility, immi-gration, emigration or domestic migration. A co-hort component method traces a race/ethnic grouphaving a common year of birth throughout theirlives. As each year passes, cohorts change due tothe action of mortality and migration. New cohortsare created by applying the fertility assumption tothe women in childbearing ages.
The 1980 Census by sex, race/ethnicity, and single-year of age serves as the benchmark. Survival andfertility rates were computed based on actual datafrom the California Department of Health Services.Migration rates were estimated by analyzing 1970to 1980 movements allowing for differential under-counts and inconsistent race/ethnic definitions be-tween the two censuses.
Three basic assumptions were made in the projec-tion process:
1. In 200 years, California's race/ethnic- and age-specific fertility rates will merge to one-halftheir current difference from national rates.The Census Bureau assumes the nationalrace/ethnic differentials will merge in the year2050,
2. In 200 years, California's race/ethnic-, age- andsex-specific mortality rates will merge to one-half their current difference from nationalrates. The Census Bureau assumes the nation-al race/ethnic differentials will merge in theyear 2050.
6%3

3. There will be an aixnual average net in-migra-tion of 215,000. Foreign immigration was heldconstant throughout the projection period andthe residual domestic migration becomes netout-migration after the year 2000. Race/ethnicdistributions are merged over time from thecurrent mix to the world, national or State pro-portions as appropriate.
Using these assumptions, the benchmark popula-tion is projected 40 years into the future. Projec-tions are controlled to the Baseline '86 projectionseries which was released in December of 1986. Itis anticipated that these race/ethnic projectionswill next be revised following the incorporation ofdata from the 1990 Census.
Appendix D: California State Universityand University of California enrollmentprojections conducted by the DemographicResearch Unit
The Demographic Research Unit uses the followingdata in the preparation of statewide fall enrollmentprojections for the California State University andthe University of California:
Historical trends in participation rates;
Recent enrollment trends;
Current admissions policies;
Population composition and demographicchanges;
The proportional distribution of the sexes, agegroups, and enrollment categories over projectionyears; and
Projected trends in past series.
An age/sex participation rate model is currentlyused. Historical enrollment systemwide is maintain-ed by sex, five age groups, and undergraduate-graduate levels of enrollment. Participation ratesfor each of the resulting categories of enrollmentare derived by dividing enrollment by the corre-sponding population projection for that age/sexgroup and multiplying by 1000. The age groups forthe population and enrollment are:
Enrollment PooLdatwn
19 and under 18-1920-24 20-24
25-2930-3435 and over
25-2930-3435-64
A linear least squares regression is one analyticaltool used in the process and is performed on a ten-year history of participation rates. In those in-stances where recent trends appear to be departingfrom tne long-term trend or where the regressionline is not a reliable predictor of actual values,greater weight is given to the recent participationrates and enrollment trends. Recent short-termtrends in participation rates may be continued ormodified for the few years of the projection, andthen held constant, for example. Projected total en-rollment is the sum of projected enrollment for eachcategory.
A spreadsheet showing an evaluation of the "good-ness of fit" of the regression line and producing sev-eral models of projected participation rates is gen-erated for the initial analysis.
The following explains the current models:
0: The least squares regression line is deter-mined by the historical participation rates.The projection starts at the Y estimate for thelast historical year.
1, 2, and F: Modified least squares regressionlines start at the last historical participationrate for the projection. The participation ratefor each projected year is calculated by mul-tiplying the slope of the least squares line bya given value and adding that product to theparticipation rate of the previous year. Themultipliers for each projection year are:
Year Model 1 Model 2 Model F
1st .8 .4 .2
2nd .65 .35 .1753rd .6 .3 .154th .55 .25 .1255th .5 .2 .1
6th .25 .15 .0757th .125 .1 .058th .0625 .05 .0259th .03125 .0 .0
10th .015625 .0 .0
The Demographic Research Unit is in the process ofevaluating its current projection model and develop-ing a more comprehensive alternate model which
o
5 1

could include, for example, greater age detail andseparate projections for first-time, transfer, andcontinuing students.
Appendix E: Methodology for thepreliminary enrollment projectionfor the California State Universitygrowth plan, 2005-06
The following projection of California State Univer-sity headcount and full-time equivalent (FTE) en-rollment in 2005-06 is based on California popula-tion projections and State University participationrate projections:
Students Headcount FTE
Undergraduate 465,500 368,100Graduate 75,800 37,900
Total 541,300 406,000
The population projections by ethnic group are fromProjected Total Population for California by Race/Re icity, (Report 88 P-4, February 1988) of theDepartment of Finance's Demographic ResearchUnit. The ethnic groups are "Asian/Other," "Black,""Hispanic," and "White."
The participation rates are based on State Univer-sity experience. The rates were projected by usingone-half the average rate of change observed overthe past two years (i.e., 1986-87 to 1987-88 and1987-88 to 1988-89) to adjust the rates for the nexttwo years (i.e., for 1989-90 and 1990-91). The rateswere held constant thereafter through 2005-06.
The projection was made by applying the adjustedAsian rates to the Asian/Other population and ap-plying the adjusted white rates to the Black, His-panic, and white population.
Appendix F: K-12 enrollment and highschool graduation projections conductedby the Demographic Research Unit
A cohort survival model approach is the methodol-ogy used for projecting enrollment in grades kinder-garten through twelfth grade and high schoolgraduates. A grade progression ratio (the educa-tional "survival rate") is multiplied by projected en-rollment in one year to calculate estimated enroll..
52
ment in the next grade level for the next year of theprojection series.
Three key data sets are required for calculatingthese projections:
1. Actual graded enrollment data: The CBEDS Unitof the State Department of Education providesgraded enrollments by county for the past tenyears.
2. Actual and projected birth data: Actual birthsare collected from the Department of Health Ser-vices, Health Data Statistics Branch. The De-partment of Finance, Demographic ResearchUnit, utilizes its own estimates for projectedbirths.
3. Actual grade progression ratios: Actual gradeprogression ratios are generated by calculatingthe ratio of enrollment in one grade to the en-rollment in the previous grade for the precedingyear.
Nine approaches are currently utilized for applyingactual grade progression patios into future years ofa projection series:
1. Last year's rate. This method assumes the latestavailable grade progression ratios will be usedfor each year of the projection period.
2. Five year average. This method calculates theaverage actual grade progression ratio over thepast five years for each grade and assumes thatthe resulting rates will hold constant for eachyear of the projection period.
3. Weighted average. This method calculates theweighted average change in actual grade pro-gression ratios over the past three years for eachgrade and assumes that the resulting rates willhold constant for each year of the projection pe-riod.
4. Applying the last historical grade progressionratios (Model 1) at the beginning of the projec-tion period, then merging to the five-year aver-age (Model 2) over the ten-year projection pe-riod.
5. Applying the last historical grade progressionratios (Model 1) at the beginning of the projec-tion period, then merging to the three-yearweighted average (Model 3) over the ten-yearprojection period.

6. Applying the three-year weighted average gradeprogression ratios (Model 3) at the beginning ofthe projection period, then merging to the five-year average (Model 2) over the ten-year projec-tion period.
7. Computing the slope of the least-squares regres-sion from the last ten years of historical gradeprogression ratios and applying it to ratios overthe ten-year projection period.
8. Computing the slope of the least-squares regres-sion from the most recent five years of historicalgrade progression ratios and applying it to theratios used over the first five years of the pro-jection, then holding the ratios constant.
9. Computing the slope of the least-squares regres-sion from the most recent three years of histor-ical grade progression ratios and applying it tothe ratios during the first three years of the pro-jection, then holding the ratios constant.
The Demographic Research Unit of the Departmentof Finance utilizes the following methodology forprojecting enrollment from kindergarten throughtwelfth grade, including high school graduates:
Actual or projected births in a given year are lag-ged by six years to calculate a birth to first gradeprogression ratio, which controls for anticipatedmortality and migration. This calculation gener-ates the entering first grade class for one year of theprojection series. Projected enrollment in the sec-ond grade is computed by multiplying the selectedfirst to second grade progression ratio to the pro-jected first grade enrollment for the preceding yearto derive second grade enrollment. The same pro-cedure is followed for all grade levels in the projec-tion series.
An 9entical approach is utilized to calculate highschool graduates as is used to project graded enroll-ments. Graduates are projected by multiplying en-rollment in the twelfth grade by the most appro-priate ratio of graduates to twelfth graders in thesame academic year. Projected kindergarten enroll-ments are derived by taking projected first gradeenrollment for a given year and dividing by anappropriate kindergarten to first grade progressionratio.
Appendix G: Community Collegeenrollment projections for capital outlaypurposes conducted by the DemographicResearch Unit
The enrollment projection model currently used bythe California Department of Finance DemographicResearch Unit to project fall enrollment for theCalifornia Community Colleges is an age/sex par-ticipation rate model which utilizes historical andprojected county populations by age and sex andcommunity college enrollment data by age, sex, andenrollment category. The population base for eachcommunity college district is the county or countiesin which it is geographically located, minus anypopulation present in military barracks or State in-stitutions and full-time students in local four-yearcolleges. Population figures come from the baseline1983 Population Projection Series of the Demo-graphic Research Unit. Enrollment data are ex-tracted from the 'Fall CCAF-130 report submitted bythe community college districts to the CaliforniaCommunity Colleges' Chancellor's Office. Ten yearsof historical data are available for the currentprojection.
For each district, enrollment is divided into the fol-lowing categories:
1. Full-tim e day (credit)2. Part-time day (credit)3. Full-time evening (credit)4. Part-time evening (credit)5. Non-Credit
For each historical year, the five enrollment cate-gorLs are divided into age groupings and related toa similar, though net always exact, population agedistribution. The enrollment and correspondingpopulation age groups by sex used are:
Enrollment Population.
19 and under 18-1920-24 20-2425-29 25-2930-34 30-3435 and over 35-64
Each comparison between the enrollment and popu-lation age group is expressed as a participation rateper 1,000 persons in the population age grouping formales and females. The participation rates forage/sex enrollment categories are extrapolated for10 years using statistical techniques such as regres-
I;
53

sion analysis. Where recont trends appear to bedeparting from long-term trends, or if the regres-sion line is not a statistically reliable predictor,then greater weight is given to recent participationrates and enrollment trends.
There are five basic models used to project partici-pation rates (with capability of adding additionalmodels). These computer-assisted models result infive different projection lines. Several models areneeded to project participation rates because of thewide variation in types of historical curves found. Ifnone of the graphed models seems appropriate it ispossible to develop a curve from the available dataor hold any participation rate constant. Recenttechniques include the capability to set the begin-ning level for the projection curve, to leave out anyyear's data which seem spurious, and to have anumber of options for extrapolating from an endingpoint in the projection curve. Attached is a list ofavailable models.
Selection of which projection line to use is subjectivewith the analysts who use their expertise andknowledge of each district to select what seems to bethe most appropriate model. In each year the se-lected participation rates are applied to the appro-priate projected county population population age-sex category to produce an expected number for thatenrollment category and age/sex group. Thesecategories and age groups are then summed for eachyear to arrive at projected total enrollment.
Enrollment figures are one part of each projection,the other being Weekly Student Contact Hours(wSCH). These hours are project( :Jr the summedenrollment categories of total day, total evening,and non-credit. Hours per student are calculated ineach of the three categories for the historical yearsand are trended forward for the 10 projected years.The WSCH/enrollment ratio for day students isvaried, as the ratio of full-time day to total day stu-dents varies in the projections.
Weekly Student Contact Hour counts are takenfrom the annual CCAF-320 report submitted by thedistricts to the California Community College Chan-cellor's Office.
Model choices for community collegecapital outlay enrollment projections
0: Least squares regression line determined by the
54
historical participation rates. Starts at intercept forthe projection.
4: Least squares regression line. Starts at tag his-torical participation rate. The slope of the leastsquares line is added to the last historical year'sparticipation rate to derive the participation ratefor the first year of the projection. The participationrate for the second year of the projection iscalculated by adding the value of the slope to theprevious year's participation rate. Subsequent pro-jected participation rates are derived in the samemanner.
1: Modified least squares regression line. Starts atlast historical participation rate. The participationrate for each projected year is calculated by mul-tiplying the slope of the least squares line by a giv-en value and adding that product to the participa-tion rate of the previous year. The multipliers are:
1st year of projection
2nd
3rd4th5th6th7th8th9th10th
.8
.65
.6
.55
.5
.25
.125
.0625
.03125
.015625
2: Modified least squares regression line. Starts atlast historical participation rate. The participationrates for the projected years are derived accordingto the same principle described in model 1. Themultipliers for this model are:
1st year of projection .4
2nd .35
3rd .3
4th .25
5th .2
6th .15
7th .1
8th .05
9th and 1.0th 0
9: The value of the participation rate for the lasthistorical year is kept constant for the 10 pojectedyears. The value of the participation rate can be

changed to any other value if analysis deems it nec-essary.
A Average of model 1 and 4B Average of model 2 and 4C Average of model 9 and 4
Average of model 1 and 2E Average of model 1 and 9
Average of model 2 and 9
8: This model allows input of starting and endingparticipation rates for projected years. Severalcurves describe the yearly change in participationrate from the starting to the ending year of theprojection. The difference between the starting andpnding participation rate is calculated. For eachyear of the pro,!ection this difference is multiplied bya given value and the product is added to the start-ing participation rate. The multipliers are differentfor each curve. The curve represents the differentassumptions underlying the change in participationrate from start to end of the projection. The startingrate of the projection is the last historical year'sparticipation rate.
The ten available curves are shown below.
POIMERIMINIIIMINIIIIMIA.
Appendix H: Estimates of CommunityCollege District Demographic Factors andAnnual Percent Change in Adult Population
The Department of Finance has been authorized toestimate the adult population and the annual per-
cent change in adult population for all 71 CaliforniaCommunity College districts. Within the Depart-ment, the Demographic Research Unit annually es-timates allowable statewide Average Daily Atten-dance (ADA) growth for budgeting purposes by con-ducting a statutorily defined estimate of percentagechange in the statewide adult population. Thesepercentages are used in a formula that calculatesthe amount of ADA growth that the State will fund.ADA is an accounting unit to measure hours of in-struction. ADA in the community colleges is mea-sured by applying the statutory formula in which478 hours of "seat time" (actual class attendancetime) equals one ADA. The 478 hour figure is de-rived by taking 525 hours (a figure equal to one stu-dent taking a full class load for one year) and multi-plying it by an "absence factor" of .911, or the per-centage of students who are generally absent eachday. This authorization was enacted by Senate Bill1641.
Section 2228(1)(a) of the Revenue and TaxationCode requires that the Department mail to Cali-fornia Community Colleges the estimated percentchanges by May 15 of each year. By January 1, theestimates of the percent change in adult populationare calculated for the current and preceding year.The estimates of adult population for the currentyear are referred to as "Demographic Factors." Theyare mailed shortly after the percent-change report.The adult population is defined as those over theage of 18 years, excluding populations in the mil-itary, California Youth Authority, Department ofCorrections, and full-time students attending four-
Curvea c d e f ..1...
.50 .25 .50 .352 .253 .0 .0 .0 .0 .0
.60 .40 .60 .422 .333 .275 .400 .355 .175 .111
.70 .55 .65 .494 .416 .363 .488 .505 .278 .222
.80 .70 .70 .566 .499 .451 .576 .630 .381 .333
.85 .825 .75 .638 .582 .539 .664 .730 .484 .445
.90 .90 .80 .71 .665 .627 .752 .805 .578 .556
.95 1.0 .85 .782 .748 .751 .928 .855 .690 .6671.0 1.0 .90 .854 .831 .803 1.0 .905 .793 .7781.0 1.0 .95 .926 .914 .891 1.0 .955 .896 .8891.0 1.0 1.0 1.0 1.0 1.0 1.0 1.0 1.0 1.0
55

year institutions that have 3,000 or more total stu-dents.
The Demographic Research Unit controls their ownestimates of adult population to those from the De-partment's "E-1" estimates of total population forJanuary 1 of the current and preceding years.These are adjusted by subtracting the under-18 pop-ulation. The Unit analyzes school enrollment dataand the Department's Baseline 1986 populationproportions to make estimates of those under-18population, and subtract it from the "E-1" esti-mates. The resulting adult population is further ad-justed at the community college district level to sub-tract the legislated population exclusions. Becausecommunity college district boundaries are not co-terminous with county boundaries in most in-stances, the Unit distributes the estimated adultpopulation for counties to community college dis-tricts. To determine what proportion of a county'spopulation goes to which district, the Unit looks atfive indicators by county:
I. Registered uoters by community college districts:By February, the first indicator the Unit receiveseach year is the number of registered voters by com-munity college districts as of January 1. It is ob-tained through a survey. The Unit does not receivedata on registered voters below the community col-lege districts level. The fqur remaining indicatorscontain data by zip code, which is then aggregatedinto community college districts for each county.The Unit uses the community college to zip code cor-respondence file to accomplish this information thatis updated annually.
2. Residential postal drops: By March, the next in-dicator the Unit receives is the number of residen-tial postal drops for each zip code as of January 1.This data is also obtained by survey.
3. Driver's licenses issusd by the Department of Mo.tor Vehicles: By the end of March, the remainingthree indicators are usually received. The Depart-ment of Motor Vehicles provides the Unit with atape listing the total cumulative number of drivers'licenses issued aP January 1.
4 and 5. State and federal income taxpayers: TheUnit receives the last two indicators from State and
56
federal taxpayers in tape form. These data are forthe previous tax year. For example, since taxpayersfiled 1986 taxes in 1987, the Unit uses it as an indi-cator for the 1987 proportions. The Unit will nothave tax indicator data for 1988 until the next cy-cle. For all of the other indicators, the Unit has1988 data already. There is a year's lag for the tv.c.htax data. Therefore, the Unit moves trend propor-tions forward to produce a 1988 indicator; Due tothe fact that taxpayer data are actual for only one ofthe two years, emphasis in analysis of county pro-portions is given to th other three indicators.
The Unit has data for all of the indicators back to1977, except for the Department of Motor Vehiclewhich goes back to 1978. The Unit also has the 18-and-over population total as of th- 1980 Census byzip code. The Unit was able to de,re lop 1980 Censusproportions of community college districts by coun-ty, by aggregating these data with the zip code tocommunity college district correspondence file andwith the community college district to K-12 schooldistrict correspondence file. The census-based pro-portions are of help ti.) the Unit in evaluating indi-cators' proportions. Each indicator is not a true re-flection of a community college district's adult popu-lation proprtions. For example, one communitycollege district may have fewer of its populationregistered as voters than another community col-lege district. Its proportion of registered voters willtherefore be smaller than its proportion of the coun-ty's adult population. The 1980 Census proportionshelp the Unit determine the indicators' bias as of1980, although, of course, this bias can change overtime. For example, continuing with voter registra-tion, a voter registration drive or purge could affectthe indicator's proportions and its bias. This is whythe Unit feels more comfortable using more indica-tors than just one, hoping that influences other thanpopulation which may alter proportions over timewill tend to balance out. The Unit also evaluateseach indicator by graphing them over several yearsto see where sudden changes in proportions occur.The Unit then evaluates deviations that are not ap-parent in the other indicators and are probably at-tributable to something other than populationchange.
6 tr)

Appendik 1: California State Universityenrollment projection methodology forsetting campus enrollment allocations
The California State University relies upon one setof officially adopted enrollment projections, knownas "enrollment allocations," for academic planningpurposes and as the basis for its annual support andcapital outlay budget requests.
Initial State University enrollment projections areprepared in late spring by the Dez iographic Re-search Unit of the Department of Finance, based onpopulation projections and projected participationrates. The Division of Analytic Studiea in the Officeof the Chancellor also makes sycfrm enrollmentprojections covering the same time period, based onthe same population projections but using participa-tion rates and student continuation rates. TheChancellor's projections are made in early winterbased on fall enrollment data. The projections aresimilar but not identical. The projections made bythe Office of the Chancellor were initially under-taken during a period in the early 1980s when theState University's actual enrollments exceeded theDepartment of Finance's projections.
The computer model used to generate the State Uni-versity's projections was developed by the Divisionof Analytic Studies and is known as the "CaliforniaHigher Education Enrollment Projection" model(CHEEP). Projections of undergraduate enrollmentsare made by the model based upon:
1. Projections of the State's population by age andgender as provided by the Demographic Re-search Unit.
2. A set of participation rates for first-time stu-dents stratified by age, sex, and ent.,,,.ring status(first-time freshman or undergraduate transfer).
3. A set of continuation rates that represent theprwortion of undergraduate enrollments thatcontinue to attend in the following year. Thesecontinuation rates are also stratified by age andsex.
4. The California Higher Education EnrollmentProjection model uses fall data to project fall
headcount enrollment. It then converts head-count to fall fuli-time-equivalent enrollment us-ing student workload factors. Fall full-time-equivalent enrollment is then converted to aca-demic year full-time-equivalent based on fall toacademic year experience.
The student data used in the model are based on fallterm census reports from 1980 to the present. Thedata source is the State Un:Versity's EnrollmentReporting System (ERs).
The population projections prepared by the Tlemo-graphic Research Unit are age and sex specific.Groups are projected for each year of age for ages 17through 24 and then in five-year increments forages 25 plus, e.g., 25-29,30-34, etc.
Historic participation rates are calculated in theCalifornia Higher Education Enrollment Projectionmodel by dividing reported age and gender specificenrollment totals (first-time freshman, under-graduate transfers) by the State population esti-mates for the same age and gender categories. Con-tinuation rates are calculated by taking the ratio ofone year's continuing students to the total enroll-ments of the previous year. Thus the model projectsa given year's undergraduate enrollment by apply-ing participation rates to the pepulation estimatefor the year to obtain projected new students (firsttime freshman and undergraduate transfers). Con-tinuation rates are applied to last year's total en-rollment to obtain continuing undergraduates. To-tal undergraduate enrollment for the given year isthe sum of new students and continuing students.
The model allows the calculation and use of alter-native participation and continuation rates, studentworkload factors and Fall to academic year ratios.Recent experience and professional judgment arethe primal y basis for determining the particular pa-rameters used.
Projections of post-baccalaureate and graduate en-rollments are made in the model using the sametechnique as for undergraduates except there is noneed to project a transfer student sub-group. Thetotal enrollment projection is the sum of undergrad-uate and post-baccalaureate/graduate enrollments.
7o
57
Cost Estimates and Simulations2 for Capital Outlay Planning
Scope and issues of the paper
This paper describes the methodological approachesand assumptions used by the Commission and Cali-fornia's three public segments of higher educationto estimate the capital outlay costs associated withaccommodating enrollment growth to the year2005. The data presented in this document havebeen provided by the segments themselves and re-present their best preliminary costing analysis ofhow much construction of new campuses will costthe State.
In order to verify the segments' estimates, the Com-mission staff developed its own model to simulatecapital costs for the University of California and theCalifornia State University. The staff has not beenable to apply this model, which is based upon his-torical budget data, to the California CommunityColleges because of the accounting and reportingdifferences among college districts prior to 1977. Inspite of the different methodological approachesused by the segments to generate their own capitaloutlay cost estimates, the Commission staffs modelproduced results that are relatively close to those ofthe University and State University. Both ap-proaches those of the segments and the Commis-sion -- are considered reasonable, and the similari-ties in outcome between them lends some degree ofconfidence among all parties as to the reliability ofthe projections.
The Commission staff has consulted extensivelywith the segments in Lallecting data for this paperand is committed to continuing discussions with thesegments as new and better data become available.It recognizes, however, that the cost estimates con-tained herein are not only changeable but likely tochange, and, as a result, caution should be takenwhen using them.
It is not the intention of the Commission to forceuniformity with regard to the methods and assump-tions used by the segments, but it is the role and re-sponsibility of the Commission to identify policy
questions raised by wide variations between thesegments and to determine whether or not thesevariations are justified on the basis of segmentaldifferences in mission, academic program offerings,level of instruction, or other factors. This paperraises three important questions of comparabilitybetween the segments' assumptions that warrantfurther discussion -- questions involving (1) the"useful life" of buildings, (2) recommended spaceand utilization standards, and (3) differences amongthe segments in their ability to fund capital outlayprojects.
1. Useful life of buildings
The segments apply substantially different assump-tions about the useful life of buildings after theirconstruction. "Useful life" is defined as the periodof time over which investment in renovation is cal-culated to equal the initial cost of the building. TheCalifornia State University and California Commu-nity Colleges both assume that their facilities willhave useful life cycles of 50 years, whereas the Uni-versity of California assumes that its facilities willhave a useful life cycle of only 30 years. It may bethat these differences in the segments' assumptionsare justified, but until this is demonstrated, the dif-ference is an issue that warrants further attentionbefore the State moves forward in providing capitaloutlay financing for the segments' expansion plans.
2. Recommended space and utilization standards
The second issue is the implementation of the Com-mission's recently recommended space and utiliza-tion standards (1990). It is expected that this imple-mentation will involve at least three steps:
First, discussions will continue among the Legis-!ature, the executive branch, the segments, andthe Commission in an effort to obtain govern-ment authorization to implement the standards;
Second, assuming that such authorization is ob-
'759
tained, discussions will continue between Com-mission staff and segmental representatives as tothe mechanics of implementing the new stan-dards in the capital outlay planning process; and
Third and finally, efforts will need to be taken toensure that these standards are fully integratedinto the long-range planning processes of the seg-ments and the Commission.
3. Funding capital outlay projects
The third issue deals with the differentials ability ofthe segments to fund capital outlay projects off-budget. In this arena, the University of Californiahas the advantage of having greater access to sour-ces of off-budget funding than the State Universityand the community colleges. This difference is re-flected in the capital outlay planning assumptionsof the segments. For example, the University's as-sumptions for financing auxiliary enterprisesthrough major sources of off-budget funds enable itto plan to provide on-campus housing for 40 percentof its total enrollment and rental housing for 10 per-cent of its newly hired facr'N whereas the othertwo segments do not operate on these assumptions,in some cases because of differential missions.
=111111101111111111111MM/11
California Community Colleges
The California Community Colleges anticipatemeeting their capacity needs by expanding and re-modeling existing campuses, extending outreachactivities, and developing new techniques for thedelivery of instruction and support services. TheChancellor's Office has developed a simulation model-- the Community College Long-Range Capital Out-lay Planning Model -- using microcomputer spread-sheet technology that compares existing facilities toprojections of future enrollments and estimatesneeds in capital outlay to the year 2005.
The California Community Colleges' Long-RangeCapital Outlay Plan (Attachment A. pages 79-92below) was presented to the Board of Governors inSeptember 1989. That report provides the findingsof the initial run of the new model. Since Septem-ber, the Chancellor's Office staff has updated themodel and elaborated on it further, and a copy ofthat revision appears in Attachment B on pages 93-98. When the model is fully operational, it will ex-
60
amine the community colleges' long-term capitaloutlay needs by district and region as well as state-wide.
Estimates for construction of new facilities
According to the Chancellor's Office (McIntyre,1989), a new campus would cost an estimated $25milli a for acquisition and development of an aver-age site and $5,400 per headcount student to buildneeded facilities.
Estimates for site acquisition and developmentcosts were derived from model results for the firstten new campuses projected. Using Planning RuleP, (page 92 below), the model estimated an averageof $24 million to acquire and develop each site. Up-dating to the current ENR construction cost index,the estimate becomes $25 million per campus.
In 1988, California community colleges enrolliaimillion studei.ta in 31 million assignablefeet (Au) of instructional ar.' supporting facilities:23.8 ASF/Enrollment. For the same year, facilitiescosts (Engineering News Record (ENM= 4665) wereestimated at $218/AEF or $5,200/Enrollment. Ad-justing for the current ENR (4828) results in an esti-mated capital outlay cost per headcount student of$5,400.
Thus, for 8,000 ADA or 14,000 headcount students,the estimated size of a new campus, the estimatedcost is $25 million plus $75.6 million (14,000 x$5,400), for a total of $100.6 million.
Start-up costs for new off-campus centers
Estimated capital outlay costs for off-campus cen-ters are based on the current average cost and ca.pacity figures of the four recently funded education-al centers listed on Display 1 on page 61. The crite-ria for establishing a new campus are based on thecurrent workload at existing campuses, reasonablecommuting time, and the amount of instruction tobe offered at outreach sites.
Capital outlay estimates for transitionof off-campus centers into new campuses
According to the model, the California CommunityColleges propose a new campus or an expansion ofan off-campus center into a full-service campuswhen (1) the average size of existing campuses in a
7

DISPLAY 1 Capital Outlay Costs for NewEducation Centers,California CommunityColleges
CurrentCost
gLn r E_(_11_11,4665
Riverside CommunityCollege District
Norco $17,704,000 38,000 1,243 FTE
Moreno Valley $15,079,000 39,055 1,203 FTE
Mt. San JacintoCommunity CollegeDistrict
West Center $ 7,193,000 30,080 1,090 FTE
Yuba CommunityCollege District:
Woodland $ 5.092.000 18.012 7131TE
Total $45,068,000 125,147 4,249 FTE
Cost/FTE = $10,607
Cost/ASF w $360
Costa are for working drawings, construction and equipmentof new facilities including site development costs. Landacquisition, which varies from $35,000 to $400,000 per acre isnot included.
Source: Chancellor's Office, California Community Colleges.
district exceeds 750 weekly student contact hours(Mai) per acre, and (2) the service areas of existingcampuses in a district exceeds:
Size of Service AreaMN) of Service Area (in Square Miles)
Urban 100Suburban 500Rural 1,000
The first criterion represents a 25 percent increasein the existing utilization of campus sites. Curr3nt-ly, the average enrollment for a Califoinia commu-nity college is 11,000 students on 150 acres -- ap-proximately 600 mai per acre. Depending on thecampus's acreage and facilities capability, more orless students would be accommodated. Other con-siderations may be considered more important indeciding expanei,,,, such as the regional location ofprograms, service urea topography, and character of
existing facilities. It should be noted that the pro-jected new campuses are based on an average size of8,000 headcount enrollment by the year 2000.
The second criterion is based on reasonable com-muting time. It is assumed that =muting timeshould not exceed more than 30 minutes, that is, 25minutes for trave;ing to ana from earnpus and 5minutes for finding parking space. "This assump-tion is then applied against expected average com-muting speeds in different areas (15 mph urban, 30mph suburban, 45 mph rura!) to derive the approxi-mate mile radius and square.mile area to be servedby each campus" (Attachment B, page 95 below).
How large a community college campus grows de-pends upon its enrollment, acreage, topography,size of service area, and a number of other factorsthat are unique to local situations The cost esti-mates for build-out of an off-campus center arebased on historical experiences.
With capital outlay costs running into the billionsof dollars, it is sometimes difficult to digest thesefigures in a meaningful way. Hence, to capture along-term perspective of what the capital outlaycosts would be per student, we need to account forthe total number of students that will be served overthe useful life of the facilities under consideration.For this exercise, even though a 50-year life cycle isassumed by the California Community Colleges, a30-year useful life cycle is used here to make costcomparisons comparable with the four-year seg-ments. Display 2 on the next page demonstrates thetotal number of students served in a 30-year periodafter opening date.
A summary estimate of costs for community col-leges capital outlay between now and the year 2005derived from their planning model. The total costfor expanding existing campuses is $1,681,862,699,and the cost for building the 23 future new cam-puses that are necessary to accommodate growth is$953,03,882 -- or $155,009,790 a year (Display 3.)
Assumptions and methodoG.,gy
The California Community Colleges planning rulesand assumptions are ortlined in Display 4 on pages63-64.
7")61

DISPLAY 2 Capital Outlay Cost Estimates for Construction of New Off-Campus Centers and Built-out Campuses of California Community Colleges, in 1988 Dollars
Cost perTotal ADA Served Coot per Campus aldent
New Off -Campus Center (Two Years of Operation)* 17,250 $ 12,198,050 $707
Mature Campus (30 Years After Establishment) 137,250 $100,600,000 $733
Community Colleges' start-up estimates exclude land acquisition costs that varies from $0 to $400,000 per acre.
Source: California Posteecendery Education Commission.
DISPLAY 3 Capital Outlay Cost Estimates,California Community Colleges, 1988 to 2005
Existing122Eigil Characteristic Campuses
1988 Number of campuses 107
Enrollment 1,333,191
Total Assigned Square Feet 31,145,732
NewCampuses Total
0 107
0 1,333,191
0 31,145,732
2005 Number of campuses 107 23 130
Enrollment* 1,756,776 120,232 1,877,008
Total Assigned Square Feet 36,263,824 2,861,522 39,125,346
Seven-Year Number of campuses 0 23 23Change
Enrollment 423,585 120,232 543,817
Total Assigned Square Feet 5,118,092 2,861,522 7,979,614
CostEstimates
Total
Total per Year
Acquire/Develop Sites $0 $306,600,000 $306,600,000
Construct and Equip 1,681,862.699 641,10.,882 aximmi$1,681,862,699 $953,303,882 $2,635,166,581
$155,009,790
This "alternative" enrollment projection was prepared in Aqiust 1989 by the Chancellor's Office of the Community Colleges and isbased on each district returning to its "more normal" participation rate (enrollme..t divided by population) that existed prior to the"abnormal" budget cuts and fee increases that occurred between 1982 and 1984.
Source: Chancellor's Office, California Community Colleges.
62'7 '

DISPLAY 4 Planning Rules and Assumptions, CommPlanning Model
A. The future balance of district lecture and labo-ratory weekly student contact hours (Mai) isbased on the district's 1989 experience as de-rived from its Five-Year Facilities Plan.
B. The district's recent ratio of wSCH/full-timevquivalent instructional staff; i.e., staffing prac-dce will remain constant over time.
C. The district's existing ratio of off-campus to on-campus WSCH is used to derive the future needfor off-campus space.
D. The existing statewide ratio of non-capacity tocapacity space (.33) is used to derive a district'sfuture need for non-capacity space.
E. The ratio of available or funded ASP to neededASF must drop below:
Sone Type
Lecture OfficeLab avtraibrarv Non-Capacity District TYPO
.96 .92 .88 Multi-Campus
.92 .8f .84 Single Campus
before more such space is built; but, when built,the "facility" or space increment is sized to thecapacity needed (according to standards) twoyears beyond the time the space is to be occu-pied.
F. The following cost schedule is used:
Proiect Tyne
Lecture
Laboratory
Office
Av/Tv/Librar y
Non-Capacity
H.
I.
Total Cost forLC& juk_El
$173
250 J.
190
225
217
District costs are adjusted further by the "con-struction multiplier" to reflect the variationacross areas of the State.
G. Three years are required, on the average, to pre-pare working drawings (W), and to construct (C)and equip (E) a facility. Under this schedule,
unity College Long-Range Capital Outlay
the project appropriations are spread in the fol-lowing way:
Year 1: 8% of total cost Working DrawingsYear 2: 76% ConstructYear 3: 16% Equip
The facility is occupied and its capacity added tothe district's total capacity in Year 4 (the yearafter this kind of space dropped to less than thatneeded, see planning Rule E). To avoid illegalprojects ( <$150,000) or scale diseconomies, noless than 1,000 ASF of any kind of space will bebuilt at any one time.
It will be possible to maintain existing ratio ofleased and rented: free/owned spaces that areutilized off campus.
Needs for new space will be met by remodelingone or more of the other four types of space if thehave/need ratio(s) of such space(s) exceed(s):
District with Enrollment Per campus
1.5 for multi-college <5,000
1.4 multi-college > 5,000
1.4 single-college <5,000
1.3 single-college > 5,000
in the target year (two years beyond occupancyof remodeled facility; but, in any case, remodel-ing shall not reduce remodeled categories to ca-pacity/need ratios of less than 1.1). (As of Au-gust 1989, this rule is not in the model).
General remodeling (CR) needs due to function-al or programmatic obsolescence (as opposed tomaintenance) is derived by the following vari-ation of the Sherman Dergis (1981) formula:
GR = (a) (2/3 rpv) (age/1275)
where
a = the fraction (say, 1/4) of buildings' ASFexpected to become functionally or pro-grammatically obsolete during theirlifetimes,
75
(continued)
.111.11=
63

DISPLAY 4, continued
rpv = 1988-89 replacement value of buildings($164/AW),
2/3 = proportion of buildings (outside of fou n-dation, outside wails, etc.) needing ie.modeling; and
1275= assumption of 50-year building life.
K. Operating budget expenditures for buildingmaintenance in 1988-89 are expected to contin-ue at that level.
L. New maintenance needs (M) are based on theSherman-Dergis (1981) formula:
M = (2/3) (rpv) ( (age) / (1275) ]
This assumes (a) an average life of 50 years forbuildings, (b) that 2/3 of any building will needmaintenance, and (c) the 1988-89 replacementvalue for buildings.
M. One-fifth of existing deferred maintenance iseliminated each year and, to be funded, mustexceed $10,000 in any given year.
N. New campuses (or centers that may becomecampuses) are proposed when (a) the averagesize of existing college(s) exceeds 600 WECii/acreand (b) the district service area exceeds:
Type ofService Area
UrbanSuburbanRural
Size of Service Areain Souare Miles)
100500
1,000
The acreage tor a new campus site is assumed tobe 120 acres.
0. New centers are proposed when . . (criteria tobe developed at a later date).
P. Costs to acquire and develop new sites varyacross the State. The following schedule is used:
Acquire Sitef$/acre)
Develop SitetVacre)
Urban $500,000 $40,000Suburban 250,000 40,000Rural 25,000 40,000
Source: ChancelloA Office, Callfornia Community Colleges.
64
The California State University
In estimating likely capital outlay costs associatedwith growth, the California State University hassed average (historical) capital outlay costs on a
per full-time-equivalent basis to project future con-struction costs. It assumes a 50-year life cycle forits buildings and a 2 percent annual renovation ex-penses calculated on total capital stock.
The State University has developed three differentcapital outlay cost estimates for different stages ofgrowth:
The first is a cost per/FTE for construction of anew off-campus center built as a new permanentfacility.
The second is for expanding an existing campusto accommodate additional growth.
The third is for transition of an off-campus centerinto an entirely new campus.
1. S::.'.imated start-up costs for constructingnew permanent off-campus centers
The capital costs for a new permanent facility for anoff-campus center were estimated fr t the capitaloutlay costs associated with the Contra Costa Off-Campus Center as shown in Display 5 on the oppo-site page. The capital outlay costs for this newpermanent off-campus center was estimated at$27,920,000 for 1,500 FTE, or about $18,613 per FTE.
Estimating the costs associated with the State Uni-versity's growth plan were based upon the assump-tion that three off-campus centers with 4,500 totalFTE will be established and will be housed in perma-nent state-owned facilities by 2005-06. The othercenters will continue to be housed in leased-/borrowed facilities. Utilizing the Contra Costa cen-ter base cost of $18,613 per rrE, and multiplying itby 4,500 FIT yields a total of cost $83,758,500 overthe 15 years 1991-2005, or an average of $5,583,900per year. Land costs are not included in these esti-mates.
2. Estimated costs for expandingexisting campuses
The enrollment range used to estimate the cost fac.tor per/rrE for expansion of an existing campus is5,000 to 25,000 rrE. The State University has esti-
7 (

DIS'ILAY 5 Capital Outlay Program for the Contra Costa Off-Campus Center of the CaliforniaState University, Hayward, 1989-90
PrpiectStatewidepriority Total Cost
A. Previously Approved
Funded RequiredPrior to 1989/90 After 1989/901989/90 Phase Reql_Leek Phase Completion Phase FTE
Infrastructure I
Initial Facility
Total
B. New
Infrastructure II
Total
Grand Total
OCC 5
OCC 6
OCC 7
$4,361,000
12.353.000
$385,000 PW
611,000 PW
$3,976,000 C
10.777.000 C
$0
965 000 E 1,001
16,714,000
11,206,000
11,206,000
996,000
0
0
14,753,000
602,000 PW
602,000
965,000
10,604,000 C
10 604 000
$27,920,000 $996,000 $15,355,000 $11,569,000
A = Acquisition E = Equipment W = Working Drawings C = Construction P :x Preliminary Plans
Source: Office of the Chancellor, The California State University.
mated that its existing main campuses will have acapacity in the year 2005-06 of 344,100 Fit, com-pared with the projected enrollment capacity ofthese campuses in 19(7-.1-91 that is estimated to bu257,208 rrE -- a growth of 86,892 FTE. This 86,892projected "excess" enrollment demand is expected tobe accommodated by expanding existing campusesover the next 15 years, with growth averaging 5,376FTE per year. The total cost to expand San Marcosfrom 5,000 to 25,000 FTE is estimated at$361,852,000 or $18,093 per FTE ($361,852,000/20,000 FIE). This figure is consistent with esti-mates derived from analysis of historic expansioncosts at existing cl,sti Using thiz, wst esti-mate as the base, the estimated total cost of expand-ing existing campuses to accommodate the projectedrrE growth would be $1,572,137,000 for the 15-yearperiod or, on average, $104,R09,000 a year.
It is estimated that the lead time for a new campusto evolve from an existing off-mpus center wouldbe about three to five years.
3. Estimated costs for the transitionof off-cam?!.a centers into new campuses
The enrollment ral.ge used to estimate the cost fac-tor per rrE for a new State University campus is 0-5,000. The initial capital outlay costs for Cal SanMarcos's historical experience is illustrated in Dis-play 6 on page 66. San Marcos's initial cost is$55,033,000 for planning, site development, infra-structure, building construction, and equipment;plus $8,500,000 for initial library volumes for a to-tal of $63,533,000, in current dollars. This creates anew campus with an enrollment capacity of ap-proximately 2,000 FTE students. The initial start-up cost for the new institution is $31,767 per FTE.An additional $101,334,000 is estimated to be nec-essary to build the new campus to 5,000 FTE stu-dents. Display 7 on page 67 delineates the projectedcost of each capital project per campus size.
The total cost for a campus of 5,000 FTE students is
ft",
65

DISPLAY 6 Capital Outlay Program for the California State University, San Marcos,1989-90
State WideProject Prioritv Total Cost
FundedPrior to1989/90 Phase
1989/90Request Phase
RequiredAfter 1989/90Completion Phase FTE
A. Previously Approved
Infrastructure/Site Development OCC 1
Physical PlantiCorporation Yard OCC 2
Initial Facility OCC 3
Academic Building I OCC 4
Total
B. New Total
Grand Total
$10,193,000
1,693,000
21 ,499,000
21.648,000
$492,000 PW
105,000 PW
869,000 PW
291 000 P
$9,701,000 C
1,485,000 C
18,282,000 C
18 107 000 WC
$0
$103,000 E
2,348,000 E
igloo E5,701,000
$5,701,000
1,811
55,033,000
0
$55,033,000
1,757,000
0
$1,757,000
47,575,000
$47,575,000
C 21 Construction E = Equipment P = Preliminary Plans W = Working Drawings
Source: Office of the Chancellor, The California State University.
$164,867,000 -- or $32,973 per FTE student. Uponexpansion of the institution to 15,000 FTE, the aver-age cost declines to $21,100 per FTE student. Dis-play 8 on page 68 illustrates the capital outlay costestimates for the San Marcos campus on a per FTEbasis by size of campus. It provides a perspective ofhow much of the projected cost is incurred at eachincrement of student enrollment. By multiplyingthe approximate per student cost of $21,068 to the25,000 FTE maximum capacity, the total cost for anew campus is $526,719,000.
66
To accommodate projected enrollment growth, theState University projects an annual capital outlaybudget in 1989 dollars of $154,357,000 for the 15-year period 1990-2005, as shown in Display 9.
To figure the cost per student served by the StateUniversity, the same methodology used for the Cali-fornia Community Colleges was also applied here,with the results shown in Display 10.

DISPLAY 7 Projected Costs, State-Funded Capital Improvement Program, San Marcos Campus,(ENR 4665)
Full-TimeEquivalent Enrollment Capital Project T tal Project Cost
5,000 Academic Buildings 153,940 $ 21,938,000
Lab Buildings 76,700 6,785,000
Library 110,000 13,410,000
Performing Arts 80,000 17,709,000
Physical Education 66,000 8,225,000
Playfields N/A 1,500,000
Physical Plant 12,000 1,432,000
Infrastructure N/A 20.335.000
Total $101,334,000
15,000 Academic Buildings 486,700 69,089,000
Lab Buildings 242,800 52,489,000
Library 90,000 11,019,000
Physical Education 66,000 8,225,000
Playfields N/A 1,500,000
Physical Plant 17,500 1,980,000
Infrastructure N/A 7.316.000
Total $ 151,618,000
25,000 Academic Buildings 536,700 76,241,000
Lab Buildings 320,700 68,509,000
Library 200,000 24,195,000Performing Arts 60,000 14,460,000Theater 50,000 12,089,000
Athletes' Complex 50,000 6,289,000
Public Safety 5,000 950,000
Physical Plant 12,500 1,483,000
Infrasaucture N/A _IMMO()Total $210,234,000
Notes:
1. Additional funds for off-site utility fees may be necessary.
2. Future remodeling projects may be necessary.
3. Capital outlay funds for initial 2000 FIT center are not included.
Source: Office of the Chancellor. The California State University.
6 7

DISPLAY 8 Summary of Projected Costs,State-Funded Capital Improvement Program,California State University, San Marcos(ENR 4665, 1989)
Size ofCampus per rrE
Project Cost(Cumulative)
EstimatedCoot in
Dollars per FTE
2,000 $63,533,000 $31,767
5,000 $164,867,000 $32,973
15,000 $316,485,000 $21,099
25,000 $526,719,000 $21,068
Note: Cost at 2,000 rrz is from the 1989-90 Capital OutlayProgram (Display 6), plus $8,500,000 for library acquisitions.These coat estimates include all facilities projected for the cam-pus. This broad definition of facilities coats goes beyond lec-ture/lab capacity and includes all facilities needs u the cam-pus grows. Thus, the cost per rrz derived above relates the ex-pansion of the entire campus to meet projected FIT growth.
Source: The California State University.
DISPLAY 9 Projected Capital Outlay Needsof the California State University, 1990-2005
New Campuses/Off-CampusCenters $743,220,000
Existing Campuses $1,572,135,000
Total $ 2,315,355,000
Cost Per Year $154,357,000
Source: California Postsecondary Education Commission.
DISPLAY 10 Capital Outlay Cost Estimatesfor Transition from an Off-Campus Center toa Full- Service California State UniversityCampus, in 1988 Dollars
Total FTE Cost per Cost perServed Campus Student
New Campus(Four Yearsof Operation) 5,000 $63,533,000 $12,707
Mature Campus(30 Years AfterEstablishment) 367,500 $526,719,000 $1,433
Source: California Postsecondary Education Commission.
68
University of California
To estimate the costs associated with constructionof new campuses, the University of California esti-mated the likely results of the Commission's studyof space and utilization standards (1990b) to derivethe average assignable square footage (ASF) re-quired per student for different space categories, aswell as the utilization rates required by space type.
Instructional and research space
Instructional and Research Space includes space re-lated to those core programs that are assigned a pro-gram data classification structure code with thenumber 1.0. These programs include biological sci-ences, agricultural sciences, mathematical sciences,engineering sciences, psychology, arts, letters, andforeign languages. A full listing of all the programsclassified under Instructional and Research Spaceare shown in Display 11 on the opposite page. In-structional and Research Space also includes bothstandard and non-standard space. The Irvine cam-pus of the University was used as the benchmarkfor determining the likely discipline distribution ofinstructional and research space for new campuses.The University was able to derive sufficient infor-mation from Irvine's experience to determine thedistribution of assignable square footage for in-structional and research space, by discipline, thatwould be appropriate to apply as the general spaceconfiguration for new campuses. This informationwas then merged with the projected mix of graduateand undergraduate students on new campuses todetermine the estimated assignable square footagerequired for instructional and research space, bydiscipline. The estimated assignable square footageis discussed further in the methodology section ofthis report.
Non-stancktrd space
Non-standard space is any room type that is notsubjected to space utilization standards, e.g., green-houses, eating facilities, student unions, and stor-age areas. To estimate needed non-standard space,the Berkeley campus was used as the base to deriveestimates for academic support, administration,and physical education. These figures reflectBerkeley's 1988 enrollments of 28,524, and no ad-justment has been made to scale space needs in
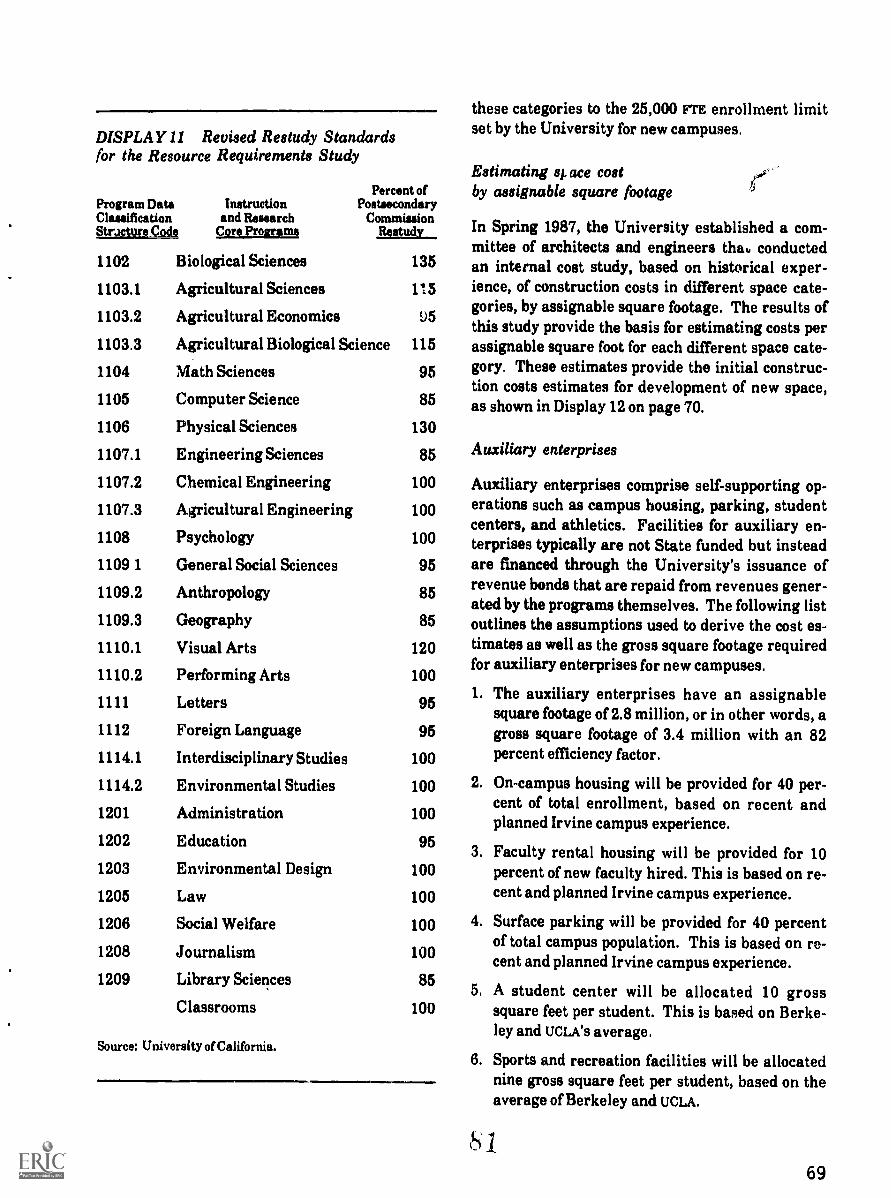
DISPLAY 11 Revised Restudy Standardsfor the Resource Requirements Study
Percent ofProgram Data Instruction PostsecondaryClassification and Research CommissionStracture Code Core Program Restudy
1102 Biological Sciences 135
1103.1 Agricultural Sciences 115
1103.2 Agricultural Economics
1103.3 Agricultural Biological Science 115
1104 Math Sciences 95
1105 Computer Science 85
1106 Physical Sciences 130
1107.1 Engineering Sciences 85
1107.2 Chemical Engineering 100
1107.3 Agricultural Engineering 100
1108 Psychology 100
1109 1 General Social Sciences 95
1109.2 Anthropology 85
1109.3 Geography 85
1110.1 Visual Arts 120
1110.2 Performing Arts 100
1111 Letters 95
1112 Foreign Language 95
1114.1 Interdisciplinary Studies 100
1114.2 Environmental Studies 100
1201 Administration 100
1202 Education 95
1203 Environmental Design 100
1205 Law 100
1206 Social Welfare 100
1208 Journalism 100
1209 Library Sciences 85
Classrooms 100
Source: University of California.
these categories to the 25,000 FTE enrollment limitset by the University for new campuses.
Estimating ace costby assignable square footage
In Spring 1987, the University established a com-mittee of architects and engineers tha, conductedan internal cost study, based on historical exper-ience, of construction costs in different space cate-gories, by assignable square footage. The results ofthis study provide the basis for estimating costs perassignable square foot for each different space cate-gory. These estimates provide the initial construc-tion costs estimates for development of new space,as shown in Display 12 on page 70.
Auxiliary enterprises
Auxiliary enterprises comprise self-supporting op-erations such as campus housing, parking, studentcenters, and athletics. Facilities for auxiliary en-terprises typically are not State funded but insteadare fmanced through the University's issuance ofrevenue bonds that are repaid from revenues gener-ated by the programs themselves. The following listoutlines the assumptions used to derive the cost es-timates as well as the gross square footage requiredfor auxiliary enterprises for new campuses.
1. The auxiliary enterprises have an assignablesquare footage of 2.8 million, or in other words, agross square footage of 3.4 million with an 82percent efficiency factor.
2. On-campus housing will be provided for 40 per-cent of total enrollment, based on recent andplanned Irvine campus experience.
3. Faculty rental housing will be provided for 10percent of new faculty hired. This is based on re-cent and planned Irvine campus experience.
4. Surface parking will be provided for 40 percentof total campus population. This is based on re-cent and planned Irvine campus experience.
5. A student center will be allocated 10 grosssquare feet per student. This is based on Berke-ley and UCLA's average.
6. Sports and recreation facilities will be allocatednine gross square feet per student, based on theaverage of Berkeley and UCLA.
69

DISPLAY 12 Cost Methodology for New Construction, University of CaliforniaBuilding
ConstructionCost/OGSF
EfficiencyFactor
Factorfor Site/Utilities Overhead
EquipmentCost/ASF
PWCECost/ASF
A. Instruction and Research Capacity Space
I. Biological Science $180 .59 8% 20% $50 $445
II. Physical Science 155 .62 8 20 60 384
III. Engineering 140 .62 8 20 60 353
IV. Office Plus 130 .65 8 20 20 279
V. Office 120 .65 8 20 20 259
B. Academic Support Space
Libraries 130 .71 8 20 10 247
Museums, Galleries, Theaters 170 .65 8 20 10 349
Instructional Research Centers,Self- Instructional Labs,Academic Computing 140 .62 8 20 75 368
Vivaria 250 .57 8 20 50 618
Academic Administration 120 .65 8 20 20 259
Greenhouses and Davis Field Buildings 90 .95 8 20 5 128
C. Other Academic Space
Physical Education 110 .70 8 20 8 214
D. Entrepreneurial Research Space
Wet Labs 180 .59 8 20 50 445
Dry Labs 140 .62 8 20 60 353
OffKes 120 .65 8 20 20 259
E. Administrative Support Space
(Including Student Servicesand Administrative Computing) 120 .65 8 20 20 259
F. Public Service Space 120 .65 8 20 20 259
Source: University of California.
7. Other enterprises included are: (a) student ac-tivities, one gross square foot per student; (b)campus food services, one-half gross square footper campus population member, (c) bikeways,$25 per campus population member, and (d)child care, $1 GSF per campus population mem-ber. These are based on size and cost of similarbuildings at existing University campuses.
70
8. Renovation costs will be allocated at $74.50 pergross square footage, including additions, basedon current experience. Surface parking is ex-cluded.
Core campus assumptions used to project the cost ofa new University campus are listed in Display 13 onthe opposite page.
L'1

DISPLAY 13 Core Campus Assumptions
Fcr the six years prior to opening day for the firstundergraduate class and the seven years after, fa-cilities identical to those presented in the materi-als for the October 1988 Regents' presentation.(See Display 14 on pages 72-74.)
Cost factors as used in the October 1988 Regents'presentation. Full funding of operation and main-tenance of plant. (See Display 15 on page 75.)
The total core campus assignable square footage(ASO is 3.6 million or 6 million of gross squarefootage (GsF), with a 60 percent efficiency factor.
Instructional and Research space standards re-vised as used in the October 1988 Regents' presen-tation; revisions were based on experience withrecent projects in anticipation that CPEC's currentstudy will yield results close to that experience.(Display 11 on page 69 recognizes the need for ad-jueitment of the old 1955 Restudy ASF standards tothe new ASF standards related to core programspace.)
UC Irvine's current general campus discipline dis-tribution is used as a base and no health sciencesprograms or hospitals are included.
Organized research space allocation is equal to 15percent of total space (the average amount atpresent predicted for existing campuses).
Other space is in proportion to a mature campus'sspace (Berkeley example):
a. Academic support space equal to 18 percent oftotal space.
b. Administrative space equal to 11 percent of to-tal space.
c. Physical education space equal to 3 percent oftotal space.
Program-related renovation is assigned a 1 per-cent renovation rate annually after the first fiveyears.
Initial autometion equipment needs as estimatedfor the October 1988 Regents' presentation, ad-justed to reflect an enrollment of 25,000.
Equipment automation is assigned a 10 percentrenovation cost, annually, after the first five years.
Source: University of California.
Methoc= 7...gy and assumptiuns
The University of California capital outlay esti-mates are based on general, ci.angeable assump-tions and are the best estimate 9 available now.These estimates are expressed in 1090 dollars.
Several variables will significantly inpact the ulti-mate capital costs for construction of new campuses.These include:
1. The campus's discipline distribution and stu-dent-faculty ratio;
2 The growth rate and the purchases or donationsof acquired facilities;
3. The extent to which the State keeps renovationcosts low by fully funding operation and main-tenance of plant;
4. The need for programmatic renovation, especial-ly in a competitive faculty recruitment environ-ment; and
5. Variation in life cycles of different kinds ofbuildings, changes in code requirements, andunanticipated technological change.
These estimates do not reflect expectations aboutany individual funding source; they are estimates ofneed. However, it is anticipated that constructionof all auxiliary enterprise space will be financedwith external loans and be repaid from revenuesand mandatory student fees (e.g., student centerfee, recreational fee, registration fee).
The University plans to provide faculty for salehousing to 40 percent of the new faculty hired, asassumed in the October 1988 Regents' presentation.However, cost estimates are not provided here be-cause the homes will be financed by private devel-opers (on law leased from the University) and thensold to facul
The University based its methodology on what hasbeen done in the past and what the campuses aredoing in the present. It is not possible at this pre-liminary stage of planning to discern the ultimateaccuracy of its projections since they are related tohistorical experiences. Yet, one cannot necessarilypredict all the costs associated with innovation andways that new campuses will need to innovateand/or renovate to adapt to future changes. For ex-ample, historically the University has mainlyplanned its campuses to exist in pasLoral environ-
7 1

DISPLAY 14 Estimated Annual Capital Costs for a Tenth University of California Campus (NewConstruction Only), in Thousands of Dollars
Year ofOccu- Capitalnano', Project ICA X-7 X-6 X-6 X-4 X-3 X-2 X-1 X X +1 X+2 X+3 X+ 4 X+5 X +6
MuterPlan 750 750 500
X-4 InterimOffice 1
pw CO
382 4,798
X-3 InterimResearch 1
pw c e648 7,452 1,500
X-2 InterimOffice 2
pw CO
191 2,399
X-1 InterimResearch 2
Corp. YardAdmin.SuPport
ComputingFacility
Utilitiesand SiteDevelopment
pw C e316 3,634 500
pw CO
382 4,798
pw CO
234 3,446
500 6,500 500 6,500 250 2,750 250 2,750
X NaturalScience 1(wet lab)
Humanities/SocialScience 1
Library 1(w/10,000)ASF-admin-istrative)
Library andAdminis-trative -Comput-ing Costs
PEFacilities
StudentHealthServices
Classroom 1
111MINMIN01.1111.14
72
p w c e1,383 1,778 36,34') 5,000
P 1 c a418 538 10,994 1,000
p w c e581 747 15,263 700
126 120 570 1,020 1,029 940 940 940 940
pw c e330 3,790 160
pw ce158 2,353
pw CO
414 5,166
(cordinued)

DISPLAY 14 (continued)
Year ofOccu- Capital
X-8 X-7 X-6 X-5 X-4 X-3 X-2 El X X+1 X+2 X+3 X+4 X+ 5 X +6
X +1 Student pw pw ceServices 622 287 3,598
Arts 1 pw C
542 7,148 600
Theater/MuseumGalleries 6,238 200
X +2 Gymnasium
EH&SFacility
pw c
494 5,686 240
pw c130 1,490 300
X +3 Engineer/Physics CS(dry lab)
w c e1,231 1,582 32,347 7,200
X + 4 NaturalScienceAlterations
ORU,Office/Lab
Classroom 2
pw c e643 7,397 2,000
pw c e648 7,462 1,500
pw ce414 5,166
X + 5 AdministrationBuilding
Humanities/SocialScience 2
ComputingFacility/InstructionalDevelopment
p w c418 538 10,994 1,000
pw c414 4,766 400
pw ce234 3,446
a +6 NaturalScience 2
p w c
899 1,155 23,621 3,250
Visual pwArta 2 414 4,766 400
Library 2 p w ce415 533 10,902 500
750 750 1,530 12,250 4,889 16,667 77,486 36,976 14,426 38,376 25,254 27,684 34,955 18,242 500
Notes: This table does not display costa associated with land acquisition.
The costs displayed probably underestimate the full cost of the future campus because:(continued)
L 1:7Cs;)
7 3

DISPLAY 14 (concluded)
(a) The equipment costs reflect the cost of equipping a building on an existing campus. On an existing campus, when thefaculty occupy a new building, they often bring some supplies and equal practice on a new campus, however, new facultywould bring little or no supplies or equipment with them.
(b) We have assumed minimal renovations. In practice, it is likely that the interim building, as well as some of the earlierbuilding, will be renovated in the fir st seven years after opening.
(c) We have estimated the sites und utility development costs using historical experience at Irvine, San Diego and SantaCruz. If the campus is located away from the ocean, then these costs cooling/heating-plant needs.
Estimates are based on UC Irvine's 1987-88 discipline mix, plus an additional research facility per assumptions.
Cost factors used were those developed during 1987 cost estimates, except for library automation and administrative comput-ing (per Dennis Smith and Richard West, respectively).
Estimates assume first permanent buildings will be occupied in year X.
Analysis assumes interim facilities will be constructed in ways that will make them useful for academic and administrativeneeds for 10 to 15 years.
Inflation is assumed to be zero.
Source: Office of the President, University of California
ments. In other words, its buildings are configuredin a "spread out" or garden-like setting. However, ifa new campus needs to be located in a densely con-gested metropolitan area, then the future may dic-tate that the University revise its thinking by ori-entating its building plans of the new campus verti-cally, where space is limited. Estimating costs forthis very drastic change in traditional campus con-figuration cannot be predicated on historical exper-ience, hence requiring innovative planning and dif-ferent cost estimation approaches.
There is some concern over the University's as-sumption that its buildings have a life cycle of only30 years, whereas the State University and thecommunity colleges assume a building life cycle of50 years. This issue warrants further discussionand needs to be resolved as the segments move for-ward with more detailed planning for expansion.
Estimated start-up costsfor construction of new campuses
The University estimates start-up costs for a newcampus to be approximately $209,221,140. This fig-ure assumes an enrollment of 3,520 full-time-equiv-alent students as the initial complement of under-graduates. This results in a start-up cost for the ini-tial facilities of $59,438 per full-time-equivalentstudent. Display 16 on page 76 lists the estimated
74
.//=1,=19.1101.1.01111101,111111111110
capital outlay expenses per cost category to con-struct a new campus. Display 17 provides the as-sumptions applied in the calculations to project thecost of a new campus. The start up costs includes alliiiitial buildings (core campus facilities and auxil-iary enterprises), infrastructure, and automationthat would need to be constructed through the open-ing year. The start up planning and environmentalimpact report (EIR) costs are based on recent exper-ience.
Estimated build-out costsfor construction of a new campus
The total estimated cost for build-out of a new uCcampus is approximately $2.44 billion, assuming anultimate size of 25,000 full-time-equivalent stu-dents and development for six years before openingday and 30 years after. These estimates include ex-penses for projects typically financed with non-statefunds, such as auxiliary enterprises, which amountto $'792 million of total costs. The construction costper full-time-equivalent student is ,ilustrated inDisplay 18 on page 77.
The University's capital outlay cost estimates forbuilding out an existing campus to maximum ca-pacity are represented in Display 19. That displayincludes also includes all start-up costs listed inDisplay 16.

MONSON, 0.41...
DISPLAY 15 Estimated Additional General Fund and Student Fee-Funded Annual OperatingNeeds for a Tenth University of California Campus with 7,000 Students,in 7'housands of Dollars (Opening of the Undergraduate Program WouldOccur in Year X)
Additional Operating Needs X-4 X-3 X-2 X-1 X X +1 X+2 X +3 X+ 4 X+5 X+6 X+7Instruction and Research andInstructional Support Costa $0 $2,145 $2,145 $2,682 $2,690 $3,24 $3,280 $3,188 $3,118 $3,104 $4,152 $4,153
Organized Research 0 0 0 894 894 894 0 0 0 0 0 0
Libraries: Staff 1,592 16 16 16 2,933 282 282 282 368 282 282 452Books and Binding 1,147 0 0 0 1,912 0 0 0 61 0 0 122
Instructional Use of Compters 0 14 14 14 156 169 169 169 169 169 169 169
Merits and Related Benefits 0 97 142 187 251 410 607 604 710 813 916 1,041
Operation and Maintenance of Plant 258 322 129 387 3,596 838 451 1,547 1,095 1,031 1,096 645
Institutional Support 0 595 595 740 745 954 949 922 954 933 1,329 1,335-Subtotal Additional AnnualGeneral Fund Operating Needs 2,997 3,189 3,041 4,920 13,177 6,827 5,638 6,712 6,475 6,332 7,944 7,917
0 72 138 630 1,015 946 946 946 946 946 946 947
0 22 22 22 381 384 384 384 384 384 384 384
0 94 160 652 1,396 1,330 1,330 1,330 1,330 1,330 1,330 1,331
Student Services
Student Aid
Subtotal Student Fee Funded Needs
Total Additional AnnualOperating Needs 2,997 3,283 3,201 5,572 14,573 8,157 6,968 8,042 7,805 7,662 9,274 9,248
Total Budget (including Base) $2,997 $6,280 $9,481 $15,053$29,626$37,783$44,751$52,793$60,598 68,260$77,534$86,782
Notes: Costs reflect current budgetary formulas or current experience to the greatest extent possible. Operation and maintenance ofplant figures are based on new standards. Organized research costs are based on the budget of a similarly sized unit at Bc rke-ley.
Auxiliary enterprises are assumed to self-supporting.
These figures do not include costs for faculty recruitment, which are estimated to be approximatoly $1,000 per FTE, nor dothey include opeeating expenses related to preliminary planning, site selection, land acquisition, environmental inr/act as-sessments, or additional mitigation efforts that may be necessary.
Inflation is assumed to be zero. Faculty and staff salaries are assumed to increase at the level of inflation except for merit.
All costs are expressed in 1988 dollars.
Source: Office of the President, University of California
California PostsecondaryEducation Commission
The Commission's methodological approach to esti-mating the capital outlay costs of construction ofnew University of California and California StateUniversity campuses was based upon historicalcapital outlay data for these segments. The histori-
cal capital outlay data was obtained from the Gov-ernor's Capital Outlay Budgets, using the actualfigures for each respective year with the exceptionof 1988-89 (estimated) and 1989-1990 (proposed).
In consultation with the four-year segments, theCommission selected appropriate sample campusesthat would be generally comparable to likely con-figuration of future campuses. The representative
75

DISPLAY 16 University of CaliforniaStart-Up Costs Estimates (ENR =4828,1990)
Planning/EnvironmentImpact Report
Instruction and Research
Other
Infra:3k Aure and Automation
Auxiliary Enterprises
Total
Source: University of California.
$ 3,193,826
107,877,854
49,298,830
17,125,294
jakaB$209,221,140
DISPLAY 17 University of CaliforniaAssumptions Used in Calculating CostEstimates for New Campuses
No inflation, all estimates in 1990 dollars (ENE4828).
No costs for land or off-site infrastructure,
No assumptions about location, although laborcosts vary considerably from one location to an-other.
An ultimate campus size of 25,000 FrE students.
A student distribution of 20 percent graduate, 80percent undergraduate.
A straight-line growth projection of 850 studentsper year.
Ultimate build-out achieved in 30 years fromopening day.
A 30-year life cycle for all buildings.
113e of the current student-faculty ratio (17.61:1),1,420 faculty.
Use of UC Santa Barbara's current ratio of stu-dents to non-academic staff (3.42:1) because SantaBarbara has no health sciences programs, 7,310staft
(continued)
76
DISPLAY 17 (conanued)
No changes in curl mt code requirements.
No renovation in the first five years; age-relatedrenovation of 4 percent of total ASF annuallythereafter.
Infrastructure renovation costs of 5 percent annu-ally after installation.
Initial infrastructure costs at the average of Ir-vine's, San Diego's, and Santa Cruz's, adjusted byi.;NR tor inflation and increased to reflect an en-rollment capacity of 25,000.
Souxce: University of California.
DISPLAY 18 University of Californic CapitalOutlay Cost Estimates for Construction andBuild-Out of a New Campus (1988 Dollars)
Total FTE$Aap_d
Cost nerQmpue
Cost perStudent
New Campus* 8,800 $209,211,140 ,T23,774
Build-OutCampus" 390,300 $2,445,021,3(.4 $6,264
'11 F our mire after opening.
" Thirty years after opening.
Source: California Postsecondary Education Commission.... .11DISPLAY 19 University of Californt.Build-Out Cost Estimates (BNR =4828, 1990)
Planning/EnvironmentalImpact Report $ 3,193,826
Instruction and Research 833,357,653Other 673,919,242
Infrastructure and Automation 142,157,080
Auxiliary Enterprises 792,393,504
Total $2,445,021,304
Source: University of California.

campuses were selected because they were estab-lished relatively recently, and their size of programofferings, and physical configurations were general-ly reflective of likely campuses that will be built inthe future. The capital outlay budget for each sam-ple campus began with the campus's date of estab-lishment. The data for this analysis included everyproject listed in the capital outlay budget for thesample campuses where monies were appropriated,except for health sciences, agriculture field stations,and other "miscellaneous" items not typical for de-velopment of a campus, such as the San JoaquinFresh Water Marsh. All renovation, alteration, con-version, and modification costs that were listed inthe budget were removed. Oncc these costs were re-moved, each segments' renovation and infrastruc-ture assumptions were incorporated and applied tothe projects included in the sample campuses' capi-tal outlay profile to obtain the total cost estimate ofbuilding a new campus.
For the University of California, a renovation costfactor of 5 percent was applied a year after installa-tion of the infrastructure and then added annuallythereafter. Instruction and research facilities andauxiliary enterprises were assumed to have a 4 per-cent renovation cost annually from the first fiveyears after installation. The same procedure wasapplied for the California State University, exceptthat a renovation cost of 2 percent was applied forall capital stock beginning the year after installa-tion.
Once the base capital outlay costs were adjustedwith the appropriate renovation assumptions, aninflation factor was applied to the total sum of capi-tal outlay expenditures to bring all expendituresinto 1989 dollars. The inflation factors were pro-vided by the State Department of Finance.
The methodologies utilized by the segments weredriven largely by projecting likely future capitaloutlay costs from current costs, whereas that usedby the Commission involved calculating historiccosts and adjusting them into current dollars. De-spite the difference in methodology, the segments'and Commission's estimates are relatively close,lending a degree of confidence among all partiesabout the general reliability of the projections.
As noted earlier, the Commission has been unableto apply its own costing model to community collegecapital outlay construction because of accountingand reporting differences among community collegedistricts prior to 1977 that made financial compari-sons among appropriate community college cam-puses infeasible. Nonetheless, extensive review byCommission staff of the Chancellor's Office cost es-timates has convinced the Commission that thosepreliminary estimates are reasonable and appropri-ate for the purposes of this statewide planning pro-ject. The results of the Commission's capital outlaystudy, compared to the estimates of the segments,are shown in Display 20 on page 78.
References
California Postsecondary Education Commission. ACapacity for Learning: Revising Space and Utiliza-tion Standards for California Public Higher Educa-tion. Commission Report 90-3. Sacramento: TheCommission, January 1990.
McIntyre, Charles. R&A Memo No. 89-73 to KirkKnutsen, December 27, 1989..
77

DISPLAY 20 Capital Outlay Cost Estimates for Construction of New Campuses in Each ofCalifornia's Public Segments of Higher Education, in 1988 Dollars
University of California
Size of Campus(maul* Cost per Campus
Start-Up (New Campus) 3,520 $209,221,140
Total Cost at Build-Out (UC estimate) 25,000 $2,445,021,304
Total Cost at Build-Out (CPEC estimate) 25,000 $2,329,192,860
The California State University
Start-Up (Off-Campus Center) 2,000 $63,533,000
Total Cost at Build-Out (Csu estimate) 25,000 $526,719,000
Total Cost at Build-Out (CPEC estimate) 25,000 $597,827,598
California Community Colleges
Start-Up (Off-Campus Center)** 1,150 $12,198,050
Total Cost at Build-Out 8,000 $100,600,000
Average daily attendance (ADA) is used for the community colleges, full-time-equivalent enrollment Wm) for the University andthe State University.
** Community colleges start-up estimates exclude land acquisition costa which varies from $O to $400,000 per acre.
Note: The Commission cost estimates are based on historic actuals for representative campuses, adjusted for inflation and current es-timated space deficiencies. This includes funding for projects traditionally paid for with non-state funds. Estimates assume a 30-yeareffective life for University facilities, 50 years for Stabs University facilities, and 60 years for community colleges facilities. Universi-ty costs and Commission estimates of University costs include auxiliary enterprise, not usually financed through State funds.
Source: California Postsecondary Education Commission.
78HU
ATTACHMENT ACalifornia Community Colleges Board of Governors'
Policy on Long-Range Capital Outlay Planning
NOTE: This material was originally produced by the Chancellor's Office of the California Com-munity Colleges and has been adapted with their permission for use in this background paper.
Background
The Board's 1989-90 Basic Agenda recognizes theneed to "accommodate future growth," noting that"the increasing demand for facilities and operatingfunds . . . calls for prudent management of limitedresources," and that "plans for growth should be co-ordinated with the other segments of higher educa-tion."
California's population is expected to become farmore culturally diverse and to grow one-fourth by2005, giving rise to an enrollment increase in com-munity colleges of at least 400,000 students theequivalent of 40 average-size colleges of 10,000 stu-dents each. While new campuses, facilities, and de-livery techniques will be required, many existingcampuses are incomplete, existing facilities are ag-ing and becoming obsolete, and equipment is in-creasingly in need of repair and replacement.
To help address these issues, Chancellor's Officestaff are examining enrollment projections underalternative assumptions about future conditions,and are developing a planning model that will esti-mate capital outlay needs for the Community Col-lege system to 2005. The details of this work and re-lated planning efforts by the California Postsecond-ary Education Commission (CPEC), the Universityof California (tiC), and the California State Univer-sity (MU) are reviewed in this item.
Analysis
411,
Enrollment projections are basic to capital outlayplanning. Current projections used for long-rangeplanning in UC, CSU, and the Community Collegesera based on widely differing methods and assump-tions, the combination of whk produces differentresults.
UC projects its undergraduate and graduate enroll-ments to in...ease by 34 percent and 80 percent, re-spectively, by 2005. These increases, together withenrollment ceilings at existing campuses, have leadto uc's recent request for three new campuses, toopen in 1998, 1999, and 2000.
CSU's long-range plans are predicated upon provic:.ing equal access to historically underrepresentee,groups. Taken literally, this would produce a two-thirds increase in Csu's undergraduate enrollmentby the year 2005, which has led to proposals for fourto six new campuses and centers (two of which havebeen approved).
Enrollment projections for the Community Collegesare prepared by the Department of Finance (DOF),which uses projections of historic participation rates(enrollment divided by population) and appliesthem to expected future population. DoF's currentprojection of 400,000 more students by 2005 appearslow because:
Abnormal budget cuts between 1982 and 1984artificially depressed historic and projected par-ticipation rates, and
Population projections are proving to be too low.Chancellor's Office staff are examining DOF'S pro-jection method in order to develop valid alterna-tives.
Part of the anticipated increases in Community Col-lege enrollments can be met by building and remod-eling facilities on existing campuses, extending out-reach activities, and developing new techniques forthe delivery of instruction and support services.The remainder of expected future enrollment in-creases will need to be accommodated at new cen-ters (many of which will become full-fledged cam-puses) if the Board of Governors goals for qualityeducation and equal access, particularly for histori-cally underrepresented students, are to be realized.
79
Capital outlay for growth also must be balancedagainst other substantial needs: to maintain andupgrade existing facilities, to repair and replaceequipment, and to provide a full complement of sup-port facilities on certain campuses.
Funding for capital outlay in the Community Col-leges, t.rc, and Mu currently is derived from the saleof revenue and general obligation bonds. Bonds au-thorized in 1986 and 1988 cover capital outlay ex-penditures through 1989-90. Legislation for an-other $900 million in higher education capital out-lay bonds is pending and, if approved, will be put be-fore California voters in June 1990, along with pos-sibly another $13 billion in bonds for other pur-poses.
Current capital outlay planning procedures for theCommunity Colleges do not provide a picture oflong-range needs or systemwide totals, nor do thecurrent procedures make it possible to easily exam-ine the impact of enrollment alternatives or policychanges. To address these problems, Chancellor'sOffice staff have begun work on a simulation model,utilizing microcomputer spreadsheet technologythat compares existing facilities to projections of fu-ture enrollment and estimates needed capital out-lay to the year 2005.
The model produces estimates by type of outlay(construction, remodeling, maintenance, etc.) andby type of facility (lecture, laboratory, office, etc.).Twenty-nine different data elements about existingand future enrollments and existing facilities foreach district are entered into the model. This infor-mation is then processed by the model, using spaceand utilization standards and 16 capital outlayplanning rules and assumptions developed for thispurpose.
An initial test of the planning model indicates thatit can be helpful in projecting long-range capitaloutlay needs for the Community Colleges system.Before further work is undertaken, however, minortechnical adjustments are needed and considerationmust be given to changing certain of the model's pa-rameters. Major issues to be addressed include: al-ternative enrollment projections; guidelines for plan-ning new campuses and centers; space and utiliza-tion standards for lecture, office, and Av/Tv/libraryfacilities; costs of completing campuses; buildingmaintenance; remodeling needs; and physical ac-cess and safety conditions.
80
Staff will report on further progress in long-rangecapital outlay planning at upcoming meetings ofthe Board.
Long-range capital outlay planning
Introduction
The Board's proposed 1989-90 Basic Agenda recom-mends six major objectives, prominent amongwhich is an effort to "Accommodate Growth," notingthat:
The rapidly increasing demand for facilitiesand operating funds to accommodate growingenrollments calls for wise and prudent man-agement of limited resources.
In addition, the Basic Agenda calls for a "long-range plan for capital construction in communitycolleges," and for consideration of
. . . both the growth of the state's changing stu-dent population and the need for facilities to ac-commodate that growth when developing thesystem's budget. Plans for growth should be co-ordinated with the other segments of highereducation.
Community College growth will be stimulated notonly by the state's future demography, but also bythe Board's goals to: (a) improve the access and re-tention of historically underrepresented students,and (b) play a more significant role in strengthen-ing California's economic development. Achieve-ment of these goals is essential if the CommunityColleges are to help prepare Californians to partici-pate in an ever-more complex and multicultural so-ciety.
Related recommendations from the 1988-89 BasicAgenda call for developing plans for faculty replace-ment -- emphasizing the need for gains in staff di-versity and for more predictable funding and ad-vanced planning.
These and other recommendations on long-rangeplanning are timely for two major reasons. First,California continues to grow; total state populationis expected to increase by over six million, or one-fourth, by the year 2005. Current estimates of fu-ture community college enrollment show the sys-tem growing by at least 400,000 students over the

next 16 years -- the equivalent of 40 average-sizecolleges of 10,000 students each. Emerging trendssuggest that students will tend to need more in-struction in basic skills and English and SecondLanguage. While, at the same time, their learningwill need to be more sophisticated because of soci-ety's increasing technological and cultural complex-ity. New educational facilities and new and im-proved instructional delivery techniques will beneeded, but existing facilities are aging and theamount of deferred maintenance is increasing onnearly every campus. Effective planning for the fa-cilities and staff needed to meet future needs is es-sential in this complex and changing environment.
A second reason for the Board to undertake long-range planning is the call for that effort in a num-ber of recent studies and legislative measures. TheCommission for the Review of the Master Plan, inits final 1987 report, The Master Plan Renewed, ob-served that, "Continuing, systematic long-rangeplanning is essential to the efficient and orderlygrowth of postsecondary education in California,"and recommended that the California Postsecond-ary Education Commission (CPEC) assume severalresponsibilities for long-range planning, includingthe development of common definitions, assump-tions, and projections for use by the segments. TheReview Commission also recommended that, "TheCommunity Colleges be expanded as necessary toaccommodate growth in demand for lower-divisionacademic and vocational instruction for credit "
The Joint Legislative Committee for the Review ofthe Master Plan proposed a number of similar rec-ommendations on long-range planning in its finalreport, California Faces, . . California's Future.This report requests the segments, in consultationwith CPEC, to prepare expansion plans to the year2005. The report goes further to suggest a numberof planning guidelines to be used in this effort.
Supplemental Language in the 1988 Budget Act di-rects CPEC to develop recommendations for the Gov-ernor and Legislature on policies about new facili-ties to 2005, including (a) new versus expandedsites, (b) new delivery techniques, (c) space and uti-lization standards, (d) year-round operation, and (e)regional approaches. A report is to be issued by
CPEC in December 1989 as a basis for a systemwideplan to be submitted to CPEC, the Department of Fi-nance, and the Joint Legislative Budget Committeeby December 1990.
In addition, Supplemental Language in the 1989Budget Act proposes that each segment submit acomprehensive five-year capital outlay plan that in-cludes at least the following:
Campus enrollment projections through 1995;
Proposed projects in each of the next five years,with programmatic and capacity justifications;
Cost estimates for each proposed project; and
The relative priority of projects.
These plans are to be submitted by September 1,1989, and updated annually.
For the Community Colleges, there is the additionalrequirement in AB 1725 (Chapter 973), Statutes of1988) that the Board of Governors "review and ap-prove comprehensive plans . . . submitted by thegoverning board of each community college dis-trict." The statute is silent, however, as to when orhow this is to be done.
At present, Chancellor's Office staff are examiningenrollment projections under alternative assump-tions about future conditions, and developing aplanning model that will project planning efforts bythe University of Cal ifornia (UC) and CaliforniaState University (Ca) are examined below.
Enrollment projections
Enrollment projections are basic to capital outlayplanning. For operating budgets, such projectionsextend no more than two years into the future. Forcapital planning purposes, ten-year projections arethe norm. However, longer (15- and 20-year) projec-tions appear necessary for the orderly planning ofnew campuses and centers.
Current enrollment projections used for long-rangeplanning by the three segments are based on widelydiffering methodologies and assumptions, the com-bination of which produces widely differing results,as show in Table 1. These differences are reviewedbelow.
8 1

TABLE 1 Projected Enrollment Growth in California Public Education, 1988-2005
2006Percentage
Growth
California Community Colleges Total 1,333,191 1,873,210 40.5%
California State University Undergraduates 284,929 465,500 63.4
California State University Graduate and Postbaccalaureate 70,177 75,800 8.0
California State University Total 355,106 541,300 52 4
University of California Undergraduates 118,513 161,800 36.5University of California Graduate and Professional 26,419 47,300 79.0University of California Health Sciences 11,804 12,250 3.8University of California Total 156,736 221,350 41.2
K-12 Total 4,512,963 6,279,403 39.1
Total Growth in Public Postsecondary Education 1,845,033 2,635,860 42.8Total Growth in Public Education 6,357,996 8,915,263 40.2
Source: Projections for the California Community Colleges and K-12 from the Demographic Research Unit, State Department ofFinance. University of California projections from the University, and California State University projections from theState University. Reproduced from Display 7 on page 17 of Higher Education at tha Crossroads (1990).
University of California
Using Department of Finance estimates of highschool graduates, the tx President's Office projectslong-term undergraduate enrollments for each cam-pus, based upon historic enrollment rates. Theseprojections are then reconciled with estimates pre-pared by each campus using factors unique, inmany cases, to their individual circumstances.
Graduate enrollments at LIC are planned and man-aged using a set of principles that include: (a) thefitture need. for research and for individuals withadvanced training, (b) the job market, (c) maintain-ing a balance between graduate and undergraduateactivity and between domestic and foreign students,(d) affirmative action objectives, and (e) selectivityand program quality. Graduate enrollment projec-tions in a recent UC study were heavily influencedby three factors: the future market for holders ofadvanced degrees (emphasizing the need for facul-ty), institutional balance, and an expansion of pro-fessional education.
Current long-range projections for tic campusesthrough the year 2005 explicitly assume that:
82
(a) The Riverside campus will not grow beyond15,000 enrollment; and
(b) The ratio of graduate to undergraduate enroll-ments will increase from .19 to .23 throughoutthe system.
UC projects an increase of 40,000 undergraduatestudents by 2005, which roughly reflects the expect-ed one-third increase in the number of high schoolgraduates. Graduate enrollments, however, areprojected to increase by about 20,000, or 80 percent,during this same period. These increases, alongwith enrollment ceilings at existing campuses, areused as arguments to support the University's cur-rent request for three new general campuses to beoccupied in 1998, 1999, and 2000, at sites that areas yet undetermined. Funds have been appropriat-ed for UC to study the environmental impact ofgrowth at existing campuses and for the selection ofnew campus sites.
California State University
A tive-year estimate of systemwide enrollment bythe Office of the Chancellor initiates csu's enroll-

ment projection process. This estimate is based on amodel that uses historic and projected enrollmentrates of first-time students from specific age andgender categories in the state's adult population.Estimates of future population are provided by theDepartment of Finance. Continuation rates for thesame age and gender categories of enrollment arethen applied to develop an estimate of total enroll-ment for the system. From this estimate, projectedenrollments are allocated among the 19 campuses ofthe system, then reviewed and negotiated withinthe overall system total. Agreed-upon one-and five-year projections become Mu policy for formulatingoperating and capital budgets.
For longer-range planning, csu has assumed that"the participation rates of Blacks and Hispanics(now 3.5 and 3.0, respectively, of each 100 21-yearold adults) will increase to equal that of whites (7 to100) by the year 2005."
In contrast to uc, enrollment assumptions for CSUresult in a relatively minor change in graduate en-rollments (7 percent increase), but a major increasein undergraduate enrollments of 180,000 students(66 percent) by the year 2005. This projection issubstantially greater than previous estimates (byabout 100,000 students) and results from Csu's stat-ed objective of providing equal access to historicallyunderrepresented students.
CSU is proposing four to six new campuses and cen-ters to meet future enrollment needs. One, at SanMarcos in San Diego County, is proposed for officialdesignation as the system's twentieth campus. Anoff-campus center in Contra Costa county has beenapproved and initial capital outlay funds appropri-ated. cSu is currently negotiating for a third site,for a permanent off-campus center in Ventura coun-ty.
California Community Colleges
By statute, long-term enrollment projections forcapital outlay planning in the California Communi-ty Colleges are prepared by the Department of Fi-nance (DOF). In the DOF model, projections are for-mulated by applying expected "participation rates"(enrollment divided by population) to projections offuture population groups, categorized according toage and gender. The expected participation ratesare based on past trends, input from local districts,and a qualitative assessment of each district's situa-
tion by DOF staff. These past trends embody notonly enrollment demand, but also budget provisionsthat affect the colleges' ability to enroll and teachstudents.
DOF's latest projections through 1997 are display( fiin Figure 1 on page 84. If the changes in participa-tion rates projected by DOF are extrapolated beyond1997, as in the figure, community college enroll-ments would rise to nearly 1 76 million by the year2005, an increase of about 400,000 students, or theequivalent of 40 average-size colleges of 10,000 stu-dents each.
These enrollment projections appear to be low fortwo reasons. First, the projections embody the con-sequences of abnormally severe budget cuts exper-ienced between 1982 and 1984, and thus implicitlyassume that similar cuts will occur in the future.By contrast, community colleges have received nor-mal funding provisions for cost-of-living and growthduring the past four years and as a result, have ex-perienced enrollment increases from 3 to 5 percentannually.
These rates of increase are substantially higherthan those projected by the DOF for the next decade.DoF's projections are below even those allowable un-der the funding cap, where ADA growth is not to ex-ceed the growth in adult population. For example,DOF projected a 3 percent increase in communitycollege enrollment for fall 1988, when in fact, pre-liminary figures show that the increase may be ashigh as 4 or 5 percent. The passage of Proposition98 last year and the possible passage of Senate Con-stitutional Amendment 1 in 1990 make it unlikelythat colleges will again experience budget cuts ofthe 1982-84 magnitude.
Second, community college enrollment projectionsare derived from population projections ("Baseline86"), also by DOF, which appear to be significantlyunderstated. Under Baseline 86 estimates, Califor-nia's population was expected to grow by just under500,000 per year between 1985 and 1990, a yearlyincrease of about 1.8 percent. By contrast, more-recent DOF population estimates (Report 87 E-2,January 1987) indicate that California's populationgrew by 643,000 in 1986 and 662,000 in 1987, ratesof 2.5 percent annually.
Appropriate consideration of the two factors of pop-ulation and participation would likely result inCommunity College enrollment projections that are
9 583

FIGURE 1 California Community College Enrollments, 1977-2005
Millions
11111ffl111-1-11-1-111111111r.'-r1977 79 81 83 86 87 89 91 93 96 97 99 1 3 5
r6-- Actual*-- Equal Access
-4- DOF '88 Projections
-9- Alternative
substantially higher than those of DOF. Such differ-ences, when projected 10 or 15 years into the future,have major implications for community collegecapital outlay needs beyond the turn of the century.
Alternative methods of projecting enrollment needto be considered. One such alternative could bebased on a gradual return to the participation ratesthe community colleges experienced prior to the ab-normal budget cuts of 1982 to 1984. Another enroll-ment projection alternative could be based on a poli-cy of equal access, where participation rates ofBlacks and Hispanics were to increase by 1992 tocorrespond to those of whites. The results of usingboth alternative methods are displayed in the en-rollment projections in Figure 1 and prove to be sub-stantially higher than those of DOF.
Chancellor's Office staff are examining the DOF pro-jection methodology to determine if budget changes
84
and other external factors that are known to havean impact on enrollment (such as unemployment)can be isolated so that potentially valid alternativeprojections can be developed.
Funding
Until 1984, funding for higher education was pro-vided by the Capital Outlay Fund for Public HigherEducation (COFPHE). This fund was supportedlargely by Tidelands Oil Revenues, which are nolonger available. UC, CSU, and the Community Col-leges are now funded through general obligationand revenue bonds. General obligation bonds wereauthorized in 1986 for $400 million and in 1988 for$600 million. The Community Colleges share was$99 million and $143 million, respectively. Com-munity colleges also receive funding from revenuebonds.

General obligation bonds must be approved by thevoters and are typically a long-term instrument fi-nanced by the State's General Fund. Like otherbonds, California's are rated according to the State'sgeneral fiscal health, its cash reserves, and its over-all level of bonded indebtedness. California's bondscurrently have the highest possible rating: AAA.(The debt service on voter-approved bonds is exemptfrom the State's appropriation (Gann1 Limit).
Revenue bonds may be authorized in two ways. TheLegislature may grant authority to an institution toissue revenue bonds for a specific project, or theLegislature mey authorize the bonds for a specificpurpose. These bonds, although backed by the Statemust be self-supporting, from a designated "rev-enue stream."
Revenue bonds have been used to fund high-technology projects. In addition, CSU and LiC haveboth issued revenue bonds to support projects suchas student centers, parking lots, dormitories, andathletic facilities -- paid for, in the case of studentcenters, by food service profits and increased stu-dent fees.
Community college capital outlay planning
Capital outlay planning for California's 107 com-munity colleges is based on the annual submissionof five-year plans and project proposals by the dis-tricts. These plans are reviewed by Chancellor's Of-fice staff, relying largely on DOF enrollment projec-tions, State-approved space and utilization stan-dards, and priorities set by the Board of Governors.On the basis of this staff review, the Board developsa list of proposed projects for the immediate budgetyear and that list is entered into the executive andlegislative budget processes. (While the first yearis emphasized, review also is made of the secondthrough fifth years of district plans.)
Districts also submit five-year plans for the fundingof deferred maintenance. After review and approv-al, districts later submit detailed proposals for fund-ed first-year projects and then revise and resubmittheir five-year plans for the next cycle. Equipmentreplacement is supported by a separate ADA alloca-tion and accommodated through the district's oper-ating budget. Ongoing facility maintenance is sup-ported by the general apportionment.
Long-range capital outlay planning model
Current capital outlay planning procedures do notprovide a picture of long-term needs or regional .andsystemwide totals, nor do current procedures makeit possible to easily examine the impact of enroll-ment alternatives and/or policy changes. To ad-dress these problems, Chancellor's Office staff areworking on a simulation model, utilizing microcom-puter spreadsheet technology that compares infor-mation on existing facilities with forecasts of enroll-ment and academic loads, and projects needed capi-tal outlay to 2005.
The model produces estimates by type of:
Outlayacquiring sites and developing new campusesconstructing and equipping new facilitiesremodeling and altering existing facilitiesmaintaining existing facilitiesleasing and renting off-campus facilitiesreplacing equipment
Facilitylecture-roomslaboratories and shopsaudio-visual, radio/television, and library officessupporting spaces
Twenty-nine different data elements about existingand future enrollments and existing facilities foreach district are entered into the model. (See Ap-pendix A for a list of these elements.) This informa-tion is then processed, using space and utilizationstandards and a series of capital outlay plann ngrules and assumptions.
Space and utilization standards are stated in termsof the square feet of facilities that staff and studentsrequire for their activities. Standards are derivedfrom policies on how many hours per week a room isto be used, how many stations in the room are to beoccupied during that time, and the amount of floorspace needed for each station. The standards for theCalifornia Community Colleges are set forth in law(Appendix B).
The 16 planning rules and assumptions used thusfar in work on the model are listed in Appendix C.For the most part, these rules and assumptions rep-resent an attempt to quantify existing policies and
(.1 7 85

procedures for use in the model. In some cases, therules are unwritten, but rigorously followed. In oth-er cases, rules or assumptions may change periodi-cally. Qualitative "rules of thumb" have been re-duced to their approximate quantitative equivalentfor use in the model. An illustration of this 1.. thetentative "rule" in the model for proposing newcampuses:
New campuses (or centers slated to become cam-puses) are proposed when
(a) Average size of existing campus(es) in a dis-trict exceeds 600 Weekly Student ContactHours (wscH) per acre, and
(b) The service area(s) of existing campus(es) ina district exceeds:
TYPO of Service Area
UrbanSuburbanRural
Size of Service Area(intiare Miles)
100500
1,000
Districts plan new campuses for several reasons.Population growth may be taking place in a part ofthe district beyond a reasonable commuting dis-tance to existing campuses. Or, an existing campusmay not physically be able to accommodate addi-tional students. In some cases, lack of parkingspace may constrain the expansion of an existingcampus.
Part (a) of this planning rule is based on the currentacreage and academic activity at the system's 107colleges. The average community college in Califor-nia enrolls 11,000 students on 150 acres. More(less) acreage and facilities can support more (few-er) students, although other factors may be moreimportant, such as the regional location of pro-grams, topography, and character of existing facili-ties.
Part (b) of this rule is based on the assumption thata commuting time of not more than 30 minutes -- in-cluding 25 minutes travel and 5 minutes to findparking -- to (and from) campus is reasonable. Thisrule of thumb is applied against expected commut-ing speeds in different areas to derive the approxi-mate mile radius and square-mile area to be servedby each campus. It is also assumed that the currentproportion of instruction taught at off-campus ot,reach sites (about 1 in every 10 WSCH) will continue.
86
Although this rule is not written down, the underly-ing concepts appear valid. The actual values in therule should be reviewed further, and it may need tobe extended to cover major centers that are not ex-pected to become campuses. With these refine-ments, the model can be helpful in suggesting theneed for new campuses within regions and acrossthe state, even though the procedure for gaining ap-proval of these sites is far more complex. Extensivecriteria are used in the actual review of such propos-als by both the Board of Governors and CPEC.
Preliminary results from the model
Three enrollment projections were examined in afirst "test" of the model:
1. Using enrollment projections prepared by DOF in1987 to estimate future capital outlays and com-paring them with districts' actual five-year-planrequests for the period 1989-94.
This projection provides for an assessment of themodel's validity in relation to district requests.
2. Using enrollment projections prepared by DOF in1988 to estimate future capital outlay needs.
This variation uses the latest "official" enroll-ment projections and illustrates the impact thatan additional year's actual enrollment exper-ience has on the DOF projections and, lonse-quently, on the need for capital outlay.
3. Using an "alternative" enrollment projection toestimate future capital outlays.
This alternative assumes a return to the "morenormal" participation rates (enrollment dividedby population) that existed prior to the "abnor-mal" budget cuts and fee increases between 1982and 1984. It illustrates the impact on capitaloutlay of changee assumptions about future par-ticipation and consequently, changed enroll-ment projections.
Major preliminary findings from running the modelusing these three enrollment projections are as fol-lows:
1. Using DOF 1987 enrollment projections to com-pare with district requests for the five-yoar peri-od, 1989-94, the model provided, as shown in Ta-ble 2 on the opposite page:

TABLE 2 Comparison of District Five-Year Plan Requests and Planning Model Projections1989-1994
Type of OutkiY_
in millions)District
Five-Year PlanaPlanning
Model
Acquire, develop sites $31.1 $40.2
Construct, equip new 597.2* 377.6
Remodel existing 15.7* 98.1
Total Capital Outlay $644.0 $515.9
(Per Year) ($128.8) ($103.2)
Deferred Maintenance 168.9 140.6
Lease/Rent Off-Campus NA 4.6
Ongoing Maintenance NA 378.6
Sources: District 1989-94 Five Year Plans and Chancellor's Office Long-Range Capital Outlay Planning Model.
* Five-Year Plan project descriptions do not allow for a precise distinction between these two kinds of projects; therefore, while thetotal of these figures is accurate, their individual levels may not be.
Less overall funding:
o $103 million per year in the model.
o $129 million per year requested by dis-tricts.
Less for new construction.
More for remodeling.
A similar amount for deferred maintenance.
Probably more for AV/TV/library space:
o Less for lecture space.
o Less for office and supporting spaces.
2. Different enrollment projections substantiallyaltz projected capital outlay (Table 3, page 88).Using the latest (1988) DOF projections, estimat-ed capital outlay by the model averaged $121million per year, rather than $103 million - themodel's estimate from 1987 DOF projections.
The amount estimated for building maintenanceis large: $500 million over the next five years.Only with the highest "alternative" enrollmentprojection does the estimate of new capital con-struction exceed 'chat of building maintenance.
3. Irrespeztive of the enrollment projection used:
"Deferred" maintenance in the model is re-duced initially, but begins to increase after1997.
In terms of total space, a number of districtsare "overbuilt" (based on current space andutilization standards), but they are deficientin specific kinds of space, particularly:
o Laboratory.
o AV/TV/library.
The model projects surprisingly little newspace for:
o Lecture rooms.
Office and other supporting facilities.
Further work
The first test of the model suggests that it can be auseful tool in projecting long-range capital outlayneeds for the Community Colleges system. Beforefurther work is undertaken, however, minor techni-cal adjustments are needed and the model param-eters that describe current policies and practicesmust be reviewed. Major issues are as follows.
Alternative enrollment projections: DOF will issuea nev set of long-term enrollment projections in
87
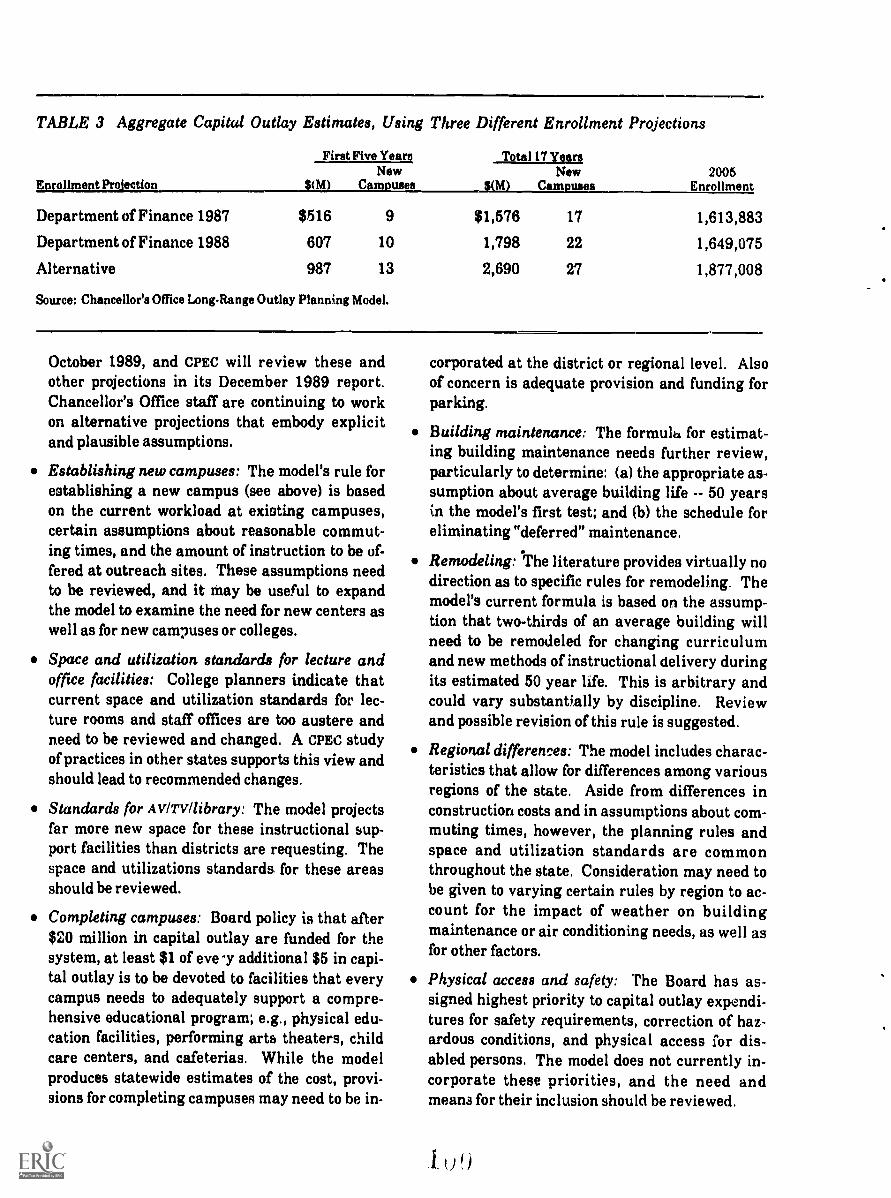
TABLE 3 Aggregate Capital Outlay Estimates, Using Three Different Enrollment Projections
Enrollment Projection
First Five Years Total 17 YearsNew New 2005
Qnp_) Campums Enrollment
Department of Finance 1987 $516 9 $1,576 17 1,613,883
Department of Finance 1988 607 10 1,798 22 1,649,075
Alternative 987 13 2,690 27 1,877,008
Source: Chancellor's Office Long-Range Outlay Planning Model.
October 1989, and CPEC will review these andother projections in its December 1989 report.Chancellor's Office staff are continuing to workon alternative projections that embody explicitand plausible assumptions.
Establishing new campuses: The model's rule forestablishing a new campus (see above) is basedon the current workload at existing campuses,certain assumptions about reasonable commut-ing times, and the amount of instruction to be of-fered at outreach sites. These assumptions needto be reviewed, and it May be useful to expandthe model to examine the need for new centers aswell as for new campuses or colleges.
Space and utilization standards for lecture andoffice facilities: College planners indicate thatcurrent space and utilization standards for lec-ture rooms and staff offices are too austere andneed to be reviewed and changed. A CPEC studyof practices in other states supports this view andshould lead to recommended changes.
Standards for A v/Tyllibrary: The model projectsfar more new space for these instructional sup-port facilities than districts are requesting. Thespace and utilizations standards for these areasshould be reviewed.
Completing campuses: Board policy is that after$20 million in capital outlay are funded for thesystem, at least $1 of eve -y additional $5 in capi-tal outlay is to be devoted to facilities that everycampus needs to adequately support a compre-hensive educational program; e.g., physical edu-cation facilities, performing arts theaters, childcare centers, and cafeterias. While the modelproduces statewide estimates of the cost, provi-sions for completing campuses may need to be in-
88
corporated at the district or regional level. Alsoof concern is adequate provision and funding forparking.
Building maintenance: The formulu for estimat-ing building maintenance needs further review,particularly to determine: (a) the appropriate as-sumption about average building life -- 50 yearsin the model's first test; and (b) the schedule foreliminating "deferred" maintenance.
Remodeling: °The literature provides virtually nodirection as to specific rules for remodeling. Themodel's current formula is based on the assump-tion that two-thirds of an average building willneed to be remodeled for changing curriculumand new methods of instructional delivery duringits estimated 50 year life. This is arbitrary andcould vary substantially by discipline. Reviewand possible revision of this rule is suggested.
Regional differences: The model includes charac-teristics that allow for differences among variousregions of the state. Aside from differences inconstruction costs and in assumptions about com-muting times, however, the planning rules andspace and utilization standards are commonthroughout the state. Consideration may need tobe given to varying certain rules by region to ac-count for the impact of weather on buildingmaintenance or air conditioning needs, as well asfor other factors.
Physical access and safety: The Board has as-signed highest priority to capital outlay expendi-tures for safety requirements, correction of haz-ardous conditions, and physical access for dis-abled persons. The model does not currently in-corporate these priorities, and the need andmeans for their inclusion should be reviewed.

APPENDIX ACapital Outlay Planning Model
District Data EntryData Elements
Existing ASP of Lecture SpaceExisting ASF of Laboratory SpaceExisting ASF of Office SpaceExisting ASF of AV/Tv/Library SpaceExisting ASF of Noncapacity Space
Median Age of BuildingsOutside Gross Square Feet of BuildingsValue of Deferred Maintenance
Ongoing Building MaintenanceOngoing Building Maintenance/Other
Number of CollegesSquare Miles per College (select value front Rule N)Campus Acres OwnedDistrict Square MilesConstruction Multiplier
1982 Population (18 to 64)1988 to 2010 Population (18-64)
Department of Finance 10/87 EstimatesTotal Enrollment, 1988 through 1996Day-Credit Enrollment, 1988 through 1996
Department of Finance 10/88 EstimatesTotal Enrollment, 1988 through 1997Day-Credit Enrollment 1988 through 1997
Department of Finance 10/87 Projection of District WSCH, 1988 through 1996Department of Finance 10/88 Projection of District WSCH, 1988 through 1997
Alternative Enrollment Projection #1 (calculates automatically)Instructional Staff prE
Total WSCH Offered on Campus
Total WSCH Offered on Campus in Lecture SpaceTotal WSCH Offered on Campus in Laboratory Space
Off-Campus Lease Cost per FootCampus Site Acquisition Cost (select value f.om Rule P)
89

APPENDIX BCapital Outlay Planning ModelSpace and Utilization Standards
Facility "capacities" -- i.e., what level of activity each should house -- are calculated by applying space andutilization standards to the space available:
assignable square feet (ASF) of facility = capacity of facility asf/workload measure
where, workload measures include:weekly student contact hours (visCH)F'TE instructional faculty (FTEIF)day graded (credit) enrollment (D(E)
Facility spaces for which capacity is measured include:
Classroom lecture: 0.429 ASF/WSCH
15 feet per lecture station,66 percent of stations occupied,53 hours per week
Classroom laboratory: *1.50 to 8.50 ASF/WSCH (depending on discipline)
* feet per lab station,80 percent of stations occupied27.5 hours per week
Offices: 140 asf/fteif < 35,000 ViSCHICOLL160 asf/fteif > 35,000 WSCH/COLL
Library:
AV/TV/Radio:
3,795 ASF + 3.83 ASF x DGE, < 3,000 DGE+ 3.39 ASF x DGE, 3,000-9,000 DGE+ 2.94 ASF x DGE, > 9,000 DGE
3,500 ASF + 1.50 ASF x DGE, < 3,000 DGE+ 0.75 ASF x DGE, 3;000-9,000 DGE+ 0.25 ASF DuE, > 9,000 DGE
For example, College A, with 26,000 ASP of lecture space, has capacity for 60,500 WSCH; i.e., 26,000/.429. IfCollege A faces an actual "load" cf 70,000 WSCH, then it has capacity for about 86 percent of its load; i.e.60,500/70,000. This .presents a deficit of 9,500 WSCH, 4,100 ASF, or about 14 percent. Additional class-room space is justified, particularly if enrollment growth is anticipated. Capacity/load relationships forother types of space are calc&ated in a similar fashion.
90

APPENDIX C
Capital Outlay Planning ModelPlanning Rules and Assumptions
A. The future balance of district lecture and laboratory Weekly Student Contact Hours (WSCH) is basedon the district's 1989 experience as derived from its Five-Year Facilities Plan.
B. The district's recent ratio of wscH/full-time equivalent instructional staff - i.e., staffing practice - willremain constant over time.
C. The district's existing ratio of off-campus to on-campus WSCH is used to derive the future need foroff-campus space.
D. The existing statewide ratio of non-capacity to capacity space (.33) is used to derive a district's futureneed for non-capacity space.
E. The ratio of available or funded asf to needed asf must drop below
Space TneLecture Office
Lab sytrY/Lib Noncapacity District Type.96 .92 .88 Multi-campus.92 .88 .84 Single campus
before more such space is built; but, when built, the "facility" or space increment is sized to the capac-ity needed (according to standards) two years beyond the time the space is to be occupied.
F. The following cost schedule is used:
Project Type Total Cost for W, C,Eg/ASF)Lecture $173Laboratory 250Office 190Av/Tv/Library 225Non( apacity 217
District costs are adjusted further by a "construction multiplier" to reflect the variation across areasof the State.
G. Three years are required, on the average, to prepare working drawings (W), and to construct (C) andequip (E) a facility. Under this schedule, the project appropriations are spread in the following way:
Year 1; 8% of total cost (W)Year 2: 76% (C)Year 3: 16% (E)
The facility is occupied and its capacity added to the district's total capacity in year 4 (the year afterthis kind of space dripped to less than that needed (see planning Rule E). To avoid illegal projects( <$150,000) or sale diseconomies, no less than 1,000 asf of any kind of space will be built at any onetime.
H. It will be possible to maintain the existing ratio of leased/rented: free/owned spaces that are utilizedoff-campus.
I. Needs for new space will be met by remodeling one or more of the other four types of space if thehave/need ratio(s) of such space(s) exceed(s):
(continued)
I 39 1
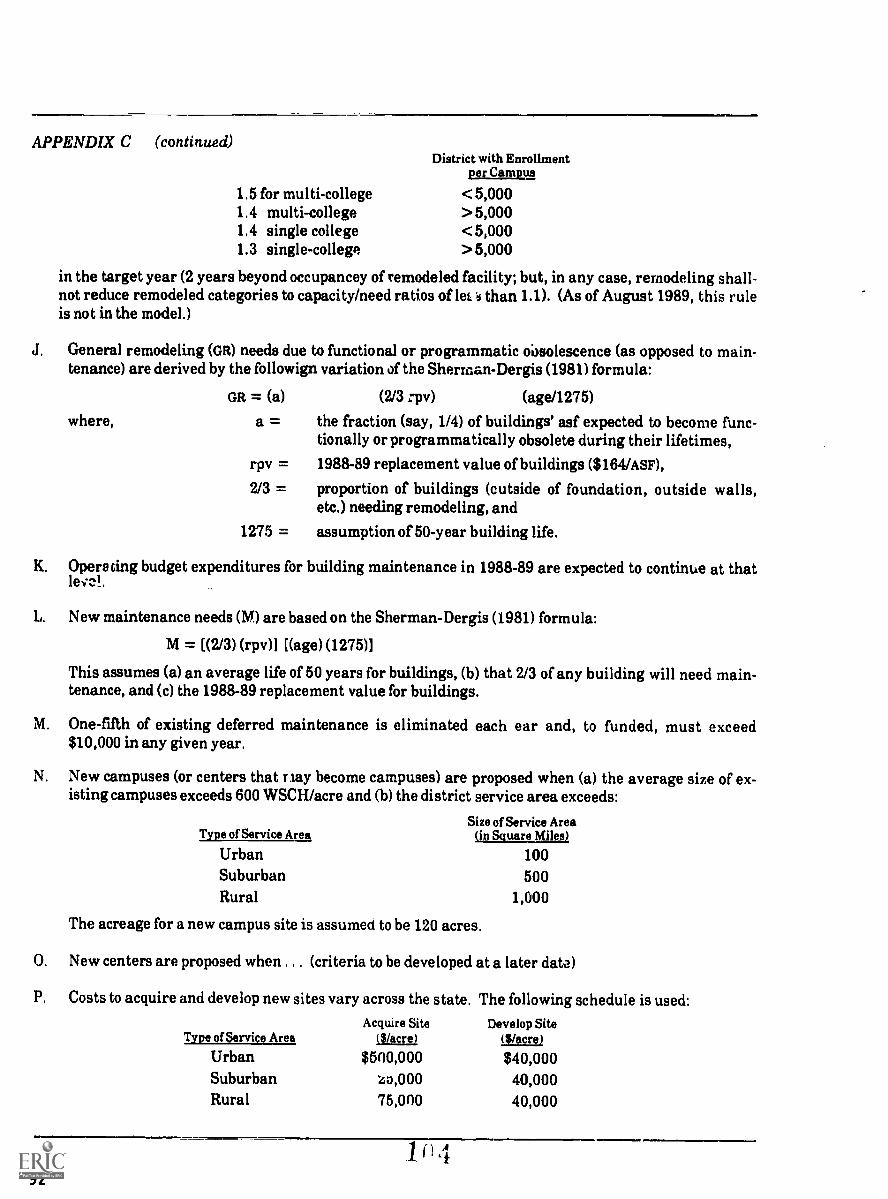
APPENDIX C (continutd)
1.5 for multi-college
District with Enrollmentge_Lcarnpu.s
<5,0001.4 multi-college > 5,0001.4 single college < 5,0001.3 single-college > 5,000
in the target year (2 years beyond occupancey of remodeled facility; but, in any case, remodeling shall-not reduce remodeled categories to capacity/need ratios of let: ;$ than 1.1). (As of August 1989, this ruleis not in the model.)
J. General remodeling (GR) needs due to functional or programmatic o'osolescence (as opposed to main-tenance) are derived by the followign variation of the Sherman-Dergis (1981) formula:
where,
GR = (a) (2/3 :pv) (age/1275)
a = the fraction (say, 1/4) of buildings' asf expected to become func-tionally or programmatically obsolete during their lifetimes,
rpv = 1988-89 replacement value of buildings ($164/AW),
2/3 = proportion of buildings (outside of foundation, outside walls,etc.) needing remodeling, and
1275 = assumption of 50-year building life.
K. Opera ting budget expenditures for building maintenance in 1988-89 are expected to continue at thatleve.
L. New maintenance needs (M) are based on the Sherman-Dergis (1981) formula:
M = R2/3) (rpv)1 Rage) (1275)1
This assumes (a) an average life of 50 years for buildings, (b) that 2/3 of any building will need main-tenance, and (c) the 1988-89 replacement value for buildings.
M. One-fifth of existing deferred maintenance is eliminated each ear and, to funded, must exceed$10,000 in any given year.
N. New campuses (or centers that nay become campuses) are proposed when (a) the average size of ex-isting campuses exceeds 600 WSCH/acre and (b) the district service area exceeds:
Size of Service AreaType of Service Area (in Square Miles)
Urban 100Suburban 500Rural 1,000
The acreage for a new campus site is assumed to be 120 acres.
0. New centers are proposed when . . . (criteria to be developed at a later date)
P. Costs to acquire and develop new sites vary across the state. The following schedule is used:
Type of Service Area
UrbanSuburbanRural
Acquire Site Develop Site($/acre)
$500,000 $40,000000 40,000
75,000 40,000
A
f92

ATTACHMENT BCalifornia Community Colleges Long-Range
Capital Outlay Planning Model
NOTE: This material is adapted and reproduced with permission from an internalstaff report prepared by the Chancellor's Office of the California Communitry Colleges.
Overview
The Community College Long-Range Capital Out-lay Planning Model is a simulation model that uti-lizes microcomputer spreadsheet technology to com-pare information on enrollment and existing facili-ties with projections of future enrollment and aca-demic loads in order to forecast needed capital out-lay.
The model is intended to make it possible to exam-ine -- by district, region, and statewide, the long-term capital outlay implicztions of alternative sce-narios in which enrollment forecasts might differ,planning assumptions change, and/or policies aboutfacilities-utilization be altered.
The model was constructed by the Research andAnalysis Unit of the Chancellor's Office, workingclosely with the Facilities Planning Unit of thatsame office. Considerable time was spent in explor-ing and specifying both written and unwritten rulesthat govern the planning of community college capi-tal outlay in California. Output from an initial runof the model was compared to recent five-year planssubmitted by community college districts and nec-essary corrections made to the model.
Following the initial test run, the model was run asecond time in August 1989 and the results ana-lyzed and presented to the Board of Governors at itsSeptember 1989 meeting in Agenda Item 5 on Long-Range Capital Outlay Planning.
The model's structure consists of a knowledge base,inference mechanism, and output for each of the 71California community college districts. Each run ofthe model analyzes several different scenarios foreach district. The results of these scenarios arethen summarized by region and, finally, for state-wide totals. (See Appendix A on page 96 for themodel's basic structure.)
The local focus of community colleges makes it nec-essary to begin the model at the district-level andsummarize the results to regional and statewidelevels. Use of only c.; statewide model would not beadequate for this purpose since it would obscuremuch of the need. To illustrate: While some com-munity colleges are "overbuilt" in lecture space(i.e., they have more lecture space than the stan-dards say they need), there is still a need to buildlecture spaces for other colleges because they areunderbuilt. In a statewide approach, by contrast,these situations could cancel each other with the re-sult that no needed lecture space is indicated. Theuse of district-level data is especially important be-cause communiky college needs are determined lo-cally and students are not "redirected" from one col-lege that might be underbuilt to another collegethat might be overbuilt. (A college-service area-level of aggregation was even considered during themodel's development, but discarded because of thelack of enrollment forecasts and potential complex-ity.)
Output
The model produces long-term estimates (currently,to the year 2005, although this can be adjusted) bytype of outlay and facility:
Outlay* acquire sites and develop new campuses* construct and equip new facilities* remodel and alter existing facilities
* maintain existing facilities
* lease and rent off-campus facilities* replace equipment
Facility* lecture rooms
93
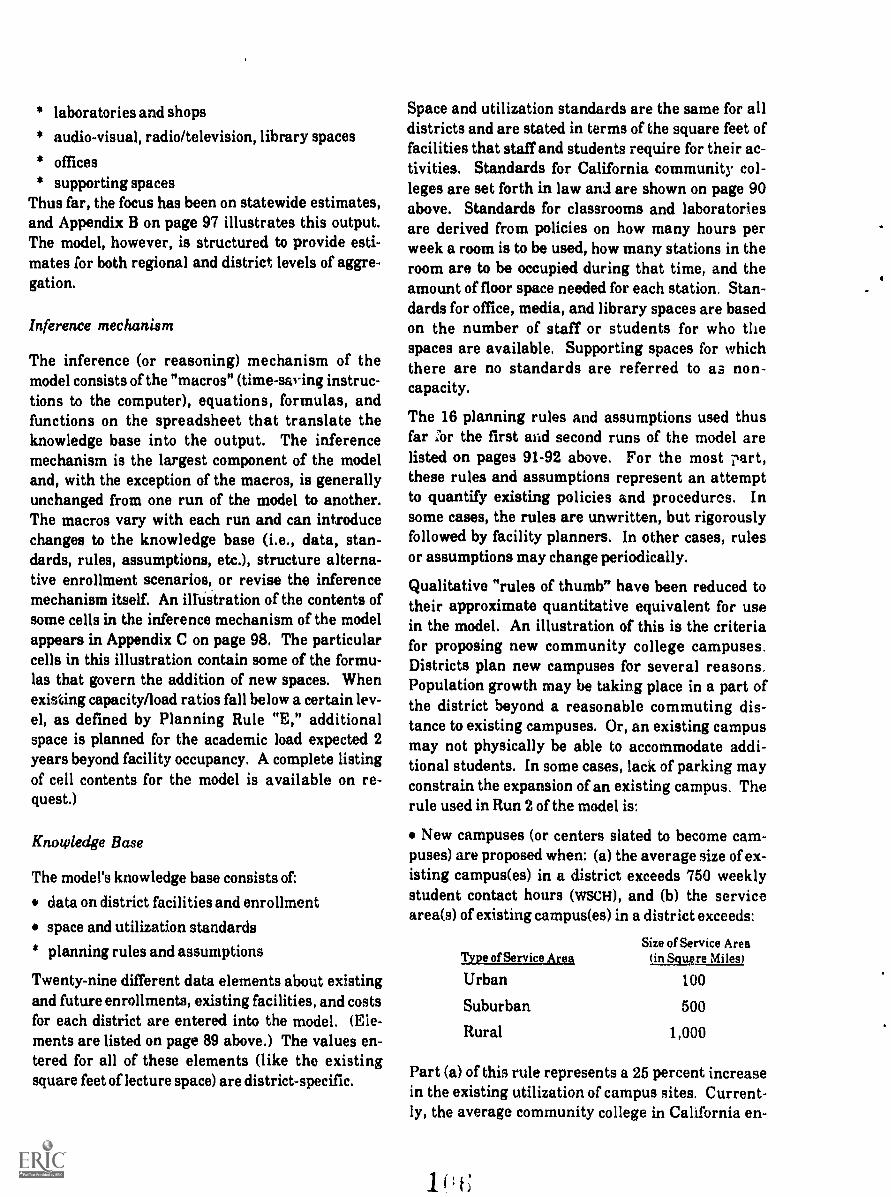
* laboratories and shops
* audio-visual, radio/television, library spaces
* offices* supporting spaces
Thus far, the focus has been on statewide estimates,and Appendix B on page 97 illustrates this output.The model, however, is structured to provide esti-mates for both regional and district levels of aggre-gation.
Inference mechanism
The inference (or reasoning) mechanism of themodel consists of the "macros" (time-saying instruc-tions to the computer), equations, formulas, andfunctions on the spreadsheet that translate theknowledge base into the output. The inferencemechanism is the largest component of the modeland, with the exception of the macros, is generallyunchanged from one run of the model to another.The macros vary with each run and can introducechanges to the knowledge base (i.e., data, stan-dards, rules, assumptions, etc.), structure alterna-tive enrollment scenarios, or revise the inferencemechanism itself. An illustration of the contents ofsome cells in the inference mechanism of the modelappears in Appendix C on page 98. The particularcells in this illustration contain some of the formu-las that govern the addition of new spaces. Whenexisting capacity/load ratios fall below a certain lev-el, as defined by Planning Rule "E," additionalspace is planned for the academic load expected 2years beyond facility occupancy. A complete listingof cell contents for the model is available on re-quest.)
Knotpledge Base
The model's knowledge base consists of:
data on district facilities and enrollment
space and utilization standards
* planning rules and assumptions
Twenty-nine different data elements about existingand future enrollments, existing facilities, and costsfor each district are entered into the model. (Ele-ments are listed on page 89 above.) The values en-tered for all of these elements (like the existingsquare feet of lecture space) are district-specific.
94
Space and utilization standards are the same for alldistricts and are stated in terms of the square feet offacilities that staff and students require for their ac-tivities. Standards for California community col-leges are set forth in law and are shown on page 90above. Standards for classrooms and laboratoriesare derived from policies on how many hours perweek a room is to be used, how many stations in theroom are to be occupied during that time, and theamount of floor space needed for each station. Stan-dards for office, media, and library spaces are basedon the number of staff or students for who thespaces are available. Supporting spaces for whichthere are no standards are referred to as non-capacity.
The 16 planning rules and assumptions used thusfar :or the first and second runs of the model arelisted on pages 91-92 above. For the most part,these rules and assumptions represent an attemptto quantify existing policies and procedures. Insome cases, the rules are unwritten, but rigorouslyfollowed by facility planners. In other cases, rulesor assumptions may change periodically.
Qualitative "rules of thumb" have been reduced totheir approximate quantitative equivalent for usein the model. An illustration of this is the criteriafor proposing new community college campuses.Districts plan new campuses for several reasons.Population growth may be taking place in a part ofthe district beyond a reasonable commuting dis-tance to existing campuses. Or, an existing campusmay not physically be able to accommodate addi-tional students. In some cases, lack of parking mayconstrain the expansion of an existing campus. Therule used in Run 2 of the model is:
New campuses (or centers slated to become cam-puses) are proposed when: (a) the average size of ex-isting campus(es) in a district exceeds 750 weeklystudent contact hours (wscH), and (b) the servicearea(s) of existing campus(es) in a district exceeds:
kpLorvice AreSize of Service Area
Miles)
Urban 100
Suburban 500
Rural 1,000
Part (a) of this rule represents a 25 percent increasein the existing utilization of campus sites. Current-ly, the average community college in California en-
1
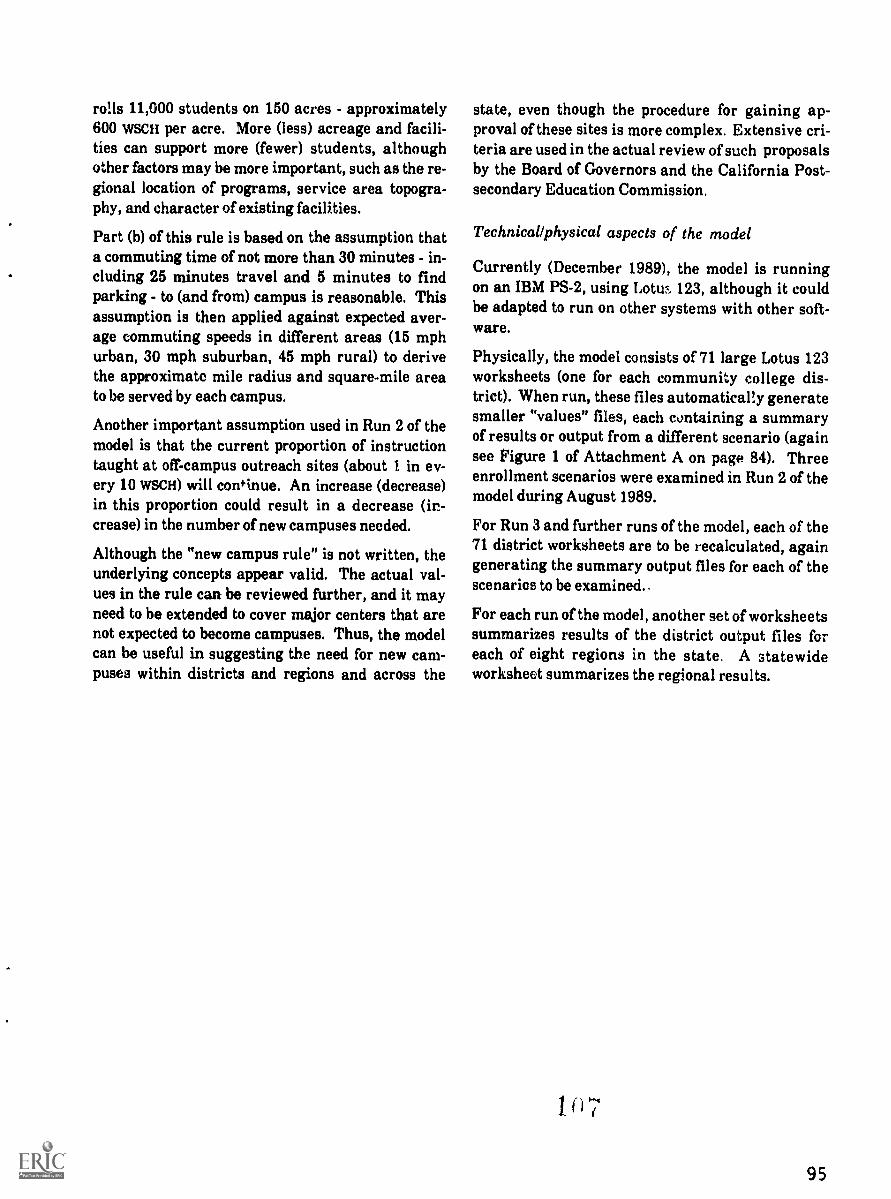
rolls 11,000 students on 150 acres - approximately600 wsCH per acre. More (less) acreage and facili-ties can support more (fewer) students, althoughother factors may be more important, such as the re-gional location of programs, service area topogra-phy, and character of existing facilities.
Part (b) of this rule is based on the assumption thata commuting time of not more than 30 minutes - in-cluding 25 minutes travel and 5 minutes to findparking - to (and from) campus is reasonable. Thisassumption is then applied against expected aver-age commuting speeds in different areas (15 mphurban, 30 mph suburban, 45 mph rural) to derivethe approximate mile radius and square-mile areato be served by each campus.
Another important assumption used in Run 2 of themodel is that the current proportion of instructiontaught at off-campus outreach sites (about I in ev-ery 10 wsCH) will continue. An increase (decrease)in this proportion could result in a decrease (in-crease) in the number of new campuses needed.
Although the "new campus rule" is not written, theunderlying concepts appear valid. The actual val-ues in the rule can be reviewed further, and it mayneed to be extended to cover major centers that arenot expected to become campuses. Thus, the modelcan be useful in suggesting the need for new cam-puses within districts and regions and across the
state, even though the procedure for gaining ap-proval of these sites is more complex. Extensive cri-teria are used in the actual review of such proposalsby the Board of Governors and the California Post-secondary Education Commission.
Technicallphysical aspects of the model
Currently (December 1989), the model is runningon an IBM PS-2, using Lotus 123, although it couldbe adapted to run on other systems with other soft-ware.
Physically, the model consists of 71 large Lotus 123worksheets (one for each community college dis-trict). When run, these files automatically generatesmaller "values" files, each containing a summaryof results or output from a different scenario (againsee Figure 1 of Attachment A on page 84). Threeenrollment scenarios were examined in Run 2 of themodel during August 1989.
For Run 3 and further runs of the model, each of the71 district worksheets are to be recalculated, againgenerating the summary output files for each of thescenarios to be examined..
For each run of the model, another set of worksheetssummarizes results of the district output files foreach of eight regions in the state. A statewideworksheet summarizes the regional results.
95

APPENDIX ACalifornia Community Colleges
Long-Range Capital Outlay Planning ModelStructure
KNOWLEDGE BASE
DISTRICT INPUT DATA
/MANNING RULES & ASSUMPTIONS
3?AC1E/UTILIZATION STANDARDS
INFERENCE MECIIANISti
Macros
141LIMMIIIIIIIMINI111
DISTRICTOUTPUT
ANI1111
I
Macros
REGIONALOUTPUT
71 DISTRICT WILES
71xN* DISTRICT SUMMARIES
Macros
111111111113LIMINIII.W
STATEWIDEOUTPUT
...1MONNIIIMINGIBMIENt
*d le Number of scenarios analyzed.
Safi* REGIONAL SUMMARIES
144* 3TATEWIDE MIMMA.RI1 .4.1
9601:_,

3181111VAV Ad00 IS38
t;() I
mettles's cia'otteolts iceitsenis osseasesus neelso'iss Dem Socss tremens''s oftemessts pg'Issemsts Limn slii-11
szo'osVcs Imens'Is ou'ut'es otoesu'os
suests'es wensetis Apemen toIts'ois inem'es meets sliesoteos mew%
meats aseat'es /semen meats oneness inessVas steno scrooge:10 Won't:I
tictois menteois western Iseesstem ottemeto tsVsocels ItelVitps asetsees
os suesn'ts aValets
esteoltetis tesesoteis asetnetti tilxtelts Os
loVouesos cue:sets ou'en'ito nseocems soesssets seVostelos oneseVis at'sn'ocs eit'oss'ais on'oso'sto we/Wm ta'stoIs Ift'106111 COVI'KIS osoesorts ta'ai'm sul'Iotels saa'ots'sgs otesssetts osoesoletis toesonto !neaten ll'oseon aseaetts on'ossetis losesio'no IOW* &neatens oneness mimeos oftessots tosettVoo sonitetio Isteaseas Is ;nemesis tte'sosess sossooseus ue'lltetss mem% ticeosteas is'ac'es ostemems Icemen, Hessen coo'netts *tenets utenseas its'Issetts es 'neatens WKS ool'ou'Its losessens Is
toetnitis utesoesozs stem's+ onenemo sternums
0$ ttesoVis itessiess Keuseus mests'a so co354115 mimeos tIoesu'as
Of Wag metals *einem wetness Is toiesaits W00% tsseaseto mew*
ocettetis ostesosessus tneits'ao tteasseso ste/is'os
AIM= AWNIVAIS 3lI U,IIfl 1311
4111113/1$1113 AIN3IIN03 41110/1111113 MUM AIM/1M
nesttiools tueltleists oosesov'esis
otteanto nssolas stuens'ais ;newts at'ou'on toessVots 'nemesis no' mew 10111.611 Be11111111
sos'on'ts foo'oosem western *Weal *Omen
MOM NI 41111 1011
ININN °IMMO 'WM* MOMS
meat 'as taeolettis toe'sssetus Ifietts'ous suetssetols tainteas
Potentials ssa'nemis ushineits
sn'oso'sols neatens nemesis
ntenVins
netsenis antens tremens
ttoetWous laStuhlas
Ingo 11.03 7411
MIII$ RIA-g
VIII MINIMS
lin Nit MIR V11113

APPENDIX CIllustrative Listing of Cells in Model's Inference Mechanism
ASO* CW273 'PLAN AV/LECTURECINIe (F0) CW133 OIF(C99<11C95,F104-C170,0)DSOs (PO) CW123 OIF(0990,C95,01040170,0)EIDOs (F0) CW123 IF(19901C95,H106E170,0)04119s CW273 ' LA4ORATORYCO9s (F0) CW133 OIF(C1000C9e,F107C171,0)009e (F0) CW123 OIF(0100(SC94,0107-0171,0)E091 (F0) C14123 OIF(1100(11044H107(171,0)AgOs CW211 OFFICEC90s (F0) (W133 01F(C101<$C94,F100C172,0)DgOs (F0) (W123 1F10101<bC94,01000172,0)E9Os (P0) CW123 OIF(111010C94,H100.41172,0)A91$ CW273 ' AV/TV/UNARYC91s (F0) rw133 mc102orm,F109-0730)mi (F0) CWI23 01F(D10201C95,010,-D173,0)E91s (F0) CWI23 OIF(E102011C95,H109.4173,0)A92s CW273 NONCAPACITYC92s (PO) CWI33 OIF(C103<SC94,F110...C174,0)092s (F0) CW123 OIF(0103(1)C94,0110-0174,0)E 921 (F0) CW123 OIF(E103004,H1104174,0)A93i (W273 'PLAN AV/LEA0E,RENTs RULE 0093e (F0) CW123 ((0.429)*(0137110131))4((0116)*((1-0137)40131))Eons (F0) CW123 ((0.429)*(6137$E131))+((11116)*((1-6137)10E131))A94s CW273 'RULE lisLAO HAVE/NEED OFFICEO 94s CW123 '449.1111C94s CW133 OIP(C1001,0.00,0.04) ,
D941 CW123 OIF(D1W1,0.00,0414)E941 (W123 IF(E106)10.00,0.04)A951 tW273 'RULE Os H/N LEC,AVTV/LIOO 951 CW123 '.00,,42C951 1.01133 OlF(C1001.0.92,0.00)D95s rwiu OIF(01001,0.92,0.00)E 95s (14123-SIF(E1001,0.92,0.00)
A962 CW273 'RULE Es HAVI/NEED LAON W CW123 '.92,014C941s CW133 OIF(C1001,0.96,0.92)Dilbs CW123 IF(011101,0.96,00,2)Eifte CW123 OI,(11001,0.96,0.92)A97s CW273 'HAVIE(A0F)/NEED(ASF)/ONCiC97, (F2) CW133 (C140/C104)097e (F2) CW123 (0160/0104)"97e (F2) CWI23 (1160/1104)AM CW273 ' CapacityC91e (F2) tW133 (C149/C105)MI (P2) (W123 (0169/0105)E gile (F2) CWI23 (E149/1105)A99s CW273 LectureMt (F2) CW133 (C170)/(C106)9991 (F2) CW123 (0170)/(0106)E991 (F2) CW123 (1170)/(1104)A100, CW273 ' LaboratoryC100e (F2) CW133 (CI71/C107)O 100s (F2) CW123 40171/D107)1100e (F2) C4123 (1171/1107)A101s CW273 MiceCIOls (F2) tW133 (C172/C100)01011 (F2) (W123 (0172/0100)1101s (F2) CW123 (E172/11011)A1021 (W273 ' AV/TV/LibraryC1021 (F2) MI, (C173/C109)D102t (F2) EIP1127 (1)173/D109)11021 (F2) tW123 (11173/E10g)A1031 EW273 ' NoncapacityC103s (F2) tW133 (C174/C110)0103s (F2) tW12, M174/01101E101: (F2) (14121 1E174/F1101
BEST COPY AVAILABIr98

Cost Estimates and Simulations3 for Operating Budgets
Introduction
This paper presents background materials regard-ing operating budgets used as a part of the Commis-sion's ongoing long-range planning project for pub-lic higher education. It analyzes information onlevels of educational and general expenditures forcurrent operations costs needed to build new cam-puses of the University of California, the CaliforniaState University, and the California CommunityCollege systems. Several displays show various it-erations of these non-capital costs, divided by seg-mental enrollments, to arrive at estimations of per-
udent expenditures in five direct and administra-'e cost categories.
Purposes of the study
The information developed in this paper is intendedfor use in planning for growth in the public sector ofCalifornia higher education. Fiscal data on the seg-ments have been compiled from several sources anddefined with assumptions reasonable for planningpurposes in order to determine financial support ra-tios for each segment and per-student costs for themany ongoing operations of existing campuses. Thepaper makes this determination in such a way as toproject the likely amounts of funds needed to oper-ate new campuses. These data are highly aggregat-ed and are averaged to arrive at final per-studentcost data for each expenditure category and as to-tals (averages) for each system. By explaining theanalytical assumptions and methodologies em-ployed in completing these cost calculations, Com-mission staff expect to further the discussion ofwhat factors are appropriate for inclusion in thesesorts of calculations. These calculations are not an-ticipated as being the final word on projected oper-ating costs in the segments, nor are the assump-tions and sources of information they are basedupon closed to further refinement. Nonetheless, thedata on per-student current operations costs devel-oped here are reasonable planning estimates for use
in evaluating the feasibility and fiscal efficiency ofcurrent operations at campuses in the State's pub-lic' segments.
Limitations of the study
By themselves, the raw numbers and support ratiosgenerated here do not explain the expendituresmade on behalf of public higher education, nor dothey make judgments about the quality or produc-tivity of these estimates of costs. This exercise todetermine operating cost estimates also does not ad-dress the important issue of the different education-al missions of the segments or the students theyserve. These missions -- along with programs ofcurrent operation, historic planning decisions, andseveral other factors -- greatly impact not only theamounts of monies spent in the public segments butalso the patterns of spending that have evolved overthe years.
In addition it is important to note that for the Uni-versity, the State University, and the communitycolleges, the fiscal information presented here de-rives planring estimates of costs that are not de-signed for use in budgeting. These cost calculationsare rough averages of combinations of data oncampus-level and systemwide educational and gen-eral expenditures. The per-student costs developedhere would not be appropriate for use in a budgetingformulae for the reasons discussed above. Rather,this report is constructed te present a general pat-tern of the levels of expenditures in selected costcategories at the public segments. These initial costcalculations are an attempt to provide guidance inthe planning of future campuses in terms of expen-ditures for the ongoing operations of these facilities.
Need for future study
Commission staff are committed to continuing to re-fine these analyses of expenditures patterns. Theissues of costs and cost containment will always be
99

before higher education planners, as will issues ofproductivity and accountability.
In future conversations with segmental representa-tives, legislative staff, and others, Commission staffanticipate that further refinements will be made tothese data. Efforts will continue to discover, isolate,and remove cost centers from these calculationsthat will not be replicated in newly constructedcampuses. As campus health science-related spend-ing was extracted from the University's displays,more detailed information on Agricultural Exten-sion will be sought to exclude expenses for this pro-gram from these calculations, if determined to beappropriate. Moreover, in a later study, fiscal datafrom the faculty salary comparison institutions ofthe University and State University as well as fromother out-of-state colleges and universities will beexamined to compare and contrast with the cost in-formation developed here.
Sources of cost information
The information on costing categories used in thisstudy of the operating costs of educating students atthe University, State University and communitycollege systems was taken from three major sources:the National Center for Education Statistics, theUniversity of California's Campus Financial Sched-ules, and the California State University's SupportBudget for fiscal years 1986 and 1987.
National Center for Education Statistics
The Natianal Center for Education Statistics (NCES)of the United States Department of Education com-piles data through its Integrated PostsecondaryEducation Data System (IPEDS) -- formerly the High-er Education cleneral Information Survey (HEGIS).Annually it sends survey forms to state.level andsystemwide offices with detailed instructions onwhat data should be included and what should beexcluded.
In California, the Postsecondary Com mission re-ceives these survey forms from the National Centerand sends them to the segmental offices, which thendistribute them to campuses and coordinate their-eturn to the Commission. The Commission sendsthe survey forms directly to California's indepen-dent colleges and universities and collects them
100
back from those institutions. The Commission thensends all of the information to the National Centerin Washington, D.C.
The National Center subjects the data to a series ofedits, checking for internal consistencies within theresponses themselves (for example, making sure therows and columns add up) and also checking thedata against prior year submissions to see if theymake sense. Large discrepancies from one year tothe next are highlighted and the institutions in-volved are contacted directly by the Center for clari-fication.
The main body of information analyzed in this re-port is compiled from the "Current Funds Expendi-tures and Transfers" section of the IPEDS reportingform. Total "educational and general expenditures"are shown for each of the categories in the displays.For the University of California, State GeneralFund revenues supply, on average, more than 85percent of these educational and general expendi-tures, tuition and fee revenues supply less than 8percent, and various small sources fund the remain-ing 7 percent. These percentages are rough aver-ages that cut across programs on all nine of the Uni-versity's campuses; the actual ratios of supportfunds vary by program and by campus. For exam-ple, the category of "instruction" receives no fund-ing from resident student fee revenues but does re-ceive it from non-resident tuition, while "studentservices" receives a large amount of funding fromresident student fee revenues, although thisamount varies from campus to campus. A signifi-cant amount of the student-based revenues is gener-ated by non-resident tuition, particularly at Uni-versity campuses with high numbers of nonresidentstudents. For the California State University, thecombination of General Fund and student revenuessupplies its total educational and general expendi-tures, with General Fund revenues providing 87percent and student tuition and fees 13 percent.
Differences in the way that student fee revenues areaccounted for affect these cost comparisons. For allthree systems, State policy is that non-resident stu-dents are charged tuition to offset to the State theircost of instruction, and revenue from nonresidenttuition charges are direct reimbursements to theState General Fund. For both the State Universityand the Community Colleges, revenue from resi-dent student fees are also reimbursements to theState General Fund, although these revenues are

accounted for separately in the University of Cali-fornia. In order to obtain comparable intersegmen-tal data on the total costs to operate programs, stu-dent fee revenues were included in the calculationsfor this analysis. If they had been exiluded, the re-sult would suggest a lower actual cost profile for theUniversity than for the other segments because ofthis accounting difference.
The University's Campus Financial Schedulesand the State University's 'Gold Book"
The University of California annually publishes itsCampus Financial Schedule that reports campus-by-campus financial information in several ways:revenues by sources of funds, and expenditures byuniform classification categories, fund source, andobject of expenditure -- to name a few. That docu-ment was used to disaggregate iealth-science-re-lated expenditures and to determine the percent-ages of educational and general expenditure byfunding source discussed above.
The California State University's Su Jport Budget(commonly known as The Gold Boo;.., provides full-time-equivalent (FTE) enrollment di t a and other in-formation on its cost categories.
Other sources of information
Commission staff also used several other books andreports to collect pertinent fiscal data on the publichigher education segments. It employed the Officeof the Legislative Analyst's annual Analysis of theBudget and the GovernDr's Budget both for generalfiscal information and to determine the comparabil-ity of the cost categories used by the two public seg-wants. Finally, headcount enrollment information'n the 1986 and 1987 fiscal years was compiled fromthe Commission's own Data Abstract 8, "Fall 1986Enrollment by Sex, Ethnicity, Student Level, andFull-Time/Part-Time Status, University of Califor-nia and the California State University" (May 1987).
Explanation of the cost categories
This report contains tabular displays showing fundsspent on public postsecondary education in Califor-nia through five cost categories used to account forcurrent operations spending -- Instruction, Academ-
ic Support, Student Services, Institutional Support,and Plant Operations. These five categories are ex-amined to derive different measurements of supportper full-time-equivalent student for the Universityand State University, and per average daily atten-dance (ADA) for the community colleges.
The five expenditure categories are generally accepted r ationwide as appropriate accounts for oper-ating expenses in postsecondary education enter-prises. They are used in both WEDS of the NationalCenter for Education Statistics and also California'sState budgeting process. As they pertain to Califor-nia's public foul /ear segments, the five categoriesare defined as follows:
1. Instruction
At the University of California, "general campus in-struction" includes most of the resources associatedwith the schools and colleges located on its eightgeneral campuses. At the State University, "regu-lar instruction" includes the instructional programsoperating during the academic year that are man-aged by the regular academic departments. Thiscategory includes expenditures for faculty, teachingassistants, instructional support staff, and suppliesand equipment that are a part of the formal degreeor certificate curriculum programs at both seg-ments. Excluded from the analysis are both seg-ments' self-supported extension programs.
2. Academic Support
At both the University and State University, thelargest function of the academic support program isto provide for library and audiovisual services tostudents and faculty. University libraries serveboth the instructional and research needs of thecampuses and the research community, while StateUniversity libraries house data processing servicesand data collection and dissemination support foractivities such as nursery schools, college farms,marine science facilities, and other ancillary ?co-grams.
3. Student Services
13th segments' student services programs fund ac-tivities designed to contribute to the students' phys-ical well-being and intellectual, cultural and socialdevelopment outside of the context of the formal in-struction program. They include expenditures for
1 i :3101

organized Student Service administrative activitieslike counseling and career guidance, students ad-missions and records and student health services.Additionally, this cost category houses administra-tive expenses for student affirmative action pro-grams in both segments. Included here are the Uni-versity's Early Outreach, Undergraduate MinorityScholars, and Graduate and Professional StudentAffirmative Action Programs and the State Univer-sity's State University Grant Program, EducationalOpportunity Program, and various disabled stu-dents services programs.
4. Institutional Support
Activities funded within this function include plan-ning, policy making and coordination within the of-fices of the systemwide offices, campus level admin-istrations and governing boards for the Universityand State University. Specific operations includesuch day-to-day functions as accounting, campuspolice, payroll and personnel, and publications. Atthe University, this category also includes federalprogram administration and certain self-supportingservices such as telephones, garages and equipmentpools. At the State University, the development ofmanagement policies and the provision of communi-cations, purchasing and inventory control, and legalservices are funded out of the Institutional Supportprogram.
The IPEDS form of the National Center for Educa-tion Statistics collects information on expendituresfor maintenance of higher education facilities as aseparate category from "Institutional Support," andtherefore the State University reports PhysicalPlant Operation separately rather than as a sub-category under 'Institutional Support." Followingthe IPEDS format, the State University's PhysicalPlant Operations expenditures have been taken outof Institutional Support and reported as Plant Op-eration, consistent with similar expenditures at theUniversity.
5. Plant Operation
This expenditure category includes th University's"Operation and Maintenance of Plant" program andthe State University's "Physical Plant Operations."It includes resources for the maintenance, preserva-tion, and renewal of State-supported physical plantspace in both segments. Major components of thiscategory include the maintenance of electrical, heat-
102
ing, and plumbing systems, buildings and Froundsmaintenance, janitorial serv ices, and painting andstructural repairs.
Calculation of cost information per student
Expenditures in the instruction and Academic Sup-port categories, when divided by enrollment, yield acost number called "Direct Average InstructionalCost per Student " This cost measurement is mostappropriate for developing gross estimates of oper-ating costs used here to plan for the building of newcampuses. These are distinguished from otherkinds of cost calculations which might be appropri-ate for other purposes in many ways. First, they ex-clude expenditures for research and public servicewhich are only indirectly related to the instruction-al mission. Second, they average costs among alllevels of instruction, and kinds of programs, acrossall campuses, to come up with a gross systemwideaverage. Third, they assume that the costs of add-ing all students are the same, without regard toeconomies of scale. In this way, these figures aredifferent from others that appear in the literatureand that are used for budgetary or other purposes,some of which include the total, direct and indirect,cost of instruction; others which impute a marginalcost, which is the cost to add one student recogniz-ing economies of scale. The Commission staff feltthat the direct, average instructional cost per stu-dent was the most appropriate one to use for this ex-ercise, since its main objective is to estimate thegross potential costs to the State to build a campusin one segment as contrasted to another segment.
Effects of the level of instruction
The cost information presented here does not s;',3 keinto account the different levels at which instruc-tion is provided to the students. The level of in-struction has a significant impact upon any directmarginal (per-student) cost calculations -- it takesgreater fiscal resources, for example, to educate apostgraduate student in the hard sciences than itdoes a lower-division general education student.The current ratio of undergraduate to graduate in-struction proposed in the University's Graduate En-rollment Plan is 4:1, and the calculations in this re-port assume maintenance of that ratio. If the pro-portion of undergraduate to graduate students is

changed, however, to increase graduate student en-rollment to a proportion of full-time equivalentgreater than 20 percent, the "per-student" costsshown here will increase substantially. In such acase, an attempt to isolate those costs per studentthat are specific to the provision of graduate educa-tion would be the most analytically correct way todetermine accurate planning cost estimates.
Reasons for inclusion and exclusionof expenditure categories
The most significant trait of all five of the expendi-ture classifications analyzed here is that they arefunded almost exclusively by the State for the on-going operations of its public higher education en-terprise. Since the taxpayers of the State of Califor-nia will be the chief source of funds for any new pub-lic higher education institutions, this analyses islimited to cost information affecting State-fundedprograms. Thus although all three of Californiapublic segmento also have self-supported indepen-dent operations and auxiliary services, these expen-ditures are not included in this report.
Three other expenditure categories -- "Scholar-ships," "Research," and "Public Service" -- are notused in the per-student costs listed in the followingdisplays but are included in the Grand Total columnat the right side of each dis, lay. Expenditure infor-mation on these programs is not available in the de-tail necessary to disaggregate these sources in themanner consistent with the other cost calculations.In addition, scholarship funds provided for stv dentfinancial aid at both segments are funded heavilyby student fees, while the focus of this study is oncosts that the State must bear as enrollment levelschange. Moreover, the definitions and functions ofthe "Research" and "Public Service" cost categoriesare not comparable between the two segments, as il-lustrated below.
Research: Under the State's Master Plan for High-er Education, the University is California's primaryresearch agency. It conducts basic and applied re-search for state and national entities, both publicand private, as a part of its educational mission.This research -- along with departmental or instruc-tion-related research provides training for schears in their advanced graduate and professional in-struction programs. The State University's re-search focus is usually limited to the provision ofgrants and leaves for faculty to conduct research ex-
pected to improve classroom instruction by keepingfaculty members aware of current developments intheir fields of study. The significant differences inthe focus arid scope of research between the two seg-ments makes this cost category an inappropriateone to calculate the expenditure comparisons de-scribed above.
Public Service: Public service is a substantial partof the educational mission of the University and theState spends more than $50 million a year in thiscategory at the University. Activities funded hereinclude the University's Cooperative Extension,Lawrence Hall of Science, California Writing andMath Projects, and several other programs. Theseactivities are designed either to increase access tohistorically underrepresented groups to the Univer-sity or to help local communities develop their re-sources. The State University runs a much smallerpublic service program (funded at just over $1 mil-lion a year) that is designed to assist the gvneralpublic. These two programs are not compatible, ei-ther in design or mission, and are excluded from thecost comparisons.
Current operations costsof California public higher education
University of California
Display 1 on pp. 104-105 shows current fund expen-ditures of the University of California for fiscalyears 1986 and 1987 in the expenditure categoriesdiscussed earlier. For this report, fiscal data forboth years instead of only one were examined in or-der to de-emphasize one-time fluctuations in expen-ditures that occur in any given fiscal year, but nosuch fluctuations were discovered in this examina-tion, and so the following text focuses on data forthe 1987 fiscal year.
Effects of the San Francisco campus: Due to thecostly health sciences programs offered by the Uni-veroity of California at San Francisco -- the onlytype of program operated by that campus -- all of theUniversity's displays present column totals that ex-clude this campus as well as systemwide totals thatinclude it. As can be seen, direct instruction (DI)per-student expenditures for 1987 ranged from alow of $6,483 at the University's Santa Barbaracampus to a high of $63,386 at San Francisco.
1 1 :;103
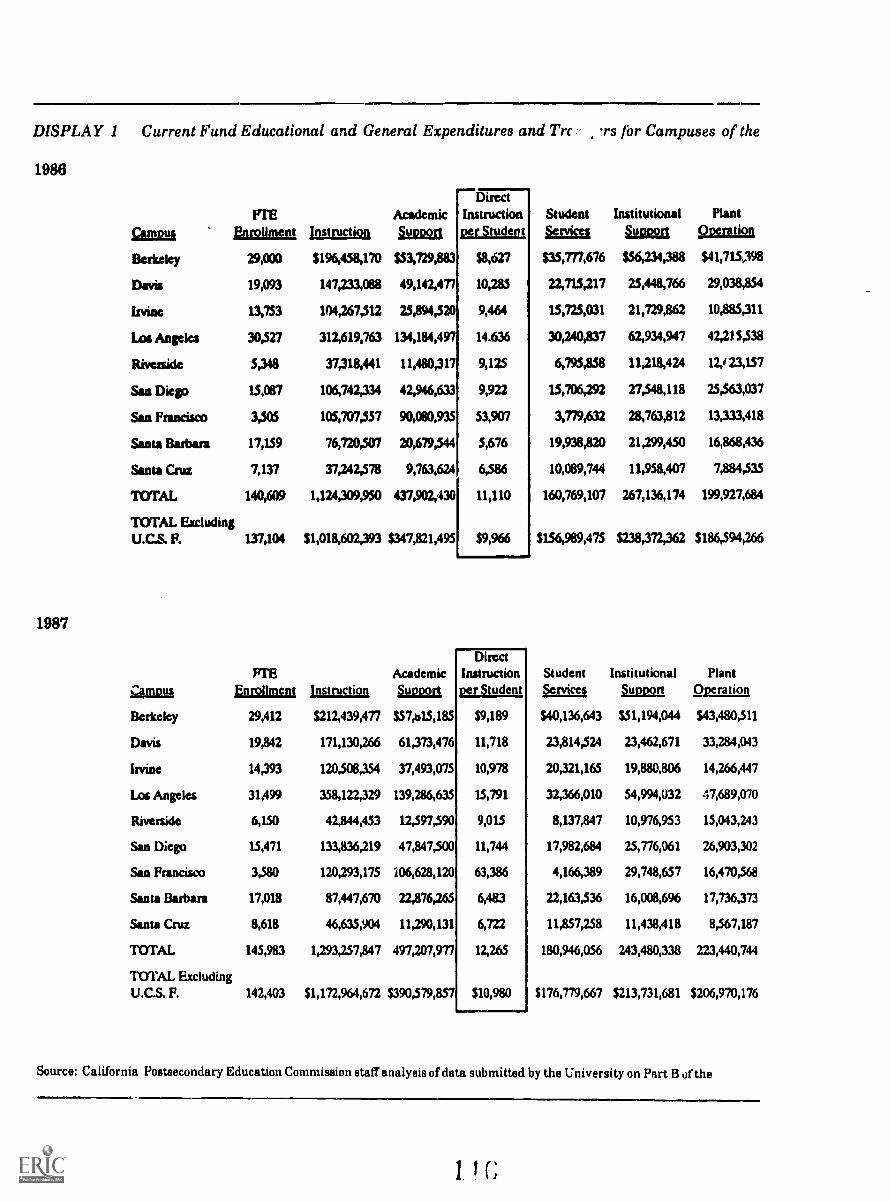
DISPLAY 1 Current Fund Educational and General Expenditures and Trc for Campuses of the
1986
CUP.IM
FTEfatrollment logvsjat"
Academiciyagn
Student&aim
InstitutionalImam
PlantOperation
DirectInstructionper Student
Berkeley 29,000 $196,458,170 $53,729,883 $8,627 $35,777,676 $56,234,388 $41,715,198
Davis 19,093 147,233,088 49,142,477 10,285 23,715,217 25,448,766 29,038,854
Irvine 13,753 104,267,512 25,894,520 9,464 15,725,031 21,729,862 10,885,311
Las Angeles 30,527 312,619,763 134,184,497 14.636 30,240,837 62,934,947 42,215,538
Riverside 5,348 37,318,441 11,480,317 9,125 6,795,858 11,218,424 12,123,157
San Diego 15,087 106,742,334 42,946,633 9,922 15,706,292 27,548,118 25,563,037
San Francisco VOS 105,707,557 90,080,935 53,907 3,779,632 23,763,812 13,333,418
Santa Barbara 17,159 76,720,507 20,679,544 5,676 19,938,820 21,299,450 16,868,436
Santa Cruz 7,137 37,242,578 9,763,624 6,586 10,089,744 11,958,407 7,884,535
TOTAL 140,609 1,124,309,950 437,902,430 11,110 160,769,107 267,136,174 199,927,684
TOTAL ExcludingU.C.S. F. 137,104 $1,018,602,393 $347,821,495 $9,966 $156,989,475 $238,372,362 $186,594,266
1987
DirectFIE Academic Instruction Student Institutional Plant
caingLis Tnroliment Instruction Suotiort per Student Services Llama Qperation
Berkeley 29,412 $212,439,477 $57,n15,185 $9,188 $40,136,643 $51,194,044 $43,480,511
Davis 19,842 171,130,266 61,373,476 11,718 23,814,524 23,462,671 33,284,043
Irvine 14,393 120,508,354 37,493,075 10,978 20,321,165 19,880,806 14,266,447
Los Angeles 31,499 358,122,329 139,286,635 15,791 32,366,010 54,994,032 47,689,070
Riverside 6,150 42,844,453 12,597,590 9,015 8,137,847 10,976,953 15,043,243
San Diego 15,471 133,836,219 47,847,500 11,744 17,982,684 25,776,061 26,903,302
San Francisco 3,580 120,293,175 106,628,120 63,386 4,166,389 29,748,657 16,470,568
Santa Barbara 17,018 87,447,670 22,876,265 6,483 22,163,536 16,008,696 17,736,373
Santa Cruz 8,618 46,615,904 11,290,131 6,722 11,8.57,258 11,438,418 8,567,187
TOTAL 145,983 1,293,257,847 497,207,977 12,265 180,946,056 243,480,338 223,440,744
TOTAL ExcludingU.C.S. F. 142,403 $1,172,964,672 $39079,857 $10,980 $176,779,667 $213,731,681 $206,970,176
Source: California Postsecondary Education Commission staff analysis of data submitted by the University on Part B of the
1041 (;

L
pus oa.mrpuodxa opunjluouno jo lu-notuo ram uo pocks.] aousuu Sam uotwonpz Jo luounavdop rolepo; Immo
I96`96I4LWES Z£04690'017IS 0111St6ITS ISVL954ZES 99EISL9'09$ L19(L,854ZELS
SO6'LIVLEL't OW616`091 Ocnio984Ea 119106`CE TIV61,£'59 U114098
6I9t9VLIT LIS'ELP LZ67.61,9 stesstl K9'L£6 T9'9I
I8t'Ot'C6I IISdOZthI 7ZZILVOT 960'ILVE tst'soVI 9S9'6£S4L£
tte0Z0'06t, 9£110£810P 09L'909't1 09Z$LE'T 0,61£L9'1, t££'9LVIST
851'9Sr6t4, 6£0'090'LZ 1Z6`571451 erateE PIVELL'Z f
Ell'EU'LET 9S1'ZL941 61611e£ TOVVIZI artZt, P8'1S1'017
LEVO£V6I6 PLO'St9IS ILV£01.16Z 911499Z46 PLO'6Z8'9L1
Ta60rla 6SL'IL0'91 0E91,546 ZPL'L9VE TO59Etrt Z6Z160819P
9Z9'6L6'L8t 610'190'TZ LII'69641 1,6V61,Zst 11946Z9'PT COVSS6`911
9Zt/b9S'LZ9S Lart/STIS IV MIES Ki'svat tetioCSITS /Z6'or gistpIS
TRU 113F0131 mrang apsalun pxyg Pe1157
patio dpisrepps anqnd
1-60'091'Itea 89Vizeres ISOWOOTS S6VII9Lta ITO'S101£6,t Irgir6£9S
ESI/E991,Z4£
969'LI0t0I
6ZO'nelOZ
9STVLI/004
9ZI1£0191,£
Lcr91,01Z1
nerfiecOs
£1.£116'612
nea91.0t
9£01088'60St
rCrt puato
£9S'SZVE£ 959`090`£11 Melte% I6I160101 STVIO9'S9L
IIV6ZI SIVIEVS 86ires1 melon 0£S40£V9I
Mina WWI 9LV9E£1£ I£I'L£V£ IW0Z9'0£
S6r0Iel, SOLILKII 89eZPVI 00r9001I tWVA'9ZI
KZ UV'S 0691.0I'ZI !Want MOO'S 991,0it'OCI
014'Ite 0111:£64Z LE"846Z9 1£6'05C9C
£90'Lce8 EL9hIL£12 MUCK Ett'91,9'9Z ZS0'0£0'ISI
E6r6Zet 0L6tWL 085'0I9t 9t6ISIOIS It 01t9Lel OCe890'IT SZL°986t £61498ZI 110'"Z£VZOI
%%Area on'weas Z66'811'13 01,0'6WLES tresx'oM
UWE! Wpm two-4min 33pag gmwswg dmu1ioq3s migna
SLI`SIS
£01.49I
6W01
89C6
OWL/
I IC191
69514
6L0'0Z
8/..131
ELL'fit
luopnis .t2d
31300 Pa1'1721
UOIPIUISVI
SLSVI
08L'OI
£90'6
KS'99
£11t4I
91911
IL0'6I
6L6'ZI
6Z£1I
InVEIS
)taapals iad
$1103 PaI*1321
noplusul
L86T Put) 3861 PJVdA 10391.4 InwaoMP23 Jo 4.7?sJaalull

The instructionally related costs (IRC) for each ofthe individual campuses, and for the Universitysystemwide, are shown in the eighth column fromthe left; this is the number most pertinent to thecurrent planning exercise. Thai, is, using the 1987fiscal year to project current operations expenses ata new campus in the University system given theexpenditure patterns of the campuses in the Uni-versity system displayed here -- an average of$16,703 in State revenues would need to be allocat-ed for each full-time-equivalent student to replicateoperations at the existing University campuses.The equivalent systemwide per-student costs for theUniversity excluding the San Francisco campus is$15,175. These two approximations assume thatthe programs of study offered, and the ratios of ex-penditures in cost categories, would be identical tothose on the existing campuses.
Effects of health sciences programs on other cam-puses: Instruction in the health sciences is offered,to varying degrees, on every University campus ex-cept Santa Barbara and Santa Cruz. Displays 2, 3,and 4 on pp. 108-113 show efforts to remove healthseience-related expenditures from the cost categor-ies, which are described below. The net effects ofthese efforts are actually to understate expendituresfor each full-time-equivalent student on the eightUniversity general campuses by "over-excluding"health science-related expenditures, particularly inthe administrative categories. Generally, the meth-od used to determine and extract health science-related costs at the general campuses is to replicatethe expenditure levels at the University's healthsciences campus in San Francisco and multiplythese totals by the full-time-equivalent enrollmentin health sciences on the respective general cam-puses.
In campuses with a relatively low proportion ofhealth sciences students -- like Berkeley and River-side -- such across-the-board prorations overstatethe actual fiscal resources consumed by health sci-ences students. This is because the large unit costsgenerated by the very well fundecl University ofCalifornia, San Francisco health sciences programsare spread over a smaller number of students atthese campuses. The marginal increases in levels ofservice actually needed for these few health sciencestudents are almost certainly less than what is gen-erated by spreading the large per-student costs gen-erated using San Francisco campus data. While us-
106
ing the "ucsr-Model" is appropriate for this initialexercise in removing health-science program costsfrom these planning calculations, the Commissionstaff is exploring more accurate methods of dis-counting for these costa in the future.
The first step of this exercise (shown in Display z)was to remove health sciences expenses from the"Instruction" and "Academic Support" categories.The University's financial schedule 1-B was used toisolate unrestricted current fund expenditures inthe General Academic programs that are F,ncific tothe health professions. These expenditures werethen extracted from the "Instruction" category oneach campus. In much the same manner, moniesprovided for ancillary support of selected healthprofessions in the "Academic Support" categorywere removed from the expenses reported for thiscategory.
Removing health science-related costs from the "In-struction" and "Academic Support" categories low-ered the systemwide direct instruction per-studentcosts for the 1987 fiscal year (excluding the SanFrancisco campus) by approximately 25 percent andlowers the instructionally related costs per-studentcosts by 18 percent.
The next step was to attempt to remove healthscience-related expenditures in the "Student Ser-vices" category from the calculations. Since thesecosts are not displayed in such a way in which theycan be disaggregated, total full-time-equivalent en-rollment, per campus and as a system, was dividedby the full-idme-equivalent enrollment in healthsciences programs to arrive at the percentage of to-tal full-time-equivalent students who are in thehealth sciences. Expenditures in the "Student Ser-vices" category were then discounted by this per-centage. Campuses with larger health sciences pro-grams, such as Los Angeles and Davis, had their"Student Services" expenditures discounted by sig-nificant amounts, while the effect on campuses withrelatively smaller health sciences programs, likeRiverside and Berkeley, was barely measurable.The average percentage reduction for the Universi-ty as a system (excluding the San Francisco cam-pus) was just over 5 percent.
This second step of removing health science-relatedcosts from the "Student Services" category loweredthe instructionally related per-student costs by an-other 1 percent in the 1987 fiscal year. Including

DISPLAY 2 Current Fund Educational and General Expenditures and Transfers for Campuses ofExpenditures Excluded, Fiscal Years 1986 and 1987
1986
CamPusFTE
Enrollment nstrii_lcatio
Academicalma
DirectInst ructionmrja_mid t
St ude ntattica
Institutionalllama
Berkeley 29,000 $189,382,754 $51,760,890 $8,315 $35,777,676 $56,234,388
Davis 19,093 :.:,004,859 39,271,042 6,666 22,715,217 25,448,766
Irvine 13,753 45,367,288 25,873,410 5,180 15,723,031 21,729,862
Los Angeles 30,527 189,397,194 79,925,038 8,822 30,240,837 62,934,947
Riverside 5,348 35,341,006 11,480,317 8,755 6,795,858 11,218,424
San Diego 15,087 61,319,540 40,982,312 6,781 15,706,292 27448,118
:ian Francisco 3,505 105,707,557 90,080,935 55,860 3,779,632 28,763,812
Santa Barbara 17,159 76,720,507 20,605,175 5,672 19,938,820 21,299,450
Santa Cruz 7,137 37,242,578 9,763,624 6,586 10,089,744 11,958,407
TOTAL 140,609 828,483,283 369,742,743 8,522 160,769,107 267,136,174
TOTAL ExcludingU.CS. F. 137,104 5722,775,726 $279,661,808 $7,312 $156,989,475 $238,372,362
1987
DirectAcademic Instruction Student Institutional
Q.Mag Enrollment In& ton Support or Student Servicq Support
Berkeley 29,412 5204,725,279 $55,898,143 $8,861 $40,136443 $51394,044
Davis 19,842 106,014,019 51,031,250 7,915 23,814,524 23,462,671
Irvine 14,393 69,399,832 37,434,283 7,423 20,321,165 19,880,806
Los Angeles 31,499 225,903,155 84,530,493 9,855 32,366,010 54,994,032
Riverside 6,150 46,999,131 12,597,590 8,715 8,137,847 10,976,953
San Diego 15,471 82,480,165 43,358,321 8,134 17,982,684 25,776,061
San Francisco 3,580 120,293,175 106,628,120 63,386 4,166,389 29,748,657
Santa Barbara 17,018 87,447,670 22,850,476 6,481 12,163,536 16,008,696
Santa Cruz 8,618 37,242,578 11,290,131 5,632 11,857,138 11,438,418
TOTAL 145,983 974,505,004 425,618,807 9,591 180,946,056 243,480,338
TOTAL ExcludingU.C.S. F. 142,403 $854,211,829 $318,990,687 $8,239 $176,779,667 $213,731,681
PlantOz[xicitt
$41,715,398
29,038,854
10,885,311
42,215,538
12,423,157
25,563,037
13,333,418
16,868,436
7,884,535
199,927,684
$186,594,266
Plant02 ration
$43480,511
33,284,043
14,266,447
47,689,070
15,043,243
26,903,302
16,470,568
17,736,373
8,567,187
223,440,744
$206,970,176
Source: California Postsecondary Education Commission staff analysis of data submitted by the University on Part B of the
108BEST COPY AVAILABLE

the "Student Services" calculation, the total healthscience-related reductions from the information inDisplay 1 yield a 25 percent reduction in direct in-struction per student and a 20 percent reduction ininstructionally related costs per student.
The final step in removing the fiscal effects ofhealth science instruction on the University was todiscount the "Institutional Support" and "Plant Op-eration" categories for these expenditures. Withthe assistance of University personnel, the follow-ing method was developed to accomplish this task:First, total full-time-equivalent enrollment at theSan Francisco campus was divided into total expen-ditures into these two categories, separately, to ar-rive at a cost-per-health-sciences full-time-equiva-lent student in both "Institutional Support" and"Plant Operation." For the 1987 fiscal year, thiscost was $8,309 for "Institutional Support" and$4,600 for "Plant Operation." Health science full-time-equivalent enrollment at the remaining eightUniversity campuses was then isolated and multi-plied by the "dollars-per-health science FTE" num-bers derived for the two cost ca tegories at the SanFrancisco campus. This calculation provided a goodapproximation of. the total monies spent in thesetwo categories on health science programs. Finally,these totals were subtracted from the "InstitutionalSupport" and "Plant Operation" categories by cam-pus and for the University as a system in order toaccount completely for health science-related ex-penditures in the "Direct Instruction" and "Instruc-tion Related" cost columns.
This last step of removing health science-relatedcosts from the "Institutional Support" and "PlantOperation" categories lowered the instructionallyrelated costs per-student costs by another 5 percentin 1987. Including this last calculation, the totalhealth science-related refinements from the infor-mation in Display 1 yield a 25 percent reduction inthe University's direct instruction costs per studentand a 24 percent reduction in instructionally relat-ed costs per student.
The initial display for all nine University cam-puses, including health sciences expenditures, showsthe University's average direct instruction cost perfull-time-equivalent student as $12,265 for 1987.When health sciences program costs are not includ-ed, the direct instruction per full-time-equivalentstudent drops to $9,591.
Based on the calculations described thus far to re-move the effects of the costs of health science in-struction from the University's operating cost calcu-lations, the per-student cost that the Commissionhas used for planning purposes is the 1987 fiscalyear instructionally-related cost per student of$11,592 from Display 4.
The highest direct instruction costs of the eight gen-eral campuses in Display 4 were at UCLA, which hada direct instruction expenditure of $9,855 per full-time-equivalent student. The highest instruction-ally related costs -- $14,170 -- were at the Riversidecampus. The size of its per-student costs are due atleast in part to its relatively small enrollment. Thelargest "Instruction" and "Academic Support" bud-gets were found at UCLA and Berkeley, which alsohad by far the highest enrollment levels in the sys-tem.
The California State University
Display 5 on pages 114-115 shows the Current FundExpenditures for the California State University forfiscal years 1986 and 1987 in the expenditure cate-gories discussed earlier. As for the University,Commission staff examined State University fiscaldata for two fiscal years in order to account for one-year fluctuations, and this section focuses on 1987information. Direct instruction per-student expen-ditures at the State University that year rangedfrom a low of $4,189 at the Long Beach campus to ahigh of $5,895 at Humboldt. Unlike health-scienceexpenditures at the University, there were no costcenters that were broken out for exclusion from thisexamination of State University fiscal data.
Examining campus-by-campus cost information inthe State University provides wide range cost pro-files due to the large variety of campuses in the sys-tem. Focusing on the fiscal data from 1987, signifi-cant economies of scale appear to be at work at theLong Beach campus, which at 24,187 full-time-equi-valent students and a cost for direct instruction of$4,189 had the second highest full-time-equivalentenrollment levels and lowest direct instruction costper student in the entire State University system.Little cost consistency is found in the State Univer-sity's more rural campus; Humboldt State had a di-rect instruction expenditure of 1$5,895 -- the highest
(text continued on page 116)
1 107

the University of California, with health Sciences-Related "Instruction" and "Academic Support"
InstructionRelated Costs Public Scholarship Grand
mat udent Research cMce Unr_essriz BautteA TransfeR Total
$12,927 $130 165,251 117,349,040 $7,778,992 $27,244,183 $3,227,055 $580,835,627
10,710 102,352,054 12,861,493 2,986,225 11,068,330 1,776,248 335,523,088
8,695 41,382,348 5,085,946 2,610,580 7,443,970 4,929,293 181,033,039
13,258 151,030,052 26,646,423 10,781,233 26,371,673 8,757,863 628,300,798
14,446 36,750,931 629,837 1,112,612 2,932,540 384,140 119,068,822
11,342 130,438,466 5,674,093 3,583,749 12,107,690 5,822,714 328,746,011
68,9 126,223,154 11,006,180 1,542,768 12,347,705 7,710,195 400,495,356
9,058 30,620,641 3,137,131 3,336,176 8,341,480 788,844 201,656,660
10,780 16,438,538 1,701,048 1,578,928 5,231,085 129,211 102,017,698
12,987 765,601,435 104,091,191 15,311,263 113,088,656 33,525,563 2,877,677,099
$11,556
Instruct ionRelated CO6tSper Student
$13,445
11,975
11,207
14,143
14,269
12,701
77,460
9,767
9,329
14,029
$12,434
$639,378,281 $93,085,011 $33,768,495 19,740,951 $25,815,368 $2,477,181,743
Public Scholarship Grand
Research kdEs lin restrict. Eggicad 'ramie.%
$146,838,927 $23,530,481 $7,255,134 $31,339,127 $13,554,897 $617,953,186
118,955,205 14,629,811 3,279,494 12,969,117 21,081,019 408,521,153
46,809,392 4,436,501 3,167,742 9,554,630 16,071,759 241,342,557
176,829,024 12,438,146 9,266,346 29,703,471 58,835,074 732,554,821
40,157,854 424,227 1,224,301 3,754,919 1,872,156 115,188,221
147,843,749 2,773,414 3,947,263 15,765,927 27,080,039 393,410,925
151,226,334 4,673,943 1,374,260 14,608,760 40,830,738 490,020,944
37,539,858 1,505,154 3,171,096 10,171,222 1,120,511 219,714,592
18,613,808 937,634 1,255,975 6,492,927 473,577 108,169,493
884,814,151 65,349,311 33,941,611 133,860,100 180,919,770 3,346,875,892
6733,587,817 $60,675,368 $32,567,351 $119,251,340 $140,08c ,032 $2,856,854,948
annual federal Department of Education IPEDS finance report on total amount of current funds expenditures and transfers.
109

11.114-10
DISPLAY 3 Current Fund Educational and General Expenditures and Transfers for Camptmes ofExpenditures Excluded and with 'Student Services" Health Sciences-Related Lxpendi-
1986
1987
Camous
Berkeley
Davis
Irvine
Los Angeles
Ftiverside
San Diego
San Francisco
Santa Barbara
Santa Cruz
TOTAL
TOTAL ExcludingLC& F.
FTEEargflmgat jagnsika
29,000 $189,382,754
19,093 88,004,859
13,753 45,367,288
30,527 189,397,194
5,348 35,341,006
15,087 61,319,540
3,505 105,707,557
17,159 76,720,507
7,137 37,242,578
140,609 828,483,283
QM.E.q
Berkeley
Davis
Irvine
Loa Angeles
Riverside
San Diego
San Francisco
Santa Barbara
Santa Cruz
TOTAL
TOTAL ExcludingU.C.S. F.
137,104 $722,775,726
FIBEnrollment Instruction
29,412 204,72.5,279
19,842 106,014,019
14393 69,399,832
31,499 225,903,155
6,150 40,999,131
15,471 82,480,165
3,580 120,293,175
17,011, 87,447,670
8,618 37,242,578
145,983 974,505,004
142,403 $854,211,829
Academic
§2818211
DirectInstructkmper Student
$51,760,890 $8,315
39,271,042 6,666
25,873,410 5,180
19,925,038 8,822
11,480,317 8,755
40,982,312 6,78:
90,080,935 55,860
20,605,175 5,672
9,763,624 6,586
369,742,743 8,522
$279,661,808 $7,312
StudentServkq
Inst it ut icon I
SuovortPlan t
Qssatiat
$34,894,837 $54,846,76,5 $40,686,041
20,665,227 23,152,030 ":6,41a,171
14,6041,910 20,187,534 10,112,701
26,94.0,612 56,066,768 31,608,497
6,736,576 11,120,563 12,314,787
14,666,441 25,724,267 23,870,611
3,779,632 28,763,812 13,333,418
19,938,820 21,299,450 16,068,425
10,089,744 11,958,407 7,884,535
152,320,799 253,119,646 189,097,197
$148,541,167 $224,355,834 $175,763,779
Academickawn
Directlnst ruct ion
per StudentSt udent&dig
Institut iona I
SupportP la nt
Operation
$55,898,143 $8,861 $39,115,723 $49,891,866 $42,374,536
51,031,250 7,915 21,770,293 21,448,643 30,426,952
37,434,283 7,423 18,868,305 18,459,430 13,246,469
84,530,493 9,855 28,968,057 49,220,471 42,682,422
12.597,590 8,715 8,081,278 10,900,648 14,938,672
43,358,321 8,134 16,790,555 24,067,284 25,119,796
106,628,120 63,386 4,166,389 29,748,657 16,470,568
22,850,476 6,481 22,163,536 16,008,696 17,736,373
11,290,131 5,632 11,837,258 11,438,418 8,567,187
425,618,807 9,591 171,781,394 231,184,114 211,562,975
S318,990,687 $8,239 $167,615,005 $201,435,457 $195,092,407
Source: California Postsecondary Education Commission staff analysis of (I ata subrtii/ted by the University on Part B of the
1 10
.114 0144.....11
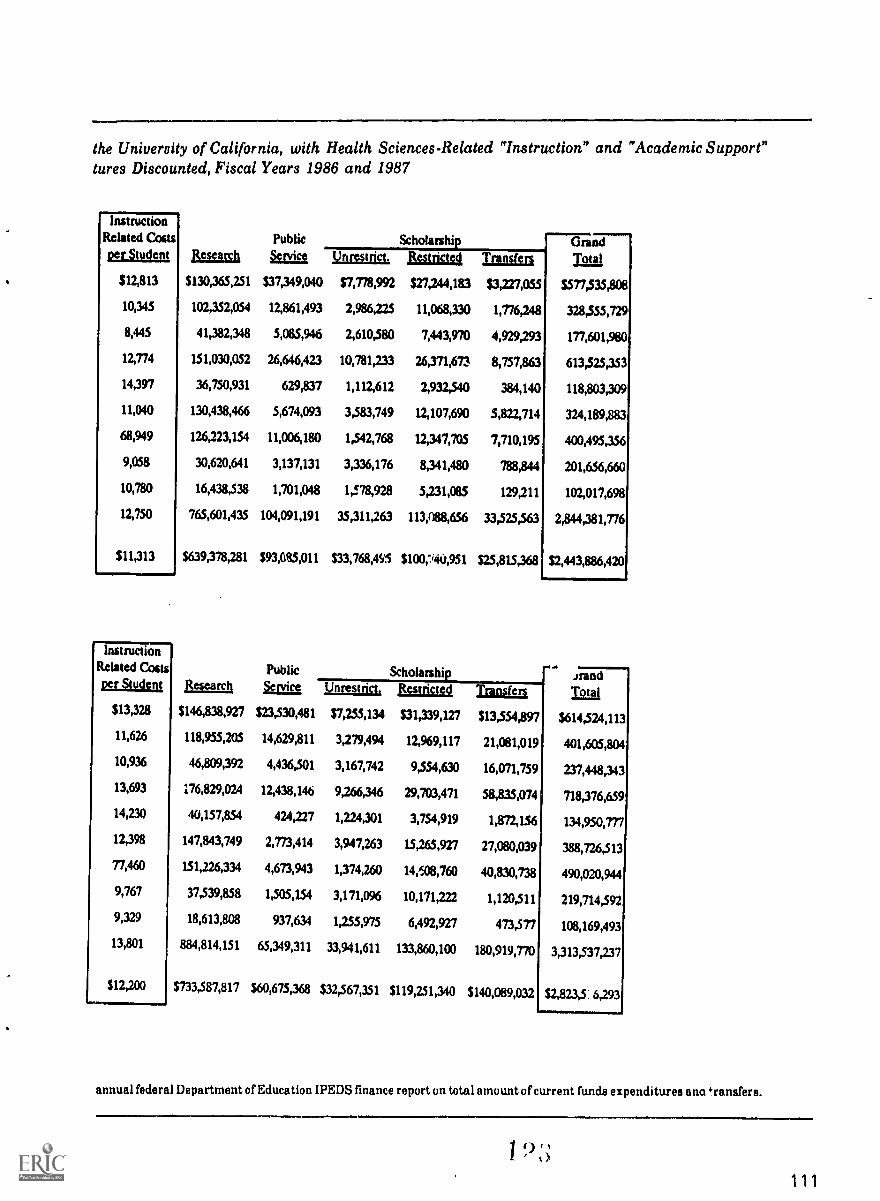
the University of California, with Health Sciences-Related 'Instruction" and "Academic Support"tures Discounted, Fiscal Years 1986 and 1987
IlesearchPublic Scholarshi
InstructionRelated Costs
per StudentGrand
§ratis VALturig, ' c Transfers
$12,813 $130,365,251 $37,349,040 $7,778,992 $27,244383 $3,227,055 $577,535,808
10,345 102,352,054 12,861,493 2,986,225 11,068,330 1,776,248 328,555,729
8,445 41,382,348 5,085,946 2,610,580 7,443,970 4,929,293 177,601,980
12,774 151,030,052 26,646,423 10,781,233 26,371,673 8,757,863 613,525,353
14,397 36,750,931 629,837 1,112,612 2,932,540 384,140 118,803,309
11,040 130,438,466 5,674,093 3,583,749 12,107,690 5,822,714 324,189,883
68,949 126,223,154 11,006,180 1,542,768 12,347,705 7,710,195 400,495,356
9,058 30,620,641 3,137,131 3,336,176 8,341,480 788,844 201,656,660
10,780 16,438,538 1,701,048 1,578,928 5,231,085 129,211 102,017,698
12,750 765,601,435 104,091,191 35,311,263 113,088,656 33,525,563 2,844,381,776
$11,313 $639,378,281 $93,085,011 $33,768,4S1 $100,-.40,951 $25,815,368 $2,443,886,420
ResearchPublic Scholarshi
InstructionRelated COMper Student
JrandLaiEsats Unrestrict, Restricted Transfers
$13,328 $146,838,927 $23,530,481 $7,255,134 $31,339,127 $13,554,897 $614,524,113
11,626 118,955,205 14,629,811 3,279,494 12,969,117 21,081,019 401,605,804
10,936 46,809,392 4,436,501 3,167,742 9,554,630 16,071,759 237,448,343
13,693 176,829,024 12,438,140 9,266,346 29,703,471 58,835,074 718,376,659
14,230 40,157,854 424,727 1,224,301 3,754,919 1,872,156 134,950,777
12,398 147,843,749 2,773,414 3,947,263 15,265,927 27,080,039 388,726,513
77,460 151,226,334 4,673,943 1,374,260 14M8,760 40,830,738 490,020,944
9,767 37,539,858 1,505,154 3,171,096 10,171,222 1,120,511 219,714,592
9,329 18,613,808 937,634 1,255,975 6,492,927 473,577 108,169,493
13,801 884,814,151 65,349,311 33,941,611 133,860,100 180,919,770 3,313,537,237
$12,200 $733,587,817 $60,675,368 $32,567,351 $119,251,340 $140,089,032 $2,823,51 6,293
annual federal Department of Education IPEDS finance report on Wtal amount of current funds expenditures ana 4'ransfers.
1 1 1

DISPLAY 4 Current Fund Educational and General Expenditures and Transfers for Campuses ofInstruction and Administrative Categories Discounted, Fiscal Years 1986 and 1987
1988
CampusFTE
&Wham InstructionAcademic&ma
DirectInstructionper Student
Student§gaissi
Ins t tu tionalSupport
PlantOneratigla
Berkeley 29,000 $189,382,754 $51,760,890 $8,315 $34,894,837 $50,210,811 $38,923,179
Davis 19,093 88,004,859 39271,042 6,666 20,665,227 9,905,639 21,833,863
Irvine 13,753 45,367,288 25,873,410 5,180 14,608,910 13,104,822 6,887,188
11.06 Angeles 30,527 189,397,194 79,925,038 8,822 26,940,612 32,242,606 27,988,153
Riverside 5,348 35,341,006 11,480,317 8,755 6,736,576 10,832,718 12,244,364
San Diego 15,087 61,319,540 40982,312 6,781 14,666,441 18,767,154 21,492,635
San Francisco 3,505 105,707,557 90,080,935 55,860 3,779,632 28,763,812 13,333,418
Santa Barbara 17,159 76,720,507 20,605,175 5,672 19,938,820 21,299,450 16,868,436
Santa Cruz 7,137 37,242,578 9,763,624 6,586 10,089,744 11,958,407 7,884,535
TOTAL 140,609 828,483,283 369,742,743 8,522 152,320,799 197,085,419 167,455,771
TOTAL ExcludingU.C.S. F. 137,104 $722,775,726 $279,661,808 $7,312 $148,541,167 $168,321,607 $154,122,353
1987
IIIONINIIM17=11
DirectFTE Academic Instruction Student Institutional Plant
Campus Enrollment jnstruction §1222n per Student &Lim Support Qperation
Berkeley 29,412 $204,725,279 $55,898,143 $8,861 $39,115,723 $44,812,209 $39,947,160
Davis 19,842 106,014,019 51,031,250 7,915 21,770,293 7,981,736 24,712,907
Irvine 14,393 69,399,832 37,434,283 7,423 18,868,305 10,582,273 9,118,244
Los Angeles 31,499 225,903,155 84,530,493 9,855 28,968,057 24,289,762 30,689,420
Riverside 6,150 40,999,131 12,597,590 8,715 8,081,278 10,619,637 14,845,412
San Diego 15,471 82,480,165 43,358,321 8,134 16,790,555 16,652,032 21,851,714
San Francisco 3,580 120,293,175 106,628,120 63,386 4,166,389 29,748,657 16,470,568
Santa Barbani 17,018 87,447,670 22,850,476 6,481 22,163,536 16,008,696 17,736,373
Santa Cruz 8,618 37,242,578 11,290,131 5,632 11,857,258 11,438,418 8,567,187
TOTAL 145,983 974,505,004 425,618,807 9,591 171,781,394 172,133,419 183,938,985
TOTAL ExcludingU.C.S. F. 142,403 5854,211,829 5318,990,687 $8,239 $167,615,005 $142,384,762 $167,468,417
Source: California Postsecondary Education Commission staff analysis of data submitted by the University on Part B of the
112 124

the University of California, with Health Sciences-Related Expenditues Excluded from the Direct
ReleijahPublic Scholarshi
InstructionRelated Costsper Student
Grand1211awls Unrestnct; Aestricted
$12,592 $130,365,251 $37,349,040 $7,778,992 $27,244,183 $3,227,055 $571,136,992
9,411 102,352,054 12,861,493 2,986,225 11,068,330 1,776,248 310,724,980
7,696 41,382,348 5,085,946 2,610,580 7,443,970 4,929,293 167,293,755
11,678 151,030,052 26,646,423 10,781,233 26,371,673 8,757,863 580,080,847
14,330 36,750,931 629,837 1,112,612 2,932,540 384,140 118,445,041
10,421 130,438,466 5,674,093 3,583,749 12,107,690 5,822,714 314,854,794
68,949 126,223,154 11,006,180 1,542,768 12,341,705 7,710,195 400,495,356
9,058 30,620,641 3,137,131 3,336,176 8,341,480 738,844 201,656,660
10,780 16,438,538 1,701,048 1,578,928 5,231,015 129,211 102,017,698
12,198 765,601,435 104,091,191 35,311,263 113,088,656 33,525,563 2,766,706,123
$10,747 $639,378,281 $93,085,011 $33,768,495 $100,740,951 $25,815,368 $2,366,210,767
Research
Public ScholarshipInstruction
Related Cogsper Student
Grand12atardil Laissaz itestricted Transfers
$13,073 $14,838,927 $23,530,481 $7,255,134 $31,339,127 $13,554,897 $607,017,080
10,660 118,955,205 14,629,811 3,279,494 12,969,117 21,081,019 382,424,851
10,102 46,809,392 4,436,501 3,167,742 9,554,630 16,071,759 225,442,962
12,520 176,829,024 12,438,146 9,266,346 29,703,471 58,835,074 681,452,947
14,170 40,157,854 424,227 1,224,301 3,754,919 1,872,156 134,576,505
11,708 147,843,749 2,773,414 3,947,263 15,265,927 27,080,039 378,043,179
77,460 151,226,334 4,673,943 1,374,260 14,608,760 40,830,738 490,020,944
9,757 37,539,858 1,505,154 3,171,096 10,171,222 1,120,511 219,714,592
9,329 18,613,808 937,634 1,2r 975 6,492,927 473,577 108,169,493
13,207 884,814,151 65,349,311 33,941,611 133,860,100 1841.119,770 3,226,862,553
$11,592 $733,587,817 $60,675,368 $32,567,351 $119,251,340 $140,089,032 $2,736,841,609
annual federal Department of Education IPEDS finance report on total amount of current funds expenditures and transfers.
4111=t1
113

DISPLAY 5 Current Fund Educational and General Expenditures and Transfers for the California
1986
1987
rd110221
BakenfieldChicoDominguez HillsFresnoFullertonHaywardHumboldtLoag BeachLos AngelesNorthridgeF,A01141
S..orament
San Berns dinoSan DiegoSan Francisco
San Jose
San Luis ObispSonomaStanislaus
TOTAL
Ca912-4.
FIEpnrollment bitmaiga
BaketsfieldChicoDominguez HillsFresnoFullertonHaywardHumboldtLong BeachLos AngelesNorthridgePomonaSacramento
San BernardinoSan DiegoSao FranciscoSan Jose
San Luis ObispSonomaStanislaus
TOTAL
3,033
13,026
4,899
14,542
lb,6989,720
5,290
23.562
16,656
20,903
14,966
17,758
.:,346
26,219
18,737
19,090
15,174
4,320
3,392
$13,275,246
48,329,376
21,122,168
57,208,768
55,249,18636 837,420
26,4136,7T1
73,609,006
63,001,378
68,545,442
53,012,410
65,109,989
18,462,655
97,298,155
67,153,044
70,245,054
60,534,110
19,058,782
13,477,401
253,331 4927,816,367
AcademicSutmott
$4,737,405
9,430,204
4,191,283
9,000,495
9,801,133
7,035,470
5,685,800
10,473,287
8,492,699
11,438,537
8,486,705
10,015,049
3,937,522
18,717,483
10,324,908
13,447,138
11,603,632
4,484,24.
3,565,195
190
Direct
per St udeta
$5,939
4,434
5,167
4,553
3,896
4,514
6,044
3,569
4,292
3,826
4,109
4,230
4,194
4,425
4,135
4,384
4,754
5,450
5,024
$4,313
Student
§9.1121
$2,607,317
9,874,994
4,541,953
9,300,741
11,751,499
6,783,812
6,487,205
17,307,580
11,508,891
13,065,329
10,001,254
11,281,264
3,894,541
18,519,520
14,352,388
17,209,476
12,421,91.4
5,156,708
2,297,000
$188,363,386
DirectFIE Academic Instrucdon Student
Ilatmegign, ,51911z .Q.tServCCS3,312
13,331
5,093
14,916
16,811
9,749
5,637
14,187
15,549
20,843
15,500
17,945
6,095
26,819
19,141
19,470
15,480
4,592
3,541
$15,550,259
56 607,012
24 358,104
67,789,363
62,973,141
41,069,358
27,682,26389,104,896
64,507,260
80,181,280
62,290,895
73,682,406
23,774,430
104,849,608
74,178,083
81,055,719
70,901,367
21,288,599
15,876,950
$3,499,491
8,353,133
4,330,175
10,426,547
9,596,295
7,484,850
5,546,702
12,212,225
8,966,909
11,818,438
8,814,614
10,504,283
4,648,940
19,318,821
11,721,472
12,026,665
11,283,216
3,782,587
3,362,246
258,011 $1,057,750,993 $167,697,609AMMO
$5,761
4,8735,633
5,244
4,317
4,980
5,895
4,189
4,725
4,414
4,587
4,691
4,663
4,630
4,488
4,781
5,309
5,4605,433
$3,697,679
13,387,312
4,589,616
11,325,020
9,791,944
6,295,160
6,779,822
20,795,902
12,086,510
12,653,276
11,408,088
12,160,121
4,385,727
17,303,802
16,337,117
15,915,335
11,418,848
4,481,299
3,429,218
Institutional PlantSupport Ooeration
$8,324,337 $2,001,169
19,587,647 5,148,395
12,625,737 2,616,802
23,016,668 5,105,530
27,112,418 4,832,961
15,944,826 4,316,840
12,086,457 3,824,577
26,887,206 11,331,671
27,992,486 4,751,974
35,888,186 4,185,087
24,884,202 5,052,240
24,600,125 5,414,34/11,847,117 1,164ii.4341,401 8,40,4042.5,577,2'n 5,011,048
32,969,322 7,038,568
26,633%7 5,931,570
10,658,519 2,543,293
8,044,031 1,781,542
$417,924,629 $90,962,264
Institutional PlantSupport Operation
. .$5,491,974 3111,195'11,245,654 7,664,747
8,212,739 4,173,767
14,315,209 8,647,345
14,650,075 8,136,1409,976,585 5,962,276
8,513,437 5,244,396
21,463,034 12,399,835
15,131,470 8,825,463
16,362,952 9,397,770
12,644,745 8,986,367
14,133,114 7,407,541
7,989,822 3,962,914
20,807,132 12,964,102
15,762,477 9,293,844
18,139,278 10,910,407
13,233,952 9,209,065
6,393,162 4,059,6835,734,193 2,981,755
$4,750 $198,241,796 $240,201,004 $143,338,612
Source: California Postsecondary Education Commission staff analysis of data submitted by the State University r Part B of the
114

State University, Fiscal Years 1986 and 1987
InstructionRelated Costsper Student
$10,2037,091
9,467,1266,5137,29610,278
5,9256,9496,3696,7786,5567,3567,120
6,5347,381
7,7199,699
8,598
$7,066
Public ScholarshipResearch azigg Unrestrict. Restricte4
$167,571 $66,066787,437 2,918,897
1,050,674 704,167797,976 1,545,801751,350 51,781846,042 0807,962 229,696
2,194,195 1,872,148
1,790,041 1,160,3830 0
429,555 1,897,223
122,267 4,341,6940 59,737
9,420,655 7,443,8511,592,005 1,673,5584,386,741 775,2972,663,107 0
25,140 398,09453,307 2,410
Transfers
$0 $866,026 $172,269
0 3,826,630 1,254,330
0 1,378,338 227,187765,527 4,729,626 713,185
0 5,460,021 27,3880 1,465,989 824,003
12,502 2,390,817 1,389,1810 5,291,390 0
64,639 3,816,854 1,410,328
0 4,692,539 1,220,853
0 3,349,155 707,307
0 5,015,497 571,6440 2,329,433 212,7960 5,705,299 1,132,417
0 4,538,812 2,176,2380 4,181,862 2,079,6940 4,391,057 744,678
19,549 1,202,070 099,202 765,597 133,684
$27,886,025 $25,140,803 $961,419 $65,397,012
InstructionRelated Cosper Student Ilse 1.1.
$9,4757,2%8,9667,5426,2557,2619,5386,4497,0436,2576,7106;169
7,3446,5346,6507,0907,4978,7128,863
$7,004
Public Scholarship
$14,997,182
am:Le UnreStrkja ROM Cteci
$o $o
0 1,185,0440 00 00 0
0 0
0 0
$0 $1,185,044 $68,951,047
$955,041
4,376,2311,421,7084,116,5443,118,6481,652,3422,596,3756,295,0494,397,766.5,203,442
4,031,4934,667,0991,483,9376,078,8225,313,8665,395,7905,482,034
1,432,002932,858
$70,329,603
Transfers
$2,89319
431,9880
5
244,14033
24,310378
600,00021993
00
054,478
00
0
$699,549
G rand
12.41
$32,217,406
101,157,910
. 48,458,309112,184,317115,037,737
74,054,402
59,200,974148,966,483123,989,673
139,035,973
107,820,051
126,471,87341,928,050
210,392,185132,399,278152,333,152
124,923,73343,546,44030,219,369
$1,924,337,277
Grand
TS111
$32,338,532
101,634,10847,538,097
116,620,028
108,266,24872,684,711
56,363,028162,295,251113,915,756
136,217,158108,176,421
122,554,65746,245,770
182,5(17,331
132,606,859143,497,672
121,528,48241,437,33232,317,220
$1,878,744,661
annual federal Department of Education IPEDS finance report on total amount of current funds expenditures and transfers.
1 9 7
115

in the system -- while Chico's per-student direct-.instruction cost was $4,873, which was only $123above the average systemwide per-student cost fordirect instruction in the 19 State University cam-puses studied.
State University campuses in typically high-costareas of the State, such as San Diego, Los Angeles,Long Beach, and San Francisco, all have direct in-struction costs and instructionally related costs be-low the average for the system; this is perhaps afunction of their large enrollments and economies ofstale. For the 1987 fiscal year, the InstructionallyRelated Costs per student (that is, the number com-parable to the $11,592 for the University) is $7,004.
California Community Colleges
Display 6 below shows the cost calculations for cur-rent operations in the California Community Col-leges for the 1986 and 1987 fiscal years. The directinstruction costs for the community colleges in fis-cal year 87 were $1,811 per student, while the in-structionally related costs were $3,071. Due to thelevel of instruction (exclusively lower-division) pro-
vided in the community colleges, and the methods ofinstruction employed (mostly classroom lecture andlaboratory), the per-student instructionally relatedcosts for the community college system are substan-tially lower than at the University and State Uni-versity ($11,592 and $7,004, respectively).
Unfortunately, there is little additional fiscal dataavailable on operating costs in individual communi-ty colleges of the type needed for this study (e.g., bysize and location of campuses, by program empha-sis, by ratio of academic to vocational course offer-ings, etc.). In later research, Commission staff willattempt to obtain and more closely examine expen-diture data in the cost categories covered in thisstudy
Summary
This paper has presented calculations of operatingcosts that are driven, both directly and indirectly,by changes in the numbers of students for the Uni-versity of California, the California State Universi-
DISPLAY 6 Current Fund Educational and General Expenditures and Transfers for the CaliforniaCommunity Colleges, Fiscal Years 1987 and 1986
COLOP.14
ADA
gnrollment ingnwistaAcs Ktemic
lama
DirectInstructionper Student
Student&Jain
Institutional1222911
MontOoeratot
TOTAL 1987 560,192 $856,263,380 $158,425,249 $1,811 $182,213,330 $335,828,197 $187,341,079
TOTAL 1986 6115,031 $981,288,121 $191,951,332 $1,713 $199,241,379 $267,342,799 $223,765,929
lated Coats Public Scholarship Grand
pInstruction
Campus er Student Research Service Unrcstrict, ktiigitt Trans(ers
TOTAL 1987 $3,071
LTOTAL 1986 $2,720 $1,711,698 $36,816,369 $1,385,839 $86,121,985 $20,443,987 $2,010,069,438
Note: The following 15 community college districts out of the 70 existing in 1987 are not included: Chaffey, Coachella Valley, Coast,Compton, Gavilan, Redwoods, Saddleback, San Bernardino, Santa Monica, Sierra Joint, Siskiyou, South County, Ventura, WestHills, and Yuba.
Source: California Postsecondary Education Commission stalTanalysis of data submitted by the California Community Colleges onthe annual federal Department of Education IPEDS finance report on total amount of current funds expenditures and transfers,
116
ty and the California Community College Systems.It explained the fiscal information and methodolo-gies used to calculate the direct instructional costsand instructionally related costs per student andwhat these calculations are mei to show.
The direct instruction and instructionally relatedcosts determined in this study for the three publicsegments appear appropriate to initiate discussions
on what levels of operating costs should be expectedwhen planning for expanded public postsecondaryfacilities in California. Though future refinementsto some of these calculations may be necessary, thecost relationships developed here are accurateenough to be at least relatively close to whatever fi-nal estimates of operating costs are developed forplanning the expansion of the public sector of post-secondary education in California.
117

Issues Related to Year-Round4 College and University Operation
Introduction
A perennial issue facing postsecondary planners iswhether the State should, as a policy matter, pro-mote more efficient use of existing space throughsummer-quarter instruction. Because past experi-ments with summer-quarter instruction have beengenerally unsuccessful, many believe the idea is un-workable. It is, however, incumbent on the Postsec-ondary Education Commission to revisit the area, toexplore whether it can work, whether the savings orprogram benefits justify it, and whether the Com-mission should recommend year-round operation asa policy matter to the segments, the Governor, andthe Legislature.
Differences between summer-quarterand summer-term instruction
"Summer-quarter" instruction is different from"summer-term" instruction: the former is generallypart of "year-round operation," with full-State fund-ing of instruction in all terms; the latter is non-State-funded instruction funded with higher stu-dent fees charged to elfray instructional costs. Atthe present time, all uC and csu campuses operatesummer-term instruction -- that is not funded bythe State. While there is a wide variation betweenthe campuses in summer-term activities, typicallythere are some ofErings of courses -- both require-ments and electives -- for credit, as well as exten-sion or other non-credit instruction. Summer termsare also used for special intensive instructional pro-grams, such as remedial courses offered to studentsin need of special help and residential programs forhigh school students or other populations. Studentfees for sumrtwr-term courses are set to cover thefull costs of operating the classes.
Current summer-quarter programs
Four csu campuses -- Los Angeles, San Luis Obispo,Pomona, and Hayward -- now offer State-supportedsummer instruction. In addition, Humboldt StateUniversity offers a special summer arts program.Enrollments during the summer at these campusestend to be well below those in the other three terms.Both CSU Los Angeles and csu Hayward maintainclose to one-fifth of total enrollments in the summerquarter; but at Pomona and San Luis Obispo,summer-quarter enrollments are below 10 percent.Because these enrollments are lower than for therest of the year, the relative cost to the State forsummer-quarter enrollments is higher than regularinstruction. The majority of summer-quarter stu-dents on all campuses are enrolled for six or morecourse units, suggesting that students are doingmore than picking up a single class.
The State's historywith year-long operation
Although academic calendars in the United Stateshave historically operated on nine- or ten-monthschedules, academic calendars designed to use thefull calendar year are by no means a recent develop-ment. For example, Harvard University operatedfrom 1638 to 1801 on a four-term (quarter system)calendar, and from 1801 to 1839 on a three-term(trimester) system.
In California, the 1955 Restudy of the Needs forCalifornia Higher Education (McConnell, Holy, andSemans, p. 319) included a proposal to increaseplant utilization by moving to year-round opera-tion, either on the four-quarter or trimester system.This policy was reaffirmed in 1960 by the MasterPlan Survey Team, which recommended "the adop-tion of a system or other means which would allow
119

an equal distribution of students throughout thewhole calendar year and thereby make full use ofexisting facilities" (p. 59). Stimulated by analysesthat concluded potentially large capital outlay sav-ings from year-round operations, both the Depart-ment of Finance and the Legislative Analyst urgedsegmental planning to include year-round oper-ations. In June 1963, the Coordinating Council forHigher Education (CCHE) undertook an interseg-mental study of year-round operations. By 1963,the University of California Regents had adopted apolicy to establish year-round operation at the earli-est possible date, preferably through the quartersystem; in early 1964, the State University Board ofTrustees took similar action. This was followedshortly by 9 r 'commendation from the CoordinatingCouncil for the State to fund year-round operationsthrough the four-quarter calendar. The Councilresolution was based on the following assumptions;
1. The cost savings from year-round operations oc-cur when enrollments among the different ses-sions are entirely balanced;
2. Capital outlay savings from full utilization ofthe summer term would be substantial;
3. These capital outlay savings would be offset byincreased operating costs in the summer quar-ter; full-year balanced enrollments were a neces-sary condition to contain these operating costs;
4. There would be one-time conversion costs toyear-round operation, as well as continuing op-erating increases from the increased "cycling"costs of another admissions/matriculation proc-
j.
Implementation of the policy goal of year-round op-eration came slowly. Although operating budgetaugmentations were provided to partially defraythe one-time costs of converting from semester toquarter systems, the State was slow to provide fulloperating budget support in the summer quarter.In 1968, when the Proposition 3 bond measure to ex-pand postsecondary facilities was defeated by thevoters, the segments were pushed to find some wayto economize on space requirements. In 1970, fail-ure to find resources needed to expand capital out-lay led to a change in classroom utilization stan-dards, from 34 to 53 hours per week. This pressurecame largely because of the failure to successfullyimplement year-round operations coupled with the
120
inability of the State to fund needed capital outlayexpansion. By the mid 1970s, the enrollment pres-sures that initially caused planners to look to year-round operations had subsided, and most capitaloutlay appropriations were transferred from newcapacity space to renovation, repair, and new pro-gram costs. Although this situation continues atpresent, enrollment expansion is once again caus-ing State planners to look at year-round operationsas a possibility.
A number of evaluations of year-round operationswere conducted during the past 20 years. The pe-rennial finding of these various studies were:
1. Neither students nor faculty were uni versallyenthusiastic about summer-quarter instruction.Thus, actual summer-quarter enrollments nevermet the projections, and the operating costs ofthe summer session were close to three timeshigher than the rest of the term. These high op-erating costs kept the State from fully fundingthe summer quarter, thereby strengthening theargument against successful year-round opera-tion.
2. Year-round operation tended to work better --e.g., draw more students -- in urban, commute,:ampuses than in residential campuces. In gen-eral, this meant that it was more successful onsome State University campuses than in theUniversity of California.
3. Students who wanted to accelerate the pace oftheir college education continued to endorseyear-round operation.
The fiscal impact of year-round operation
A number of studies of the hypothetical fiscal effectof year-round operation have been conducted overthe years. These studies generally concluded thatyear-round operations force a more efficient use ofspace resources, thus resulting in capital outlaysavings by reducing pressure to build new build-ings. These capital outlay savings are at least par-tially offset by increased operating costs, associatedwith the higher cost of instruction in the summerquarter.
An analytic model to evaluate the question of thesavings and costs of year-round operation was de-

veloped recently by Frank Jewett, director of thePlanning for Growth project for the California StateUniversity. While that study does not reach policyconclusions for or against year-round operations, itis a recent effort to examine the fiscal questionsabout year-round operations that is useful for thiscurrent discussion. There are four components inhis evaluation:
1. Year-round operation promotes a more efficientuse of facilities and reductions in capital outlayexpenditures in growth situations where addi-tional facilities are needed. These reductionsare measured theoretically as the difference be-tween the facilities needed to accommodate agiven amount of growth with and without year-round operation. When facilities are used moreintensively, the need to construct facilities toaccommodate any given level of full-time-equivalent enrollment is reduced, with savingsequaling the cost of facilities that are not built.The effect is to make the capital outlay budgetsmaller than it otherwise would have been. Thesavings are distributed over a period of years asfull-time-equivalent enrollment grows. (Thecapital outlay budget grows but at a lower ratethan if summer-quarter instruction had notbeen implemented.)
2. The additional costs of operating year roundmust be estimated and deducted from the esti-mated savings in Paragraph 1 above. Some ofthe costs will appear in the support budget.These costs should not be confused with the reg-ular costs of instructing a full-time-equivalentenrollment which would occur anyway. The ad-ditional budget costs of the summer quarter arein the support budget permanently.
3. The third component is less precise than thefirst two. Campuses without a summer quarterrun summer sessions for regularly matriculatedstudents as part of their summer session. To theextent that the State-supported summer quar-ter.displaces existing instruction in summersession, the State is paying for instruction thatwould have otherwise been paid for by the stu-dents. There is a commensurate increase in thebudget without an increase in full-time equiv-alent enrollment.
4. If a semester campus converts to the quartersystem before converting to year-round opera-tion, this cost too must be added. Such a conver-sion represents a major effort that requires a re-view and revision of the campus' entire curricu-lum including degree programs, credential pro-grams, and general education. This is an initialcost that must be incurred at least one or twoyears before the summer quarter begins. Basedon the cost of converting California State Uni-versity, Los Angeles to the quarter system inthe 1960s, it would cost $1.6 million per campusin today's dollars for such a conversion.
Both the benefits (cost savings) and costs (addition-al expenses and summer session reductions) occurprospectively over a period of years. To make themcomparable they are discounted to the present timeperiod, i.e., the present values of the benefits andcosts are calculated. The difference between thepresent value of the benefits and the costs is the netpresent value of the project. A positive net presentvalue indicates a feasible project in the sense that ifone borrowed money today at the discount rate, theloan could be repaid and there would be a surplus.The feasibility criterion holds for internally gener-ated funds also. The question then becomes wheth-er to lend the funds at the discount rate or use themto do the project.
The model allows hypothetical costs and savings tobe generated under various scenarios of costs andenrollments. For instance, it calculates the poten-tial savings in capital outlay costs to add facilitiesfor 15,000 full-time-equivalent enrollments if thereis full use of the summer quarter -- e.g., summer en-rollments are one-quarter of total-year enrollments.If summer quarter operations are less, then the sav-ings go down. To these possible savings are addedincreased operating costs of the summer quarter atvarious enrollment levels, as well as the loss of rev-enue from the displacement of full-fee fundedcourses, and the one-time conversion costs of goingfrom three to four-term operations. The net resultof the calculations is that year-round operation canresult in a net cost to the State if enrollments of thesummer quarter are not maintained at close to par-ity with the three other terms.
121
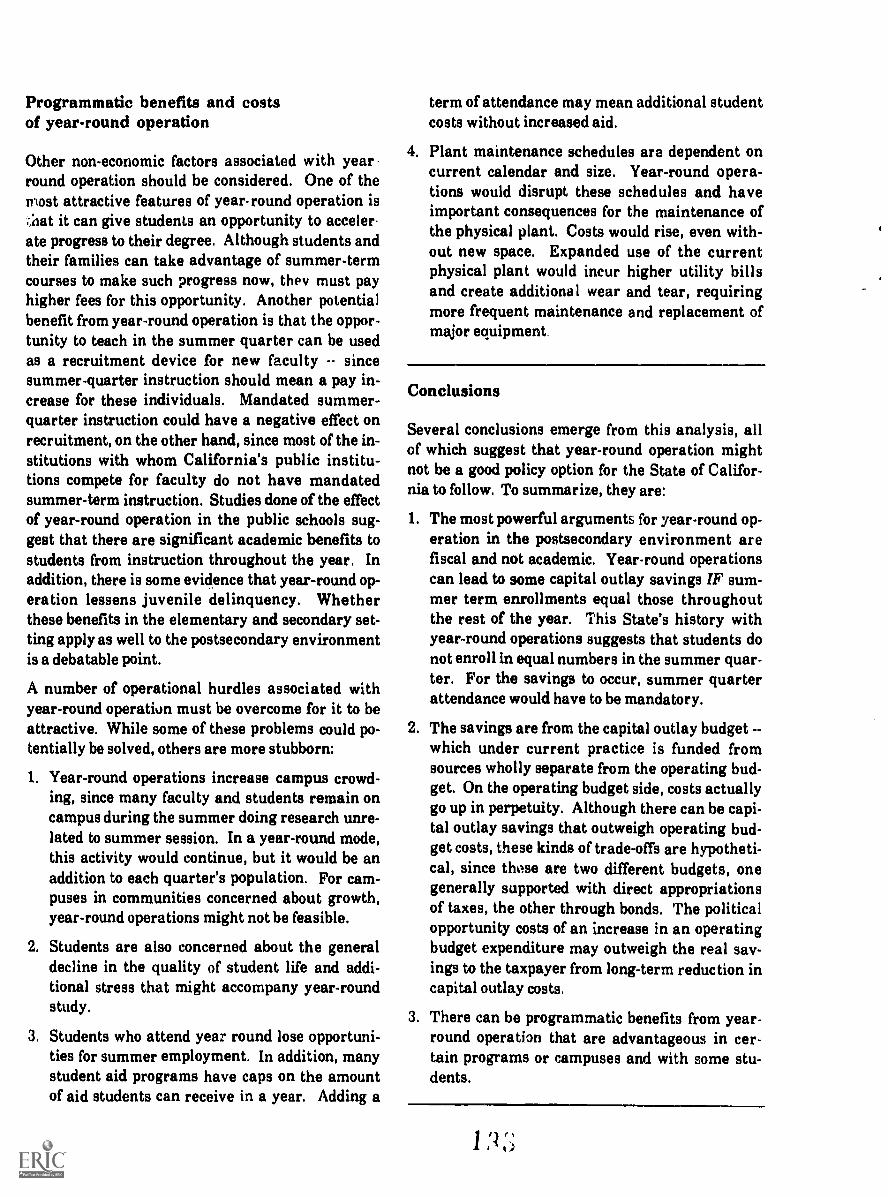
Programmatic benefits and costsof year-round operation
Other non-economic factors associated with yearround operation should be considered. One of themost attractive features of year-round operation is
iat it can give students an opportunity to acceler .ate progress to their degree. Although students andtheir families can take advantage of summer-termcourses to make such progress now, they must payhigher fees for this opportunity. Another potentialbenefit from year-round operation is that the oppor-tunity to teach in the summer quarter can be usedas a recruitment device for new faculty -- sincesummer-quarter instruction should mean a pay in-crease for these individuals. Mandated summer-quarter instruction could have a negative effect onrecruitment, on the other hand, since most of the in-stitutions with whom California's public institu-tions compete for faculty do not have mandatedsummer-term instruction. Studies done of the effectof year-round operation in the public schools sug-gest that there are significant academic benefits tostudents from instruction throughout the year. Inaddition, there is some evidence that year-round op-eration lessens juvenile delinquency. Whetherthese benefits in the elementary and secondary set-ting apply as well to the postsecondary environmentis a debatable point.
A number of operational hurdles associated withyear-round operation must be overcome for it to beattractive. While some of these problems could po-tentially be solved, others are more stubborn:
1. Year-round operations increase campus crowd-ing, since many faculty and students remain oncampus during the summer doing research unre-lated to summer session. In a year-round mode,this activity would continue, but it would be anaddition to each quarter's population. For cam-puses in communities concerned about growth,year-round operations might not be feasible.
2. Students are also concerned about the generaldecline in the quality of student life and addi-tional stress that might accompany year-roundstudy.
3. Students who attend year round lose opportuni-ties for summer employment. In addition, manystudent aid programs have caps on the amountof aid students can receive in a year. Adding a
122
term of attendance may mean additional studentcosts without increased aid.
4. Plant maintenance schedules are dependent oncurrent calendar and size. Year-round opera-tions would disrupt these schedules and haveimportant consequences for the maintenance ofthe physical plant. Costs would rise, even with-out new space. Expanded use of the currentphysical plant would incur higher utility billsand create additional wear and tear, requiringmore frequent maintenance and replacement ofmajor equipment
Conclusions
Several conclusions emerge from this analysis, allof which suggest that year-round operation mightnot be a good policy option for the State of Califor-nia to follow. To summarize, they are:
1. The most powerful arguments for year-round op-eration in the postsecondary environment arefiscal and not academic. Year-round operationscan lead to some capital outlay savings IF sum-mer term enrollments equal those throughoutthe rest of the year. This State's history withyear-round operations suggests that students donot enroll in equal numbers in the summer quar-ter. For the savings to occur, summer quarterattendance would have to be mandatory.
2. The savings are from the capital outlay budget --
which under current practice is funded fromsources wholly separate from the operating bud-get. On the operating budget side, costs actuallygo up in perpetuity. Although there can be capi-tal outlay savings that outweigh operating bud-get costs, these kinds of trade-offs are hypotheti-cal, since those are two different budgets, onegenerally supported with direct appropriationsof taxes, the other through bonds. The politicalopportunity costs of an increase in an operatingbudget expenditure may outweigh the real sav-ings to the taxpayer from long-term reduction incapital outlay costs.
3. There can be programmatic benefits from year-round operation that are advantageous in cer-tain programs or campuses and with some stu-dents.
Bibliography
California State Department of Education. Year-Round Education: Year-Round Opportunities, AStudy of Year-Round Education in California. Sac-ramento, 1987.
California State Department of Finance. IncreasingUtilization of State Higher Education FacilitiesSacramento. December 31, 1970. November 19,1970. California Joint Legislative Budget Commit-tee.
The California State University. Special Report onYear-Round Operation. Los Angeles: Office of theChancellor, California State Colleges, February1970.
--. The Summer Quarter at California State College,Hayward: An Analysis of Year-Round Operationsfor the Pviod 1965-1969. Hayward, California:Trustees for the California State Colleges, February20, 1970.
--. Enrollments and Costs of Year-Round, QuarterSystem, and Semester System Operation in TheCalifornia State University and Colleges: A Reportto the Joint Legislative Budget Committee. LosAngeles: Division of Academic Program and Re-source Planning, Office of the Chancellor, The Cali-fornia State University and Colleges, May 1974.
Coordinating Council for Higher Education. Back-ground Material Concerning the 12-Month Academ-ic Calr:ndar. A Staff Report Prepared for the Tech-nical Committee for the 12-Month Calendar Study.Sacramento: T he Council, September 3, 1963.
--. A Comparison of Trimester and Four-QuarterCalendars for Year-Round Operation of Public
Higher Education in California. Council Report 63-10. Sacramento: The Council, November 26, 1963.
--. Cost Estimates for Year-Round Operations at theUniversity of California and the California StateColleges. Council Report 64-5. Sacramento: TheCouncil, February 25, 1964.
--. Evaluation of Year-Round Operations at the Uni-versity of California and the California State Col-leges. A Report Prepared for the CoordinatingCouncil for Higher Education by Touche, Ross, Bai-ley & Smart. Sacramento: The Council, September1968.
Cowley, W. H A Study of the Relative Merits of theQuarter and Semester Systems. Columbus, Onio:The Ohio State University, May 1932.
Jewett, Frank. 1989 California State UniversityGrowth Plan for 1990-2005: Growth and Diversity,Meeting the Challenge. Long Beach: Office of theChancellor, The California State University, 1989.
Joint Legislative Budget Committee, California Leg-islature. Year-Round Operation of the PublicSchools in California. Sacramento: California Leg-islature, November 19, 1970.
Master Plan Survey Team. A Master Plan for High-er Education in California, 1960 to 1975. Preparedfor the Liaison Committee of the State Board ofEducation and the Regents of the University of Cali-fornia. Sacramento: California State Departmentof Education, 1960.
McConnell, T. R.; Holy, Thomas C.; and Semans,Hubert H. A Restudy of the Needs of CaliforniaHigher Education. Sacramento: California StateDepartment of Education, 1955.
1 '44;
123
ASIV1011,11
The Role of Accredited IndependentInstitutions in Meeting California's
5 Future Enrollment Demand
Introduction
In the past, statewide planning for postsecondaryeducation in California has overwhelmingly focusedon public postsecondary education. To the extentthat planning has been extended to private postsec-ondary education, it has centered on financial aidand the role of aid in providing studbnt access to re-gionally accredited non-profit postsecondary educa-tion.
Until the 1987 review of the Master Plan, the sub-ject of independent postsecondary education was nota focus of State planning, perhaps largely becauseso much of State policy and planning regardingpostsecondary education centers around budgetaryissues, and the State Constitution prohibits directState support to private institutions under ArticleIX, Section 8, as does Article XVI, Section 3. In partbecause of this constitutional prohibition, as well asfor other reasons, the State has chosen to provide in-dependent institutions support attached to studentsin the form of State financial aid, rather than di-rectly to the institutions. The policy goal of theState's financial aid programs has always been two-fold, to provide students with both "access" to post-secondary educath,n and the opportunity to choosewhich Institution to attend. It is thus the studentconsumer, rather than the State, who is the opera-tive determinant of the distribution of financial aidresources, and the State has historically resistedchanging that policy to recognize or make explicitan obligation to assist specific independent institu-tions.
In its final report, the Commission for the Review ofthe Master Plan for Higher Education acknowl-edged the relative silence of State planning with re-spect to independent postsecondary education,while calling for more explicit attention to the ac-credited independent institutions as a significant
piece of the total educational system (1987, p. 3):
The 1960 Master Plan said little about the roleof postsecondary schools, colleges and universi-ties in the accredited private sector. Sincethen, the accredited private sector has alsogrown rapidly and can no longer be left out ofthe plan. In the coming years, the state mustacknowledge the accredited private institu-tions' ability to shoulder much of the increasingdemand for educational services, and the ac-credited private institutions must be encour-aged to accept that responsibility as partners ina unified enterprise.
Because of the potential ability for these institu-tions to contribute in easing the demand for publiceducational services and the need for the State tophysically expand its public institutions, this back-ground Aper addresses the role these institutionscan serve in California's long-range plan for post-secondary education. This paper presents informa-tion on the potential additional physical capacity --or the additional supply of spaces for students --available among these institutions, as well as thepotential student demand for them. The material isorganized as follows: first, it begins with a brief de-scription of the accredited independent sector ofpostsecondary education in California, focusing onthe subset of thoFe institutions which have admis-sions standards comparable either to the Universityof California or the State University. The paperthen reviews enrollment trends by segment of pub-lic and independent postsecondary education inCalifornia over the period 1975 to the present, andidentifies declines in participation for the 21 inde-pendent institutions with admissions standardscomparable to the University of California and atthe same time that increases occurred in the Uni-versity over the period 1984 to the present. Nosimilar trade-off can be seen between the 20 inde-
r125

pendent institutions with admissions standardscomparable to the State University. The relation ofthese enrollments to the increased tuition gap be-tween these institutions is reviewed, and the possi-ble impact on enrollments of increases in Stategrant aid to students in independent institutions isdiscussed.
California's privatepostsecondary institutions
Privately supported postsecondary education inCalifornia encompasses a wide and diverse varietyof institutions. In all, over 2,300 non-State-support-ed postsecondary institutions operate in California-- only 15 percent of them degree granting. Of this15 percent, less than 60 percent -- approximately
195 -- are accredited or candidates for accreditationby agencies recognized by the United States Secre-tary of Education. The remaining 40 percent of thPdegree-granting institutions operate in Californiaunder authorization or approval of the State Super-intendent of Public Instruction.
Of California's 195 private accredited degree-grant-ing institutions, 125 are accredited by its regionalaccrediting agency -- the Western Association ofSchools and Colleges (INASC), the remainder beingaccredited by specialized accrediting agencies. Ofthese 125 regionally accredited institutions, fourare proprietary (for profit). Of the remaining 121regionally accredited, non-profit institutions, 64 aremembers of the Association of Independent Califor-nia Colleges and Universities (AICCu) and enroll ap-proximately 95 percent of the students who are en-rolled at such institutions. Virtually all of the non-
DISPLAY 1 Independtnt California Institutions with Admissions Standards Comparableto Those of the University of California and the California State University
Institutions with StandardsComparable to the University of California
California Institute of TechnologyClaremont McKenna CollegeHarvey Mudd CollegeLoyola Marymount UniversityMills CollegeOccidental CollegePepperdine UniversityPitzer CollegePomona CollegcSt. Mary's College of CaliforniaSanta Clara UniversityScripps CollegeStanford UniversityThomas Aquinas CollegeUniversity of RedlandsUniversity of San DiegoUniversity of San FranciscoUniversity of Southern CaliforniaUniversity of the PacificWestmont CollegeWhittier College
Source: Association of Independent California Colleges and Universities.
Institutions with StandardsComparable to the California Statly,
Azusa Pacific UniversityBiola Ul .,ersityCalifornia Baptist CollegeCalifornia Lutheran CollegeChapman CollegeChristian Heritage CollegeCollege of Notre DameChrist College IrvineDominican CollegeFresno Pacific CollegeLoma Linda UniversityMaster's CollegeMount St. Mary's CollegePacific Union CollegePoint Loma Nazarene CollegeSouthern California CollegeUnited States International UniversityUniversity of La VerneWoodbury UniversityWorld College West
126 1 n

AICCU members are schools offering specialized instruction -- such as the Academy of Art College,American Film Institute, Brooks Institute of Pho-tography, and the California College of PodiatricMedicine, to name a few. The majority of the AICCUinstitutions are comprehensive colleges and univer-sities offering the full spectrum of academic subjectsand disciplines.
Of the 64 AICCU members, 41 have admissions stan-dards comparable to California's public four-yearinstitutions as evidenced by the grade-point aver-ages and murse-taking patterns of their enteringstudents. More narrowly, 21 have admissions stan-dards comparable to the University of California,while the remaining 20 have standards comparablemore to the State University. It should be notedthat these comparable institutions that are listed inDisplay 1 above enroll approximately 85 percent ofall students enrolled in private degree-grantingCalifornia colleges and universities.
Enrollment trends in the comparableinsdtutions and factorl influencing them
The enrollment of California residents in the 41 in-dependent institutions comparable to California'spublic four-year colleges and universities has re-mained relatively constant over the period 1975through 1988, although California resident enroll-ments among those institutions with admissionscomparable to the University of California have de-clined since 1984. While enrollments at the StateUniversity-comparable institutions have fluctuatedfrom 15,000 to 17,000 annually, with Fall 1988 en-rollments at the high end of that scale, theUniversity-comparable institutions in 1988 en-rolled about 10 percent fewer Californians thanthey had only four years earlier.
In an effort to obtain an understanding of the fac-tors that influence the enrollment and hence par-ticipation rates of the independent institutions,Commission staff analyzed numerous demographicand economic variables that may have played a rolein this phenomena. As Display 2 indicates, the an-nual percentage change in the independent partici-pation rate closely tracked the annual change in thenumber of high school graduates until 1983. Thissame demographic trend can also be seen in com-paring the change in the participation rate with the
DISPLAY 2 Annual Percentage Change in theNumber of California High School Graduatesand in the Participation Rate of CaliforniaResidents in IndepeAdent InstitutionsComparable to the University of California andthe California State University, 1977-1988
6.00%
4.00% Percent Change in Number
of Hilb School Graduates
Percent Chugs in PartiMpation Rata
-4.00%
1977 1978 1979 1980 1961 1982 1963 1964 1965 1986 1987 1988
Source: California Postsecondary Education Commissionstaff analysis.
change in the 18-29-year-old State population. Inshort, it appears that prior to 1983, the participa-tion rate of the independents could be determinedrelatively accurately from the number of highschool graduates or the number of 18-29 year olds.However, since 1983 that is not the case.*
After considerable analysis, the data indicate thats:nce 1983 a number of interrelated factors influ-enced the independent institutions' participationrate. Primary among these factors are the tuitionfees charged by these institutions and the amount ofState, federal, and institutional financial aid avail-able to attend them. Because of the complexities ofthe financial aid distribution system and the multi-ple sources from which these funds are derived, de-veloping a clear understanding of exactly which ofthese factors is influencing the independents' par-ticipation rate is difficult to determine definitively.
4' The participation rate for each segment was developed bytaking California .esident enrollment in each segment anddividing by the cumulative number of California high schoolgraduates during the previous four-year period. The state-wide participation rate was developed by taking the totalnumber of California residents enrolled in California's fourhigher education segments and dividing by the cumulativenumber of California high school graduates during the pre-vious four-year period. The annual and indexed percentagechanges were then calculated from these numbers.
127

The one question that the data is able to answerwith a significant level of certainty is where stu-dents who would have previously attended a Uni-versity-comparable independent institution arenow going to obtain a higher education. Display 3below shows that while the cumulative independentparticipation rate stabilized after 1983 and then be-gan to decline in 1986, the University of Californiacumulative participation rate continued to increaseover the entire period. Hence, this data suggeststhat students who would have attended a Universi-ty-comparable independent institution had it beenmore affordable are opting to attend one of the sig-nificantly lower-cost publicly supported Universityof California campuses. Thus, California's Univer-sity-comparable independent institutions are losinga portion of their market share to the University ofCalifornia. The data do not show similar aggregatetrade-offs between the State University-comparableindependent institutions and State University en-rollments. Although staff plan to do further re-search into the relation between price and enroll-ments for these students, at this time, the focus ofthe inquiry has thus been confined to the Univer-sity-comparable independent institutions.
While this analysis assists in understanding thechanges that have occurred in the University-comparable independent institutions' enrollmentlevels, it fails to answer the question of whether thenumber of students opting to attend such institu-tions would increase given an increase in the State's
DISPLAY 3 Indexed Percentage Change inParticipation Rates for California's Four-YearPostsecondary Education Segments, 1977Through 1988 ,
UG Inds. GSU SW* Nab.
Source: California Postsecondary Education Commissionstaff analysis.
128
maximum Cal Grant A award. The following sec-tion addresses this quostion.
11111111,=
Impact of increases in the maximumCal Grant A award on University-comparable independent institutionenrollment levels
In 1989, the State established a policy for adjustingthe maximum Cal Grant A award for students at-tending California's independent colleges and uni-versities. That policy calls for the maximum grantto be equivalent to the estimated average StateGeneral Fund cost of educating a student at one ofCalifornia's public four-year colleges or universi-ties. The formula for determining the estimatedaverage State General Fund cost includes (1) theaverage cost of instruction and academic support asdetermined by the California State University non-resident tuition methodology, plus (2) the averageUniversity and State University systemwide andcampus-based fees. In 1989-90, this formula wouldhave provided a maximum Cal Grant A award ofapproximately $6,200, but the State providea fund-ing for a maximum grant no greater than $5,250. Ifthe State were to increase its funding to provide themaximum Cal Grant A award called for by the ad-justment policy, how many students would opt to at-tend a University-comparable independent institu-tion rather than a public one? As noted earlier, it isdifficult to answer this question with any level ofcertainty because of the interrelated economic fac-tors influencing the enrollment decisions of stu-dents. However, statistical analysis assuming thatpast University-comparable independent enroll-ment trends continue suggests that the increaseddemand -- the number of additional students whowould opt to attend -- would equal approximately1,500 new students each year at the University-comparable independent institutions if the maxi-mum Cal Grant A award is increased to the levelcalled for by the adjustment policy. In developingthis estimation, Commission staff conducted regres-sion analybis which simulated the effect on enroll-ments if the full amount proided by the adjustmentpolicy was the actual level of the grant award. Ac-cording to this analysis and other observed enroll-ment patterns, it is expected that these new stu-dents would attend one of the University-compa.
(4t

rable independent institutions rather than one ofthe University of California campuses. (For a dis-cussion of the methodology used in the regressionanalysis, please see the methodological note on page134.)
In summary, this analysis indicates that the needfor expanding the University of California could bereduced by approximately 6,000 full-time-equiva-lent students per year (1,500 students multiplied byfour years) by increasing the maximum Cal GrantA award and thereby utilizing current and projectedcapacity in the University-comparable independentinstitutions. The two questions that result fromthis finding are whether the independent institu-tions have sufficient capacity -- supply -- to accom-modate an increase in enrollment -- demand --should the maximum Cal Grant award be funded atthe level called for by the adjustment policy, andwhether it is actually cost effective for the State toencourage these students through the increasedgrant to attend a University-comparable indepen-dent institution rather than a public one.
Capacity available in boththe University- and State University-comparable independent institutions
The Association of Independent California Collegesand Universities has surveyed its members with ad-missions standards comparable to those at the Uni-versity and State University to determine their fu-ture expansion plans and potential available capac-ity -- additional supply. Display 4 on page 130shows the additional potential available capacity --supply -- at the University-comparable independentinstitutions.
The Association reports that Loyola MarymountUniversity, Pepperdine University, Saint Mary'sCollege of California, the University of Redlands,the University of Southern California, and the Uni-versity of San Francisco each plan to expand theircurrent enrollment by between 100 and 300 stu-dents by 1995. In all, by 1995 the independent in-stitutions with University-comparable admissionsstandards plan to enroll approximately 1,300 morestudents than they presently do.
In addition to this expansion, these institutionsmay also have room for additional California resi-
dents by changing the composition of their studentbodies. Over the past several years, California's ac-credited independent institutions have increasedthe number of California nonresidents they enroll --
primarily because of the declining coverage of max-imum Cal Grant A awards. In 1978, Cal Grant Aawards coveted approximately 71 percent of theiraverage tuition and fees, but by 1988, that percent-age had declined to about 47 percent. With that de-cline came a marked decrease in the number ofCalifornia residents that enroll in these institu-tions.
The Association of Independent California Collegesand Universities estimates that if these institutionsreturn to enrolling the peak number of Californiaresidents they enrolled over the past 12 years, theywill be able to accommodate an additional 6,100California residents. Combining this change incomposition with their present unutilized capacityand planned expansion means that these institu-tions would have the capacity -- potential additionalsupply to enroll nearly 10,500 more Californiaresident students in 1995 than they presently do.
Moreover, these institutions are in the process of re-viewing their potential expansion plans beyond1995. They estimate that if the maximum CalGrant award increases to the level called for by theexisting adjustment policy and if other favorablemarket conditions exist, they would be willing andable to expand their physical capacity to accommo-date an additional 3,700 students. If these expan-sion plans are implemented, it would bring the totalpotential added capacity -- additional supply -- ofUniversity-comparable independent institutions toover 14,000.
Capacity and expansion plans -- potential addition-al supply -- for the State University-comparable in-dependent institutions are shown in Display 5 onpage 131. As the display indicates, learly all of theState University-comparable insti, Yams plan toexpand over the next five years. This expansion isprojected to provide space to accommodate some4,700 additional students. In addition, these insti-tutions could also return to enrolling larger per-centages of California residents which could resultin space for an additional 2,000 California residentstudents. Combining this change in compositionwith their present unutilized capacity and plannedexpansion means that these institutions have thecapacity -- potential additional supply -- to enroll
1 41 rd129
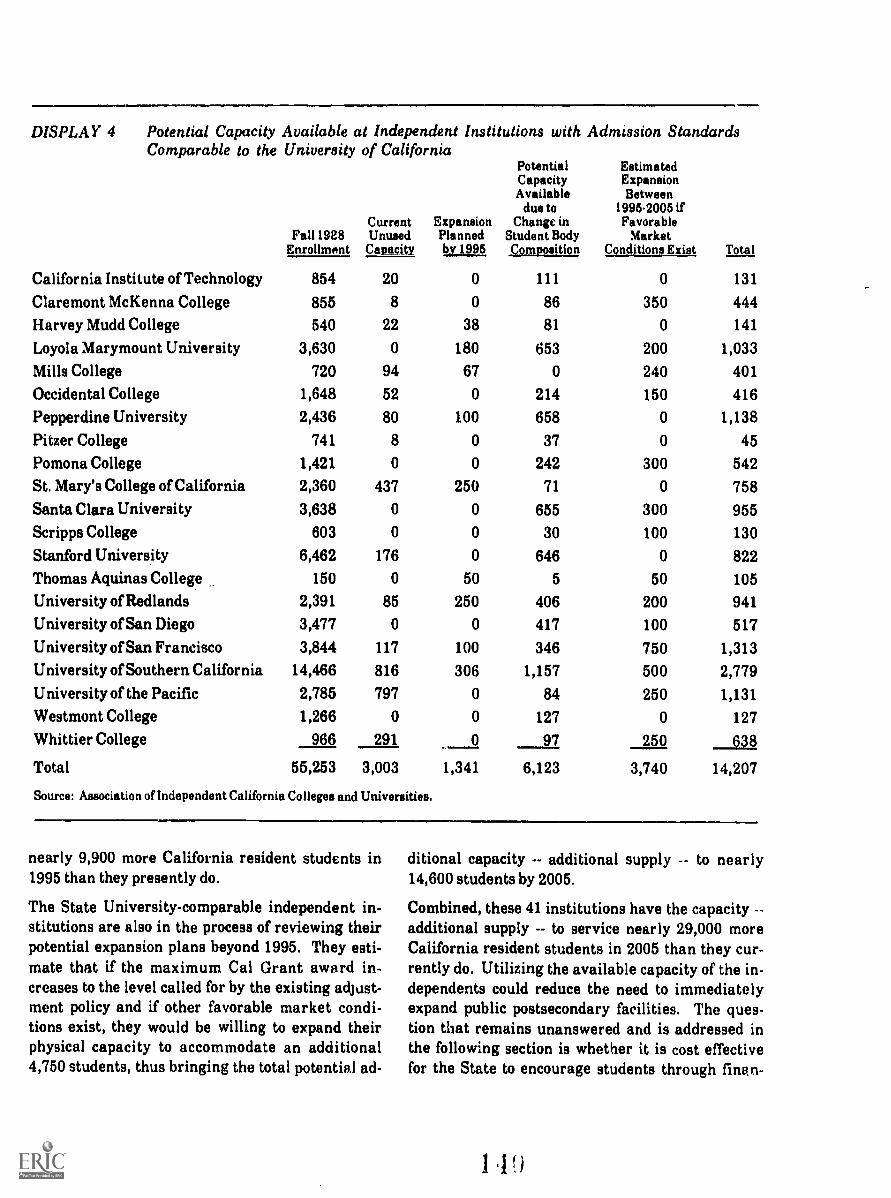
DISPLAY 4 Potential Capacity Available at Independent Institutions with Admission StandardsComparable to the University of California
Fall 1928Enrollment
CurrentUnused
Capacity
ExpansionPlanned12L110.
PotentialCapacityAvailabledue to
Change inStudent BodyComposition
EstimatedExpansionBetween
1995.2005 ifFavorable
MarketConditions Exist Total
California Institute of Technology 854 20 0 111 0 131
Claremont McKenna College 855 8 0 86 350 444
Harvey Mudd College 540 22 38 81 0 141
Loyola Marymount University 3,630 0 180 653 200 1,033
Mills College 720 94 67 0 240 401
Occidental College 1,648 52 0 214 150 416
Pepperdine University 2,436 80 100 658 0 1,138
Pitzer College 741 8 0 37 0 45
Pomona College 1,421 0 0 242 300 542
St. Mary's College of California 2,360 437 250 71 0 758Santa Clara University 3,638 0 0 655 300 955
Scripps College 603 0 0 30 100 130
Stanford University 6,462 176 0 646 0 822Thomas Aquinas College 150 0 50 5 50 105University of Redlands 2,391 85 250 406 200 941
University of San Diego 3,477 0 0 417 100 517
University of San Francisco 3,844 117 100 346 750 1,313
University of Southern California 14,466 816 306 1,157 500 2,779University of the Pacific 2,785 797 0 84 250 1,131
Westmont College 1,266 0 0 127 0 127
Whittier College 966 291 0 97 250 638
Total 55,253 3,003 1,341 6,123 3,740 14,207
Source: Association of Independent California Colleges and Universities.
nearly 9,900 more California resident students in1995 than they presently do.
The State University-comparable independent in-stitutions are also in the process of reviewing theirpotential expansion plans beyond 1995. They esti-mate that if the maximum Cal Grant award in-creases to the level called for by the existing adjust-ment policy and if other favorable market condi-tions exist, they would be willing to expand theirphysical capacity to accommodate an additional4,750 students, thus bringing the total potential ad-
130
ditional capacity -- additional supply -- to nearly14,600 students by 2005.
Combined, these 41 institutions have the capacity --
additional supply -- to service nearly 29,000 moreCalifornia resident students in 2005 than they cur-rently do. Utilizing the available capacity of the in-dependents could reduce the need to immediatelyexpand public postsecondary facilities. The ques-tion that remains unanswered and is addressed inthe following section is whether it is cost effectivefor the State to encourage students through linen-
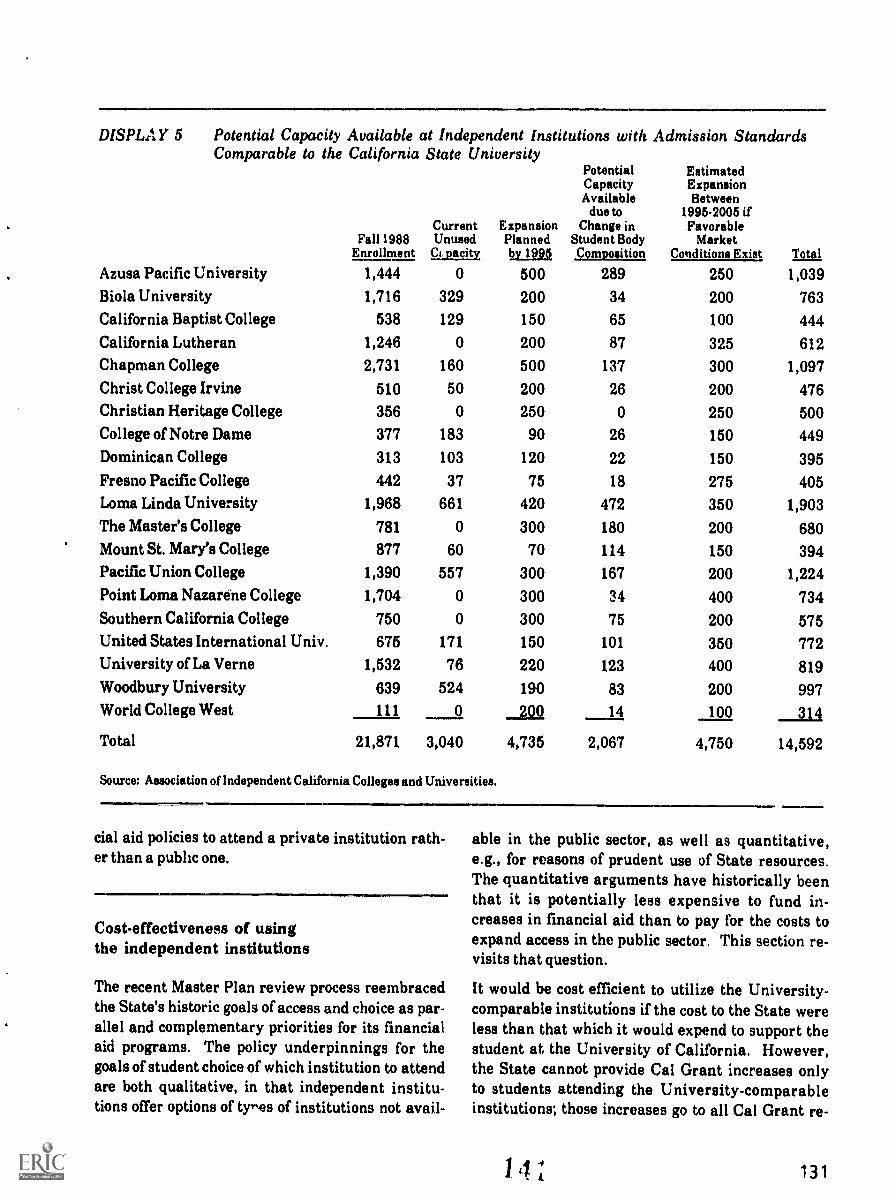
DISPLAY 5 Potential Capacity Available at Independent Institutions with Admission StandardsComparable to the California State University
Fall 1988Enrollment
CurrentUnused
CI pacity
ExpansionPlannedby 1995
PotentIalCapacityAvailable
due toChange in
Student BodyComposition
EstimatedExpansionBetween
1995-2005 ifFavorable
MarketConcitismEtist Total
Azusa Pacific University 1,444 0 500 289 250 1,039Biola University 1,716 329 200 34 200 763California Baptist College 538 129 150 65 100 444California Lutheran 1,246 0 200 87 325 612Chapman College 2,731 160 500 137 300 1,097Christ College Irvine 510 50 200 26 200 476Christian Heritage College 356 0 250 0 250 500College of Notre Dame 377 183 90 26 150 449Dominican College 313 103 120 22 150 395Fresno Pacific College 442 37 75 18 275 405Loma Linda University 1,968 661 420 472 350 1,903The Master's College 781 0 300 180 200 680Mount St. Mary's College 877 60 70 114 150 394Pacific Union College 1,390 557 300 167 200 1,224Point Loma Nazarene College 1,704 0 300 34 400 734Southern California College 750 0 300 75 200 575United States International Univ. 675 171 150 101 350 772University of La Verne 1,532 76 220 123 400 819Woodbury University 639 524 190 83 200 997World College West 111 0 200 14 100 314
Total 21,871 3,040 4,735 2,067 4,750 14,592
Source: Association of Independent California Colleges and Universities.
cial aid policies to attend a private institution rath-er than a public one.
Cost-effectiveness of usingthe independent institutions
The recent Master Plan review process reembracedthe State's historic goals of access and choice as par-allel and complementary priorities for its financialaid programs. The policy underpinnings for thegoals of student choice of which institution to attendare both qualitative, in that independent institu-tions offer options of tres of institutions not avail-
IMINIM.111=1M
able in the public sector, as well as quantitative,e.g., for reasons of prudent use of State resources.The quantitative arguments have historically beenthat it is potentially less expensive to fund in-creases in financial aid than to pay for the costs toexpand access in the public sector. This section re-visits that question.
It would be cost efficient to utilize the University-comparable institutions if the cost to the State wereless than that which it would expend to support thestudent at the University of California. However,the State cannot provide Cal Grant increases onlyto students attending the University-comparableinstitutions; those increases go to all Cal Grant re-
131

DISPLAY 6 Costs to the State of Increasing the Maximum Cal Grant A Award to the LevelCalled for by the Adjustment Policy to Redirect 1,500 Students Each Yearto Independent Institutions
Year
Numberof CurrentRecipientsEligibile
for Increasein Award
Amountof AwardIncrease
TotalCost toProvideIncrease
to CurrentRecipients
Number ofAdditionalPotentialStudents
Amountof Grant
TotalCost for
RedirectedStudents
TotalCost of
UtilizingIndependentInstitutions
1 12,233 $1,289 $15,768,079 1,500 $6,539 $9,808,500 $25,576,579
2 12,233 $1,289 $15,768,079 3,000 $6,539 $19,617,000 $35,385,079
3 12,233 $1,289 $15,768,079 4,500 $6,539 $29,425,500 $45,193,579
4 12,233 $1,289 $15,768,079 6,000 $6,539 $39,234,000 $55,002,079
5 12,233 $1,289 $15,768,079 6,000 $6,539 $39,234,000 $55,002,079
6 12,233 $1,289 $15,768,079 6,000 $6,539 $39,234,000 $55,002,079
12,233 $1,289 $15,768,079 6,000 $6,539 $39,234,000 $55,002,079
8 12,233 $1,289 $15,768,079 6,000 $6,539 $39,234,000 $55,002,079
9 12,233 $1,289 $15,768,079 6,000 $6,539 $39,234,000 $55,002,079
10 12,233 $1,289 $15,768,079 6,000 $6,539 $39,234,000 $55,002,079
Total 1-10 $157,680,792 $333,489,000 $491,169,792
Total 6-10 $78,840,396 $196,170,000 $275,010,396
Note: All figures are in 1990 dollars.
Source: California Postsecondary Education Commission staff analysis.
cipients in all independent institutions. Thus, theanalysis hinges on the costs to increase the CalGrant maximum award to students at all indepen-dent institutions versus the costs of expanding ca-pacity in the University to accommodate 1,500 stu-dents a year. Display 6 above and Display 7 cr. thefollowing page compare the costs of these two alter-natives -- increasing the Cal Grant A award to en-courage 1,500 students to attend an independent in-stitution rather than the University of California.
Display 6 shows the costs associated with increas-ing the maximum Cal Grant A to encourage 1,500students each year to attend an independent insti-tution rather than a public onek, Presently some13,532 students attending California's independentcolleges and universities are eligible for a Cal GrantA award. Of those, approximately 90 percent(12,233) are eligible for the maximum award and as
132
such if the maximum Cal Grant A award were in-creased those students would likely be eligible to re-ceive that increase. The 1990-91 propised Statebudget provides a maximum Cal Grant award of$5,250, but the adjustment policy calls for a maxi-mum of approximately $6,539. Thus, to fund theCal Grant A awards at the level called for by the ad-justment policy, each current recipient who receivesthe maximum award would receive an increase ofapproximately $1,289. Therefore, to fund the awardincrease for the current recipients would cost theState approximately $15.7 million. The costs asso-ciated with bringing new students to the programwho otherwise might opt to attend a public institu-tion is the full imount of the maximum grant --
$6,539. It should be noted that during the firstyear, 1,500 additional students would receive amaximum Cal Grant to attend an independent in-stitution and that that number grows at 1,500 per

DISPLAY 7 Costs to the State of Supporting 1,500 New Students Each Year at the Universityof California
Number of Additional Students Total Cost of UtilizingYear at the University of California Cost to Support Each Student the University of California
1 1,500 $18,589 $27,883,500
2 3,000 $18,589 $55,767,000
3 4,500 $18,589 $83,650,500
4 6,000 $18,589 $111,534,000
5 6,450 $18,589 $119,899,050
6 6,450 $18,589 $119,899,050
6,450 $18,589 $119,899,050
8 6,450 $18,589 $119,899,050
9 6,450 $18,589 $119,899,050
10 6,450 $18,589 $119,899,050
Total 1-10 $998,229,300
Total 6-10 $599,495,250
Note: All figures are in 1990 dollars.
Source: California Postsecondary Education Commission staff analysis.
year until the fifth year, since students are eligibleto receive a Cal Grant award for four years only.Hence the costs to the State of redirecting new stu-dents to independents and away from a public insti-tution, begins at $9.8 million in the first year andtops off at $39.2 million in the fourth year. (Itshould be noted that all figures are in 1990 dollars.)Hence the total cost to the State of utilizing the ca-pacity of the independents (both the cost to increasethe award for current grant recipients and the costassociated with the new grant recipients) is ap-proximately $55.0 million per year in the fourthyear and beyond.
Display 7 shows the costs to the State if these 1,500students per year enrolled in the University of Cali-fornia rather than attending an independent insti-tution. The total State cost per full-time-equivalent(rrE) student of $18,589 is derived by adding the$11,592 in support cost per FT% student (see Back-grouni. Paper 3) plus $6,264 in capital outlay costper FTE student (see Background Paper 2) plus $733in financial aid cost per FTE student (it was assumed
that some of the students would be eligible for Statefinancial aid and that by taking an average of the fi-nancial aid awards coming from State GeneralFunds to these students would result in this amount).Under this scenario, in the first year 1,500 addition-al students would be enrolled at the University,while by the fourth some 6,000 additional studentswould be enrolled. The number of students contin-ues to increase in the fifth year but tops out in thatyear. Since University support is based on the num-ber of units in which a studat enrolls and not onheadcount, each student enrolling beyond the nor-mal 180-units required for graduation adds a par-tial FTE to the University's budget and hence in-creases the costs to the State. The partial rrEs asso-ciated with the 1,500 students enrolling in an aver-age of 10 units beyond the 180-unit graduation re-quirement translates into approximately 450 addi-tional rrE, which have been added to the 6,000 baseFTE in the fifth year. It should be noted that whileundergraduates at the University take approxi-mately five years on average to graduate with theirbaccalaureate degrees, that does not mean the Uni-
. )133
versity receives five years worth of support for thestudent since funding is on an rrE basis. Therefore,the timing of the State expenditures shown in Dis-play 7 are n...t completely accurate and should bedistributed over a longer period of time, but the to-tal cost to the State to educate the same number ofstudents as in the previous alternative is accurate.
In comparing the cost to the State of the two alter-natives, using the capacity of the independents isapproximately half as costly as supporting the stu-dents at the University. Hence, utilizing the inde-pendent institutions can be seen as a cost-effectivealternative.
Conclusion
In summary, this analysis indicates that the needfor expanding the University of California could bereduced by approximately 6,000 fhll-time-equiva-lent students per year in the long-run by increasingthe maximum Cal Grant A award to the level calledfor by the State's existing adjustment policy. Undercertain market conditions, the University-compa-rable independent institutions will have a supply ofover 10,000 additional seats by 1995, and if themaximum Cal Grant A award is increased, demandfor those seats will equal approximately 6,000 stu-dents. It should be noted that not only is the use offinancial aid to redirect students to the independentinstitutions a cost-effective approach for accommo-dating enrollment demand, it is already called for inexisting State policy.
Methodological note
In conducting the regression analysis, Commissionstaff regressed California resident enrollment inthe 41 University- and State University-compa-rable independent institutions against the percent-age that the maximum Cal Grant A award of theprevious year covered of total average tuition andfees charged during the previous year. The percent-age from the previous year was used because enroll-ment decisions typically are made prior to knowl-edge of the actual maximum Cal Grant award forthe period in which enrollment will commence.Data for all 41 University- and State University-
134
comparable independent institutions was used forthe following calculations since at the time of thispublication disaggregated data for the 21 Univer-sity-comparable independent institutions exclusiveof the 20 State University-comparable data was un-available. During the coming months, Commissionstaff will disaggregate the University-comparabledata from the combined data so that the full effectsof an increase in the Cal Grant A award on enroll-ment in University-comparable independent insti-tutions can be seen. It is expected that the effect ,fthis increase on enrollment in those institutionswill be greater than that estimated using all 41,since enrollment in the State University-compar-able independent institutions was increasing at thesame time the percentage the maximum Cal GrantA covers of average tuition and fees was decreasing.Hence, the estimate in the following analysis likelyunderestimates the full impact of the increase onthe University-comparable independent insItu-dons. Once disaggregated data is available, Com-mission staff will recompute the regression equa-tion and, usirg that revised equation, recalculatethe impact of a grant increase on those institutions.
The analysis resulted in the &flowing regressionequation:
Resident enrollment in independent institu-tions = 44,321+ 3572 x (% Cal Grant A coversof average independent tuition and fees).
Assuming 1988 enrollment decisions (the latest pe-riod for which resident enrollment data was avail-able) were based on knowledge of the Cal Grantaward level of the previous year, this analysis uses1987-88 Cal Grant A award levels to determinewhat 1988 California resident enrollment in the in-dependents would have been had the Cal Grant ad-justment policy been in place at that time and beenfully funded.
The adjustment policy would have provided a maxi-mum Cal Grant A award of $5,533 in 1987-88 --59.82 percent of the weighted average 1987 inde-pendent tuition and fees of 49,250.
Plugging the 59.82 percent into the regressionequation, we obtain 46,458 -- the estimated 1988California resident enrollment in the independentshad the maximum Cal Grant award been deter-mined by the current adjustment policy.

Fall 1988 independent California resident enroll-ment was 45,121. Therefore this analysis suggeststhat an additional 1,336 California residents wouldhave enrolled in the independents had the maxi-mum Cal Grant award been at the level prescribedby the current Cal Grant adjustment policy.
In addition, an additional price response coefficientcould be added to this equation because parents andstudents over time become more aware that theState is committed to funding a given portion of theindependent tuition and fees. While the actualnumber that should be added is difficult to predict,staff estimates that as many as 400 additional stu-dents per year may be drawn to the independent in-stitutions as a result of the State's continued sup-port in funding Cal Grants at the level called for bythe existing adjustment policy.
Henceanywhere from 1,300 to 1,700 new studentseach year will be drawn to the independent institu-tions as a result of a change in the State's support ofthe maximum Cal Grant A award for students at-tending independent institutions. Multiplyingthese figures by four, (the approximate time takento earn a baccalaureate ckgree at the independentinstitutions) means that the independent institu-tions could enroll between 5,200 and 6,800 morestudents than they currently do who may have oth-
erwise opted to attend a lower cost publicly support-ed institution had the Cal Grant not been funded atthe level called for by the adjustment policy.
References
California Postsecondary Education Commission."Cost Estimates and Simulations for Capital OutlayPlanning." Technical Background Paper 2, Techni-cal Background Papers for Higher Education at theCrossroads: Planning for the Twenty-First Cen-tury. Commission Report 90-2. Sacramento: TheCommission, January 1990.
--. "Cost Estimates and Simulations for OperatingBudgets." Technical Background Paper 3, Techni-cal Background Papers for Higher Education at theCrossroads: Planning for the Twenty-First Cen-tury. Commission Report 90-2. Sacramento: TheCommission, January 1990.
Commission for Review of the Master 1314n r rHigher Education. The Master Plan ReneweJ: Uni-ty, Equity, Quality, and E fficieney in California .Post-secondary Education. Sacramento: The Commis-sion, July 1987.
1 .r;
135

Joint or Shared Use of Facilities inHigher Education in Selected States
Major approaches
States have used two main approaches to joint orshared higher education facilities -- the location oftwo or more public institutions on one site and anarrangement for use by one institution of the facili-ties or land (or both) that are owned or under thecontrol of another institution on its own or an adja-cent site. This may also entail construction of a spe-cial new facility for joint use, as well as, the use ofspace in an existing facility. In the first case, all in-stitutions are in a sense "tenants" on a common site,and, in the latter, one institution often is the "ten-ant" on the site or in the facilities "owned" by an-other.
In addition to sharing a site or facilities, institu-tions are likely to glare certain services that bothneed -- for example, maintenance, counseling andother student services, library and instructionaltechnology, and computers. In regard to personnel,the institutions may also share some facuI4 ei-ther by means of concurrent student enrollment orthe use of specialized faculty to teach each other'scourses.
Another dimension of shared or joint use facilities isthe status of the institutions that are involved;ranging from an autonomous institution with itsown governing board to an independently accredit-ed campus of a college or university system, to anoff-campus center of a college or university. Branchcampuses and off-campus centers may offer either alimited number of credit courses that are applicableto a degree or an upper-division or graduate pro-gram that enables students to meet all degree re-quirements.
Scope of the paper
This paper offers examples of these two major ap--proaches to shared facilities that are drawn from
other states, followed by a brief description of Cali-fornia's experience
The higher education center model
Examples are drawn from three states -- Colorado,Illinois, and New York -- of multi-institutional ar-rangements for using a common site for their in-structional and, in some instances, research activi-ties. They differ significantly in regard to the impe-tus for establishing these centers, the nature of theinstitutions that are involved, and their mecha-nisms for funding.
Colorado
The Auraria Higher Education Center in Denver,Colorado, is probably the foremost example of jointfacilities that are utilized by three diverse institu-tions of higher education on a single site -- the Uni-versity of Colorado in Denver, Metropolitan StateCollege, and the Community College of Denver.The Colorado legislature took steps to establish theCenter in 1970 in appropriating planning money forthe development of the complex as a means of ex-panding access to public higher education and relat-ed services for residents of the urban metropolitanDenver area. (The main campus of the Universityis of course in nearby Boulder, the Community Col-lege was then a multi-campus institution, and Met-ropolitan State College was a new institution tomeet the special needs of underserved groups inDenver.)
The legislature's intent and expectations were thatthe Center offer a broad range of programs to a di-verse urban population while achieving more effec-tive utilization of facilities than was likely if the in-stitutions operated in separate, uncoordinated fa-cilities. In 1972, the legislature affirmed its intentto move ahead with the development of the Centerbut with utilization standards that were more "in-
146 137

tensive" for classrooms, faculty and administratoroffices and library stations than were in effect state-wide for other institutions. Furthermore, the legis-lature specified that no provision of space should beplanned for (1) courses that were not part of a de -gree or certificate program and (2) what it regardedas nonessential research activities.
In addition to its original declaration regardingshared facilities, the legislature in 1978 also direct.ed the Center to pursue the consolidation of servicesin the areas of computers, disabled student services,institutional research, career counseling, and anyadditional functions related to student services thatthe Center might propose in the future.
The Center was formalized in statute in 1974, withthe provision that its administration should man-age the facilities and grounds, allocate space, oper-ate auxiliary and support services, develop long-range plans, and foster cooperation among the par-ticipating institutions and their governing boards.Because of uncertainty about future higher educa-tion enrollments in Colorado, the legislature in1975 kept the initial cap of 15,000 FTE on the Cen-ter's enrollment for purposes of both constructionand operational support, but by Fall 1988, head-count enrollment had reached a total of more than29,000 -- about 10,000 in the University, 15,600 inthe State College, and 3,300 in the Community Col-lege -- or slightly more than 18 percent of the totalstate public institutions' headcount.
The Center is located on a 170-acre site in down-town Denver. Metropolitan State College -- thelargest of the three institutions -- offers only under-graduate degrees and certificates while the Univer-sity of Colorado at Denver offers botn undergrad-uate and graduate work -- the latter enrolling about30 percent of its students. New transfer studentsare a slightly larger group than first-time freshmenbut continuing and returning students comprise afar larger proportion of the student body at each in-stitution. Each institution makes its own operatingbudget request through its respective governiugboard although the Center administration workswith the three campuses during the year to deter-mine their need for funding in future budget re-quests. The Center administration has its own bud-get that is the responsibility of the Auraria board.
Not surprisingly, there is some duplication of un-dergraduate programs offered by the two baccalau-
138
reate degree-granting institutions -- 13 last year,mostly in the liberal arts and sciences. The maincommunity college in Denver is now at the Centerand is a comprehensive institution.
The Center complex continues to function as origi-nally intended, having survived a Colorado Cornmission on Higher Education staff recommendationin November 1988 that the two baccalaureate insti-tutions be replaced by a single comprehensive uni-versity to meet the unique needs of the Denver met-ropolitan area and that the Community Collegemove its operation to a different site; all of this re-sulting from a consultant report in September 1988on the management of the Center.
The only notable change that followed these propos-als for change that were made in late 1988 has beenin the governance structure of the Center a prob-lem since its inception. Membership on the Center'sboard was changed by reducing the number of ap-pointments by the Governor from four to three andadding the chief executive officers of the three insti-tutions, while retaining a representative from eachof the three governing boards -- thus increasing thenumber of members from seven to nine.
The Center has space for additional facilities butconstruction is hampered by a requirement that itscapital out:ay plan encompass all three institutions-- a requirement with which the University has notat this time complied. Its new governance structuremay alleviate some problems that characterized thepast and, in any case, the Center appears destinedto succeed in terms of serving diverse students inColorado's capital, in spite of negative attitudes andopinions that have been expressed by Universityadministrators and others who wish that the Center-- as conceived by the legislature nearly 20 yearsago -- would fail and be replaced by a single institu-tion.
Illinois
The Illinois legislature in 1972 enacted the HigherEducation Cooperation Act that appropriates fundsannually to the Illinois Board of Higher Educationto make grants to groups of postsecondary institu-tions for the purposes of (1) encouraging interinsti-tutional cooperation, (2) making efficient use ofeducational resources, (3) extending access to edu-cational pograms and services, and (4) developinginnovative concepts. The current appropriation to
i 4 7

the Board is $8.545 million -- having increased from$3.910 million for 1985-86 and with a still largeramount to be requested for 1990 91
A major outcome of the cooperative program is theestablishment of multi-institutional off-campus cen-ters often on community college sites -- to makeeducational opportunity available at the upper-division and graduate levels in centers of population that do not have nearby public university cam.puses These programs may also (1) include continuing education and research; (2) involve bothpublic and private institutions, together with busi.ness, industry, and appropriate federal installa-tions; and (3) extend across state lines -- for exam-ple, into Iowa in the quad-cities project.
An example of the nine projects for which the Boardmade grants in 1987 is the multi-institutional cen-ter in the western Chicago suburbs that includesthe College of Du Page (a community college),Northern Illinois University, the University of Illi-nois, and the Illinois Institute of Technology (an in-dependent degree-granting institution). The grantfollowed the submission of a needs assessment re-port that reviewed, the demographic, economic, andeducational characteristics of the area and its needfor additional educational resources. Prior to thisgrant, the Board had authorized several indepen-dent institutions to offer certain degree programsoff campus on the campus or in the district of thecommunity college.
The first-year grant was used primarily for the pur-chase of equipment for a computer laboratory. Astate budget shortfall slowed progress in developingthe Center but second-year funding was used to (1)remodel space at the College for classrooms and thecomputer lab, (2) begin scheduling classes and pro-vide assistants for the new lab, and (3) continue co-operative planning to stimulate the delivery of off-campus programs and develop support services ap-propriate to scientific and technological disciplines.The center requested nearly three-quarters of a mil-lion dollars in Cooperation Act funds for the currentfiscal year to remodel additional space for class-rooms on the College campus, construct scientif-ic/technology labs, fund access to library services,and provide basic administrative services. Coursesthat the baccalaureate degree-granting institutionswill begin to offer include engineering technology,
computer science, electrical and mechanical engi-neering, and business.
There are now 14 members of an expanded WestSuburban Regional Academic Consortium thatcompleted an extensive needs-assessment study andis now coordinating plans to meet additional needsfor advanced training and education that will in-volve businesses and corporations, as well as resi-dents of the area.
Perhaps best-known of these cooperative projects isthe Quad-Cities Graduate Study Center -- a consor-tium of nine postsecondary institutions that servesand is supported by both Illinois and Iowa. Local in-stitutions are liberal arts and community collegesbut three Illinois universities offer off-campus pro-grams in the area as part of the nine-member con-sortium that was incorporated in 1969.
A needs-assessment study that the National Centerfor Higher Education Management Systems com-pleted for Western Illinois University in 1986 led tothe establishment of the Rock Island Regional Un-dergraduate Center in 1987 to serve this urbanarea, with approval to offer three off-campus pro-grams at the baccalaureate level in the fields ofbusiness and elementary education. As in an exam-ple cited earlier, a revenue shortfall in Illinoisslowed the development of the Center's programs infiscal 1988 but planning for full o:..rations contin-ues with a new budget proposal for 1989.
New York City
The Graduate School and University Center -- un-der the governing board of the multi-campus CityUniversity of New York -- is a rather unique consor-tial arrangement under which the senior institu-tions in the system jointly offer graduate degreeprograms that are centrally administered at theCenter in mid-town Manhattan. The Center housesa library that meets the special needs of doctoralstudents in the humanities, social sciences, andmathematics; a computer center with both a main-frame and a microcomputer laboratory; foreign lan-guage instruction to help graduate students meettheir language requirements; classrooms; and of-fices for faculty and administrators. The Centeralso provides facilities for more than a dozen re-search institutes in such areas as labor and man-agement policy, and European studies.
139

The Graduate School faculty is drawn from the var-ious City University campuses, except for a fewwhose affiliation is solely with the Center. Bothmaster's and doctoral degree programs are offeredin Cefiter facilities in fields that do not require spe-cialized equipment and facilities, with courseworkin the latter fields offered on campuses with appro-priate facilities but administered through the Cen-ter.
The major purpose of this consortial arrangement isto assure high quality and avoid duplication ofgraduate education by pooling resources from all in-stitutions in the City University to support them.
Joint or shared-use facilities
The second type of cooperative use of facilities ofteninvolves a "tenant" and "owner" relationship -- thatis, one institution leasing or otherwise arranging touse facilities located on another's campus. Exam-ples can be found of locating a community college inthe facilities of a comprehensive four-year institu-tion but the much more common approach involvesuniversity use of community college sites and facili-ties to offer upper-division and graduate work lead-ing to degrees.
Use of community college sites and facilities by uni-versities for off-campus programs has two major ad-vantages. The first is the likelihood that communi-ty colleges are located within relativdy easy reachof most residents of a state and are thus accessibleto adults who cannot relocate close to a universitybecause of family or career constraints. The secondadvantage is the ease with which "2 + 2" articula-tion can be accomplished when a baccalaureatedegree-granting institution offers resident upper-division instruction on a community college cam-pus. Various states that are making plans to ex-pand their higher education systems appear to beusing their two-year colleges to provide initial ac-cess to baccalaureate-degree programs, at least inpart by means ofjoint-use facilities.
The disadvantages to the "tenant" institution arealso evident -- inadequacy of specialized equipmentand library resources, difficulty in recruiting or as-signing first-rate faculty, and lack of control over
140
the assignment of space and access to shared sup-port services.
Florida
Florida probably has had the clearest history ofjoint-use facilities for postsecondary education un-der legislative direction The statute was first en-acted in 1976 and authorized school districts to es-tablish cooperatively joint use educational facilitiesfor instruction with special .,tate funds. The statutewas amended in 1977 to include the University ofFlorida system, the community colleges, and theFlorida School for the Deaf and the Blind. It statesquite simply that the boards of two or more publicinstitutions shall (1) adopt a joint resolution that in-dicates their commitment to the utilization of thejoint-use facility that they are requesting, and (2)submit it and certain background information tothe state's Commissioner of Education. It alsospecifies that no more than 50 percent of the fundsthat will be required for the facility shall come fromthe Public Education Capital Outlay fund that isappropriated for this purpose and is administeredby the Commissioner, and that the remaining fundsshall be provided by the boards -- state funds in thecase of postsecondary institutions that are a part ofthe University's or the community colleges' owncapital outlay programs.
The statute is brief in regard to intent and proce-dures but both have been elaborated and revised bythe Commissioner over time so as to tie joint-use fa-cility planning to capital outley and other long-range planning generally. Procedures now involvethe Florida Postsecondary Education PlanningCommission as well as the state office for the com-munity colleges, the University of Florida Board ofRegents, and local college trustees.
The general purpose of the statute is to enable thepublic universitie s to offer "affiliated and coopera-tive programs" in various locations so as to take ad-vantage of the strength of established programswhile providing expanded access -- in simple terms,to offer upper-division programs leading to a bacca-laureate degree on or adjacent to community collegecampuses at some distance from the universities, inspecial facilities that are constructed for this pur-pose. Five of Florida's six regional universities --
1 4 ;1

established more than two decades ago as upper-division and graduate institutions -- have been theprimary participants in this joint-use facilities pro-gram. (Little off-campus instruction for credit is of-fered by the University of Florida, Florida StateUniversity, and Florida A. & M University - both ofthe latter located in the state capitol and the Uni-versity in north central Florida )
Nine such arrangements for joint use of facilitieswere described in a Florida Postsecondary PlanningCommission report that was published in 1985.These involved five regional universities and sevencommunity colleges on eight campuses. Amongthem are the Broward Community College campuswith a special facility used by both Florida Atlanticand Florida International Universities, and the twocampuses of Palm Beach Junior College with ar-rangements with Florida Atlantic. Sites and facili-ties may also be shared by two community collegesunder this statute and a Florida Commission reportin 1986 encouraged the consideration of this optionby colleges that were planning new campuses orcenters. Community colleges also have joint-use fa-cilities agreements with public school districts un-der this statute but these are not discussed here.
Three examples ofjoint-use facilities arrangementsare described below.
Broward Community College and Florida Atlanticand Florida International Universities: Recogniz-ing the need for public university programs and ser-vices in the Fort Lauderdale area, Florida AtlanticUniversity offered off-campus upper-division andgraduate courses on the central campus of BrowardCommunity College and elsewhere with a specialstate appropriation for this purpose beginning in1981. The following year funds were appropriatedfor the construction of a joint-use tower in down-town Fort. Lauderdale on land leased from the Com-munity College for one dollar per year that is alsonear the county library. The tower facility was partof an agreement that provided for joint use not onlyby Florida Atlantic and the Community College butalso by Florida International University for upper-division and graduate offerings.
The nearly $10 million for construction of the towercame from the University system's capital outlaybudget, rather than the special joint-use facilitiesfund, with the impetus for the project coming fromFlorida Atlantic University. However, with the ex-
ception of the method of funding and the inclusionof the county library in the multi.institutionalagreement, the project does not appear to differ fun-damentally from the specially funded joint-use fa-cilities projects in Florida. The University's earlyexperience in contracting with the Community Col-lege for space and services before construction of thetower was helpful, as these institutions moved intothe more complex joint-use facility project and oper-ational problems now appear to have been largelyovercome.
In its 1989 session, the Florida legislature autho-rized and appi opriated new funds for the construc-tion of what is to be a branch campus of Florida At-lantic University on the central campus of BrowardCommunity College. Operation of the branch is tobegin in portable buildings while permanent facili-ties are being constructed. Degree programs will beprimarily at the upper-division and graduate levels,with the Community College offering most of thelower-division coursework. The University willthus be offering courses on two sites in this Commu-nity College district and may seek funding for theconstruction of a second tower on the downtownsita, although Florida International Universitymay cease operations there. However, the two uni-versities are expecting to share still another down-town building that is owned by Florida Atlantic butas a research center, rather than a classroom facili-ty.
Palm Beach Junior College and Florida AtlanticUniversity: Palm Beach Junior College has devel-oped two joint-use facilities agreements with Flor-ida Atlantic University. The more conventional oneinvolves construction of a joint-use facility on thenorth campus of the College, using proceeds fromthe sale of land owned by the University that are tobe added to the value of the site that the Collegecontributed, and matched by the state's specialjoint-use facilities fund. This project also evolvedout of a long period of cooperation between the twoinstitutions in providing academic services to thecounty's residents.
The second example is the use of the main campusof Florida Atlantic University in Boca Raton byPalm Beach Junior College as its south campusThe University's offerings were limited until re-cently to upper-division and graduate work and theCollege provided college-preparatory and univer-

sity-parallel courses at the lower-division level, aswell as some vocational coursework. In late 1982,the College shifte4 from total dependence on theUniversity's facilities to leasing land from the Uni-versity on which it was able to place some portableclassrooms and construct some permanent facilities.However, Lhe College students continue to have ac-cess to such University facilities as science labora-tories, the library, and recreation.
University of Central Florida and Brevard and Day-tona Beach Community Colleges: Two joint-use fa-cilities agreements into which the University ofCentral Florida has entered are designed to extendits upper-division and graduate offerings beyond itsmain campus in Orlando to residents of the Cocoaand Daytona Beach areas. In both instances, theconstruction of a special joint-use facility followed along period of cooperative educational endeavors inwhich the University engaged with each communi-ty college.
Impetus for the Lifelong Learning Center on the Co-coa campus of Brevard Community College camefrom that institution's seeing the potential for serv-ing the county's residents with needs beyond the as-sociate degree -- needs that the University assessedover a period of years. The University provides thefaculty and administration for its programs, andwith admissions, registration, and financial aidfunctio performed through computer linkage toits nw in campus. The College provicles ancillaryservices. The operation is regarded as a model forother joint-use facilit,:s and is a key part of the Uni-versity's long-range planning.
The Daytona Beach project was modeled on the Co-coa facility although the University also had a longhistory of cooperative educational endeavors withthis College oefore they proposed a joint-use facility-- at first at no charge in the College's facilities butalso in a building that the University owned on adifferent site. Funding of the two institutions' joint-use facility on the College campus was contingenton the sale of the University's building in DaytonaBeach, the proceeds from which were to be used forpartial funding of the new joint-use facility. Justifi-cation for the new facility included the College'sneed for additional space on its campus, as well asthe University's need for a permanent facility inthat city. The cooperative plan that the institutionsdeveloped makes good use of the College's pre-
142
existing service facilities such as its bookstore andcafeteria, as well as maintenance and other ser-vices.
Washington State
Washington is well served by its 27 public community colleges but its four-year colleges and universi-ties provide only limited access to upper-divisionand graduate programs because of the location oftheir campuses. Access to such programs has beenextended by means of cooperative off-campus operations -- an approach that has for the most part beenafrirmed and expanded in a recent consultants' re-port to the Washington Higher Education Coordi.nating Board. These off-campus operations oftenlipiolve independent colleges and universities aswell as Washington's public institutions, and insome cases take place in community college facilities.
What is probably the oldest and largest example ofa multi-institutional, off-campus project in Wash-ington is the five-university consortium in the tri-cities area (Paseo, Kennewick, and Richland). Dat-ing back to 1946, it became the Joint Center forGraduate Study in 1958 and expanded in the 1970sto offer undergraduate education in fields otherthan engineering. This became the Tri-Cities Uni-versity Center in 1985. with five universities par-ticipating in its offerings and may now expand itsfacilities and programs as a branch campus ofWashington State University.
Other examples of current operations include (1)Central Washington University's off-campus pro-grams offered in the facilities of Yakima ValleyCommunity College; (2) the Southwest WashingtonJoint Center for Education in Vancouver that co-ordinates the rogram offerings of Evergreen StateCollege, WasLington State University, and Clarkand Lower Columbia Community Colleges -- an op-eration that has been using the facilities of ClarkCollege; and (3) the multi-institutional upper-division and graduate offerings in the Olympia-Tacoma area, using the facilities of Tacoma Com-munity College. (The conversion of several ofWashington's off-campus centers to branch cam-puses of particular state universities was proposedin the consultants report but legislative action to doso is not yet certain.)
I 5 1

Arizona
One of three state institutions, Northern ArizonaUniversity is planning a major off-campus opera-tion on a campus of Arizona Western College -- a5,500-student, public community college in Yuma.The project will extend opportunities for upper-division and graduate work to residents of the area.This development is viewed as a cost-effective alter-native to Arizona State University's new West cam-pus in Phoenix, with no sacrifice in quality of pro-grams and support services.
Summary comments
Florida's community colleges and regional universi-ties have incorporated joint-use facilities into theirshort- and long-term capital outlay planning sincethe 1970s, based on the state's strong commitmentto using it.3 community colleges as the principalpoint of access for lower-division students. Thestate offers an incentive for joint-use facilities byappropriating a special capital outlay fund on a50/50 matching basis for projects approved by theCommission of Education. At the same time, thelegislature severely limits lower-division enroll-ments in the regional universities. That the joint-use facilities program has b-en at least moderatelysuccessful is demonstrateu by the findings that (1)cooperative use of facilities predates special fundingfor construction of joint-use facilities in many in-stances, (2) some institutions have continued to usetheir own system's capital outlay funds to constructsuch facilities, and (3) the universities have agreedto limit their offerings to upper-division and gradu-ate work at their off-campus centers.
How well the joint-use facilities arrangements workin Florida and elsewhere depends on the goodwill ofthe administrators who are directly involved sincethere is a kind of tenant-owner relationship, withthe community college almost always the "owner"and provider of a range of important ancillary ser-vices. In any case, this alternative to self-containedsites for university branch campuses and off-campus centers that wculd duplicate communitycollege ancillary services and facilities appears tobe a permanent part of the planning by severalstates for the expansion of access to public highereducation, with full-time faculty and full course-sh:...ek for some degree programs in the larger facili-ties.
1
California's past and presentexperience with shared facilities
The California State University has had at leastthree kinds of shared-use facilities that began whenit was a collection of state colleges under the StateBoard of Education. These three ty pes are (shared campus with what were then junior colleges,(2) off-campus centers on what are now communitycollege campuses, and (3) shared use of facilitieswith the University of California
Shared campuses
New state colleges were in some instances "housed"on junior college campuses before their own facili-ties were built on a different campus site in thesame metropolitan area. Three examples of this ar-rangement are California State University, Sacra-mento -- then Sacramento State College -- first onthe campus of Sacramento City College; CaliforniaState University, Fresno -- then Fresno State Col-lege -- first sharing a campus with Fresno City Col-lege; and California State University, Los Angeles-- then Los Angeles State College -- located at firston the Los Angeles City College campus.
grf-campus centers
The State University has a long history of offeringcourses for credit and degree programs on campusesand in facilities of other educational institutions --
often community colleges in locations that aresomewhat distant from any State University cam-pus. The Commission does not maintain a currentinventory of off-campus centers but a few examplesof well-established centers are:
The Stockton Center: Located on the campus ofSan Joaquin Delta College, California State Uni-versity, Stanislaus, leases several classrooms forits off-campus programs and has been doing sofor about 17 years.
The Mission Viejo Satellite Campus: CaliforniaState University, Fullerton, will begin offeringprograms in facilities leased from SaddlebackCollege in Fall 1990.
The Palm Desert Center: California State Uni-versity, San Bernardino, leases facilities fromthe College of the Desert on its campus in theCoachella Valley.
143

In the only joint-uze facility that was constructedby the State for this purpose, the California StateUniversity, San Francisco, leases the top floor ofthe eight-story downtown center of the San Fran-cisco Community College District, where it offersboth credit and noncredit courses.
Shared use involving the University
While the University does not generally engage inoff-campus center operations, two examples ofshared-use facilities with the State University are:
The Bishop Ranch: The University and the StateUniversity both use a facility maintained by theContra Costa Community College District in thesouthern part of that county for extension pro-grams.
The Ventura Center: The University of Califor-nia, Santa Barbara, and the California StateUniversity, Northridge, jointly operated an off-campus center in Ventura for about 15 years be-fore it became solely a State University facility.
Other examples: The University and the State Uni-versity cooperate in two additional functions thatare peripherally related to joint-use facilities. Thefirst is the shared use of special research facilities --at Moss Landing in northern California and in theSouthern California Ocean Studies Consortium. Thesecond example involves the joint doctoral pro-grams in which University doctoral students enrollin the State University for a substantial part oftheir coursework an arrangement that the StateUniversity also has made with some independentinstitutions.
Conclusions
Four conclusions may be drawn from this brief anal-ysis of joint- or shared-use facilities in selectedstates that are planning to expand to accommodateprojected growth in higher education enrollments.Additional conclusions could be drawn but these arethe most relevant to planning in California:
1. For residents of underserved areas, expansion ofopportunity to work toward R degree from a pub-lic university is usually at the upper-divisionand graduate levels, with states continuing todepend on their two-year institutions to offer the
144
first two years of the baccalaureate degree tomany or most of their students.
2. In planning for growth and expansion, states areturning more to joint-use facilities on estab-lished campuses than to educational centers thatwould house two or more new institutions, withthe most common model being the establishmentof a university off-campus center or branch forupper-division and graduate programs on a com-munity college campus or on an adjacent site.Both models may include joint ancillary servicesand facilities such as student centers and stu-dent personnel services, bookstores and cafete-rias, libraries, computer laboratories, and rec-reational facilities, with some services such asmaintenance and janitorial arranged under con-tract with the host institution in the case of off-campus centers.
3. Most institutional administrators and their gov-erning boards prefer to have full control over thesites and facilities they use to offer credit pro-grams but joint-use facilities agreements areworking satisfactorily in the situations describ-ed in this report. The bases for this conclusionare that (1) students are being served who mightnot otherwise be able to avail themselves of edu-cational opportunities that are offered on thehome university campus, and (2) the arrange-ments have continued over a period of yearswithout significant changes being made. A
main ingredient of any type of joint- or shared-facilities use that works well is good faith andwillingness to cooperate on the part both the"tenant" and the "owner" instL,:fions (9r thosethat are otherwise sharing sites and facilities).
4. Finally, it appears unlikely that other statesthat are planning the expansion of their highereducation delivery systems will replicate thecomprehensive universities that they estab-lished in the past because of factors that includeuncertainty about the need for more such insti-tutions, given the diversity of the projected pop-ulation; cost of both building and operating suchinstitutions; and the problem of assuring qualitywhen attempting to replicate the flagship uni-versities. Instead, states are looking at bothjoint- or shared-use facilities for two or more in-stitutions and the possibility of a new type of ur-ban institution that would meet the specialneeds of an older, more ethnically diverse popu-
1 5
lation that would probably not seek a degree be-yond the master's and in a field that relates totheir careers.
Bibgography
Colorado Commission on Higher Education. Au-raria Governance Study. Agenda Item V,a Denver:The Commission, November 3,1988.
Franklin Patterson & Associates. A Study of theManagement of the Auraria Higher Education Cen-ter (AHEC) for the Colorado Commission on HigherEducation. Boston: Franklin Patterson & Associ-ates, September 1988.
Florida Postsecondary Education Planning Com-mission. Joint Use Facilities for Postsecondary Ed-ucation in Florida: Report and Recommendations.Commission Report 85-5. Tallahassee: The Com-mission, March 1985.
--. A Study of the Establishment of New Centers and
Campuses and Long Range Potential Site Plans:Report and Recommendations. Commission Report86-7. Tallahassee: The Commission, October 1986
--. A Study of the Courses, Programs, and Facilitiesof the Okaloosa-Walton Junior College/University ofWest Florida Joint Center in Fort Walton BeachReport and Recommendations. Commission Report87-9. Tallahassee: The Commission, September1987.
--. The Structure of Public Postsecondary Educationin Florida: Study Outline. Tallahassee: The Com-mission, August 1989.
Illinois Board of Higher Education. Report on Meet-ing the Educational Needs of Underserved Areas.Agenda Item 11. Springfield: The Board, March1988.
MGT of America, Inc. Branch Campus DevelopmentAlternatives: Final Report Submitted to the Wash-ington Higher Education Coordinating Board.Olympia: MGT of America, Inc., November 1989
145
11111111111111111111114. 1111111Mill
CALIFORNIA POSTSECONDARY EDUCATION COMMISSION
THE California Postsecondary Education Commis-sion is a citizen board established in 1974 by theLegislature and Governor to coordinate the effortsof California's colleges and universities and to pro-vide independent, non-partisan policy analysis andrecommendations to the Governor and Legislature.
Members of the Commission
The Commission consists of 15 members. Nine rep-resent the general public, with three each appointedfor six-year terms by the Governor, the SenateRules Committee, and the Speaker of the Assembly.The other six represent the major segments of post-secondary education in California.
As of February 1990, the Commissioners represent-ing the general public are:
Mim Andelson, Los Angeles;C. Thomas Dean, Long Beach;Henry Der, San Francisco;Seymour M. Farber, M.D., San Francisco;Rosalind K. Goddard, Los Angeles;Helen Z. Hansen, Long Beach;Lowell J. Paige, El Macero; Vice Chair:Cruz Reynoso, Los Angeles; Chair; andStephen P. Teale, M.D., Modesto.
Representatives of the segments are:
Meredith J. Khachigian, San Clemente; appointed'ay the Regents of the University of California;
Theodore J. Saenger, San Francisco; appointed bythe Trustees of the California State University;
John F. Parkhurst, Folsom; appointed by the Boardof Governors of the California Community Colleges;
Harry Wugalter, Thousand Oaks; appointed by theCouncil for Private Postsecondary Educational In-stitutions;
Joseph D. Carrabino, Orange; appointed by theCalifornia State Board of Education; and
James B. Jamieson, San Luis Obispo; appointed bythe Governor from nominees proposed by Califor-nia's independent colleges and universities,
11111MIUMMIN
Functions of the Commission
The Commission is charged by the Legislature andGovernor to "assure the effective utilization of pub-lic postsecondary education resources, thereby elimi-nating waste and unnecessary duplication, and topromote diversity, innovation, and responsivenessto student and societal needs."
To this end, the Commission conducts independentreviews of matters affecting the 2,600 institutions ofpostsecondary education in California, includingcommunity colleges, four-year colleges, universi-ties, and professional and occupational schools.
As an advisory planning and coordinating body, theCommission does not administer or govern any in-stitutions, nor does it approve, authorize, or accreditany of them. Instead, it cooperates with other Stateagencies and non-governmental groups that per-form these functions, while operating as an indepen-dent board with its own staff and its own specific du-ties of evaluation, coordination, and planning,
Operation of the Commission
The Commission holds rg.plar meetings throughoutthe year at which it debates and takes action onstaff studies and takes positions on proposed legisla-tion affecting education beyond the high school inCalifornia. By law, its meetings are open to thepublic. Requests to speak at a meeting may be madeby writing the Commission in advance or by submit-ting a request before the start of the meeting.
The Commission's day-to-day work is carried out byits staff in Sacramento, under the guidance of its ex-ecutive director, Kenneth B. O'Brien, who is ap-pointed by the Commission.
The Commission publishes and distributes withoutcharge some 30 to 40 reports each year on major is-sues confronting California postsecondary educa-tion. Recent reports are listed on the back cover.
Further information about the Commission, itsmeetings, its staff, and its publications may be ob-tained from the Commission offices at 1020 TwelfthStreet, Third Floor, Sacramento, CA 98514-3985;telephone (916) 445-7933.
1 ;
r COPY tAILABLE IMINIIIIIMINI

TECHNICAL BACKGROUND PAPERS TO"HIGHER EDUCATION AT THE CROSSROADS"
California Postsecondary Education Commission Report 90-2
ONE of a series of reports published by the Commis-sion as part of its planning and coordinating respon-sibilities. Additional copies may be obtained withoutcharge from the Publications Office, California Post-secondary Education Commission, Third Floor, 1020Twelfth Street, Sacramento, California 95814-3985.
Recent reports of the Commission include:
89-21 State Oversight of Postsecondary Education:Three Reports on California's Licensure of Private In-stitutions and Reliance on Non-Governmental Accre-ditation (A reprint of Reports 89-13, 89-17, and 89-18] (June 1989)
8642 Revisions to the Commission's Faculty SalaryMethodology for the California State University (June1989)
89-23 Update of Community College Transfer Stu-dent Statistics, 1988-89: The University of Califor-nia, The California State University, and California'sIndependent Colleges and Universities (August 1989)
89-24 California College-Going Rates, Fall 1988Update: The Twelfth in a Series of Reports on NewFreshman Enrollments at California's Colleges andUniversities by Recent Graduates of California HighSchools (September 1989)
89-25 Overseeing the Heart of the Enterprise: TheCommission's Thirteenth Annual Report on ProgramProjection, Approval, and Review Activities, 1987-88(September 1989)
89-26 Supplemental Report on Academic Salaries,1988-89: A Report to the Governor and Legislaturein Response to Senate Concurrent Resolution No. 51(1965) and Subsequent Postsecondary Salary Legis-lation (September 1989)
89-27 Technology and the Future of Education: Di-rections for Progress. A Report of the California Post-secondary Education Commission's Policy Task Forceon Educational Technology (September 1989)
89-28 Funding for the Cali' -,01 State University'sStatewide Nursing Program: . Report to the Legis-lature in Response to Supplemental Language to the1988-89 Budget Act (October 1989)
89-29 First Progress Report on the Effectiveness ofIntersegmental Student Preparation Programs: Oneof Three Report- to the Legislature in Response toItem 6420-0011-001 of the 1988-89 Budget Act (Octo-ber 1989)
or:rt int tt vAIA6LE
89-30 Evaluation of the Junior MESA Program: AReport to the Legislature in Response to AssemblyBill 610 (Hughes) of 1985 (October 1989)
89-31 Legislation Affecting Higher Education Dur-ing the First Year of the 1989-90 Session: A Staff Re-port of the California Postsecondary Education Com-mission (October 1989)
89-32 California Colleges and Universities, 1990: AGuide to Degree-Granting Institutions and to TheirDegree and Certificate Programs (December 1989)
90-1 Higher Education at the Crossroads: Planningfor the Twenty-First Century (January 1990)
90-2 Technical Background Papers to Higher Edu-cation at the Crossroada: Planning for the Twenty-First Century (January 1990)
90-3 A Capacity for Learning: Revising Space andUtilization Standards for California Public HigherEducation (January 1990)
90-4 Survey of Space and Utilization Standards andGuidelines in the Fifty States: A Report of MGT Con-sultants, Inc., Prepared for and Published by theCalifornia Postsecondary Education Commission(January 1990)
90-5 Calculation of Base Factors for Comparison In-stitutions and Study Survey Instruments: TechnicalA ppendix to Survey of Space and Utilization Stan-dards and Guidelines in the Fifty States. A SecondReport of MGT Consultants, Inc., Prepared for andPublished by the California Postsecondary EducationCommission (January 1990)
90-6 Final Report, Study of Higher Education Spaceand Utilization Standards/Guidelines in California:A Third Report of MGT Consultants, Inc., Prepared forand Published by the California Postsecondary Edu-cation Commission (January 1990)
90-7 Legislative Priorities of the Commission, 1990:A Report of the California Postsecondary EducationCommission (January 1990)
90-8 State Budget Priorities of the Commission,1990: A Report of the California Postsecondary Edu-cation Commission (January MO)
90-9 Guidelines for Review of Proposed Campusesand Off-Campus Centers: A Revision of the Commis-sions 1982 Guidelines and Procedures for Review ofNew Campuses and Off-Campus Centers (January1990)