ed 364 554 tm 020 701 author southard, margarida … 364 554 tm 020 701 author southard, margarida...
TRANSCRIPT

DOCUMENT RESUME
ED 364 554 TM 020 701
AUTHOR Southard, Margarida F.TITLE Process Evaluation in Dropout Prevention Programs.
Detecting and Predicting Problems and Benefitsthrough the Use of Problem Benefit/Survey.
PUB DATE Jan 91NOTE 57p.; Paper presented at the Annual Meeting of the
Southeast Evaluation Association (Tallahassee, FL,January 1991). For a related document, see TM 020702.
PUB TYPE Reports Research/Technical (143)Speeches/Conference Papers (150)
EDRS PRICE MF01/PC03 Plus Postage.DESCRIPTORS *Administrative Problems; Administrators; *Dropout
Prevention; Dropout Programs; Dropout Research;Elementary School Teachers; Elementary SecondaryEducation; *Formative Evaluation; Interviews; *MailSurveys; Program Effectiveness; Program Evaluation;Program Improvement; Qualitative Research; *ResearchMethodology; School Districts; Secondary SchoolTeachers; Test Construction
IDENTIFIERS Administrator Surveys; *Leon County School DistrictFL; *Problem Identification; Teacher Surveys
ABSTRACTResults of a process evaluation of dropout prevention
progr=ms in the Leon County (Florida) School District during theschool year 1989-90 are presented. Altogether, 11 dropout programswere operationalized in that school year. The methodology used fordeveloping a problem and benefit survey among teachers andadministrators, the results of the evaluation, and recommendationsfor program improvement are presented. In all, these programs served1,900 students during the school year. All of the programs metcriteria established by the school district, and featured smallclasses, a variety of instructional approaches, and close teachercontact with students and parents. Development of the survey beganwith identification of areas of concern through 38 qualitativeinterviews with teachers and administrators. The instrument, whichconsisted of 43 statements in 8 problem areas, was sent to 118teachers and 32 administrators, with responses from 70 teachers and23 program administrators. Teachers saw more serious problems thandid administrators, but all respondents indicated that small classsize and the opportunity for personal counseling were the mainbenefits of the programs. An appendix summarizes the perceptions ofrespondents. One figure and six tables present study findings.(Contains 13 references.) (SLD)
***********************************************************************
Reproductions supplied by EDRS are the best that can be madefrom the original document.
***********************************************************************

PROCESS EVALUATION IN DROPOUT PREVENTION PROGRAMS
ul DETECTING AND PREDICTING PROBLEMS AND
.0 BENEFITS THROUGH THE USE OFtee
PROBLEM BENEFIT/SURVEY
U.S. DEPARTMENT OE EDUCATIONOffice of Educational Research and Improvement
EDUCXTIONAL RESOURCES INFORMATIONCENTER (ERIC1
Mrs document has been reproduced asr eceived horn the oersOn Or orgamtationorrornahrig rt
r Mn.,r changes have been made 10 rmprOvereproduction Clualihe
'POInts ol view or Opinions staled in this docurnent do not necessarily repreSentOE RI positron or pOIrCy
Margarida F. Southard
"PERMISSION TO REPRODUCE THISMATERIAL HAS BEEN GRANTED BY
NAR44 IT F 5-oc) h/rD
TO THE EDUCATIONAL RESOURCESINFORMATION CENTER (ERIC)."
Research, Evaluation and User ServicesInformation Services
Leon County School District
Paper Presented at the Southeast Evaluation AssociationTallahassee, Florida
January 1991
The opinions and conclusions expressed herein are those of theauthor and do not necessarily reflect the position or policy of theOffice of Special Programs or the Leon County School District.
4C1
2 BEST COPY AVAILABLE

ACKNOWLEDGMENT
The author wishes to express her gratitude to the LeonCounty Director of Special Programs, Margaret Fultonand to the Coordinator of Special Programs, Susan Borotofor their support and to the teachers and administratorsof Leon County Schools, who through their participationmade this study possible.
3

The purpose of this paper is to present the results of aprocess evaluation of dropout prevention programs in Leon CountySchool District, Florida during the school year 1989-90. Alto-gether 11 dropout prevention programs were operationalized duringthat school year. Specifically, this paper has three mainobjectives: (1) to describe the methodology us.ed for developinga problem and benefit survey among teachers and administrators;(2) to present the results regarding problems associated with theimplementation of dropout prevention programs and (3) to proposerecommendations for program improvement. The study was conductedbetween March and June 1990.
Background
The current interest in identifying, predicting anddeveloping programs for the "at risk population" has developedrapidly over the past five years as local, state and nationalAgencies have been underpressure from the public to make ourschool system more efficient. At the heart of this discussion isthe apparent inability of the educational system to prevent a largenumber of students from dropping out.
Like every other state in the nation, Florida is con-cerned with the large percentage of its students who drop out be-fore completing high school. Since the 1983-84 school year,statistics have been collected on the number of students whodrop out before graduation or completion of a program of studies.For the 1988-69 school year, a total of 36,878 ninth to twelfthgrade students (7.5%) dropped out. This represents a slightincrease from the previous rate of 6.91% for the S7-SS school year.At present, the Florida Department of Education has establishedthe goal of achieving a dropout rate in high school of four per-cent or less by 1992.
The dropout problem is also a major concern in LeonCounty School District, a middle sized school district in northFlorida and the site of the state capital: A comparison of dropoutrates for Leon County and the State of Florida can be seen inFigure 1.
In 1986 the Florida Legislature adopted the DropoutPrevention Act to increase the number of students completing highschool and receiving a high school diploma. District School Boardswere encouraged to establish dropout prevention programs to meetthe needs of students who were not effectively served by convention-al education programs in the public system.
4BEST COPY AVAILABLE

DR
OPO
UT
S G
RA
DE
S 9
12L
EO
N C
O. V
S. S
TA
TE
198
3-89
Perc
ent
1983
-84
1984
-85
1985
-86
(Thi
s ye
ar's
rat
e re
flec
ts a
corr
ectio
nin
our
dis
tric
t's c
odin
g pr
oced
ure
& is
likel
y a
cons
erva
tive
figu
re.)
1986
-87
1987
-88"
LE
ON
1988
-89
,-...
STA
TE
BE
ST C
OPY
AV
AIL
AB
LE
6

The Leon County School System addressed this challengeby offering several alternative education programs to aid studentswith the potential for success who are not motivated, or aredisinterested in school. These programs are designed to assiststudents in grades 4-12, and are targeted for improving academicskills and attendance, increasing Leon County's promotion rate anddecreasing the county's overall dropout rate. During the 89-90school year, a total of 11 programs at elementary, middle andhigh levels were put in place. Special programs such as theTeenage Paient Program (TAP), Substance Abuse (DISC) and YouthServices were also implemented. Altogether, the droput preventionprograms served a total of 1,900 students in the 1989-90 schoolyear. The cost factor of 1.722 assigned to the programs resultedin an appropriation for each full-time equivalent student (FTE) in
the program of $4,300.
The programs differ from traditional education programsin philosophy, curriculum implementation, structure and teachingstrategies. Below is a summary of the main components common tothe alternative education programs. When appropriate, the specificcharacteristics of some of the programs will be mentioned.
Program Components
1. Students may be referred by teachers, guidancecounselors, school administrators, parents andstudents themselves.
2. They must meet two or more of the criteria es-tablished by the Florida Department of Educationand included in the Comprehensive Dropout Pre-vention Plan. The critria address the majorindicators related to "at risk students" i.e.failing grades, retention, poor attendance, poorself esteem, negative attitude toward school, etc.With regard to the TAP program, students arereferred mainly because of pregnancy. Disc Villagestudents are usually in the custody of the Departmentof Health and Rehabilitative Services (DHRS) andhave a documented substance abuse problem. YouthServices students are adjudicate or dependent youth.
3. Participation in the program should be voluntary.Once a student meets the eligibility criteria and isselected for possible placement, his/her parent(s)/guardian is notified in writing of placenent eligibi-lity and informed of rights and responsibilities.The student is placed in the program only after approvalis given in writing by a parent/guardian.
BEST COPY AVAILABLE

- 3 -
4. Classes should be smaller. (Approximately 16students.
5. Teachers should closely monitor student prov'essand offer constant reward and recognize good academicperformance, improved attendance and demonstrationof good citizenship behavior.
6. The curriculum should be presented using an inte-
grated approach, making the instruction relevantto the needs, interests and talents of the students.
7. The curriculum should follow the guidelines foracademic curriculum as stated in the district's pupil
progression plan. It should also meet the minimumperformance standards set by the State of Florida.A unique part of the curriculum for high school
students is the provision f Peer Counseling -- a
course that provides the students the opportunity tolearn and use counseling techniques in working with
others.
S. Teachers should use a variety of instructionalstrategies to match students interests, needs and
ability level to the level of difficulty of schoolcurriculum. Some of the approaches used are:cooperative learning, peer tutoring/peer counseling,hands-on, multisensory, project-oriented activities,simulations, group development and group dynamicsexperiences. An individualized, self-paced curriculumis offered in one high school, the Secondary SkillProgram (SSP).
9. Teachers should maintain close contact with theparents of participating students. At one middleschool, parent support and involvement is a conditionfor participating in the program.
10. A team approach is recommended to address the needsof students and their families. Social workers,guidance counselors, school psychologists, and schoolstaff should join with personnel from outside agencies(Department of Health and Rehabilitative Services,Department of Labor, Employment and Security, Depart-ment of Law Enforcement, etc.) to diagnose specialneeds and to provide support services for stuch,ntsand their families.
11. Students should attend a mininum of three (3) alter-native education instructiona: periods per day. One
of the high schools, the School for Applied Individualized
BEST COPY AVAILABLE

Learning (SAIL) offers seven (7) claases aday. In another program, the Secondary SkillsProgram (SSP) students attend academic classesfor three hours each day and spend the remainder ofthe day attending vocational classes or workingpart-time as part of the work study component (DCT).
12. An in-service training for dropout preventionteachers should be delivered through summer institutes,district in-service training sessions, individualstudy activities, etc. Some of the areas ofinterest are: classroom management, behavior manage-ment, developing motivation, self-esteem, etc.
Need for Product and Process Evaluation of DropoutPrevention Programs
At this time of great concern with the problem of theschool dropout, much has been written on graduation rate and drop-out rate (GAO, 1986, 1987; Fine, 1987; Morrow, 1987; Johnson, 1990;Ligon et.al. 1990; Olson, 1990). Numerous studies have focused onsystems to identify and predict at risk students (Barber et.al.1987; Brodinsky et.al. 1989; Taite, 1990; Wilkinson, et.al. 1990)using a series of variables to arrive at a profile of the dropout.Thus, most scientific research in the area is concerned withfactors (academic, personal experience and family background)that correlate with the probability of leaving high school beforegraduation (Natriello et.al. 1988).
Few studies have been concerned with evaluating theprograms intended to reduce dropping out. Furthermore, when theseprograms are evaluated the main evaluation purpose is to access theeffectiveness of the programs and not the process that bringsabout the outcomes. As one author stated "Despite the many pre-vention programs being implemented by school and districts, westill have little knowledge about wha_ actually works to reducedropout" (Natriello et.al., 1988).
The need for process data is much needed in the area ofprogram implementation of dropout prevention programs. This needwas recognized by the United States General Accounting Office(1987) in their review of dropout programs. The report concludesthat "it may be unrealistic to expect much successful program out-comes until a program is fully operational" (p. 335). The authorscontend that school officials must confront the practical problemsof implementation. The Center for Dropout Prevention at theUniversity of Miami (1987) in their Manual for Develorim; Comprehen-sive Plans also recommends the gathering of process evaluation in-formation for purposes of program improvement.
9 BEST COPY AVAILABLE

- 5 -
One of the purposes of process evaluation is to detectand/or predict defects in a program by identifying and monitoringthe potential sources of failure in a project. To the extent thatproblems can be anticipated, they can often be avoided or met insome way as to minimize harmful effects on the project.
The evaluation literature has always stressed the im-portance of identifying and anticipating problems during programimplementation (Brinkerhoff, et.al., 1983); Foster and Grahan,1971; Scriven, 1967, 1983; and Stufflebeam, 1971, 1988).
Recognizing the importance of this endeavor, a processevaluation of the dropout prevention programs in Leon County was proposedand included in thaoverall evaluation plan for the 1988-89 schoolyear. The strategy for this evaluation was the development of aproblem and benefit survey among teachers and administrators.
Evaluation Questions
After becoming familiar with the literature regardingalternative education/dropout prevention programs, the authormet with the program contact to discuss the proposed evaluation.A list of tentative evaluation questions was then drafted and dis-cussed with other evaluators and program staff. The final listresulted in the following questions:
1. What is the perception of teachers and administrators regard-ing the seriousness of the problems affecting the dropoutprevention programs in Leon County? What were the itemsconsidered as "serious" and "very serious"? What were theitems considered "not a serious problem" and "not a problem"?Is there a consensus between these two groups?
. When considering school levels (elementary, middle and highschool), is there a difference regarding the nature andseriousness of the problems affecting dropout prevention programsin Leon County?
5. What are the ten most serious problems which inhibit the successof the programs? Do teachers and administrators differ intheir perception? Are there differences among school levels?
4. What do teachers and administrators perceive as the benefits,both immediate and future, for students in the alternativeeducation programs?
BEST COPY AVAILABLE
f)
- 6 -
S. Are there differences among school levels regarding thebenefits of the dropout prevention programs?
Methodology
Instrument Development
Foster and Grahan (1971) have suggested the use of aseries of questionnaires called problem survey to identify potentialproblems in a project. These authors have suggested that personneldirectly involved in the implementation of a program are the best
qualified to identify critical problems. Simply askiog suchpersons to state problem areas generally results in a fairly ex-tensive listing. Therefore, these authors suggest that the first
.;tep in conducting a problem survey is the development of an open-ended questionnaire to allow respondents maximum freedom in the
identification of problem areas.
The authors contend that the initial questionnaire mustconvey two important ideas to program personnel. First, personnelshould understand that anticipated problems in the implementationphase ofa program are to be expected. Second, the processevaluator should convey the idea that in order for the questionnaireto be a successful problem identification strategy, the respondentsmust be open and candid in their responses.
In this study, qualitative interviews were used insteadof open-ended questionnaires to guide the development of the
instrument. The steps conducted were: (a) qualitative interviewswith a sample of teachers and administrators,(b) recording of theinterviews in a data base, (c) analysis of the data identifyingspecific problem areas, (d) categorization of problem areas, (e)
development of forced-choice problem survey and open-ended benefit
survey and (f) formative evaluation of the instrument through one-
to-one evaluation. A brief explanation of these steps will follow.
Qualitative Interviews
A total of 38 interviews following the interview guidea:,:roach (Patton, 1990) were conducted with alternative education/dropout prevention teachers, program coordinators and project
directors. The purpose of the interviews was to guide the develop-
;zent of the problem survey.
BEST COPY AVAILABLE
11

- 7 -
Before the interviews took place, a set of issues thatwere to he explored were written in advance. No set of questionswere written in advance and no particular order was followed. Theinterviews were developed at the school site and occurred in aninformal fashion. At least 2 or 3 persons at each site were inter-viewed. All the middle schools, high schools and 8 of the 18 ele-mentary schools were visited. In addition, staff from the specialprojects, TAP and Youth Services were also included in the sample.
Some of the issues discussed were:
Program strengths and weaknesses - things they like,they dislike, best features, poor features, etc.
- Training criteria for selecting teachers for the program.
- Instructional strategies, schedule, location of program.
- Community and parental support.
- Identification and selection of students.
Learning environment and support from administration andschool staff.
- Staff development.
The interviews were followed by .1 visit to one or twoclassrooms. An average of 3 hours was spent on each site.
Analysis of interview data
A cross-case analysis by issue was conducted and theanswers from the different participants were grouped by problemtopic. Variations to common questions were noted. Ouring thisphase it was specifically important to separate solutions fromproblems and to recognize that the same problem might be stated indifferent ways.
A preliminary list of 70 problems was then placed inc:.:legories using the major components of the programs as a guide.The problems were then reduced to a set of items that elicitedstandard responses. These items were used to develop the question-naire. This first draft was then sent by mail to three teachersfor their review and comments.
Construction of the questionnaire.
Based on this tryout of the instrument, revisions werein the structure of the questionnaire. The final form of the
BEST COPY MAILABLE
12

- 8 -
instrument consisted of 43 statements categorized into eightproblem areas related to: (1) scheduling; (2) lack of clearlydefined procedures; (3) building and equipment; (4) parental andcommunity involvement; (5) provision of essential services;(6) lack of support; (7) staffing and training and (b) classroominstruction. At the end of each category a space was providedfor the addition of new problems.
The respondents were asRed to indicate their degree of
general agreement concerning the seriousness of each problemstated. They indicated their opinions by checking the followingresponse categories: Very Serious Problem, Serious Problem,Has Not Beena Serious Problem, Has Not been a Problem, and Not Relevant to the Program
In the analysis of the data it was decided that the five
categories of the response scales could be better understood if
condensed. The categories Very Serious Problem and Serious Problemwere combined into one category labeled Serious. The categoryNot Relevant to the Program was eliminated from the analysis.Therefore, the data will be reported on a three unit scale.
After completing the scales the respondents were askedto pick out the ten problems, which, in their opinion, most in-
hibited the success of the program by circling the item numbers.
A second part of the survey, a benefit survey, consistedof two open questions regarding intended and unintended benefits.
Results
A total of 118 questionnaires were sent to the alternativeeducation, CITY school and Teenage Parent Program teachers.Seventy teachers (60%) representing thirty-three (89%) dropoutprevention programs answered the survey. Of the thirty-two school/programs, twenty-three (70%) completed the survey for administrators.Some schools administrators returned more than one sur-..ey.Overall, thirty-six questionnaires were received from administrators.
Table 1 presents the distribution Jf returned surveysper school/program and per job position.
BEST COPY AVAILABLE
13

TABLE 1
NUMBER OF RETURNED QUESTIONNAIRES PERSCHOOL/PROGRAM BY JOB POSITION
School/Program Teachers
Position
Administrator Total
# Schools
Elementary Schools
Middle Schools
Project Escapea
15
6
1
20
14
-).
17
10
37
24
?
High Schools 4 16 23
SSPb 1 3 3
SAILb 1 7 1 8
TAPc 1 4 1 5
CITY/DISCd ? 4 4
TOTAL 70 3 106
a Middle School Program for Overaged Students.
Alternative High Schools
c Teenage Parent Program
dYouth Service/Substance Abuse Programs
BEST COPY AVAIL AfilE
14

9
The results of the study are presented here accordingto the questions identified earlier.
1. What is the perception of teachers and administrators regardingthe seriousness of the problems affecting the dropout preventionprograms In Leon County? What were the items considered as"serious" and "very serious"? What were the items considered"not a serious problem" and "not a problem"? Is there a con-sensus between these two groups?
Table 2 presents the perceptions of respondents regardingthe seriousness of the problems.
Of the 43 items in the survey, 10 items (23%) were rated asa "serious problem" by a majority of the teachers and/or administra-tors. These problems are listed with the letter in parenthesesindicating whether teachers, administrators or both identified the
item as a serious problem.
Lack of clearly defined procedures for promoting schoolattendance (T).
- Obtaining and maintaining parent support (A).
- Regular school counseling services not enough for alternativeeducation student (T,A).
-- Regular school social work services not enough for alternativeeducation student (T).
- Lack of a full-time counselor for alternative educationstudents (T,A).
-- Lack of family counseling and crisis intervention (T,A).
Lack of a full-time aide in each classroom (T,A).
-- Too much time spent in classroom management and disciplineproblems (T).
More time spent by teacher dealing with the students' personaland familial problems than teaching.
- - Traditional curriculum is not relevant to many students (T,A).
Most of these problems are related to the category of lack
of provision of essential services (4 items) and classroom instruction3 items). Teachers and administrators are in agreement regarding
BEST COPY AVAILABLE
1 5

- 10
the need for counseling services and the need for an instructionalaide. Teachers seem more concerned with lack of procedures forpromoting school attendance and principals believe that parentalsupport is a critical area.
It should be noted that some items were rated as seriousby teachers and administrators but not by a majority of either groups.
These items are listed below.
-- Not enough time for consultation with individual students.
-- Lack of clearly defined procedures for identifying andrecruiting "at risk students".
- - Lack of clearly defined procedures for selecting students thatwould most benefit from the program.
7- Recruiting tutors and mentors from the community.
-- Organizing activities (field trips, meetings, etc,) to secureparent involvement.
- Lack of team approach in addressing the needs of alternativeeducation students.
-- Lack of appropriate training for teachers before being assignedto alternative education programs.
-- Not enough information on employability skills and careerawareness included in the curriculum.
Items not Considered a Problem. As summarized in Table 2,17 items (39.6%) were rated as "not a problem" by a majority of theteachers or administrators. These items belonged to the categoriesof scheduling, support and training (4 items) and building andec..uipment (5 items). Again, a general agreement exists betweenteachers and administrators regarding areas not considered a problem.An exception is the problem related to teacher turnover. Fifty-fourpercent of the teachers considered it not to be a problem while only2o:, of the administrators perceived this area as a non-problem area.
Items Considered Not a Serious Problem. As can be seen inTable 2, none of the items were rated by the majority of teachersand administrators as being a "problem but not serious". Adminis-trators seem, again, more concerned with the area of parental andco=lunity involvement than teachers. Five out of six items on thiscategory was rated by 40% of the administrators as being a problemalthough not serious.
BEST COPY AVAILABLE

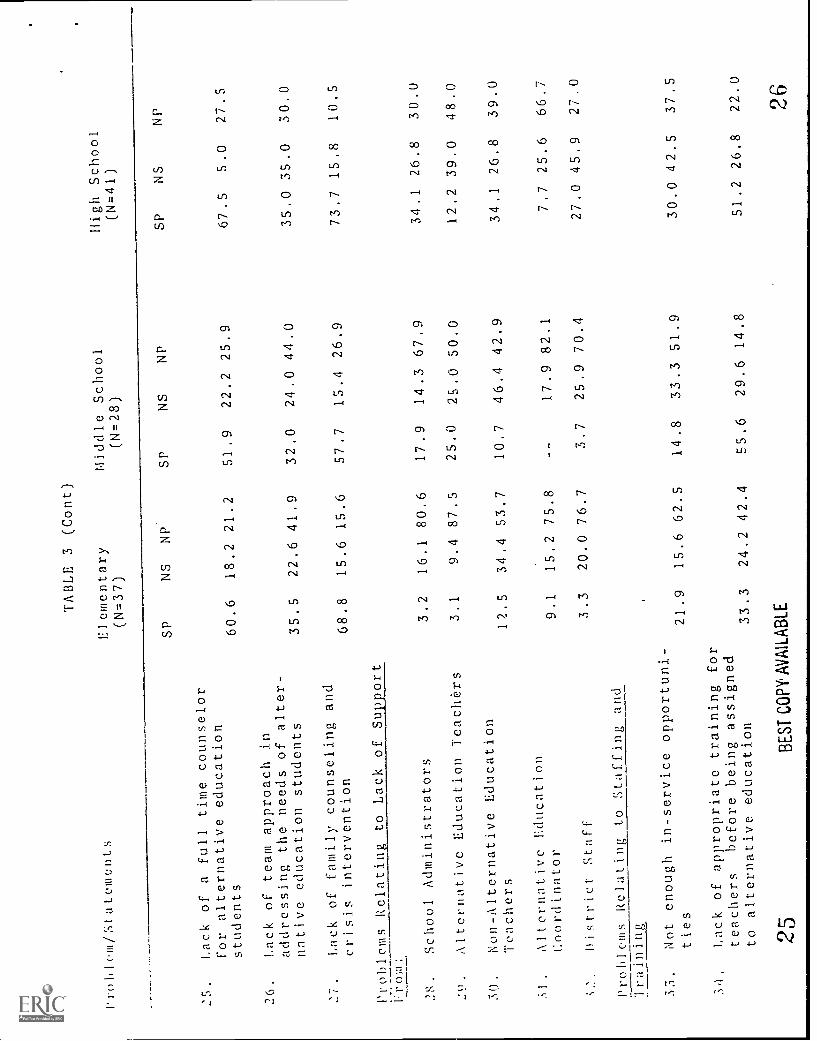
2. When considering school levels (elementary, middle and highschool), is there a difference regarding the nature andseriousness of the problems affecting dropout preventionprograms in Leon County?
An exam of Table 3 suggests that teachers and administra-tors at the high school level see more serious problems in theirprograms than the staff at the elementary and middle school levels.In addition, the nature of the problems seem, in some cases, uniqueto the school level.
Of the 43 items in the survey, 16 items were rated as"serious problem" by a majority of the respondents participatingin programs at the high school level. At the middle school level,6 items were rated as a "serious problem" and at the elementarylevel, 7 items were considered serious.
Across all levels (elementary, middle and high), there isa consensus regarding the critical problems. These problems arerelated to lack of counseling services (items 23,25,27) lack offull time aide (item 37) and to problems related to classroommanagement and instruction (items 40,41,42).
At the middle school level, a major concern exists withteacher turnover (item 38) and lack of appropriate training forteachers being assigned to the dropout prevention programs (item34). The latter was also considered a serious problem by themajority of high school respondents.
In addition, high school participants are concerned aboutproblems in the area of lack of clearly defined procedures relatedto selection and retrieval of students, promoting school attendanceand parental involvement (items 17,20,21).
Items not Considered a Problem. Participants involvedith the elementary alternative education programs see fewer problemsin their programs than their counterparts at the middle and highschool level; of the 43 items in the survey, 16 items were rated as"not a problem" by a majority of the elementary school personnel.At the middle sdhool level, 13 items were rated as "not a problem"and at the high school level, 10 items were considered "not a problem".
At the elementary level, these items are related to schedul-ing (items 1,2,3,4,5) lack of clearly defined procedures (item 9),eo.uipment (items 11,12,15), lack of support (items 28,29,-1,32) andtraining and staffing (33,35,38).
the middle school level, the items not considereda problem are related to scheduling (item 3), lack of clearly defined:-rccedures (12,13,14,15), parental involvement (items 21,22), lack
1 '7
BEST COPY AVAILABLE

- 12 -
of support (items 28,29,31,32) and training and staffing (items 35,3o).
At the high school level, the items not considered aproblem are related to scheduling (item 4), building and equipment(items 12,13,14,15,16), lack of support (item 31) and training andstaffing (items 35,36,38).
3. What are the ten most serious problems which inhibit the successof the program? Do teachers and administrators differ in theirperception? Are there differences among school levels?
The respondents were asked to identify the ten (10) problemswhich in their opinion most inhibited the success of the alternativeeducation programs. The number of times the item was mentioned wasused to arrive at a list in order of priority. Percentages were thencalculated for the total sample, for teachers and administrators.
An examination of Table 4 confirms the results describedearlier. Teachers and administrators in general agree in theirperceptions with small variations. As it was expected, teachersseem more concerned with problems related to lack of counselingservices for students and classroom management. Administratorsplaced a greater importance toward securing parent involvement andfamily counseling. Obtaining and maintaining parental support wasmentioned by SS% of the administrators as a problem while only 34%of teachers considered this item as being one of the most serious.
Another area considered critical by the respondents waslack of a full-time aide. The respondents ranked this problemfourth in priority. Finally, the area of training deserves attention.Although most of the items related to training were not consideredproblems, the provision of training for new teachers before beingassigned to the programs was. This item was ranked in sixth place.
Differences across school levels. When looking at theranking of the 10 most serious problems across school levels(Table S), important features are revealed. It appears that thenature of the problems are somewhat different depending on the schoollevel. It is true that there is a general agreement across alllevels that the lack of regular school counseling services inhibitsthe success of the programs. However, staff at the elementary levelplaced greater emphasis on this area. Teachers feel that they spenttoo much time taking care of the students' familial and personalproblems in detriment of quality instructional time. The firstthree top problems at the elementary level are related to provisionof counseling services.
At the middle school level, there is a great concern re-garding the lack of appropriate training for teachers before being
BEST COPY AVAILABLE
is

- 13 -
assigned to the programs. Almost 60% of the respondents mentionedthis problem as one of the most critical. The physical locationof the programs in areas characterized for serving the so called"different student" was ranked among the 10 most serious problemsonly by the middle school staff. Finally, the need of a full-timeaide in each classroom seems more critical at the middle school
level. This item was ranked in third place.
The problems ranked at the high school level present adifferent picture. At this level, great concern exists regardingparental involvement than at any other level. This problem wasranked in second place. In addition, a lack of understandingregarding the program rules and procedures is evident. The problemsrelated to lack of clearly defined procedures for promoting schoolattendance, selecting students that would most benefit from theprogram and identifying and recruiting "at risk students" wereranked in third, fourth and seventh place respectively.
Finally, a concern with discipline and classroom managementexists at the elementary and middle school level. This problem wasranked in fourth place.
Benefit Survey
4. What do teachers and administrators perceive as the benefits,
both immediate and future, for students in the dropoutprevention programs?
S. Are there differences among school levels regarding the
benefits of the dropout prevention programs?
The respondents were asked to name the immediate and future
benefits of the dropout prevention programs through two open-endedc,uestions. The responses to these questions yielded 263 statementsthat were then categorized. Appendix A presents the results byschool levels and position.
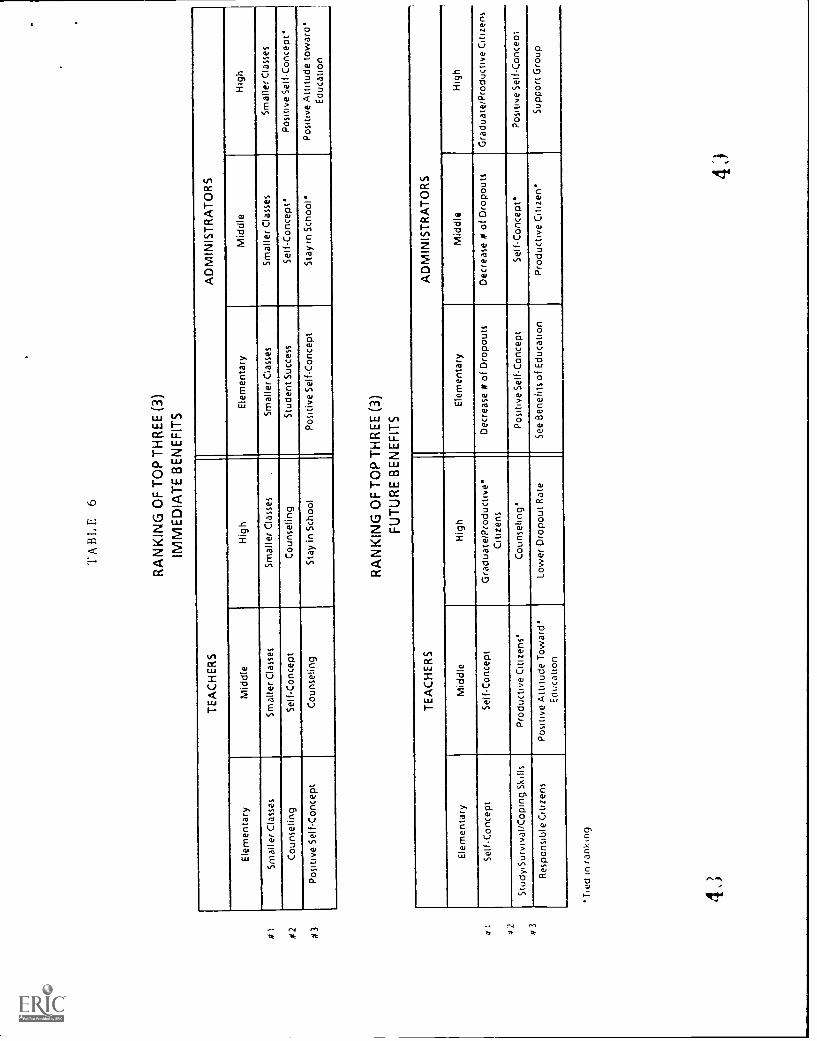
Next, the number of times each statement was mentioned wasused to arrive at a list of statements in order of priority. Tablee ranks the top three immediate and future benefits as perceivedby teachers and administrators at the elementary, middle and schoollevel. An examination of the results suggests that teachers and
administrators at all school levels generally agree in their rank-ings. There were only small variations in their rankings. As it wasexpected, the immediate benefits are related to improving astudent's experience in school. The future benefits are seen in thelight of the programs' capability of reducing the indivi,lual andsocial costs of dropping out of school.
BEST COPY AVAILABLE
1D

- 14
Immediate Benefits: Across all three school levels, the smallsize of the classrooms was considered the most important benefitby teachers and administrators. In their statements they expressedthat higher teacher to student ratio allows for one-on-one inter-actions with the teachers. Students then receive the individualattention they need.
Having more group and individualized counseling was seen byteachers as another benefit of these programs. It should be pointedout that the lack of counseling services was ranked as one of theserious problems affecting the programs. Teachers perceive theprovision of counseling services as one of the benefits of theseprograms but feel that the services being offered are not sufficientto meet the needs of the students.
The development of self-concept, a positive attitude towardschool and the alternative of staying in school instead of droppingout were also perceived as immediate benefits of the program.
Future Benefits: The decrease in the number of dropouts, theproduction of competent graduates and responsible citizens andthe development of a positive self concept were seen as the mainfuture benefits of the program. As it was expected, administratorssee the oenefits of the program mol-e in terms of decreasing thenumber of dropouts, especially at the high school level. It isimportant to note that the reduction in the dropout rate is seen asa future benefit of the program and not as an immediate one.
Conclusions
In this paper the methodology used in a problem/benefitsurvey was described. The results obtained with this technique werereported hoping that they can contribute to a better understandingof the complex issues confrorting dropout prevention programs duringtheir implementation.
The high rate of return obtained from teachers (60%) was anencouraging factor and gives more credibility to the results obtained.This high return seemed a result of involving teachers and adminis-trators in the development of the survey instrument.
Problem Survey
Of the 43 items in the survey, 10 items were rated as "aserious problem" and 17 items were considered "not to be a problem"1,y the majority of teachers and principals. Teachers tended to bemore critical. They'saw more problems as being serious then adminis-trators. School levels seem to influence the nature of the problems.
2 )

- 15 -
Personnel working with high school students identified moreproblems as being serious than personnel in programs at theelementary and middle school level.
This section summarizes the main problem areasidentified in the study.
1. Problems related to lack of provisions of essentialservices
Most of the critical problems identified in this studywere related to the category of lack of provisions of counselingservices and social services across all school levels (elementary,middle and high).
This seems consistent with the current view that suggeststhat a range of outside school-factors affecting the at-riskstudent contribute to dropping out. These liabilities includea series of personal, familial and community problems such as alcoholand drug abuse, single-parent families, family crises and family
financial needs. In attempting to deal with these problems, teachersfind themselves spending more time dealing with the students'personal and familial problems than with teaching. The regularschool counseling services are not sufficient to deal with the
at-risk student.
During the course of the interviews, teachers voiced theopinion that a case management approach needs to be introducedinto the schools. With this approach, different services areprovided to a targeted group of students in the school. Theseservices are delivered in the school by a team of human serviceworkers from other organizations under contract to the school.
Problems related to classroom instruction
Another area of concern identified in this study wasrelated to classroom manaoement and instruction. During the courseof the interviews, some teachers expressed the concern that thetraditional curriculum is not relevant to many students. Theyargued that there is a lack of appropriate match between the academicprogram of the school and the skills and interests of the students.
Natriello (1988), suggests three basic strategies tocounteract the lack of match between the school program and the needsof the students. First, he contends that it is possible to individua-lize the curriculum and instructional strategy so that the curriculumis tailored to each student's ability. Second, students' skillsand abilities should be strengthened to permit them to meet theexpectations of the school curriculum. Finally, the school academicprogram should be made more salient to the lives of students.

- 16 -
3. Problems related to parental involvement
To obtain and maintain parent support was of a greatconcern, especially, among high school principals. In the opinionof some of the respondents, only through the combined efforts ofthe educational staff, can parents become more aware of and in-volved in ways to solve their social and school related concerns.
4. Problems related to staffing and training
In general, the category related to training was not con-sidered a problem as it refers to in-service training. However,provisions of training for new teachers before being assigned tothe programs was considered a serious problem, especially, atthe middle school level. Sixty percent'of the middle school res-pondents ranked this problem as one of the most serious.
Finally, it is worth mentioning that the majority of theitems bclonging to the categories of scheduling, building andequipment and support from administrators were not consideredproblems.
Further research is required to integrate and expand ourunderstanding of the problems that affect the implementation ofdropout prevention programs so that the factors that contributeto the success of a program can be identified.
Benefit Survey
A total of 263 statements addressing the immediate andfuture benefits of the dropout prevention programs were categorizedby school levels and school position. A general consensus %cisfound among the respondents regarding the nature of the immediateand future benefits of the programs. The respondents indicated thatsmall class size, and the opportunity of personal counseling werethe main benefits of the programs. This is consistent with theresearch literature which indicates that a caring and committedstaff and a nonthreatening environment are important to make aprogram effective.
The reduction of the number of dropouts, and the encourage-ment of responsible citizenship were seen as future benefits ofthe programs. These are the ultimate goals of the programs.
In summary, the environment which provides personnel who arecaring and responsive to student needs will both encourage thestudents to remain in school and positively impact upon academicsuccess.
22

TABLE 2
Perceptions of kespondents Regarding Seriousness of Problems in AlternativeEduc:Ition Programs Indicated in Percentage by School Position
Problem/Statements Teachers Administration(N=70) (N=36)
Scheduling Problem3SP NS NP SP NS NP
1Not enough time for students topractice what they learn 11.3 42.0 46.8 9.4 34.4 56.3
Lack of common planning time forA.E. teachers 32.4 30.9 36.8 14.7 29.4 55.9
3. Appropriate scheduling foroptimal learning 27.3 21.2 51.5 20.0 20.0 60.0
4. Not enough block time with teacher 12.5 32.8 54.7 18.2 24.2 57.6
S. No: enough time for consultationwith individual students 33.8 32.4 33.8 36.4 15.2 48.5
Problel.:.s Relating to Lack of ClearlyDefined Procedures for:
6. Identifying and recruiting "atrisk students" 42.6 29.4 27.9 41.2 23.5 35.3
Selecting students that wouldmest benefit from the program 41.8 34.3 23.9 45.5 21.2 33.3
>nstreaming students backdm:7.o regular classes 31.9 36.2 31.9 26.5 56.2 35.3
0. Retrieving students at risk ofhdrawing 55.6 29.9 31.3 31.3 31.3 37.5
10. T'r::7.oting school attendance 54.5 18.2 27.3 33.3 39.4 27.3
Prob1o:7s of Buildings, Equipment andSpace
11. Ne: enough space in classroomsf:r group work 34.9 19.0 46.0 15.2 39.4 45.5
SP = Serious ProblemNS = A ':'roblem but Not SeriousNP = N:: a Problem
BEST COPY AVAILABLE

Problem/Statements
TABLE 2 (Cont)
Teachers(N=70)
Administration(N=36)
SP NS NP SP NS NP
12. Classrooms too large and open 6,3 14.1 79.7 24.2 75.8
13. Classrooms physically isolatedfrom the main building (portables) 18.5 23.1 58.5 23.5 23.5 52.9
14. Rooms are too noisy for classroominstruction 17,5 30.2 52.4 6.3 31.3 62.5
15. Location of program in the mainbuilding but in an arca character-ized for serving the so called"dumb" or "different" student 13.8 23.1 63.1 9.1 15.2 75.8
16. Lack of telephone in classrooms 32.8 17.9 49.3 32.4 14.7 52.9
Problems Relating to Involvementof Parents and Community
17. Obtaining and maintainingparent support
18. Securing the support ofcommunity organizations(private sector and governmentagencies)
19. Recruiting tutors and mentorsfrom the community
47.7 35.4 16.9 54.3 20.0 25.7
32.8 18.1 39.1 30.3 42.4
36.4 48.5 15.2
20. Organizing activities (field trips,meetings, etc.) to secure parentinvolvement 35.9 34.4 29.7 36.4 39.4 24.2
21. Contact parents through telephonecalls and notes 32.8 29.7 37.5 30.3 48.5 21.2
nn Obtaining parent consent forstudent enrollment 16.4 34.4 49.2 34.4 40.6 25.0
Problems Relating to Provision ofEssenti:11 Services
23. Regular school counseling servicesnet enough for alternative educa-tion student
24. Regular school social workservices not enough for alterna-tive education student
70.1 14.9 14.9 53.9 20.6 23.5
32.1 21.2 lc
24
BEST COPY AVAILAbLE
1S.S.
Problem/Statements
TABLE 3
(Cont)
Elementary
(N=37)
Middle School
High School
(N=28)
(N=41)
25.
Lack of a
full time counselor
for alternative education
students
26.
Lack of team approach in
addressing the needs
of alter-
native education students
Lack of family counseling
and
crisis intervention
Problems Relating to
Lack of Support
SP
NS
NP
SP
NS
NP
SP
NS
NP
60.6
35.5
68.8
28,
School Administrators
3.2
.2P.
Alternative Education Teachers
30.
Non-Alternative Education
Teachers
S.:.
Alternative Education
Coordinator
Oistrict Staff
Problems Relating to Staffing
and
lraining
33.
Not enough in-service opportuni-
ties
3,1.
Lack of appropriate training
for
teachers
before being assigned
to alternative
education
3.3
21.9
33.3
25B
ES
T C
OP
Y A
VA
ILA
BLE
18.2
21.2
51.9
22.2
25.9
67.5
5.0
27.5
22.6
41.9
32.0
24.0
44.0
35.0
35.0
30.0
15.6
15.6
57.7
15.4
26.9
73.7
15.8
10.5
16.1
80.6
17.9
14.3
67.9
34.1
26.8
30.0
9.4
87.5
25.0
25.0
50.0
12.2
39.0
48.0
34.4
53.7
10.7
46.4
42.9
34.1
26.8
39.0
15.2
75.8
17.9
82.1
7.7
25.6
66.7
20.0
76.7
3.7
25.9
70.4
27.0
45.9
27.0
15.6
62.5
14.8
33.3
51.9
30.0
42.5
37.5
24.2
42.4
55.6
29.6
14.8
51.2
26.8
22.0
26

Prob1(.m/Stotements
TABLE 3
(Cont)
Elementary
(N=37)
Middle School
High School
(N=28)
(N=41)
SP
NS
NP
SP
NS
NP
SP
IS.
Lack of a
full time counselor
for alternative education
students
60.6
18.2
21.2
51.9
22.2
25.9
67.5
26.
Lack of team approach in
addressing the needs of alter-
native education students
35.5
22.6
41.9
32.0
24.0
44.0
35.0
27.
Lack of family counseling and
crisis intervention
68.8
15.6
15.6
57.7
15.4
26.9
73.7
Problems Relating to Lack of Support
From:
28.
School Administrators
3.2
16.1
80.6
17.9
14.3
67.9
34.1
29.
Alternative Education Teachers
3.1
9.4
87.5
25.0
25.0
50.0
12.2
30.
Non-Alternative Education
Teachers
12.5
34.4
53.7
10.7
46.4
42.9
34.1
Alternative Education
Coordinator
9.1
15.2
75.8
17.9
82.1
7,7
ni strict Staff
3.3
20.0
76.7
3.7
25.9
70.4
27.0
Problems Relating to Staffing and
Training
33.
Not enough in-service opportuni-
ties
21.9
15.6
62.5
14.8
33.3
51.9
30.0
31,
Lack of appropriate training for
teachers
before being assigned
to alternative education
33.3
24.2
42.4
55.6
29.6
14.8
51.2
4"?."/
BLST UOPY AVALABLE
NS
NP
5.0
27.5
35.0
30.0
15.8
10.5
26.8
30.0
39.0
48.0
26.8
39.0
25.6
66.7
45.9
27.0
42.5
37.5
26.8
22.0
28

Problem/Statements
TABLE 2 (Cont)
Teachers(N=70)
Administration(N=36)
40. Too much time is spent inclassroom management and disci-pline problems
41 Teacher spends more time deal-ing with the students' personaland familial problems thanteaching
42 Traditional curriculum is notrelevant to many students
43. Not enough information onemployability skills andcareer awareness included inthe curriculum
SP NS NP SP NS NP
60.6
50.8
58.5
45.9
2
27.3 12.1 47.1 41.2 11.8
31.7 17.5 42.4 45.5 12.1
26.2 15.4 58.8 17.6 23.5
14.8 39.3 38.2 38.2 23.5
BEST CON AMLAWE

TABLE 3
Perceptions of Respondents Regarding
Seriousness of Problems in
Alternative Fducation Programs Indicated
in Percentage by School
Level
Problem/Statements
Elementary
Middle School
High School
(N=37)
(N=28)
(N=41)
Sch'eduling Problems
1.
Not enough time for students to
practice what they learn
.Lack of common planning time
for A.E. teachers
3.
Appropriate scheduling for
optimal learning
LNot enough block time with
teacher
S.
Not enough time for consultation
with individual students
Probl ems Relating to Eack of Clearly
i ned Procedures for:
.
6.
IdentiCying and recruiting "at
risk students"
SP
NS
NP
SP
NS
NP
16.1
16.1
67.7
12.5
45.8
41.7
12.1
18.2
69.7
28.6
32.1
39.3
21.2
6.1
72.7
7.4
40.7
51.9
13.3
16.7
70.0
14.8
40.7
44.2
31.3
15.6
53.1
35.7
32.1
32.1
36.4
27.3
36.4
32.1
39.3
28.6
SP
NS
NP
5.1 53.8
41.0
36.6 39.0
24.4
39.0 19.5
41.5
15.0 32.5
52.5
36.6 31.7
31.7
53.7 19.5
26.8
SP
-Serious Problem
NS
=A Problem But Not Serious
-Not
a Problem
BE
ST
CO
PY
AV
AIL
AB
LE
31

Prohlem/Statements
7.
Selecting students that would
most benefit from the program
S.
Mainstreaming students back
into regular classes
Y.
Retrieving students at risk
of withdrawing
10.
Promoting school attendance
Problems of Buildings, Equipment
and Space
11.
Not enough space in classrooms
for group work
12.
Classrooms too large and open
13.
Classrooms physically isolated
from the main building
(portables)
11.
kooms are too noisy for
classroom instruction
15.
Location of program in the main
building but
in an area character-
ized for serving the so called
"dumb" or "different" student
1(
-1,
of telephone in classrooms
32B
ES
T C
OP
Y A
VA
ILA
BLE
TABLE 3
(Cont)
Elementary
Middle School
High School
(N.28)
(N=41)
SP
NS
NP
SP
NS
NP
SP
NS
NP
25.6
37.5
37.5
33.3
37.0
29.6
63.4
19.5
17.1
26.5
35.3
38.2
28.6
32.1
39.3
34.1
41.5
24.4
6.5
41.9
51.6
25.9
29.6
44.4
65.9
22.0
12.2
12.9
38.7
48.4
44.4
18.5
37.0
75.6
19.5
4,9
10.0
23.3
66.7
26.9
34.6
38.5
42.5
22.5
35.0
16.1
83.9
7.7
15.4
76.9
5.0
20.0
75.0
18.8
37.5
43.8
33.3
11.1
55.6
12.5
20.0
67.5
16.1
35.5
48.4
16.0
32,0
52.0
10.3
25.6
64.1
15.6
28.1
56.3
18.5
14.8
66.7
5.1
17.9
76.9
24.2
27.3
48.5
42.9
14.3
42.9
32.5
10.0
57.5

Pr()hlem/Matements
TABLE 3
(Cont)
Elementary
(N=37)
Middle School
High School
(N=28)
(N=41)
25.
Lack of a full time counselor
for alternative education
students
26.
Lack of team approach in
addressing the needs of alter-
native education students
17.
Lack of family counseling and
crisis intervention
Problems Relating to Lack of Support
Nrom:
School Administrators
\lternative Education Teachers
on-Alternative Education
leachers
Alternative Education
Coordinator
32.
District Staff
Prohleri:, kclatinv to Staffin_
and
lrdining
,ot enough in-service opportuni-
ties
Lack of appropriate training for
teachers
before being assigned
to alternative education
SP
NS
NP
SP
NS
NP
SP
NS
NP
60.6
18.2 21.2
51.9
22.2 25.9
67.5
5.0
27.5
35.5
22.6 41.9
32.0
24.0 44.0
35.0 35.0
30.0
68.8
15.6 15.6
57.7
15.4 26.9
73.7 15.8
10.5
3.2
16.1 80.6
17.9
14.3 67.9
34.1 26.8
30.0
3.1
9.4 87.5
25.0
25.0 50.0
12.2 39.0
48.0
12.5
9.1
3.3
21.9
33.3
34
BE
ST
CO
PY
AV
AIL
AB
LE
34.4
53.7
10.7
46.4
42.9
34.1
26.8
15.2
75.8
17.9
82.1
7.7
25.6
20.0
76.7
3.7
25.9
70.4
27.0
45.9
15.6
62.5
14.8
33.3
51.9
30.0
42.5
24.2
42.4
55.6
29.6
14.8
51.2
26.8
39.0
66.7
27.0
37.5
22.0
35

TABLE 3
(Cont)
l'r(A1(;0!-,tatement-,
Elementary
(N.37)
Middle School
High School
(N=28)
(N=41)
25.
Lack of a
full time counselor
for alternative education
students
26.
Lack of team approach in
addressing the needs of alter-
native education students
27.
Lack of family counseling and
crisis intervention
Problems Relating to Lack of Support
From:
28.
School Administrators
29.
Alternative Education Teachers
30.
Non-Alternative Education
Teachers
Alternative Education
Coordinator
2.
hitriet Staff
Prohlem:, kelatinl; to Staffing and
Training ot enough in-service opportuni-
ties
Lack of appropriate training for
teachers
before being assigned
to alternative education
SP
NS
NP
SP,
NS
NP:
SP
NS
NP
60.6
18.2
21.2
51.9
22.2
25.9
67.5
5.0
27.5
35.5
22.6
41.9
32.0
24.0
44.0
35.0
35.0
30.0
68.8
15.6
15.6
57.7
15.4
26.9
73.7
15.8
10.5
3.2
16.1
80.6
17.9
14.3
67.9
34.1
26.8
30.0
3.1
9.4
87.5
25.0
25.0
50.0
12.2
39.0
48.0
12.5
34.4
53.7
10.7
46.4
42.9
34.1
26.8
39.0
9.1
15.2
75.8
17.9
82.1
7.7
25.6
66.7
3.3
20.0
76.7
3.7
25.9
70.4
27.0
45.9
27.0
21.9
15.6
62.5
14.8
33.3
51.9
30.0
42.5
37.5
33.3
24.2
42.4
55.6
29.6
14.8
51.2
26.8
22.0
BE
ST
CO
PY
AV
AIL
AB
LE3
7

Pr(,1,lem/'.-itatements
TABLE 3
(Cont)
Elementary
Middle School
high School
(N=37)
(N=28)
(N=41)
35.
Lack of coordinator's input in
the selection of new teachers
36.
Too much teaching time for
high school coordinator
37.
Lack of a
full-time aide in
each classroom
38.
Teacher turn over
Problems Relating to Classroom
instruction
Lack of appropriate instruction-
al materials
40.
Too much time is spent in class-
room management and discipline
problems
Teacher spends more time deal-
ing with the students
personal
dnd Camilial problems than
teaching
Iraditional curriculum is not
relevant
t_u many students
43.
Not enough information on
employability skills and
career awareness included in
the curriculum
3 3
BE
ST
CO
PY
AV
AIL
AB
LE
SP
NS
NP
SP
,NS
NP
SP
3.6
96.4
4.3
13.0
82.6
22.0
-7.4
92.6
13.0
4.3
82.6
50.0
66.7
3.0
30,3
50.0
25.0
25,0
61.0
15.4
23.1
61.5
55.6
25.9
18.5
28.9
29.0
29.0
41.9
34.6
38.5
26.9
46.3
51,5
33,3
15.2
61.5
30.8
7.7
56.1
53.3
23.3
23.3
46.2
34.6
19.2
45.0
59.4
15.6
25.0
46.2
38.5
15.4
65.9
36.7
20.0
43.3
30.8
30.8
38.5
56.4
NS
NP
19.5
58.5
5.0
95.0
19.5
19.5
18.4
52.6
29.3
24.4
31.7
12.2
47.5
7.5
19.5
14.6
20.5
23.1
:3

TABLE 4
PERCEPTION OF RESPONDENTS REGARDING
THE TEN MOST SERIOUS PROBLEMS RANKED BY
TOTAL SAMPLE, TEACHERS AND ADMINISTRATORS
STATEMENT
Regular school counseling
services not enough for
Total
Sample
96
(N=106)
Rank
Teachers
(N=70)
Rank
Admin.
(N=36)
Rank
alternative education students
58
165.7
144.6
3
Obtaining and maintaining
parent support
41.5
234.3
855.7
1.5
Lack of a
full-time counselor
for alternative education
tudents
41.3
345.7
238.9
5
Lack of
afull-time aide in
c.ich classroom
40.7
441.4
439.0
4
Ldck of family counseling
and crisis intervention
ioo much time is spent
in
clasroom management and
iling with discipline problems
of appropriate training
teacher:, before being
lied
to alternative
dot. al
iuii
liaditional curriculum is not
40.6
40.4
39.6
5 6 7
32.9
44.3
38.6
9 3 6
55.7
35.4
36.3
1.5
8 6
FLIcant to many students
37.6
840.0
533.4
9.5
4
RP
T C
OP
Y A
VA
ILA
BLE
4

TABLE 4
(Coat)
STATLMENT
Total
Sample
(N=106)
Rank
Teachers
'%
(N=70)
Rank
Admin.
(N=36)
Rank
Regular school social work
services not enough for
alternative education
teachers
34.9
935.7
733.4
9.5
Identifying and recruiting
"at risk students"
31.1
10
36.2
7
'leacher spends more time
dealing with the student's
personal and familj,a1 problems
thdn teaching
32.6
10
25.0
11
`'ainstreaming students back
into rei;ular classroom
22.3
1?
4
RF
ST
CO
PY
AV
AIL
AB
LE
4 3

TABLE 5
Percentage of Responses Regarding the Ten most Services
Prohleim; Ranked by Total Sample and School Levels
Statement
Total Sample
Elementary School
N=106)
(N=37)
Rank
1Regular school counseling
services not enough for
alternative education
students
58
1
'.
Obtaining and maintaining
parent support
41.5
2
3.
Lack of a full-time
counselor for alternative
education students
1.
Lack of a full-time aide
in each classroom
5Lack of family counseling
and crisis intervention
Ran
k
Middle School
(N=28)
High School
(N=41)
Rank
Rank
64.8
135.8
261
1
29.7
744
2
41.3
348.6
2-
33
5
40.7
439.7
632.2
3
40.6
545.9
3-
.....
34.6
6
o.
Too much time is spent in
classroom management and
dealing with discipline
problems
40.4
643.2
432
4
Lack of appropriate training
for teachers before being
assigned to alternative
education
39.6
740.5
558.6
1
s.
Traditional curriculum is
not relevant to many
students
37.6
829.6
8
9Regular school social work
st..rvices not enough for al-
t(..rnative education Leachers 31.9
9
4 4
BLS
] CU
N ii
vrilo
wLE
4 5
28.6
526.8
8

TABLE
S(Cont)
!;1;11.cmcnt.
Total Sample
Elementary
School
Middle School
High School
(N=106)
(N=37)
(N=28)
(N=41)
Rank
Rank
Rank
Rank
10.
Lack of clearly defined
procedures for identifying
and
recruiting "at risk
students"
31.1
10
31.7
7
11.
Selecting students that
would most benefit from
the program
27.0
928.2
634.2
4
12.
Lack of appropriate
instructional materials
24.3
1 0
13.
Classrooms physically isolat-
ed from the main buildings
(portables)
21.9
7
1.1.
Not enough time for con-
sultation with individual
students
21.4
8
1.
Lack of support from school
odministrators
24.3
9
I(
lock of team approach in
oddressing the needs of al-
ternative education teachers
-21.3
9
Mainstreaming students hack
inti, regular classrooms
17.8
10
Ldc
),of clearly defined
procedures fur promoting
school attendance
43.9
3
19.
Lack of common planning
time for A.E. teachers
22
10
4C)
BE
ST C
OPY
AV
AIL
AB
I F
47
-
TA
BL
E 6
RA
NK
ING
OF
TO
P T
HR
EE
(3)
IMM
ED
IAT
E B
EN
EF
ITS
TE
AC
HE
RS
AD
MIN
IST
RA
TO
RS
Ele
men
tary
Mid
dle
Hig
hE
lem
enta
ryM
iddl
eH
igh
Sm
alle
r C
lass
esS
mal
ler
Cla
sses
Sm
alle
r C
lass
esS
mal
ler
Cla
sses
Sm
alle
r C
lass
esS
mal
ler
Cla
sses
Cou
nsel
ing
Sel
f-C
once
ptC
ouns
elin
gS
tude
nt S
ucce
ssS
elf-
Con
cept
Pos
itive
Sel
fCon
cept
Pos
itive
Sel
f-C
once
ptC
ouns
elin
gS
tay
in S
choo
lP
ositi
ve S
elf-
Con
cept
Sta
y in
Sch
ool'
-,P
ositi
ve A
ttitu
de to
war
d'E
duca
tion
RA
NK
ING
OF
TO
P T
HR
EE
(3)
FU
TU
RE
BE
NE
FIT
S
TE
AC
HE
RS
AD
MIN
IST
RA
TO
RS
Ele
men
tary
Mid
dle
Hig
hE
lem
enta
ryM
iddl
eH
igh
Sel
f -C
once
ptS
elf-
Con
cept
Gra
duat
e/P
rodu
ctiv
e"C
itize
nsD
ecre
ase
# of
Dro
pout
sD
ecre
ase
# of
Dro
pout
sG
radu
atet
Pro
duct
ive
Citi
zens
Stu
dy/S
urvi
val/C
opin
g S
kills
Pro
duct
ive
Citi
zens
'C
ouns
elin
g'P
ositi
ve S
elf-
Con
cept
Sel
fCon
cept
'P
ositi
ve S
elf-
Con
ceot
Res
pons
ible
Citi
zens
Pos
itive
Atti
tude
Tow
ard
Edu
catio
nLo
wer
Dro
pout
Rat
eS
ee B
enef
its o
f Edu
catio
nP
rodu
ctiv
e C
itize
n'S
uppo
rt G
roup
'Tie
din
ran
king
4,) '
4;)

APPENDIX A
Perceptions of respondents regarding immediate andfuture benefits of alternative education programsindicated in percentage by school level and schoolposition.

ELEMENTARY ADMINISTRATORS
IMMEDIATE BENEFITS
% N
30.8 8 Smaller class size/one-on-one student/teacher ratio23.1 6 Student success/accomplishments19.2 5 Positive self-concept/esteem/motivation11.5 3 Good teachers3.9 1 Students function as class member3.9 1 Education becomes personal3.9 1 Better discipline3.9 1 Alternative curriculum
26
ELEMENTARY ADMINISTRATORS
FUTURE BENEFITS
% N
25.0 6
20.8 5
12.5 3
8.3 2
8.3 2
8.3 2
4.2 1
4.2 1
4.2 1
4.2 1
24
Decrease number of dropoutsStudents positive self/conceptStudents see benefits of educationEarn better gradesMore interested in schoolProductive members of societySpread word about benefits of programVocational aspectsFewer discipline problemsHigher attendance

A - 2
ELEMENTARY TEACHERS
IMMEDIATE BENEFITS
37.9 11 Smaller classes; one-on-one instruction13.8 4 More individual counseling/tutoring10.3 3 Positive self-concept/esteem6.9 2 Good teachers/role models6.9 2 More parental involvement3.5 1 More hands-on experience3.5 1 More problem solving techniques3.5 1 Academic improvement3.5 1 Better Attendance3.5 1 Bonding between teacher and student
29
ELEMENTARY TEACHERS
FUTURE BENEFITS
40.0 6 Self-concept/better attitude/motivation26.7 4 Study/survival/coping skills13.4 2 Become responsible citizens6.7 1 Tutors/mentors in community6.7 1 Positive interaction6.7 1 Self-directing
15
A 3
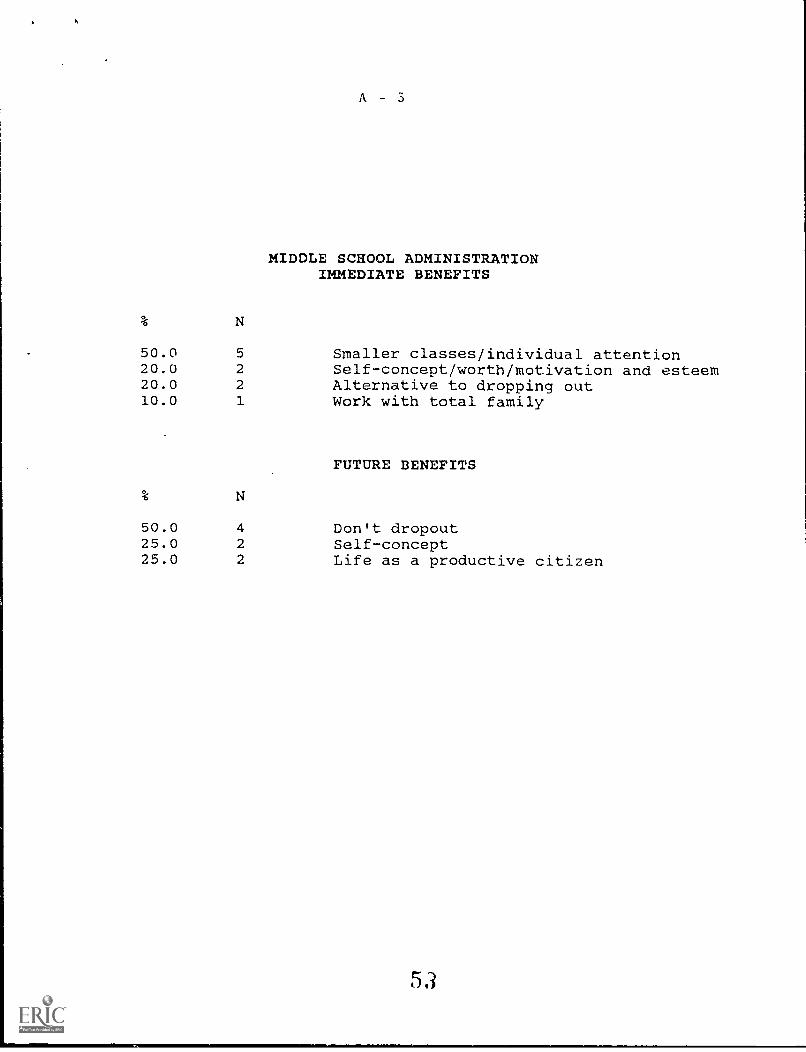
MIDDLE SCHOOL ADMINISTRATIONIMMEDIATE BENEFITS
50.0 5 Smaller classes/individual attention20.0 2 Self-concept/worth/motivation and esteem20.0 2 Alternative to dropping out10.0 1 Work with total family
FUTURE BENEFITS
% N
50.0 4 Don't dropout25.0 2 Self-concept25.0 2 Life as a productive citizen
53

A - 4
MIDDLE SCHOOL TEACHERSIMMEDIATE BENEFITS
33.330.023.3
109
7
Class size smaller/teacher supportMotivation/self confidence plus attitudeCounseling/caring individuals
3.3 1 Better attendance3.3 1 Build prior knowledge base3.3 1 Values education3.3 1 Needs fulfilled, innovative methods
FUTURE BENEFITS
23.8 5 Self-concept/esteem19.1 4 Productive citizens19.1 4 Attitude toward education9.5 2 Don't dropout9.5 2 Goal setting4.8 1 Family needs are met4.8 1 Decision making skills4.8 1 Ability to advance in school4.8 1 Problem solving skills

A - 5
34.813.413.48.78.74.34.34.34.34.3
83
3
22
1
1
1
1
1
HIGH SCHOOL ADMINISTRATORSIMMEDIATE BENEFITS
Smaller classes/personal attitudeMotivation/Success/Self-esteemPositive attitude toward educationOpen learning environmentKeeps in schoolPeer group supportCoordinator to handle paperworkImprove academic skillsStable environmentProblem solving
23
HIGH SCHOOL ADMINISTRATORSFUTURE BENEFITS
33.3 5 Graduation/productive citizens26.7 4 Confidence/self concept13.3 2 Support group6.7 1 Goal setting6.7 1 Number of dropouts6.7 1 Positive attitude toward education6.7 1 Stronger knowledge base
15

A - 6
26.211.99.57.1
115
4
3
HIGH SCHOOL TEACHERSIMMEDIATE BENEFITS
One-on-one teachingCounselingDo not dropoutAllowed to succeed
7.1 3 Self-esteem7.1 3 Group effort -act as a group7.1 3 Offers safe environment4.8 2 Earn credits/better grades4.8 2 Choice of schools4.8 2 Health education2.4 1 School pride2.4 1 Productive citizens2.4 1 Quality curriculum2.4 1 Positive reinforcement
42
HIGH SCHOOL - TEACHERSFUTURE BENEFITS
35.0 7 Graduate - get job - productive citizen35.0 7 Counseling - Interpersonal communication15.0 3 Lower dropout rate10.0 3 More alternatives5.0 1 Attend school of choice
20
5 G

References
Barber, LA., C, McClellan, .C. Looking at America's Oropouts:Who are they? Phi Delta Kappan, 1987, 8, 264-2b7.
Brinkerhoff, R.O., Brethower, Di1. , Hluchytj, T. 11 Nowakowski.Program Evaluation: A Practitioner's Guide_for Trainers andEducators. Norwell, Ma: Kluwer Academic Publishers, 1983.
Brodisky, B. and Keough, R.E. Tackling the at-risk problem. Instudents at-risk: Problems and solutions. AmericanAssociation of School Administrators. Arlington, Virginia,1989.
Fine, M. Why urban adolescents drop into and out of public high.In G. Natriello (ed). Dropouts: Patterns and Policies. NewYork: Teachers College Press, 1987.
Foster, G. & Graham, D. Implementing Problem Surveys. Tallahassee:Evaluation Training Center, Florida State University, 1971.
Johnson,-Frank, H. State Dropout Definitions and Reporting Practices.A paper presented at the annual meeting of the AmericanEducational Research Association, Boston, April, 1990.
Leon County Schools. Comprehensive Dropout Prevention Plan.Tallahassee: Author, 1989.
Ligo, G., Stewart, B., and Wilkinson, D. Making Dropout RatesComparables: .An Analysis of Definitions and Formulas.paper presented at the annual meeting of the AmericanEducational Research Association, Boston, April, 1990.
Natriello, G., Pallas, M.A., McDill, E.L., McPartland, .M.,and Royster, D. An Examination of the Assumptions andEvidence for Alternative Dropout Prevention Programs in HighSchool. Center for Research on Elementary and Middle Schools,1988.
Olson, G.H. Where Have all the Dropouts Gone? Prevailing Estimative':May be too High. A paper presented at the annual meeting ofthe American Educational Research Association, Boston, pril,1990.
Patton, M.O. Qualitative Evaluation Methods. Beverly Hills: Sage,1989.
General Accounting Office. School Dropout,: .-ur%c% of LocalPrograms. Washington: Author, 1987.
'AI1kinson, L.D., & Frazer, L,H. Fine Tuning Drnnout ire.:.1ction ThroughDiscriminant Analysis: The Ethnic Factor. ripor -ro..cnred atthe annual meeting of the American Lduca:lor,l ,ircAssociation, Roston, April, 1990.
ce-vt)