edelweiss presentation template - rakesh...
TRANSCRIPT
Mid-Cap Marvels
RCM Research
Edelweiss – Ideas create, values protect
July 2015
INDEX
2
I Our Core Investment Philosophy (1 of 2)
II Our Core Investment Philosophy (2 of 2)
III Our preferred stocks with philosophy
IV Mid Cap Marvels Stocks
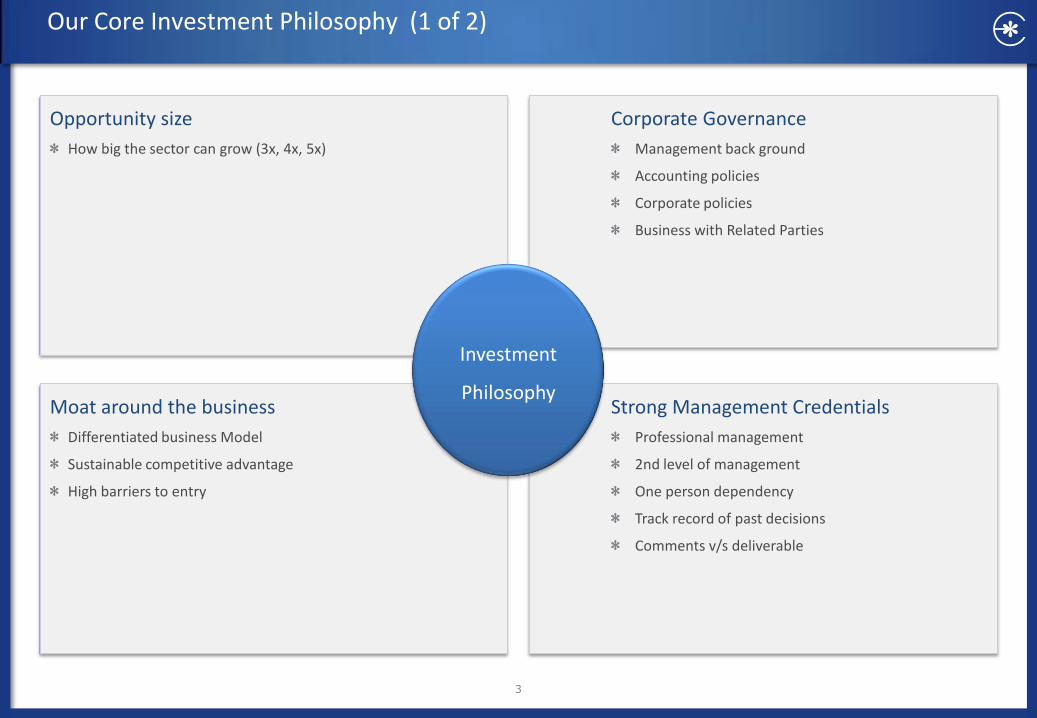
Our Core Investment Philosophy (1 of 2)
3
Opportunity size
How big the sector can grow (3x, 4x, 5x)
Moat around the business
Differentiated business Model
Sustainable competitive advantage
High barriers to entry
Corporate Governance
Management back ground
Accounting policies
Corporate policies
Business with Related Parties
Strong Management Credentials
Professional management
2nd level of management
One person dependency
Track record of past decisions
Comments v/s deliverable
Investment
Philosophy
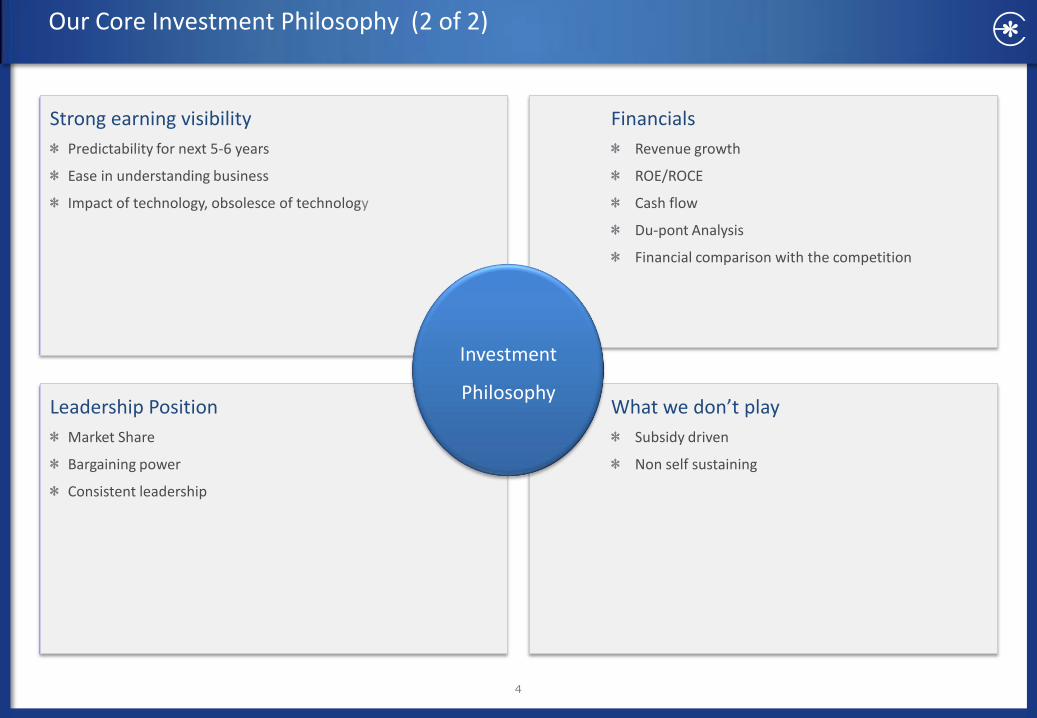
Our Core Investment Philosophy (2 of 2)
4
Strong earning visibility
Predictability for next 5-6 years
Ease in understanding business
Impact of technology, obsolesce of technology
Leadership Position
Market Share
Bargaining power
Consistent leadership
Financials
Revenue growth
ROE/ROCE
Cash flow
Du-pont Analysis
Financial comparison with the competition
What we don’t play
Subsidy driven
Non self sustaining
Investment
Philosophy
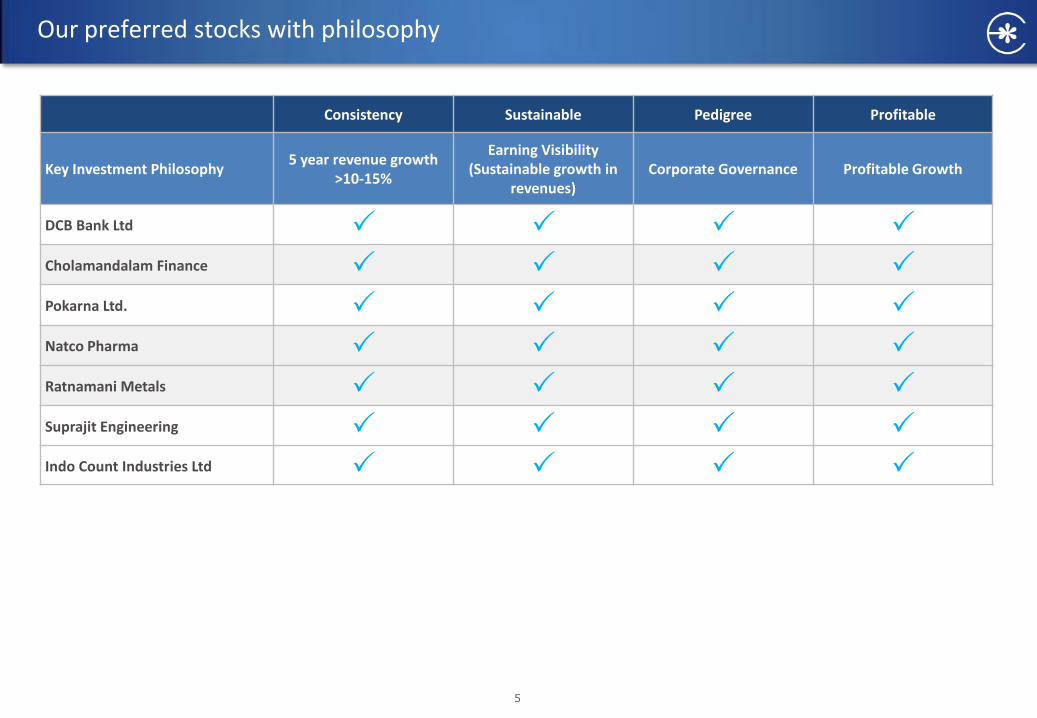
Our preferred stocks with philosophy
5
Consistency Sustainable Pedigree Profitable
Key Investment Philosophy 5 year revenue growth
>10-15%
Earning Visibility (Sustainable growth in
revenues) Corporate Governance Profitable Growth
DCB Bank Ltd Cholamandalam Finance Pokarna Ltd. Natco Pharma Ratnamani Metals Suprajit Engineering Indo Count Industries Ltd
Our Preferred Stocks
6
Ch
ola
man
dal
am
Consistency
Sustainable
Profitable
Pedigree
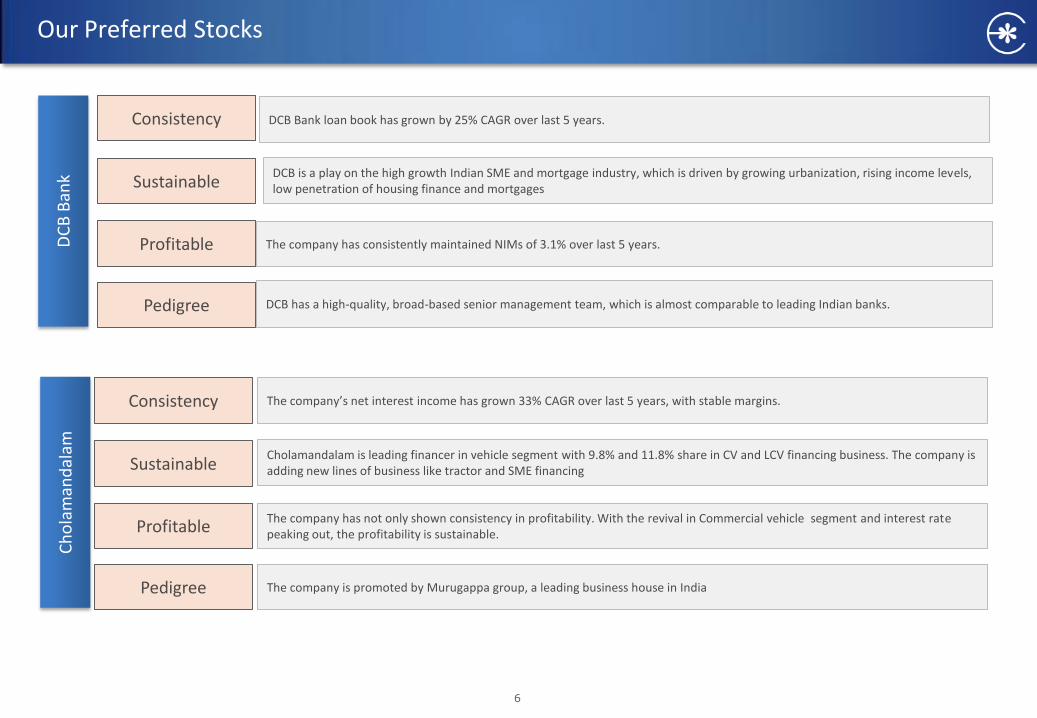
The company’s net interest income has grown 33% CAGR over last 5 years, with stable margins.
Cholamandalam is leading financer in vehicle segment with 9.8% and 11.8% share in CV and LCV financing business. The company is adding new lines of business like tractor and SME financing
The company has not only shown consistency in profitability. With the revival in Commercial vehicle segment and interest rate peaking out, the profitability is sustainable.
The company is promoted by Murugappa group, a leading business house in India
DC
B B
ank
Consistency
Sustainable
Profitable
Pedigree
DCB Bank loan book has grown by 25% CAGR over last 5 years.
DCB is a play on the high growth Indian SME and mortgage industry, which is driven by growing urbanization, rising income levels, low penetration of housing finance and mortgages
The company has consistently maintained NIMs of 3.1% over last 5 years.
DCB has a high-quality, broad-based senior management team, which is almost comparable to leading Indian banks.
Our Preferred Stocks In
do
Co
un
t In
du
stri
es L
td Consistency
Sustainable
Profitable
Pedigree
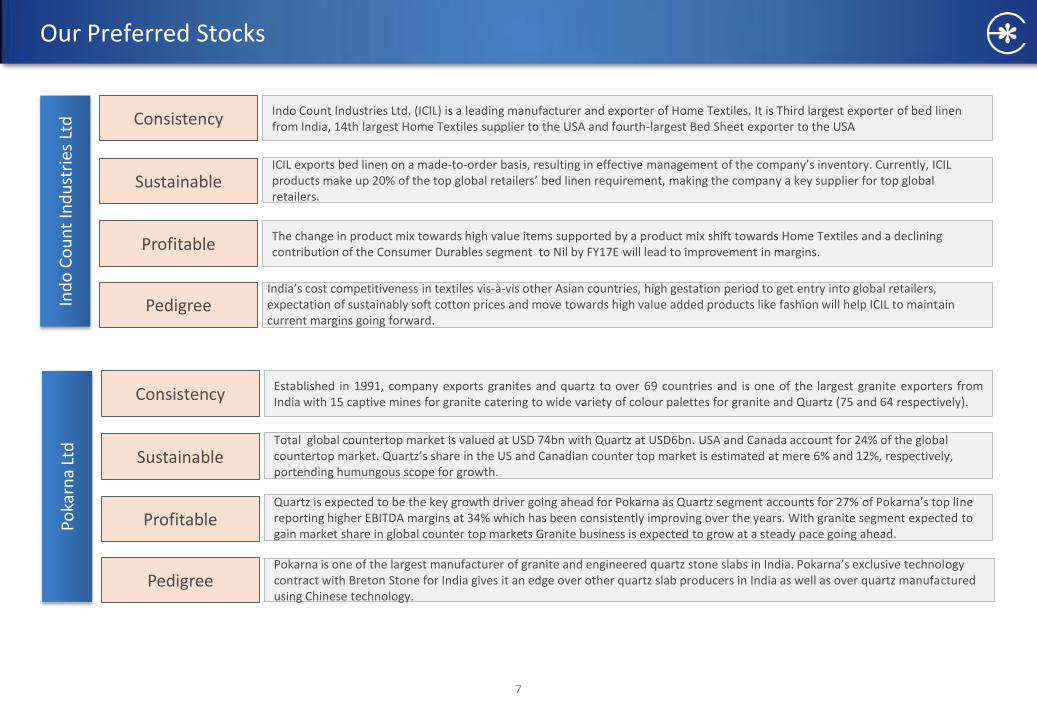
Indo Count Industries Ltd. (ICIL) is a leading manufacturer and exporter of Home Textiles. It is Third largest exporter of bed linen from India, 14th largest Home Textiles supplier to the USA and fourth-largest Bed Sheet exporter to the USA
ICIL exports bed linen on a made-to-order basis, resulting in effective management of the company’s inventory. Currently, ICIL products make up 20% of the top global retailers’ bed linen requirement, making the company a key supplier for top global retailers.
The change in product mix towards high value items supported by a product mix shift towards Home Textiles and a declining contribution of the Consumer Durables segment to Nil by FY17E will lead to improvement in margins.
India’s cost competitiveness in textiles vis-à-vis other Asian countries, high gestation period to get entry into global retailers, expectation of sustainably soft cotton prices and move towards high value added products like fashion will help ICIL to maintain current margins going forward.
7
Poka
rna
Ltd
Consistency
Sustainable
Profitable
Pedigree
Established in 1991, company exports granites and quartz to over 69 countries and is one of the largest granite exporters from India with 15 captive mines for granite catering to wide variety of colour palettes for granite and Quartz (75 and 64 respectively). Total global countertop market is valued at USD 74bn with Quartz at USD6bn. USA and Canada account for 24% of the global countertop market. Quartz’s share in the US and Canadian counter top market is estimated at mere 6% and 12%, respectively, portending humungous scope for growth. Quartz is expected to be the key growth driver going ahead for Pokarna as Quartz segment accounts for 27% of Pokarna’s top line reporting higher EBITDA margins at 34% which has been consistently improving over the years. With granite segment expected to gain market share in global counter top markets Granite business is expected to grow at a steady pace going ahead. Pokarna is one of the largest manufacturer of granite and engineered quartz stone slabs in India. Pokarna’s exclusive technology contract with Breton Stone for India gives it an edge over other quartz slab producers in India as well as over quartz manufactured using Chinese technology.
Our Preferred Stocks R
atn
aman
i Met
als
& T
ub
es
Consistency
Sustainable
Profitable
Pedigree
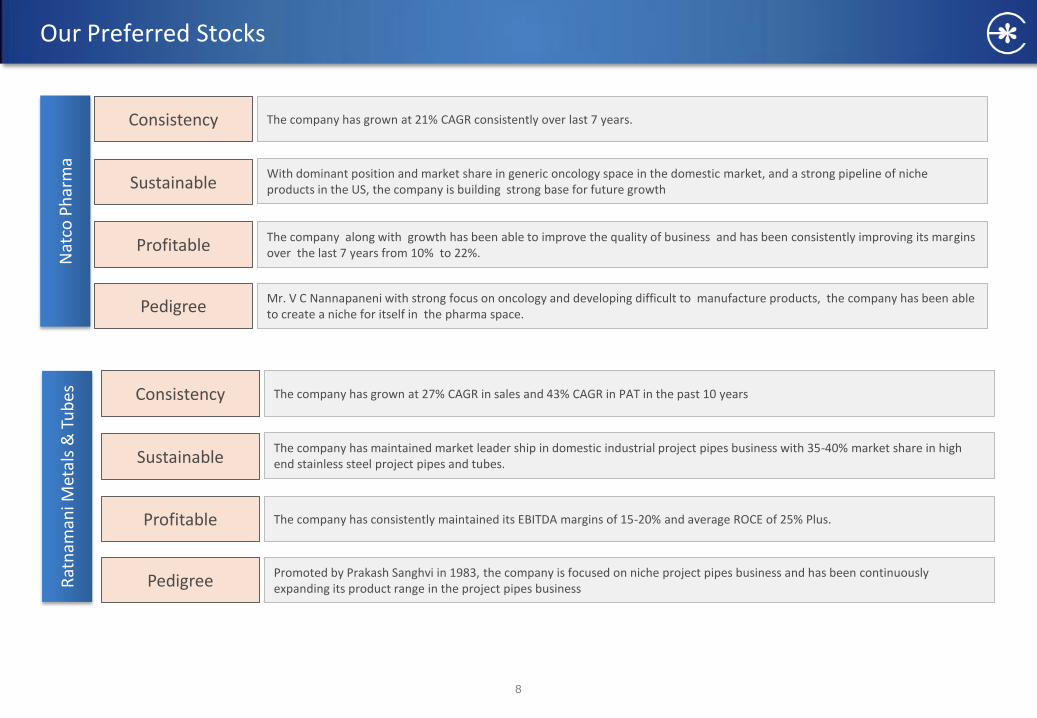
The company has grown at 27% CAGR in sales and 43% CAGR in PAT in the past 10 years
The company has maintained market leader ship in domestic industrial project pipes business with 35-40% market share in high end stainless steel project pipes and tubes.
The company has consistently maintained its EBITDA margins of 15-20% and average ROCE of 25% Plus.
Promoted by Prakash Sanghvi in 1983, the company is focused on niche project pipes business and has been continuously expanding its product range in the project pipes business
Nat
co P
har
ma
Consistency
Sustainable
Profitable
Pedigree
The company has grown at 21% CAGR consistently over last 7 years.
With dominant position and market share in generic oncology space in the domestic market, and a strong pipeline of niche products in the US, the company is building strong base for future growth
The company along with growth has been able to improve the quality of business and has been consistently improving its margins over the last 7 years from 10% to 22%.
Mr. V C Nannapaneni with strong focus on oncology and developing difficult to manufacture products, the company has been able to create a niche for itself in the pharma space.
8
Our Preferred Stocks Su
pra
jit E
ngi
nee
rin
g Lt
d Consistency
Sustainable
Profitable
Pedigree
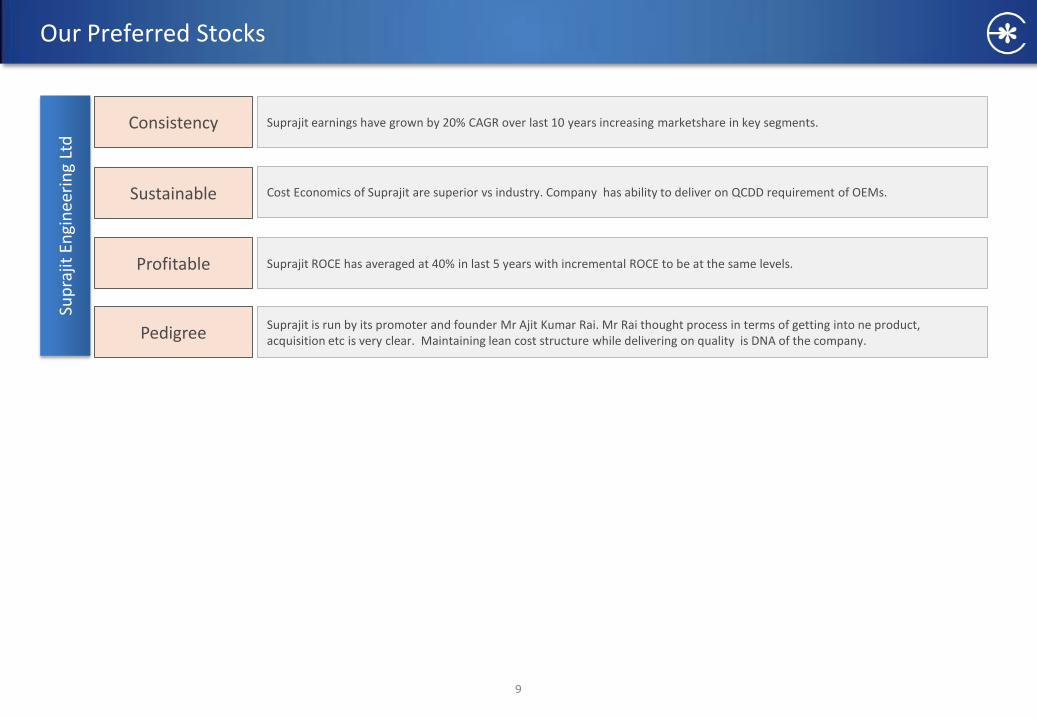
Suprajit earnings have grown by 20% CAGR over last 10 years increasing marketshare in key segments.
Cost Economics of Suprajit are superior vs industry. Company has ability to deliver on QCDD requirement of OEMs.
Suprajit ROCE has averaged at 40% in last 5 years with incremental ROCE to be at the same levels.
Suprajit is run by its promoter and founder Mr Ajit Kumar Rai. Mr Rai thought process in terms of getting into ne product, acquisition etc is very clear. Maintaining lean cost structure while delivering on quality is DNA of the company.
9
Edelweiss Mid-Cap Marvels
10
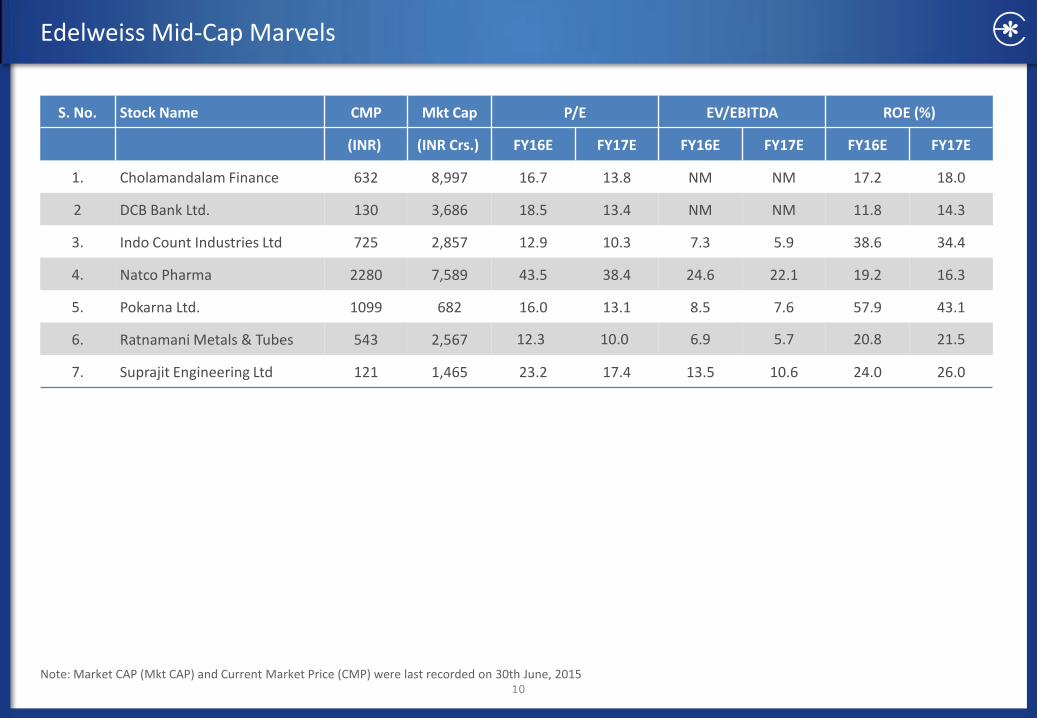
Note: Market CAP (Mkt CAP) and Current Market Price (CMP) were last recorded on 30th June, 2015
S. No. Stock Name CMP Mkt Cap P/E EV/EBITDA ROE (%)
(INR) (INR Crs.) FY16E FY17E FY16E FY17E FY16E FY17E
1. Cholamandalam Finance 632 8,997 16.7 13.8 NM NM 17.2 18.0
2 DCB Bank Ltd. 130 3,686 18.5 13.4 NM NM 11.8 14.3
3. Indo Count Industries Ltd 725 2,857 12.9 10.3 7.3 5.9 38.6 34.4
4. Natco Pharma 2280 7,589 43.5 38.4 24.6 22.1 19.2 16.3
5. Pokarna Ltd. 1099 682 16.0 13.1 8.5 7.6 57.9 43.1
6. Ratnamani Metals & Tubes 543 2,567 12.3 10.0 6.9 5.7 20.8 21.5
7. Suprajit Engineering Ltd 121 1,465 23.2 17.4 13.5 10.6 24.0 26.0

11
Cholamandalam Investment (CMP: INR 632; Mkt Cap: INR 8,997 crs)
Business Overview
Retail finance company, promoted by Murugappa group, with focus on vehicle finance and loan against property
Vehicle finance constitute 69% of AUM and home equity constitute 29% of AUM
Within vehicle finance, the focus is on small road transport operators
Within home equity, 89% of loan is against self occupied residential property.
Company has 534 branches (90% in Tier II, Tier III and Tier IV towns)
Opportunity Size: -
CV sales growth over last 2 years was worst in 10 years. There will be growth due to uptick in pent up demand
Company is adding new lines of business like tractor financing, rural financing, SME financing, both working capital and term loan
Year to March FY13 FY14 FY15 FY16E FY17E
Net Interest Income (INR cr) 1,107 1,459 1,654 1,991 2,432
Net Profit after tax (INR cr) 307 364 433 587 712
Adjusted BV per share 137 160 221 235 274
Dilute EPS (Rs.) 21.4 25.4 30.2 37.8 45.8
Gross NPA ratio (%) 1.0 1.9 2.7 2.5 2.1
Net NPA ratio (%) 0.2 0.7 1.4 1.3 0.9
Price/Adj. Book Value(x) 4.6 3.9 2.9 2.7 2.3
Price/Earnings (x) 29.6 24.9 20.9 16.7 13.8
Name of the Shareholder Shares as % of Total No. of
Shares
Promoter 58.76
Norwest Venture Partners X Fii – Mauritius 4.93
Creador I Llc 4.61
Amansa Holdings Private Limited 4.28
International Finance Corporation 4.12
60
110
160
210
260
310
Jan
-14
Feb
-14
Mar
-14
Ap
r-1
4
May
-14
Jun
-14
Jul-
14
Au
g-1
4
Sep
-14
Oct
-14
No
v-1
4
Dec
-14
Jan
-15
Feb
-15
Mar
-15
Ap
r-1
5
May
-15
Chola Sensex
12
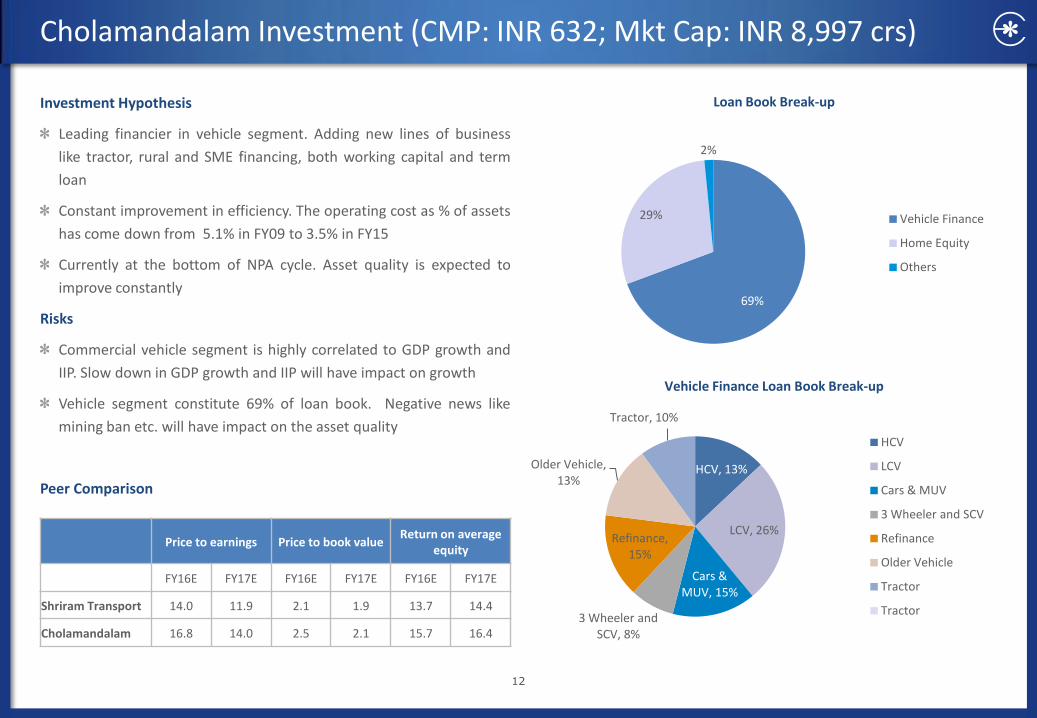
Cholamandalam Investment (CMP: INR 632; Mkt Cap: INR 8,997 crs)
Investment Hypothesis
Leading financier in vehicle segment. Adding new lines of business
like tractor, rural and SME financing, both working capital and term
loan
Constant improvement in efficiency. The operating cost as % of assets
has come down from 5.1% in FY09 to 3.5% in FY15
Currently at the bottom of NPA cycle. Asset quality is expected to
improve constantly
Risks
Commercial vehicle segment is highly correlated to GDP growth and
IIP. Slow down in GDP growth and IIP will have impact on growth
Vehicle segment constitute 69% of loan book. Negative news like
mining ban etc. will have impact on the asset quality
Peer Comparison
Vehicle Finance Loan Book Break-up
69%
29%
2%
Vehicle Finance
Home Equity
Others
HCV, 13%
LCV, 26%
Cars & MUV, 15%
3 Wheeler and SCV, 8%
Refinance, 15%
Older Vehicle, 13%
Tractor, 10%
HCV
LCV
Cars & MUV
3 Wheeler and SCV
Refinance
Older Vehicle
Tractor
Tractor
Loan Book Break-up
Price to earnings Price to book value Return on average
equity
FY16E FY17E FY16E FY17E FY16E FY17E
Shriram Transport 14.0 11.9 2.1 1.9 13.7 14.4
Cholamandalam 16.8 14.0 2.5 2.1 15.7 16.4
13
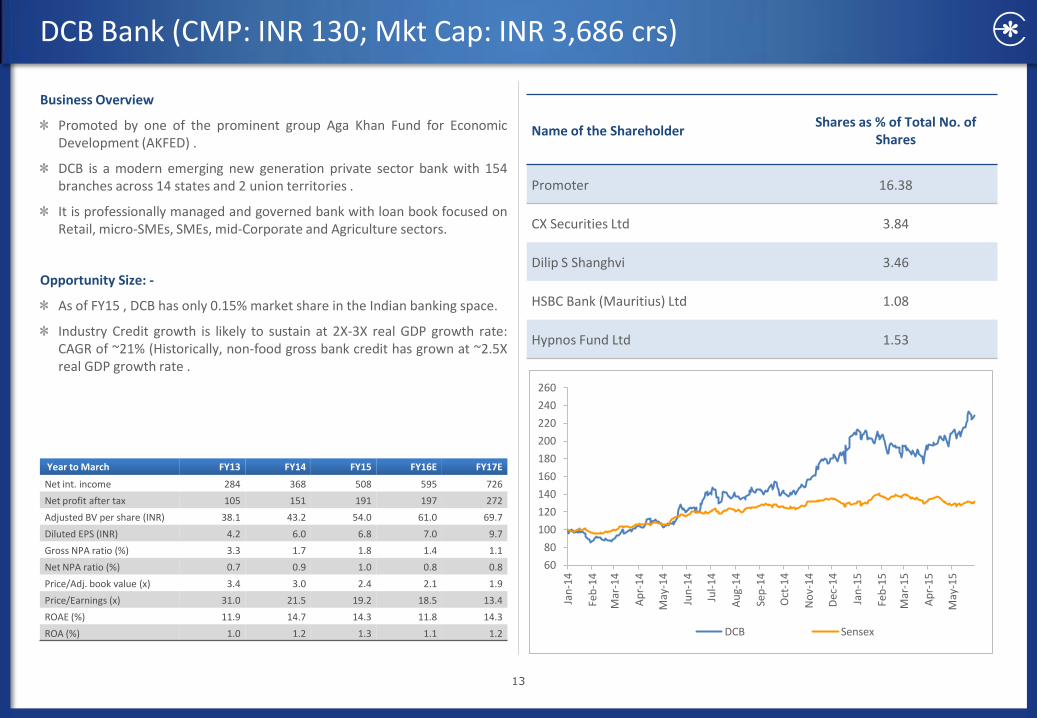
DCB Bank (CMP: INR 130; Mkt Cap: INR 3,686 crs)
Business Overview
Promoted by one of the prominent group Aga Khan Fund for Economic Development (AKFED) .
DCB is a modern emerging new generation private sector bank with 154 branches across 14 states and 2 union territories .
It is professionally managed and governed bank with loan book focused on Retail, micro-SMEs, SMEs, mid-Corporate and Agriculture sectors.
Opportunity Size: -
As of FY15 , DCB has only 0.15% market share in the Indian banking space.
Industry Credit growth is likely to sustain at 2X-3X real GDP growth rate: CAGR of ~21% (Historically, non-food gross bank credit has grown at ~2.5X real GDP growth rate .
Year to March FY13 FY14 FY15 FY16E FY17E
Net int. income 284 368 508 595 726
Net profit after tax 105 151 191 197 272
Adjusted BV per share (INR) 38.1 43.2 54.0 61.0 69.7
Diluted EPS (INR) 4.2 6.0 6.8 7.0 9.7
Gross NPA ratio (%) 3.3 1.7 1.8 1.4 1.1
Net NPA ratio (%) 0.7 0.9 1.0 0.8 0.8
Price/Adj. book value (x) 3.4 3.0 2.4 2.1 1.9
Price/Earnings (x) 31.0 21.5 19.2 18.5 13.4
ROAE (%) 11.9 14.7 14.3 11.8 14.3
ROA (%) 1.0 1.2 1.3 1.1 1.2
Name of the Shareholder Shares as % of Total No. of
Shares
Promoter 16.38
CX Securities Ltd 3.84
Dilip S Shanghvi 3.46
HSBC Bank (Mauritius) Ltd 1.08
Hypnos Fund Ltd 1.53
60
80
100
120
140
160
180
200
220
240
260
Jan
-14
Feb
-14
Mar
-14
Ap
r-1
4
May
-14
Jun
-14
Jul-
14
Au
g-1
4
Sep
-14
Oct
-14
No
v-1
4
Dec
-14
Jan
-15
Feb
-15
Mar
-15
Ap
r-1
5
May
-15
DCB Sensex
14
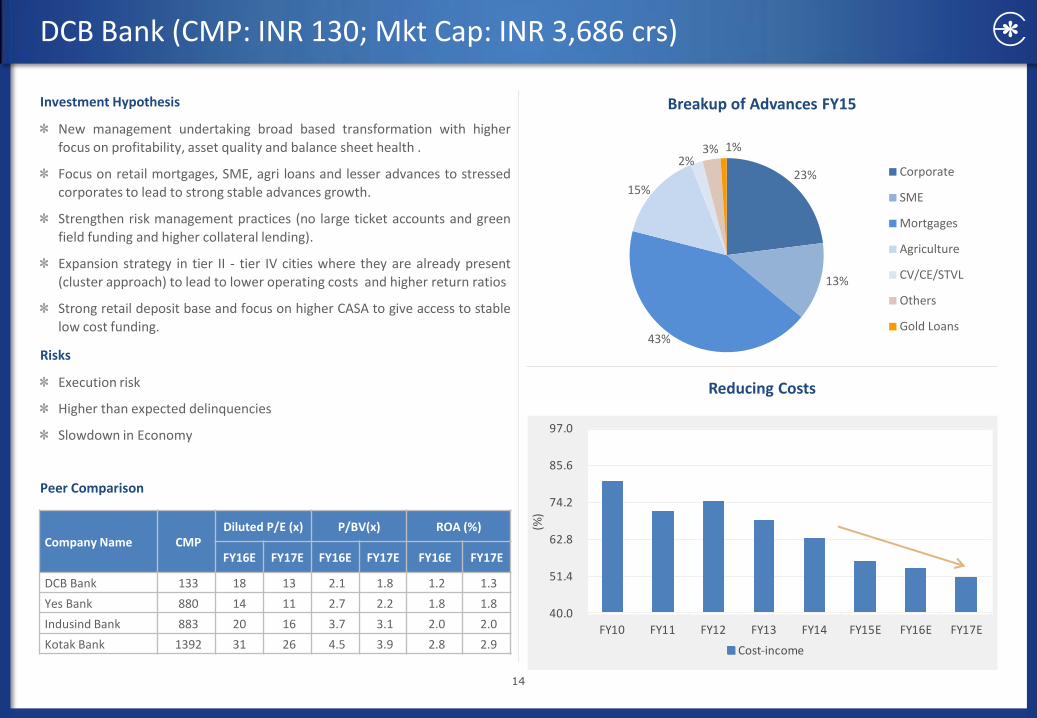
DCB Bank (CMP: INR 130; Mkt Cap: INR 3,686 crs)
Investment Hypothesis
New management undertaking broad based transformation with higher focus on profitability, asset quality and balance sheet health .
Focus on retail mortgages, SME, agri loans and lesser advances to stressed corporates to lead to strong stable advances growth.
Strengthen risk management practices (no large ticket accounts and green
field funding and higher collateral lending).
Expansion strategy in tier II - tier IV cities where they are already present
(cluster approach) to lead to lower operating costs and higher return ratios
Strong retail deposit base and focus on higher CASA to give access to stable
low cost funding.
Risks
Execution risk
Higher than expected delinquencies
Slowdown in Economy
Peer Comparison
Breakup of Advances FY15
Reducing Costs
Company Name CMP Diluted P/E (x) P/BV(x) ROA (%)
FY16E FY17E FY16E FY17E FY16E FY17E
DCB Bank 133 18 13 2.1 1.8 1.2 1.3
Yes Bank 880 14 11 2.7 2.2 1.8 1.8
Indusind Bank 883 20 16 3.7 3.1 2.0 2.0
Kotak Bank 1392 31 26 4.5 3.9 2.8 2.9
40.0
51.4
62.8
74.2
85.6
97.0
FY10 FY11 FY12 FY13 FY14 FY15E FY16E FY17E
(%)
Cost-income
23%
13%
43%
15%
2% 3% 1%
Corporate
SME
Mortgages
Agriculture
CV/CE/STVL
Others
Gold Loans
15
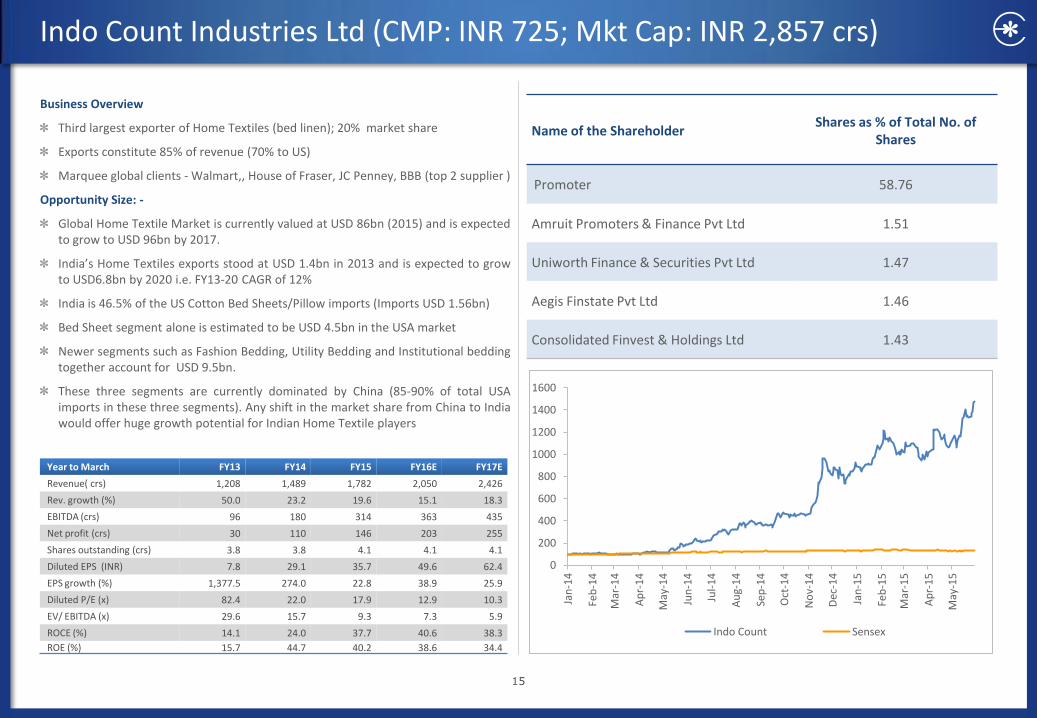
Indo Count Industries Ltd (CMP: INR 725; Mkt Cap: INR 2,857 crs)
Business Overview
Third largest exporter of Home Textiles (bed linen); 20% market share
Exports constitute 85% of revenue (70% to US)
Marquee global clients - Walmart,, House of Fraser, JC Penney, BBB (top 2 supplier )
Opportunity Size: -
Global Home Textile Market is currently valued at USD 86bn (2015) and is expected to grow to USD 96bn by 2017.
India’s Home Textiles exports stood at USD 1.4bn in 2013 and is expected to grow to USD6.8bn by 2020 i.e. FY13-20 CAGR of 12%
India is 46.5% of the US Cotton Bed Sheets/Pillow imports (Imports USD 1.56bn)
Bed Sheet segment alone is estimated to be USD 4.5bn in the USA market
Newer segments such as Fashion Bedding, Utility Bedding and Institutional bedding together account for USD 9.5bn.
These three segments are currently dominated by China (85-90% of total USA imports in these three segments). Any shift in the market share from China to India would offer huge growth potential for Indian Home Textile players
Year to March FY13 FY14 FY15 FY16E FY17E
Revenue( crs) 1,208 1,489 1,782 2,050 2,426
Rev. growth (%) 50.0 23.2 19.6 15.1 18.3
EBITDA (crs) 96 180 314 363 435
Net profit (crs) 30 110 146 203 255
Shares outstanding (crs) 3.8 3.8 4.1 4.1 4.1
Diluted EPS (INR) 7.8 29.1 35.7 49.6 62.4
EPS growth (%) 1,377.5 274.0 22.8 38.9 25.9
Diluted P/E (x) 82.4 22.0 17.9 12.9 10.3
EV/ EBITDA (x) 29.6 15.7 9.3 7.3 5.9
ROCE (%) 14.1 24.0 37.7 40.6 38.3
ROE (%) 15.7 44.7 40.2 38.6 34.4
Name of the Shareholder Shares as % of Total No. of
Shares
Promoter 58.76
Amruit Promoters & Finance Pvt Ltd 1.51
Uniworth Finance & Securities Pvt Ltd 1.47
Aegis Finstate Pvt Ltd 1.46
Consolidated Finvest & Holdings Ltd 1.43
0
200
400
600
800
1000
1200
1400
1600
Jan
-14
Feb
-14
Mar
-14
Ap
r-1
4
May
-14
Jun
-14
Jul-
14
Au
g-1
4
Sep
-14
Oct
-14
No
v-1
4
Dec
-14
Jan
-15
Feb
-15
Mar
-15
Ap
r-1
5
May
-15
Indo Count Sensex
16
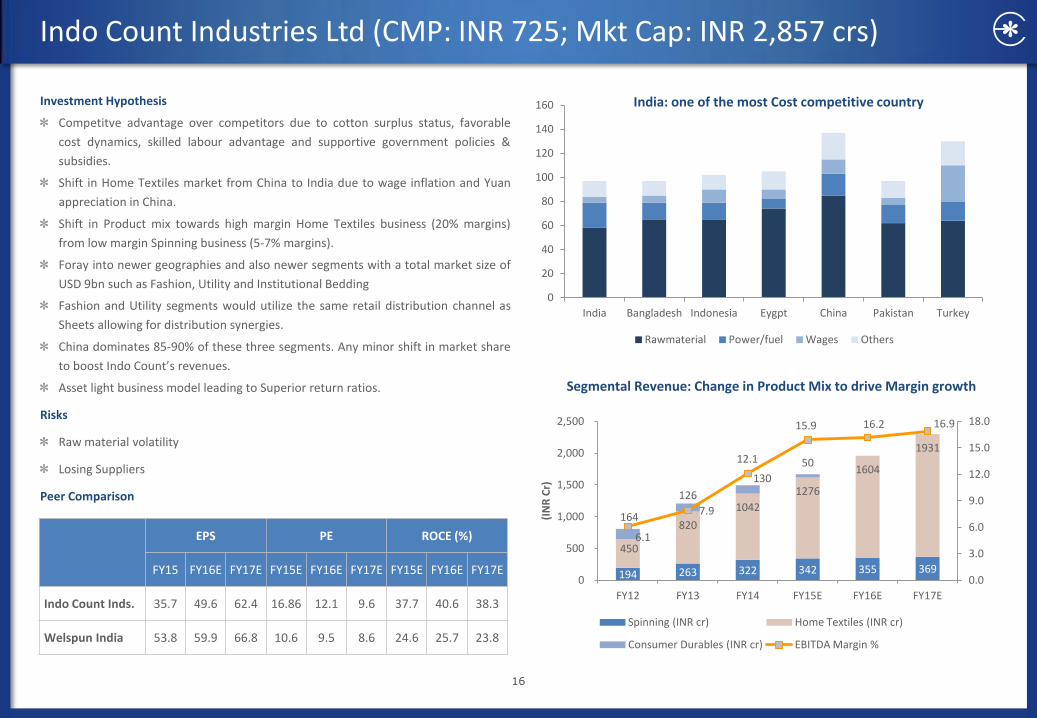
Indo Count Industries Ltd (CMP: INR 725; Mkt Cap: INR 2,857 crs)
Investment Hypothesis
Competitve advantage over competitors due to cotton surplus status, favorable
cost dynamics, skilled labour advantage and supportive government policies &
subsidies.
Shift in Home Textiles market from China to India due to wage inflation and Yuan
appreciation in China.
Shift in Product mix towards high margin Home Textiles business (20% margins)
from low margin Spinning business (5-7% margins).
Foray into newer geographies and also newer segments with a total market size of
USD 9bn such as Fashion, Utility and Institutional Bedding
Fashion and Utility segments would utilize the same retail distribution channel as
Sheets allowing for distribution synergies.
China dominates 85-90% of these three segments. Any minor shift in market share
to boost Indo Count’s revenues.
Asset light business model leading to Superior return ratios.
Risks
Raw material volatility
Losing Suppliers
Peer Comparison
EPS PE ROCE (%)
FY15 FY16E FY17E FY15E FY16E FY17E FY15E FY16E FY17E
Indo Count Inds. 35.7 49.6 62.4 16.86 12.1 9.6 37.7 40.6 38.3
Welspun India 53.8 59.9 66.8 10.6 9.5 8.6 24.6 25.7 23.8
194 263 322 342 355 369
450
820
1042
1276
1604
1931
164
126
130
50
6.1
7.9
12.1
15.9 16.2 16.9
0.0
3.0
6.0
9.0
12.0
15.0
18.0
0
500
1,000
1,500
2,000
2,500
FY12 FY13 FY14 FY15E FY16E FY17E
(IN
R C
r)
Spinning (INR cr) Home Textiles (INR cr)
Consumer Durables (INR cr) EBITDA Margin %
Segmental Revenue: Change in Product Mix to drive Margin growth
0
20
40
60
80
100
120
140
160
India Bangladesh Indonesia Eygpt China Pakistan Turkey
India: one of the most Cost competitive country
Rawmaterial Power/fuel Wages Others
17
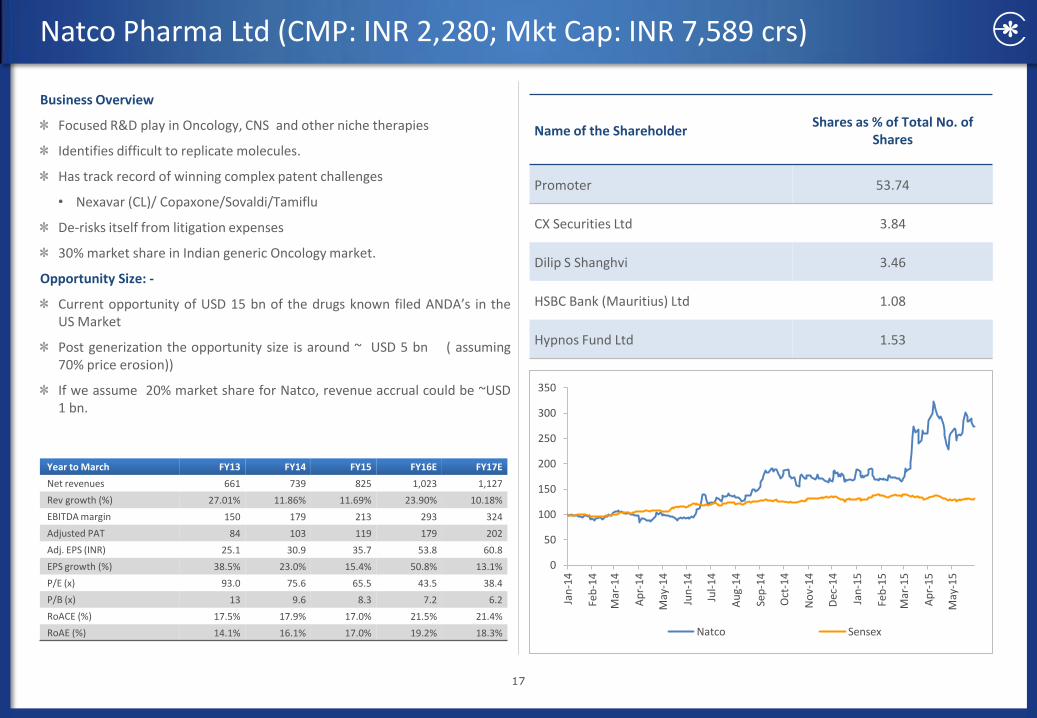
Natco Pharma Ltd (CMP: INR 2,280; Mkt Cap: INR 7,589 crs)
Business Overview
Focused R&D play in Oncology, CNS and other niche therapies
Identifies difficult to replicate molecules.
Has track record of winning complex patent challenges
• Nexavar (CL)/ Copaxone/Sovaldi/Tamiflu
De-risks itself from litigation expenses
30% market share in Indian generic Oncology market.
Opportunity Size: -
Current opportunity of USD 15 bn of the drugs known filed ANDA’s in the US Market
Post generization the opportunity size is around ~ USD 5 bn ( assuming 70% price erosion))
If we assume 20% market share for Natco, revenue accrual could be ~USD 1 bn.
Year to March FY13 FY14 FY15 FY16E FY17E
Net revenues 661 739 825 1,023 1,127
Rev growth (%) 27.01% 11.86% 11.69% 23.90% 10.18%
EBITDA margin 150 179 213 293 324
Adjusted PAT 84 103 119 179 202
Adj. EPS (INR) 25.1 30.9 35.7 53.8 60.8
EPS growth (%) 38.5% 23.0% 15.4% 50.8% 13.1%
P/E (x) 93.0 75.6 65.5 43.5 38.4
P/B (x) 13 9.6 8.3 7.2 6.2
RoACE (%) 17.5% 17.9% 17.0% 21.5% 21.4%
RoAE (%) 14.1% 16.1% 17.0% 19.2% 18.3%
Name of the Shareholder Shares as % of Total No. of
Shares
Promoter 53.74
CX Securities Ltd 3.84
Dilip S Shanghvi 3.46
HSBC Bank (Mauritius) Ltd 1.08
Hypnos Fund Ltd 1.53
0
50
100
150
200
250
300
350
Jan
-14
Feb
-14
Mar
-14
Ap
r-1
4
May
-14
Jun
-14
Jul-
14
Au
g-1
4
Sep
-14
Oct
-14
No
v-1
4
Dec
-14
Jan
-15
Feb
-15
Mar
-15
Ap
r-1
5
May
-15
Natco Sensex
18
Natco Pharma Ltd (CMP: INR 2,280; Mkt Cap: INR 7,589 crs)
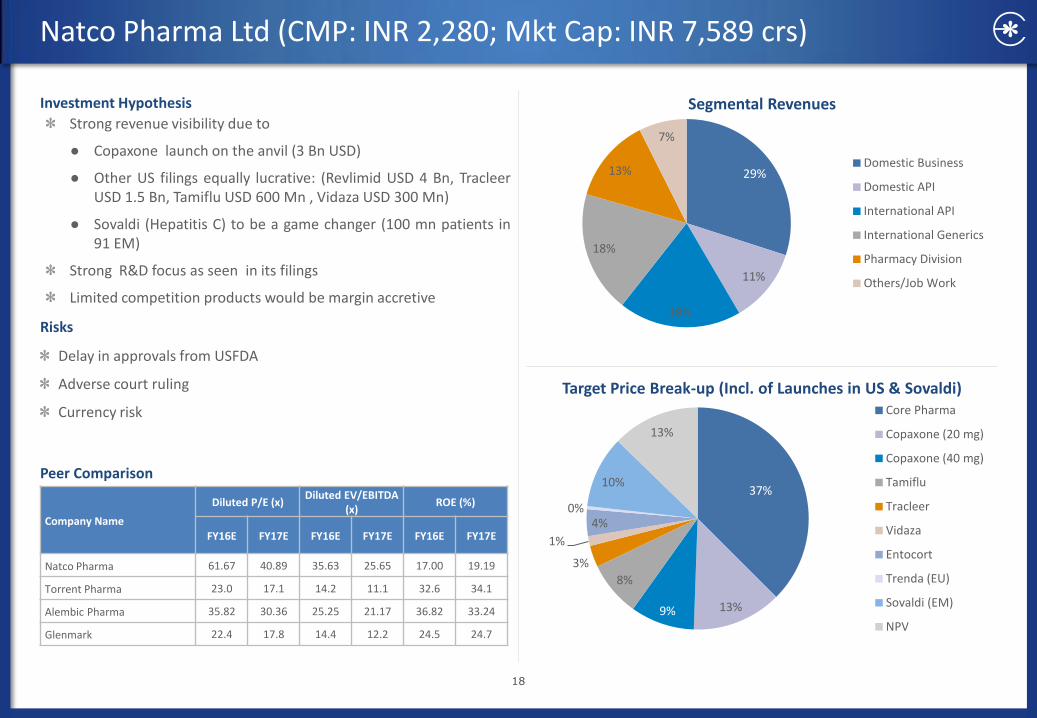
Investment Hypothesis
Strong revenue visibility due to
● Copaxone launch on the anvil (3 Bn USD)
● Other US filings equally lucrative: (Revlimid USD 4 Bn, Tracleer USD 1.5 Bn, Tamiflu USD 600 Mn , Vidaza USD 300 Mn)
● Sovaldi (Hepatitis C) to be a game changer (100 mn patients in 91 EM)
Strong R&D focus as seen in its filings
Limited competition products would be margin accretive
Risks
Delay in approvals from USFDA
Adverse court ruling
Currency risk
Peer Comparison
Segmental Revenues
Target Price Break-up (Incl. of Launches in US & Sovaldi)
Company Name
Diluted P/E (x) Diluted EV/EBITDA
(x) ROE (%)
FY16E FY17E FY16E FY17E FY16E FY17E
Natco Pharma 61.67 40.89 35.63 25.65 17.00 19.19
Torrent Pharma 23.0 17.1 14.2 11.1 32.6 34.1
Alembic Pharma 35.82 30.36 25.25 21.17 36.82 33.24
Glenmark 22.4 17.8 14.4 12.2 24.5 24.7
37%
13% 9%
8%
3%
1%
4% 0%
10%
13%
Core Pharma
Copaxone (20 mg)
Copaxone (40 mg)
Tamiflu
Tracleer
Vidaza
Entocort
Trenda (EU)
Sovaldi (EM)
NPV
29%
11%
18%
18%
13%
7%
Domestic Business
Domestic API
International API
International Generics
Pharmacy Division
Others/Job Work
19
Pokarna Ltd (CMP: INR 1,099; Mkt Cap: INR 682 crs)
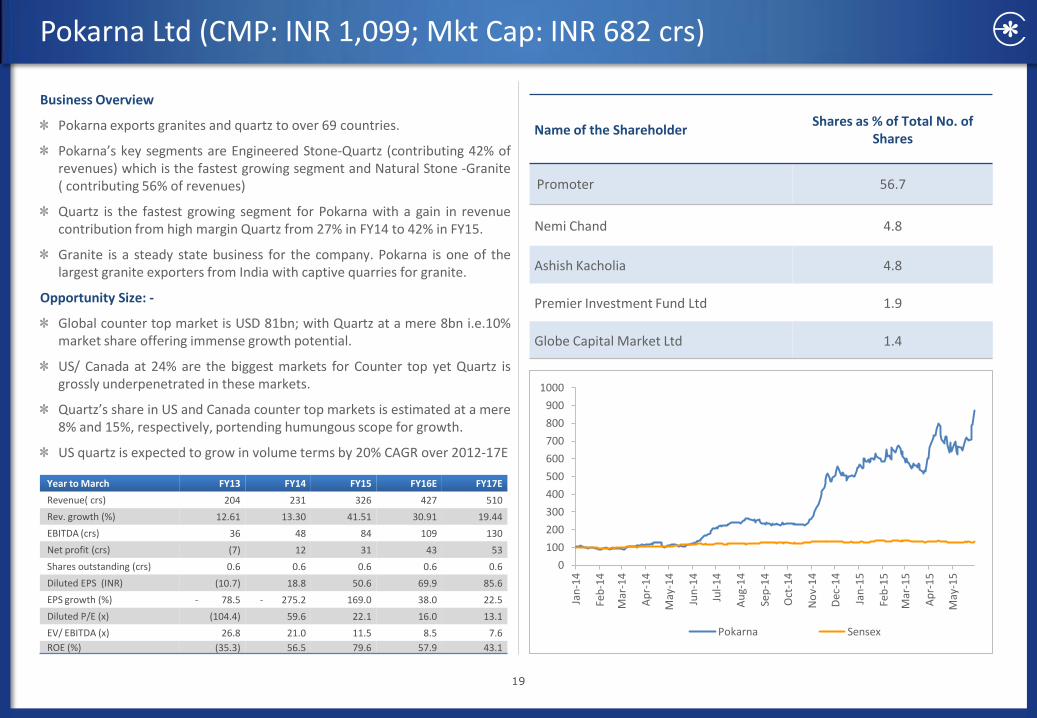
Business Overview
Pokarna exports granites and quartz to over 69 countries.
Pokarna’s key segments are Engineered Stone-Quartz (contributing 42% of revenues) which is the fastest growing segment and Natural Stone -Granite ( contributing 56% of revenues)
Quartz is the fastest growing segment for Pokarna with a gain in revenue contribution from high margin Quartz from 27% in FY14 to 42% in FY15.
Granite is a steady state business for the company. Pokarna is one of the largest granite exporters from India with captive quarries for granite.
Opportunity Size: -
Global counter top market is USD 81bn; with Quartz at a mere 8bn i.e.10% market share offering immense growth potential.
US/ Canada at 24% are the biggest markets for Counter top yet Quartz is grossly underpenetrated in these markets.
Quartz’s share in US and Canada counter top markets is estimated at a mere 8% and 15%, respectively, portending humungous scope for growth.
US quartz is expected to grow in volume terms by 20% CAGR over 2012-17E
Year to March FY13 FY14 FY15 FY16E FY17E
Revenue( crs) 204 231 326 427 510
Rev. growth (%) 12.61 13.30 41.51 30.91 19.44
EBITDA (crs) 36 48 84 109 130
Net profit (crs) (7) 12 31 43 53
Shares outstanding (crs) 0.6 0.6 0.6 0.6 0.6
Diluted EPS (INR) (10.7) 18.8 50.6 69.9 85.6
EPS growth (%) - 78.5 - 275.2 169.0 38.0 22.5
Diluted P/E (x) (104.4) 59.6 22.1 16.0 13.1
EV/ EBITDA (x) 26.8 21.0 11.5 8.5 7.6
ROE (%) (35.3) 56.5 79.6 57.9 43.1
Name of the Shareholder Shares as % of Total No. of
Shares
Promoter 56.7
Nemi Chand 4.8
Ashish Kacholia 4.8
Premier Investment Fund Ltd 1.9
Globe Capital Market Ltd 1.4
0
100
200
300
400
500
600
700
800
900
1000
Jan
-14
Feb
-14
Mar
-14
Ap
r-1
4
May
-14
Jun
-14
Jul-
14
Au
g-1
4
Sep
-14
Oct
-14
No
v-1
4
Dec
-14
Jan
-15
Feb
-15
Mar
-15
Ap
r-1
5
May
-15
Pokarna Sensex
20
Pokarna Ltd (CMP: INR 1,099; Mkt Cap: INR 682 crs)
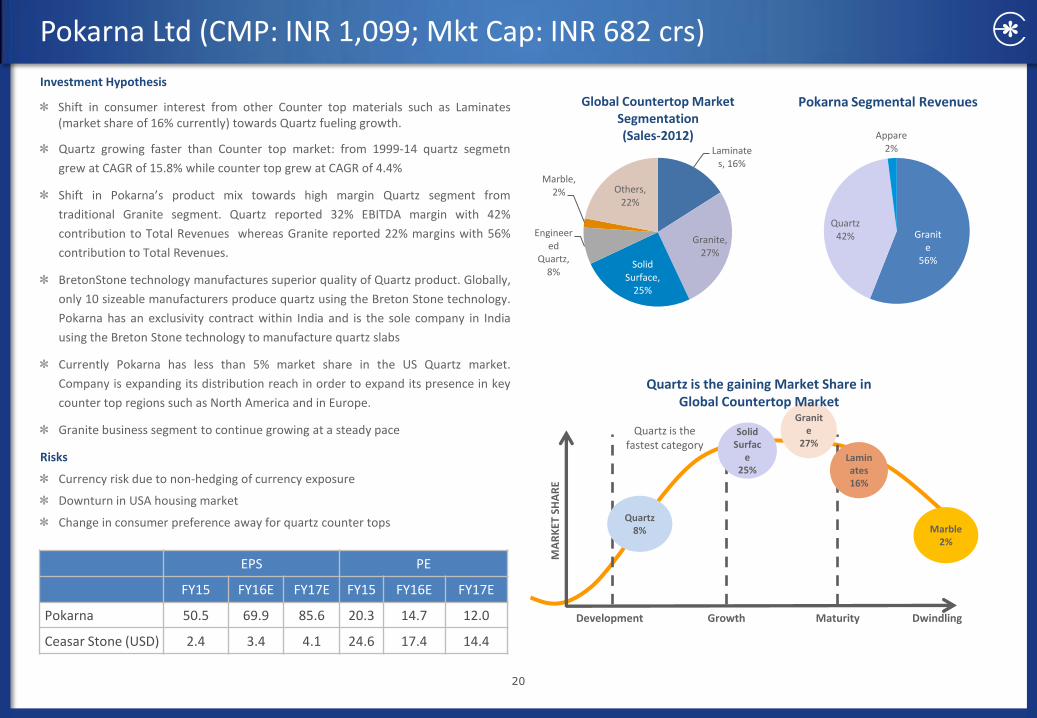
Investment Hypothesis
Shift in consumer interest from other Counter top materials such as Laminates (market share of 16% currently) towards Quartz fueling growth.
Quartz growing faster than Counter top market: from 1999-14 quartz segmetn
grew at CAGR of 15.8% while counter top grew at CAGR of 4.4%
Shift in Pokarna’s product mix towards high margin Quartz segment from
traditional Granite segment. Quartz reported 32% EBITDA margin with 42%
contribution to Total Revenues whereas Granite reported 22% margins with 56%
contribution to Total Revenues.
BretonStone technology manufactures superior quality of Quartz product. Globally,
only 10 sizeable manufacturers produce quartz using the Breton Stone technology.
Pokarna has an exclusivity contract within India and is the sole company in India
using the Breton Stone technology to manufacture quartz slabs
Currently Pokarna has less than 5% market share in the US Quartz market.
Company is expanding its distribution reach in order to expand its presence in key
counter top regions such as North America and in Europe.
Granite business segment to continue growing at a steady pace
Risks
Currency risk due to non-hedging of currency exposure
Downturn in USA housing market
Change in consumer preference away for quartz counter tops
Peer Comparison EPS PE
FY15 FY16E FY17E FY15 FY16E FY17E
Pokarna 50.5 69.9 85.6 20.3 14.7 12.0
Ceasar Stone (USD) 2.4 3.4 4.1 24.6 17.4 14.4
Laminates, 16%
Granite, 27%
Solid Surface,
25%
Engineered
Quartz, 8%
Marble, 2% Others,
22%
Global Countertop Market Segmentation (Sales-2012)
Quartz 8%
Solid Surfac
e 25%
Granite
27%
Laminates 16%
Marble 2%
Quartz is the fastest category
Quartz is the gaining Market Share in Global Countertop Market
MA
RK
ET S
HA
RE
Development Growth Maturity Dwindling
Pokarna Segmental Revenues
Granite
56%
Quartz 42%
Appare 2%
21
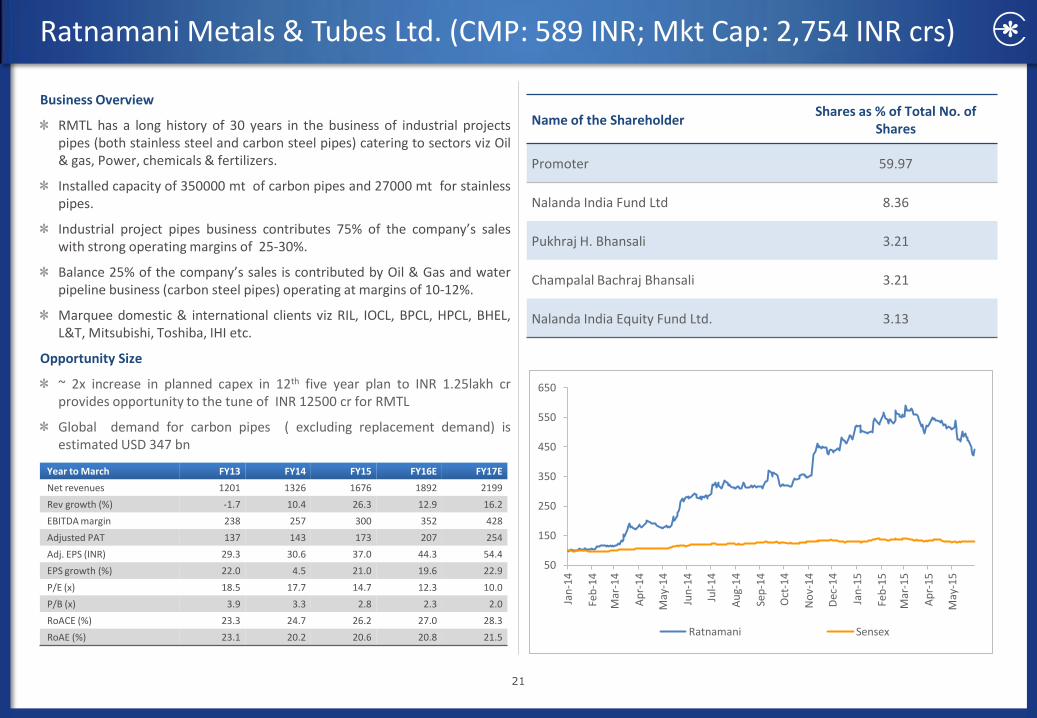
Ratnamani Metals & Tubes Ltd. (CMP: 589 INR; Mkt Cap: 2,754 INR crs)
Business Overview
RMTL has a long history of 30 years in the business of industrial projects pipes (both stainless steel and carbon steel pipes) catering to sectors viz Oil & gas, Power, chemicals & fertilizers.
Installed capacity of 350000 mt of carbon pipes and 27000 mt for stainless pipes.
Industrial project pipes business contributes 75% of the company’s sales with strong operating margins of 25-30%.
Balance 25% of the company’s sales is contributed by Oil & Gas and water pipeline business (carbon steel pipes) operating at margins of 10-12%.
Marquee domestic & international clients viz RIL, IOCL, BPCL, HPCL, BHEL, L&T, Mitsubishi, Toshiba, IHI etc.
Opportunity Size
~ 2x increase in planned capex in 12th five year plan to INR 1.25lakh cr provides opportunity to the tune of INR 12500 cr for RMTL
Global demand for carbon pipes ( excluding replacement demand) is estimated USD 347 bn
Year to March FY13 FY14 FY15 FY16E FY17E
Net revenues 1201 1326 1676 1892 2199
Rev growth (%) -1.7 10.4 26.3 12.9 16.2
EBITDA margin 238 257 300 352 428
Adjusted PAT 137 143 173 207 254
Adj. EPS (INR) 29.3 30.6 37.0 44.3 54.4
EPS growth (%) 22.0 4.5 21.0 19.6 22.9
P/E (x) 18.5 17.7 14.7 12.3 10.0
P/B (x) 3.9 3.3 2.8 2.3 2.0
RoACE (%) 23.3 24.7 26.2 27.0 28.3
RoAE (%) 23.1 20.2 20.6 20.8 21.5
Name of the Shareholder Shares as % of Total No. of
Shares
Promoter 59.97
Nalanda India Fund Ltd 8.36
Pukhraj H. Bhansali 3.21
Champalal Bachraj Bhansali 3.21
Nalanda India Equity Fund Ltd. 3.13
50
150
250
350
450
550
650
Jan
-14
Feb
-14
Mar
-14
Ap
r-1
4
May
-14
Jun
-14
Jul-
14
Au
g-1
4
Sep
-14
Oct
-14
No
v-1
4
Dec
-14
Jan
-15
Feb
-15
Mar
-15
Ap
r-1
5
May
-15
Ratnamani Sensex
22
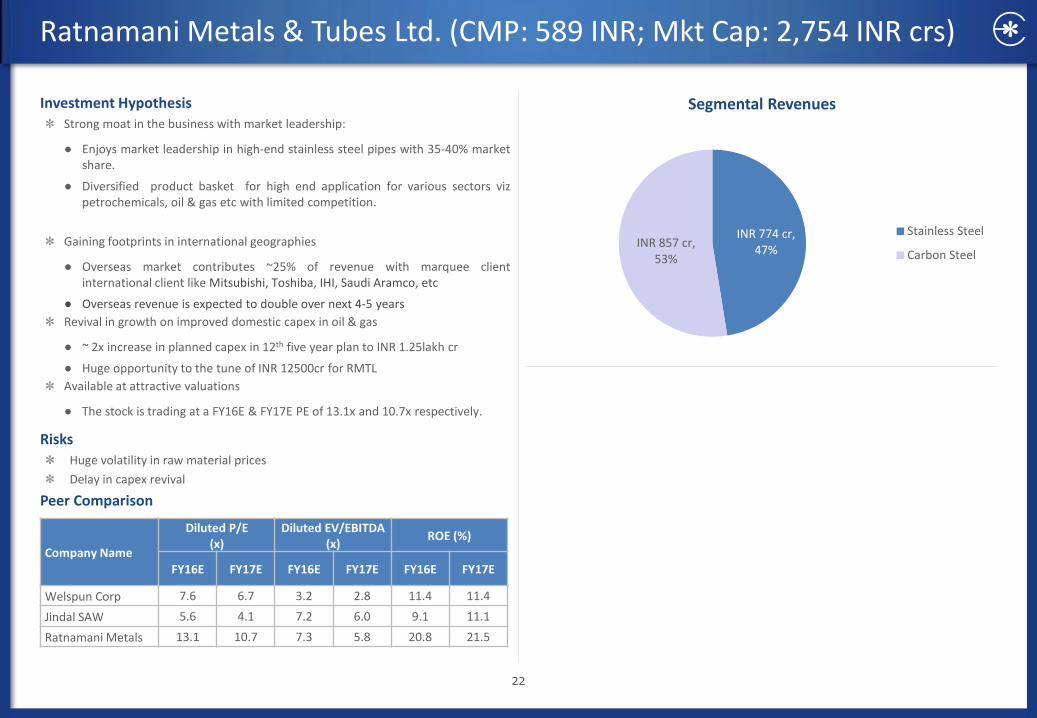
Investment Hypothesis
Strong moat in the business with market leadership:
● Enjoys market leadership in high-end stainless steel pipes with 35-40% market share.
● Diversified product basket for high end application for various sectors viz petrochemicals, oil & gas etc with limited competition.
Gaining footprints in international geographies
● Overseas market contributes ~25% of revenue with marquee client international client like Mitsubishi, Toshiba, IHI, Saudi Aramco, etc
● Overseas revenue is expected to double over next 4-5 years
Revival in growth on improved domestic capex in oil & gas
● ~ 2x increase in planned capex in 12th five year plan to INR 1.25lakh cr
● Huge opportunity to the tune of INR 12500cr for RMTL
Available at attractive valuations
● The stock is trading at a FY16E & FY17E PE of 13.1x and 10.7x respectively.
Risks
Huge volatility in raw material prices
Delay in capex revival
Peer Comparison
Segmental Revenues
Company Name
Diluted P/E (x)
Diluted EV/EBITDA (x)
ROE (%)
FY16E FY17E FY16E FY17E FY16E FY17E
Welspun Corp 7.6 6.7 3.2 2.8 11.4 11.4
Jindal SAW 5.6 4.1 7.2 6.0 9.1 11.1
Ratnamani Metals 13.1 10.7 7.3 5.8 20.8 21.5
Ratnamani Metals & Tubes Ltd. (CMP: 589 INR; Mkt Cap: 2,754 INR crs)
INR 774 cr, 47%
INR 857 cr, 53%
Stainless Steel
Carbon Steel
23
Suprajit Engineering (CMP: INR 121; Mkt Cap: INR 1,465 crs)
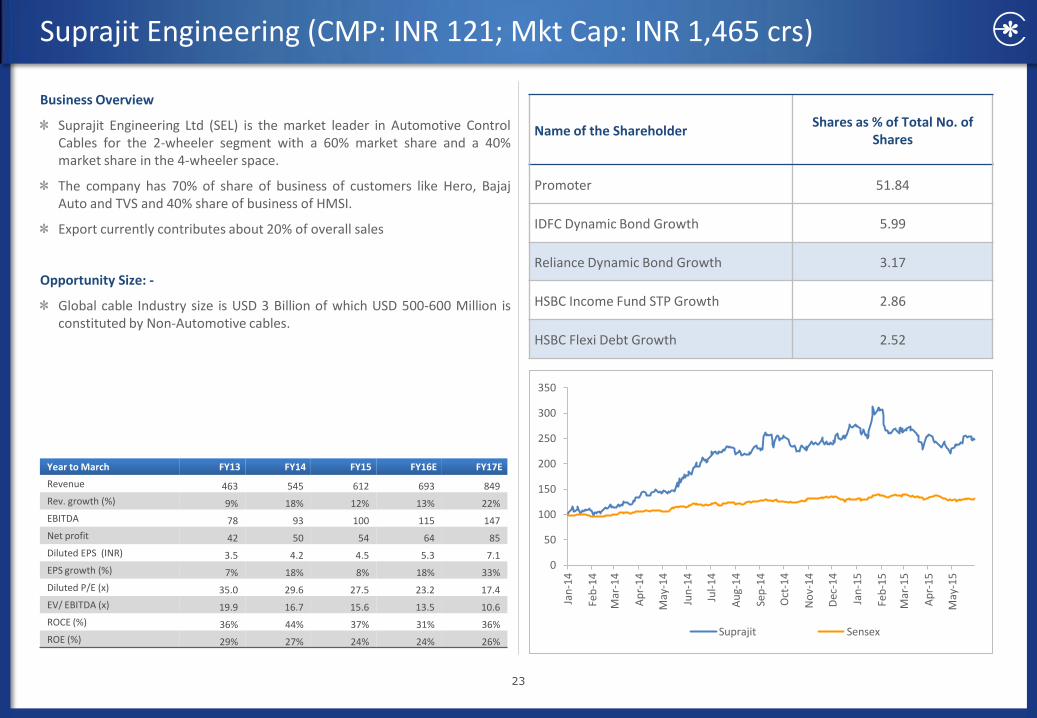
Business Overview
Suprajit Engineering Ltd (SEL) is the market leader in Automotive Control Cables for the 2-wheeler segment with a 60% market share and a 40% market share in the 4-wheeler space.
The company has 70% of share of business of customers like Hero, Bajaj Auto and TVS and 40% share of business of HMSI.
Export currently contributes about 20% of overall sales
Opportunity Size: -
Global cable Industry size is USD 3 Billion of which USD 500-600 Million is constituted by Non-Automotive cables.
Year to March FY13 FY14 FY15 FY16E FY17E
Revenue 463 545 612 693 849
Rev. growth (%) 9% 18% 12% 13% 22%
EBITDA 78 93 100 115 147
Net profit 42 50 54 64 85
Diluted EPS (INR) 3.5 4.2 4.5 5.3 7.1
EPS growth (%) 7% 18% 8% 18% 33%
Diluted P/E (x) 35.0 29.6 27.5 23.2 17.4
EV/ EBITDA (x) 19.9 16.7 15.6 13.5 10.6
ROCE (%) 36% 44% 37% 31% 36%
ROE (%) 29% 27% 24% 24% 26%
Name of the Shareholder Shares as % of Total No. of
Shares
Promoter 51.84
IDFC Dynamic Bond Growth 5.99
Reliance Dynamic Bond Growth 3.17
HSBC Income Fund STP Growth 2.86
HSBC Flexi Debt Growth 2.52
0
50
100
150
200
250
300
350
Jan
-14
Feb
-14
Mar
-14
Ap
r-1
4
May
-14
Jun
-14
Jul-
14
Au
g-1
4
Sep
-14
Oct
-14
No
v-1
4
Dec
-14
Jan
-15
Feb
-15
Mar
-15
Ap
r-1
5
May
-15
Suprajit Sensex
24
Suprajit Engineering (CMP: INR 121; Mkt Cap: INR 1,465 crs)
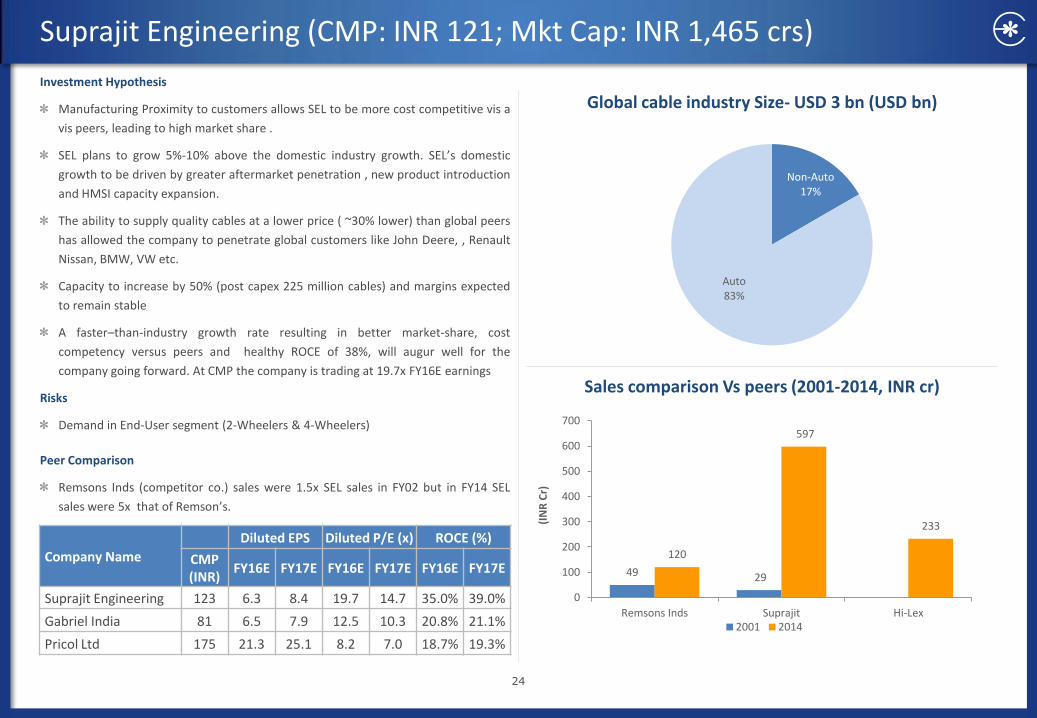
Investment Hypothesis
Manufacturing Proximity to customers allows SEL to be more cost competitive vis a
vis peers, leading to high market share .
SEL plans to grow 5%-10% above the domestic industry growth. SEL’s domestic
growth to be driven by greater aftermarket penetration , new product introduction
and HMSI capacity expansion.
The ability to supply quality cables at a lower price ( ~30% lower) than global peers
has allowed the company to penetrate global customers like John Deere, , Renault
Nissan, BMW, VW etc.
Capacity to increase by 50% (post capex 225 million cables) and margins expected
to remain stable
A faster–than-industry growth rate resulting in better market-share, cost
competency versus peers and healthy ROCE of 38%, will augur well for the
company going forward. At CMP the company is trading at 19.7x FY16E earnings
Risks
Demand in End-User segment (2-Wheelers & 4-Wheelers)
Peer Comparison
Remsons Inds (competitor co.) sales were 1.5x SEL sales in FY02 but in FY14 SEL
sales were 5x that of Remson’s.
Global cable industry Size- USD 3 bn (USD bn)
Sales comparison Vs peers (2001-2014, INR cr)
Company Name
Diluted EPS Diluted P/E (x) ROCE (%)
CMP (INR)
FY16E FY17E FY16E FY17E FY16E FY17E
Suprajit Engineering 123 6.3 8.4 19.7 14.7 35.0% 39.0%
Gabriel India 81 6.5 7.9 12.5 10.3 20.8% 21.1%
Pricol Ltd 175 21.3 25.1 8.2 7.0 18.7% 19.3%
Non-Auto 17%
Auto 83%
49 29
120
597
233
0
100
200
300
400
500
600
700
Remsons Inds Suprajit Hi-Lex
(IN
R C
r)
2001 2014
25
Edelweiss Midcap Marvels: Performance
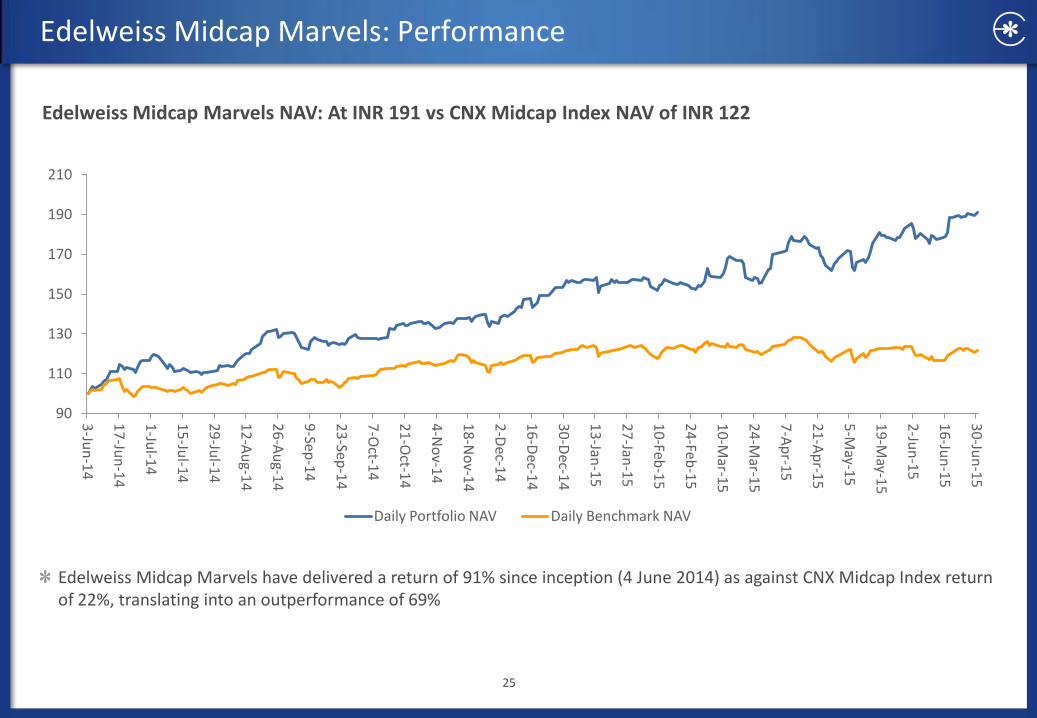
Edelweiss Midcap Marvels have delivered a return of 91% since inception (4 June 2014) as against CNX Midcap Index return of 22%, translating into an outperformance of 69%
Edelweiss Midcap Marvels NAV: At INR 191 vs CNX Midcap Index NAV of INR 122
90
110
130
150
170
190
210
3-Ju
n-1
4
17
-Jun
-14
1-Ju
l-14
15
-Jul-1
4
29
-Jul-1
4
12
-Au
g-14
26
-Au
g-14
9-Sep
-14
23
-Sep-1
4
7-O
ct-14
21
-Oct-1
4
4-N
ov-1
4
18
-No
v-14
2-D
ec-14
16
-Dec-1
4
30
-Dec-1
4
13
-Jan-1
5
27
-Jan-1
5
10
-Feb-1
5
24
-Feb-1
5
10
-Mar-1
5
24
-Mar-1
5
7-A
pr-1
5
21
-Ap
r-15
5-M
ay-15
19
-May-1
5
2-Ju
n-1
5
16
-Jun
-15
30
-Jun
-15
Daily Portfolio NAV Daily Benchmark NAV
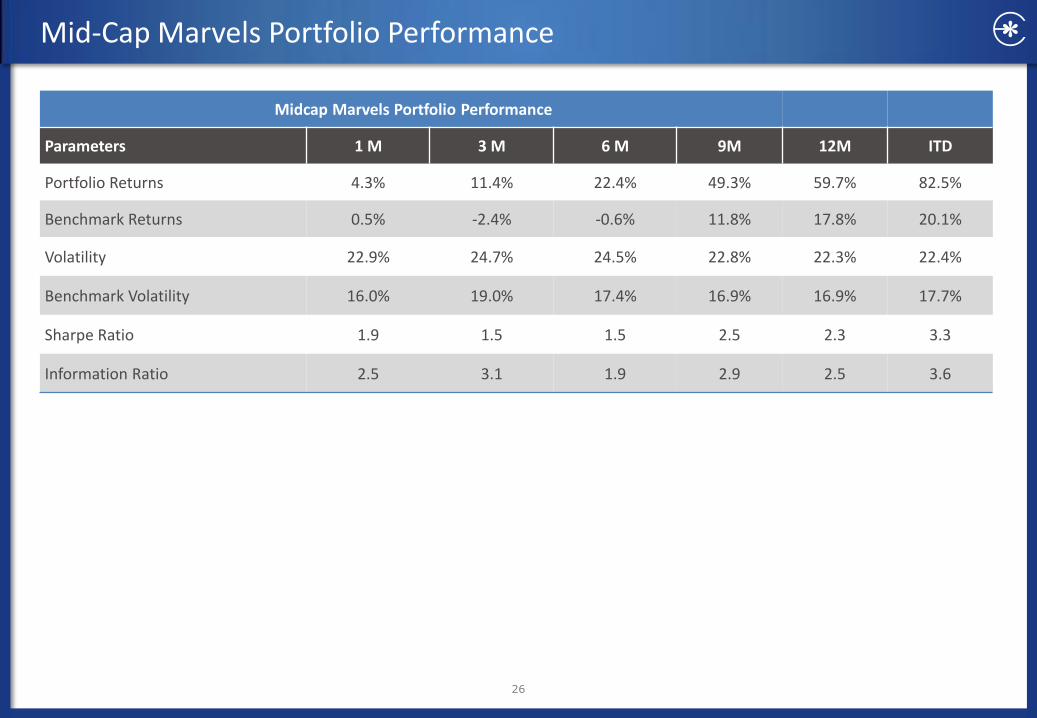
Mid-Cap Marvels Portfolio Performance
26
Midcap Marvels Portfolio Performance
Parameters 1 M 3 M 6 M 9M 12M ITD
Portfolio Returns 4.3% 11.4% 22.4% 49.3% 59.7% 82.5%
Benchmark Returns 0.5% -2.4% -0.6% 11.8% 17.8% 20.1%
Volatility 22.9% 24.7% 24.5% 22.8% 22.3% 22.4%
Benchmark Volatility 16.0% 19.0% 17.4% 16.9% 16.9% 17.7%
Sharpe Ratio 1.9 1.5 1.5 2.5 2.3 3.3
Information Ratio 2.5 3.1 1.9 2.9 2.5 3.6
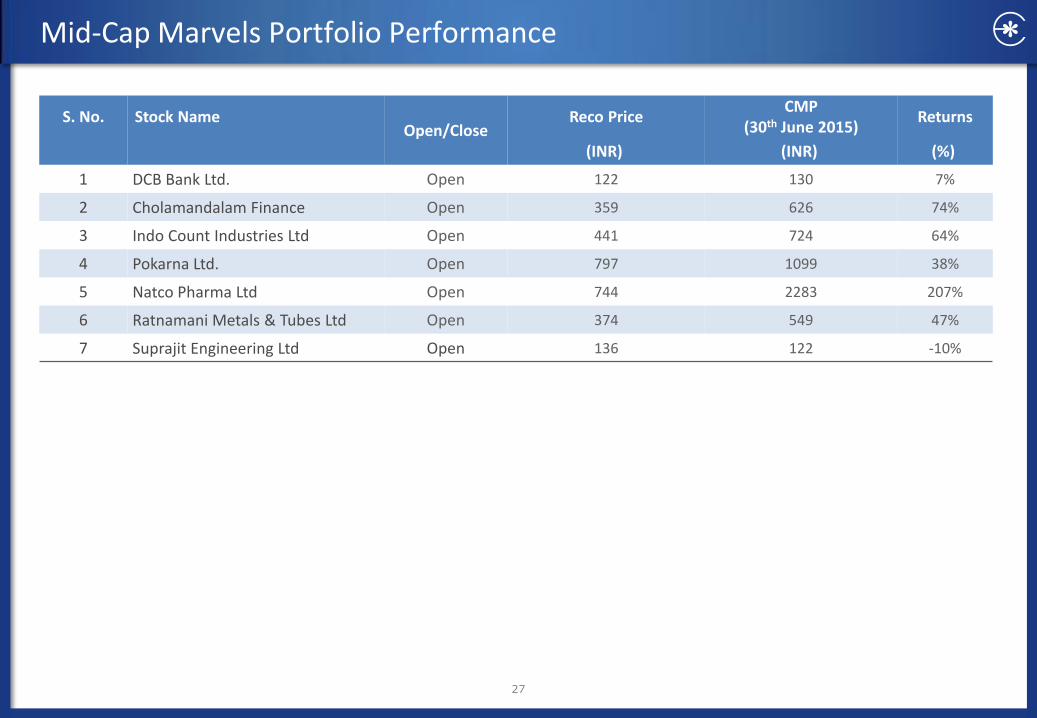
Mid-Cap Marvels Portfolio Performance
S. No. Stock Name Open/Close
Reco Price CMP
(30th June 2015) Returns
(INR) (INR) (%)
1 DCB Bank Ltd. Open 122 130 7%
2 Cholamandalam Finance Open 359 626 74%
3 Indo Count Industries Ltd Open 441 724 64%
4 Pokarna Ltd. Open 797 1099 38%
5 Natco Pharma Ltd Open 744 2283 207%
6 Ratnamani Metals & Tubes Ltd Open 374 549 47%
7 Suprajit Engineering Ltd Open 136 122 -10%
27
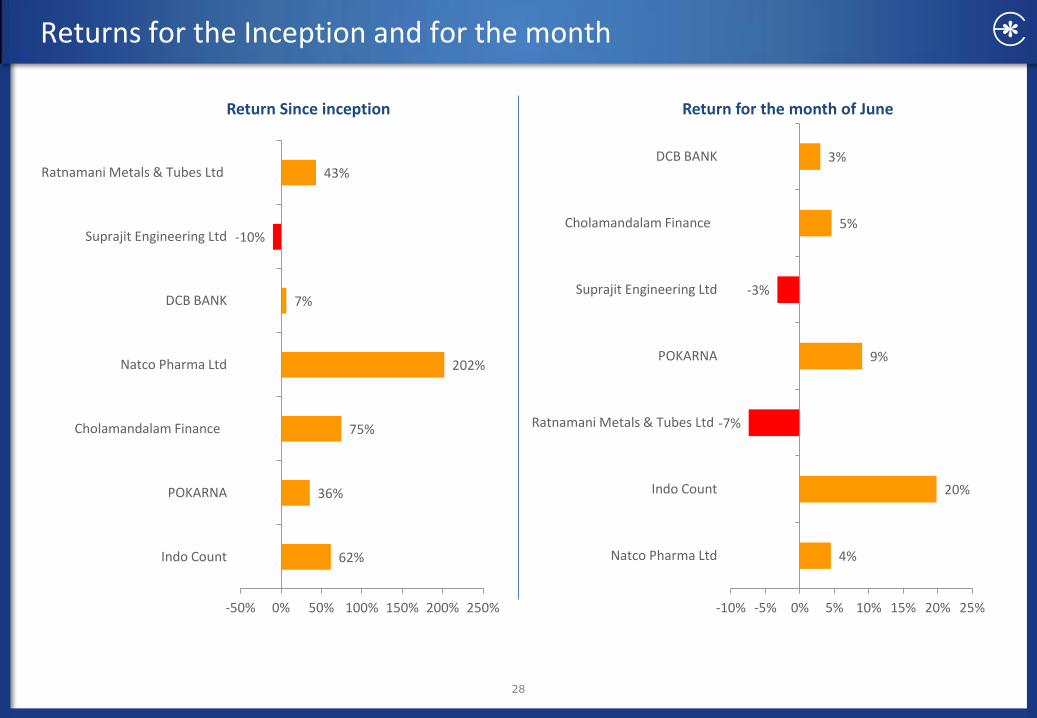
Returns for the Inception and for the month
28
62%
36%
75%
202%
7%
-10%
43%
-50% 0% 50% 100% 150% 200% 250%
Indo Count
POKARNA
Cholamandalam Finance
Natco Pharma Ltd
DCB BANK
Suprajit Engineering Ltd
Ratnamani Metals & Tubes Ltd
Return Since inception
4%
20%
-7%
9%
-3%
5%
3%
-10% -5% 0% 5% 10% 15% 20% 25%
Natco Pharma Ltd
Indo Count
Ratnamani Metals & Tubes Ltd
POKARNA
Suprajit Engineering Ltd
Cholamandalam Finance
DCB BANK
Return for the month of June
Disclaimer
29
Broking services offered by Edelweiss Broking Limited under SEBI Registration No.: INZ000005231 (NSE, BSE and MSEI); Research Analyst services offered by Edelweiss Broking Limited under SEBI registration no. INH000000172. Name of the Compliance Officer: Mr. Dhirendra P. Rautela,
Email ID: [email protected]. Corporate Office: Edelweiss House, Off CST Road, Kalina, Mumbai - 400098; Tel. (022) 4009 4400/ 4088 5757/4088 6278
This report has been prepared by Edelweiss Broking Limited (Edelweiss). This report does not constitute an offer or solicitation for the purchase or sale of any financial instrument or as an official confirmation of any transaction. The information contained herein is from publicly available data or other sources believed to be reliable. This report is provided for assistance only and is not intended to be and must not alone be taken as the basis for an investment decision. The user assumes the entire risk of any use made of this information. Each recipient of this report should make such investigation as it deems necessary to arrive at an independent evaluation of an investment in the securities of companies referred to in this report (including the merits and risks involved), and should consult his own advisors to determine the merits and risks of such investment. The investment discussed or views expressed may not be suitable for all investors. This information is strictly confidential and is being furnished to you solely for your information. This information should not be reproduced or redistributed or passed on directly or indirectly in any form to any other person or published, copied, in whole or in part, for any purpose. This report is not directed or intended for distribution to, or use by, any person or entity who is a citizen or resident of or located in any locality, state, country or other jurisdiction, where such distribution, publication, availability or use would be contrary to law, regulation or which would subject Edelweiss and affiliates/ group companies to any registration or licensing requirements within such jurisdiction. The distribution of this report in certain jurisdictions may be restricted by law, and persons in whose possession this report comes, should observe, any such restrictions. The information given in this report is as of the date of this report and there can be no assurance that future results or events will be consistent with this information. This information is subject to change without any prior notice. Edelweiss reserves the right to make modifications and alterations to this statement as may be required from time to time. Edelweiss or any of its affiliates/ group companies shall not be in any way responsible for any loss or damage that may arise to any person from any inadvertent error in the information contained in this report. Edelweiss is committed to providing independent and transparent recommendation to its clients. Neither Edelweiss nor any of its affiliates, group companies, directors, employees, agents or representatives shall be liable for any damages whether direct, indirect, special or consequential including loss of revenue or lost profits that may arise from or in connection with the use of the information. Past performance is not necessarily a guide to future performance. The disclosures of interest statements incorporated in this report are provided solely to enhance the transparency and should not be treated as endorsement of the views expressed in the report. The information provided in these reports remains, unless otherwise stated, the copyright of Edelweiss. All layout, design, original artwork, concepts and other Intellectual Properties, remains the property and copyright of Edelweiss and may not be used in any form or for any purpose whatsoever by any party without the express written permission of the copyright holders. Analyst Certification: The analyst for this report certifies that all of the views expressed in this report accurately reflect his or her personal views about the subject company or companies and its or their securities, and no part of his or her compensation was, is or will be, directly or indirectly related to specific recommendations or views expressed in this report. Edelweiss shall not be liable for any delay or any other interruption which may occur in presenting the data due to any reason including network (Internet) reasons or snags in the system, break down of the system or any other equipment, server breakdown, maintenance shutdown, breakdown of communication services or inability of the Edelweiss to present the data. In no event shall the Edelweiss be liable for any damages, including without limitation direct or indirect, special, incidental, or consequential damages, losses or expenses arising in connection with the data presented by the Edelweiss through this report. Additional Disclaimer for U.S. Persons Edelweiss is not a registered broker – dealer under the U.S. Securities Exchange Act of 1934, as amended (the“1934 act”) and under applicable state laws in the United States. In addition Edelweiss is not a registered investment adviser under the U.S. Investment Advisers Act of 1940, as amended (the "Advisers Act" and together with the 1934 Act, the "Acts), and under applicable state laws in the United States. Accordingly, in the absence of specific exemption under the Acts, any brokerage and investment services provided by Edelweiss, including the products and services described herein are not available to or intended for U.S. persons. This report does not constitute an offer or invitation to purchase or subscribe for any securities or solicitation of any investments or investment services and/or shall not be considered as an advertisement tool. "U.S. Persons" are generally defined as a natural person, residing in the United States or any entity organized or incorporated under the laws of the United States. US Citizens living abroad may also be deemed "US Persons" under certain rules. Transactions in securities discussed in this research report should be effected through Enclave Capital, LLC. Additional Disclaimer for U.K. Persons The contents of this research report have not been approved by an authorised person within the meaning of the Financial Services and Markets Act 2000 ("FSMA"). In the United Kingdom, this research report is being distributed only to and is directed only at (a) persons who have professional experience in matters relating to investments falling within Article 19(5) of the FSMA (Financial Promotion) Order 2005 (the “Order”); (b) persons falling within Article 49(2)(a) to (d) of the Order (including high net worth companies and unincorporated associations); and (c) any other persons to whom it may otherwise lawfully be communicated (all such persons together being referred to as “relevant persons”). This research report must not be acted on or relied on by persons who are not relevant persons. Any investment or investment activity to which this research report relates is available only to relevant persons and will be engaged in only with relevant persons. Any person who is not a relevant person should not act or rely on this research report or any of its contents. This research report must not be distributed, published, reproduced or disclosed (in whole or in part) by recipients to any other person. Additional Disclaimer for Canadian Persons Edelweiss is not a registered adviser or dealer under applicable Canadian securities laws nor has it obtained an exemption from the adviser and/or dealer registration requirements under such law. Accordingly, any brokerage and investment services provided by Edelweiss, including the products and services described herein, are not available to or intended for Canadian persons. This research report and its respective contents do not constitute an offer or invitation to purchase or subscribe for any securities or solicitation of any investments or investment services. Disclosures under the provisions of SEBI (Research Analysts) Regulations 2014 (Regulations) Edelweiss Broking Limited (“EBL” or “Research Entity”) is regulated by the Securities and Exchange Board of India (“SEBI”) and is licensed to carry on the business of broking, depository services and related activities. The business of EBL and its associates are organized around five broad business groups – Credit including Housing and SME Finance, Commodities, Financial Markets, Asset Management and Life Insurance. There were no instances of non-compliance by EBL on any matter related to the capital markets, resulting in significant and material disciplinary action during the last three years. This research report has been prepared and distributed by Edelweiss Broking Limited (“Edelweiss”) in the capacity of a Research Analyst as per Regulation 22(1) of SEBI (Research Analysts) Regulations 2014 having SEBI Registration No.INH000000172.