edgewood isd academic leadership team academy august 12 – 13, 2013
TRANSCRIPT

Edgewood ISDACADEMIC LEADERSHIP TEAM ACADEMY
AUGUST 12 – 13, 2013

A personal goal . . . My favorite place on earth . . .
The most important non-human thing in my life . . .
If I were an animal, I’d be a . . .
Describe Yourself Through Pictures
Edgewood ISDUNDERSTANDING THE NEW ACCOUNTABILITY SYSTEM AND THE APPLICATION
ANNA NIETO
AUGUST 12, 2013

A Solid Foundation with a World-Class Education

Agenda for the SessionAccountability SystemUnderstanding the ReportsApplication to the SystemMy CampusWhat Must Change?How Will We Share with Our Staff?
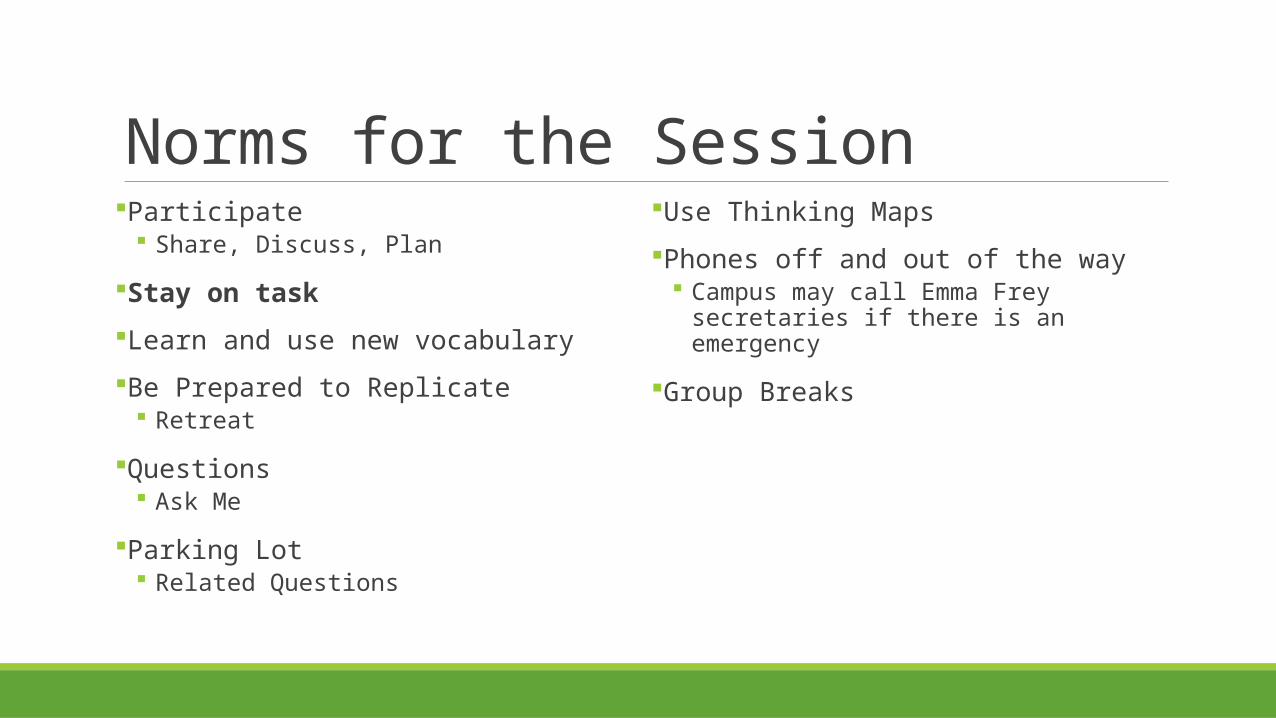
Norms for the SessionParticipate
Share, Discuss, Plan
Stay on task
Learn and use new vocabulary
Be Prepared to Replicate Retreat
Questions Ask Me
Parking Lot Related Questions
Use Thinking Maps
Phones off and out of the way Campus may call Emma Frey secretaries if there
is an emergency
Group Breaks

Notes PacketoStructured Notes PacketoInformation to Develop UnderstandingoProcessoReflections

Assessment
Accountability System
Ratings

Edgewood 31
57
59
84
What does it mean?
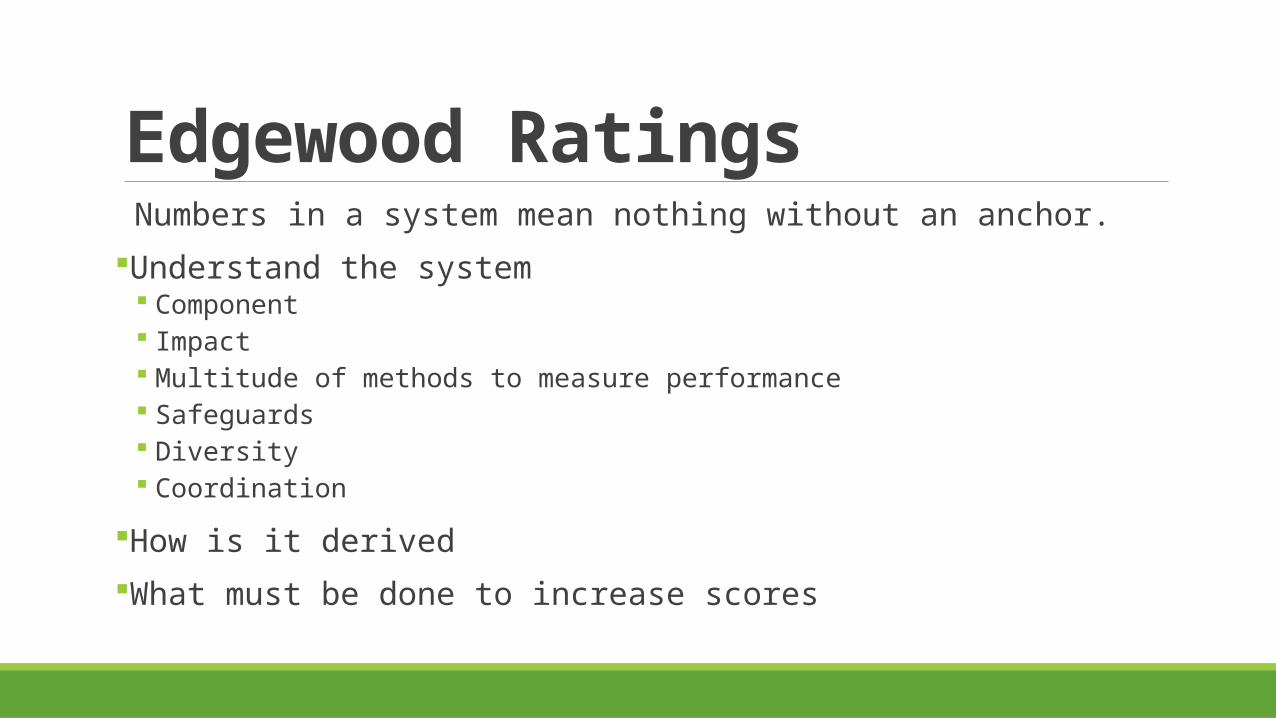
Edgewood Ratings Numbers in a system mean nothing without an anchor.Understand the system
Component Impact Multitude of methods to measure performance Safeguards Diversity Coordination
How is it derivedWhat must be done to increase scores
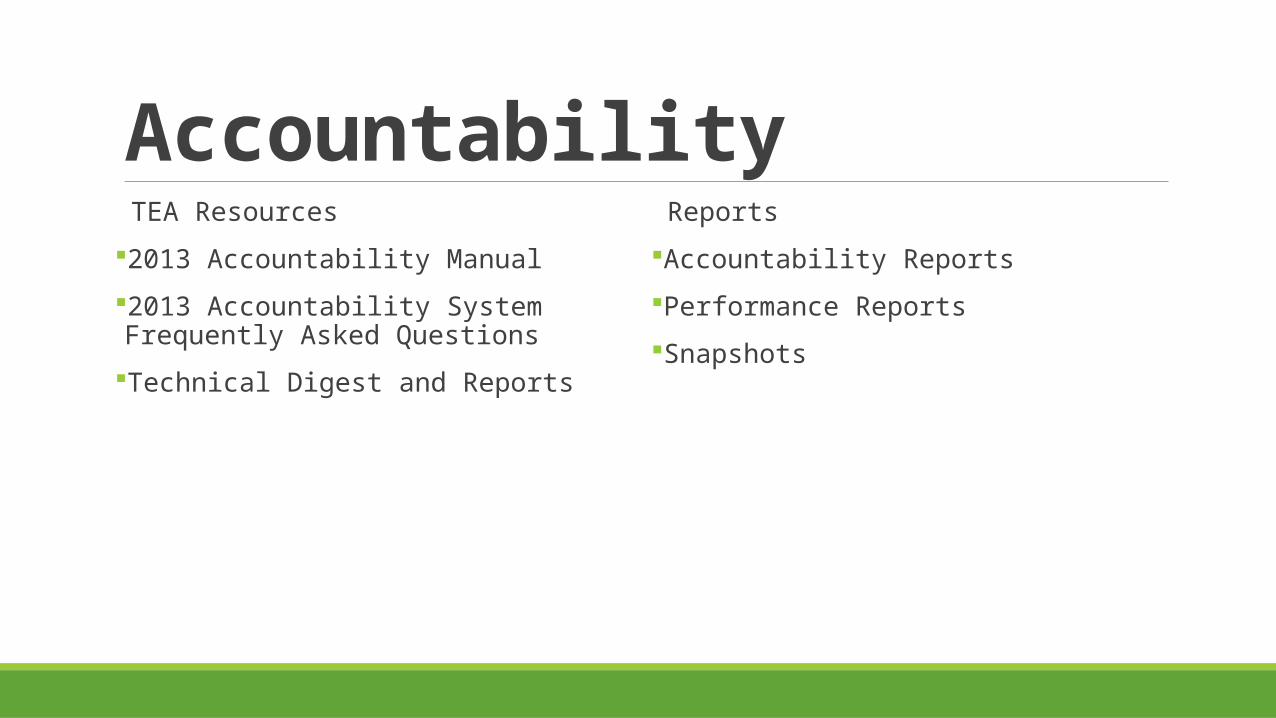
Accountability TEA Resources
2013 Accountability Manual
2013 Accountability System Frequently Asked Questions
Technical Digest and Reports
Reports
Accountability Reports
Performance Reports
Snapshots
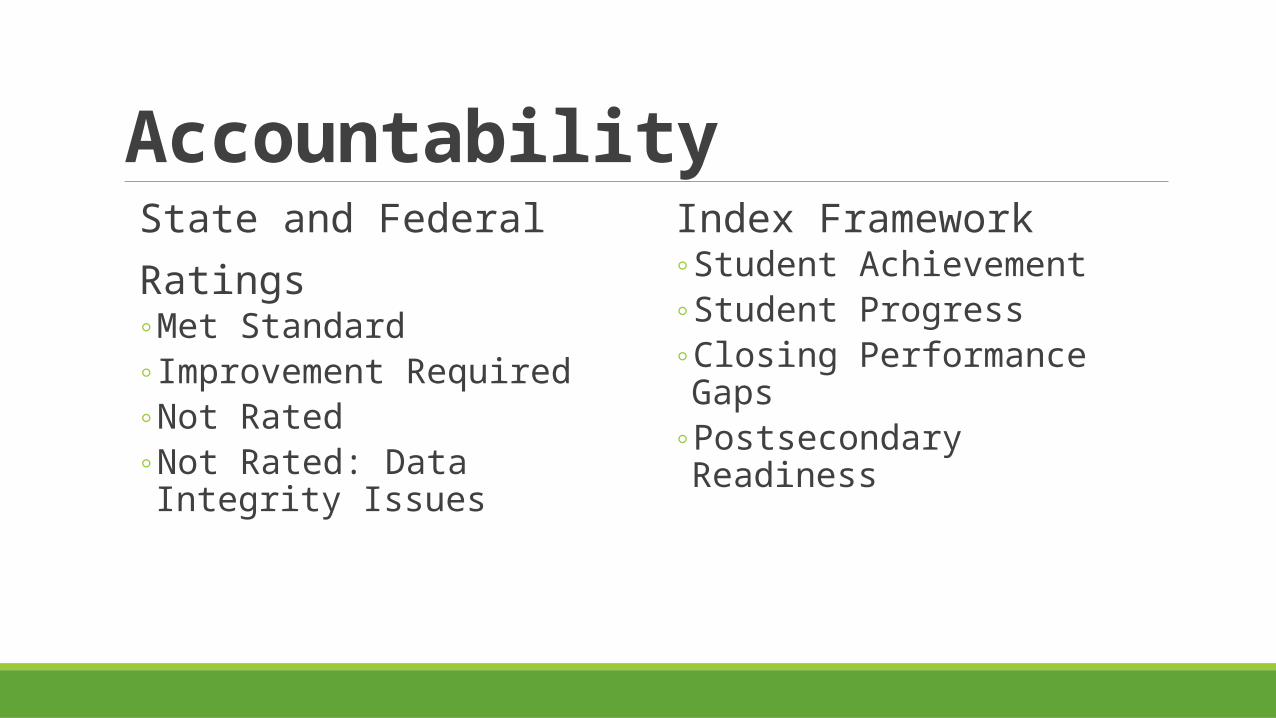
Accountability State and Federal Ratings
◦ Met Standard◦ Improvement Required◦ Not Rated◦ Not Rated: Data Integrity Issues
Index Framework◦ Student Achievement◦ Student Progress◦ Closing Performance Gaps◦ Postsecondary Readiness
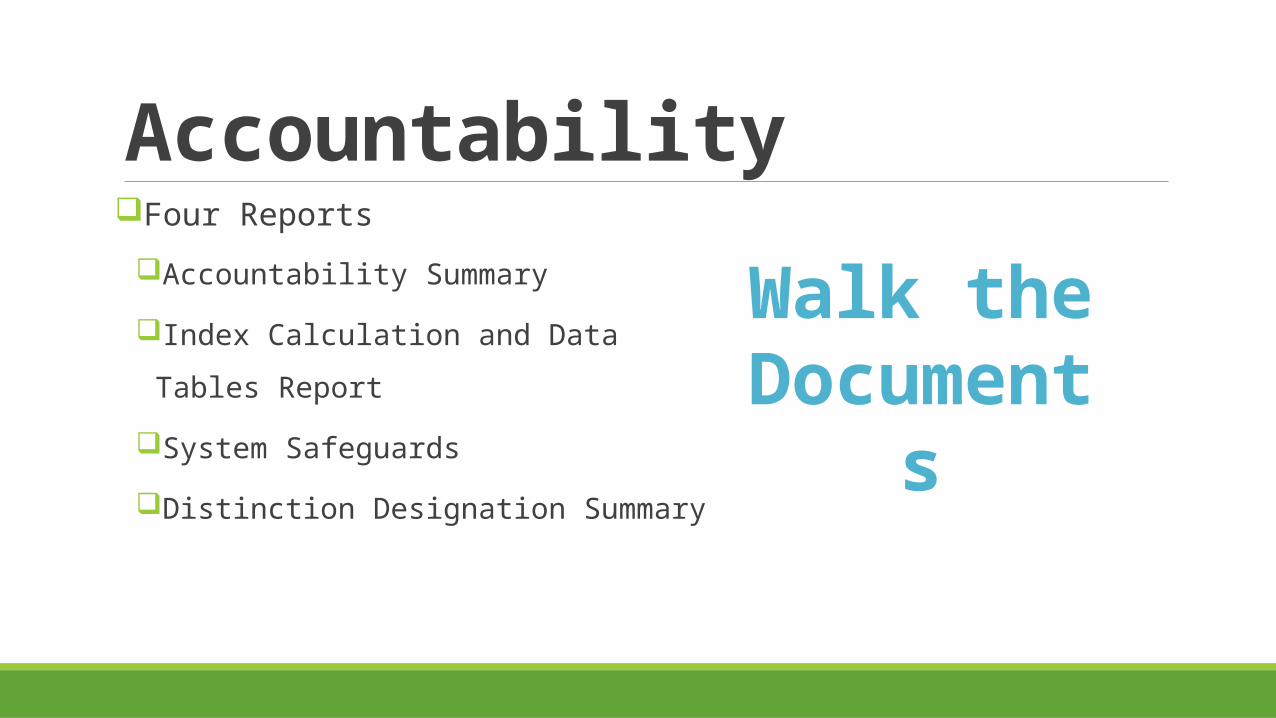
AccountabilityFour Reports
Accountability Summary
Index Calculation and Data Tables Report
System Safeguards
Distinction Designation Summary
Walk the Documents
Types of Reports

Types of Reports Index Calculation and Data Tables Reports System Safeguards Reports Distinction Designations Report Accountability Summary Report

Index Calculation and Data Tables Report
Calculation for each IndexData Table for all students, each content, ethnicities, and populations
Heart of the Reports
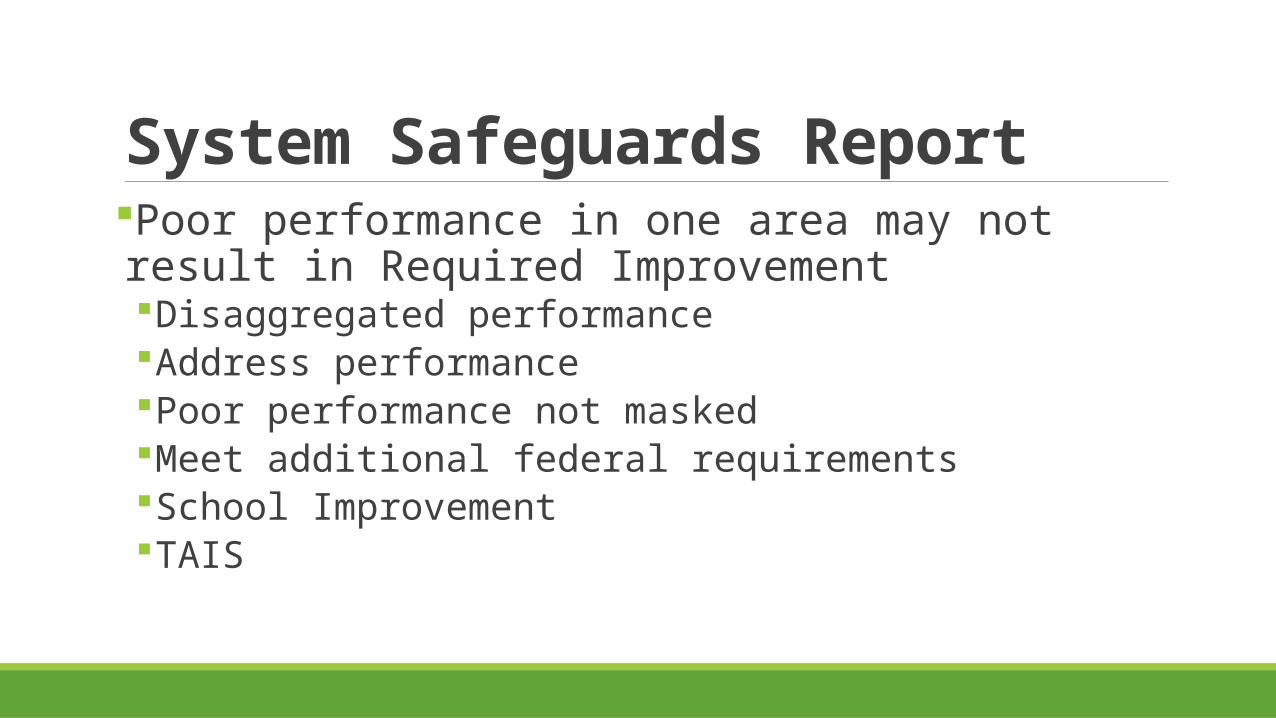
System Safeguards ReportPoor performance in one area may not result in Required ImprovementDisaggregated performanceAddress performancePoor performance not maskedMeet additional federal requirementsSchool ImprovementTAIS
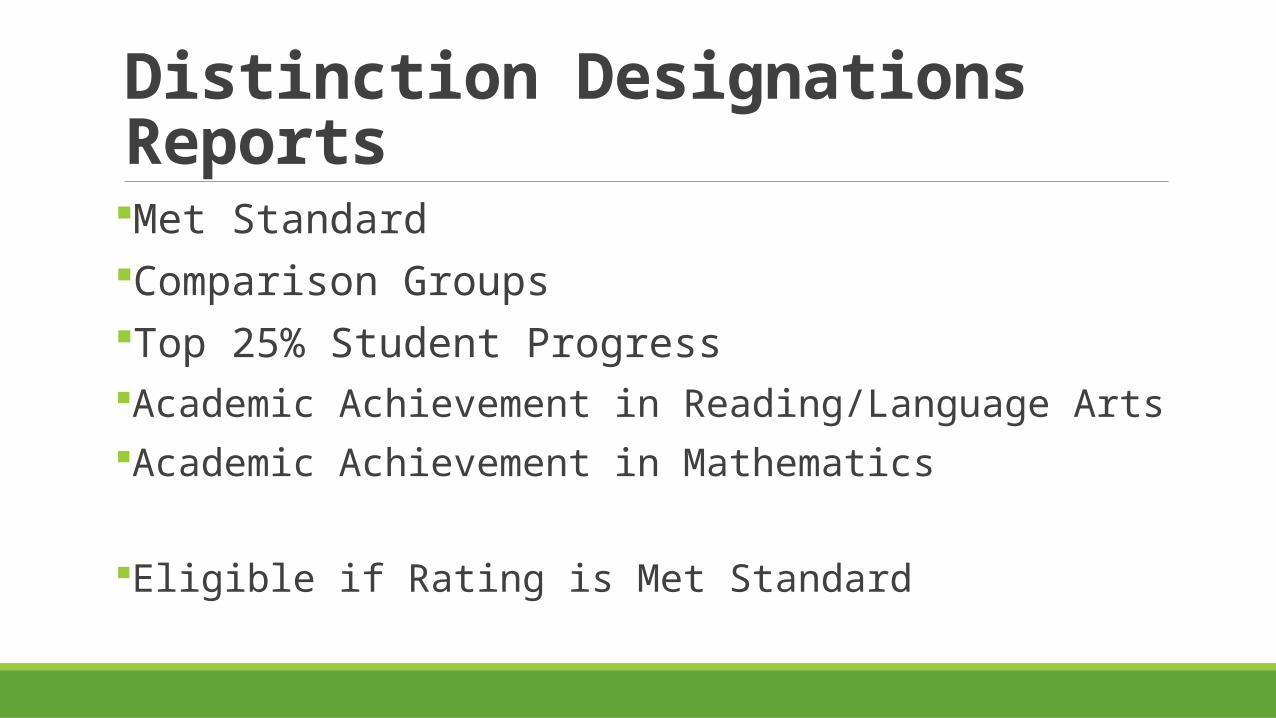
Distinction Designations ReportsMet StandardComparison GroupsTop 25% Student ProgressAcademic Achievement in Reading/Language ArtsAcademic Achievement in Mathematics
Eligible if Rating is Met Standard

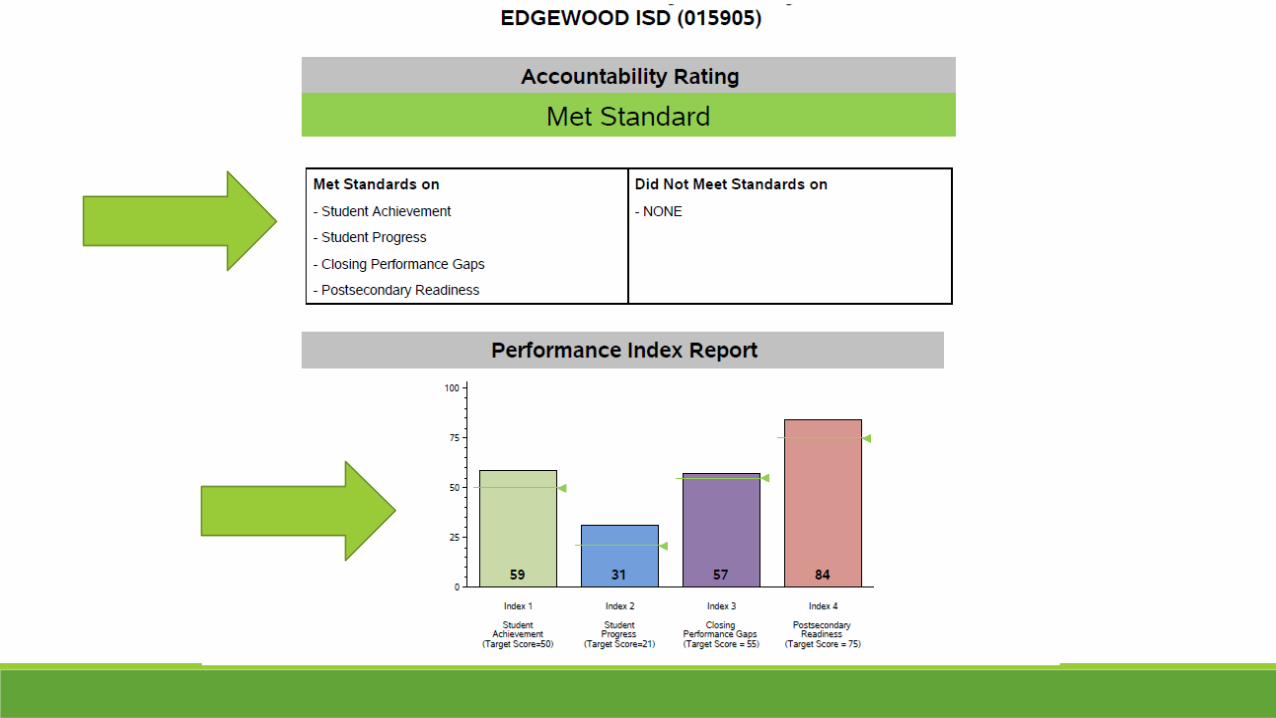
Accountability Summary Report
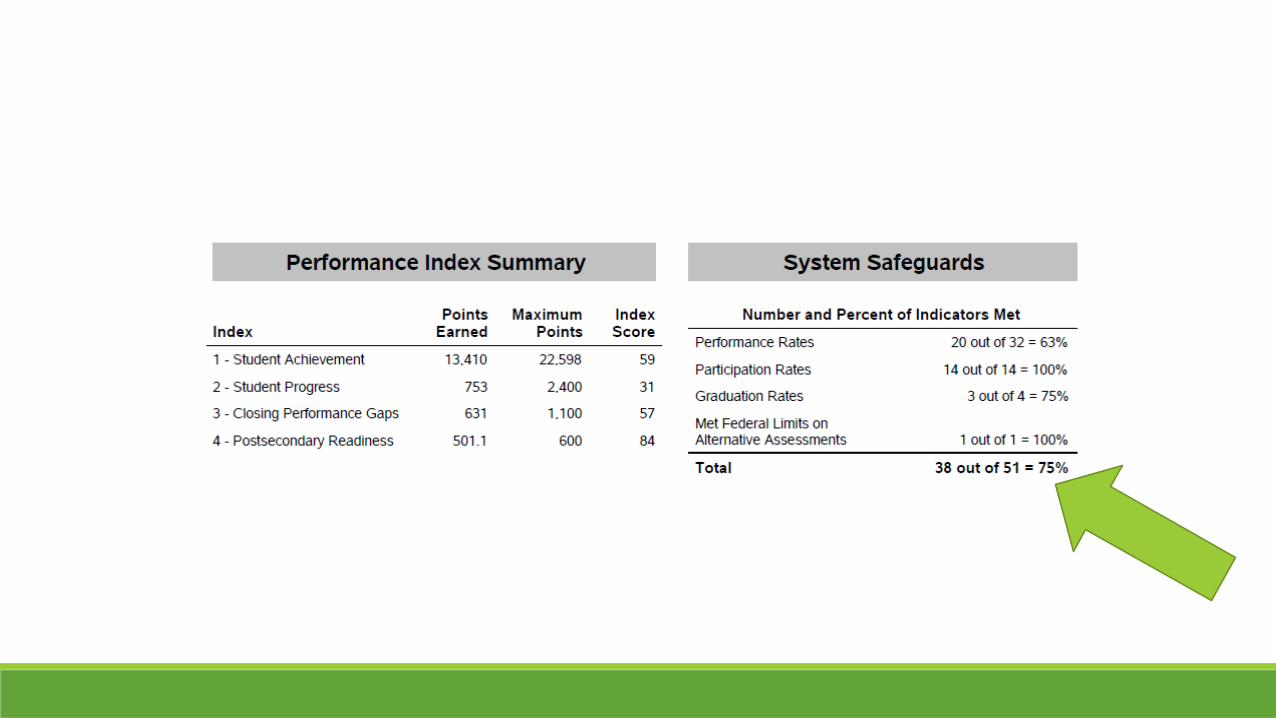
RatingPerformance Index ReportPerformance Index SummarySystem Safeguards

Perceptionsimmediate or intuitive recognition or appreciation, as of moral, psychological, or aesthetic qualities; insight; intuition; discernment

High Sense of Urgency
Low Sense of Urgency
Low Sense of Efficacy High Sense of Efficacy
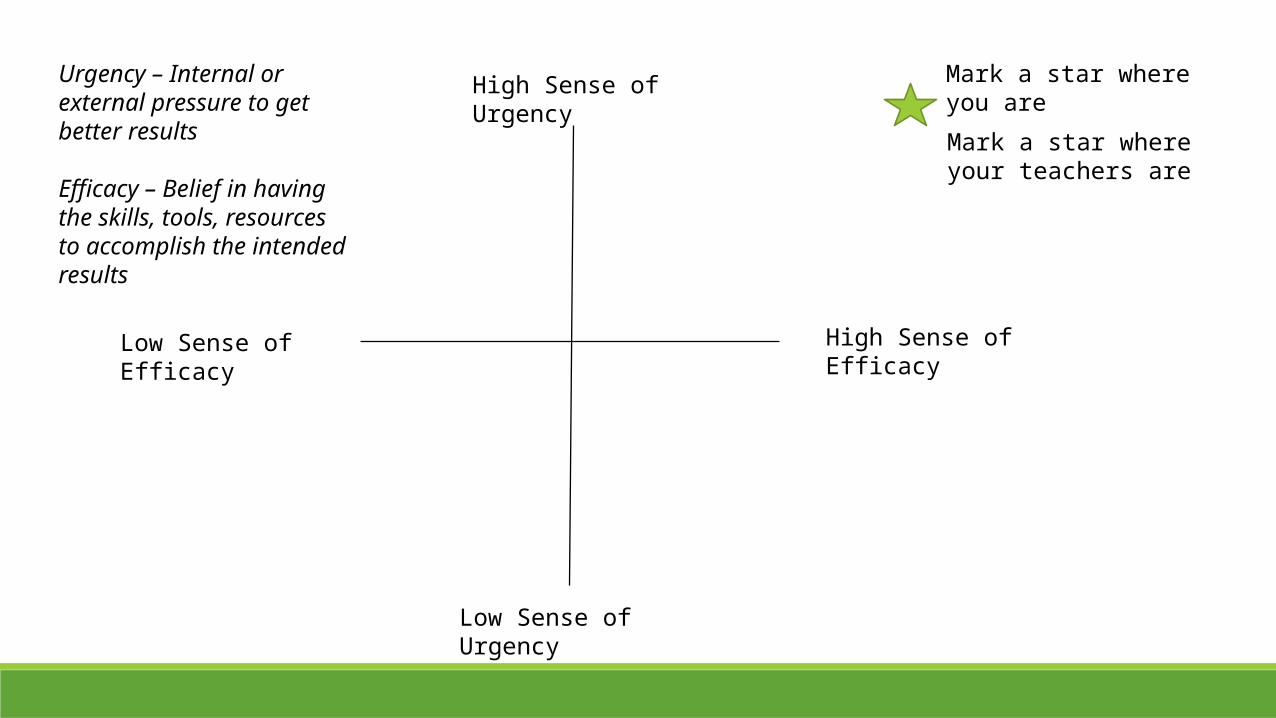
Urgency – Internal or external pressure to get better results
Efficacy – Belief in having the skills, tools, resources to accomplish the intended results
High Sense of Urgency
Low Sense of Urgency
Low Sense of Efficacy High Sense of Efficacy
Urgency – Internal or external pressure to get better results
Efficacy – Belief in having the skills, tools, resources to accomplish the intended results
Mark a star where you are
Mark a star where your teachers are

Perceptions Compare responses at your campus table
Discuss why you responded as you did

High Sense of Urgency
Low Sense of Urgency
Low Sense of Efficacy High Sense of Efficacy
CHANGEPeople
See need to change
Feel they have the tools
Significant improvement is possible with leadershipCHANCE
PeopleDon’t see a need
to changeStaff is skilled and
believe they make a difference
STATUS QUOPeople
Don’t perceive a need to do anything
This too shall passWe’re doing the
best we can
DESPAIRPeople
Are in crisisDon’t believe they
can make a difference
Blame others, give up
Buy stuff
PerceptionsWhat is easier to change – urgency or efficacy? Why is this important?What can you address?How can you address it?
Develop UnderstandingWORK SESSION

Accountability
Index Framework◦ Student Achievement◦ Student Progress◦ Closing Performance Gaps◦ Postsecondary Readiness

Indices Index Framework
◦ Index 1 Student Achievement◦ Index 2 Student Progress◦ Index 3 Closing Performance Gaps◦ Index 4 Postsecondary Readiness
Purpose of the IndexWhy are there four indices?What is the purpose of each?

Experts in Accountability

Task Divide your campus table into four groups.
Elementary Middle School High School
1 – 1 Person 2 – 1 Person3 – 1 Person 4 – 1 Person
1 – 1 Person 2 – 2 Person3 – 2 Person 4 – 1 Person
1 – 2 Person 2 – 2 Person3 – 2 Person 4 – 2 Person
Additional GroupsCareer Academy – Join each High SchoolDAEP – Join each Middle SchoolBurleson – Join Las PalmasCardenas – Join RooseveltStafford – Join Stafford
Why?
This is your Index
District – Divide the sections

Campus Folder Materials Jigsaw Activity
◦ Pages of the Accountability Manual◦ Master Copy – Leave it!
1. Separate the pages according to the Index 1. Multiple sets for the overlap pages
2. Determine who should have the intro pages
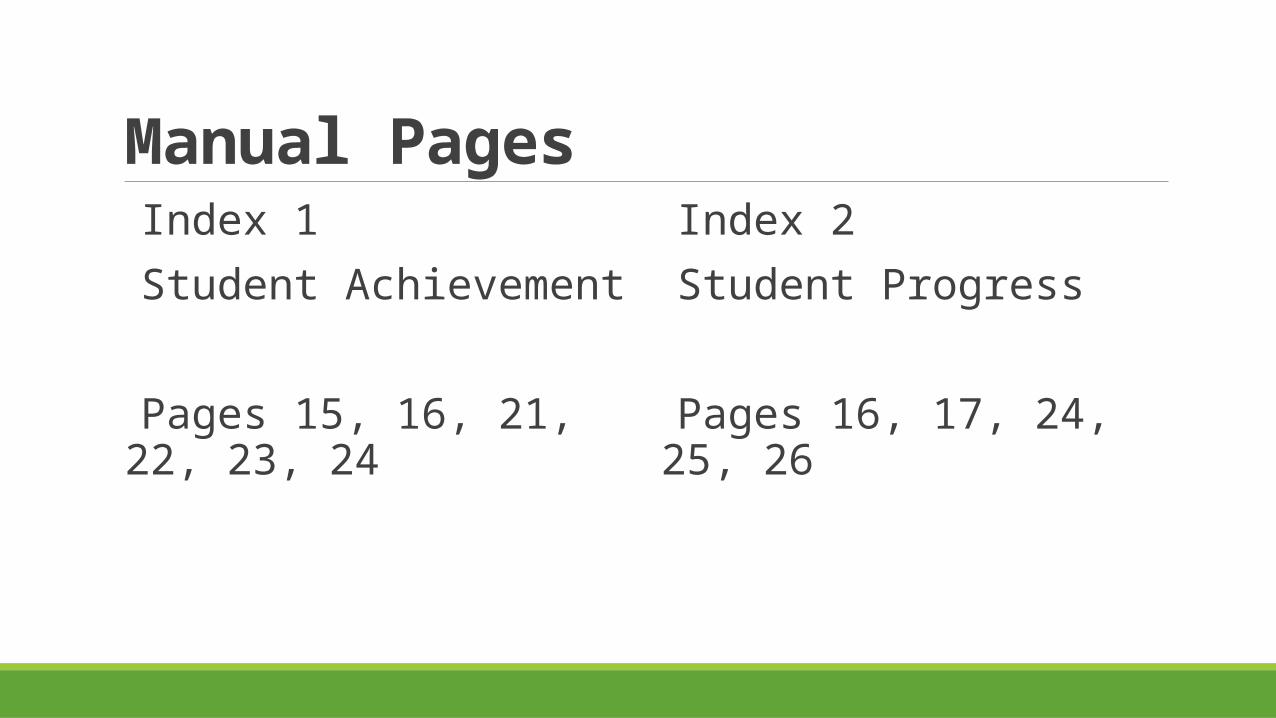
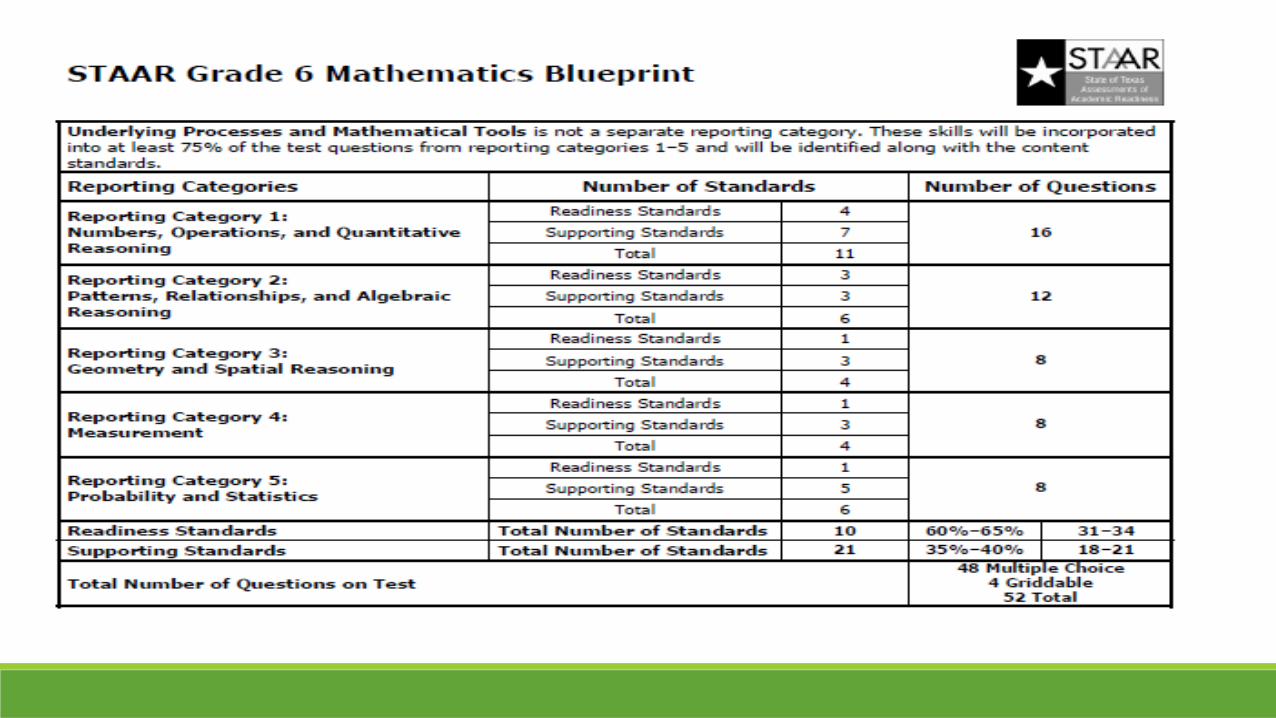
Manual Pages Index 1 Student Achievement
Pages 15, 16, 21, 22, 23, 24
Index 2 Student Progress
Pages 16, 17, 24, 25, 26
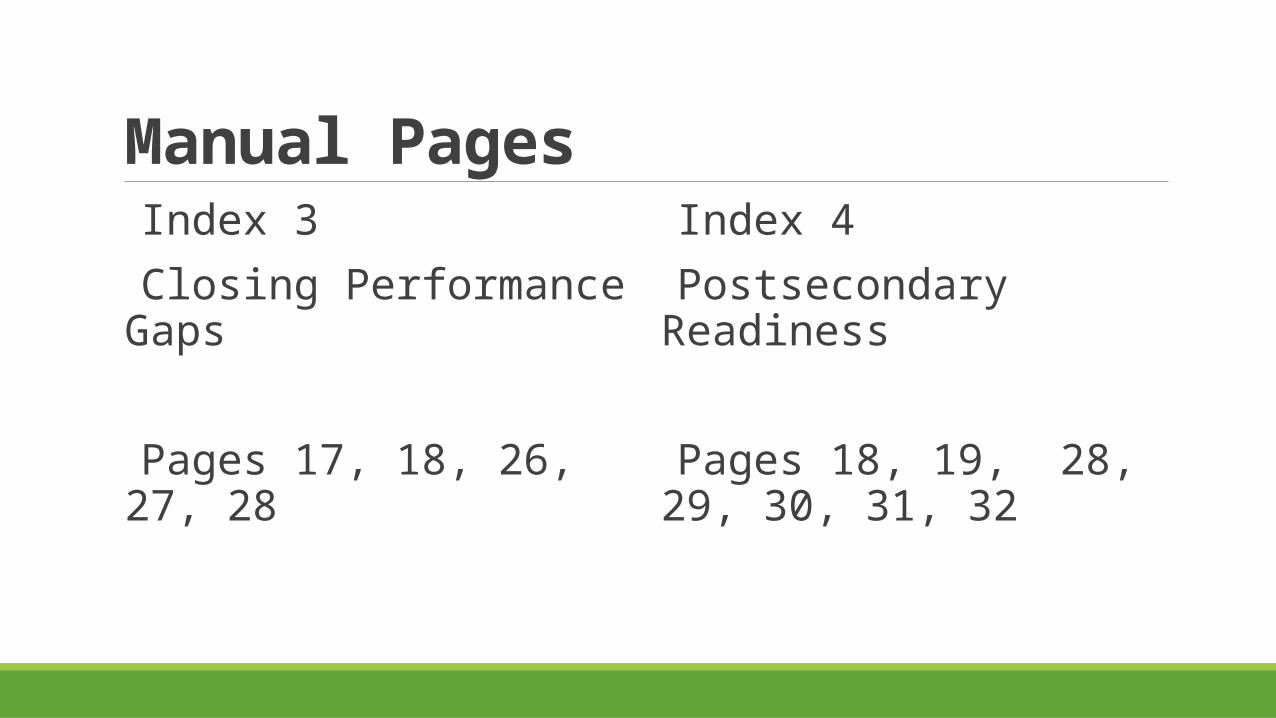
Manual Pages Index 3 Closing Performance Gaps
Pages 17, 18, 26, 27, 28
Index 4 Postsecondary Readiness
Pages 18, 19, 28, 29, 30, 31, 32
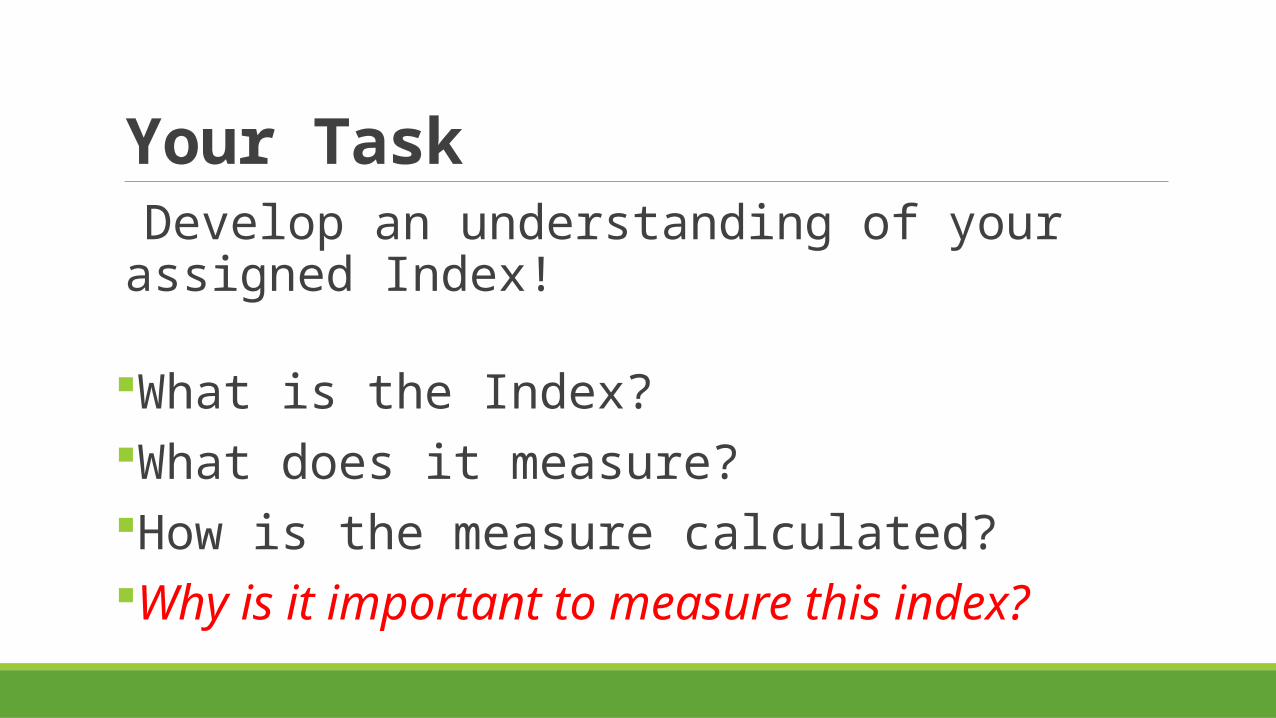
Your Task Develop an understanding of your assigned Index!
What is the Index?What does it measure?How is the measure calculated?Why is it important to measure this index?

Your Task1. Read and develop an understanding of your section.
1. Five minutes 2. Highlight, Take Notes
2. Meet with your same index group1. All Levels
3. Discuss and record the components of your index1. Bullet points
4. Make certain your address the questions1. Chart – Post 2. Note Packet
15 Minutes to Work!
Everyone in the group must be prepared to share

Index Understanding Return to your campus station Share information Note Taking Packet
Does your staff need to know this information?◦ How will you share it?
Index Review What would a campus have to do to be successful with each of the indices?

Edgewood ISD DataEXAMINE AS A GROUP
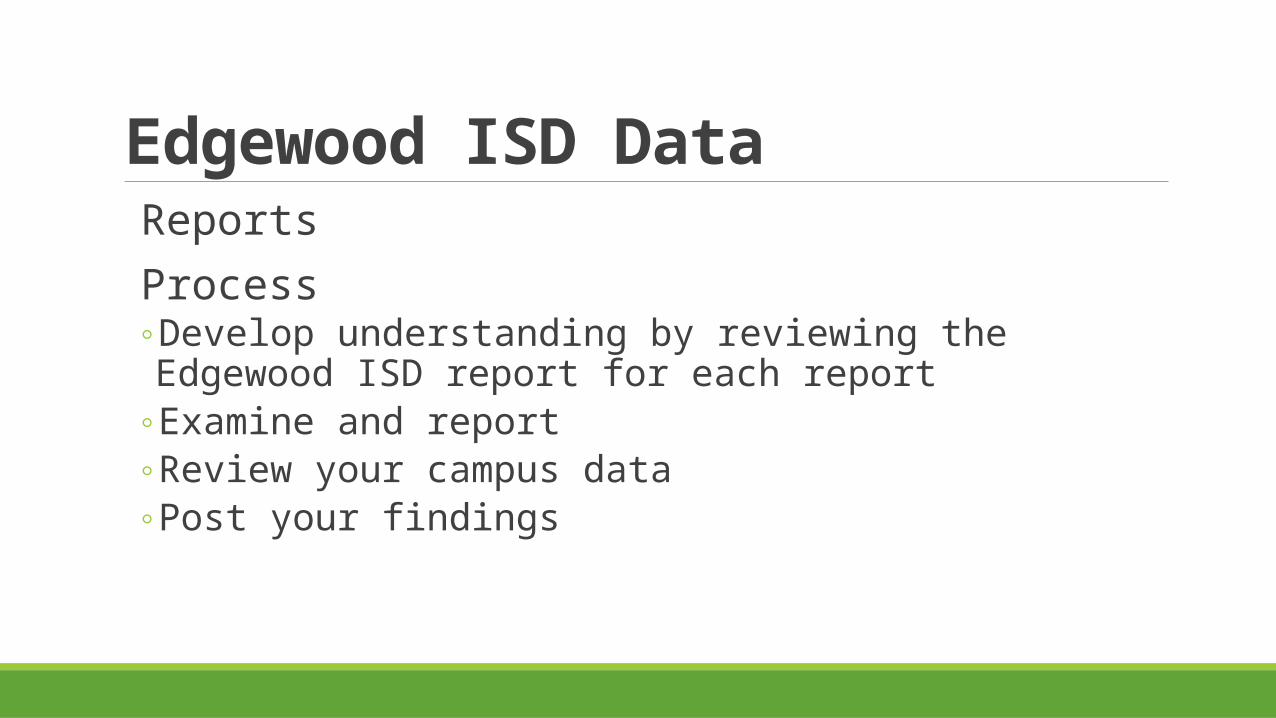
Edgewood ISD Data Reports Process
◦ Develop understanding by reviewing the Edgewood ISD report for each report
◦ Examine and report◦ Review your campus data◦ Post your findings

Reports Available Index Calculation and Data Table Report System Safeguards Distinction Designations Accountability Summary
Index Calculation and Data Table Report
Edgewood ISD Data Calculation Report
◦ Information as to how each Index was calculated◦ Walk through the document ◦ Continue note page◦ Use a calculator

Index Calculation and Data Table ReportUnderstandFour reports1 = 3

Edgewood ISD DataCALCULATION REPORT
◦ Index 1◦ Page 1 = Calculation (Summary of the Tables)◦ Pages 2 & 3 = Data Table for the Index (Highlighted = used for
the calculation)
◦ Index 2◦ Page 4 =Calculation◦ Pages 5 & 6 = Data Table
◦ Index 3◦ Page 7 & 8 = Calculation◦ Pages 9 & 10 = Data Table
◦ Index 4◦ Page 11 = Calculation◦ Page 12 = Data Table
TARGETS
◦ Index 1◦ 50
◦ Index 2◦ Elementary 30◦ Middle School 29◦ High School 17◦ District 21
◦ Index 3◦ 55
◦ Index 4◦ 75
Index 1STUDENT ACHIEVEMENT
Index Calculation and Data Table Report
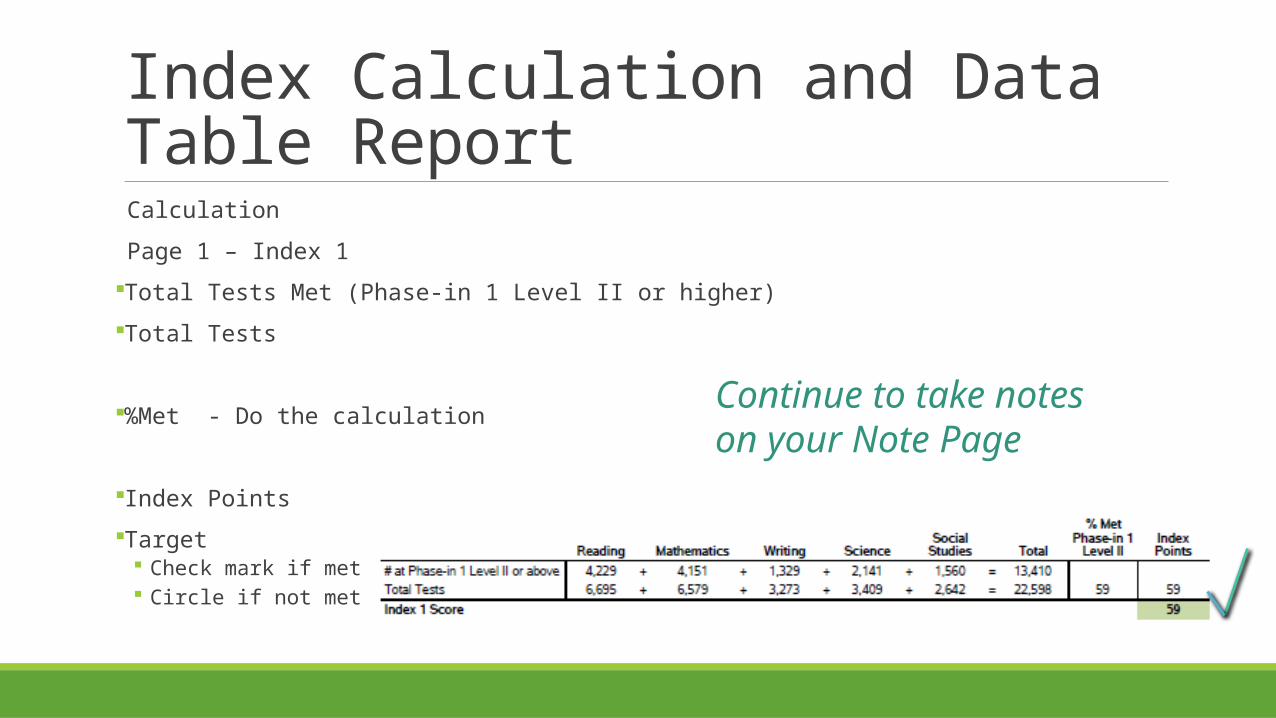
Calculation
Page 1 – Index 1
Total Tests Met (Phase-in 1 Level II or higher)
Total Tests
%Met - Do the calculation
Index Points
Target Check mark if met Circle if not met
Continue to take notes on your Note Page
Index Calculation and Data Table Report
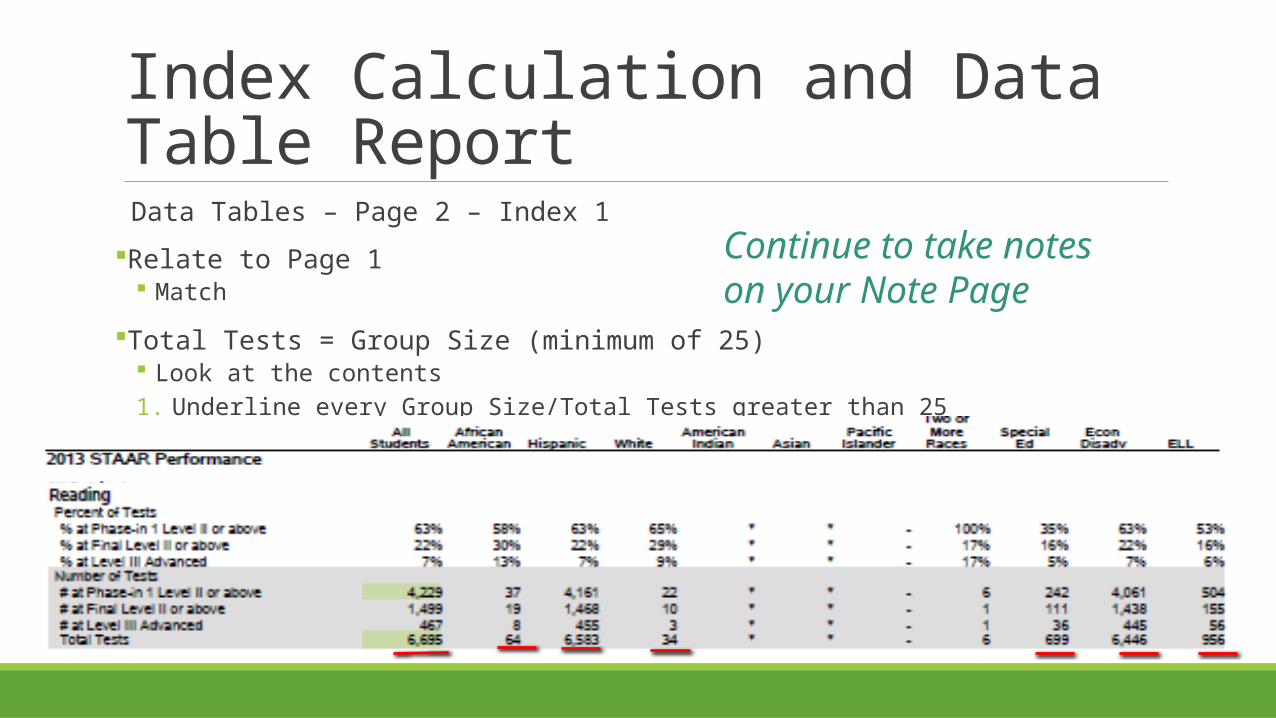
Data Tables – Page 2 – Index 1
Relate to Page 1 Match
Total Tests = Group Size (minimum of 25) Look at the contents1. Underline every Group Size/Total Tests greater than 25
Continue to take notes on your Note Page
Index Calculation and Data Table Report
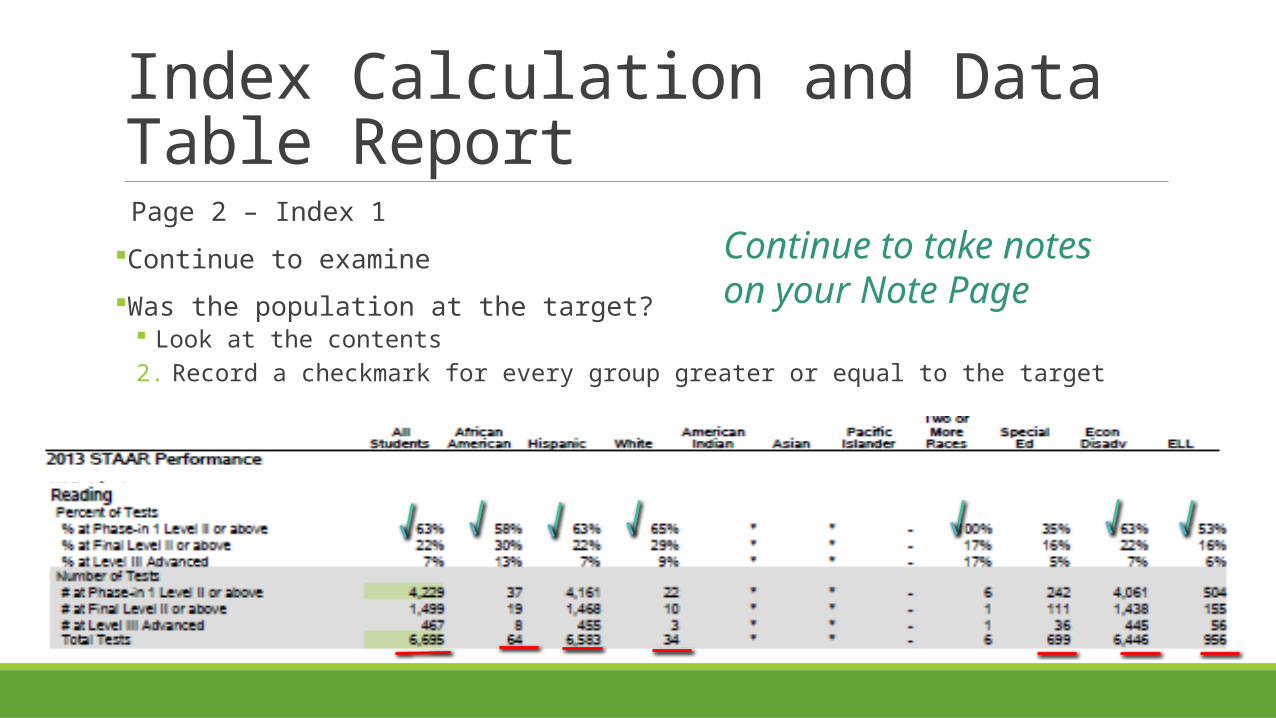
Page 2 – Index 1
Continue to examine
Was the population at the target? Look at the contents2. Record a checkmark for every group greater or equal to the target
Continue to take notes on your Note Page
Index Calculation and Data Table Report
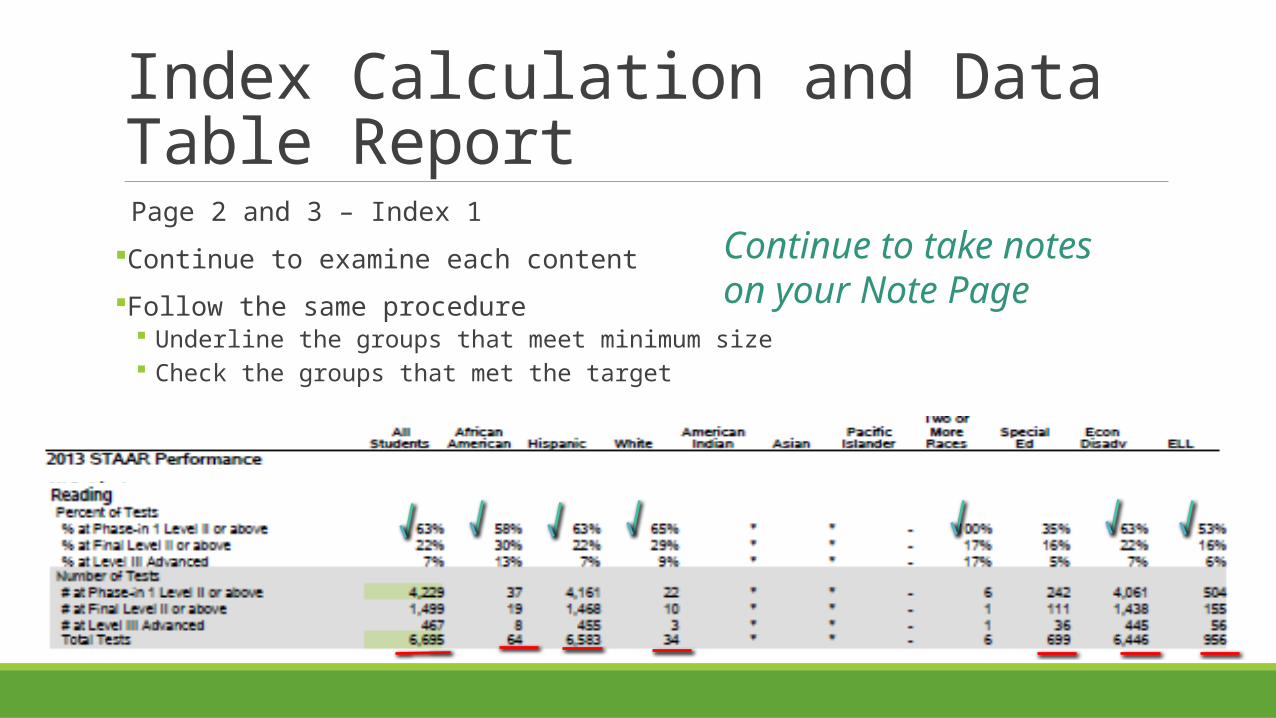
Page 2 and 3 – Index 1
Continue to examine each content
Follow the same procedure Underline the groups that meet minimum size Check the groups that met the target
Continue to take notes on your Note Page
Index Calculation and Data Table Report
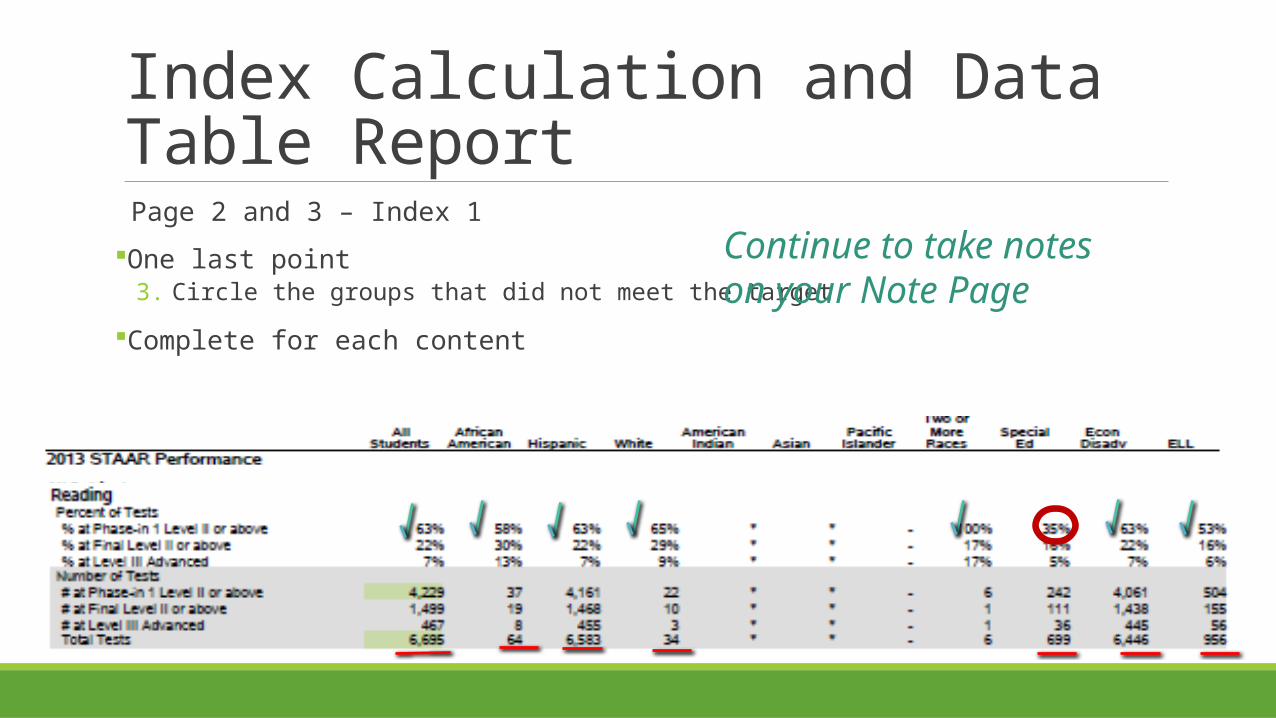
Page 2 and 3 – Index 1
One last point3. Circle the groups that did not meet the target
Complete for each content
Continue to take notes on your Note Page
Index Calculation and Data Table ReportSummarize the District results for Index 1
Groups meeting minimum size Groups met standard Groups not meeting standard
What does this mean?
What do we do?
Record on your Edgewood Reflections Page
Index Calculation and Data Table ReportReview the data for your campus for Index 1
1. Underline Minimum Size Groups
2. Check mark the groups that met the target
3. Circle the groups not met
Record on your Campus Reflections Page
Campus Reports

Index Calculation and Data Table ReportReview the data for your campus for Index 1
Chart Paper for your campus – Use for all 4 Indices Record strengths Record needs
Examine as a District
Campus Reports

Improve Index 2
Focus
Student Expectation Difficulties What causes them?
How do we address?
1 + 1 + 1 = _
1 + 1 + 1 = 9

Student Expectation Difficulties How does this change instruction?

Table TalkWhat do you commit to doing differently?

Index 2STUDENT PROGRESS
Index Calculation and Data Table Report
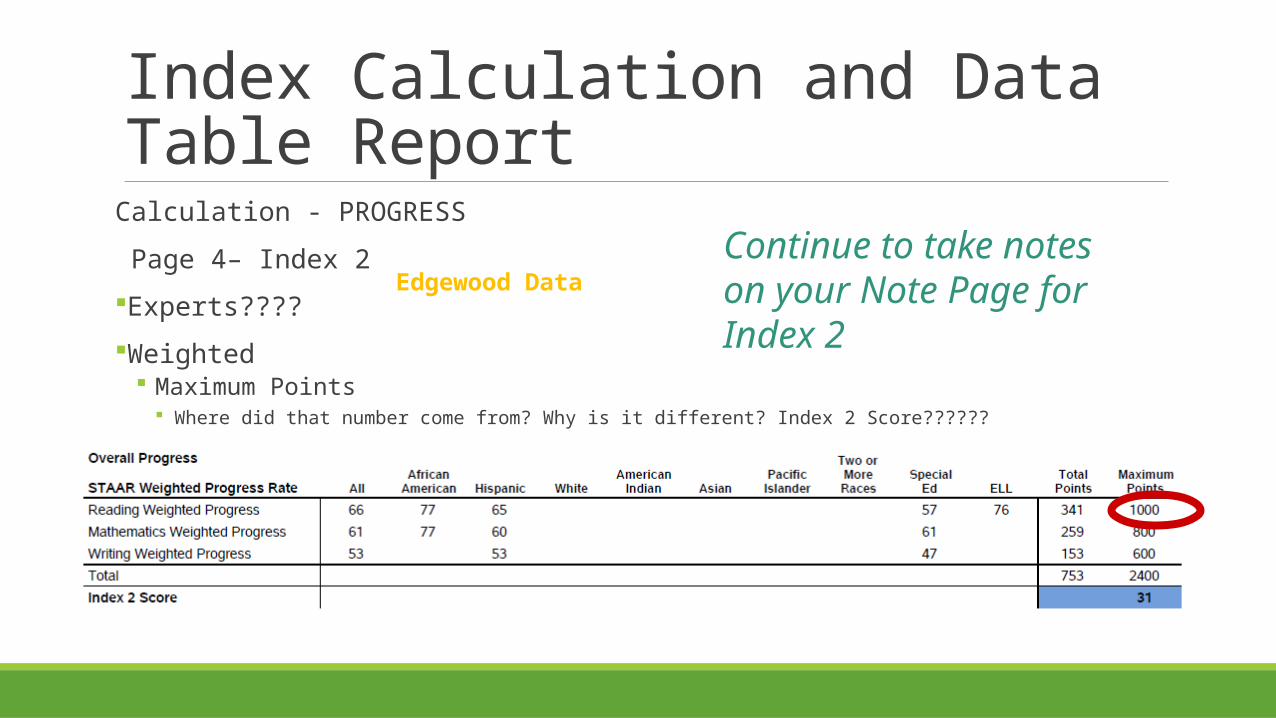
Calculation - PROGRESS
Page 4– Index 2
Experts????
Weighted Maximum Points
Where did that number come from? Why is it different? Index 2 Score??????
Continue to take notes on your Note Page for Index 2Edgewood Data
Index Calculation and Data Table Report
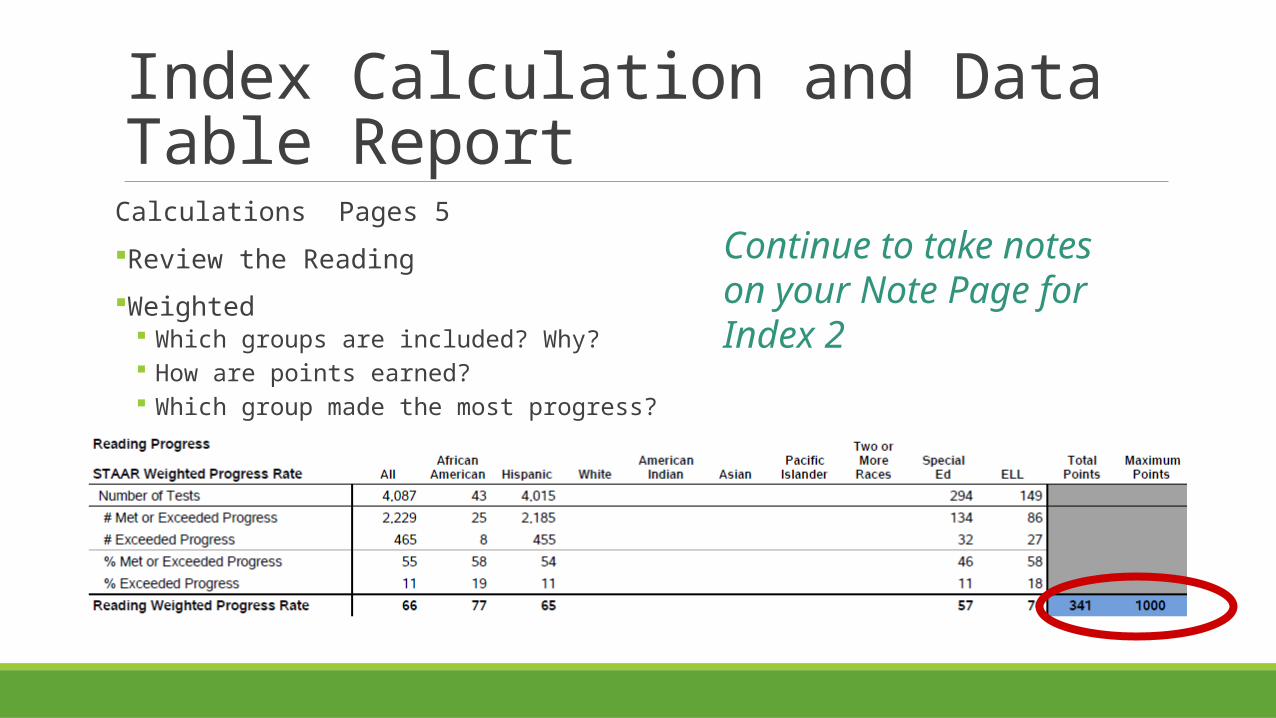
Calculations Pages 5
Review the Reading
Weighted Which groups are included? Why? How are points earned? Which group made the most progress?
Continue to take notes on your Note Page for Index 2
Index Calculation and Data Table Report
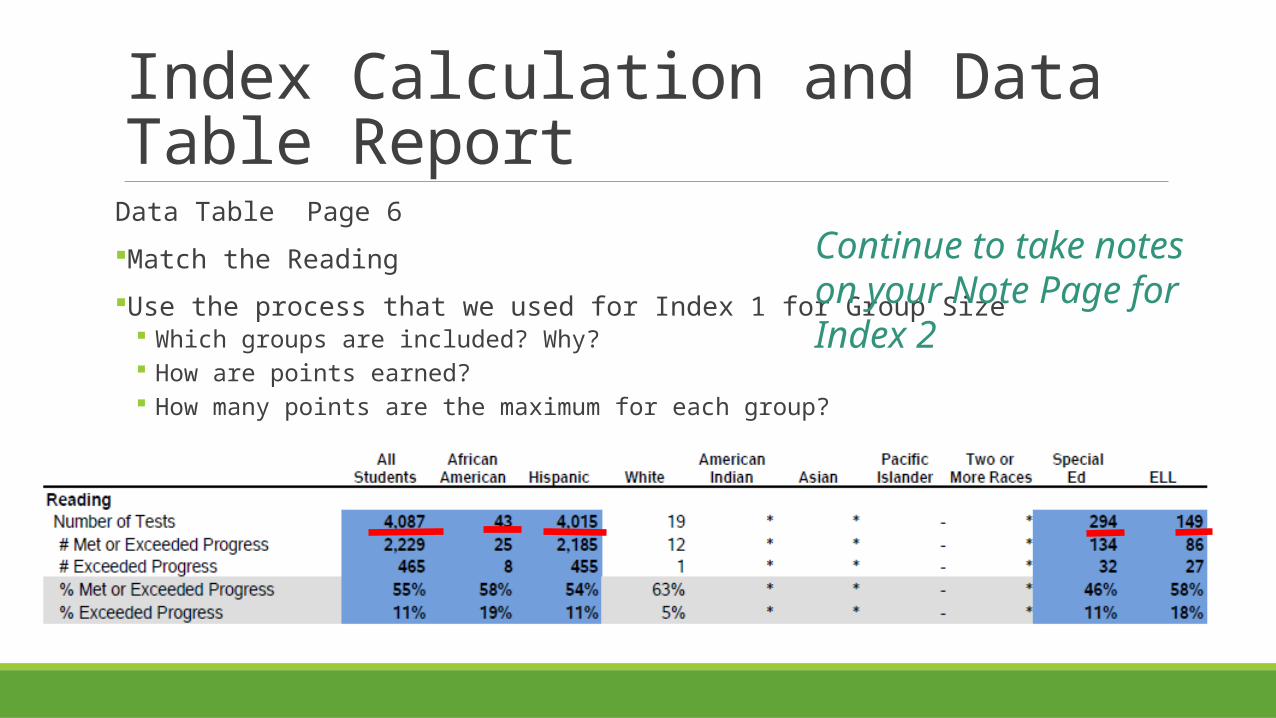
Data Table Page 6
Match the Reading
Use the process that we used for Index 1 for Group Size Which groups are included? Why? How are points earned? How many points are the maximum for each group?
Continue to take notes on your Note Page for Index 2
Index Calculation and Data Table Report
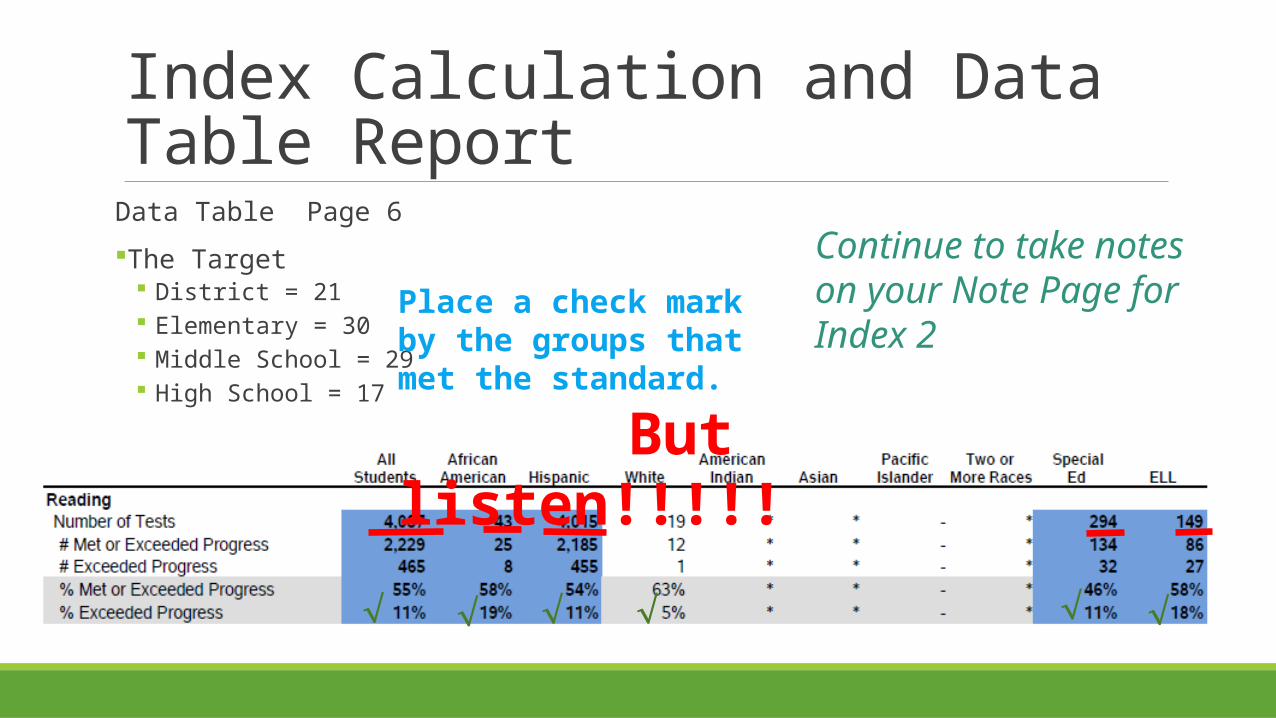
Data Table Page 6
The Target District = 21 Elementary = 30 Middle School = 29 High School = 17
Continue to take notes on your Note Page for Index 2Place a check mark by the
groups that met the standard.
But listen!!!!!
Index Calculation and Data Table Report
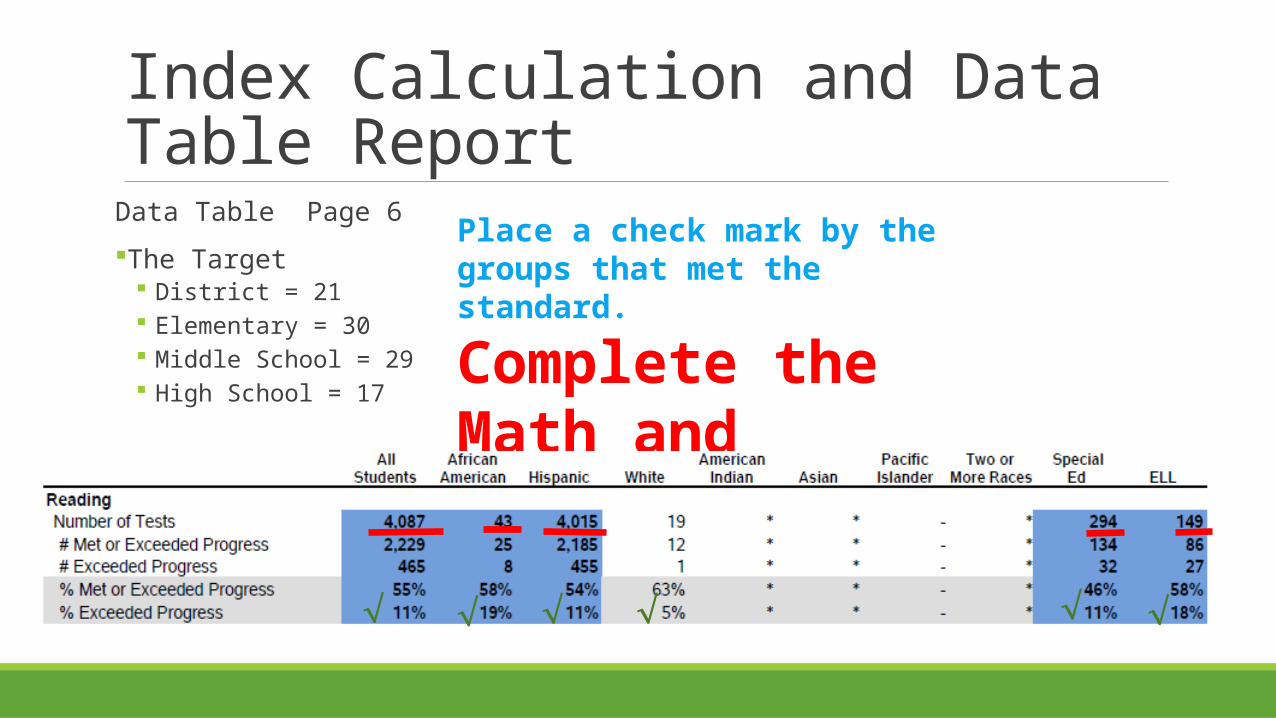
Data Table Page 6
The Target District = 21 Elementary = 30 Middle School = 29 High School = 17
Place a check mark by the groups that met the standard.
Complete the Math and Writing

Index Calculation and Data Table ReportSummarize the District results for Index 2
Groups meeting minimum size Groups met standard Groups not meeting standard
What does this mean?
What do we need to change?
What might cause a campus to NOT meet this index?
Record on your Edgewood Reflections Page
Index Calculation and Data Table ReportReview the data for your campus
1. Underline Minimum Size Groups
2. Check mark the groups that met the target
3. Circle the groups not met
Record on your Campus Reflections Page
Campus Reports

Index Calculation and Data Table ReportReview the data for your campus for Index 2
Chart Paper for your campus – Use for all 4 Indices Record strengths Record needs
Examine as a District
Campus Reports
Improve Index 2
How Does Your Campus Implement
What We Have?

Improve Index 2

Improve Index 2

Improve Index 2Purpose of the WAR AreaValue Added System
Student ConferencesEstablish GoalsSuccessful Students

Table TalkWhat do you commit to doing differently?

Index 3CLOSING PERFORMANCE GAPS

Index Calculation and Data Table Report
Closing Performance Gaps
Page 7– Index 3
Experts???? – What is different about the groups measured?
Why are these populations addressed? Maximum Points
Where did that number come from? Why is it different? Index 3 Target is 55.
Continue to take notes on your Note Page for Index 3
Did EISD meet?
Edgewood

Index Calculation and Data Table Report
Page 7 & 8– Index 3 Continue the calculations
Examine the populations closely Pages 9 & 10
Continue to take notes on your Note Page for Index 3
Did EISD meet?
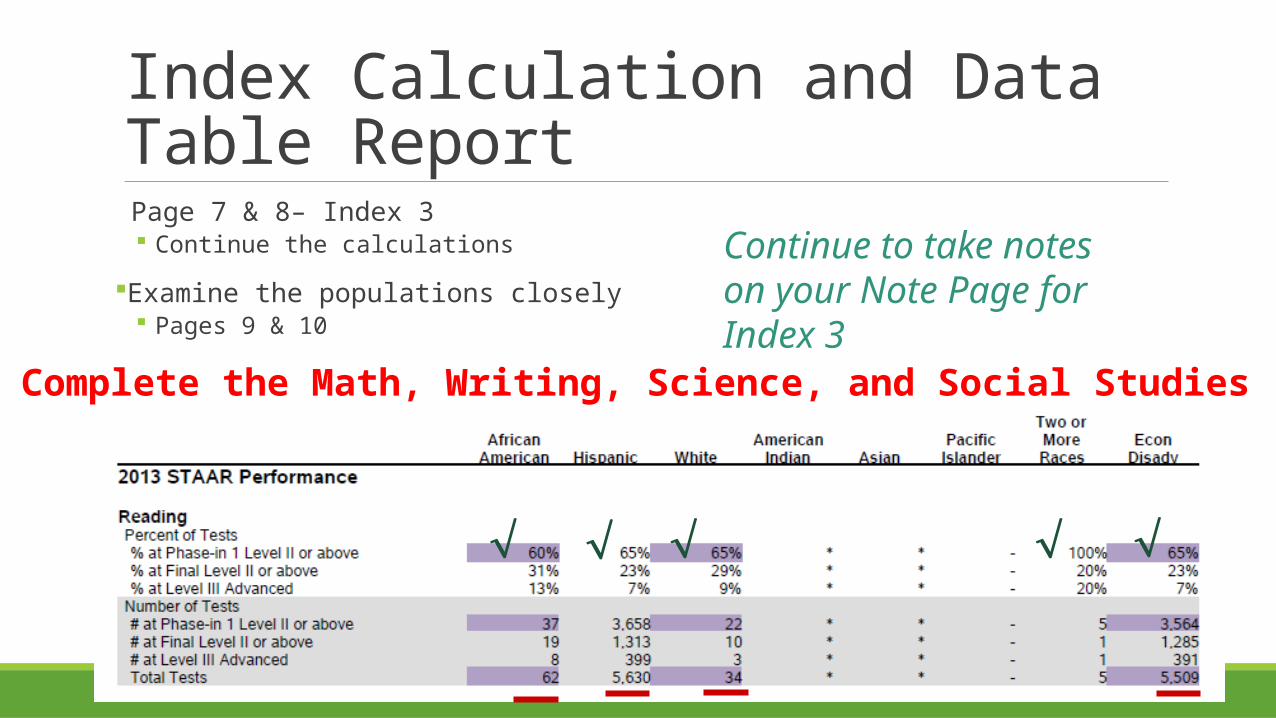
Index Calculation and Data Table Report
Page 7 & 8– Index 3 Continue the calculations
Examine the populations closely Pages 9 & 10
Continue to take notes on your Note Page for Index 3
Complete the Math, Writing, Science, and Social Studies

Index Calculation and Data Table ReportSummarize the District results for Index 3
Groups meeting minimum size Groups met standard Groups not meeting standard
What does this mean?
What do we need to change?
What might cause a campus to NOT meet this index?
Record on your Edgewood Reflections Page

Index Calculation and Data Table ReportReview the data for your campus
1. Underline Minimum Size Groups
2. Check mark the groups that met the target
3. Circle the groups not met
Record on your Campus Reflections Page
Campus Reports

Index Calculation and Data Table ReportReview the data for your campus for Index 3
Chart Paper for your campus – Use for all 4 Indices Record strengths Record needs
Examine as a District
Campus Reports

Improve Index 3
Change Instruction to
STAAR Instruction
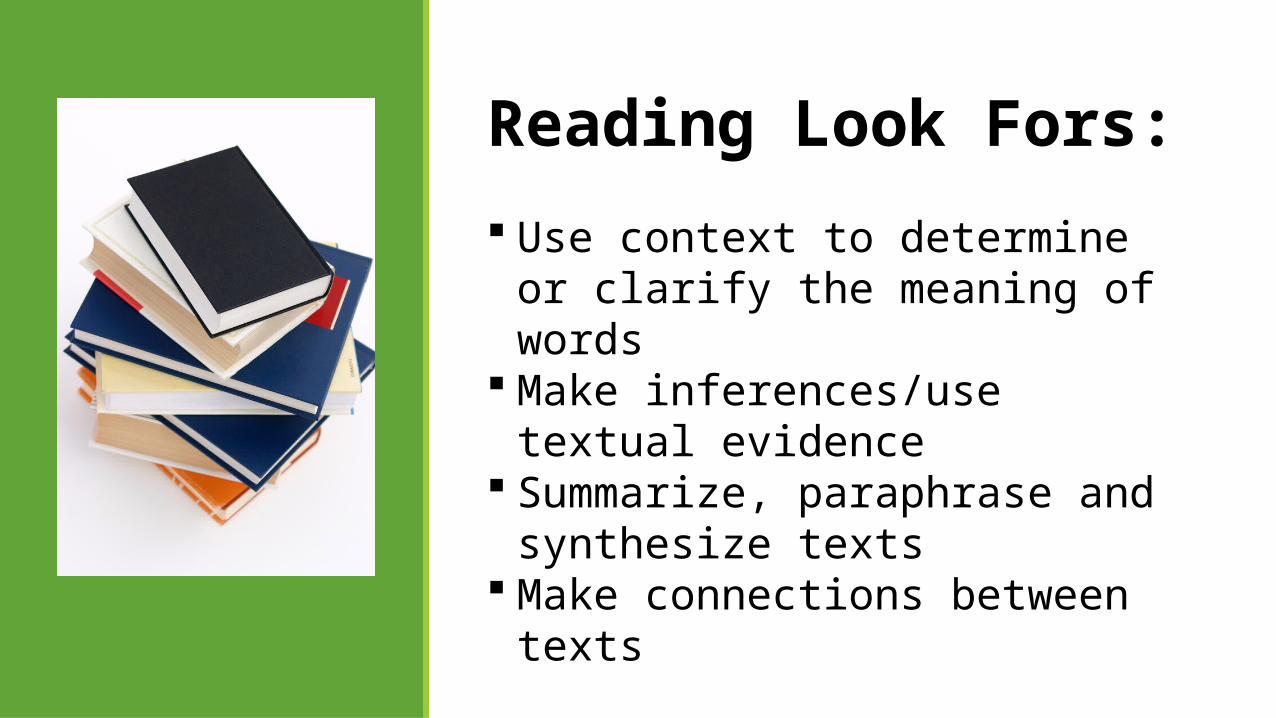
Reading Look Fors:
Use context to determine or clarify the meaning of words
Make inferences/use textual evidence Summarize, paraphrase and synthesize
texts Make connections between texts

Writing Look Fors:
Revise Write to a prompt while maintaining a
focus Clear thesis Writing across contents

Math Look Fors:
Math in everyday situations Use a problem solving model Select/develop a problem solving
strategy Use mathematical tools Communicate mathematical ideas Make generalizations, conjectures and
justify thinking

Science Look Fors:
Analyze information Interpret information Make inferences Communicate valid conclusions Use scientific tools and instruments Use models to represent
Social Studies Look Fors:
Sequencing, categorizing, cause/effect, inference
Organize, analyze and interpret information
Use primary and secondary resources
What did you notice about the Look Fors?
Embedded Process Skills


Table TalkWhat do you commit to doing differently?

Index 4POST SECONDARY READINESS

Index Calculation and Data Table Report
Post Secondary Readiness
Page 11 – Index 4
Experts???? Target?
What are the options here?
Continue to take notes on your Note Page for Index 4Did EISD
meet?

Index Calculation and Data Table Report
Post Secondary Readiness
Graduation Calculation
Underline groups
Check if met
Continue to take notes on your Note Page for Index 4
Index Calculation and Data Table Report
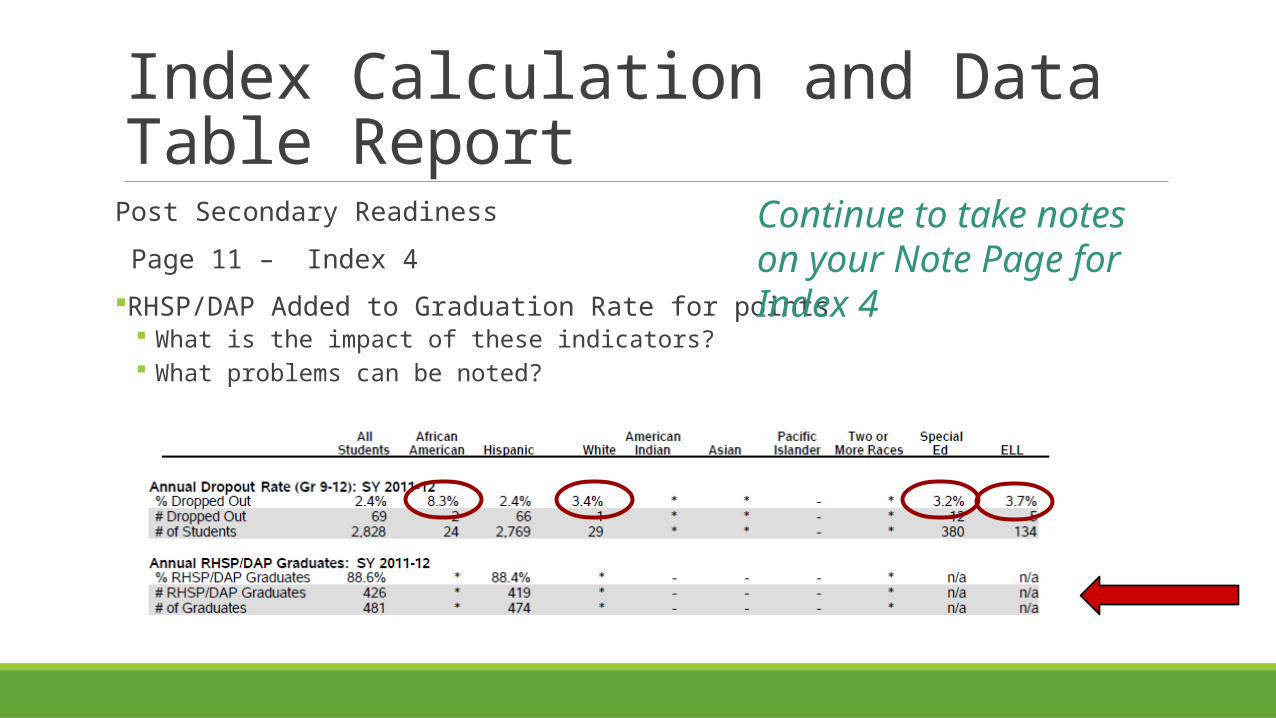
Post Secondary Readiness
Page 11 – Index 4
RHSP/DAP Added to Graduation Rate for points What is the impact of these indicators? What problems can be noted?
Continue to take notes on your Note Page for Index 4

Index Calculation and Data Table ReportElementary and Middle Schools
Groups meeting minimum size Groups met standard Groups not meeting standard
Concerns
High Schools
Record on your Edgewood Reflections Page
Campus Reports
2014 = Final Level II
Improve Index 4
Prepared Students
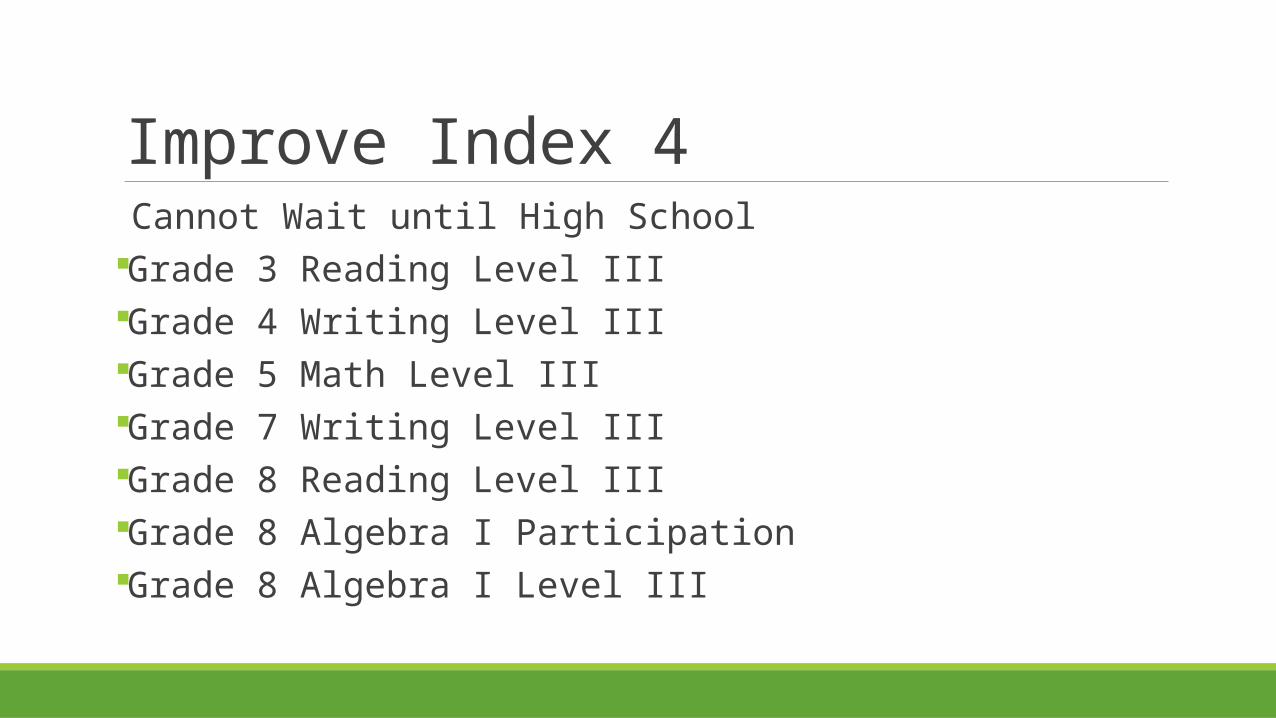
Improve Index 4 Cannot Wait until High SchoolGrade 3 Reading Level IIIGrade 4 Writing Level IIIGrade 5 Math Level IIIGrade 7 Writing Level IIIGrade 8 Reading Level IIIGrade 8 Algebra I ParticipationGrade 8 Algebra I Level III

Table TalkWhat do you commit to doing differently?

Finished One Set of Reports
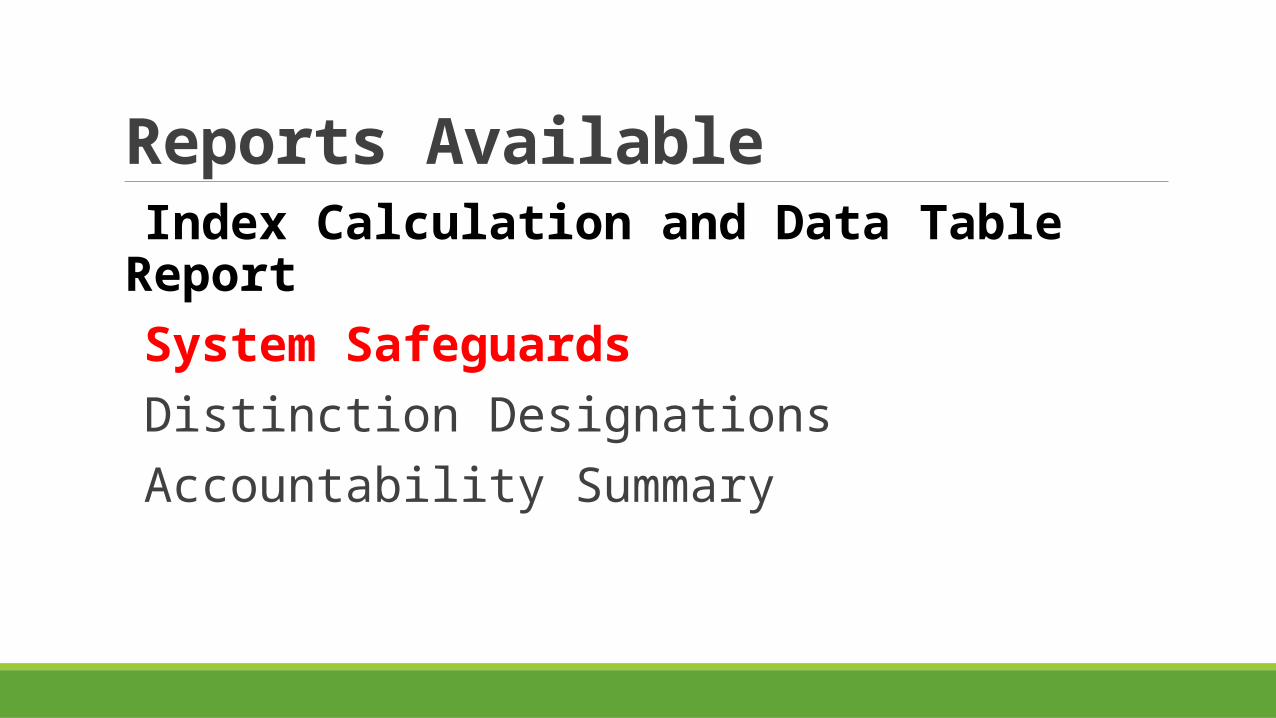
Reports Available Index Calculation and Data Table Report System Safeguards Distinction Designations Accountability Summary
System Safeguards

System Safeguards Poor performance in one subject or grade level or student group does not result in Improvement Required rating.Disaggregated data is reportedCampuses are responsible for addressing performance for each subject and each student groupMethod to meet federal accountabilityAny group with 25 or more tests is evaluatedIncludes targets for caps
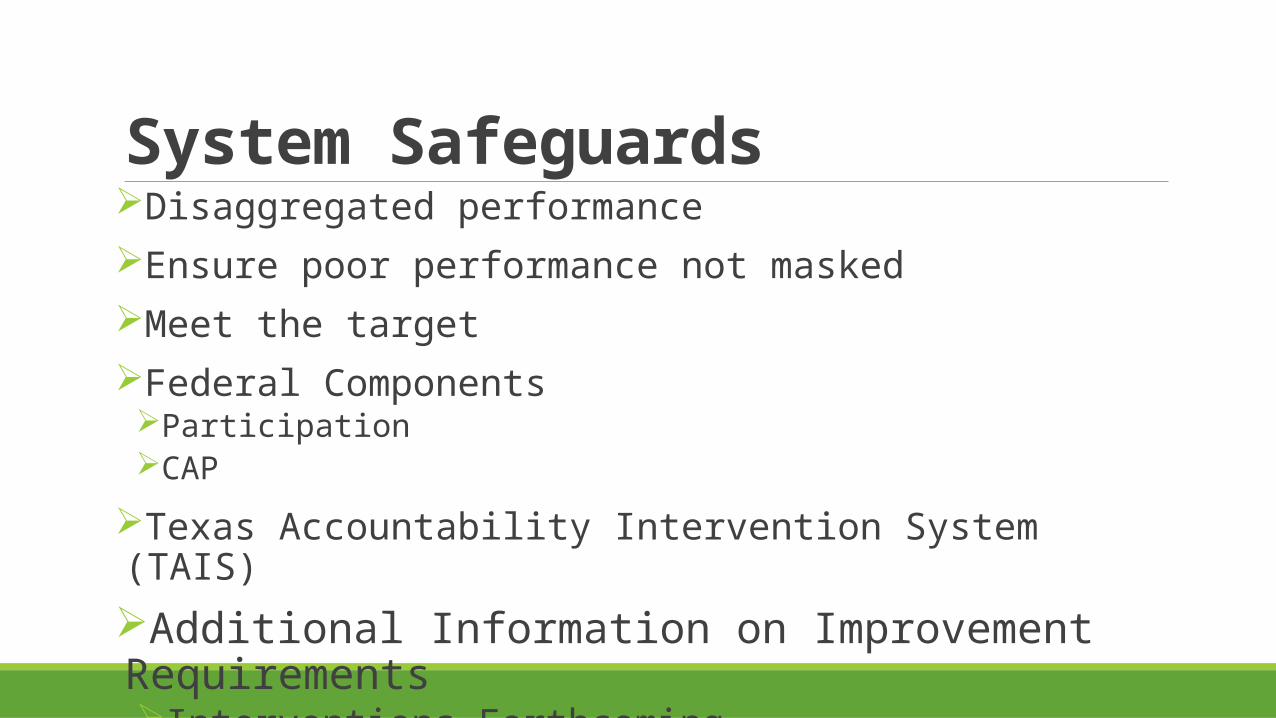
System SafeguardsDisaggregated performanceEnsure poor performance not maskedMeet the targetFederal ComponentsParticipationCAP
Texas Accountability Intervention System (TAIS)
Additional Information on Improvement RequirementsInterventions Forthcoming
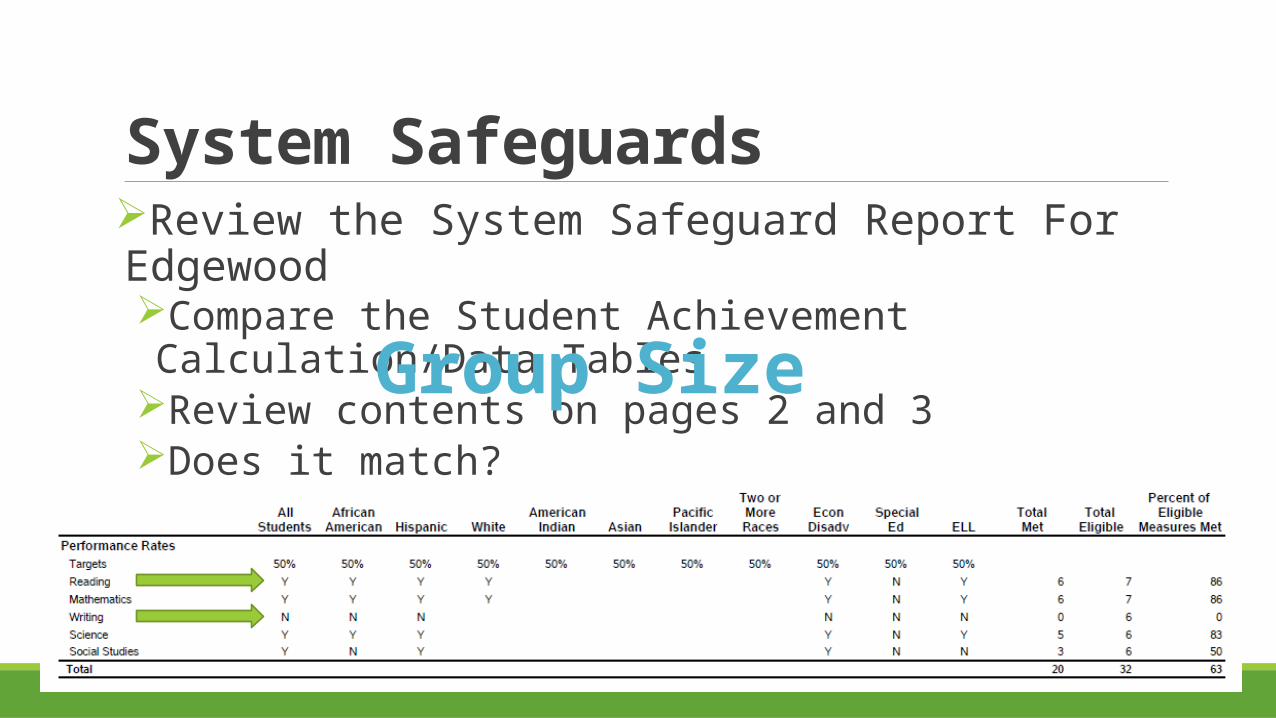
System SafeguardsReview the System Safeguard Report For EdgewoodCompare the Student Achievement Calculation/Data TablesReview contents on pages 2 and 3Does it match? Group Size

System Safeguards
Failure to meet the safeguard target for any reported cell is addressed through TAIS. Manual Page 69
System Safeguards At your table determine which indicators were not met by the District.
What areas require the greatest improvement for the District?
◦ Select Two
System SafeguardsReview the System Safeguard Report For CampusCompare the Student Achievement Calculation/Data TablesReview contents on pages 2 and 3Does it match?
System Safeguards Review the System Safeguards for your campus
How many System Safeguards does your campus need to meet?
Which category has the most indicators for your campus?
Did your campus meet all indicators?
What indicators require improvement?
Can a campus meet all System Safeguards and still be designated as Improvement Needed?
System SafeguardsHow many indicators is the District responsible for?
Why?
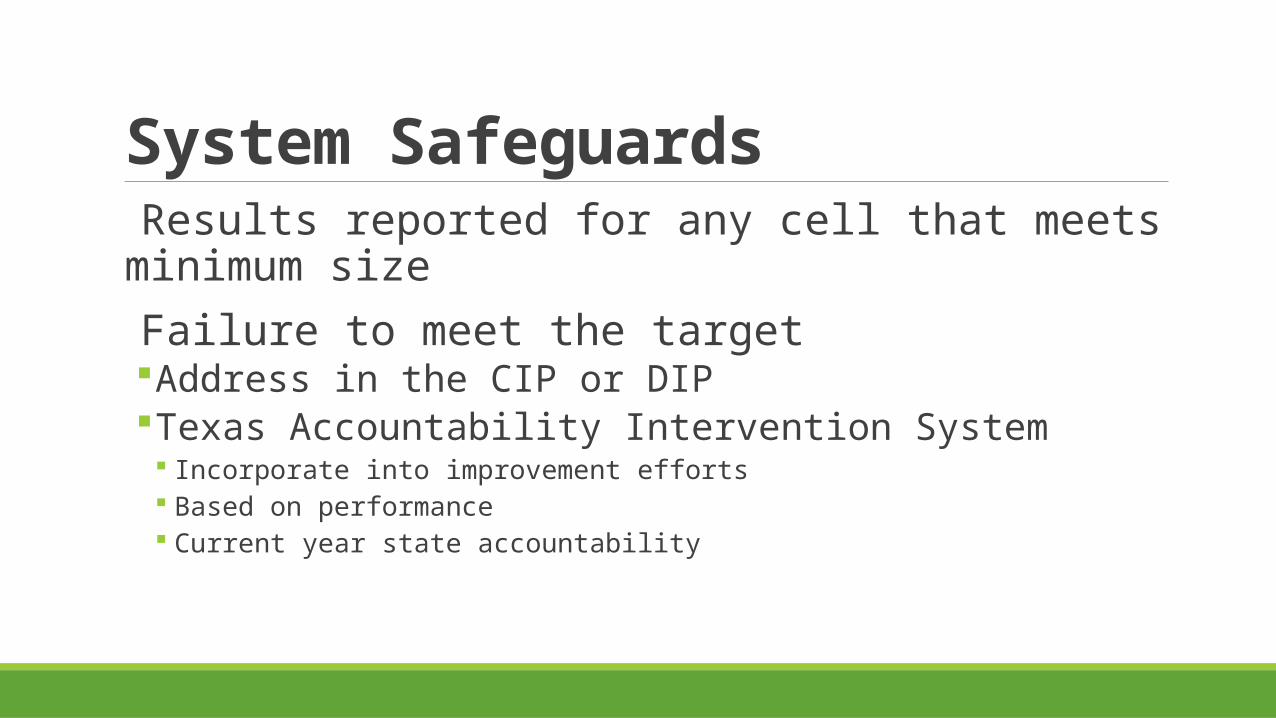
System Safeguards Results reported for any cell that meets minimum size Failure to meet the targetAddress in the CIP or DIPTexas Accountability Intervention System Incorporate into improvement efforts Based on performance Current year state accountability

Address in the CIP or DIP
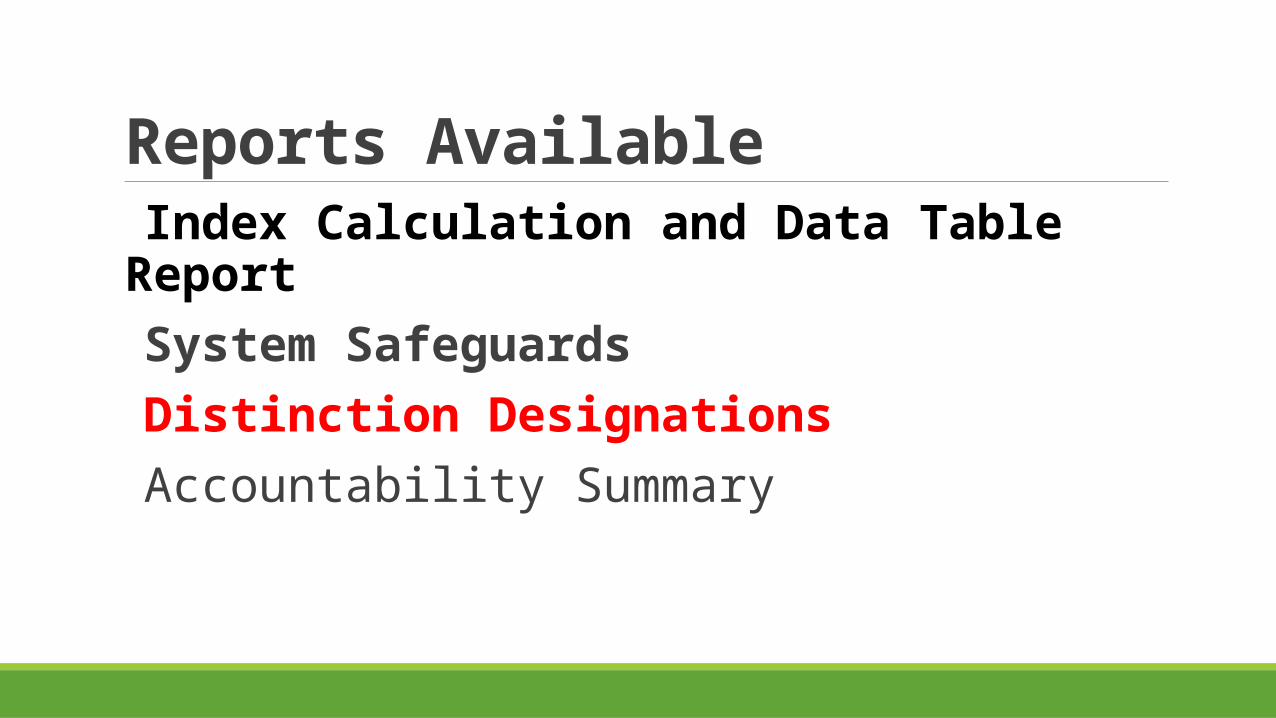
Reports Available Index Calculation and Data Table Report System Safeguards Distinction Designations Accountability Summary
Distinction Designations
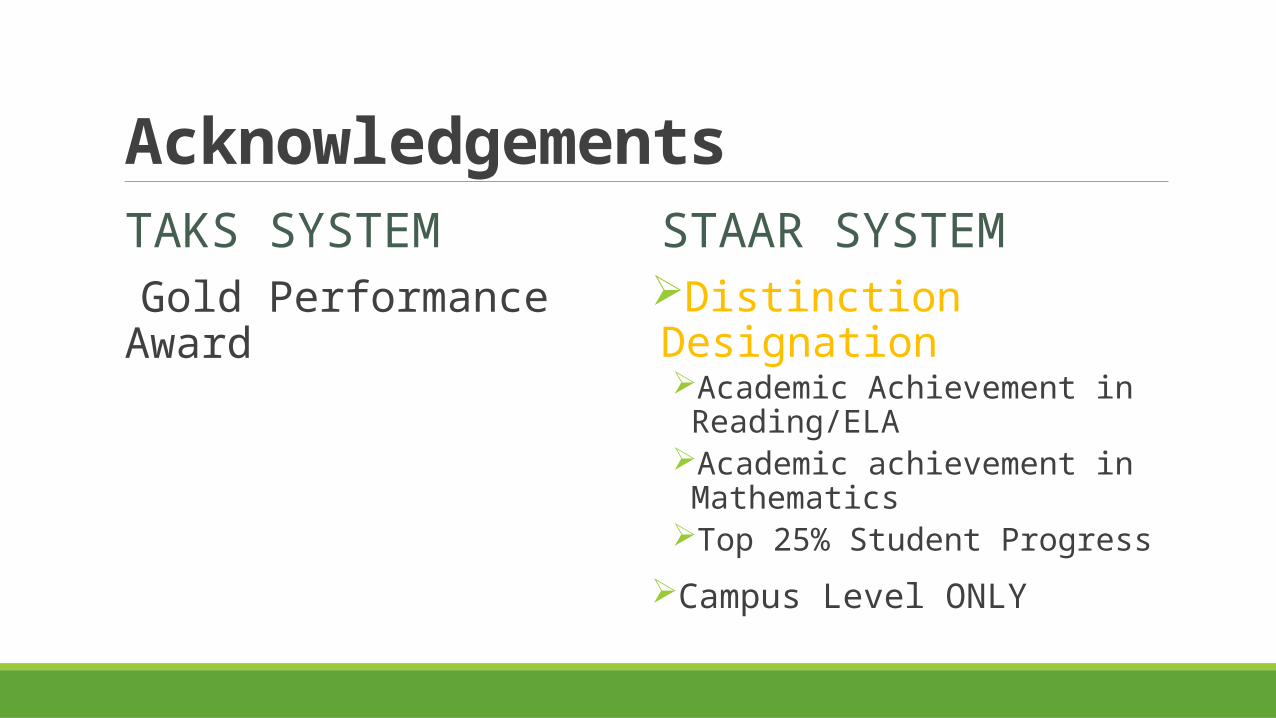
AcknowledgementsTAKS SYSTEM Gold Performance Award
STAAR SYSTEMDistinction DesignationAcademic Achievement in
Reading/ELAAcademic achievement in
MathematicsTop 25% Student Progress
Campus Level ONLY

Distinction DesignationCampus Comparison GroupsTypeSizeEconomically DisadvantagedMobilityELLs
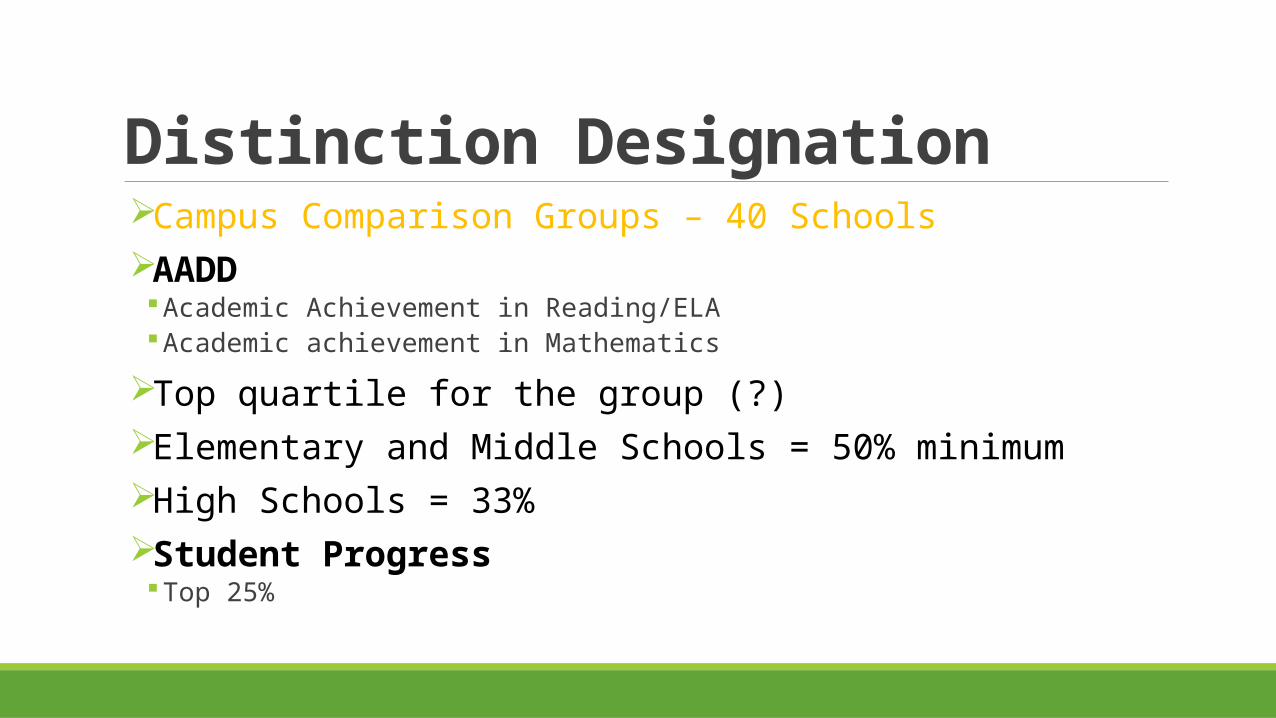
Distinction DesignationCampus Comparison Groups – 40 SchoolsAADD Academic Achievement in Reading/ELA Academic achievement in Mathematics
Top quartile for the group (?)Elementary and Middle Schools = 50% minimumHigh Schools = 33%Student Progress Top 25%
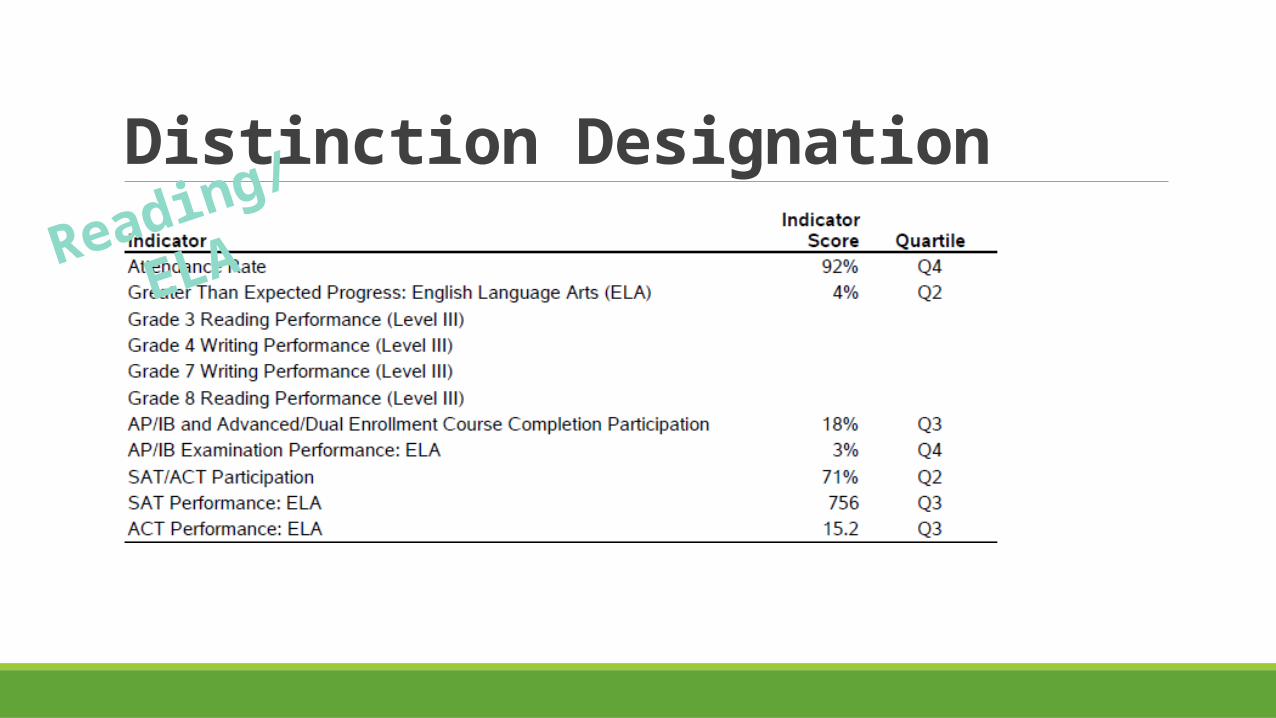
Distinction Designation
Reading/ELA

Distinction Designation
Reading/ELA

Distinction DesignationCampus Comparison Groups
Top 25% Student ProgressWhat does that mean?

Distinction DesignationReview the report for your campusWhat are the strengths?What can you build upon?
If the rating is Improvement Required can you earn a Distinction Designation?

Final Components to ExamineTHREE REPORTS DOWN ONE TO GO

Reports Available Index Calculation and Data Table Report System Safeguards Distinction Designations Accountability Summary
Accountability Summary
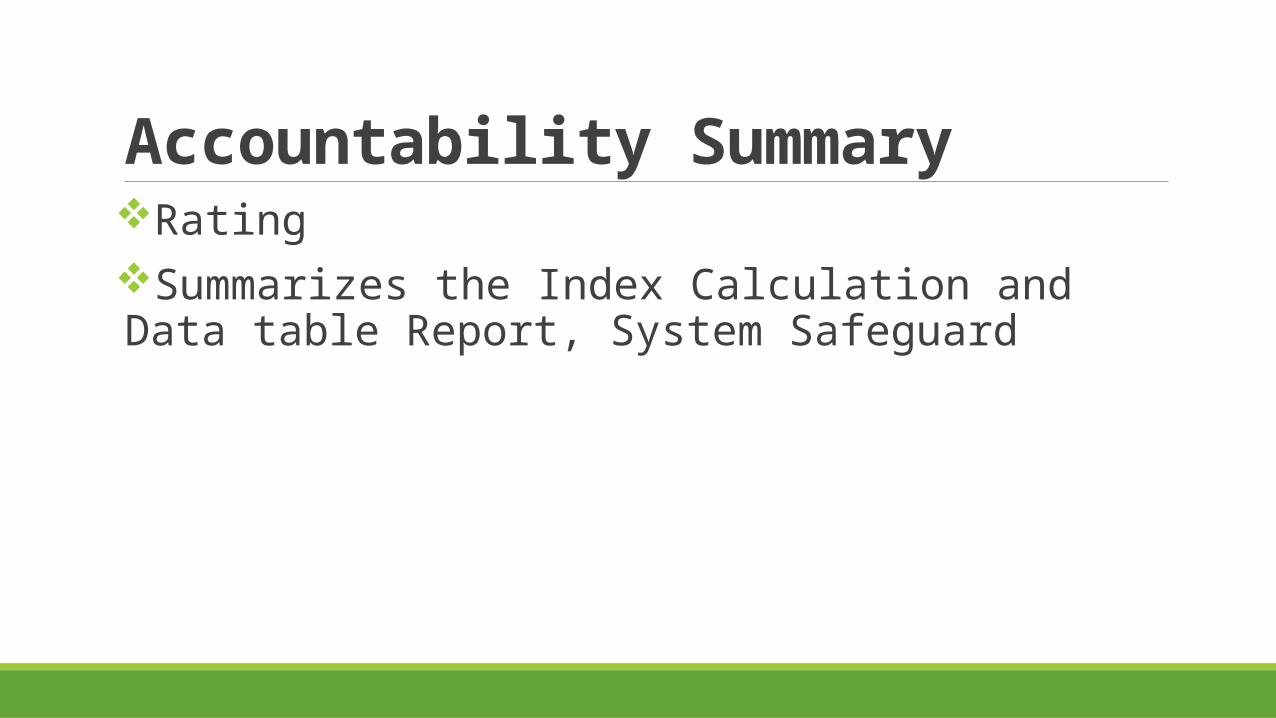
Accountability SummaryRatingSummarizes the Index Calculation and Data table Report, System Safeguard


Reports Available Index Calculation and Data Table Report System Safeguards Distinction Designations Accountability Summary

TEA Ratings
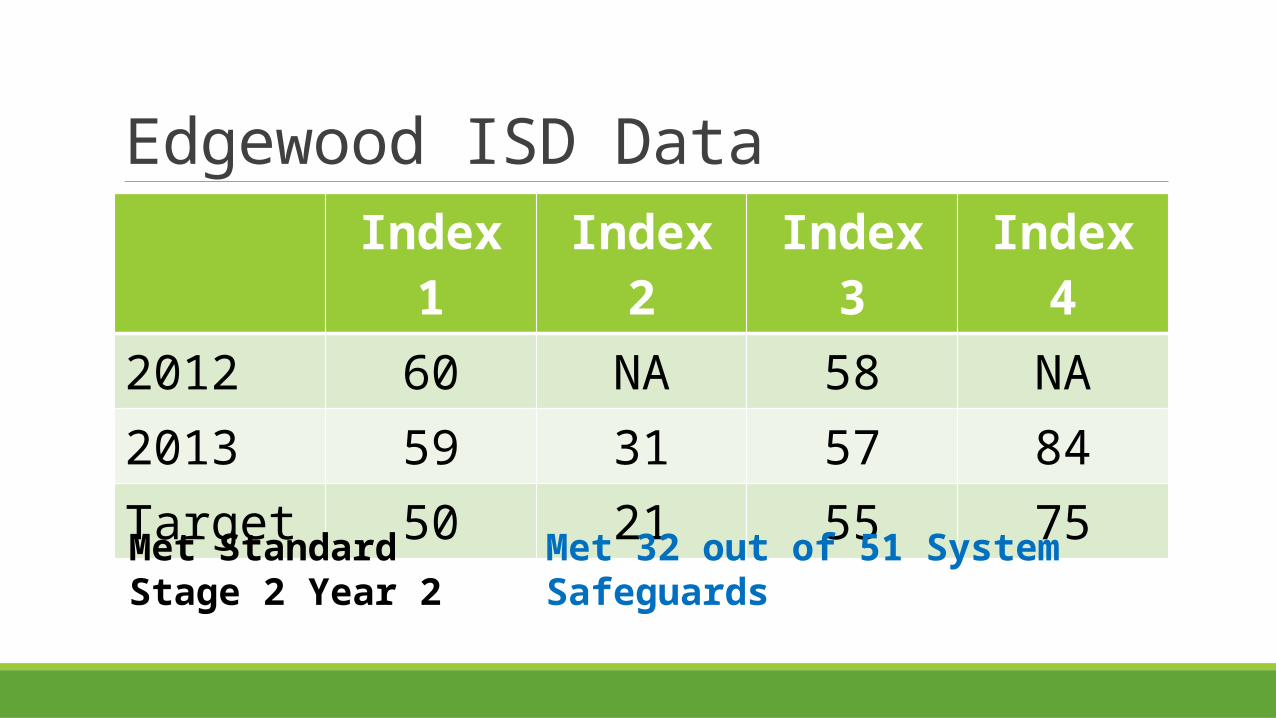
Edgewood ISD DataIndex 1 Index 2 Index 3 Index 4
2012 60 NA 58 NA2013 59 31 57 84Target 50 21 55 75
Met StandardStage 2 Year 2
Met 32 out of 51 System Safeguards
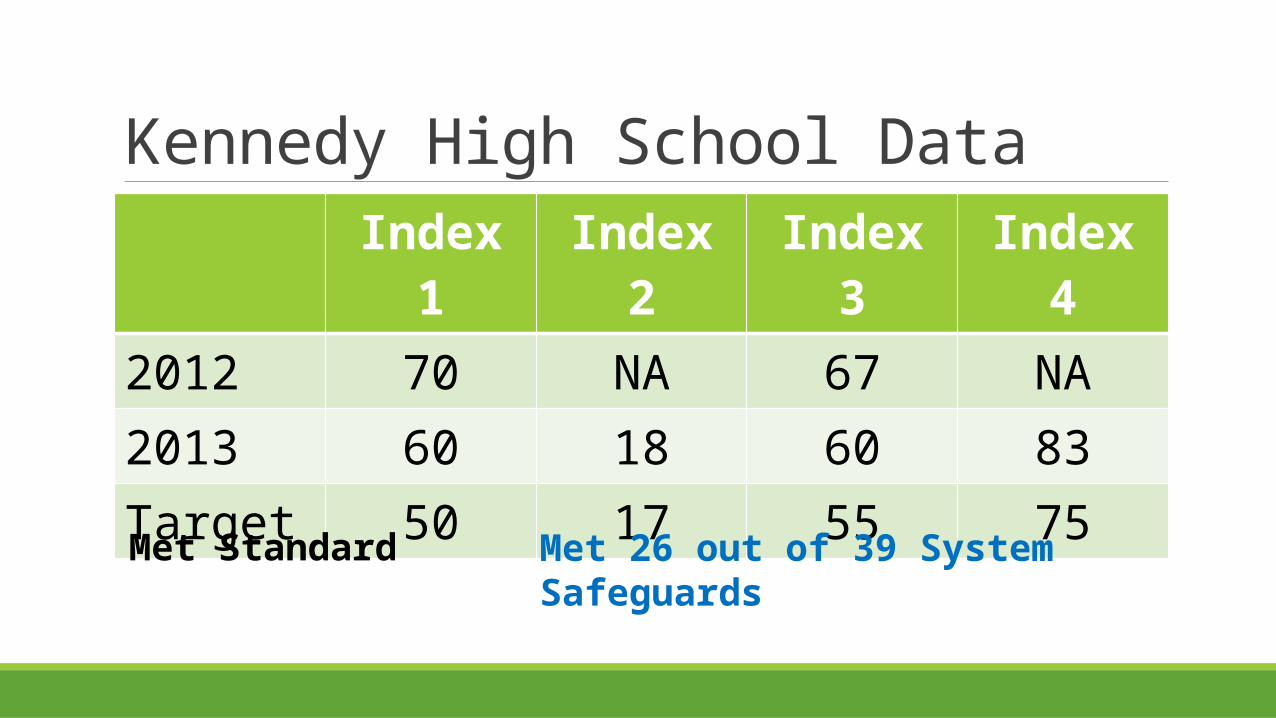
Kennedy High School DataIndex 1 Index 2 Index 3 Index 4
2012 70 NA 67 NA2013 60 18 60 83Target 50 17 55 75
Met Standard Met 26 out of 39 System Safeguards
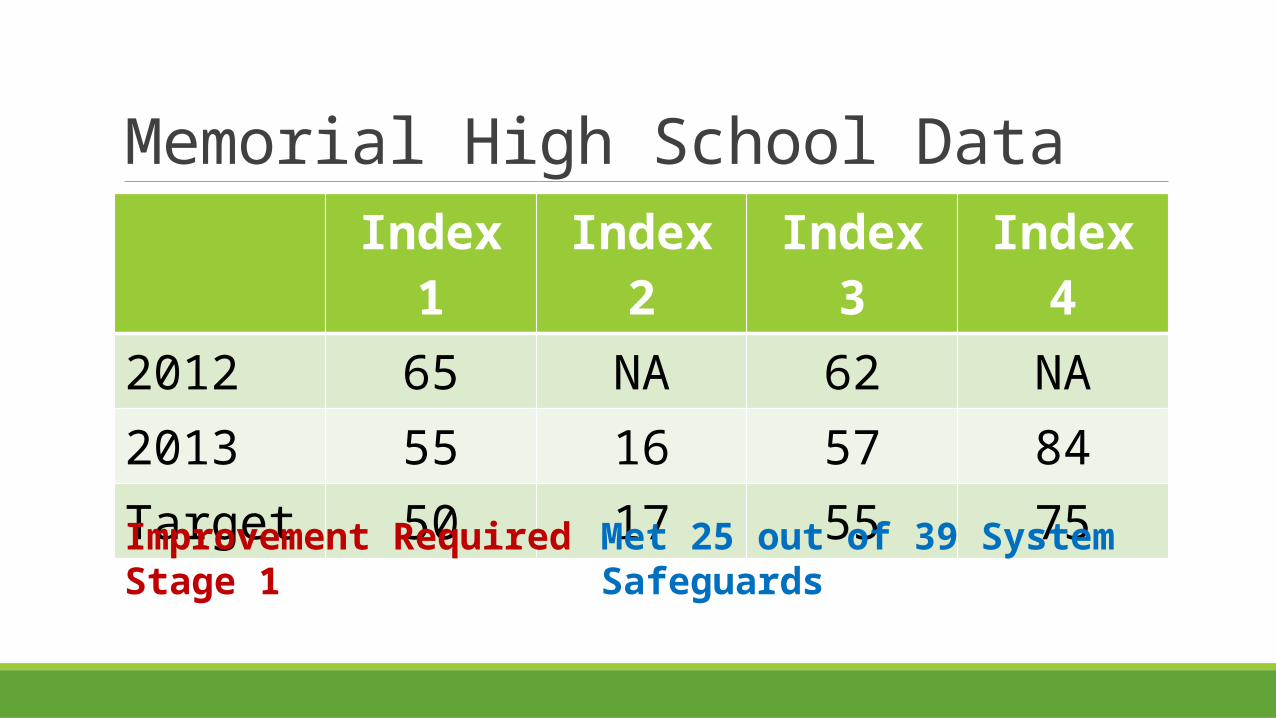
Memorial High School DataIndex 1 Index 2 Index 3 Index 4
2012 65 NA 62 NA2013 55 16 57 84Target 50 17 55 75
Improvement RequiredStage 1
Met 25 out of 39 System Safeguards

High School DataIndex 1 Index 2 Index 3 Index 4
Kennedy 60 18 60 83Memorial 55 16 57 84Target 50 17 55 75

Brentwood DataIndex 1 Index 2 Index 3 Index 4
2012 54 NA 512013 55 30 55Target 50 29 55 75
Met StandardStage 2 Year 2
Met 21 out of 33 System Safeguards
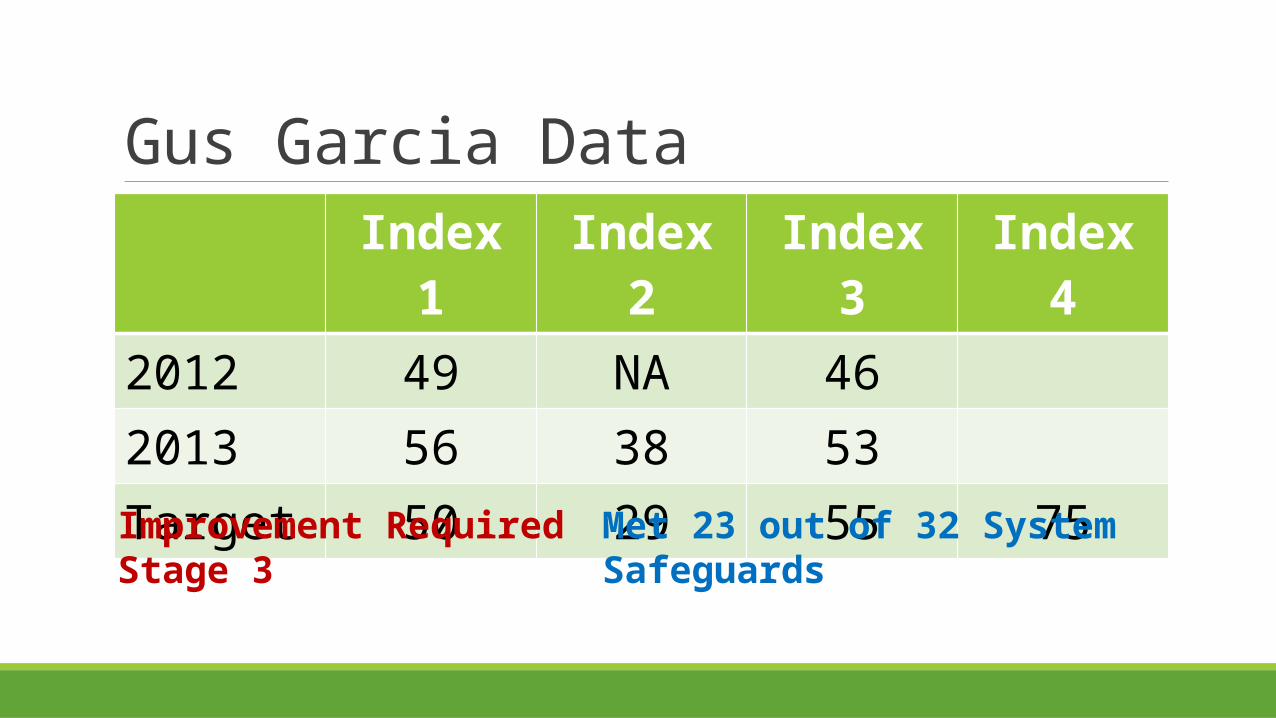
Gus Garcia DataIndex 1 Index 2 Index 3 Index 4
2012 49 NA 462013 56 38 53Target 50 29 55 75
Improvement RequiredStage 3
Met 23 out of 32 System Safeguards
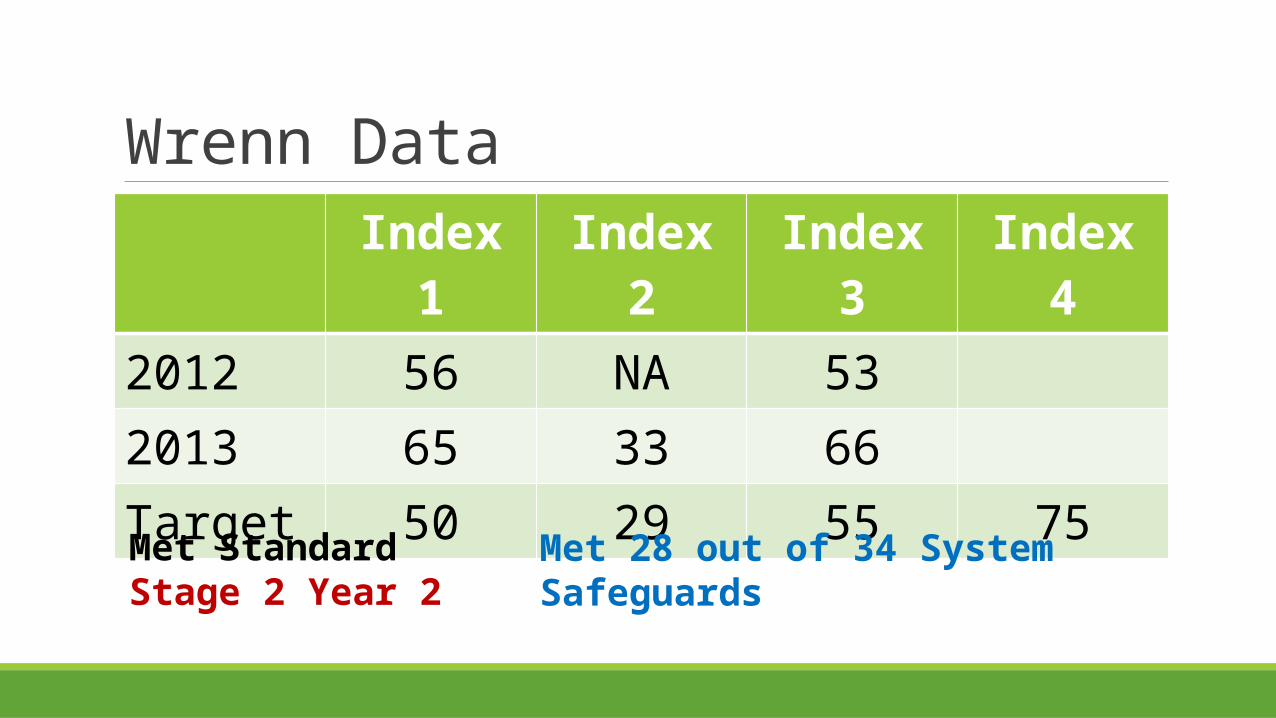
Wrenn DataIndex 1 Index 2 Index 3 Index 4
2012 56 NA 532013 65 33 66Target 50 29 55 75
Met StandardStage 2 Year 2
Met 28 out of 34 System Safeguards
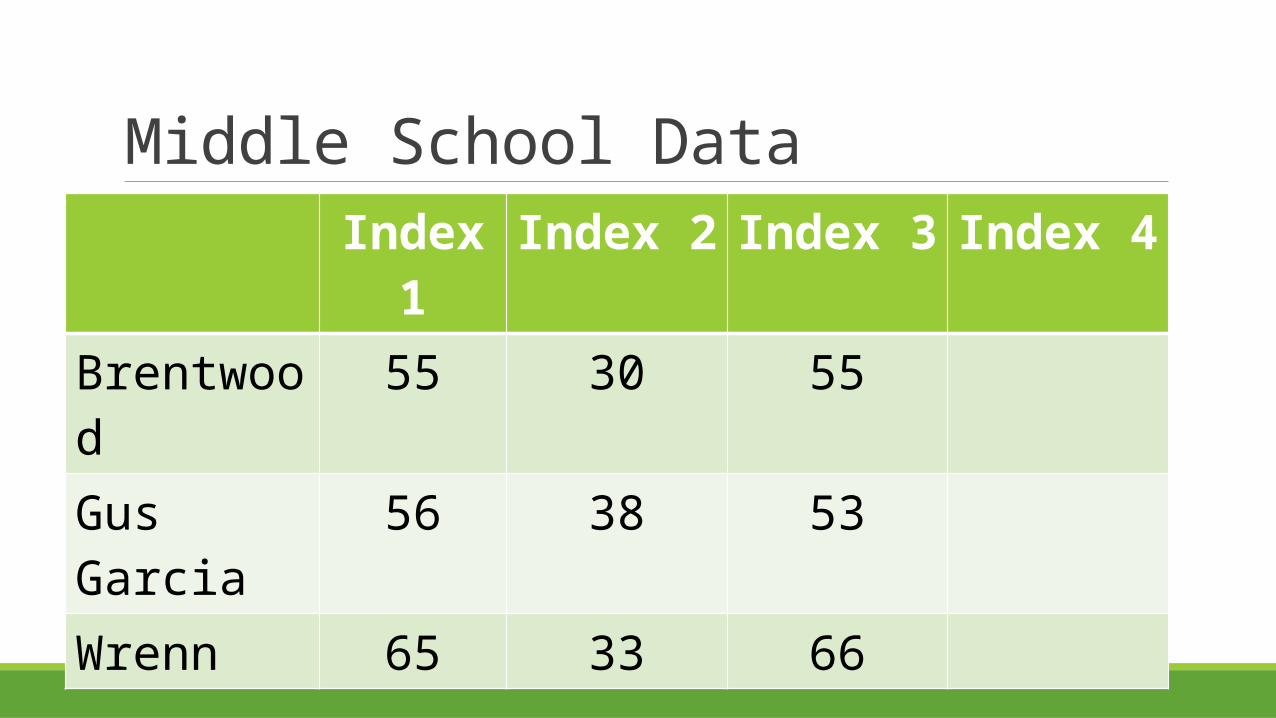
Middle School DataIndex 1 Index 2 Index 3 Index 4
Brentwood 55 30 55Gus Garcia 56 38 53Wrenn 65 33 66
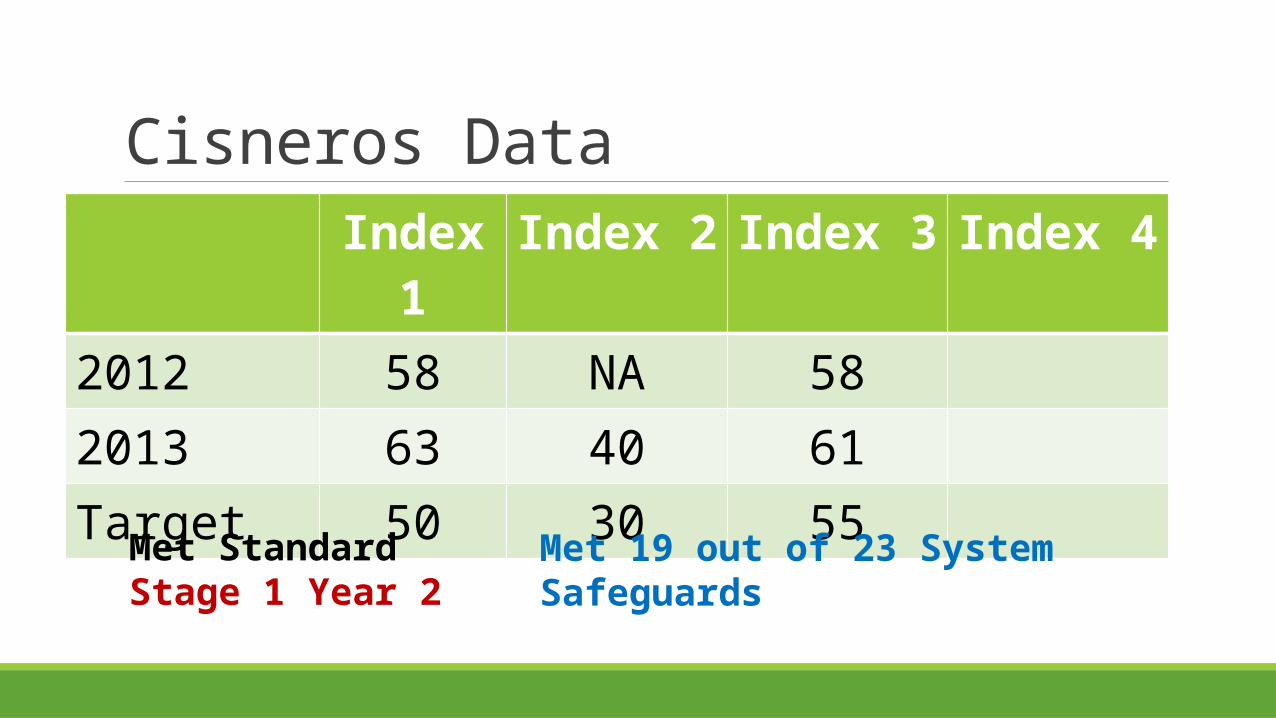
Cisneros DataIndex 1 Index 2 Index 3 Index 4
2012 58 NA 582013 63 40 61Target 50 30 55
Met StandardStage 1 Year 2
Met 19 out of 23 System Safeguards
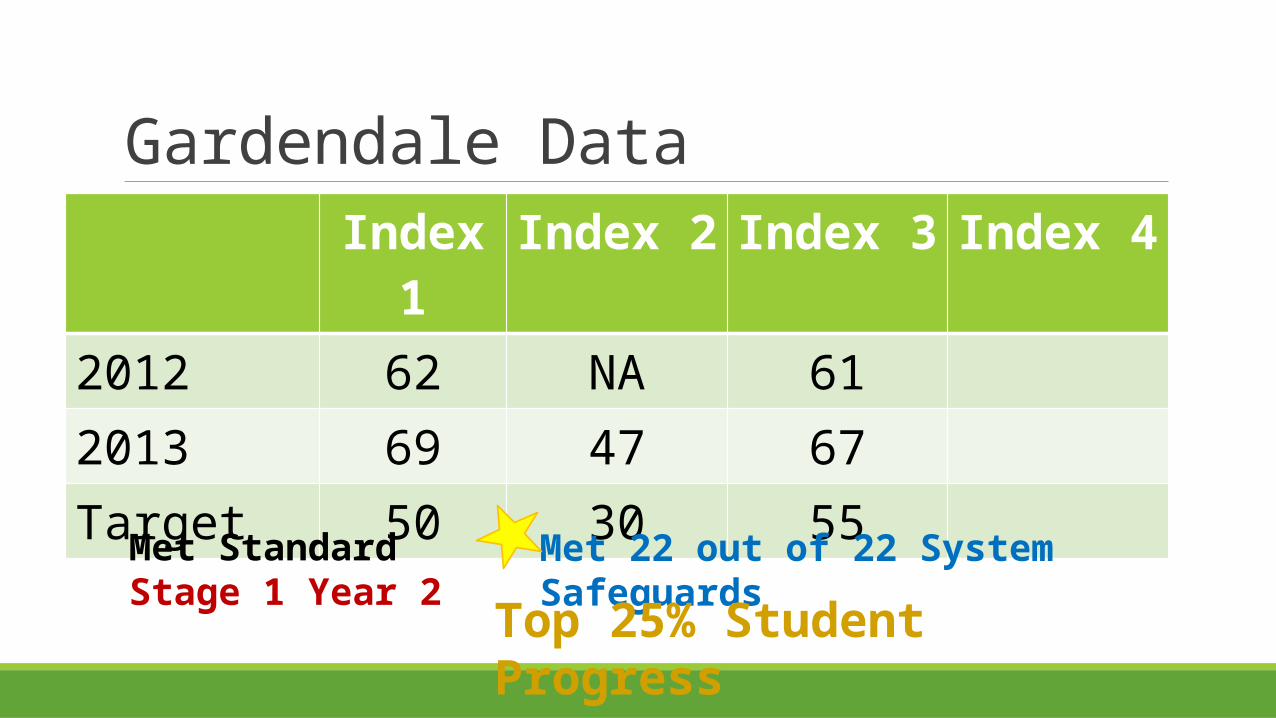
Gardendale DataIndex 1 Index 2 Index 3 Index 4
2012 62 NA 612013 69 47 67Target 50 30 55
Met StandardStage 1 Year 2
Met 22 out of 22 System Safeguards
Top 25% Student Progress
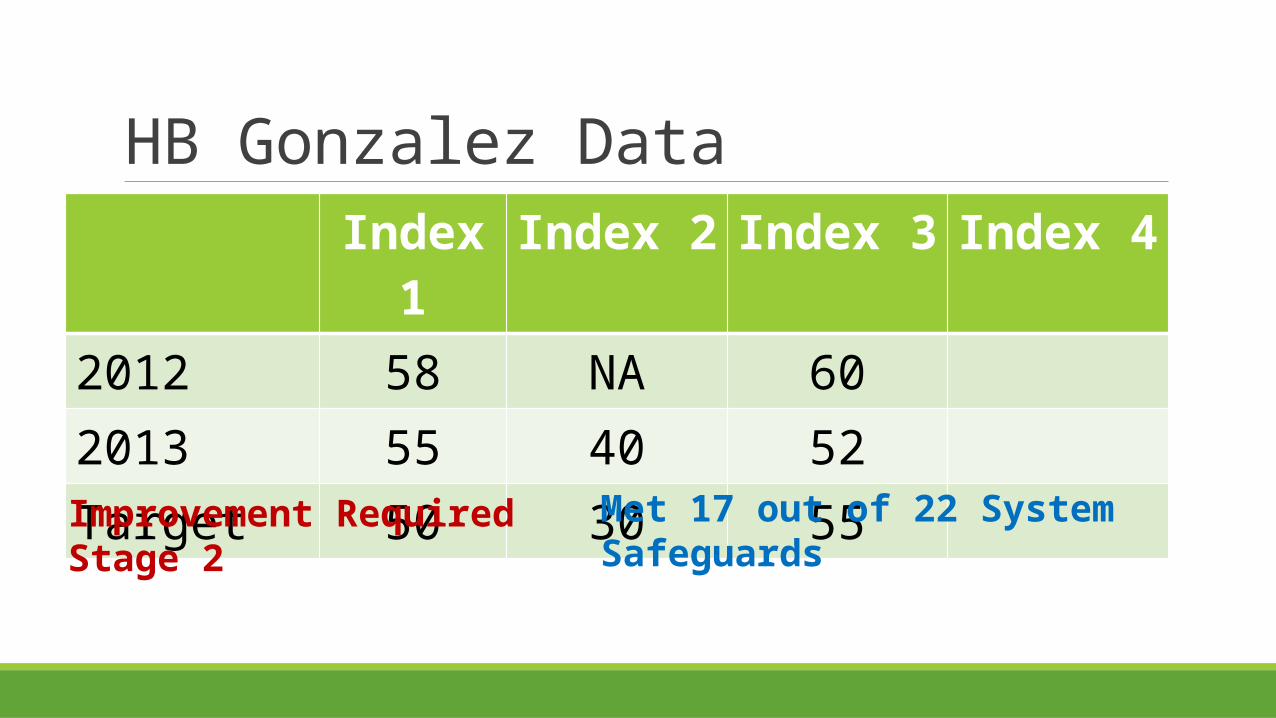
HB Gonzalez DataIndex 1 Index 2 Index 3 Index 4
2012 58 NA 602013 55 40 52Target 50 30 55
Improvement RequiredStage 2
Met 17 out of 22 System Safeguards
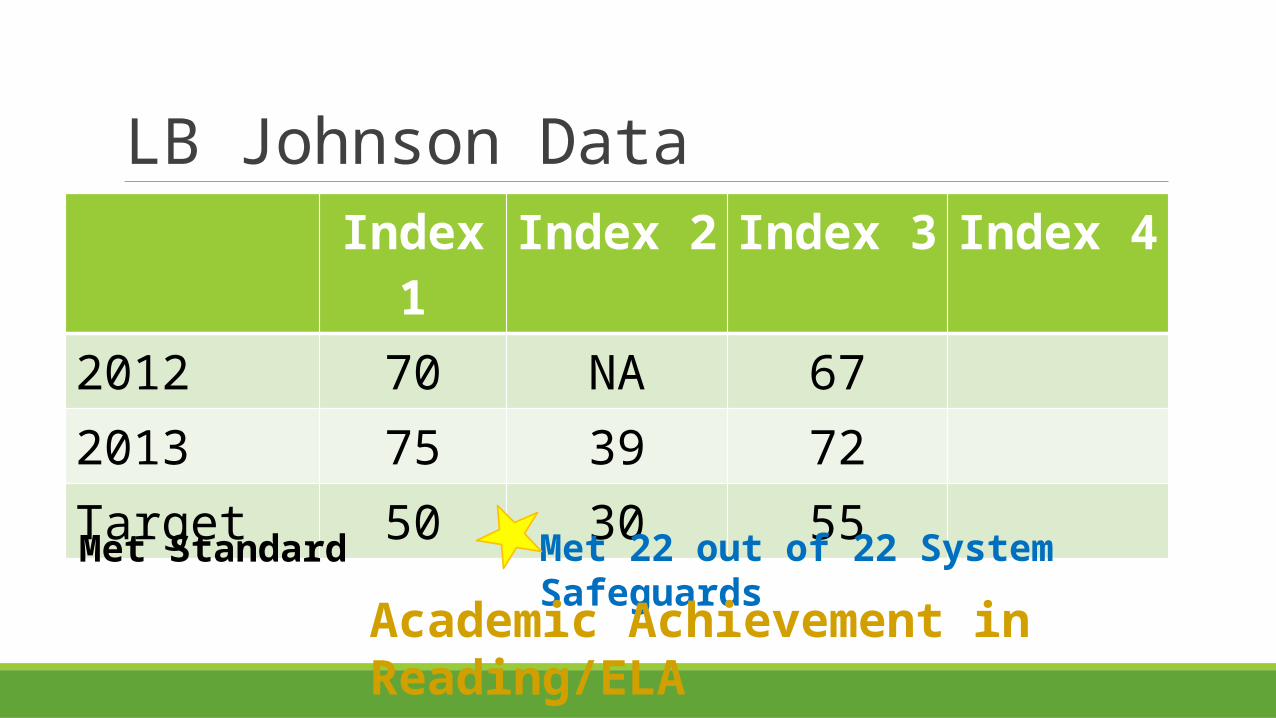
LB Johnson DataIndex 1 Index 2 Index 3 Index 4
2012 70 NA 672013 75 39 72Target 50 30 55
Met Standard Met 22 out of 22 System Safeguards
Academic Achievement in Reading/ELA
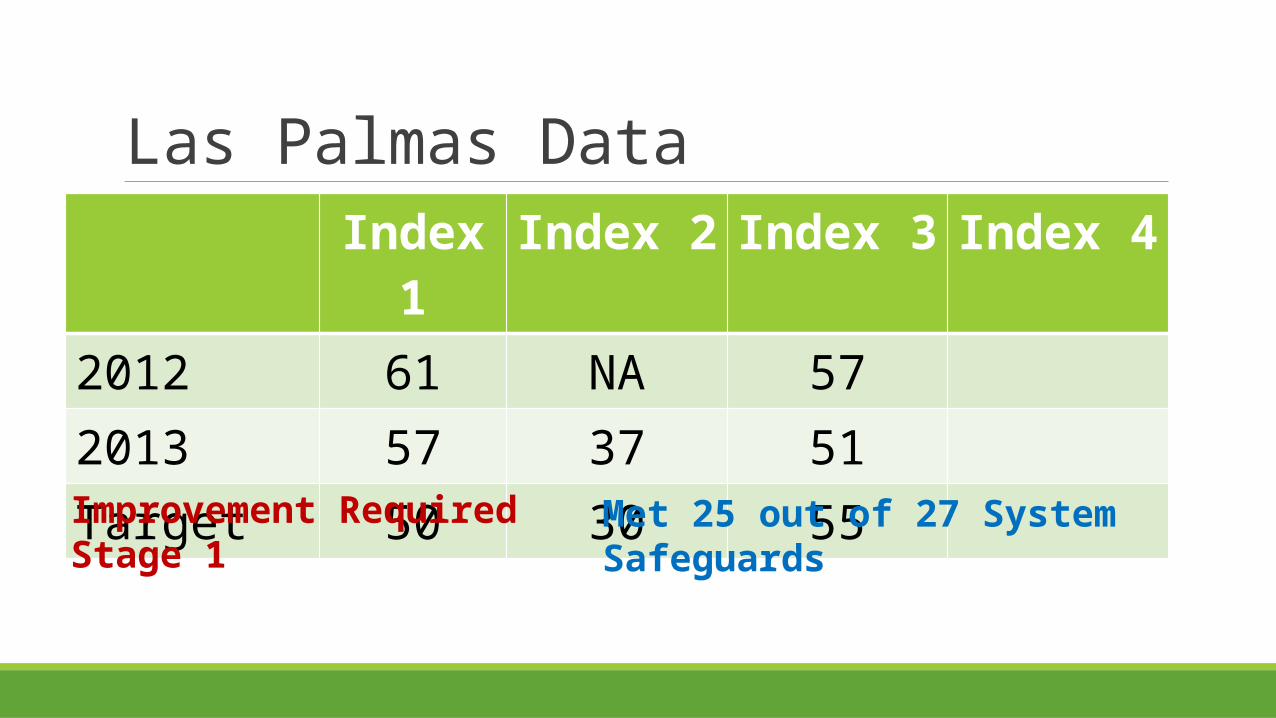
Las Palmas DataIndex 1 Index 2 Index 3 Index 4
2012 61 NA 572013 57 37 51Target 50 30 55
Improvement RequiredStage 1
Met 25 out of 27 System Safeguards
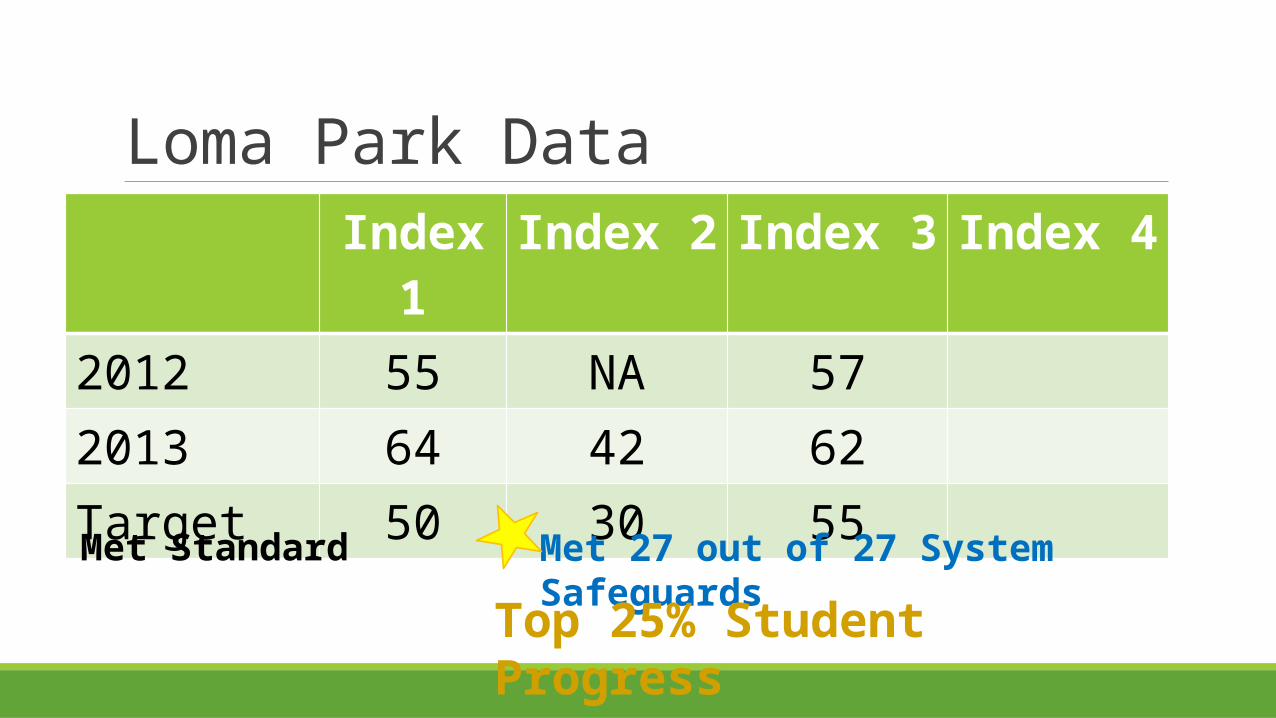
Loma Park DataIndex 1 Index 2 Index 3 Index 4
2012 55 NA 572013 64 42 62Target 50 30 55
Met Standard Met 27 out of 27 System Safeguards
Top 25% Student Progress
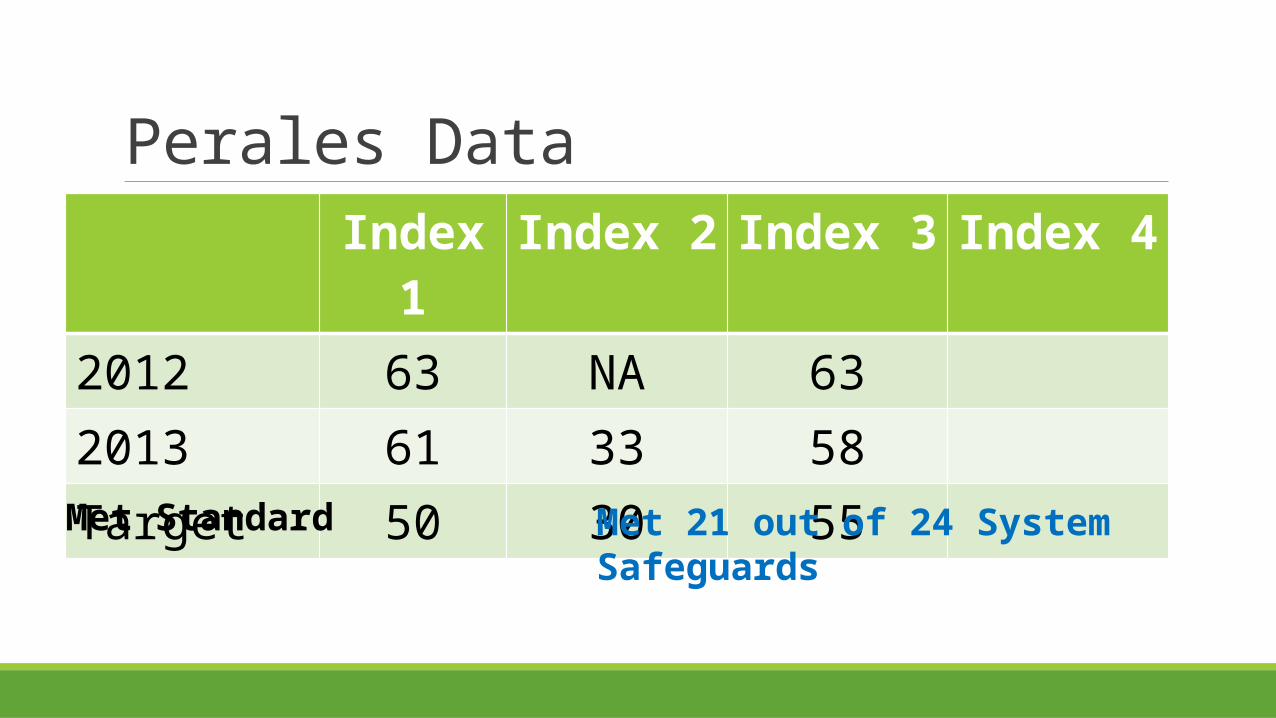
Perales DataIndex 1 Index 2 Index 3 Index 4
2012 63 NA 632013 61 33 58Target 50 30 55
Met Standard Met 21 out of 24 System Safeguards
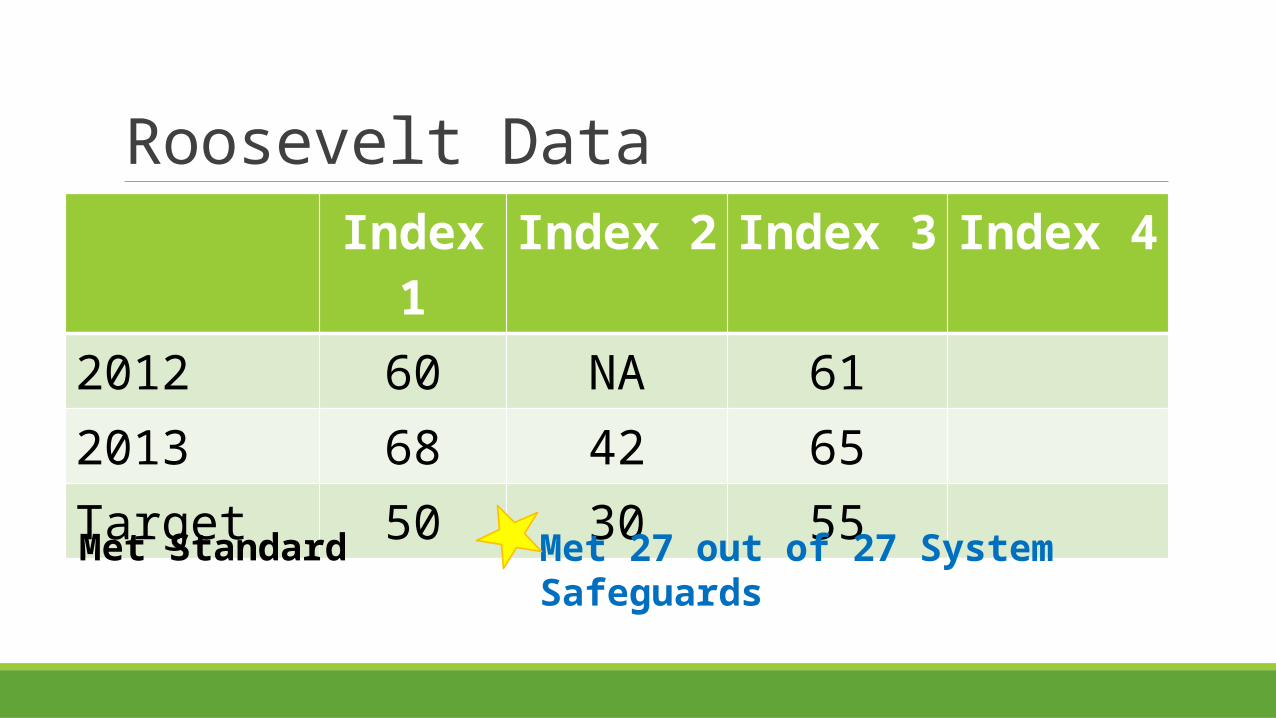
Roosevelt DataIndex 1 Index 2 Index 3 Index 4
2012 60 NA 612013 68 42 65Target 50 30 55
Met Standard Met 27 out of 27 System Safeguards
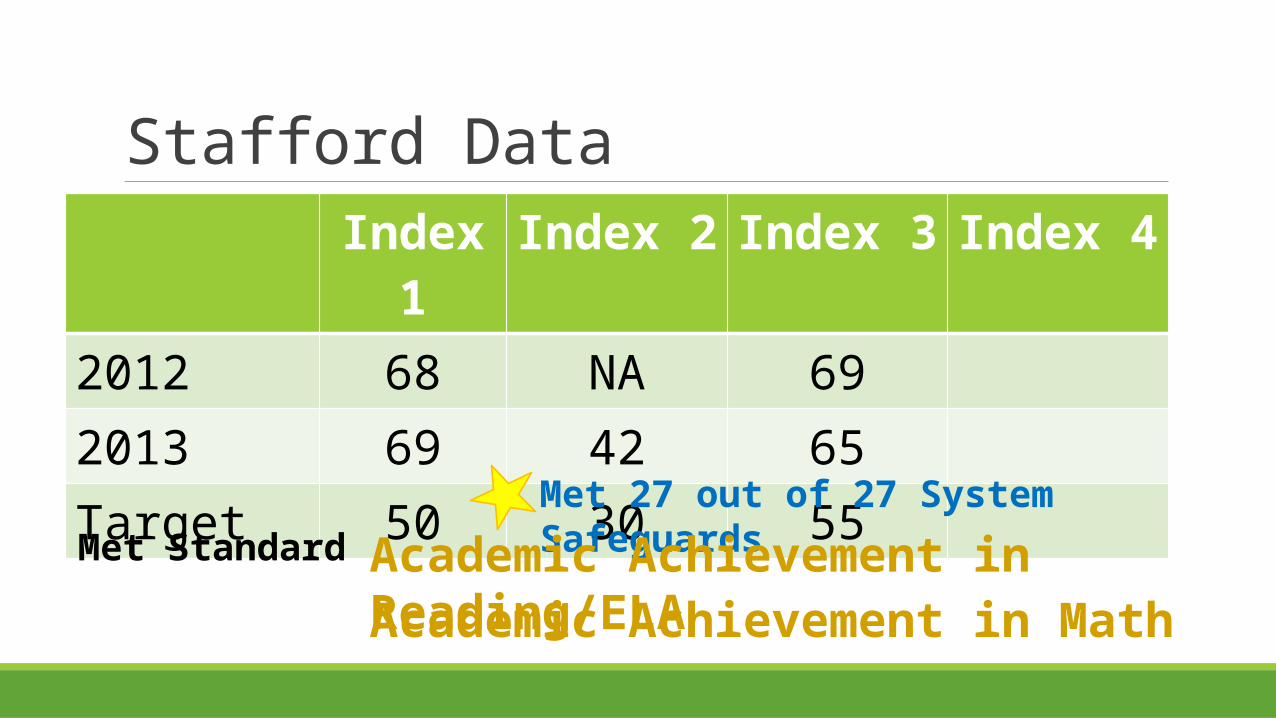
Stafford DataIndex 1 Index 2 Index 3 Index 4
2012 68 NA 692013 69 42 65Target 50 30 55
Met StandardMet 27 out of 27 System Safeguards
Academic Achievement in MathAcademic Achievement in Reading/ELA
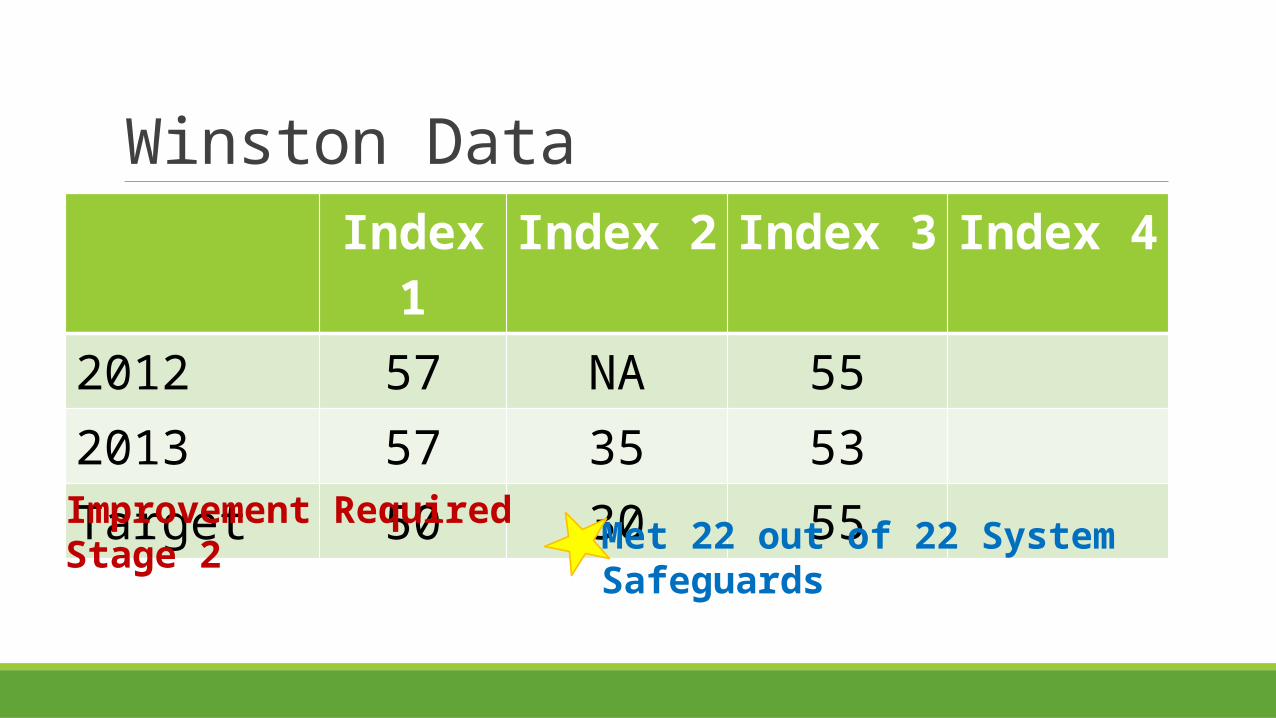
Winston DataIndex 1 Index 2 Index 3 Index 4
2012 57 NA 552013 57 35 53Target 50 30 55
Improvement RequiredStage 2 Met 22 out of 22 System Safeguards
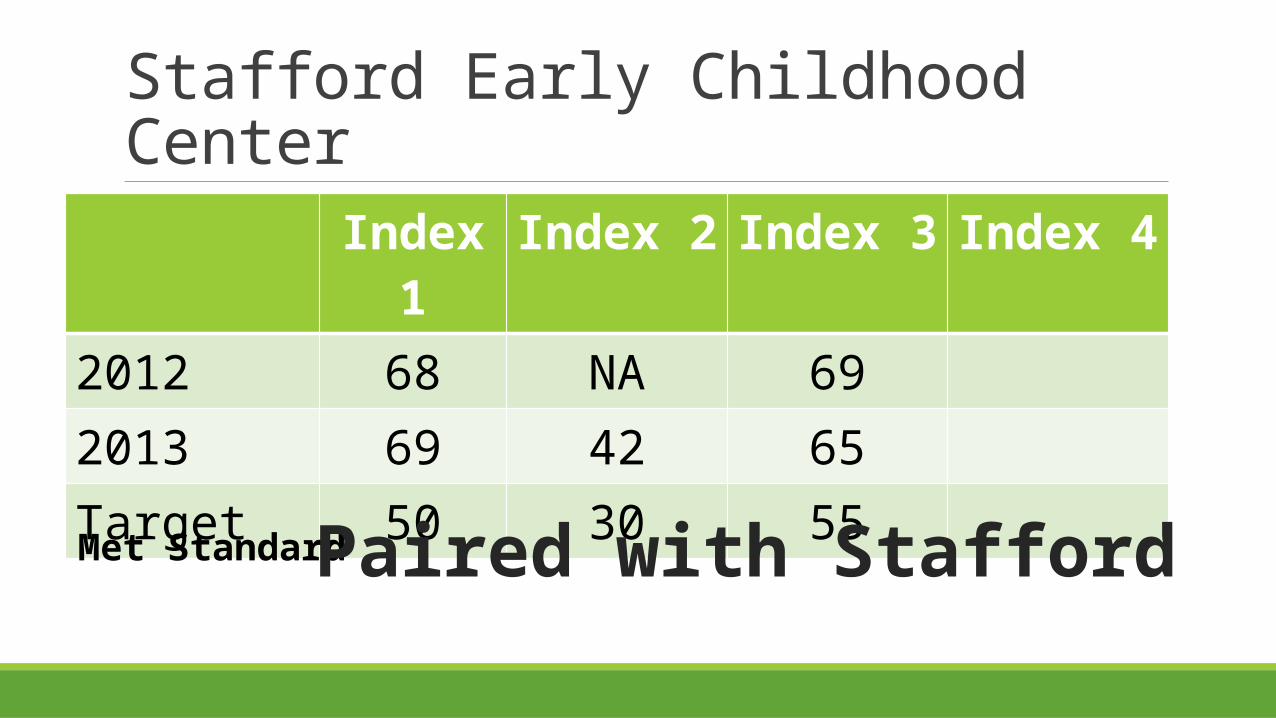
Stafford Early Childhood CenterIndex 1 Index 2 Index 3 Index 4
2012 68 NA 692013 69 42 65Target 50 30 55
Met Standard Paired with Stafford
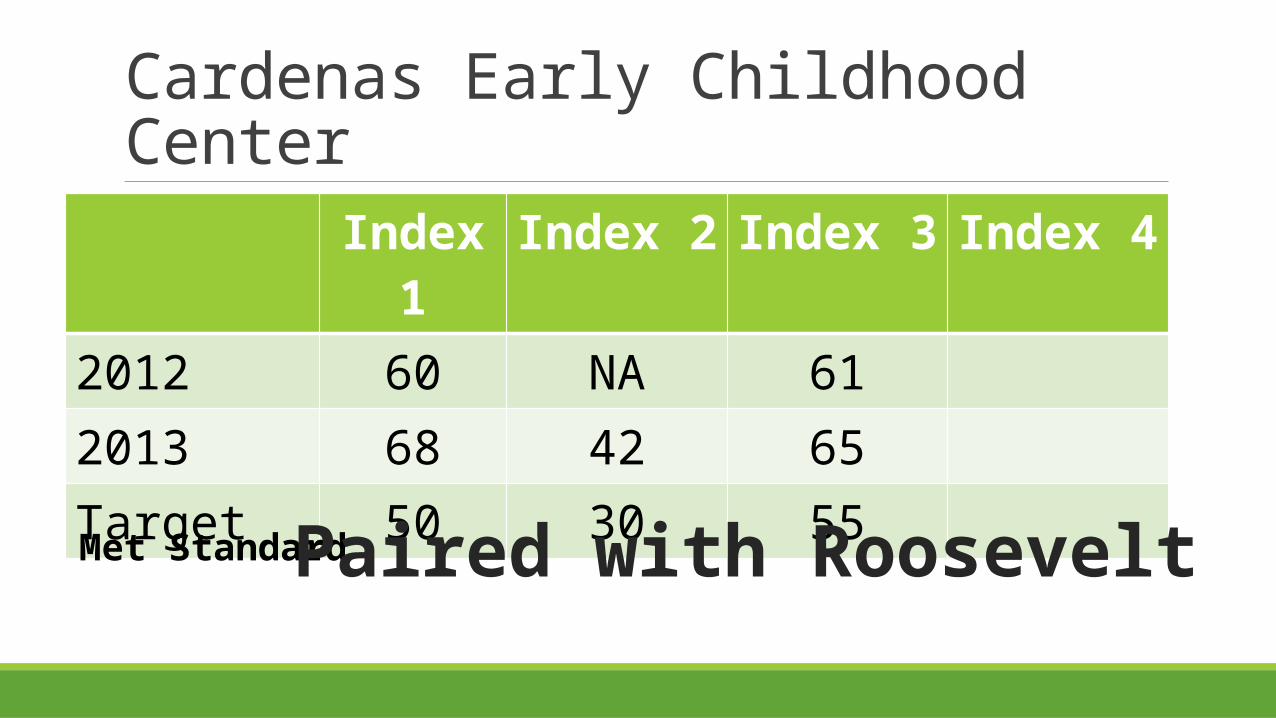
Cardenas Early Childhood Center
Index 1 Index 2 Index 3 Index 42012 60 NA 612013 68 42 65Target 50 30 55
Met Standard Paired with Roosevelt

Burleson Early Childhood CenterIndex 1 Index 2 Index 3 Index 4
2012 61 NA 572013 57 37 51Target 50 30 55
Improvement RequiredStage 1 Paired with Las Palmas
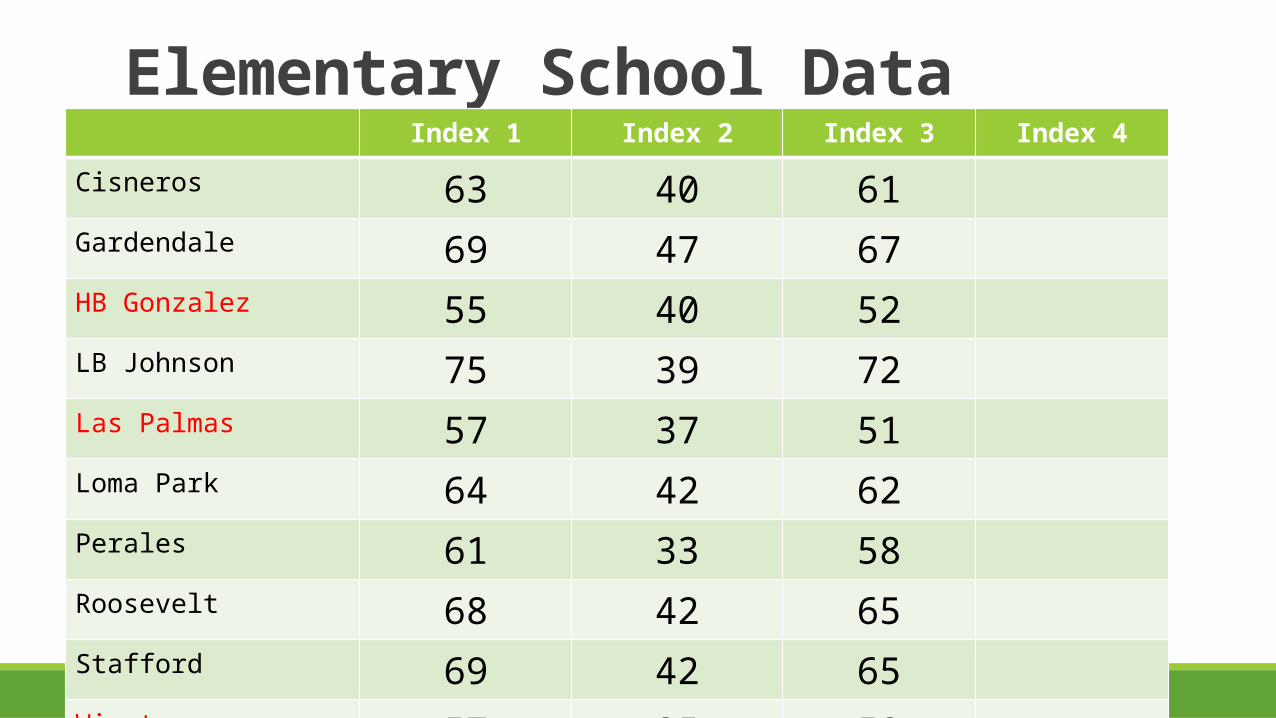
Elementary School DataIndex 1 Index 2 Index 3 Index 4
Cisneros 63 40 61Gardendale 69 47 67HB Gonzalez 55 40 52LB Johnson 75 39 72Las Palmas 57 37 51Loma Park 64 42 62Perales 61 33 58Roosevelt 68 42 65Stafford 69 42 65Winston 57 35 53

Campus Index DifferencesIndex 1 Index 2 Index 3 Index 4
Kennedy 10 1 5 8
Memorial 5 -1 2 9
Brentwood 5 1 0Gus Garcia 6 9 -2Wrenn 15 4 11Cisneros 13 10 6Gardendale 19 17 12HB Gonzalez 5 10 -3LB Johnson 25 9 17Las Palmas 7 7 -4Loma Park 14 12 7Perales 11 3 3Roosevelt 18 12 10Stafford 19 12 10Winston 7 5 -2
SimilaritiesStrengths

State Comparisons Statewide Results 84.2% Met Standard 6.1% Improvement Required
Edgewood Results 66.7% Met Standard 33.3% Improvement Required

Additional Data

Not Done with DataAPSAT/ACTTALAmSTAAR Universal ScreenerTELPASTPRI/Tejas LEEFontas & PinnellmClass
AttendanceSubstitutesDisciplineCBAsEtc. Campus
Analysis Required

Changes for 2013 - 2014 Standards remain at Phase In Level I
Statistical Equating
Last year of Modified Assessments
Index Changes
Work Harder YearWork Effectively Year
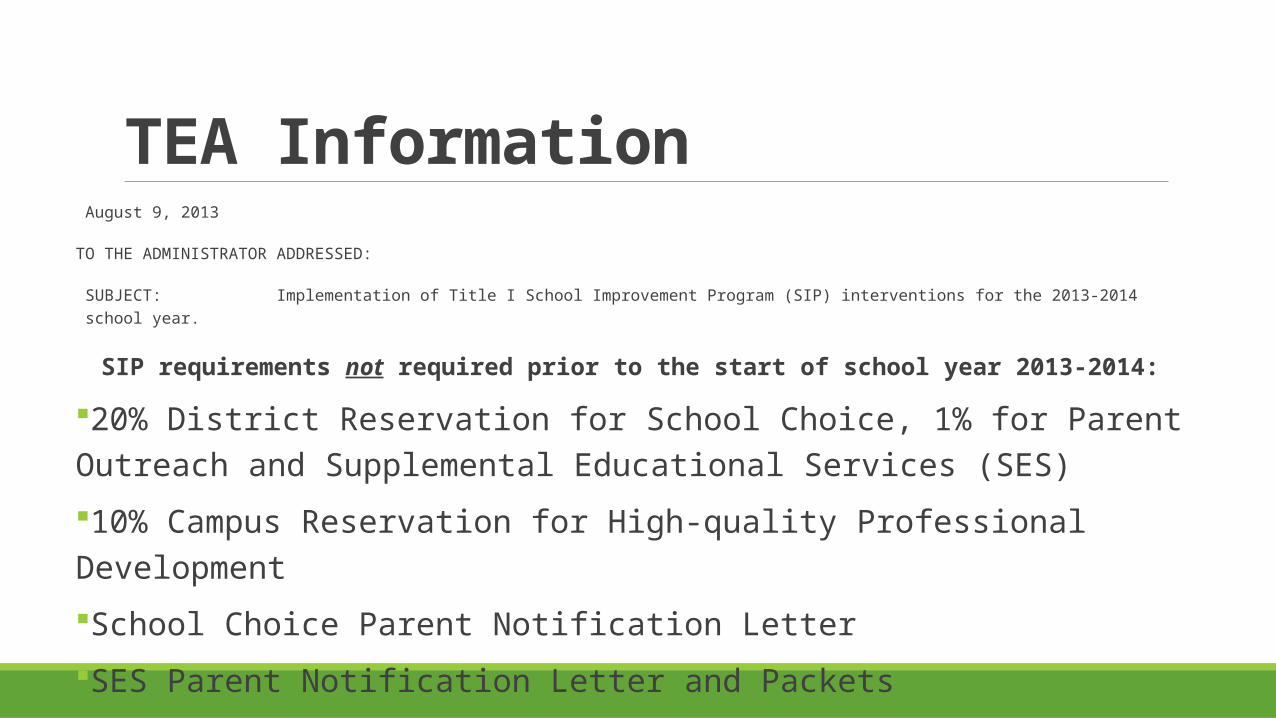
TEA Information August 9, 2013
TO THE ADMINISTRATOR ADDRESSED:
SUBJECT: Implementation of Title I School Improvement Program (SIP) interventions for the 2013-2014 school year.
SIP requirements not required prior to the start of school year 2013-2014:
20% District Reservation for School Choice, 1% for Parent Outreach and Supplemental Educational Services (SES)
10% Campus Reservation for High-quality Professional Development
School Choice Parent Notification Letter
SES Parent Notification Letter and Packets
TEA InformationWhat does it mean?One SystemFederal Program Directors
SynthesisWhy do you need to know the System?Do your teachers need to know it?How will you share it?How is the perception work related to knowing the Accountability System?
Next StepsUse the informationCommunicateCampus Visits
Evaluation
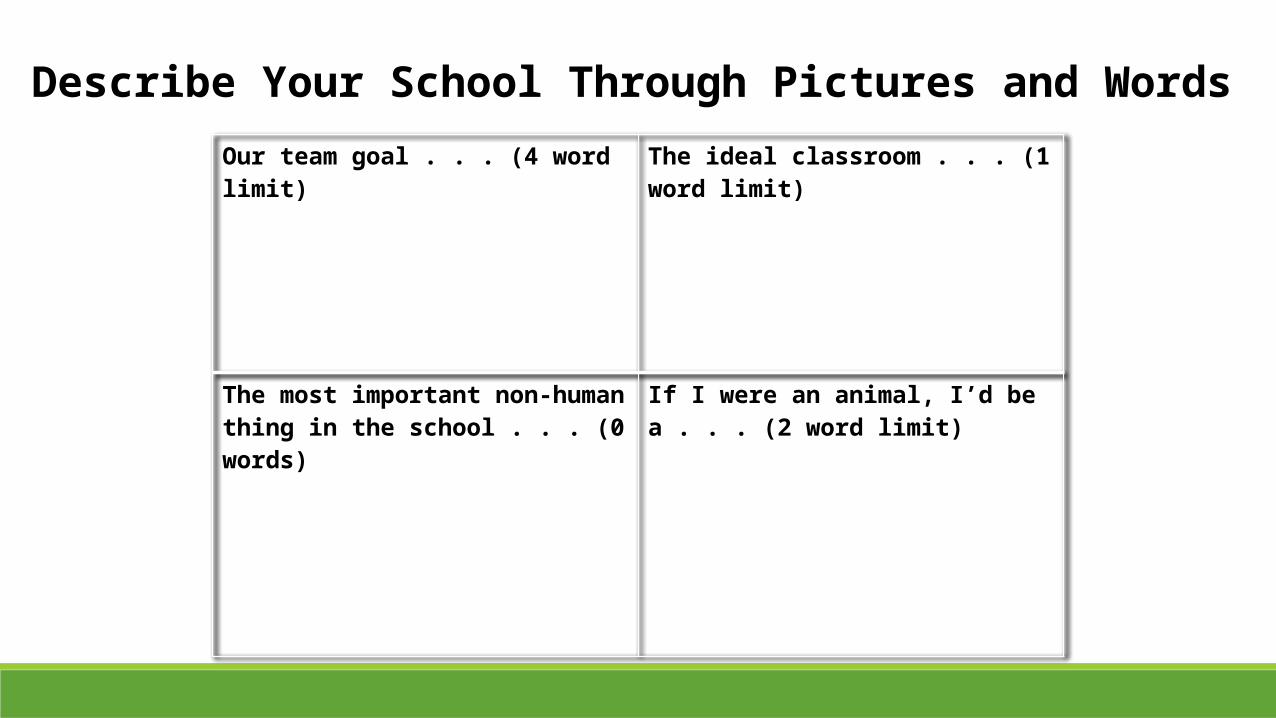
Our team goal . . . (4 word limit) The ideal classroom . . . (1 word limit)
The most important non-human thing in the school . . . (0 words)
If I were an animal, I’d be a . . . (2 word limit)
Describe Your School Through Pictures and Words