edinburgh, 10-15 april 2011 | juerg heldstab infras, beat achermann · pdf filejuerg heldstab...
TRANSCRIPT
Edinburgh, 10-15 April 2011 | Juerg Heldstab INFRAS, Beat Achermann FOEN
Swiss Federal Office for the Environment FOEN
Switzerland’s nitrogen budget
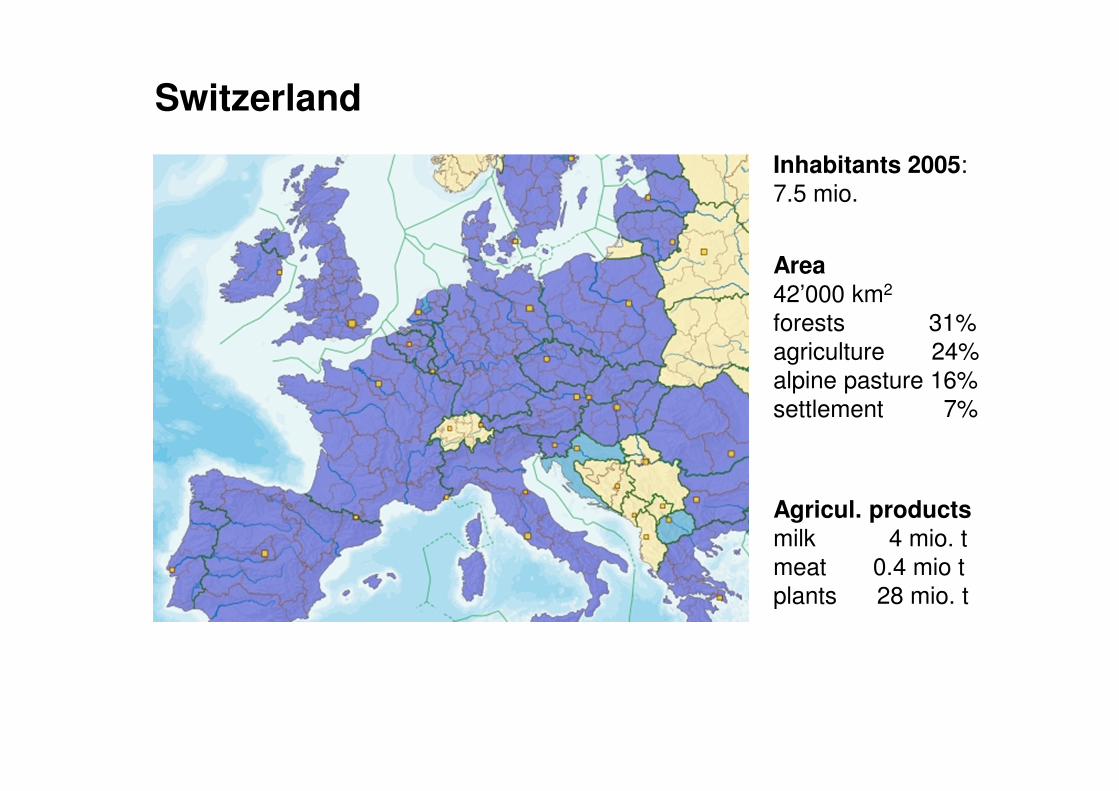
Inhabitants 2005: 7.5 mio.
Area42’000 km2
forests 31% agriculture 24%
alpine pasture 16%
settlement 7%
Agricul. productsmilk 4 mio. t
meat 0.4 mio t
plants 28 mio. t
Switzerland
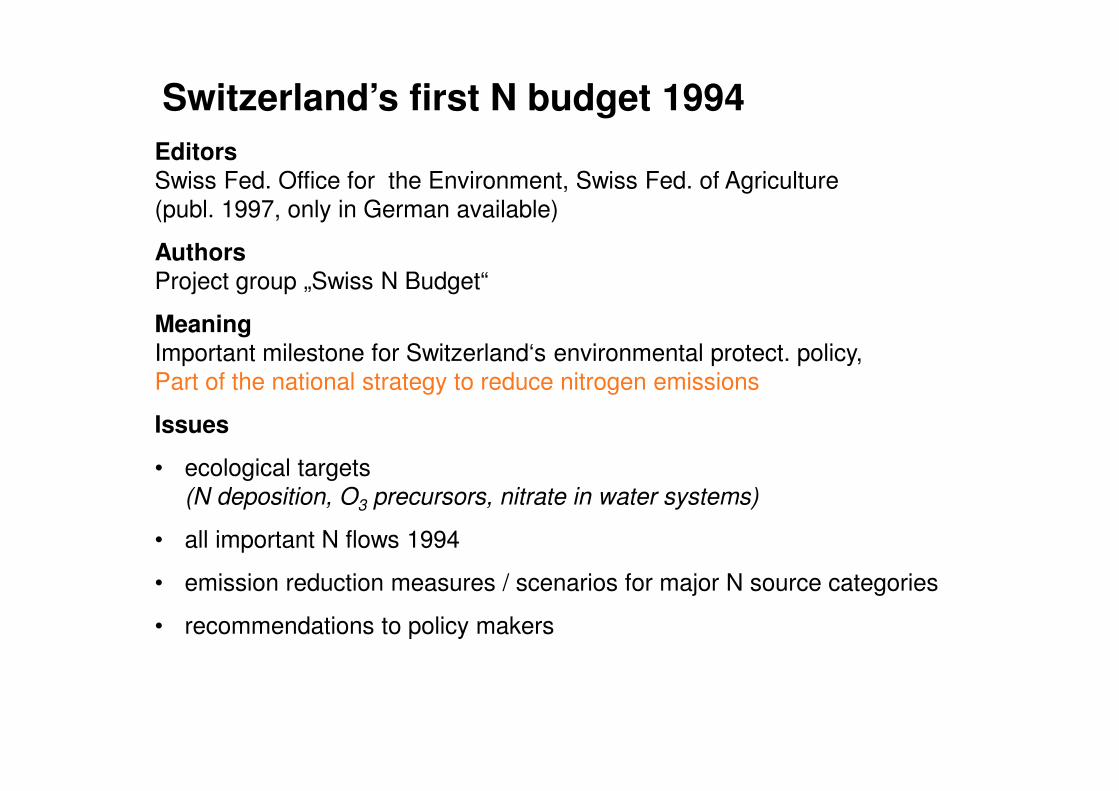
EditorsSwiss Fed. Office for the Environment, Swiss Fed. of Agriculture
(publ. 1997, only in German available)
AuthorsProject group „Swiss N Budget“
MeaningImportant milestone for Switzerland‘s environmental protect. policy,
Part of the national strategy to reduce nitrogen emissions
Issues
• ecological targets
(N deposition, O3 precursors, nitrate in water systems)
• all important N flows 1994
• emission reduction measures / scenarios for major N source categories
• recommendations to policy makers
Switzerland’s first N budget 1994
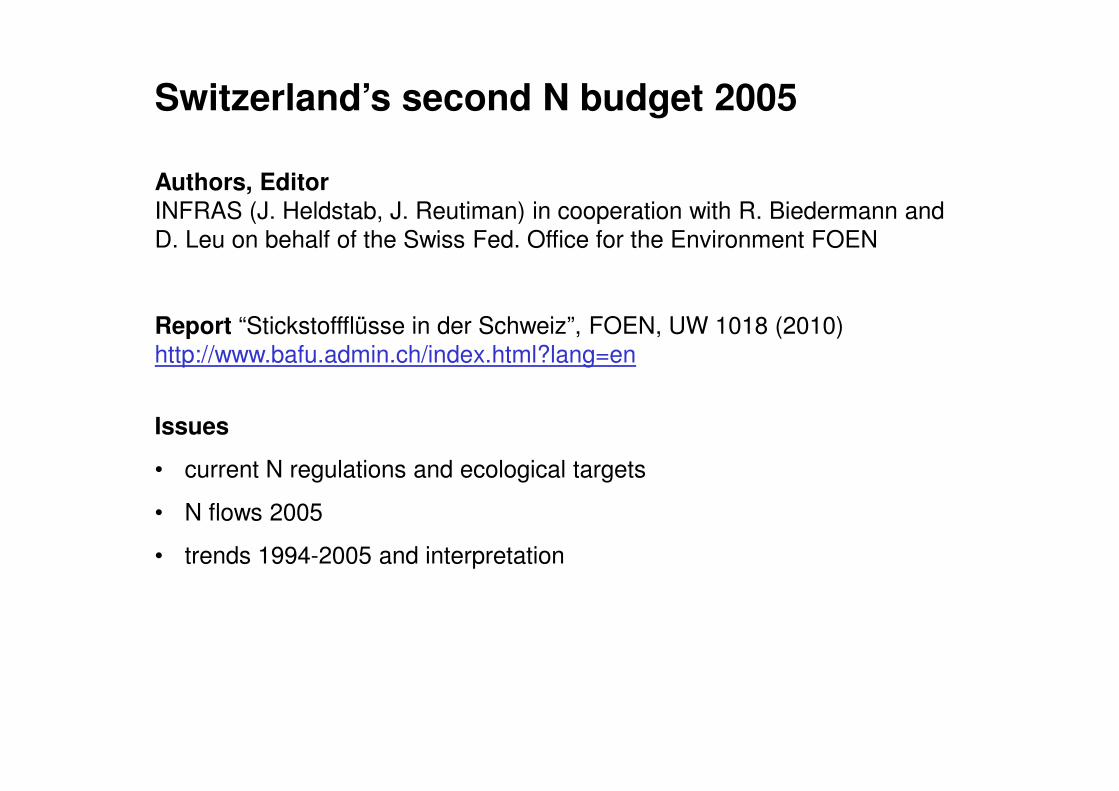
Authors, EditorINFRAS (J. Heldstab, J. Reutiman) in cooperation with R. Biedermann and D. Leu on behalf of the Swiss Fed. Office for the Environment FOEN
Report “Stickstoffflüsse in der Schweiz”, FOEN, UW 1018 (2010)http://www.bafu.admin.ch/index.html?lang=en
Issues
• current N regulations and ecological targets
• N flows 2005
• trends 1994-2005 and interpretation
Switzerland’s second N budget 2005
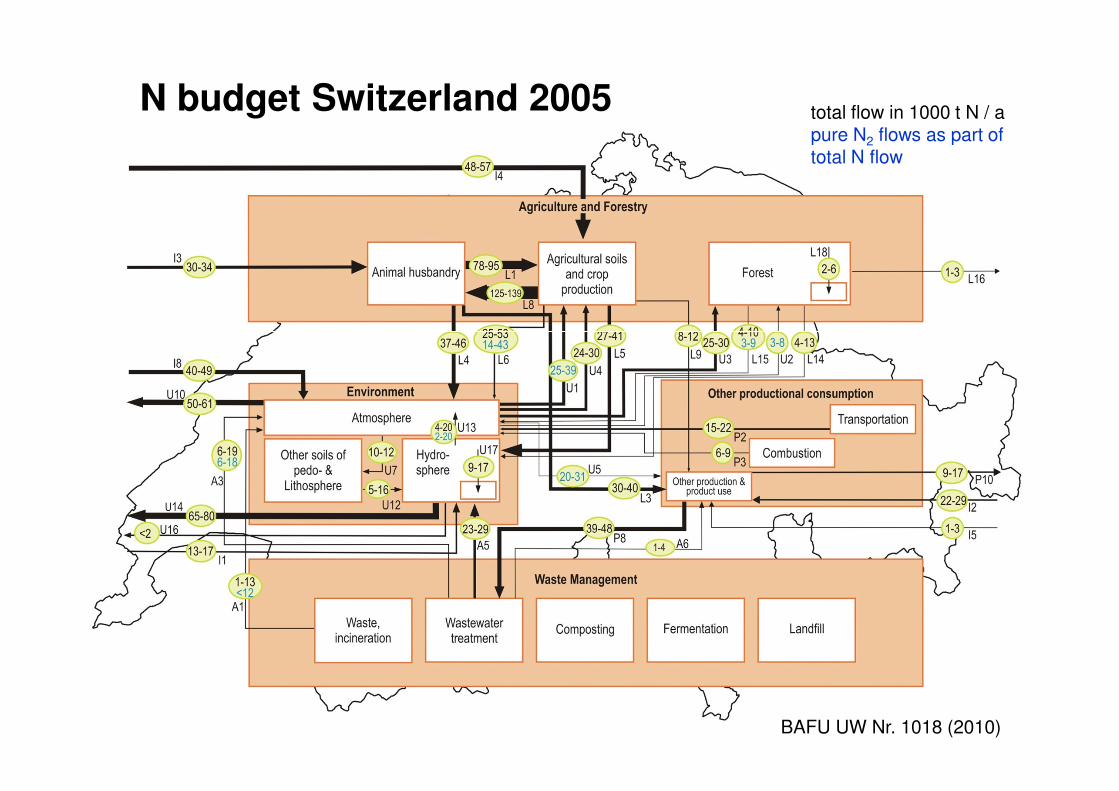
N budget Switzerland 2005 total flow in 1000 t N / apure N2 flows as part of total N flow
BAFU UW Nr. 1018 (2010)
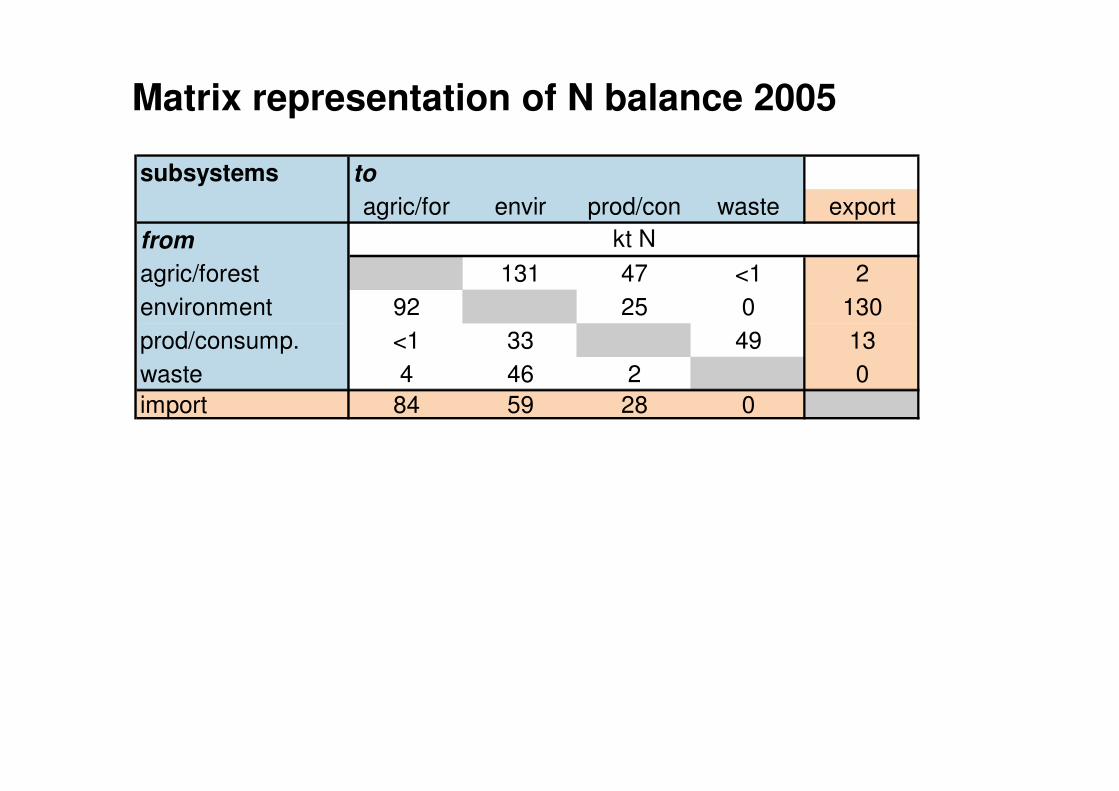
Matrix representation of N balance 2005
subsystems to
agric/for envir prod/con waste export
from
agric/forest 131 47 <1 2
environment 92 25 0 130
prod/consump. <1 33 49 13
waste 4 46 2 0
import 84 59 28 0
kt N
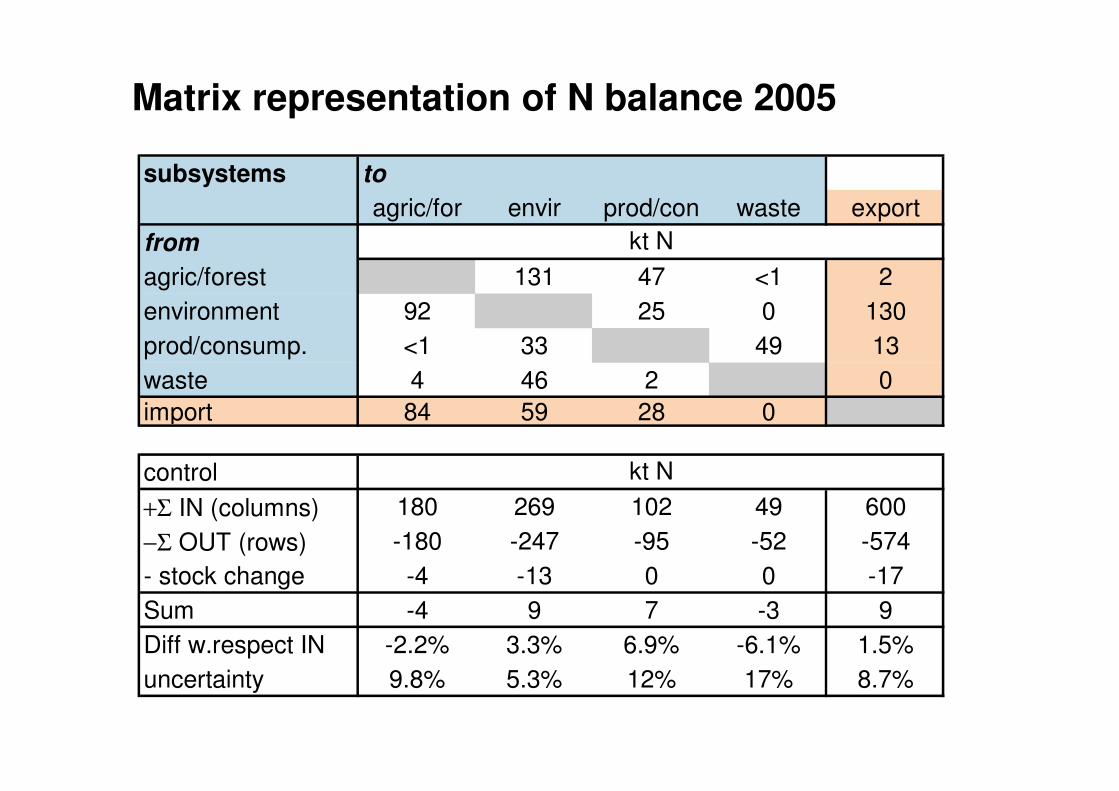
Matrix representation of N balance 2005
subsystems to
agric/for envir prod/con waste export
from
agric/forest 131 47 <1 2
environment 92 25 0 130
prod/consump. <1 33 49 13
waste 4 46 2 0
import 84 59 28 0
control
+Σ IN (columns) 180 269 102 49 600
−Σ OUT (rows) -180 -247 -95 -52 -574
- stock change -4 -13 0 0 -17
Sum -4 9 7 -3 9
Diff w.respect IN -2.2% 3.3% 6.9% -6.1% 1.5%
uncertainty 9.8% 5.3% 12% 17% 8.7%
kt N
kt N
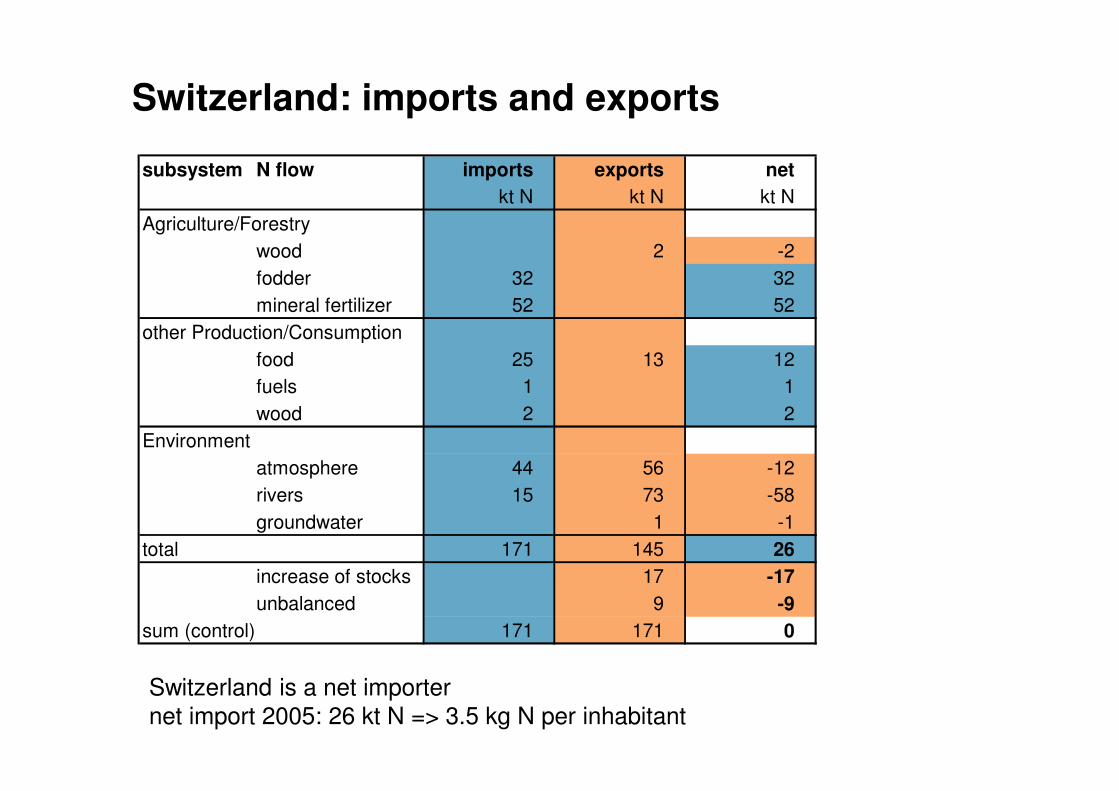
Switzerland: imports and exports
Switzerland is a net importernet import 2005: 26 kt N => 3.5 kg N per inhabitant
subsystem N flow imports exports net
kt N kt N kt N
Agriculture/Forestry
wood 2 -2
fodder 32 32
mineral fertilizer 52 52
other Production/Consumption
food 25 13 12
fuels 1 1
wood 2 2
Environment
atmosphere 44 56 -12
rivers 15 73 -58
groundwater 1 -1
total 171 145 26
increase of stocks 17 -17
unbalanced 9 -9
sum (control) 171 171 0
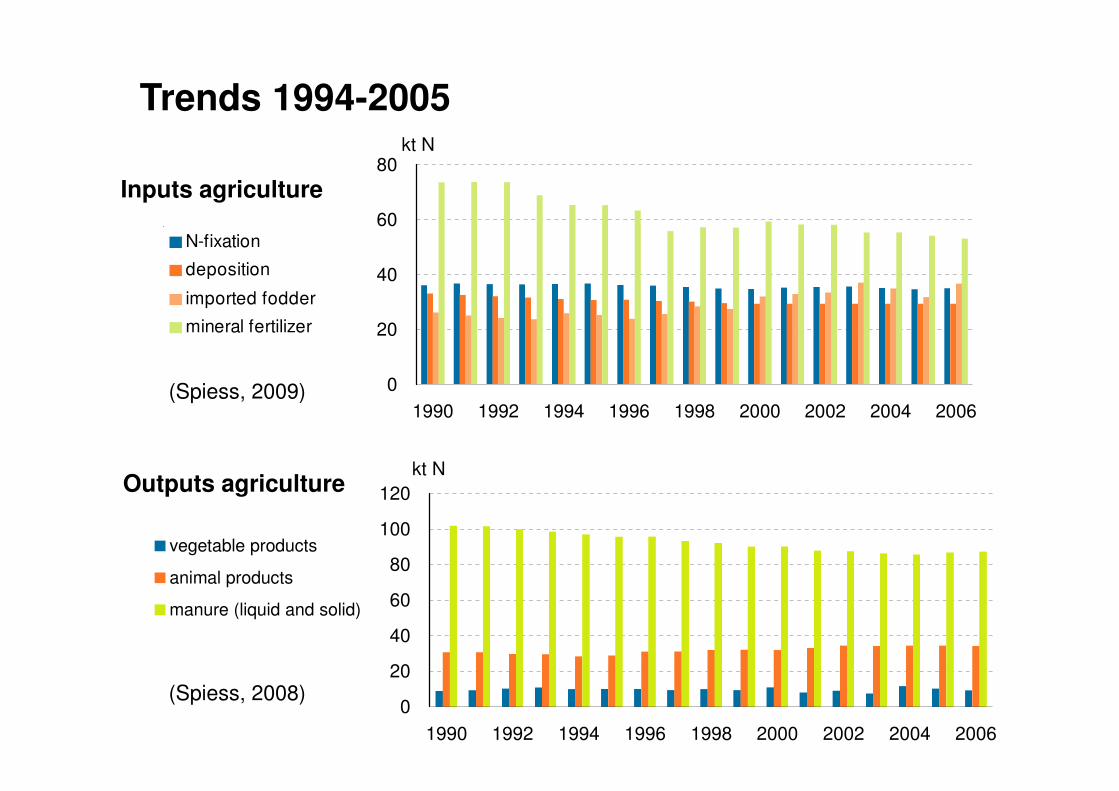
Trends 1994-2005
0
20
40
60
80
1990 1992 1994 1996 1998 2000 2002 2004 2006
kt N
0
20
40
60
80
100
120
1990 1992 1994 1996 1998 2000 2002 2004 2006
kt N
020406080
19
90
20
03
N-fixation
deposition
imported fodder
mineral fertilizer
kt N
vegetable products
animal products
manure (liquid and solid)
Inputs agriculture
Outputs agriculture
(Spiess, 2009)
(Spiess, 2008)
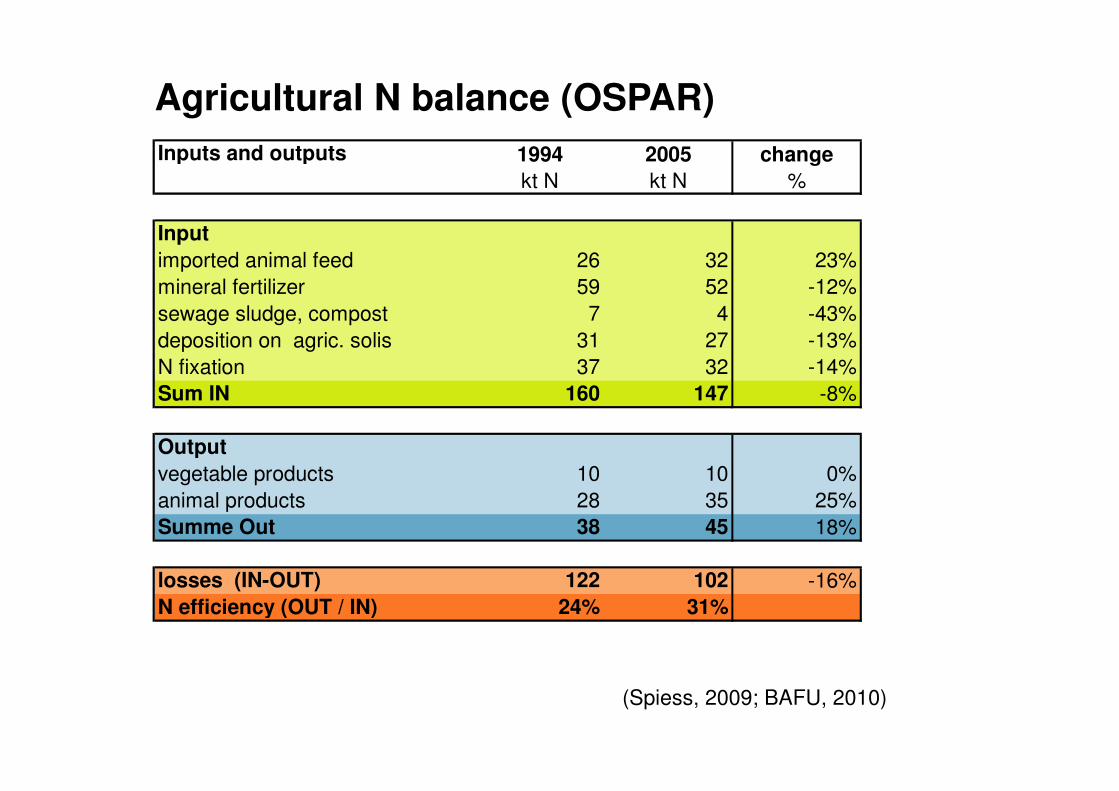
Agricultural N balance (OSPAR)
Inputs and outputs 1994 2005 change
kt N kt N %
Input
imported animal feed 26 32 23%
mineral fertilizer 59 52 -12%
sewage sludge, compost 7 4 -43%
deposition on agric. solis 31 27 -13%
N fixation 37 32 -14%
Sum IN 160 147 -8%
Output
vegetable products 10 10 0%
animal products 28 35 25%
Summe Out 38 45 18%
losses (IN-OUT) 122 102 -16%
N efficiency (OUT / IN) 24% 31%
(Spiess, 2009; BAFU, 2010)
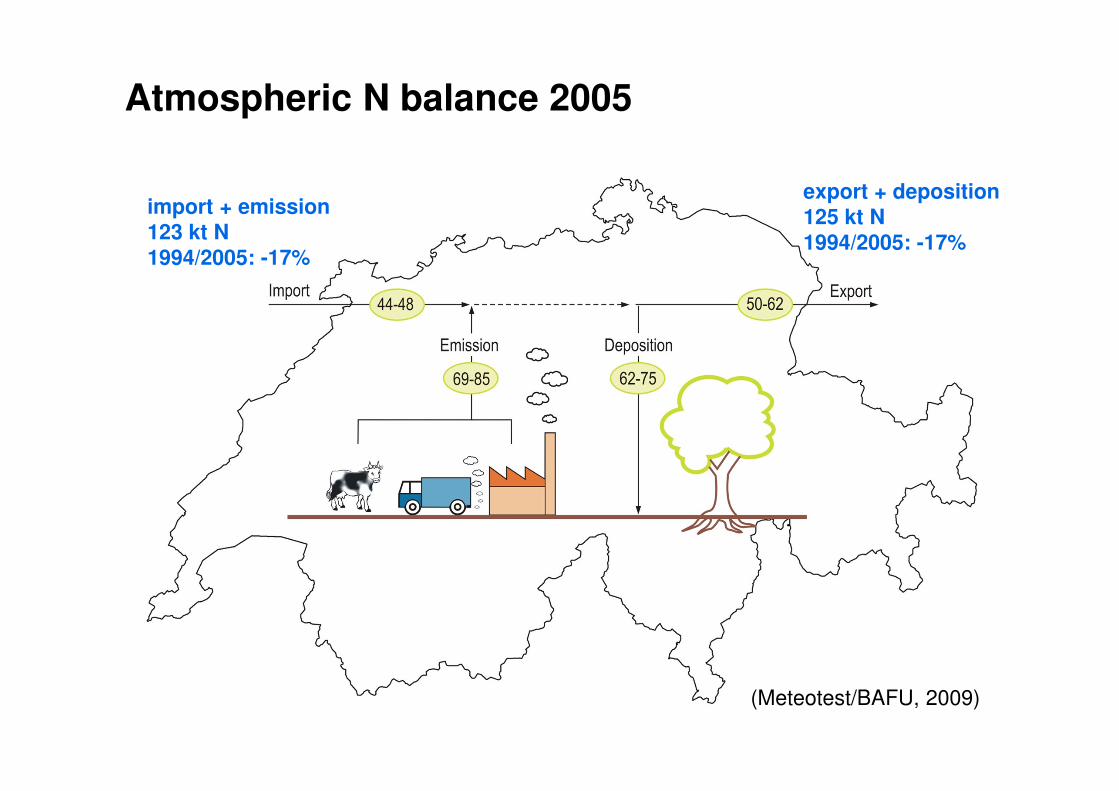
Atmospheric N balance 2005
import + emission123 kt N1994/2005: -17%
export + deposition125 kt N1994/2005: -17%
(Meteotest/BAFU, 2009)
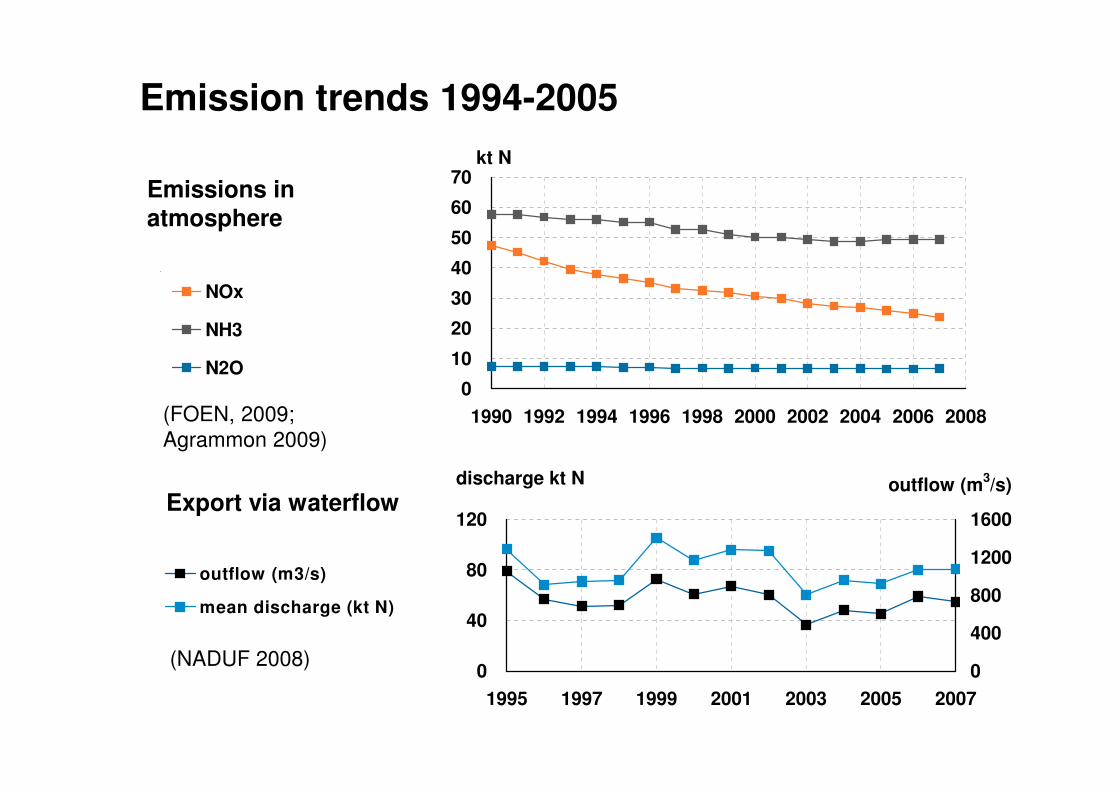
Emission trends 1994-2005
0
10
20
30
40
50
60
70
1990 1992 1994 1996 1998 2000 2002 2004 2006 2008
kt N
Emissions in atmosphere
00
0
19
90
NOx
NH3
N2O
Export via waterflow
04080120
19
95
20
05outflow (m3/s)
mean discharge (kt N)
discharge kt N
0
40
80
120
1995 1997 1999 2001 2003 2005 2007
0
400
800
1200
1600
outflow (m3/s)
(FOEN, 2009;
Agrammon 2009)
(NADUF 2008)
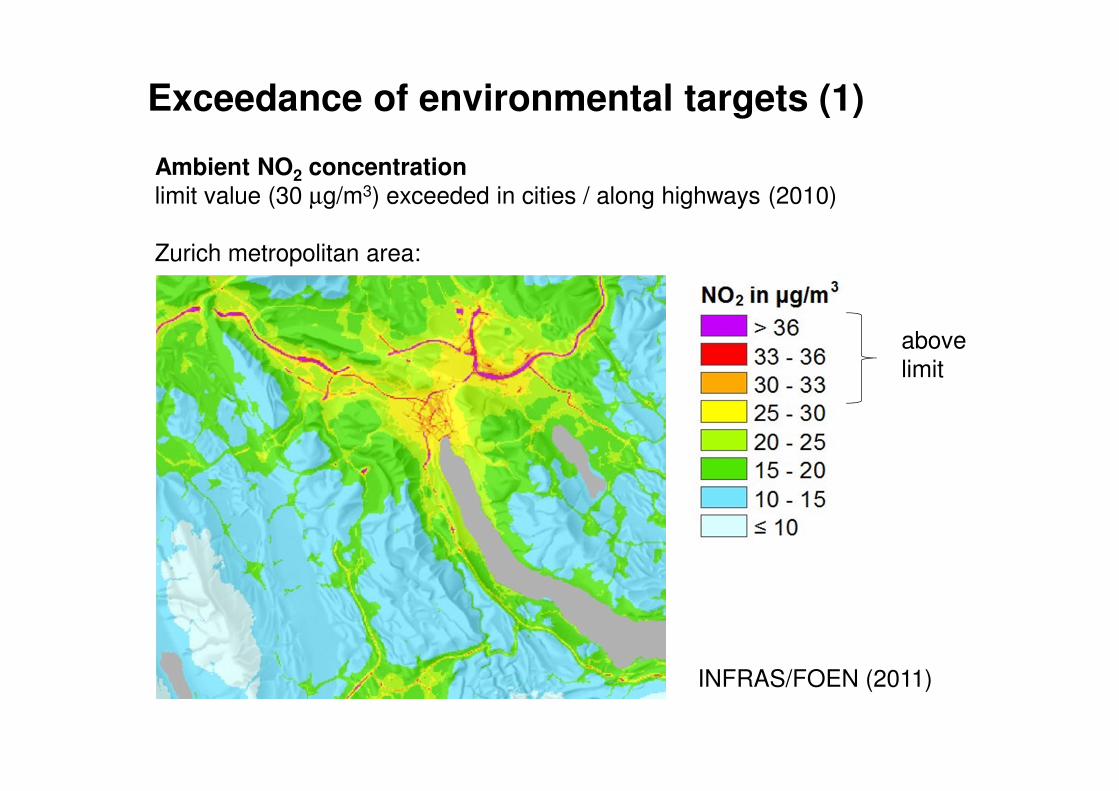
Exceedance of environmental targets (1)
Ambient NO2 concentrationlimit value (30 µg/m3) exceeded in cities / along highways (2010)
Zurich metropolitan area:
INFRAS/FOEN (2011)
above
limit
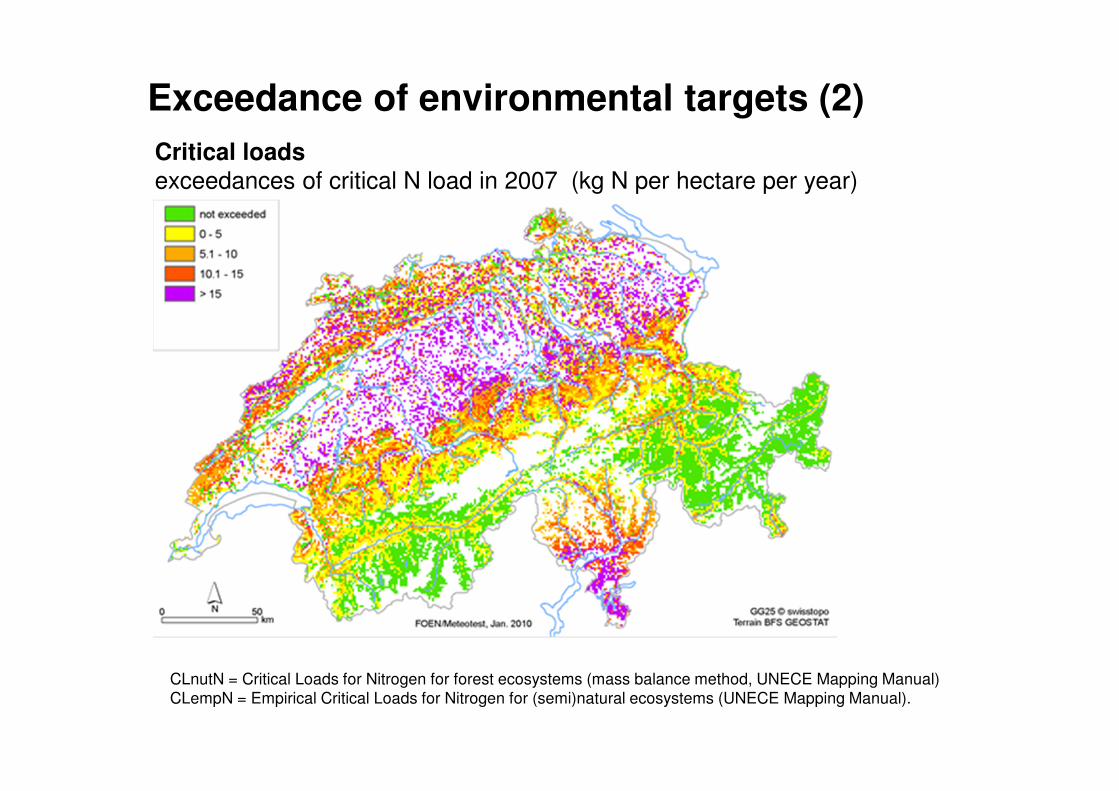
Exceedance of environmental targets (2)
Critical loadsexceedances of critical N load in 2007 (kg N per hectare per year)
CLnutN = Critical Loads for Nitrogen for forest ecosystems (mass balance method, UNECE Mapping Manual)
CLempN = Empirical Critical Loads for Nitrogen for (semi)natural ecosystems (UNECE Mapping Manual).
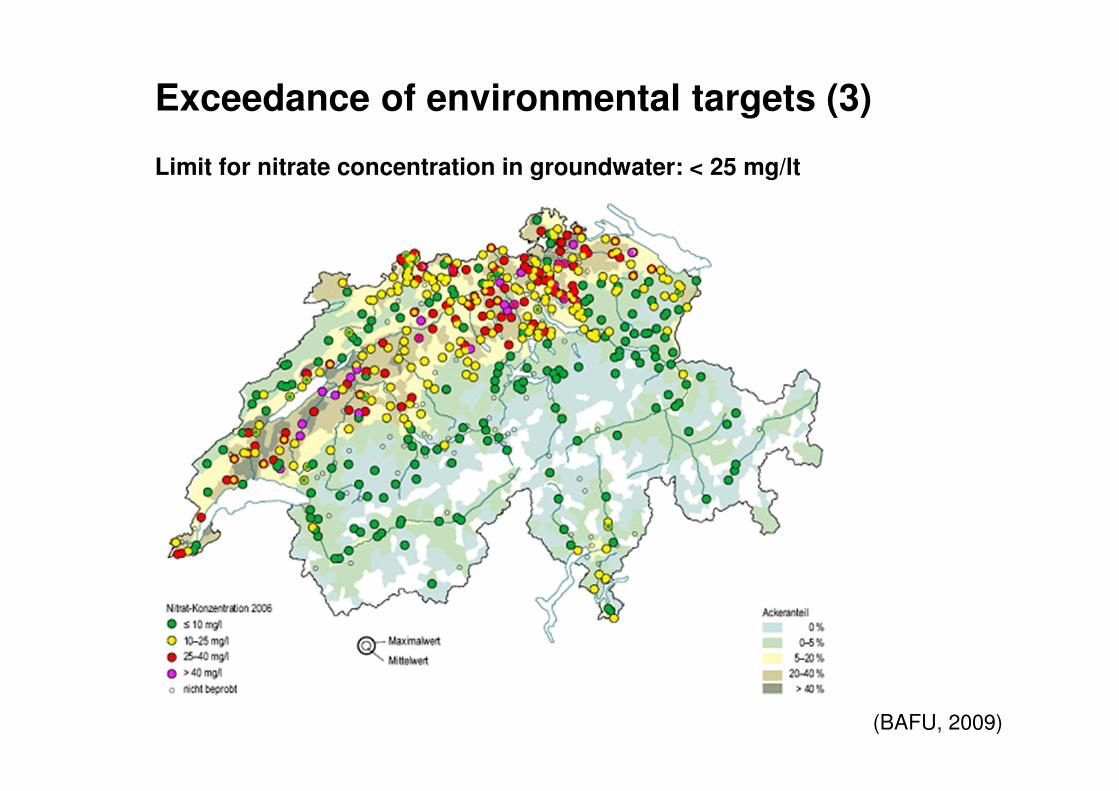
Exceedance of environmental targets (3)
Limit for nitrate concentration in groundwater: < 25 mg/lt
(BAFU, 2009)

Exceedance of environmental targets (4)
N input to surface waters for the Rhine catchment area,PARCOM recommendation 88/2 of 17 June 1988: 50% reduction within 1985-1995
N reduction achieved between 1985 and 2001 for the Rhine catchment:
(Prasuhn/Sieber, 2005)
target 1985-1995 reduction achieved until 2001
-50% -23%
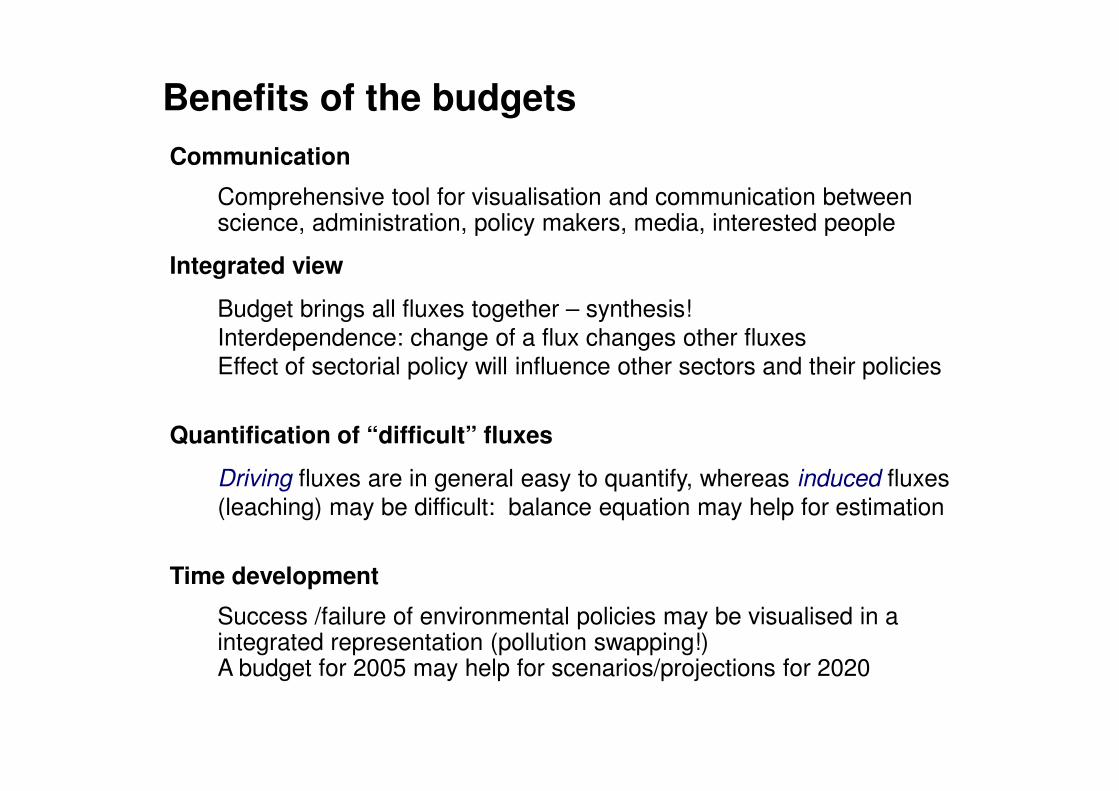
Benefits of the budgets
Communication
Comprehensive tool for visualisation and communication between science, administration, policy makers, media, interested people
Integrated view
Budget brings all fluxes together – synthesis!
Interdependence: change of a flux changes other fluxes
Effect of sectorial policy will influence other sectors and their policies
Quantification of “difficult” fluxes
Driving fluxes are in general easy to quantify, whereas induced fluxes
(leaching) may be difficult: balance equation may help for estimation
Time development
Success /failure of environmental policies may be visualised in a integrated representation (pollution swapping!)A budget for 2005 may help for scenarios/projections for 2020
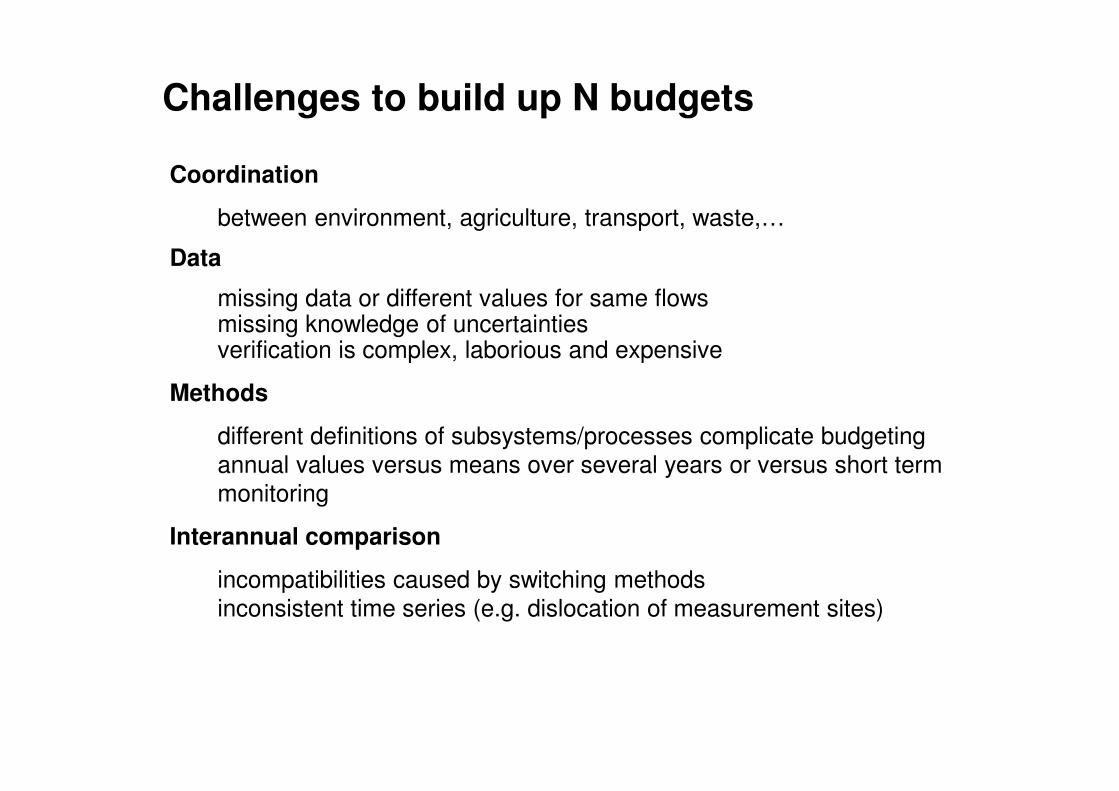
Challenges to build up N budgets
Coordination
between environment, agriculture, transport, waste,…
Data
missing data or different values for same flowsmissing knowledge of uncertaintiesverification is complex, laborious and expensive
Methods
different definitions of subsystems/processes complicate budgeting
annual values versus means over several years or versus short term
monitoring
Interannual comparison
incompatibilities caused by switching methods
inconsistent time series (e.g. dislocation of measurement sites)
Outlook
Nitrogen scenarios for Switzerland 2020/2030
ongoing project Federal Office for the Environment
Expert Panel on Nitrogen Budget (provides expert guidance to the Task Force on Reactive Nitrogen)
Excel tool for national N budgets (A. Leipp, JRC Ispra)
further development towards a dynamic tool => see Poster by Adrian Leipp
… coffee break
thank you for your attention!
some reports of Switzerland’s nitrogen budget are available
(in German only!)
see also http://www.bafu.admin.ch/index.html?lang=en
[email protected] - www.infras.ch
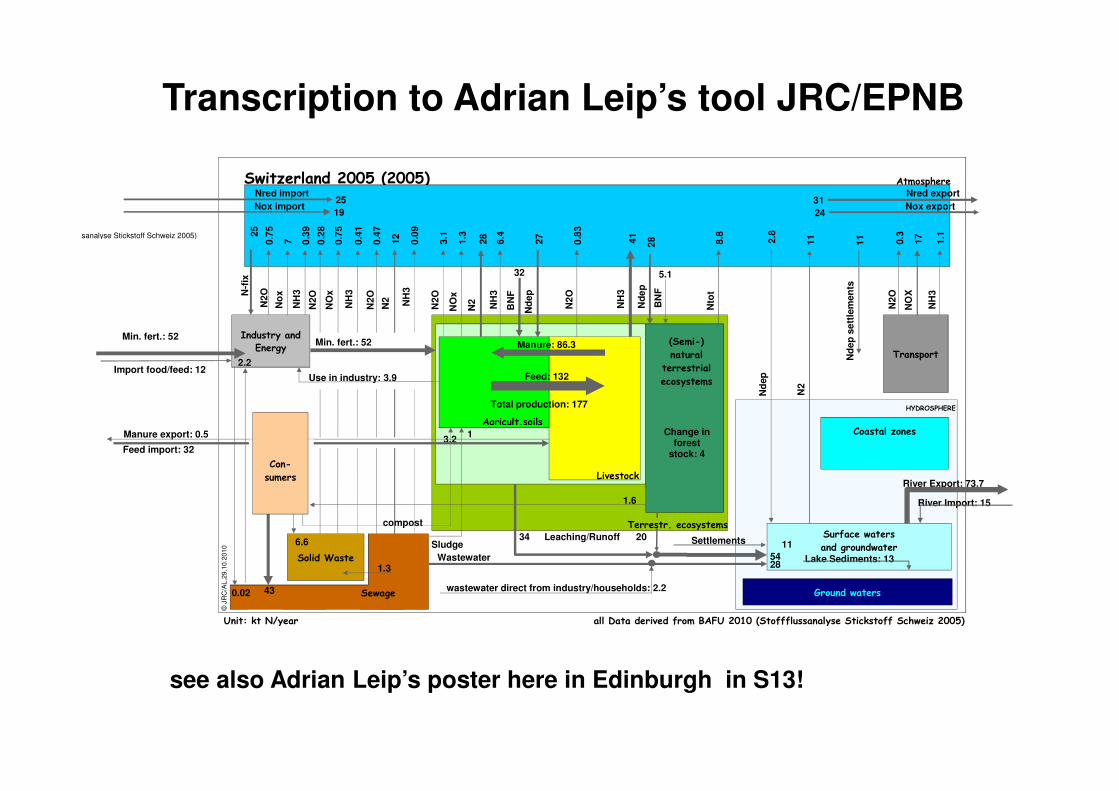
Switzerland 2005 (2005)
Switzerland 2005-all Data derived from BAFU 2010 (Stoffflussanalyse Stickstoff Schweiz 2005)
Unit: kt N/year all Data derived from BAFU 2010 (Stoffflussanalyse Stickstoff Schweiz 2005)
Industry and Energy
Transport
Surface waters
and groundwater
Ground waters
Coastal zones
Sewage
Solid Waste
HYDROSPHERE
Agricult.soils
Atmosphere
Livestock
(Semi-)
natural
terrestrial
ecosystems
© J
RC
/AL
,29.1
0.2
01
0
N-f
ix25
N2O
0.7
5
NH
30
.39
No
x7
Min. fert.: 52
N2
O0.3
NH
31.1
NO
X17
Settlements 11
N2
O0
.83
N2O
3.1
N2
28
NH
3
41
NH
36.4
NO
x1.3
Import food/feed: 12
Manure: 86.3
Manure export: 0.5
BN
F
32
Total production: 177
Feed: 132
Leaching/Runoff34
compost
3.2
BN
F
5.1
20
Nto
t8.8
1.6
Change in forest
stock: 4
54
River Import: 15
River Export: 73.7
Lake Sediments: 13
6.6
NH
30
.41
NO
x0
.75
N2O
0.2
8
0.02
2.2
43
N2O
0.4
7
NH
30
.09
N2
12
Wastewater28
Sludge
1
1.3
wastewater direct from industry/households: 2.2
N2
11
Nd
ep
27
Nd
ep
28
Nd
ep
2.8
Nd
ep
se
ttle
men
ts1
1
Nred import25
Nox import19
Nred export31
Nox export24
Min. fert.: 52
Feed import: 32
Use in industry: 3.9
Con-
sumers
Terrestr. ecosystems
Transcription to Adrian Leip’s tool JRC/EPNB
see also Adrian Leip’s poster here in Edinburgh in S13!
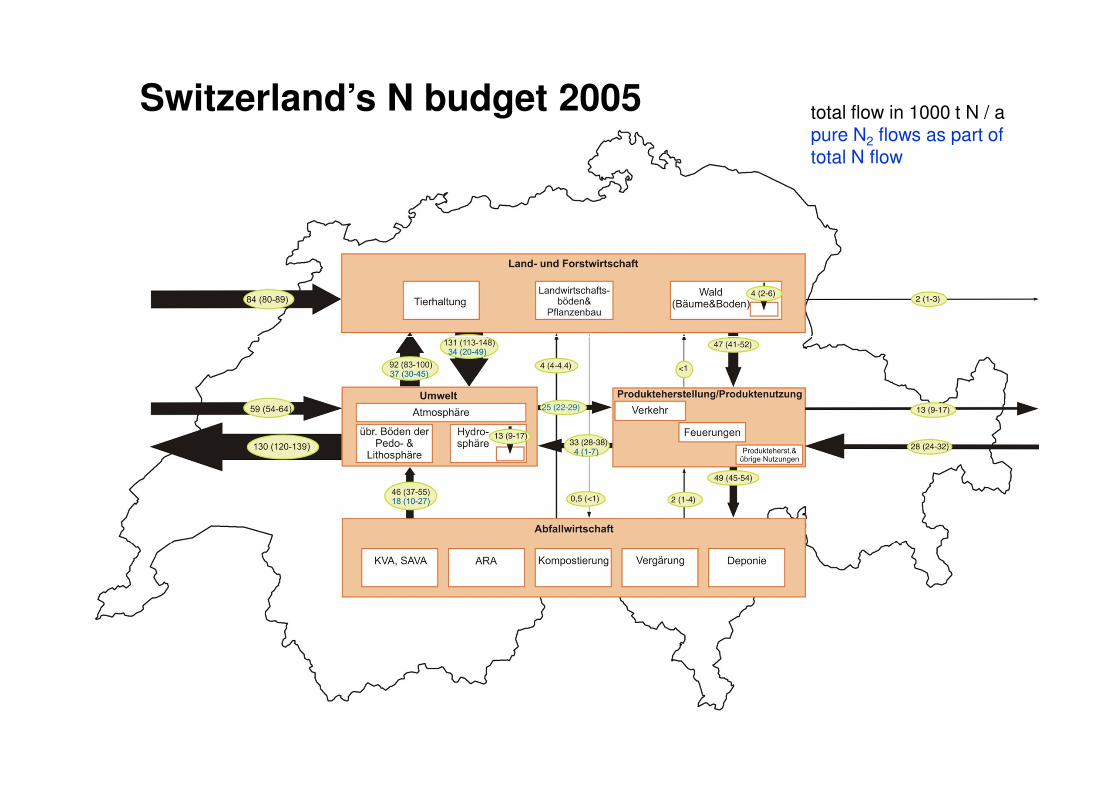
Switzerland’s N budget 2005 total flow in 1000 t N / apure N2 flows as part of total N flow
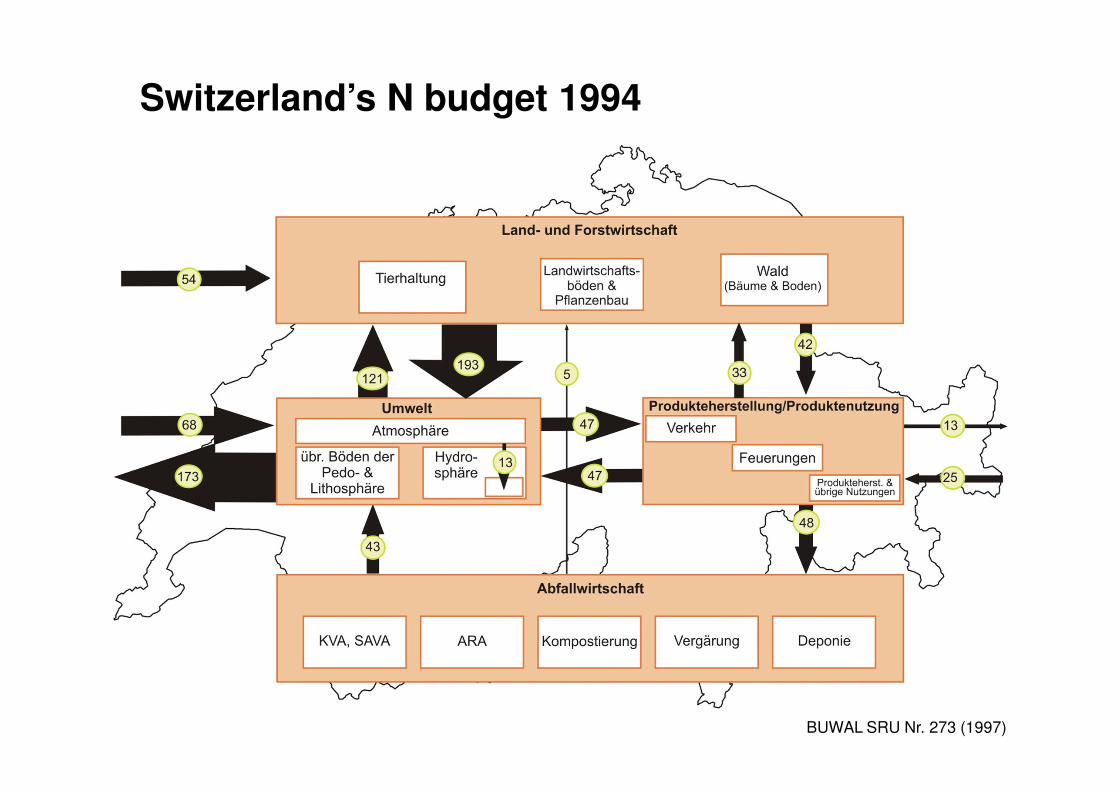
Switzerland’s N budget 1994
BUWAL SRU Nr. 273 (1997)