edited sanitaryware sector jul16 -...
TRANSCRIPT

Please refer to important disclosures at the end of this report
Equity Research July 8, 2016 BSE Sensex: 27201
HSIL (Rs279 – ADD) Target price Rs319 Cera Sanitaryware (Rs2449 – HOLD) Target price Rs2,506
Sanitaryware industry Testing times Reason for report: Initiating coverage
Research Analysts:
Nehal Shah [email protected] +91 22 6637 7235
The Indian sanitaryware industry, currently pegged at Rs35.6bn, is growing in single-digits over the past two years as compared to 13-15% CAGR over FY10-FY14, largely due to significant slowdown in the real estate sector. Further, lower potential for consumer shift from unbranded to branded products and significantly lower replacement opportunities in the sanitaryware space, which have been strong growth triggers for allied products like tiles and faucets, is expected to keep sanitaryware industry growth under check. With the real estate sector likely to see only a gradual uptick, we foresee the sanitaryware industry growth to remain under pressure till FY18. We however expect the mass market focused sanitaryware players to continue to outpace growth over the premium players in such testing times. We initiate coverage on the sector with HOLD rating on Cera Sanitaryware (CRS) with a target price of Rs2,506 per share and ADD rating on HSIL with target price of Rs319 per share.
Branded sanitaryware space to grow at a muted pace over the next two years: The Indian sanitaryware industry is currently growing in single-digits over the past two years as compared to 13-15% CAGR over FY10-FY14 largely due to significant slowdown in the real estate sector. While the increased Budgetary outlay towards drinking water and sanitation programmes and impetus on construction of toilets under Swachh Bharat Abhiyaan programme augurs well for growth and scalability of the sanitaryware industry, much would depend on the implementation of these schemes. Also, incremental demand under the aforesaid schemes would largely benefit the unorganised industry. We thus expect growth for the branded players to be restricted to growth in distribution and limited opportunities in terms of consumer shift from unbranded to branded products.
Mass market to outpace the premium segment in terms of growth: We expect the mass market players to outpace growth over premium players due to: a) lower competitive intensity in the mass market space, and b) demand for premium/luxury sanitaryware products slowing down considerably due to sluggish demand in metros and tier-1 cities. Further, intensified focus on affordable housing segment and increasing shift from unbranded to branded products is expected to drive higher demand for mass market vs premium sanitaryware products. We thus expect CRS (perceived as the strongest mass market brand) to grow at a faster pace than HSIL over the next two years.
Foray into allied products by major players offsetting lower growth in the core sanitaryware segment: Majority of the branded players – domestic and MNC – have over the past few years forayed into allied products like faucets, tiles and wellness to leverage their existing distribution strength in the sanitaryware space. While HSIL has intensified its focus on faucets and recently introduced consumer products like water heater, water purifier, etc, CRS has over the years been focusing on tiles as well as faucets. Parryware too has expanded its product basket to include faucets, water heaters and wellness.
Valuation Summary Rating CMP
(Rs) Target
(Rs) Upside
(%) Mcap
(Rs bn) Rev. CagrFY16-18E
PAT Cagr FY16-18E
P/E (x) RoCE (%) FY17E FY18E FY17E FY18E
HSIL ADD 279 319 14 20.2 11.4 25.6 18.2 14.4 10.9 12.6Cera HOLD 2,446 2,506 2 31.8 16.2 25.0 30.9 24.4 28.3 30.2
Source: I-Sec research
INDIA

Sanitaryware industry, July 8, 2016 ICICI Securities
2
TABLE OF CONTENTS Sanitaryware industry dominated by branded players ................................................ 3
Demand drivers ............................................................................................................... 3
Allied products – Faucets and tiles segments .............................................................. 6 Faucetware industry ........................................................................................................ 6
Tiles industry ................................................................................................................... 7 Demand drivers for tiles industry .................................................................................... 8
Index of tables and charts ............................................................................................. 10
COMPANY
HSIL ................................................................................................................................. 11 Cera Sanitaryware ............................................................................................................ 39
Prices as on July 7, 2016

Sanitaryware industry, July 8, 2016 ICICI Securities
3
Sanitaryware industry dominated by branded players The sanitaryware industry in India is currently pegged at Rs35.6bn. The top three domestic players – HSIL, Cera Sanitaryware (CRS) and Parryware Roca (PR) – account for ~45% of the industry size and over 65% of the organised sanitaryware space. Over 60% of the market is estimated to be dominated by the organised players which includes MNC brands as well. The unorganised industry accounting for <40% of the size, is largely based out of Morbi, Wankaner and Thangad areas of Gujarat.
Table 1: Market share of top three domestic players Market share FY16 Size (Rs bn) Overall market share Organised market share HSIL 6.3 18% 26% CRS 4.4 12% 18% PR 5.5 15% 23% Source: I-Sec Research The organised industry, which was growing at 13-15% over FY10-FY14, is now growing in single-digits largely due to slowdown in the real estate sector. The industry could be broadly classified into four sub-segments – low-end, mass-market, premium, and luxury –with diverse characteristics and competitive intensity.
Table 2: Segment-wise breakup with price points, industry size and key competing brands
Segment-wise Industry Low / Basic segment Standard / Mid-market / Mass segment
Premium segment Super Premium / Luxury segment
Market Size Rs12bn Rs12bn Rs8bn Rs3.6bn Market Mix 34% 34% 22% 10% Price points Rs500-1,000 Rs1,000-2,500 Rs2,500-5,000 Rs5,000-20,000+ Organised vs Unorganised 10:90 75:25 100% organised 100% organised
Brands
Raasi, Neycer, Johnson, CRS and unorganised players
Cera, Hindware, Parryware, Kerovit and Somany
Kohler, Duravit, Toto, American Standard, Jaquar, RAK, Roca, Parryware, Cera & Hindware Art
Kohler, Duravit, Toto, American Standard, V&B, Jaquar, Artize, RAK, Isvea, Roca, Hindware Italian & Queo
Market Leader Unorganised players CRS HSIL PR
Competitive intensity High with 150 unorganised units in this space
Average with three large organised brands dominating the space
High with organised as well as MNC brands competing
High with organised as well as MNC brands competing in this space
Source: I-Sec Research
Demand drivers
Low sanitation levels in India India, home to the world’s second-largest population, has only 40% sanitation coverage, lowest in Asia. As per the 2011 Census of India, rural sanitation coverage stands at 32.7%, which implies that more than 67% of the rural population in India is deprived of basic sanitation facilities. According to the Ministry of Urban Development (MoUD), in notified slums (slums registered by the municipality), 17% of the population is without access to proper sanitation, and in non-notified slums, the average is 51%. As per UNICEF, 638mn people in India lack proper sanitation facilities.

Sanitaryware industry, July 8, 2016 ICICI Securities
4
Chart 1: Sanitation levels – lowest in India
95
90
66
63
50
40
0 20 40 60 80 100
Thailand
Sri Lanka
Indonesia
Korea
China
India
(%)
Source: CRISIL To increase sanitation levels over the years, programmes of the Central and state governments have been on the rise. Budgetary allocation for National Rural Drinking Water Programme (NRDWP) and Swachh Bharat Abhiyaan stood at Rs50bn and Rs113bn, respectively.
The increase in Budgetary outlay towards drinking water and sanitation programmes and rising awareness of such schemes augurs well for the growth and the scalability of the sanitaryware industry. However, the incremental demand under the aforesaid schemes would largely benefit the unorganised industry. Incremental demand would come from:
• New construction activities driven by increasing housing shortage, shift towards nuclear families from joint families, and rising need for commercial and industrial establishments.
• Replacement demand constitutes 10-12% of total demand. It is expected to be a major driver going forward, due to shortening of the replacement cycle. Globally, 80% of total demand accrues from replacement.
• Increasing urbanisation, higher disposable incomes and discretionary spend augur well for the industry. Increasing aspiration levels leads to scaling up of the value chain, with growing appetite for new styles and aesthetics.
• Increasing number of bathrooms per flat in recently built apartments, even in tiers-2&3 cities.
• Emergence of concept bathrooms: The concept of a bathroom has evolved from its primitive utility. Today’s bathrooms are equipped with a range of solutions, comprising designer sanitaryware, faucets, and tiles, high-tech shower systems, and more.

Sanitaryware industry, July 8, 2016 ICICI Securities
5
Strong entry barriers in sanitaryware industry
• Brand equity: Brand creation takes a long gestation period. Any new company would need at least 5-10 years to establish itself as a reputed brand.
• Distribution network: Creation of a strong and widespread distribution network is a constant and long-drawn process. It takes many years to create such a network, thus posing a strong entry barrier.
• Low probability of new domestic players aggressively entering the industry: The sanitaryware industry is capital- and labour-intensive. Well established domestic players had set up facilities at least three decades back, when costs involved for setting up plants were far lower. With substantial escalation in current costs, new entrants are unlikely to earn RoCEs in excess of 14-18% (depending upon the product mix), which in itself is a huge entry barrier.
RoCE model of a sanitaryware plant with capacity of 1.2mn pieces: • Case I: Product mix – 100% mass market products
• Case II: Product mix – 50% mass and 50% premium products
Table 3: RoCE model for setting up a sanitaryware unit Case I Case II
Product mix 100% mass market 50% mass and 50% premium Rs mn Rs mn
Gross Block / Capex 1,000 1,500 Working Capital (20% of revenues) 216 300 Capital Employed (A) + (B) ………….. 1,216 1,800 Net Revenues 1,080 1,875
EBIDTA margin 20% 22% EBIDTA 216 412 Depreciation (6% of gross block) 50 90 EBIT 166 322 RoCE 14% 18%
Source: I-Sec Research

Sanitaryware industry, July 8, 2016 ICICI Securities
6
Allied products – Faucets and tiles segments
Faucetware industry
The Rs60bn Indian faucetware industry is currently growing at 12-13% CAGR compared to 15-18% over FY10-FY14. The organised faucet industry accounts for 50% of the size. Jaquar remains the top recall brand, with over 60% and one-third share of the organised and overall market, respectively. The other notable players in the industry include Grohe, Kohler, HSIL, Cera Sanitaryware (CRS) and Parryware Roca (PR).
HSIL, PR, and CRS forayed into the manufacture of faucets to leverage their strong brands and existing distribution network in sanitaryware space. These brands are targeting the mid-market segment where Jaquar does not have much of a presence. Kajaria Ceramics too has entered the faucet segment and has recently set up a manufacturing unit in Rajasthan.
Scalability in the faucet industry is superior to that in the sanitaryware industry, considering the coverage potential of faucets vis-à-vis sanitaryware products in bathrooms besides being used in kitchens as well. The demand drivers include new construction, rising disposable incomes, increasing urbanisation, strong replacement demand and increasing shift from unbranded to branded products. With these drivers, we expect the faucet industry to register 13-15% CAGR over the next 2-3 years, clearly outpacing growth of sanitaryware and tiles segment, with organised industry expected to exhibit CAGR of 15-18%.
Chart 2: Positioning of brands across segments
Super-premium or Luxury segmentMNC brands:Grohe, Kohler, Duravit, Toto, American Standard, Roca and QueoIndian brands: Artize (Jaquar)
Premium segmentMNC brands:Grohe, Kohler, Duravit, Toto, American Standard, Roca and QueoIndian brands: Jaquar, Hindware Italian, ParrywareRoca and Cera
Mass-market segmentMNC brands: NILIndian brands: Jaquar, Hindware, Parryware, Cera, Kajaria and SomanyUnorganised brands: Few Morbiunits
Basic/Low end segment.MNC brands: NILIndian brands: NILUnorganised brands: Large number of units from Delhi and Chandigarh
Competing brands segment wise
Source: I-Sec Research

Sanitaryware industry, July 8, 2016 ICICI Securities
7
Tiles industry
The Indian tiles industry is currently estimated to be at 756mn-sqm in terms of volumes and Rs240bn in value. The industry, which was growing at 14-16% CAGR over FY10-FY14, is now growing at 8-10% over the past two years on account of slowdown in real estate sector. The top-10 players, which include players based out of Morbi in Gujarat, account for over 45% of the industry. The organised industry currently accounts for 30% of overall volumes and 50% of industry revenues while Morbi (the unorganised tile manufacturers hub) players account for ~70% of total volumes and 50% of revenues.
Majority (90-95%) of the unorganised tiles industry is based out of Morbi (Gujarat) with the balance being based out of Himmatnagar (Gujarat) and Andhra Pradesh. Morbi over the past few years has increasingly been becoming an outsourcing hub for the organised players. The installed capacity of Morbi (which houses close to 650 units) currently stands at 700mn-sqm with nearly 15-20% of the capacity being idle at this point in time.
Table 4: Segment-wise breakup and growth of the tiles industry Segments Industry size – FY15 Mix 5-year
CAGR Volume (mn sq. m)
Value (Rs bn)
Volume Value
Ceramic wall and floor 440 105 58% 44% 10-12% Polished vitrified tiles 266 105 35% 44% 12-14% Glazed vitrified tiles 50 30 7% 12% 20-25% Total 756 240 100% 100% 12-14%
Source: I-Sec Research
Chart 3: Tiles industry volume mix Chart 4: Tiles industry value mix
Ceramic wall and
floor58%
PVT35%
GVT7%
Ceramic wall and
floor44%
PVT44%
GVT12%
Source: Company data, I-Sec research
The ceramic wall and floor segment currently accounts for 58% of tile industry volumes and 44% of the overall size. PVT (which includes soluble salt vitrified tiles and value-added double charged vitrified tiles) on the other hand accounts for 35% of the overall volumes and 44% of the size. GVT, the fastest growing value-added tiles, accounts for 12% of the industry size and 7% of volumes.

Sanitaryware industry, July 8, 2016 ICICI Securities
8
Demand drivers for tiles industry
Government policy reform – A key trigger: Policy reforms set forth by the Union government, including creation of Smart Cities, ‘Housing for All’, GST implementation, Swachh Bharat Abhiyaan, etc. are expected to stimulate strong demand for tiles
Increasing replacement to traditional materials: In India, 47% of the population lives in houses with mud flooring, 37% with cement flooring, and 11% with mosaic and tile flooring. With higher disposable incomes and tiles being a superior quality and durability material, its increasing acceptance in both rural and urban India is expected to result in sustained demand for ceramic tiles.
Table 5: Percentage of households by flooring material Flooring options India Rural Urban 1991 2001 2011 2001 2011 2001 2011 Mud 67% 57% 47% 72 63 18 12 Stone 0 6 8 5 6 9 12 Cement 21 27 31 18 24 48 46 Tiles/Mosaic 4 7 11 2 4 21 26 Others 8 3 4 3 3 4 4
Source: I-Sec research Higher disposable incomes: Higher disposable incomes and increasing discretionary spend continue to be a major growth driver. It has been noticed that growing aspirations levels are leading to scaling up the value chain. There is a growing appetite for new styles and aesthetics. India seems to be moving on from being just a ‘value-for-money’ market.
Increasing preference over natural stone: Tiles have been replacing natural stone due to ease in laying, competitive costs, varying sizes and attractive designs. Like paints, but with a more time lag, there is also a shift being noticed to replace the older set of tiles with newer ceramic (digital) and vitrified tiles such as double-charged and digital glaze. The replacement cycle has considerably shortened (once or twice in a lifetime earlier to once in 10 years due to value addition).
Shift towards nuclear families: The shift towards nuclear families from joint families, apart from increase in disposable incomes, is also adding to demand for housing. This is expected to be a major driver for real estate and building materials going forward.
Increasing applications: New tiling applications that are opening up include exterior cladding, interior walls (apart from bathroom and kitchen) and paver tiles. These would incrementally drive demand for ceramic tiles.
With these demand drivers along with the recent imposition of anti-dumping duty on polished vitrified tiles, we expect the tiles industry to grow at 10-12% CAGR over the next two years. While Kajaria Ceramics (KJC) enjoys the best brand equity in this segment, Somany Ceramics (SOMC) is a rapidly improving brand. HR Johnson, the no.2 brand in terms of revenues, has been consistently losing market share to KJC and SOMC over the past five years.
Sanitaryware industry, July 8, 2016 ICICI Securities
9
Table 6: Bathroom solutions industry at a glance
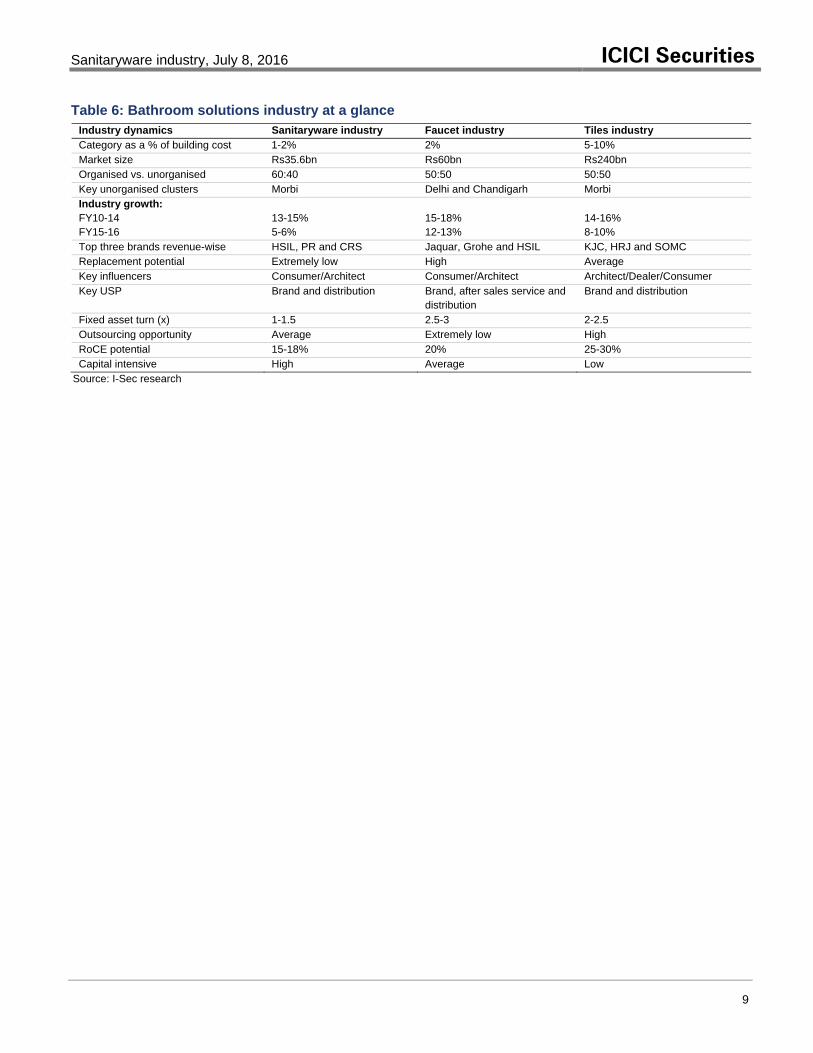
Industry dynamics Sanitaryware industry Faucet industry Tiles industry Category as a % of building cost 1-2% 2% 5-10% Market size Rs35.6bn Rs60bn Rs240bn Organised vs. unorganised 60:40 50:50 50:50 Key unorganised clusters Morbi Delhi and Chandigarh Morbi Industry growth: FY10-14 FY15-16
13-15% 5-6%
15-18% 12-13%
14-16% 8-10%
Top three brands revenue-wise HSIL, PR and CRS Jaquar, Grohe and HSIL KJC, HRJ and SOMC Replacement potential Extremely low High Average Key influencers Consumer/Architect Consumer/Architect Architect/Dealer/Consumer Key USP Brand and distribution Brand, after sales service and
distribution Brand and distribution
Fixed asset turn (x) 1-1.5 2.5-3 2-2.5 Outsourcing opportunity Average Extremely low High RoCE potential 15-18% 20% 25-30% Capital intensive High Average Low
Source: I-Sec research

Sanitaryware industry, July 8, 2016 ICICI Securities
10
Index of tables and charts
Tables Table 1: Market share of top three domestic players ........................................................... 3 Table 2: Segment-wise breakup with price points, industry size and key competing brands3 Table 3: RoCE model for setting up a sanitaryware unit ...................................................... 5 Table 4: Segment-wise breakup and growth of the tiles industry ......................................... 7 Table 5: Percentage of households by flooring material ...................................................... 8 Table 6: Bathroom solutions industry at a glance ................................................................. 9
Charts Chart 1: Sanitation levels – lowest in India ........................................................................... 4 Chart 2: Positioning of brands across segments .................................................................. 6 Chart 3: Tiles industry volume mix ........................................................................................ 7 Chart 4: Tiles industry value mix ........................................................................................... 7

11
Market Cap Rs20.2bn/US$300mn Year to Mar FY15 FY16 FY17E FY18EReuters/Bloomberg HSNT.BO / HSI IN Revenue (Rs mn) 19,806 20,561 22,027 24,830Shares Outstanding (mn) 72.3 Rec. Net Income (Rs mn) 854 890 1,110 1,40552-week Range (Rs) 357/228 EPS (Rs) 11.8 12.3 15.4 19.4Free Float (%) 52.9 % Chg YoY 129.7 4.2 24.7 26.5FII (%) 11.1 P/E (x) 23.6 22.7 18.2 14.4Daily Volume (US$/'000) 338.0 CEPS (Rs) 29.1 28.9 32.4 39.9Absolute Return 3m (%) (6.4) EV/E (x) 8.4 7.9 7.5 5.9Absolute Return 12m (%) (20.5) Dividend Yield (%) 1.0 1.4 2.1 2.8Sensex Return 3m (%) 10.9 RoCE (%) 10.9 10.2 10.9 12.6Sensex Return 12m (%) (2.0) RoE (%) 7.3 6.6 7.9 9.5
Equity Research July 8, 2016 BSE Sensex: 27201
Sanitaryware Target price Rs319 Shareholding pattern
Sep ’15
Dec ’15
Mar ’16
Promoters 47.1 47.1 47.1 Institutional investors 33.7 32.9 33.5 MFs and UTI 22.8 22.1 22.1 FIs/Banks 0.1 0.5 0.4 Insurance 0.5 - - FIIs 10.4 10.3 11.1 Others 19.2 20.0 19.4
Source: NSE Price chart
0
100
200
300
400
500
Jul-1
3Ja
n-14
Jul-1
4Ja
n-15
Jul-1
5D
ec-1
5Ju
n-16
(Rs.
)
HSIL ADD Best brand, but capital allocation a worry Rs279Reason for report: Initiating coverage
Research Analysts:
Nehal Shah [email protected] +91 22 6637 7235
HSIL stands out amongst peers in the sanitaryware space led by its: 1) ‘top of themind recall’ brand Hindware, 2) strong distribution franchise, and 3) focus onquality and premiumisation. However, the company’s recent unrelateddiversification (consumer products) in the building products division andaggressive expansion in the packaging products division (PPD) in the past haveadded to its current slowdown woes in the sanitaryware space, leading to a mere2% PAT CAGR over the past five years – lowest in the building materials space.This has resulted in relatively subdued valuations notwithstanding its formidablecore competency in the sanitaryware segment. Besides these valid concerns,HSIL’s intended foray into plastic pipes, caps and closures segment over the next12 months has also enhanced investor concerns about the company’sdiversification strategies against the backdrop of its early exit from the tilessegment. However, HSIL is expected to see a marked improvement in itsprofitability going forward, on the back of: 1) likely sustainability of theturnaround in PPD and 2) scaling up of its building product division (BPD) led bytraction in consumer products segment. We initiate coverage on HSIL with anADD rating and SoTP-based target price of Rs319 per share.
BPD revenues to gain traction; recent margin pressures likely to continue. ‘Topof the mind recall’, strong presence in the premium segment, and a large nationwidedistribution network make HSIL the best and biggest player in the brandedsanitaryware space. The company’s intensified focus on the faucet segment, withthrust on manufacturing, has paid rich dividends, enabling it to grow at >30% CAGRover the past five years and offsetting lower growth in its core sanitaryware segmentand the momentum is likely to continue. Besides this, HSIL’s recent launches anddistribution expansion in the consumer products segment over the past 15 monthsare also expected to drive BPD revenues. Overall, we expect BPD revenues to growat 17.2% CAGR over FY16-FY18. BPD margins however are expected to remainunder pressure due to higher brand spends, increasing contribution from faucetsegment, losses in the consumer product division till breakeven, and start-up costsin the plastic pipes segment in FY18.
PPD volume growth a concern; margins expected to remain firm. Withincremental capacity addition in the past by HSIL and Hindusthan National Glass &Industries in South India, and demand taking a subsequent hit due to the macro-economic slowdown, both the players have been unable to utilise their full capacitiesand increase prices on account of cost pressures, thereby impacting theirprofitability. However, significantly lower fuel prices and HSIL’s improving productmix have enabled a strong turnaround in margins over the past two years, which islikely to sustain. We expect PPD revenues to grow at a muted 3% CAGR while EBITmargins are expected to remain firm at 12% over the next two years.
INDIA

HSIL, July 8, 2016 ICICI Securities
12
TABLE OF CONTENTS BPD revenues to gain traction; margin pressures likely to continue ...................... 13
Sanitaryware segment expected to grow in single digits due to sluggish demand ...... 13
Intensified focus on manufacturing in faucet segment .................................................. 14 Diversification into consumer product business to drive BPD revenues ...................... 15
BPD margins likely to remain under pressure over FY16-FY18 ................................... 16
Packaging products division – back to profitable ways ............................................ 17 Profitability improves significantly in FY16 led by higher margins and debt repayment17 Peak capex behind; strategic capex on Rs1.12bn on caps and closures to add to scale ...................................................................................................................................... 18
Strong brand equity with pan-India distribution network .......................................... 20 Large-ticket capex to peak out by FY17 ...................................................................... 22 Financials expected to Improve ................................................................................... 23 Key concerns ................................................................................................................. 25 Valuation ......................................................................................................................... 25 Company background ................................................................................................... 26
Building products division ............................................................................................. 27
Packaging products division ......................................................................................... 30 Others............................................................................................................................ 32
Key milestones ............................................................................................................... 33 Financial summary ........................................................................................................ 34 Index of tables and charts ............................................................................................. 38

HSIL, July 8, 2016 ICICI Securities
13
BPD revenues to gain traction; margin pressures likely to continue
Sanitaryware segment expected to grow in single digits due to sluggish demand
Largest sanitaryware player in India with strongest brand pull: HSIL is India’s largest player in the sanitaryware space, with an organised market share of 26%. ‘Top of the mind recall’, strong presence in the premium segment and large nationwide distribution network make it the best and largest player in the branded sanitaryware industry. HSIL markets its products under the umbrella brand Hindware.
Focus on retail: Over the years, with its aggressive brand spends and focus on retail, Hindware is perceived as the strongest retail brand in the sanitaryware space. In FY16, retail sales accounted for 85% of the company’s sanitaryware segment revenues while the balance consisted of institutional/project sales. Within its branded portfolio, Benelave is largely showcased as a project brands while Hindware, Hindware Art, Hindware Italian Collection and Queo are largely retail brands. Brand Queo is positioned as the luxury brand while Hindware Art and Hindware Italian Collection are premium brands.
Moving up the value chain through premiumisation: Over the past decade, contribution from premium and luxury products has increased from 27% of HSIL’s revenues in FY07 to 60% in FY16. This has resulted in the company having a strong margin profile vis-à-vis its immediate listed peer – CRS, which focuses largely on mass market products.
Chart 1: Increasing premiumisation over the years
27%
52% 57% 60%
73%
48% 43% 40%
0%10%20%30%40%50%60%70%80%90%
100%
FY07 FY12 FY14 FY16
Premium brands - Queo, Hindware Italian and Hindware Art Mass brands - Hindware and Raasi
Source: Company data, I-Sec research With the focus intensifying on brand Queo, the share of premiumisation in HSIL’s overall portfolio is expected to further increase over the next few years.

HSIL, July 8, 2016 ICICI Securities
14
Expect sanitaryware segment revenues to grow in single digits on slowdown woes: With the sanitaryware sector slowing down considerably over the past two years due to slowdown in real estate sector, we expect HSIL’s sanitaryware segment revenues to grow in single digits led by lower single-digit volume growth and some product mix improvement.
Chart 2: Trend in sanitaryware segment revenues
20%
16%
2%1% 0%
5%
-5%
0%
5%
10%
15%
20%
25%
-
1,000
2,000
3,000
4,000
5,000
6,000
7,000
FY12 FY13 FY14 FY15 FY16 FY17 FY18
Sanitaryware revenues (Rs mn) Growth (RHS)
Source: Company data, I-Sec research
Intensified focus on manufacturing in faucet segment
HSIL is intensifying its focus on the faucet segment, with a thrust on manufacturing over the earlier practice of outsourcing. The commissioning of 2.5mn pieces faucet unit at Kaharani, Rajasthan, in FY15 has scaled up the faucet business further with focus on mass as well as premium products.
Increasing in-house capacities to reduce dependence on outsourcing In FY16, turnover from own manufacturing constituted 55% of overall faucet sales. With the company extensively focusing on manufacturing, the contribution of manufactured turnover is expected to rise, with a ramp-up in production from the Kaharani plant. The Bhiwadi plant is temporarily shut down and would commence operations as and when the demand environment improves.

HSIL, July 8, 2016 ICICI Securities
15
Chart 3: Faucet revenues to grow at 22.5% CAGR over FY16-FY18
14%
19%
27%
35%
25%
20%
0%
5%
10%
15%
20%
25%
30%
35%
40%
-
1,000
2,000
3,000
4,000
5,000
6,000
7,000
FY12 FY13 FY14 FY15 FY16 FY17 FY18
Faucet revenues (Rs mn) Growth (RHS)
Source: Company data, I-Sec research The capacity of Kaharani plant is scalable up to 5mn pieces of faucets, with an incremental capex of Rs600mn-700mn. HSIL expects its faucet business to generate revenues of Rs5bn over the next 3-4 years.
Diversification into consumer product business to drive BPD revenues
Apart from its core products – sanitaryware and faucets – related to bathroom solution channels, HSIL is currently taking initiatives to develop two more channels - a) consumer electrical channel for expanding its recently launched consumer product business and b) hardware channel for launching its plumbing pipe products over the next one year.
• Consumer electrical business. The products launched by HSIL under the consumer business including water heaters, air coolers, air purifiers, kitchen chimneys, hoods and hobs, etc. have been well accepted by the market. The company has tied up with Groupe Atlantic of France for water heaters and the Indian subsidiary of The Marmon Group (a subsidiary of Bershire Hathway, US) for water purification products. In FY16, HSIL’s consumer electrical business achieved revenues to the tune of Rs600mn. At EBIT level, it suffered a loss of Rs160mn in FY16. The loss is largely attributed to development costs incurred in building a network of around 225 distributors across India and 4,000 active sales touch points. HSIL intends to double the footprint over the next year.
• Consumer hardware business. HSIL is in the process of setting up a PVC/CPVC pipes unit in Telangana in South India. The plant is expected to commence operations by Mar’17. The company will be spending Rs1.05bn to build a 30,000tpa plant with 60% catering to CPVC pipes. HSIL expects ~Rs2bn revenues from the business after 3-4 years of commissioning. The company has already entered into an arrangement with Sekisui Chemical Co Limited, Japan, for supply of CPVC resin. For HSIL, the pipes business will be a further extension of its building product portfolio and is expected to leverage the existing sales and distribution network for marketing. The company is already in the process of creating a hardware channel for marketing its plumbing pipe products.

HSIL, July 8, 2016 ICICI Securities
16
We expect HSIL’s consumer product business to grow at a CAGR of 112% over FY16-FY18. We expect revenues from this business to touch Rs2.7bn in FY18 and the segment to achieve EBIDTA breakeven in the same year.
Chart 4: Expect BPD revenues from to grow at 17.2% CAGR over FY16-FY18
4%
17%
35%
24%20%
18%
6%
11%14%
20%
0%
5%
10%
15%
20%
25%
30%
35%
40%
-
2,000
4,000
6,000
8,000
10,000
12,000
14,000
16,000
FY08 FY09 FY10 FY11 FY12 FY13 FY14 FY15 FY16 FY17 FY18
BPD revenues (Rs mn) Growth (RHS)
Source: Company data, I-Sec research Overall, we expect the Building Products Division (BPD) to grow at a CAGR of 17.2% over FY16-FY18. We expect the sanitaryware segment to contribute 47% of the segmental revenues with faucet and consumer product business to contribute 29% and 19% respectively in FY18.
BPD margins likely to remain under pressure over FY16-FY18
HSIL’s BPD margins have been trending lower in past two years after being resilient since FY11. EBIT margins are expected to remain under pressure due to higher brand spends, increasing contribution from faucet division, losses in the consumer product division till it breaks even, and start-up costs in the plastic pipes segment in FY18E.
Chart 5: Changing of margin trajectory in phases
Source: Company data, I-Sec research

HSIL, July 8, 2016 ICICI Securities
17
Chart 6: Trend in BPD EBIT margins
15.7%
17.2%
19.4%
21.1%
19.7%
18.2%
20.7%
19.0%
14.6%14.0% 14.0%
12.0%
16.0%
20.0%
24.0%
FY08 FY09 FY10 FY11 FY12 FY13 FY14 FY15 FY16 FY17 FY18
Source: Company data, I-Sec research While margins are expected to remain under pressure over the next two years, we expect the same to be at an inflection point in FY19 and again start trending higher towards 17-18% with the new businesses likely gaining significant traction and the core segment too contributing to growth given the macro-economic recovery expected to have panned out by then.
Packaging products division – back to profitable ways HSIL is the second-largest player in the domestic container glass industry, with ~17% and 19% domestic market shares in terms of revenues and capacity, respectively. The container glass division has two manufacturing facilities located at Hyderabad and Bhongir, Telangana, the largest consumer of liquor, beer, and soft beverages in the country, thereby giving HSIL better headroom for growth than its peers.
Profitability improves significantly in FY16 led by higher margins and debt repayment
FY09-FY12: Phase of strong visibility and superior profitability: HSIL witnessed a phase of strong growth and dominance particularly post the commissioning of its greenfield project in Bhongir (capacity of 425tpd). With South India being the largest consumer of beer and liquor in India and HSIL the largest player in terms of capacity there, the company witnessed strong surge in revenues and EBIT, which grew by 34% and 49% respectively during FY09-FY12. EBIT margins too were up sharply during the period by 800bps from 7.2% in FY08 to 15.2% in FY12, led by higher capacity utilisation and high pricing power.
FY13-FY14: Demand decelerates while capacity enhances – leading to sharp fall in profitability: Immediately post HSIL’s aggressive capacity additions in FY12 by way of brownfield expansion (capacity of 475tpd) in South India, it was jolted by a number of issues:

HSIL, July 8, 2016 ICICI Securities
18
• Over-supply in the South, with HSIL’s biggest competitor – HNGIL – setting up a large capacity plant of 650tpd in Naidupeta, Andhra Pradesh, in FY13
• Overall economic slowdown leading to under-utilisation of capacities
• Inability to raise prices despite rising costs, resulting in sharp deterioration in margins
FY15-FY16: Impressive comeback despite sluggish demand: Over the past two years, while the demand for container glass bottles remained sluggish (largely in the liquor and beer segment led by ban on consumption of liquor in a few states), the profitability of the division has drastically improved over the past two years on account of the following:
• Change in fuel source: HSIL has changed its source of fuel oil, effective Oct’13, from high-cost furnace oil to fluidised petcoke. This has reduced power and fuel cost to 30% of revenues in FY16 from 42% in FY14, thereby being margin-accretive to that extent
• Foray into the value-added container glass segment: HSIL has recently forayed into the manufacture of coloured glass, chemical, and lightweight bottles. It has deployed a sophisticated colouring technique – Forehearth Technology – to emerge as India’s sole manufacturer of speciality coloured bottles. These bottles command higher realisations and margins.
Interest cost substantially lower in FY16: HSIL raised Rs2.5bn in Mar’16 via Qualified Institutional Placement (QIP) at a price of Rs400 per share. These funds were used for repaying debt, which reduced interest costs of the PPD division by ~Rs250mn in FY16, thereby aiding higher profitability.
Peak capex behind; strategic capex on Rs1.12bn on caps and closures to add to scale
Over the past few years, HSIL has increased capacities in its container glass division through a mix of greenfield and brownfield expansion and debottlenecking – taking its total capacity to 1,600tpd. Of the total capacity (four furnaces), one of the furnaces with capacity of 300tpd at Hyderabad.is shut since Sep’13 due to excess supply in the South India market.
Capacity utilisation of the other three furnaces stood at 90% in FY16, which still offers some headroom for growth. We thus believe the company may not have to expand in this segment for the next three to four years as we expect it to deliver single-digit growth over the same period.
The PPD has however planned further value addition to its existing product profile by foraying into safety and tamper evident caps and closures. The new plant with a capacity to manufacture 720mn pieces of caps per annum at a capex of Rs1.12bn is expected to commence commercial operations by Mar’17.

HSIL, July 8, 2016 ICICI Securities
19
Volume growth to remain muted Considering the sluggish demand, particularly in the liquor and beer segment (50% of PPD revenues) led by slowdown woes and ban in consumption of liquor by a few states, we expect volume growth to remain muted over the next two years. Further, with the company finding it difficult to undertake price hikes in such testing times, we expect minimal probability of that in the near future. However, improving product mix would enable realisations to grow at 1-1.5% CAGR over the next two years. We expect PPD revenues and EBIT to grow at CAGRs of 3% and 1.2% respectively over FY16-FY18. More importantly, with minimal capex (post-FY17) and improving cash flow from operations, we expect debt to significantly reduce over FY18-FY20.
Chart 7: Revenue trend in PPD over FY08–FY18E
9%
43%
29% 30%
15%
5% 6%
-1%1%
5%
-5%0%5%10%15%20%25%30%35%40%45%
01,0002,0003,0004,0005,0006,0007,0008,0009,000
10,000
FY08 FY09 FY10 FY11 FY12 FY13 FY14 FY15 FY16 FY17 FY18
PPD revenues (Rs mn) Growth (RHS)
Source: Company data, I-Sec research
Chart 8: EBIT trend in PPD over FY08–FY18E
7.2%
11.0% 11.1%
15.0% 15.2%
8.6%
1.1%
9.1%
12.4% 12.0% 12.0%
1.0%
3.0%
5.0%
7.0%
9.0%
11.0%
13.0%
15.0%
17.0%
FY08 FY09 FY10 FY11 FY12 FY13 FY14 FY15 FY16 FY17 FY18
Source: Company data, I-Sec research

HSIL, July 8, 2016 ICICI Securities
20
Strong brand equity with pan-India distribution network Over the years, HSIL established a strong and widespread distribution network, encompassing over 3,000 dealers and over 19,000 retailers across India. It has presence in all towns with population of 100,000 and above.
HSIL has also established company-owned display centres, exhibiting its entire building products range, under the brand Hindware Lacasa. It has also encouraged dealers to open exclusive Hindware shops named Hindware Boutiques and Hindware Arcades, across major cities to sell the entire Hindware portfolio. The company also has created Hindware Shop in Shop by occupying space at dealer locations for adequate display of its product range.
Around 60% of pan-India sanitaryware dealers stock HSIL's products. The company has established 20 service centres across different states, covering 95% of its total sales base. HSIL is further strengthening its presence by expanding its dealer network while focusing on advertising to promote its products and brands.
Table 1: HSIL’s deeply entrenched network Network Basis Ownership Number and location
Hindware Lacasa 600-1,500sqft display centres Company-owned Four - Mumbai, Kochi, Bangalore and Ahmedabad
Hindware Boutiques and Arcades
Over 3,000sqft exclusive showrooms Dealer-owned 125 – across major cities
Hindware shop-in-shops
Dedicated space provided by dealer at his shop for display Dealer-owned 500 – across India
Source: Company data, I-Sec research
Chart 9: Reaping the benefits of aggressive advertising and promotion spends
1.8%
1.9%
3.9% 3.8%3.5%
3.1% 3.2%
2.0% 1.8%
3.1%
4.9%
5.6%
0%
1%
2%
3%
4%
5%
6%
-
100.0
200.0
300.0
400.0
500.0
600.0
FY04 FY05 FY06 FY07 FY08 FY09 FY10 FY11 FY12 FY13 FY14 FY15
A&P spends (Rs mn) % of BPD revenues (RHS)
Source: Company data, I-Sec research Hindware, a ‘top of the mind recall’ brand in the minds of consumers, is largely backed by branding strategies. Historically, HSIL has nearly spent 3-4% of revenues from its building products division towards advertising and publicity. With the company getting aggressive in promoting its premium/luxury brands through celebrity endorsements, we expect advertising and promotion spends to be in the range of 4-6% of BPD revenues going forward.

HSIL, July 8, 2016 ICICI Securities
21
Key brand spend initiatives by HSIL over the past three years Chart 10: Bollywood celebrities endorsing HSIL brands
Chart 11: Active participation in various building material exhibitions
Chart 12: Rich clientele in PPD as well
Liquor
Beer
Food
Soft drinks
Pharmaceuticals
HSIL, July 8, 2016 ICICI Securities
22
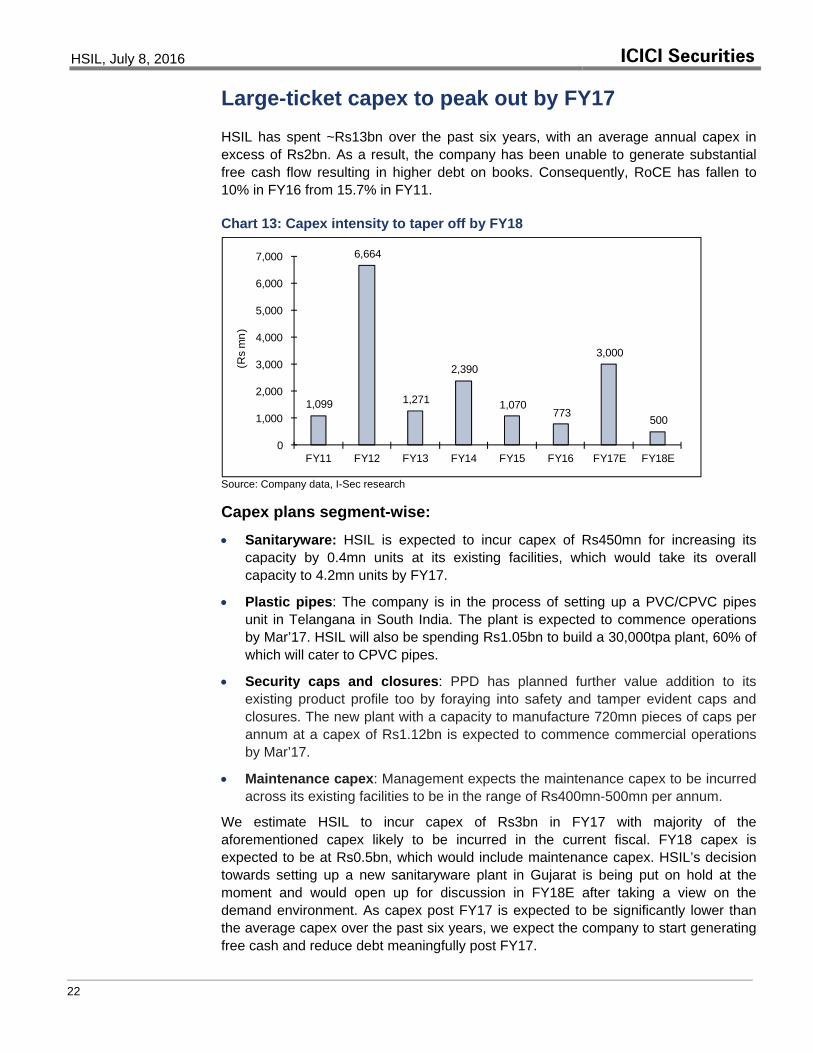
Large-ticket capex to peak out by FY17 HSIL has spent ~Rs13bn over the past six years, with an average annual capex in excess of Rs2bn. As a result, the company has been unable to generate substantial free cash flow resulting in higher debt on books. Consequently, RoCE has fallen to 10% in FY16 from 15.7% in FY11.
Chart 13: Capex intensity to taper off by FY18
1,099
6,664
1,271
2,390
1,070 773
3,000
500
0
1,000
2,000
3,000
4,000
5,000
6,000
7,000
FY11 FY12 FY13 FY14 FY15 FY16 FY17E FY18E
(Rs
mn)
Source: Company data, I-Sec research Capex plans segment-wise: • Sanitaryware: HSIL is expected to incur capex of Rs450mn for increasing its
capacity by 0.4mn units at its existing facilities, which would take its overall capacity to 4.2mn units by FY17.
• Plastic pipes: The company is in the process of setting up a PVC/CPVC pipes unit in Telangana in South India. The plant is expected to commence operations by Mar’17. HSIL will also be spending Rs1.05bn to build a 30,000tpa plant, 60% of which will cater to CPVC pipes.
• Security caps and closures: PPD has planned further value addition to its existing product profile too by foraying into safety and tamper evident caps and closures. The new plant with a capacity to manufacture 720mn pieces of caps per annum at a capex of Rs1.12bn is expected to commence commercial operations by Mar’17.
• Maintenance capex: Management expects the maintenance capex to be incurred across its existing facilities to be in the range of Rs400mn-500mn per annum.
We estimate HSIL to incur capex of Rs3bn in FY17 with majority of the aforementioned capex likely to be incurred in the current fiscal. FY18 capex is expected to be at Rs0.5bn, which would include maintenance capex. HSIL’s decision towards setting up a new sanitaryware plant in Gujarat is being put on hold at the moment and would open up for discussion in FY18E after taking a view on the demand environment. As capex post FY17 is expected to be significantly lower than the average capex over the past six years, we expect the company to start generating free cash and reduce debt meaningfully post FY17.

HSIL, July 8, 2016 ICICI Securities
23
Financials expected to Improve
Chart 14: Trend in revenues and revenue growth Chart 15: Trend in EBIDTA and EBIDTA growth
9%
17%
32%34%35%
20%
5% 6%3%
10%13%
0%
5%
10%
15%
20%
25%
30%
35%
40%
0
5,000
10,000
15,000
20,000
25,000
30,000
FY08
FY09
FY10
FY11
FY12
FY13
FY14
FY15
FY16
FY17
E
FY18
E
Net revenues (Rs mn) Revenue growth (RHS)
0% 2%
26%
40%42%
21%
4%-2%
31%
-5%
10%
19%
-10%
0%
10%
20%
30%
40%
50%
0
500
1,000
1,500
2,000
2,500
3,000
3,500
4,000
4,500
FY07
FY08
FY09
FY10
FY11
FY12
FY13
FY14
FY15
FY16
FY17
E
FY18
E
EBIDTA (Rs mn) EBIDTA growth (%)
Source: Company data, I-Sec research
Chart 16: EBIDTA margin trend Chart 17: Trend in PAT and PAT growth
15.7%16.7%
17.8%18.8%
17.1%
14.7%13.6%
16.8%15.3%15.7%16.6%
0.0%2.0%4.0%6.0%8.0%
10.0%12.0%14.0%16.0%18.0%20.0%
FY08
FY09
FY10
FY11
FY12
FY13
FY14
FY15
FY16
FY17
E
FY18
E
-4%18%
38%79%
20%
-12%
-59%
151%
4%25%
27%
-100%
-50%
0%
50%
100%
150%
200%
-
200
400
600
800
1,000
1,200
1,400
1,600
FY08
FY09
FY10
FY11
FY12
FY13
FY14
FY15
FY16
FY17
E
FY18
E
PAT (Rs mn) PAT growth (RHS)
Source: Company data, I-Sec research
Chart 18: PAT margin trend Chart 19: Trend in CFO and FCF
5.1%5.1%5.3%
7.1%6.4%
4.7%
1.8%
4.3%4.3%5.0%
5.7%
0.0%
1.0%
2.0%
3.0%
4.0%
5.0%
6.0%
7.0%
8.0%
FY08
FY09
FY10
FY11
FY12
FY13
FY14
FY15
FY16
FY17
E
FY18
E (4,000)
(3,000)
(2,000)
(1,000)
-
1,000
2,000
3,000
4,000
5,000
FY09 FY10 FY11 FY12 FY13 FY14 FY15 FY16
CFO (Rs mn) FCF (Rs mn)
Source: Company data, I-Sec research

HSIL, July 8, 2016 ICICI Securities
24
Chart 20: Trend in working capital days Chart 21: Trend in RoE and RoCE
-
20
40
60
80
100
120
140
160
FY08
FY09
FY10
FY11
FY12
FY13
FY14
FY15
FY16
FY17
E
FY18
E
Debtor days Inventory days
Payable days W/C days
-2.0 4.0 6.0 8.0
10.0 12.0 14.0 16.0 18.0 20.0
FY09
FY10
FY11
FY12
FY13
FY14
FY15
FY16
FY17
E
FY18
E
RoE (%) RoCE (%)
Source: Company data, I-Sec research
Chart 22: Trend in net debt/equity Chart 23: Trend in dividend payout
0.9
1.6
1.0
0.6
0.8 0.9
1.0
0.6
0.3 0.4 0.3
-
0.2
0.4
0.6
0.8
1.0
1.2
1.4
1.6
1.8
FY08 FY10 FY12 FY14 FY16 FY18E
(x)
36.0 32.5 29.5
24.6 24.6 28.3
68.0
27.3
38.0 45.7 48.2
-
10.0
20.0
30.0
40.0
50.0
60.0
70.0
80.0
FY08
FY09
FY10
FY11
FY12
FY13
FY14
FY15
FY16
FY17
E
FY18
E
(%)
Source: Company data, I-Sec research
HSIL, July 8, 2016 ICICI Securities
25
Key concerns
Prices of soda ash remain at elevated levels Prices of soda ash constitute ~18% of the cost of glass manufacturing. If soda ash prices stay at elevated levels and HSIL remains unable to undertake a price hike particularly in the liquor and beer segment, then this would adversely affect margins of the packaging products division and profitability of the company.
Competitive intensity increasing in the premium segment Around 60% of HSIL’s sanitaryware revenues accrue from the premium / super-premium segment. Competition from MNC players such as Kohler, Duravit, Toto, etc. within this segment has been increasing. Some of these companies have already set up their manufacturing base in India, which could result in high competitive intensity in the segment and therefore pressure on margins.
Home retail furnishing subsidiary continues to bleed HSIL’s home retail furnishing subsidiary, Hindware Home Retail Pvt Ltd, reported losses of Rs110mn in FY16. We however expect the subsidiary to gradually pare down its losses over the next few years with HSIL expected to gradually convert into the franchise model. In the event of losses escalating, it would adversely impact HSIL’s consolidated profits.
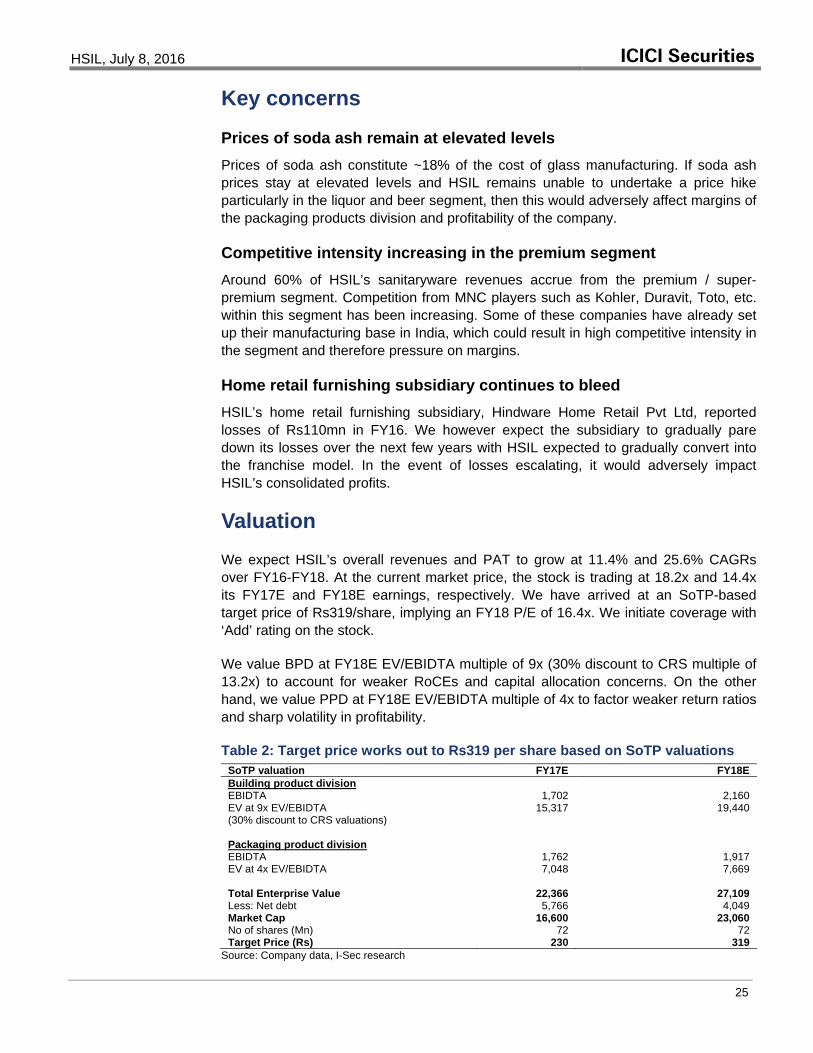
Valuation We expect HSIL’s overall revenues and PAT to grow at 11.4% and 25.6% CAGRs over FY16-FY18. At the current market price, the stock is trading at 18.2x and 14.4x its FY17E and FY18E earnings, respectively. We have arrived at an SoTP-based target price of Rs319/share, implying an FY18 P/E of 16.4x. We initiate coverage with ‘Add’ rating on the stock.
We value BPD at FY18E EV/EBIDTA multiple of 9x (30% discount to CRS multiple of 13.2x) to account for weaker RoCEs and capital allocation concerns. On the other hand, we value PPD at FY18E EV/EBIDTA multiple of 4x to factor weaker return ratios and sharp volatility in profitability.
Table 2: Target price works out to Rs319 per share based on SoTP valuations SoTP valuation FY17E FY18E Building product division EBIDTA 1,702 2,160 EV at 9x EV/EBIDTA 15,317 19,440 (30% discount to CRS valuations) Packaging product division EBIDTA 1,762 1,917 EV at 4x EV/EBIDTA 7,048 7,669 Total Enterprise Value 22,366 27,109 Less: Net debt 5,766 4,049 Market Cap 16,600 23,060 No of shares (Mn) 72 72 Target Price (Rs) 230 319
Source: Company data, I-Sec research

HSIL, July 8, 2016 ICICI Securities
26
Company background HSIL, the flagship company of the Somany Group, was the first company in India to manufacture vitreous china sanitaryware. Established in 1960, HSIL is India’s largest manufacturer of sanitaryware products, with a 26% market share of the organised industry. Over the years, HSIL has established a strong distribution network, supported by over 3,000 dealers and 19,000 retail outlets. It is also the market leader in the container glass segment in South India and the second largest player in India.
The company has five manufacturing facilities in India – three in Telangana (two container glass units and one sanitaryware unit) and one each in Haryana (sanitaryware unit) and Rajasthan (faucet unit). Apart from manufacturing sanitaryware, faucets, and container glass, HSIL’s other activities include manufacturing of PET bottles (via the acquisition of Garden Polymers) and home retail furnishing.
Table 3: HSIL’s business model Divisions Building products division Packaging products division
Products
Sanitaryware, faucets, wellness, consumer products like water heaters, air purifiers, water purifiers, kitchen chimneys, hoods and hobs, etc
Container glass and PET bottles
FY16 revenues (Rs mn) Rs10.3bn Rs9.1bn Revenue mix (%) 50 44 FY16 EBIT (Rs mn) Rs1.5bn Rs1.1bn FY16 EBIT margin (%) 14.6 12.4
Distribution model 100% sales through dealers 100% sales to original equipment manufacturers
Pricing power High Low Working capital Lower Higher
Cashflow Strong cashflows on account of sustained growth and lower working capital requirements
Weak cashflows due to dealing with OEMs and higher credit period offerings
Return ratios High Low Raw material import dependency No Yes (soda ash)
Commodity vs value addition 60% value addition (premiumisation) Largely a commodity business
Entry barriers Distribution network and branding Capital intensive and requires strong relations with OEMs
Major competitors Parryware, Cera, Kohler, Duravit, Toto, Jaquar, etc. HNGIL
Source: Company data, I-Sec research

HSIL, July 8, 2016 ICICI Securities
27
Building products division
Revenue mix: 50% of FY16 revenues Within the business products division, HSIL manufactures/deals in the following product categories:
• Sanitaryware: Manufactured as well as outsourced
• Faucets: Manufactured as well as outsourced
• Consumer products: Entirely outsourced
• Allied products: Wellness and others entirely outsourced
Chart 24: Building product offerings category-wise and brand-wise
*Wellness products sold under brands Hindware and Amore; **to be launched next year Source: Company data, I-Sec research
Sanitaryware and allied products Sanitaryware and allied products accounted for 61% of BPD revenues in FY16, which is HSIL’s core business activity. At present, its capacity in sanitaryware stands at 3.8mn pieces, spread across its two facilities in Bahadurgarh, Haryana (1.8mn pieces) and Bibinagar, Telangana (2mn pieces). The company has separate category brands for different price points: Raasi, Benelave, Hindware, Hindware Art, Hindware Italian and Queo. Over 90% of the turnover is derived from manufactured products while the rest comes through outsourcing. The company outsources its luxury brand Queo from Barwood Products, UK and some Hindware Italian models from China.

HSIL, July 8, 2016 ICICI Securities
28
Chart 25: Product offerings: Wash Basins Water Closets Urinals Bidets
Table 4: Product segments in sanitaryware segment Product segment Price range HSIL brands Competitors in respective categories Super premium Rs15,000–200,000 Queo Kohler, Duravit, Toto, and Roca Premium Rs5,000–15,000 Hindware Italian/Art American Standard, Toto, Kohler, Duravit, and Parryware Roca Standard Rs375–5,300 Hindware Parryware and Cera Basic Rs250–2,000 Hindware Parryware and Cera Low-end Rs200-550 Raasi Unorganised companies
Source: Company data, I-Sec research FY16 sanitaryware product mix: The first two categories in the above table account for 60% of turnover with the balance accruing from the last three: standard and basic at 37% and low-end at 3%. Going forward, HSIL would continue to focus on the top two categories by introducing new designs and models, which would help consolidate its position in the premium segment.
Table 5: Sanitaryware capacity location-wise
Location Capacity (mn pieces)
Capacity addition (mn pieces)
Capacity post expansion (mn pieces) Month of completion
Bahadurgarh, Haryana 1.8 0.1 1.9 Mar’17 Bibinagar, Telangana 2.0 0.3 2.3 Mar’17
Source: Company data, I-Sec research
In FY16, HSIL touched a capacity utilisation of close to 90% at both plants (Bahadurgarh and Bibinagar). With the incremental capacity addition (0.4mn pieces per annum) expected by Mar’17 and HSIL expected to grow at 5-7% in volume terms over the next three years, the company may not be required to invest in any greenfield project at least for next 2-3 years.
Faucets HSIL’s faucet segment revenues accounted for 26% of BPD revenues in FY16. This segment is increasingly becoming another focus area for HSIL. The company marked its foray into this segment in FY11 through the inorganic route, when it acquired the faucet unit of Havells India (manufacturing capacity 0.5m pieces per annum) in May’10. However, HSIL relaunched the Crabtree brand under a new name – Benelave – in Jan’11.
Chart 26: Product offerings in faucet segment Faucets Showers Stop cocks Accessories

HSIL, July 8, 2016 ICICI Securities
29
Having tested the market successfully over FY04-FY10, through outsourcing initially and then via the inorganic route, HSIL is now focusing on this segment in a big way, with a thrust on manufacturing. Its greenfield project at Bhiwadi, Rajasthan, with a manufacturing capacity of 2.5mn pieces per annum, was commissioned in Jul’14.
Table 6: Faucet capacity location-wise Location Capacity (mn pieces) Capacity utilisation Bhiwadi, Rajasthan 0.5 Temporarily shut down Kaharani, Rajasthan 2.5 60% utilisation in FY16
Source: Company data, I-Sec research The Kaharani plant is scalable to manufacture 5mn faucets per annum at an incremental capex of Rs0.7bn. The management intends to start production at the old Bhiwadi plant once it is confident that it would be able to utilise that plant to the fullest extent when the demand environment improves.
Consumer products Apart from its core products – sanitaryware and faucets – related to bathroom solution channels, HSIL is currently taking initiatives to develop two more channels in the consumer electrical and hardware space for expanding its recently launched consumer products and to-be-launched plumbing pipe products, respectively. Consumer product revenues accounted for 6% of the BPD revenues in FY16.
• Consumer electrical business: The products launched by HSIL under the consumer business till date include water heaters, air purifiers, kitchen chimneys, hoods and hobs, etc. The company is expected to launch water purifiers soon. It has tied up with Groupe Atlantic of France for water heaters and the Indian subsidiary of The Marmon Group (a subsidiary of Bershire Hathway, US) for water purification products. Though consumer electrical segment was loss-making for HSIL in FY16, the management expects it to turn EBIDTA breakeven in FY18.
Chart 27: Product offerings in the consumer electrical segment
Water heater Air cooler Air purifier Kitchen hoods
Source: Company data, I-Sec research
• Consumer hardware business: HSIL’s imminent entry into the pipes business will be a further extension to its building product portfolio. The company will leverage its existing sales and distribution network for marketing the piping products. HSIL is already in the process of creating a hardware channel for marketing its plumbing pipe products. It is setting up a PVC/CPVC pipes unit in Telangana in South India, which is expected to commence operations by Mar’17 at a capex of Rs1.05bn.

HSIL, July 8, 2016 ICICI Securities
30
Wellness and others HSIL outsources and sells other products like bath tubs, showers, enclosures, etc., which accounted for 3% of the BPD revenues in FY16. Wellness products are sold under the brands Hindware and Amore. While mass to premium segment products are sold under brand Hindware, the luxury products are sold under the brand Amore.
Chart 28: Product offerings in the wellness segment
Massage tub Shower enclosure Multipurpose shower enclosure Shower panel
Packaging products division
Revenue mix: 44% of FY16 revenues
HSIL’s packaging product division comprises of two business segments: Container glass segment HSIL is the second-largest manufacturer of container glass bottles in India, with a domestic market share of 17%. It remains the largest manufacturer in the South – India’s largest container glass market, with a dominant market share. The company markets its products under the brand name AGI. Its product range caters to user industries like beer and liquor, food and beverages, and pharmaceuticals among others.
Chart 29: HSIL’s product range in the container glass segment
Source: Company data, I-Sec research

HSIL, July 8, 2016 ICICI Securities
31
Table 7: HSIL’s container glass facilities and installed capacities Location Capacity (in tpd) Furnaces (nos)Hyderabad, Telangana 650 2 Bhongir, Telangana 950 2 Total 1,600 4
Source: Company data, I-Sec research Strategic location of plants: The container glass division has two manufacturing facilities strategically located at Hyderabad and Bhongir, both in Telangana, which is the largest consumer of liquor, beer and soft beverages in the country. The division generated over 50% of its revenues from the beer and liquor segment while beverages, pharmaceuticals and the food segment accounted for the rest.
Since freight cost is an important consideration in this segment and transporting container glass over large distances is not feasible, HSIL enjoys a strategic competitive advantage, with its manufacturing facilities in Telangana – the largest market for container glass. It has the largest installed capacity of 1,600tpd in South India. HNGIL is the other recognised player in the region, with an existing capacity of 1,010tpd. Together, both players constitute 90% of current capacity in the southern region, making it practically a duopoly.
Garden Polymers segment In Aug’11, HSIL acquired 100% stake in Garden Polymers Pvt Ltd, via a share purchase agreement. Garden Polymers is engaged in the business of manufacturing PET bottles, caps and closures, with plants at Dharwad (Karnataka) and Selaqui (Uttarakhand). It is a leading supplier to premier customers in the liquor, pharmaceutical and FMCG industries, and was merged with HSIL in FY14.
Chart 30: Product offerings Pharmaceutical and
Healthcare Alco-beverages Personal care Caps and closures
Source: Company data, I-Sec research
This acquisition of Garden Polymers synergised with HSIL’s container glass division, which supplies to a similar set of customers. This further strengthens the company’s position as a packaging solutions provider. This division reported net revenues of ~Rs1bn in FY16.

HSIL, July 8, 2016 ICICI Securities
32
Others
Revenue mix: 6% of FY16 revenues HSIL operates its home retail furnishing business via its wholly-owned subsidiary HHRPL Hindware Home Retail Pvt Ltd. Currently, the company has 13 mega stores under the brand name Evok. This segment accounted for 6% of FY16 consolidated revenues. Furniture accounts for ~60-70% of sales and is mostly imported from Malaysia and Indonesia. Evok is a chain of specialty home furnishing mega stores, showcasing a range of over 20,000 home interior products. This segment posted a loss of Rs110mn in FY16.

HSIL, July 8, 2016 ICICI Securities
33
Key milestones
Source: Company data, I-Sec research

HSIL, July 8, 2016 ICICI Securities
34
Financial summary Table 8: Profit and Loss Statement (Rs mn, year ending Mar 31)
FY14 FY15 FY16 FY17E FY18E Net Sales 18,279 19,421 20,019 22,027 24,830 Add: Other Operating Income 303 385 542 - - Net revenue 18,582 19,806 20,561 22,027 24,830
Less: Cost of goods sold 6,475 7,315 7,627 8,767 9,874 Employee cost 1,884 2,159 2,510 2,864 3,278 Others 7,689 7,006 7,273 6,932 7,561
Total Operating Expenses 16,049 16,481 17,409 18,563 20,712
EBITDA 2,533 3,325 3,152 3,465 4,117
Depreciation 1,101 1,250 1,202 1,235 1,483 Other income 38 36 35 40 40
EBIT 1,470 2,111 1,985 2,270 2,675
Less: Financial expenses 718 775 412 500 470
Recurring Pre-tax Income 752 1,335 1,573 1,769 2,204
Less: Taxation 412 481 683 659 800 Less: Minority Interest / Subsidiary loss - - - - - Net Income (Reported) 340 854 890 1,110 1,405
Extraordinary Items - - - - -
Recurring Net Income 340 854 890 1,110 1,405 Source: Company data, I-Sec research

HSIL, July 8, 2016 ICICI Securities
35
Table 9: Balance Sheet (Rs mn, year ending Mar 31)
FY14 FY15 FY16 FY17E FY18E ASSETS Current Assets, Loan & Advances Inventories 4,443 4,744 4,901 5,371 5,918 Sundry debtors 4,192 4,138 3,901 4,224 4,626 Cash and bank balances 603 251 199 334 301 Other current assets 39 35 22 22 22 Loans and advances 968 816 935 1,050 1,250 Total Current Assets 10,245 9,984 9,957 11,001 12,117
Current Liabilities & Provisions Current Liabilities 1,502 1,451 1,583 1,810 2,041 Provisions and other liabilities 2,472 2,723 4,428 5,325 6,250 Total Current Liabilities & Provisions 3,975 4,174 6,011 7,135 8,291
Net Current Assets 6,270 5,810 3,946 3,866 3,826
Investments 109 109 108 108 108
Fixed Assets Gross block 20,669 22,599 23,707 26,707 27,207 Less : depreciation 5,510 6,752 7,954 9,189 10,671 Net block 15,159 15,847 15,753 17,518 16,535 CWIP 1,195 335 - - -
Goodwill 35 35 - - -
Total Assets 22,767 22,136 19,807 21,492 20,470
LIABILITIES AND SHAREHOLDERS' EQUITY Shareholders Fund Equity share capital 132 145 145 145 145 Reserves and surplus 10,151 13,086 13,635 14,237 14,965 Total Shareholders Fund 10,283 13,231 13,779 14,382 15,110
Borrowings Secured loans 7,303 3,884 2,934 2,750 1,750 Unsecured loans 4,027 3,976 2,084 3,350 2,600 Total Borrowings 11,330 7,860 5,018 6,100 4,350
Deferred Tax Liability 1,154 1,045 1,010 1,010 1,010 Minority Interest - - - - -
Total Liabilities & Shareholders' Equity 22,767 22,136 19,807 21,492 20,470 Source: Company data, I-Sec research

HSIL, July 8, 2016 ICICI Securities
36
Table 10: Cashflow Statement (Rs mn, year ending Mar 31)
FY14 FY15 FY16 FY17E FY18E Cash Flow from Operating Activities PAT 340 854 890 1,110 1,405 Add: Depreciation 1,101 1,250 1,202 1,235 1,483 Add: Other Operating activities (64) (182) (4) 0 (0) Operating Cash Flow Before Working Capital change (a) 1,377 1,923 2,088 2,345 2,887
Changes in Working Capital (Increase) / Decrease Trade & 0th receivables (298) 54 237 (324) (401) (Increase) / Decrease Inventories (377) (300) (157) (471) (547) Increase / (Decrease) Current liab and provisions 20 199 1,837 1,124 1,155 Others 681 155 (70) (115) (200) Working Capital Inflow / (Outflow) (b) 26 108 1,847 215 7
Net Cash flow from Operating Activities (a) + (b) 1,403 2,030 3,936 2,560 2,894
Cash Flow from Capital commitments (c) (2,390) (1,070) (773) (3,000) (500)
Free Cash flow after capital commitments (a) + (b) + (c) (987) 960 3,163 (440) 2,394
Cash Flow from Investing Activities Purchase of Investments (0) (0) 0 - - Change in goodwill - - - - - Net Cash flow from Investing Activities (d) (0) (0) 0 - -
Cash Flow from Financing Activities Equity raised/(repaid) - 2,500 - - - Proceeds from fresh borrowings 989 (3,470) (2,842) 1,082 (1,750) Dividend paid including tax and others (231) (233) (338) (508) (677) Net Cash flow from Financing Activities (e) 758 (1,203) (3,180) 574 (2,427)
Change in Deferred Tax Liability (f) 13 (109) (35) - -
Total Increase / (Decrease) in Cash (217) (352) (52) 135 (33) (a) + (b) + (c) +(d) + (e) + (f) Opening Cash and Bank balance 820 603 251 199 334 Closing Cash and Bank balance 603 251 199 334 301 Increase / (Decrease) in Cash and Bank balance (217) (352) (52) 135 (33)
Source: Company data, I-Sec research

HSIL, July 8, 2016 ICICI Securities
37
Table 11: Key ratios (year ending Mar 31)
FY14 FY15 FY16 FY17E FY18E Per Share Data (Rs) EPS 5.1 11.8 12.3 15.4 19.4 Cash EPS 21.8 29.1 28.9 32.4 39.9 Dividend per share (DPS) 3.0 2.8 4.0 6.0 8.0 Book Value per share (BV) 106.8 138.4 190.6 198.9 209.0
Growth (%) Net Sales 5.3 6.2 3.1 10.0 12.7 EBITDA (2.1) 31.3 (5.2) 9.9 18.8 PAT (58.6) 151.4 4.2 24.7 26.5 Cash EPS (17.8) 33.4 (0.6) 12.1 23.1
Valuation Ratios (x) P/E 54.2 23.6 22.7 18.2 14.4 P/CEPS 12.8 9.6 9.6 8.6 7.0 P/BV 2.6 2.0 1.5 1.4 1.3 EV / EBITDA 11.5 8.4 7.9 7.5 5.9 EV / Sales 1.6 1.4 1.2 1.2 1.0
Operating Ratio Raw Material / Sales (%) 35.4 37.7 38.1 39.8 39.8 Employee cost / Sales (%) 10.3 11.1 12.5 13.0 13.2 SG&A / Sales (%) 8.7 10.3 - 11.0 10.7 Other Income / PBT (%) 5.1 2.7 2.2 2.3 1.8 Effective Tax Rate (%) 54.8 36.0 43.4 37.3 36.3 Working Capital (days) 142.4 139.6 131.6 129.0 125.0 Inventory Turnover (days) 88.7 89.2 89.4 89.0 87.0 Receivables (days) 83.7 77.8 71.1 70.0 68.0 Payables (days) 30.0 27.3 28.9 30.0 30.0 Net D/E Ratio (x) 1.0 0.6 0.3 0.4 0.3
Return/Profitability Ratio (%) Net Income Margins 1.8 4.3 4.3 5.0 5.7 RoACE * 7.7 10.9 10.2 10.9 12.6 RoAE 3.3 7.3 6.6 7.9 9.5 Dividend Payout 68.0 27.3 38.0 45.7 48.2 Dividend Yield 1.0 1.0 1.4 2.1 2.8 EBITDA Margins 13.6 16.8 15.3 15.7 16.6
* RoACE for FY17 and FY18 would stand higher by 270bps and 310bps, respectively had Business Reconstruction Reserve been net-off from reserves and surplus while calculating the capital employed of the company Source: Company data, I-Sec research

HSIL, July 8, 2016 ICICI Securities
38
Index of tables and charts
Tables Table 1: HSIL’s deeply entrenched network ....................................................................... 20 Table 2: Target price works out to Rs319 per share based on SoTP valuations ............... 25 Table 3: HSIL’s business model ......................................................................................... 26 Table 4: Product segments in sanitaryware segment ......................................................... 28 Table 5: Sanitaryware capacity location-wise ..................................................................... 28 Table 6: Faucet capacity location-wise ............................................................................... 29 Table 7: HSIL’s container glass facilities and installed capacities ...................................... 31 Table 8: Profit and Loss Statement .................................................................................... 34 Table 9: Balance Sheet ....................................................................................................... 35 Table 10: Cashflow Statement ............................................................................................ 36 Table 11: Key ratios ............................................................................................................ 37
Charts Chart 1: Increasing premiumisation over the years ............................................................ 13 Chart 2: Trend in sanitaryware segment revenues ............................................................. 14 Chart 3: Faucet revenues to grow at 22.5% CAGR over FY16-FY18 ................................ 15 Chart 4: Expect BPD revenues from to grow at 17.2% CAGR over FY16-FY18 ............... 16 Chart 5: Changing of margin trajectory in phases .............................................................. 16 Chart 6: Trend in BPD EBIT margins .................................................................................. 17 Chart 7: Revenue trend in PPD over FY08–FY18E ........................................................... 19 Chart 8: EBIT trend in PPD over FY08–FY18E .................................................................. 19 Chart 9: Reaping the benefits of aggressive advertising and promotion spends ............... 20 Chart 10: Bollywood celebrities endorsing HSIL brands .................................................... 21 Chart 11: Active participation in various building material exhibitions ................................ 21 Chart 12: Rich clientele in PPD as well .............................................................................. 21 Chart 13: Capex intensity to taper off by FY18 ................................................................... 22 Chart 14: Trend in revenues and revenue growth .............................................................. 23 Chart 15: Trend in EBIDTA and EBIDTA growth ................................................................ 23 Chart 16: EBIDTA margin trend .......................................................................................... 23 Chart 17: Trend in PAT and PAT growth ............................................................................ 23 Chart 18: PAT margin trend ................................................................................................ 23 Chart 19: Trend in CFO and FCF ....................................................................................... 23 Chart 20: Trend in working capital days ............................................................................. 24 Chart 21: Trend in RoE and RoCE ..................................................................................... 24 Chart 22: Trend in net debt/equity ...................................................................................... 24 Chart 23: Trend in dividend payout ..................................................................................... 24 Chart 24: Building product offerings category-wise and brand-wise .................................. 27 Chart 25: Product offerings: ................................................................................................ 28 Chart 26: Product offerings in faucet segment ................................................................... 28 Chart 27: Product offerings in the consumer electrical segment ........................................ 29 Chart 28: Product offerings in the wellness segment ......................................................... 30 Chart 29: HSIL’s product range in the container glass segment ........................................ 30 Chart 30: Product offerings ................................................................................................. 31

39
Market Cap Rs31.8bn/US$472mn Year to Mar FY15 FY16 FY17E FY18EReuters/Bloomberg CERA.BO / CRS IN Revenue (Rs mn) 8,217 9,337 10,764 12,596Shares Outstanding (mn) 13.0 Rec. Net Income (Rs mn) 677 835 1,029 1,30452-week Range (Rs) 2464/1578 EPS (Rs) 52.0 64.2 79.2 100.3Free Float (%) 45.3 % Chg YoY 26.8 23.4 23.3 26.7FII (%) 13.9 P/E (x) 47.0 38.1 30.9 24.4Daily Volume (US$/'000) 363 CEPS (Rs) 63.9 76.7 93.6 118.8Absolute Return 3m (%) 38.3 EV/E (x) 27.4 22.5 18.6 14.9Absolute Return 12m (%) 33.1 Dividend Yield (%) 0.2 0.4 0.5 0.6Sensex Return 3m (%) 10.9 RoCE (%) 29.4 27.6 28.3 30.2Sensex Return 12m (%) (2.0) RoE (%) 23.5 21.2 21.5 22.6
Equity Research July 8, 2016 BSE Sensex: 27201
Sanitaryware Target price Rs2,506 Shareholding pattern
Sep ’15
Dec ’15
Mar ’16
Promoters 54.8 54.8 54.8 Institutional investors 20.0 20.3 20.4 MFs and UTI 4.4 4.7 4.6 FIs/Banks 1.0 1.4 1.9 Insurance 0.2 0.1 0.4 FIIs 14.7 14.1 13.9 Others 25.2 24.9 24.9
Source: NSE Price chart
0 500
1000 1500 2000 2500 3000
Jul-1
3Ja
n-14
Jul-1
4Ja
n-15
Jul-1
5D
ec-1
5Ju
n-16
(Rs.
)
Cera Sanitaryware HOLD Emerging as a focused bathroom solution player Rs2,446Reason for report: Initiating coverage
Research Analysts:
Nehal Shah [email protected] +91 22 6637 7235
We are structurally positive on the business prospects of Cera Sanitaryware(CRS) due to its growing brand equity, increasing distribution network, soundmanagement credibility, and scalability of business model. Besides its coreexpertise in the sanitaryware segment, CRS is fast emerging as a strongbathroom solution provider as it is intensifying focus into allied products viz.faucets through in-house manufacturing, and tiles through a mix of joint ventureand outsourcing model. Further, lower gas prices, employee linked productivitymeasures and increasing premiumisation, higher utilisation in the faucetssegment and scaling up of joint venture model in tiles are expected to drivemargins and profitability going forward. We expect top line and bottom line towitness CAGR of 16.2% and 25% respectively over FY16-FY18E with ROCEsexpected to improve 260bps to 30.2%. The stock currently trades at 24.4x itsFY18E earnings of Rs 100.3. We initiate coverage with a HOLD on CRS and targetprice of Rs 2,506, valuing it at 25x FY18E earnings.
Growth in allied products expected to drive overall growth. The growth in thecore sanitaryware segment is expected to remain in high single digits led by therecent slowdown woes. However, by intensifying focus in faucets via manufacturingmodel and tiles through both trading and joint venture model, CRS is positioningitself as a complete bathroom solutions provider. While sanitaryware and alliedproducts account for 60% of revenues currently, faucets and tiles account for 23%and 15% of overall revenues, respectively. With the company expected to ramp upproduction in faucet unit and tiles likely to gain traction post the recentcommissioning of Anjani Tiles in Andhra Pradesh, these product segments are likelyto supplement company’s overall growth. We expect CRS to report 16.2% revenueCAGR over FY16-FY18E.
Focus back on profitable growth. CRS witnessed a margin decline from 18.8% inFY11 to 14.3% in FY15 which recovered partially to 15.1% in FY16. We expectmargins to gain traction over the next two years led by a) lower gas prices, b)employee linked productivity measures resulting in lower wastages and higherefficiency, c) increasing premiumisation across product categories, d) higherutilisation in the faucets segment, and e) scaling up of joint venture model in tiles.With this, we expect CRS margins to improve by 190bps to 17% over the next twoyears. Strong operating performance is also expected to drive CRS bottomline by25% CAGR over FY16-FY18E.
Strong financial discipline with impressive return ratios. The asset light modelof CRS has enabled it to generate strong RoCE in excess of 28% over the last fiveyears. With the trend in outsourcing likely to sustain and focus intensifying onprofitable growth, we expect RoCEs to improve over 260bps to over 30% by FY18E,thereby sustaining higher valuations.
INDIA

Cera Sanitaryware, July 8, 2016 ICICI Securities
40
TABLE OF CONTENTS Strong brand in mass market space ............................................................................ 41 Moving towards premiumisation – premium and luxury segments ......................... 43 Focus on branding and advertising contributes to growing brand awareness ...... 44 Increasing reach through distribution ......................................................................... 46 Strong growth in allied products to offset tepid growth in core sanitaryware segment .......................................................................................................................... 47 Asset light model leading to strong RoCEs ................................................................ 49 Focus on EBIDTA margins and working capital discipline ....................................... 50 Improving financials ...................................................................................................... 52 Investment concerns ..................................................................................................... 54 Valuations ....................................................................................................................... 54 Company background ................................................................................................... 55
Management bandwidth ................................................................................................ 56
Financial summary ........................................................................................................ 58 Index of tables and charts ............................................................................................. 62
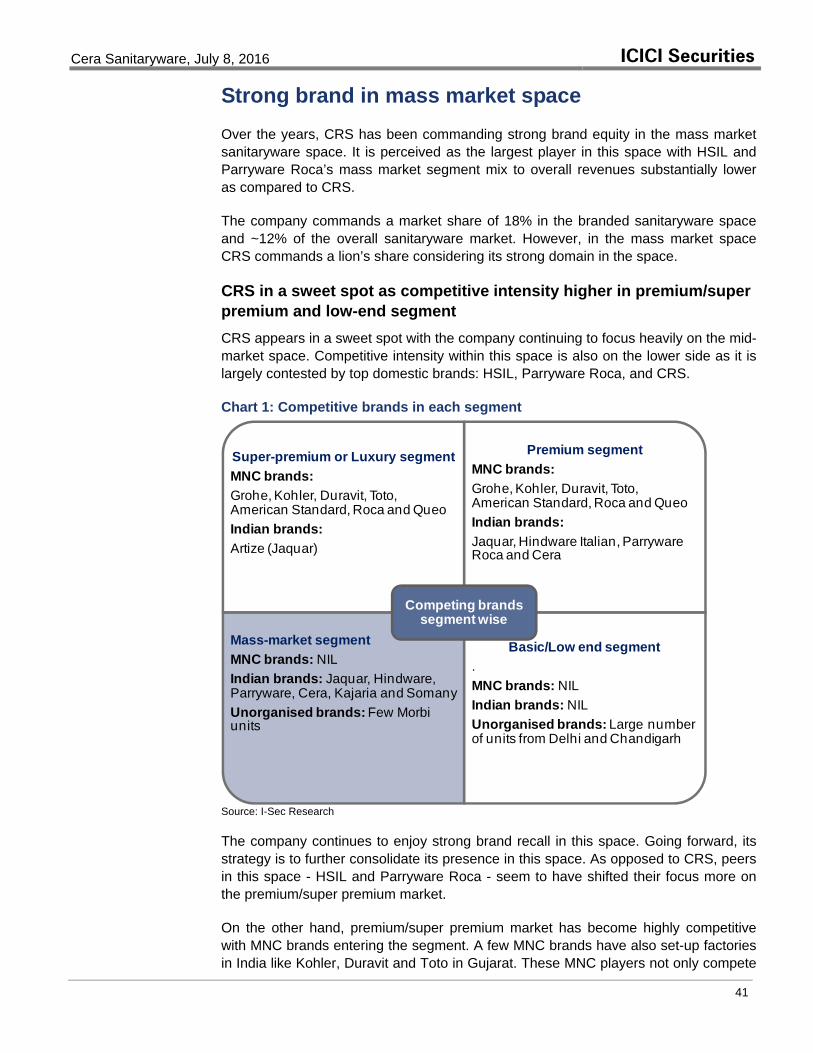
Cera Sanitaryware, July 8, 2016 ICICI Securities
41
Strong brand in mass market space Over the years, CRS has been commanding strong brand equity in the mass market sanitaryware space. It is perceived as the largest player in this space with HSIL and Parryware Roca’s mass market segment mix to overall revenues substantially lower as compared to CRS.
The company commands a market share of 18% in the branded sanitaryware space and ~12% of the overall sanitaryware market. However, in the mass market space CRS commands a lion’s share considering its strong domain in the space.
CRS in a sweet spot as competitive intensity higher in premium/super premium and low-end segment CRS appears in a sweet spot with the company continuing to focus heavily on the mid-market space. Competitive intensity within this space is also on the lower side as it is largely contested by top domestic brands: HSIL, Parryware Roca, and CRS.
Chart 1: Competitive brands in each segment
Super-premium or Luxury segmentMNC brands:Grohe, Kohler, Duravit, Toto, American Standard, Roca and QueoIndian brands: Artize (Jaquar)
Premium segmentMNC brands:Grohe, Kohler, Duravit, Toto, American Standard, Roca and QueoIndian brands: Jaquar, Hindware Italian, ParrywareRoca and Cera
Mass-market segmentMNC brands: NILIndian brands: Jaquar, Hindware, Parryware, Cera, Kajaria and SomanyUnorganised brands: Few Morbiunits
Basic/Low end segment.MNC brands: NILIndian brands: NILUnorganised brands: Large number of units from Delhi and Chandigarh
Competing brands segment wise
Source: I-Sec Research The company continues to enjoy strong brand recall in this space. Going forward, its strategy is to further consolidate its presence in this space. As opposed to CRS, peers in this space - HSIL and Parryware Roca - seem to have shifted their focus more on the premium/super premium market.
On the other hand, premium/super premium market has become highly competitive with MNC brands entering the segment. A few MNC brands have also set-up factories in India like Kohler, Duravit and Toto in Gujarat. These MNC players not only compete

Cera Sanitaryware, July 8, 2016 ICICI Securities
42
amongst themselves but also with the top three domestic brands in this space. The low-end market segment largely comprises unbranded units, which are large in numbers, spread across Morbi, Wankaner and Thangad areas of Gujarat. Competition here is much higher as compared to mid-market or premium segments.
Also, in the current economic scenario, the mass segment is expected to outpace the premium/luxury market led by a) Government’s focus on affordable housing; b) increasing infrastructure activities in Tier 2 and 3 cities as opposed to sustained slowdown in Tier 1 cities and metros; and c) increasing shift from unbranded to branded products in the mass market space.

Cera Sanitaryware, July 8, 2016 ICICI Securities
43
Moving towards premiumisation – premium and luxury segments In order to have presence across the entire value chain and offer complete bouquet of sanitaryware products, CRS has over the last three years become aggressive in launching premium products to gain some traction in the premium sanitaryware segment. The aggressive branding measures including advertising campaigns and related promotional activities have resulted in increasing contribution from premium products to 30% in FY16 vs. 20% in FY13.
Recently forayed into luxury sanitaryware segment with the launch of ISVEA brand CRS entered a marketing agreement with ECE Banyo, the owners of Italian Luxury Sanitaryware brand ISVEA for a period of 5 years, which can be extended later, exclusively for sales, distribution and marketing of ISVEA brand in India. Products of ISVEA brand are designed by well-known Italian designers giving it an individualistic and unique aesthetic look. The ISVEA brand was launched by the Company in Apr’16 in India. The agreement between the two brands is not only to market ISVEA’s products in India but also promote CRS’ products in EU markets.
Chart 2: Recent launch of brand ISVEA at the CREDAI NATCON event in Istanbul
Source: I-Sec Research ISVEA established in 1962 in Italy, is better known for its impressive designers. Most product ranges of ISVEA have bagged design awards, including the prestigious Red Dot. Some technologically advanced products that ISVEA would launch are CleaRim WCs (rimless hygienic WCs), Aquaplus WCs (water-saving WCs using 2.7 litres of water), DecorPlus (printed washbasins), SmartPlus (with built-in personal hygiene), Softclose (with noiseless closure lids), SterilPlus (bacteria-free product) and e-Motion (height-adjustable WC and washbasin).
With the company gradually moving towards premiumisation – premium as well as luxury segments, we expect CRS’ contribution to premium and luxury segments to increase from current 30% to 40% in FY18E. This would increase the company’s realisations and also turn out to be margin accretive over the next few years.

Cera Sanitaryware, July 8, 2016 ICICI Securities
44
Focus on branding and advertising contributes to growing brand awareness CRS has been spending ~4% of revenues on branding and promotional activities yearly to create a brand recall in consumers’ minds. Three years ago, it roped in Bollywood celebrity Sonam Kapoor as brand ambassador, replacing Dia Mirza. It also launched advertisements in general entertainment channels along with niche branding measures like in-film branding (Heroine released in 2012) and co-sponsoring realty shows (Nach Baliye 6) to aid its growing brand visibility.
Chart 3: Advertisement and promotional campaigns: Aggression displayed over the last three years
Advertisement campaign in 2010 targeted in select news and business
channels
May-12: New TV commercial with Dia Mirza
Aug-12: In-film branding where Kareena Kapoor was shown launching a Cera
Bath Studio in movie Heroine Oct-13: TV commercial with Sonam
Kapoor as brand ambassador
Co-sponsoring a realty show on a
general entertainment channel (Nach Baliye 6 being aired on Star Plus)
Promotion of faucets and tiles with brand ambassador Sonam Kapoor
Source: Company
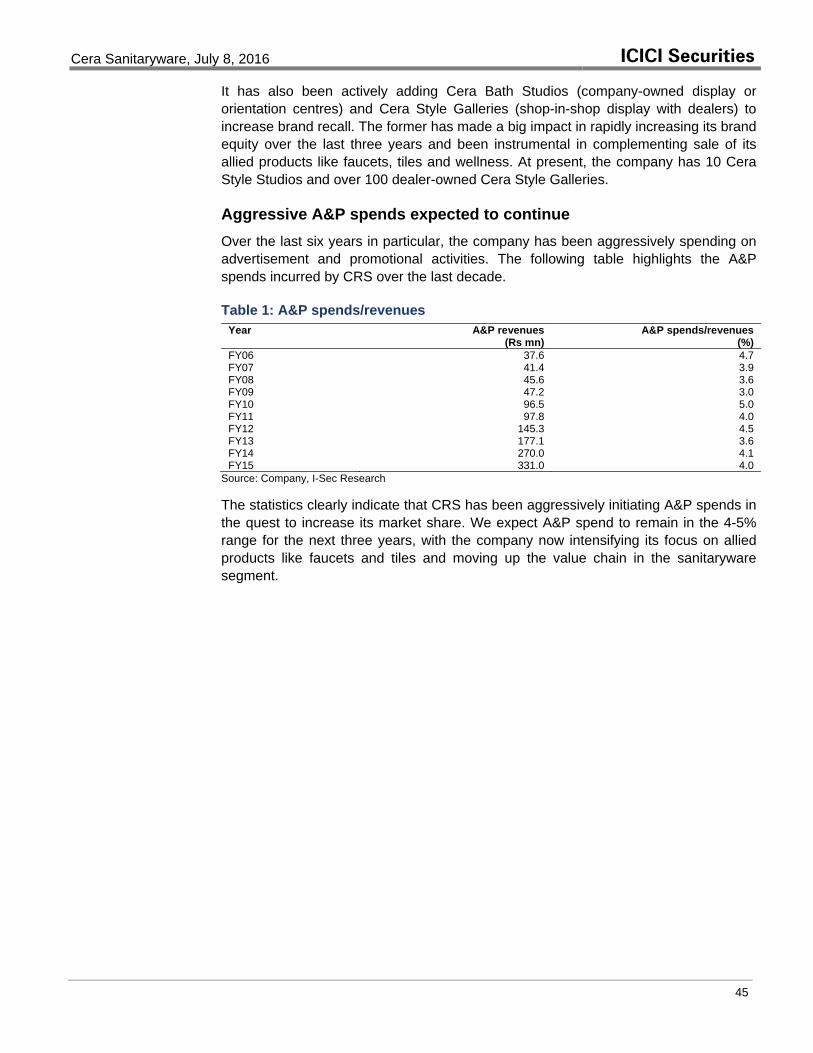
Cera Sanitaryware, July 8, 2016 ICICI Securities
45
It has also been actively adding Cera Bath Studios (company-owned display or orientation centres) and Cera Style Galleries (shop-in-shop display with dealers) to increase brand recall. The former has made a big impact in rapidly increasing its brand equity over the last three years and been instrumental in complementing sale of its allied products like faucets, tiles and wellness. At present, the company has 10 Cera Style Studios and over 100 dealer-owned Cera Style Galleries.
Aggressive A&P spends expected to continue Over the last six years in particular, the company has been aggressively spending on advertisement and promotional activities. The following table highlights the A&P spends incurred by CRS over the last decade.
Table 1: A&P spends/revenues
Source: Company, I-Sec Research The statistics clearly indicate that CRS has been aggressively initiating A&P spends in the quest to increase its market share. We expect A&P spend to remain in the 4-5% range for the next three years, with the company now intensifying its focus on allied products like faucets and tiles and moving up the value chain in the sanitaryware segment.
Year A&P revenues (Rs mn)
A&P spends/revenues (%)
FY06 37.6 4.7 FY07 41.4 3.9 FY08 45.6 3.6 FY09 47.2 3.0 FY10 96.5 5.0 FY11 97.8 4.0 FY12 145.3 4.5 FY13 177.1 3.6 FY14 270.0 4.1 FY15 331.0 4.0
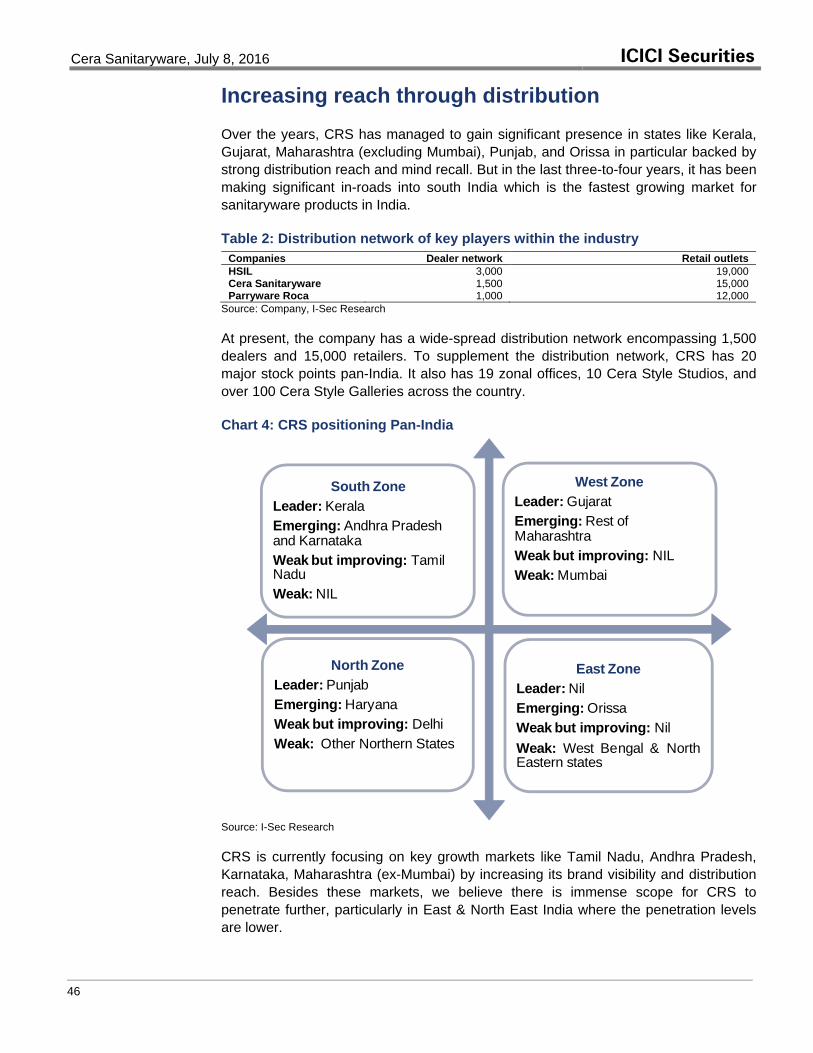
Cera Sanitaryware, July 8, 2016 ICICI Securities
46
Increasing reach through distribution Over the years, CRS has managed to gain significant presence in states like Kerala, Gujarat, Maharashtra (excluding Mumbai), Punjab, and Orissa in particular backed by strong distribution reach and mind recall. But in the last three-to-four years, it has been making significant in-roads into south India which is the fastest growing market for sanitaryware products in India.
Table 2: Distribution network of key players within the industry Companies Dealer network Retail outlets HSIL 3,000 19,000 Cera Sanitaryware 1,500 15,000 Parryware Roca 1,000 12,000
Source: Company, I-Sec Research At present, the company has a wide-spread distribution network encompassing 1,500 dealers and 15,000 retailers. To supplement the distribution network, CRS has 20 major stock points pan-India. It also has 19 zonal offices, 10 Cera Style Studios, and over 100 Cera Style Galleries across the country.
Chart 4: CRS positioning Pan-India
South ZoneLeader: KeralaEmerging: Andhra Pradesh and KarnatakaWeak but improving: Tamil NaduWeak: NIL
West ZoneLeader: Gujarat Emerging: Rest of MaharashtraWeak but improving: NIL Weak: Mumbai
North ZoneLeader: PunjabEmerging: HaryanaWeak but improving: DelhiWeak: Other Northern States
East ZoneLeader: NilEmerging: OrissaWeak but improving: NilWeak: West Bengal & NorthEastern states
Source: I-Sec Research CRS is currently focusing on key growth markets like Tamil Nadu, Andhra Pradesh, Karnataka, Maharashtra (ex-Mumbai) by increasing its brand visibility and distribution reach. Besides these markets, we believe there is immense scope for CRS to penetrate further, particularly in East & North East India where the penetration levels are lower.

Cera Sanitaryware, July 8, 2016 ICICI Securities
47
Strong growth in allied products to offset tepid growth in core sanitaryware segment Currently the core sanitaryware segment (60% of revenues) is growing in higher single digits as opposed to 24% revenue CAGR witnessed over FY12-FY16. This is largely attributed to slowdown in the real estate sector. However, company’s increasing penetration and strong growth in the faucets and tiles segment over the past few years is expected to offset tepid growth in core business and drive overall growth going forward.
By intensifying its focus on allied products like faucets (through manufacturing model in the recent past) and tiles (through 51% JV model), CRS is positioning itself as a complete bathroom solutions provider. Currently, while sanitaryware accounts for 60% of revenues, faucets and tiles account for 23% and 15% of overall revenues, respectively. With the company expected to increase capacities in faucets and the newly acquired JV in tiles segment expected to ramp up production, both these categories are likely to supplement overall growth of the company.
Faucet segment: Having test marketed the product initially, CRS ventured into manufacturing of faucets in FY11 at Kadi, adjoining its sanitaryware facility, the capacity of which is scalable to 10,000 pieces per day. The company caters to the upper and lower mid-market segments through its manufacturing and outsourcing model, respectively, while importing some high-end faucets from China to cater to the premium market. The current capacity of the plant stands at 7,200 pieces per day while the company operated at over 75% capacity utilisation in FY16. The faucets revenues in FY16 stood at Rs 2.2bn and have witnessed 64% CAGR over FY12-FY16.
Chart 5: Scaling up in faucets segment over the last five years
127%
59%
43% 40%30% 25%
0%
20%
40%
60%
80%
100%
120%
140%
0
500
1,000
1,500
2,000
2,500
3,000
3,500
4,000
FY12 FY13 FY14 FY15 FY16 FY17E FY18E
Faucet revenues (Rs mn) Growth (%)
Source: Company, I-Sec Research We expect the company to increase its faucet capacity to 10,000 pieces per day in FY18E at a significantly lower cost which is expected to be RoCE accretive for the company. Margins too are expected to improve led by increasing premiumisation and higher capacity utilisation.
Tiles segment: CRS ventured into trading of tiles in FY13. Over the last three years, the company has been outsourcing ceramic wall and vitrified floor tiles from Morbi units and selling it through its existing distribution network. After testing the market for
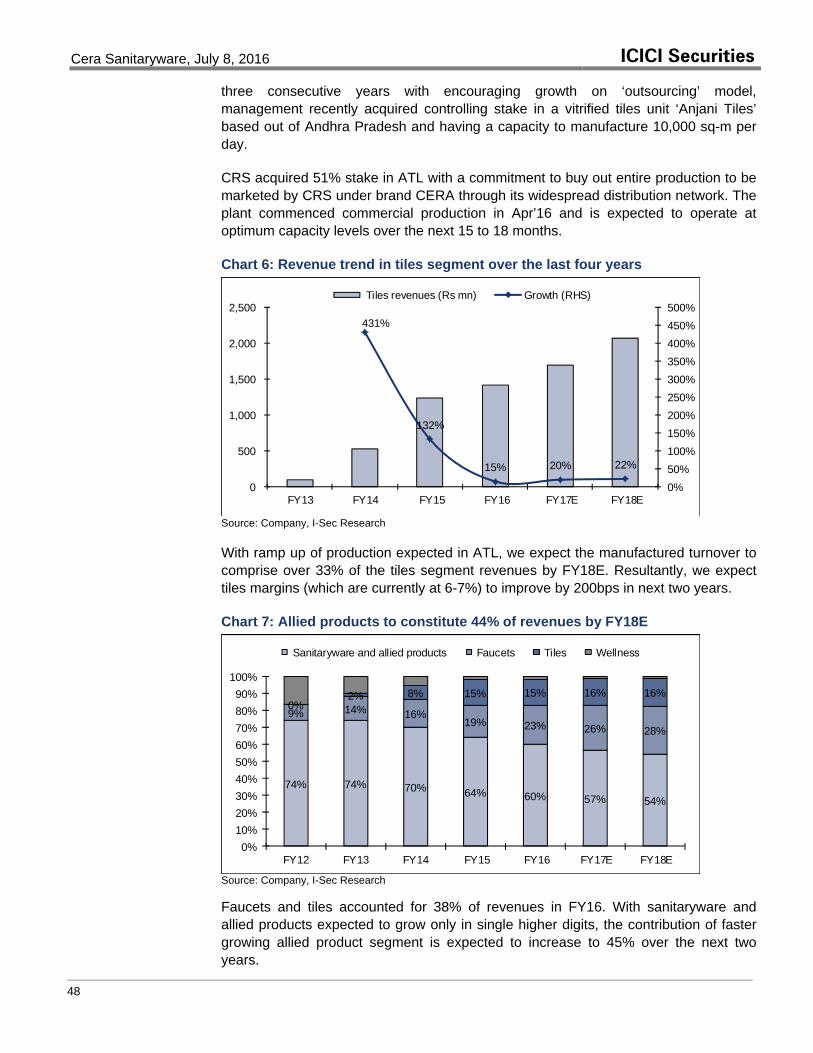
Cera Sanitaryware, July 8, 2016 ICICI Securities
48
three consecutive years with encouraging growth on ‘outsourcing’ model, management recently acquired controlling stake in a vitrified tiles unit ‘Anjani Tiles’ based out of Andhra Pradesh and having a capacity to manufacture 10,000 sq-m per day.
CRS acquired 51% stake in ATL with a commitment to buy out entire production to be marketed by CRS under brand CERA through its widespread distribution network. The plant commenced commercial production in Apr’16 and is expected to operate at optimum capacity levels over the next 15 to 18 months.
Chart 6: Revenue trend in tiles segment over the last four years
431%
132%
15% 20% 22%
0%50%100%150%200%250%300%350%400%450%500%
0
500
1,000
1,500
2,000
2,500
FY13 FY14 FY15 FY16 FY17E FY18E
Tiles revenues (Rs mn) Growth (RHS)
Source: Company, I-Sec Research With ramp up of production expected in ATL, we expect the manufactured turnover to comprise over 33% of the tiles segment revenues by FY18E. Resultantly, we expect tiles margins (which are currently at 6-7%) to improve by 200bps in next two years.
Chart 7: Allied products to constitute 44% of revenues by FY18E
74% 74% 70% 64% 60% 57% 54%
9% 14% 16%19% 23% 26% 28%
0%2% 8% 15% 15% 16% 16%
0%10%20%30%40%50%60%70%80%90%
100%
FY12 FY13 FY14 FY15 FY16 FY17E FY18E
Sanitaryware and allied products Faucets Tiles Wellness
Source: Company, I-Sec Research Faucets and tiles accounted for 38% of revenues in FY16. With sanitaryware and allied products expected to grow only in single higher digits, the contribution of faster growing allied product segment is expected to increase to 45% over the next two years.

Cera Sanitaryware, July 8, 2016 ICICI Securities
49
Asset light model leading to strong RoCEs Over the years CRS has been focusing on the outsourcing model across its business verticals by leveraging its strong brand in the sanitaryware space. In FY16, manufactured turnover in sanitaryware segment accounted for 70% while outsourcing, including imports, accounted for 30% of FY16 sanitaryware revenues. In faucet, outsourcing accounted for 50% of FY16 segmental revenues. On the other hand, the entire tiles segment revenues came through outsourcing.
FY16: Outsourcing trend across categories
FY18E: Expected trend in outsourcing
30%
Sanitaryware
50%
Faucets
100%
Tiles
40%
Sanitaryware
40-45%
Faucets
67%
Tiles
Source: Company, I-Sec Research Outsourcing strategies in each of its verticals going forward:
Sanitaryware division: Over the last three years, CRS has increased its sanitaryware capacity from 2 mn pieces to 3 mn pieces. Given that the current capacity has almost reached optimum utilisation, it plans to further augment its capacity to 3.3 mn pieces by end-FY17. While the incremental capacity is expected to support volume growth in the near term only, we expect the dependence on outsourcing model to continue both for low-end as well as premium and luxury products (currently sourced from China and Turkey).
Faucets: In FY16, the outsourcing model accounted for 50% of the divisional revenues while CRS utilised 75% of its existing capacity of 7,200 pieces of faucets per day. Over the next two years, we expect outsourced revenues to decline to 40-45% led by a) ramping up of production to achieve optimum utilisation from the current capacity of 7,200 pieces per day, and b) scaling up of the capacity to 10,000 pieces per day.
Ceramic tiles: After test marketing the product for three years, CRS recently acquired 51% stake in ‘Anjani Tiles’ in Andhra Pradesh; it has a capacity to manufacture 10,000 sq-m per day. With the JV expected to manufacture polished vitrified tiles we expect the company to continue to outsource its ceramic wall and floor and GVT requirements from Morbi units. We however expect the vanilla outsourcing share of overall tiles revenues to decline to 67% over the next two years.
With the sustenance of outsourcing model and CRS’ focus on profitable growth, we expect the company to continue to generate impressive RoCEs over the next few years. Over FY16-FY18E, RoCEs are expected to improve by 260bps to 30.2%.

Cera Sanitaryware, July 8, 2016 ICICI Securities
50
Focus on EBIDTA margins and working capital discipline EBIDTA margins at an inflection point CRS witnessed a margin decline from 18.8% in FY11 to 14.3% in FY15. This was largely led by a) steep rupee depreciation making imports costlier; b) higher gas prices; c) time taken to achieve EBIDTA break-even in the new faucets plant; and d) increasing contribution from tiles through vanilla outsourcing model.
Chart 8: Trend in EBIDTA margins
18.518.8 18.8
16.7
15.4
14.3 14.3
15.1
16.0
17.0
12.0
13.0
14.0
15.0
16.0
17.0
18.0
19.0
20.0
FY09 FY10 FY11 FY12 FY13 FY14 FY15 FY16 FY17E FY18E
(%)
Source: Company, I-Sec Research Margins however have partially recovered to 15.1% in FY16 largely led by higher margins in faucets and gradually declining gas prices. We expect margins to gain further traction over the next two years led by a) steep fall in gas prices, b) employee linked productivity measures to be initiated over the next two years resulting in lower wastages and higher efficiency, c) increasing premiumisation across product categories, d) higher utilisation in the faucets segment, and e) scaling up of joint venture model in tiles. With this, we expect CRS margins to improve by 190bps to 17% over the next two years.
Control over working capital: Significant scope for improvement In the quest to gain market share, Cera over the last few years has seen deterioration in its working capital. Our channel checks suggest that debtor days, in particular, have risen due to its liberal/accommodative credit policy with dealers, particularly in the faucets and tiles segment.
Debtor days: With rising brand equity, the company is expected to impose stricter control by phasing out its liberal credit policy (particularly in case of allied products like faucets and tiles) to dealers in a phased manner. With the focus on addition of stronger/cash rich dealers, we expect debtor days to improve gradually over next three years.
Inventory days: Traction in allied products - faucets and tiles in particular has resulted in sharp correction in inventory days at elevated levels. With these products expected to gain further traction, we expect inventory cycle to remain lean. Also, better inventory control in sanitaryware segment through increase in distribution reach may not be ruled out.

Cera Sanitaryware, July 8, 2016 ICICI Securities
51
Table 3: Trend in working capital days (In days) FY12 FY13 FY14 FY15 FY16 FY17E FY18E Receivable 52 62 59 72 74 71 68 Inventory 105 70 58 56 53 54 55 Payable 22 21 21 22 26 27 28 Working capital 135 112 95 106 101 98 95
Source: Company, I-Sec Research We expect working capital days to improve conservatively from 101 days in FY16 to 95 days in FY18E largely led by reduction in inventory cycle. If demand environment improves in the sanitaryware segment, further moderation in working capital could be a possibility.
Table 4: Q4FY16 results: Positive margin surprise (Rs mn)
Particulars Q4FY16 Q4FY15 YoY (%) Q3FY16 QoQ (%) FY16 FY15 YoY (%) Net Sales 2,806 2,504 12.0 2,335 20.2 9,337 8,217 13.6 Expenditure 2,325 2,144 8.4 1,978 17.5 7,924 7,041 12.5 Raw Materials 252 355 (29.0) 57 345.0 695 521 33.3 Cost of traded goods 1,128 902 25.1 1,017 11.0 3,712 3,322 11.8 Staff Cost 296 207 43.3 280 6.0 1,110 917 21.0 Other Expenditure 648 679 (4.6) 625 3.7 2,407 2,281 5.5 Operating Profit 481 361 33.4 358 34.6 1,413 1,175 20.2 OPM (%) 17.2 14.4 280 bps 15.3 190 bps 15.1 14.3 80 bps Other Income 36 22 62.6 16 122.8 100 66 51.4 Interest 14 25 (42.0) 11 29.8 55 77 (29.3) Depreciation 42 45 (5.2) 45 (4.7) 163 155 5.6 PBT 461 314 46.8 318 44.7 1,295 1,009 28.3 Tax 163 93 75.7 117 38.7 460 333 38.3 PAT 298 221 34.8 201 48.2 835 677 23.4 NPM (%) 10.6 8.8 180 bps 8.6 200 bps 8.9 8.2 70 bps
Source: Company, I-Sec Research
Revenue growth remains subdued The company reported muted revenue growth of 12% YoY in Q4FY16 to Rs2.8bn as demand environment remains challenging particularly in the sanitaryware segment. For FY16, revenues grew 13.6% to Rs9.3bn. While sanitaryware and allied products constituted 60% of revenues, faucets and tiles accounted for 23% and 15% of the revenues, respectively.
EBIDTA margin up 280bps YoY to 17.2%; big positive surprise CRS’ operating performance in Q4FY16 was very impressive with EBIDTA margins expanding by 280bps YoY to 17.2%. This was the highest margin recorded by the company in last 19 quarters. The positive surprise was largely led by higher gross margins and reduction in power and fuel costs. The higher gross margins are largely attributed to better capacity utilisation in sanitaryware and faucets segment, improvement in product mix led by increasing premiumisation and partial price hikes taken in Dec’15. EBITDA grew 33% to Rs481mn. For FY16, margins improved by 80bps to 15.1%.
PAT up 35% YoY to Rs298mn The company posted 35% YoY growth in bottomline to Rs298mn as compared to Rs221mn registered in the corresponding quarter of the previous year led by strong operating performance. For FY16, PAT grew by 23% to Rs835mn.

Cera Sanitaryware, July 8, 2016 ICICI Securities
52
Improving financials
Chart 9: Trend in revenues and revenue growth Chart 10: Trend in EBIDTA and EBIDTA growth
20%
27%31%
53%
36%
24%
14% 15% 17%
0%
10%
20%
30%
40%
50%
60%
0
2,000
4,000
6,000
8,000
10,000
12,000
14,000
FY10
FY11
FY12
FY13
FY14
FY15
FY16
FY17
E
FY18
E
Net revenues (Rs mn) Revenue growth (RHS)
22%27%
17%
41%
26%24%
20% 22% 21%
0%
5%
10%
15%
20%
25%
30%
35%
40%
45%
0
500
1,000
1,500
2,000
2,500
FY10 FY12 FY14 FY16 FY18E
EBIDTA (Rs mn) EBIDTA growth (RHS)
Source: Company data, I-Sec research
Chart 11: Trend in PAT and PAT growth Chart 12: Trend in CFO and FCF
50%
35%
21%
44%
12%
30%
23% 23% 22%
0%
10%
20%
30%
40%
50%
60%
0
200
400
600
800
1000
1200
1400
FY10
FY11
FY12
FY13
FY14
FY15
FY16
FY17
E
FY18
E
PAT (Rs mn) PAT growth (RHS)
(1000)
(500)
0
500
1000
1500FY
10
FY11
FY12
FY13
FY14
FY15
FY16
FY17
E
FY18
E
Cash flow from operations (Rs mn) Free cash flow (Rs mn)
Source: Company data, I-Sec research
Chart 13: Trend in working capital cycle (days) Chart 14: Debt/equity trend
135
11295
106 101 100 100
0
20
40
60
80
100
120
140
160
FY12
FY13
FY14
FY15
FY16
FY17
E
FY18
E
Debtor days Inventory days
Payable days W/C days 0.30.3 0.3 0.3
0.20.2
0.10.1 0.1
0.0
0.1
0.2
0.3
0.4
FY10
FY11
FY12
FY13
FY14
FY15
FY16
FY17
E
FY18
E
(x)
Source: Company data, I-Sec research

Cera Sanitaryware, July 8, 2016 ICICI Securities
53
Chart 15: Dividend payout trend Chart 16: Trend in RoE and RoCE
9.4
13.9 13.812.7
14.3
10.9
16.417.8 18.3
0.02.04.06.08.0
10.012.014.016.018.020.0
FY10
FY11
FY12
FY13
FY14
FY15
FY16
FY17
E
FY18
E
(%) 24.6 26.5 25.6
29.025.7
23.521.2 21.4 21.8
26.0
30.3 28.932.8 32.4
29.427.6 27.9 28.7
0.0
5.0
10.0
15.0
20.0
25.0
30.0
35.0
0.0
5.0
10.0
15.0
20.0
25.0
30.0
35.0
40.0
FY10
FY11
FY12
FY13
FY14
FY15
FY16
FY17
E
FY18
E
RoE (%) RoCE (%)
Source: Company data, I-Sec research

Cera Sanitaryware, July 8, 2016 ICICI Securities
54
Investment concerns Reduction in APM gas allocation: CRS’ Kadi facility receives APM gas from GAIL for 50-55% of its total capacity. It started receiving APM gas even before priority for power and fertiliser units was defined. While this contract cannot be changed, supply may reduce if the field from which the gas is being supplied starts depleting.
Sudden turnaround in APM/LNG gas prices: Spot gas prices have been on a decline over the past few quarters. Since the spot prices are now linked closer to long term contract rates, any spurt in spot prices is expected to impact the profitability of the company if the same cannot be passed on.
Depreciating INR: 20% of CRS’ revenues come from outsourcing via imports model. So, any steep depreciation in INR going forward is expected to put pressure on margins.
Valuations We expect top line and bottom line to witness CAGR of 16.2% and 25% respectively over FY16-FY18E. The stock currently trades at 24.4x its FY18E earnings of Rs100.3. The asset light model of CRS with continued focus on outsourcing and higher profitability over FY16-FY18E is expected to improve its RoCEs further by 260bps to 30.2%, thereby expected to sustain high valuations. We initiate coverage with a HOLD on CRS and target price of Rs2,506, valuing it at 25x FY18E earnings.

Cera Sanitaryware, July 8, 2016 ICICI Securities
55
Company background Cera Sanitaryware (CRS), a Gujarat-based company, is the third largest sanitaryware company in India. It has a state-of-the-art manufacturing plant located at Kadi, Gujarat capable of manufacturing 3mn pieces of sanitaryware products per annum, making it a largest facility at a single location in India. It also entered into manufacturing of faucets from FY11 with a current manufacturing capacity of 7,200 pieces per day, scalable up to 10,000 pieces per day.
CRS has also been trading in tiles through vanilla outsourcing model since FY13. However, it recently acquired 51% stake in ‘Anjani Tiles’ in Andhra Pradesh; it has a capacity to manufacture 10,000 sq-m per day of vitrified tiles per day. The company also has presence in wellness products (through vanilla outsourcing model) comprising bathtubs, Jacuzzi, steam cubicles, shower partitions, shower panels and allied sanitaryware products like cisterns and seat covers.
It has also added new product categories like mirrors, kitchen sinks and personal care products like hand dryers, hair dryers, soap dispensers, ceramic and chrome plated bath accessories, et al. With this, the company is now positioning itself as a complete bathroom solutions provider by leveraging its growing brand awareness and widespread distribution network.
Table 5: Business model Segments Sanitaryware Faucets Tiles Year of launch 1980 2011 2013
Product range Water Closet, European water closets, wash basins, urinals, squatting pans, etc
Single lever fittings, quarter-turn and half-turn fittings, flush valves and cocks, angle cocks, showers, etc
Ceramic wall and floor and vitrified tiles
Revenues – FY16 (Rs mn) 5,586 2,186 1,417 Revenue mix – FY16 60% 23% 15% FY13-FY16 revenue CAGR 15.7% 47% 142% FY16 manufactured turnover mix 70% 50% Nil
EBIDTA margins – FY16 18-20% 10-12% 5-7%
Capacity (pieces) 3,000,000 7,200 per day, scalable up to 10,000 per day
10,000 sq-m per day scalable by ~4 times
Capacity expansion
FY17E 300,000 Nil Nil FY18E Nil 2,500 per day Nil
Expected revenue CAGR 11% 28% 21%
Source: Company, I-Sec Research
Sanitaryware The products are sourced from Kadi factory, outsourced/contract manufactured from Morbi companies, and imported from China and Turkey – particularly the premium sanitaryware. CRS’ products (manufactured and locally outsourced) are largely targeted at the mass market, where it enjoys a strong brand recall. In FY16, manufactured turnover accounted for 70% of segmental turnover with the balance being met through a mix of outsourcing and high-end imports.

Cera Sanitaryware, July 8, 2016 ICICI Securities
56
Faucets CRS started trading in faucets from FY06. With test marketing initiated through outsourced products showing encouraging results, it decided to enter manufacturing of faucets. The faucet facility at Kadi started commercial production in Sep’10. The company initially started with manufacturing of half-and quarter-turn series and has now graduated to producing high-end single lever series as well. In FY16, manufactured turnover accounted for 50% of segmental turnover with the balance being met through outsourcing and some imports. Cera expects to increase its faucets capacity to 10,000 pieces per day in FY18E and from the current 7,200 pieces per day.
Ceramic tiles CRS launched ceramic tiles through vanilla outsourcing model in FY13. For three consecutive years. it outsourced commodity tiles from five-to-six players in Morbi and imported high end vitrified tiles from China. Currently, vitrified tiles account for 75% of the tiles division while the balance is contributed by wall tiles. The company recently moved to JV model with the acquisition of Anjani Tiles in Andhra Pradesh which is expected to reduce the vanilla outsourcing share to 67% from the current 100%.
Management bandwidth
Cera Sanitaryware was incorporated in 1980 and is currently into its 34th year of operations. The company is mainly spearheaded by Vikram Somany and is run by a dedicated team of professionals within the organisation.
Top management Designation Age
(years) Experience
(years) Profile
Vikram Somany
Chairman and managing director
65 40 A visionary and an Industrialist who had set up the ceramic division of Madhusudan Industries (now Cera Sanitaryware)
SC Kothari Chief Executive Officer 70 41
Retired from board in 2008, however recalled in Sep’12 after the demise of Mr. Vidush Somany
Atul Sanghvi Executive Director 53 31
Worked as a Chief Operating Officer from Oct’12 prior to which he served the company as president sales and marketing. He was then appointed as Executive Director in Apr’14
Source: Company, I-Sec Research

Cera Sanitaryware, July 8, 2016 ICICI Securities
57
Key milestones
2016
• Acquires vitrified tiles unit 'Anjani Tiles' through 51% JV model• Brand ISVEA launched in metros and Tier 1 cities
2015• Tied-up with Italian brand ISVEA for marking its entry into luxury sanitaryware segment
2014
• Expands faucet manufacturing capacity to 7,200 pieces per day• Ropes in Ms. Sonam Kapoor as the brand ambassador
2013
• Capacity expansion in sanitaryware from 2mn to 2.7mn pieces• Re-entry into tiles segment through local outsourcing• Vidush Somany, the Executive Director, expires in Aug-12
2012
• New logo unveiled• Aggressive marketing with induction of Dia Mirza as brand ambassador
2011
• Commercialisation of 2,500 TPD faucetware unit in Kadi• Efforts on to increase distribution network in smaller towns
2008 &2009
• Ties up with Italian wellness major - Novellini SpA - to launch premium wellness product range• Capacity expansion in sanitaryware from 1.4mn to 2mn pieces• Introduced the concept of Cera Bath Galleries with its retail partners
2006 & 2007
• Capacity expansion in sanitaryware from 1.3mn to 1.4mn pieces• Fuel efficient kilns installed by the company (Italian technology)• Introduced new products like bath fittings, glass basins, etc
2005
• Introduction of shower products like whirlpools, shower temples, shower panels, et al• Introduced concept of display centres called Cera Bath Studios
2002 & 2003
• Demerger of ceramic division from the company in FY02 to form Cera Sanitaryware• Launched plastic cisterns and seat covers through outsourcing
1980
• Incorporated as Madhusudan Ceramics with presence in oil and ceramics• Inaugrated sanitaryware plant at Kadi with a capacity of 0.3mn pieces per annum
Source: Company

Cera Sanitaryware, July 8, 2016 ICICI Securities
58
Financial summary Table 6: Profit and Loss Statement (Rs mn, year ending Mar 31)
FY14 FY15 FY16 FY17E FY18E Net Sales 6,637 8,217 9,337 10,764 12,596 Add: Other Operating Income - - - - - Net revenue 6,637 8,217 9,337 10,764 12,596
Less: Cost of goods sold 3,055 3,843 4,407 5,145 5,959 Employee cost 743 917 1,110 1,158 1,335 Others 1,889 2,281 2,407 2,744 3,161
Total Operating Expenses 5,688 7,041 7,924 9,047 10,455
EBITDA 949 1,175 1,413 1,717 2,141
Depreciation 122 155 163 188 241 Other income 62 66 100 75 88
EBIT 888 1,087 1,349 1,605 1,989
Less: Financial expenses 64 77 55 57 57
Recurring Pre-tax Income 824 1,009 1,295 1,548 1,932
Less: Taxation 305 333 460 519 628 Less: Minority Interest / Subsidiary loss - - - - - Net Income (Reported) 519 677 835 1,029 1,304
Extraordinary Items - - - - -
Recurring Net Income 519 677 835 1,029 1,304 Source: Company data, I-Sec research

Cera Sanitaryware, July 8, 2016 ICICI Securities
59
Table 7: Balance Sheet (Rs mn, year ending Mar 31)
FY14 FY15 FY16 FY17E FY18E ASSETS Current Assets, Loan & Advances Inventories 1,046 1,259 1,357 1,592 1,898 Sundry debtors 1,066 1,612 1,884 2,094 2,347 Cash and bank balances 307 295 600 421 450 Other current assets 5 3 16 16 16 Loans and advances 418 572 754 950 1,200 Total Current Assets 2,842 3,741 4,612 5,074 5,910
Current Liabilities & Provisions Current Liabilities 377 487 660 796 966 Provisions and other liabilities 1,231 1,479 2,080 2,248 2,398 Total Current Liabilities & Provisions 1,608 1,965 2,740 3,045 3,365
Net Current Assets 1,234 1,776 1,872 2,029 2,546
Investments 121 478 475 475 475
Fixed Assets Gross block 2,117 2,879 3,193 4,644 5,394 Less : depreciation 600 732 896 1,084 1,325 Net block 1,517 2,147 2,298 3,561 4,070 CWIP 52 77 651 - -
Goodwill - - - - -
Total Assets 2,924 4,477 5,295 6,065 7,090
LIABILITIES AND SHAREHOLDERS' EQUITY Shareholders Fund Equity share capital 63 65 65 65 65 Reserves and surplus 2,176 3,452 4,145 4,992 6,067 Total Shareholders Fund 2,240 3,517 4,210 5,057 6,132
Borrowings Secured loans 483 539 208 500 450 Unsecured loans - 142 369 - - Total Borrowings 483 682 578 500 450
Deferred Tax Liability 202 278 344 344 344 Minority Interest - - 164 164 164
Total Liabilities & Shareholders' Equity 2,924 4,477 5,295 6,065 7,090 Source: Company data, I-Sec research

Cera Sanitaryware, July 8, 2016 ICICI Securities
60
Table 8: Cash Flow Statement (Rs mn, year ending Mar 31)
FY14 FY15 FY16 FY17E FY18E Cash Flow from Operating Activities PAT 519 677 835 1,029 1,304 Add: Depreciation 122 155 163 188 241 Add: Other Operating activities (25) (53) (5) - - Operating Cash Flow Before Working Capital change (a) 616 778 993 1,218 1,545
Changes in Working Capital (Increase) / Decrease Trade & 0th receivables (235) (546) (272) (210) (253) (Increase) / Decrease Inventories (106) (213) (98) (235) (306) Increase / (Decrease) Current liab and provisions 379 358 775 304 320 Others (109) (152) (31) (196) (250) Working Capital Inflow / (Outflow) (b) (70) (554) 374 (336) (488)
Net Cash flow from Operating Activities (a) + (b) 546 224 1,366 881 1,056
Cash Flow from Capital commitments (c) (373) (787) (889) (800) (750)
Free Cash flow after capital commitments (a) + (b) + (c) 173 (563) 478 81 306
Cash Flow from Investing Activities Purchase of Investments (107) (356) 3 - - Change in goodwill - - - - - Net Cash flow from Investing Activities (d) (107) (356) 3 - -
Cash Flow from Financing Activities Equity raised/(repaid) - 706 - - - Proceeds from fresh borrowings (128) 199 (104) (78) (50) Dividend paid including tax and others (74) (74) (137) (183) (228) Net Cash flow from Financing Activities (e) (202) 831 (241) (260) (278)
Change in Deferred Tax Liability (f) 40 76 66 - -
Total Increase / (Decrease) in Cash (96) (12) 305 (179) 28 (a) + (b) + (c) +(d) + (e) + (f) Opening Cash and Bank balance 404 307 295 600 421 Closing Cash and Bank balance 307 295 600 421 450 Increase / (Decrease) in Cash and Bank balance (96) (12) 305 (179) 28
Source: Company data, I-Sec research

Cera Sanitaryware, July 8, 2016 ICICI Securities
61
Table 9: Key ratio (year ending Mar 31)
FY14 FY15 FY16 FY17E FY18E Per Share Data (Rs) EPS 41.0 52.0 64.2 79.2 100.3 Cash EPS 50.7 63.9 76.7 93.6 118.8 Dividend per share (DPS) 5.0 4.9 9.0 12.0 15.0 Book Value per share (BV) 177.0 270.4 336.3 401.4 484.1 Growth (%) Net Sales 36.0 23.8 13.6 15.3 17.0 EBITDA 26.0 23.8 20.2 21.6 24.7 PAT 12.3 30.4 23.4 23.3 26.7 Cash EPS 15.3 26.1 20.0 22.0 26.9 Valuation Ratios (x) P/E 59.6 47.0 38.1 30.9 24.4 P/CEPS 48.3 38.3 31.9 26.1 20.6 P/BV 177.0 270.4 336.3 401.4 484.1 EV / EBITDA 32.8 27.4 22.5 18.6 14.9 EV / Sales 4.7 3.9 3.4 3.0 2.5 Operating Ratio Raw Material / Sales (%) 46.0 46.8 47.2 47.8 47.3 Employee cost / Sales (%) 11.9 11.2 11.2 11.9 10.8 SG&A / Sales (%) 20.8 20.3 - - 19.5 Other Income / PBT (%) 7.5 6.5 7.7 4.9 4.6 Effective Tax Rate (%) 37.0 33.0 35.5 33.5 32.5 Working Capital (days) 95.4 105.9 100.9 98.0 95.0 Inventory Turnover (days) 57.5 55.9 53.1 54.0 55.0 Receivables (days) 58.6 71.6 73.7 71.0 68.0 Payables (days) 20.7 21.6 25.8 27.0 28.0 Net D/E Ratio (x) 0.1 0.1 (0.0) 0.0 0.0 Return/Profitability Ratio (%) Net Income Margins 7.8 8.2 8.9 9.6 10.4 RoACE 32.4 29.4 27.6 28.3 30.2 RoAE 25.7 23.5 21.2 21.5 22.6 Dividend Payout 14.3 10.9 16.4 17.7 17.5 Dividend Yield 0.2 0.2 0.4 0.5 0.6 EBITDA Margins 14.3 14.3 15.1 16.0 17.0
Source: Company data, I-Sec research

Cera Sanitaryware, July 8, 2016 ICICI Securities
62
Index of tables and charts
Tables Table 1: A&P spends/revenues .......................................................................................... 45 Table 2: Distribution network of key players within the industry ......................................... 46 Table 3: Trend in working capital days ............................................................................... 51 Table 4: Q4FY16 results: Positive margin surprise ............................................................ 51 Table 5: Business model ..................................................................................................... 55 Table 6: Profit and Loss Statement .................................................................................... 58 Table 7: Balance Sheet ....................................................................................................... 59 Table 8: Cash Flow Statement............................................................................................ 60 Table 9: Key ratio ................................................................................................................ 61
Charts Chart 1: Competitive brands in each segment .................................................................... 41 Chart 2: Recent launch of brand ISVEA at the CREDAI NATCON event in Istanbul ......... 43 Chart 3: Advertisement and promotional campaigns: Aggression displayed over the last
three years .................................................................................................................... 44 Chart 4: CRS positioning Pan-India .................................................................................... 46 Chart 5: Scaling up in faucets segment over the last five years ......................................... 47 Chart 6: Revenue trend in tiles segment over the last four years ....................................... 48 Chart 7: Allied products to constitute 44% of revenues by FY18E ..................................... 48 Chart 8: Trend in EBIDTA margins ..................................................................................... 50 Chart 9: Trend in revenues and revenue growth ................................................................ 52 Chart 10: Trend in EBIDTA and EBIDTA growth ................................................................ 52 Chart 11: Trend in PAT and PAT growth ............................................................................ 52 Chart 12: Trend in CFO and FCF ....................................................................................... 52 Chart 13: Trend in working capital cycle (days) .................................................................. 52 Chart 14: Debt/equity trend ................................................................................................. 52 Chart 15: Dividend payout trend ......................................................................................... 53 Chart 16: Trend in RoE and RoCE ..................................................................................... 53

Sanitaryware Industry, July 8, 2016 ICICI Securities
63
This report may be distributed in Singapore by ICICI Securities, Inc. (Singapore branch). Any recipients of this report in Singapore should contact ICICI Securities, Inc. (Singapore branch) in respect of any matters arising from, or in connection with, this report. The contact details of ICICI Securities, Inc. (Singapore branch) are as follows: Address: 10 Collyer Quay, #37-16 Ocean Financial Tower, Singapore - 049315, Tel: +65 6232 2451 and email: [email protected], [email protected].
"In case of eligible investors based in Japan, charges for brokerage services on execution of transactions do not in substance constitute charge for research reports and no charges are levied for providing research reports to such investors."
New I-Sec investment ratings (all ratings based on absolute return; All ratings and target price refers to 12-month performance horizon, unless mentioned otherwise) BUY: >15% return; ADD: 5% to 15% return; HOLD: Negative 5% to Positive 5% return; REDUCE: Negative 5% to Negative 15% return; SELL: < negative 15% return
ANALYST CERTIFICATION We /I, Nehal Shah, CA Research Analysts, authors and the names subscribed to this report, hereby certify that all of the views expressed in this research report accurately reflect our views about the subject issuer(s) or securities. We also certify that no part of our compensation was, is, or will be directly or indirectly related to the specific recommendation(s) or view(s) in this report. Analysts are not registered as research analysts by FINRA and are not associated persons of the ICICI Securities Inc. Terms & conditions and other disclosures: ICICI Securities Limited (ICICI Securities) is a full-service, integrated investment banking and is, inter alia, engaged in the business of stock brokering and distribution of financial products. ICICI Securities Limited is a SEBI registered Research Analyst with SEBI Registration Number – INH000000990. ICICI Securities is a wholly-owned subsidiary of ICICI Bank which is India’s largest private sector bank and has its various subsidiaries engaged in businesses of housing finance, asset management, life insurance, general insurance, venture capital fund management, etc. (“associates”), the details in respect of which are available on www.icicibank.com. ICICI Securities is one of the leading merchant bankers/ underwriters of securities and participate in virtually all securities trading markets in India. We and our associates might have investment banking and other business relationship with a significant percentage of companies covered by our Investment Research Department. ICICI Securities generally prohibits its analysts, persons reporting to analysts and their relatives from maintaining a financial interest in the securities or derivatives of any companies that the analysts cover. The information and opinions in this report have been prepared by ICICI Securities and are subject to change without any notice. The report and information contained herein is strictly confidential and meant solely for the selected recipient and may not be altered in any way, transmitted to, copied or distributed, in part or in whole, to any other person or to the media or reproduced in any form, without prior written consent of ICICI Securities. While we would endeavour to update the information herein on a reasonable basis, ICICI Securities is under no obligation to update or keep the information current. Also, there may be regulatory, compliance or other reasons that may prevent ICICI Securities from doing so. Non-rated securities indicate that rating on a particular security has been suspended temporarily and such suspension is in compliance with applicable regulations and/or ICICI Securities policies, in circumstances where ICICI Securities might be acting in an advisory capacity to this company, or in certain other circumstances. This report is based on information obtained from public sources and sources believed to be reliable, but no independent verification has been made nor is its accuracy or completeness guaranteed. This report and information herein is solely for informational purpose and shall not be used or considered as an offer document or solicitation of offer to buy or sell or subscribe for securities or other financial instruments. Though disseminated to all the customers simultaneously, not all customers may receive this report at the same time. ICICI Securities will not treat recipients as customers by virtue of their receiving this report. Nothing in this report constitutes investment, legal, accounting and tax advice or a representation that any investment or strategy is suitable or appropriate to your specific circumstances. The securities discussed and opinions expressed in this report may not be suitable for all investors, who must make their own investment decisions, based on their own investment objectives, financial positions and needs of specific recipient. This may not be taken in substitution for the exercise of independent judgment by any recipient. The recipient should independently evaluate the investment risks. The value and return on investment may vary because of changes in interest rates, foreign exchange rates or any other reason. ICICI Securities accepts no liabilities whatsoever for any loss or damage of any kind arising out of the use of this report. Past performance is not necessarily a guide to future performance. Investors are advised to see Risk Disclosure Document to understand the risks associated before investing in the securities markets. Actual results may differ materially from those set forth in projections. Forward-looking statements are not predictions and may be subject to change without notice. ICICI Securities or its associates might have managed or co-managed public offering of securities for the subject company or might have been mandated by the subject company for any other assignment in the past twelve months. ICICI Securities or its associates might have received any compensation from the companies mentioned in the report during the period preceding twelve months from the date of this report for services in respect of managing or co-managing public offerings, corporate finance, investment banking or merchant banking, brokerage services or other advisory service in a merger or specific transaction. ICICI Securities or its associates might have received any compensation for products or services other than investment banking or merchant banking or brokerage services from the companies mentioned in the report in the past twelve months. ICICI Securities encourages independence in research report preparation and strives to minimize conflict in preparation of research report. ICICI Securities or its analysts did not receive any compensation or other benefits from the companies mentioned in the report or third party in connection with preparation of the research report. Accordingly, neither ICICI Securities nor Research Analysts have any material conflict of interest at the time of publication of this report. It is confirmed that Nehal Shah, CA Research Analysts of this report have not received any compensation from the companies mentioned in the report in the preceding twelve months. Compensation of our Research Analysts is not based on any specific merchant banking, investment banking or brokerage service transactions. ICICI Securities or its subsidiaries collectively or Research Analysts do not own 1% or more of the equity securities of the Company mentioned in the report as of the last day of the month preceding the publication of the research report. Since associates of ICICI Securities are engaged in various financial service businesses, they might have financial interests or beneficial ownership in various companies including the subject company/companies mentioned in this report. It is confirmed that Nehal Shah, CA Research Analysts do not serve as an officer, director or employee of the companies mentioned in the report. ICICI Securities may have issued other reports that are inconsistent with and reach different conclusion from the information presented in this report. Neither the Research Analysts nor ICICI Securities have been engaged in market making activity for the companies mentioned in the report. We submit that no material disciplinary action has been taken on ICICI Securities by any Regulatory Authority impacting Equity Research Analysis activities. This report is not directed or intended for distribution to, or use by, any person or entity who is a citizen or resident of or located in any locality, state, country or other jurisdiction, where such distribution, publication, availability or use would be contrary to law, regulation or which would subject ICICI Securities and affiliates to any registration or licensing requirement within such jurisdiction. The securities described herein may or may not be eligible for sale in all jurisdictions or to certain category of investors. Persons in whose possession this document may come are required to inform themselves of and to observe such restriction. This report has not been prepared by ICICI Securities, Inc. However, ICICI Securities, Inc. has reviewed the report and, in so far as it includes current or historical information, it is believed to be reliable, although its accuracy and completeness cannot be guaranteed.