editorial board -...
TRANSCRIPT
2012.23.3 (75) Fiziologia - Physiology 1Fiziologia ‑ Physiology 2010 supplement 1
Official Journal of the Romanian Society of Physiological Sciences
ARDELEAN AUREL (Arad)BADIU GHEORGHE (Constanţa)BĂDĂRĂU ANCA (Bucureşti)BENEDEK GYÖRGY (Szeged)BENGA GHEORGHE (Cluj)BUNU CARMEN (Timişoara)COJOCARU MANOLE (Bucureşti)CUPARENCU BARBU (Oradea)CONSTANTIN NICOLAE (Bucureşti)HAULICĂ ION (Iaşi)IANCĂU MARIA (Craiova)MIHALAŞ GEORGETA (Timişoara)MUNTEAN DANINA (Timişoara)MUREŞAN ADRIANA (Cluj)NESTIANU VALERIU (Craiova) OPREA TUDOR (New Mexico)
CHIEF EDITOR FRANCISC SCHNEIDERCO-CHIEF EDITORS IOANA SISKA CARMEN TATUASSOCIATE EDITORS MIHAI NECHIFOR SORIN RIGAEXECUTIVE EDITORS FLORINA bOjIN GAbRIELA TANASIE DACIANA NISTOR CALIN MUNTEAN
E D I T O R I A L B O A R DPĂUNESCU VIRGIL (Timişoara)PETROIU ANA (Timişoara)POPESCU LAURENŢIU (Bucureşti)RÁCZ OLIVER (Košice)RIGA DAN (Bucureşti)SABĂU MARIUS (Tg. Mureş)SIMIONESCU MAIA (Bucureşti)SIMON ZENO (Timişoara)SAULEA I. AUREL (Chişinău)SWYNGHEDAUW BERNARD (Paris)TANGUAY M. ROBERT (Canada)TATU FABIAN ROMULUS (Timişoara)VLAD AURELIAN (Timişoara)VOICU VICTOR (Bucureşti)ZĂGREAN LEON (Bucureşti)
Publication data: Fiziologia (Physiology) is issued quarterly
Subscription rates: Subscriptions run a full calendar year. Prices
are give per volume, surface postage included.
Personal subscription: Romania - 100 RON, Outside
Romania - 35$ (must be in the name of, billed to, and paid by an
individual. Order must be marked “personal subscription”)
Institutional subscription: 50$ (regular rate)
Single issues and back volumes: Information on availability
and prices can be obtained through the Publisher.
Change of address: Both old and new address should be stated
and send to the subscription source.
Bibliographic indices: We hope this journal will be regularly listed
in bibliographic services, including “Current Contents”.
Book Reviews: Books are accepted for review by special
agreement.
Advertising: Correspondence and rate requests should be
addressed to the Publisher.
1. FOR SUBSCRIPTION ADDRESS
HVB Bank TIMISOARARO 21 BACX 0000000218508250
TIMISOARA – ROMANIAPENTRU REVISTA
„FIZIOLOGIA – PHYSIOLOGY”
2. CORRESPONDENCE SHOULD BE ADDRESSED TO THE CHIEF EDITOR
PROF. DR. FRANCISC SCHNEIDER PO BOX 135
300024 – TIMISOARA – ROMANIAe-mail: [email protected]
Editura EUROSTAMPATel./fax: 0256-204816
ISSN 1223 – 2076
AccREDITED By cNcSIS - B cATEgORy - cODE 240http://journals.indexcopernicus.com/karta.php?action=masterlist&id=4929
http://www.ebscohost.com/titleLists/a9h-journals.pdf
Fiziologia ‑ Physiology 2010 supplement 1
Official Journal of the Romanian Society of Physiological Sciences
ARDELEAN AUREL (Arad)BADIU GHEORGHE (Constanţa)BĂDĂRĂU ANCA (Bucureşti)BENEDEK GYÖRGY (Szeged)BENGA GHEORGHE (Cluj)BUNU CARMEN (Timişoara)COJOCARU MANOLE (Bucureşti)CUPARENCU BARBU (Oradea)CONSTANTIN NICOLAE (Bucureşti)HAULICĂ ION (Iaşi)IANCĂU MARIA (Craiova)MIHALAŞ GEORGETA (Timişoara)MUNTEAN DANINA (Timişoara)MUREŞAN ADRIANA (Cluj)NESTIANU VALERIU (Craiova) OPREA TUDOR (New Mexico)
CHIEF EDITOR FRANCISC SCHNEIDERCO-CHIEF EDITORS IOANA SISKA CARMEN TATUASSOCIATE EDITORS MIHAI NECHIFOR SORIN RIGAEXECUTIVE EDITORS FLORINA bOjIN GAbRIELA TANASIE DACIANA NISTOR CALIN MUNTEAN
E D I T O R I A L B O A R DPĂUNESCU VIRGIL (Timişoara)PETROIU ANA (Timişoara)POPESCU LAURENŢIU (Bucureşti)RÁCZ OLIVER (Košice)RIGA DAN (Bucureşti)SABĂU MARIUS (Tg. Mureş)SIMIONESCU MAIA (Bucureşti)SIMON ZENO (Timişoara)SAULEA I. AUREL (Chişinău)SWYNGHEDAUW BERNARD (Paris)TANGUAY M. ROBERT (Canada)TATU FABIAN ROMULUS (Timişoara)VLAD AURELIAN (Timişoara)VOICU VICTOR (Bucureşti)ZĂGREAN LEON (Bucureşti)
Publication data: Fiziologia (Physiology) is issued quarterly
Subscription rates: Subscriptions run a full calendar year. Prices
are give per volume, surface postage included.
Personal subscription: Romania - 100 RON, Outside
Romania - 35$ (must be in the name of, billed to, and paid by an
individual. Order must be marked “personal subscription”)
Institutional subscription: 50$ (regular rate)
Single issues and back volumes: Information on availability
and prices can be obtained through the Publisher.
Change of address: Both old and new address should be stated
and send to the subscription source.
Bibliographic indices: We hope this journal will be regularly listed
in bibliographic services, including “Current Contents”.
Book Reviews: Books are accepted for review by special
agreement.
Advertising: Correspondence and rate requests should be
addressed to the Publisher.
1. FOR SUBSCRIPTION ADDRESS
HVB Bank TIMISOARARO 21 BACX 0000000218508250
TIMISOARA – ROMANIAPENTRU REVISTA
„FIZIOLOGIA – PHYSIOLOGY”
2. CORRESPONDENCE SHOULD BE ADDRESSED TO THE CHIEF EDITOR
PROF. DR. FRANCISC SCHNEIDER PO BOX 135
300024 – TIMISOARA – ROMANIAe-mail: [email protected]
Editura EUROSTAMPATel./fax: 0256-204816
ISSN 1223 – 2076
AccREDITED By cNcSIS - B cATEgORy - cODE 240http://journals.indexcopernicus.com/karta.php?action=masterlist&id=4929
http://www.ebscohost.com/titleLists/a9h-journals.pdf
+
Fiziologia - Physiology 2012.23.3 (75)2 Fiziologia ‑ Physiology 2010 supplement2
Official Journal of the Romanian Society of Physiological Sciences
Submission: Only original papers in English are considered and should be sent to:
Prof. dr. Francisc SchneiderChief Editor of “Fiziologia”PO Box 135300024, TIMISOARA, ROMANIATel./Fax: 40-256/490507
Manuscripts should be submitted in triplicate sets of illustrations (of which one is an original), typewritten doublespaced on one side of the paper, with a wide margin.
Conditions: All manuscripts are subject to editorial review. Manuscripts are received with the explicit understanding that they are not under simultaneous consideration by any other publication. Submission of an article for publication implies the transfer of the copyright from the author to the publisher upon acceptance. Accepted papers become the permanent property of “Fiziologia” (Physiology) and may not be reproduced by any means, in whole or in part, without the written consent of the publisher. It is the author’s responsibility to obtain permission to reproduce illustrations, tables, etc. from other publications.
Arrangement:Title page: The first of each paper should indicate the title
(main title underlined), the authors’ names, and the institute where the work was conducted. A short title for use as running head is also required.
Keywords: for indexing purposes, a list of 3-10 keywords in English and Romanian is essential.
Abstract: Each paper needs abstract and title in Romanian and English language, fonts size 9, Arial Narrow.
Bady text: fonts size 10, Arial Narrow.Small type: Paragraphs which can or must be set in smaller
type (case histories, test methods, etc.) should be indicated with a „p” (petit) in the margin on the left-hand side.
Footnotes: Avoid footnotes. When essential, they are numbered consecutively and typed at the foot of the appropriate page, fonts size 8, Arial Narrow.
Tables and illustrations: Tables (numbered in Roman numerals) and illustrations (numbered in Arabic numerals) should be prepared on separate sheets, fonts size 9, Arial Narrow. Tables require a heading, and figures a legend, also prepared on a separate sheet. For the reproduction of illustrations, only good drawings and original photographs can be accepted; negatives or photocopies cannot be used. When possible, group several illustrations on one block for reproduction (max. size 140x188 mm) or provide crop marks. On the back of each illustration indicate its number, the author’s name, and article title. Colour
illustration are reproduced at the author’s expense.References: In the text identify references by Arabic
figures, (in brackets), fonts size 9, Arial Narrow. Material submitted for publication but not yet accepted should be noted as “unpublished data” and not be included in the reference list. The list of references should include only those publications which are cited in the text. The references should be numbered and arranged alphabetically by the authors’ names. The surnames of the authors followed by initials should be given. There should be no punctuation signs other than a comma to separate the authors. When there are more than 3 authors, the names of the 3 only are used, followed by “et al”. abbreviate journal names according to the Index Medicus system. (also see International Committee of Medical Journal Editors: Uniform Requirements for manuscripts submitted to biomedical journals. Ann Intern Med 1982; 96: 766 – 771).
Examples:(a) Papers published in periodicals: Kauffman HF, van der
Heide S, Beaumont F, et al: Class-apecific antibody determination against Aspergillus fumigatus by mean of the enzyme-linked immunosorbent assay. III. Comparative study: IgG, IgA, IgM, ELISA titers, precipitating antibodies and IGE biding after fractionation of the antigen. Int Arch Allergy Appl Immunol 1986; 80: 300 – 306.
(b) Monographs; Matthews DE, Farewell VT: Using and Understanding Medical Statistics. Basel, Karger, 1985.
(c) Edited books: Hardy WD Jr, Essex M: FeLV-inducted feline acquired immune deficiency syndrome: A model for human AIDS; in Klein E(ed): Acquired Immunodeficiency Syndrome. Prog Allergy, Busel, Karger, 1986, vol 37, 353 – 376.
Full address: The exact postal address complete with postal code of the senior author must be given; if correspondence is handled by someone else, indicate this accordingly. Add the E-mail address if possible.
Page charges: There is no page charge for papers of 4 or fewer printed pages (including tables, illustrations and references).
Galley proofs: unless indicated otherwise, galley proofs are sent to the first-named author and should be returned with the least possible delay. Alternations made in galley proofs, other than the corrections of printer’s errors, are charged to the author. No page proofs are supplied.
Reprints: Order forms and a price list are sent with the galley proofs. Orders submitted after the issue is printed are subject to considerably higher prices. Allow five weeks from date of publication for delivery of reprints.
Instructions to Authors

2012.23.3 (75) Fiziologia - Physiology 3
CONTENTS
1. Diagnostic Aspects in Adult Patients with Thyroid Disease and Type 2 Diabetes ...................................................................................................................................................4Adriana Gherbon, Lavinia Noveanu, Georgeta Mihalaş2. The Morphology of Colonies from Breast Cancer SK-BR-3 Cells in Semisolid Media Depends on the Media Composition ...............................................................................9Cean Ada, Istratoaie Bogdan, Cristea Mirabela, Ivan Alexandra, Anghel Simona, Gavriliuc Oana, Bojin Florina, Tanasie Gabriela, Tatu Carmen, Panaitescu Carmen, Paunescu Virgil3. A Simple ECG Recording Hardware for Langendorff Isolated Heart Experiments ...............................................................................................................................................15Marcel Perian, Dan Dobreanu, Carmen Caldararu, Marius Sabau4. Analysis of the Evolution in Time of the Effects of Monotonous Auditory Stimulation on Cortical Biopotentials ..............................................................................................18Marius Georgescu, Daniel Georgescu, Dragoş Alexandru, Daniela Puscasiu, Carmen Tatu, Maria Iancău
5. Physiology and Physiopathology of Hepatic Encephalopathy .............................................................................................................................................................................23Scheau Cristian, Lazăr Mihai, Bunea Magda, Ciornei Cătălina, Papacocea Raluca, Ion Daniela Adriana, Bădărău Anca Ioana6. The Effects of Adenosine Amine Congener (ADAC) on the Sound Stress in Wistar Rats ....................................................................................................................................26Goanţă CM, Sandu S, Pîslaru A, Zăgrean L7. Prevalence of Refractive Errors in Schoolchildren in Urban Environment ............................................................................................................................................................30Luminita Turcin8. Changes of Interleukin-12 Serum Levels in Patients with Chronic Hepatitis C Virus Infection before Interferon Alpha Treatment ....................................................................34Manole Cojocaru, Simona Alexandra Iacob, Dorina Banică, Eugenia Panaitescu, Diana Gabriela Iacob9. Etiology and Pathophysiology of Seizures, Epilepsy and Status Epilepticus after Stroke ....................................................................................................................................36Vintilescu Raluca, Balseanu Adrian, Mitu Cristina, Dina Ciprian, Georgescu Marius, Iancau Maria10. The Survey of Nosocomial Infections from a University Clinic Institute with Cardiovascular Profile .................................................................................................................41Livia Stângă, Luminiţa Mirela Bădiţoiu, Matilda Rădulescu, Delia Berceanu-Văduva, Elena Hogea, Delia Muntean, Piluţ C., Monica Licker, Roxana Moldovan
CUPRINS
1. Caracteristici diagnostice ale pacientilor adulti cu afectiune tiroidiana si Diabet Zaharat tip 2 ............................................................................................................................4Adriana Gherbon, Lavinia Noveanu, Georgeta Mihalaş2. Aspectele morfologice ale coloniilor celulare formate de linia tumorala mamara SK-BR-3 sunt corelate cu compozitia mediului de cultura semisolid .................................9Cean Ada, Istratoaie Bogdan, Cristea Mirabela, Ivan Alexandra, Anghel Simona, Gavriliuc Oana, Bojin Florina, Tanasie Gabriela, Tatu Carmen, Panaitescu Carmen, Paunescu Virgil3. Dispozitiv simplu pentru înregistrarea ECG în experimente pe inima izolată în sistem Langendorff .................................................................................................................15Marcel Perian, Dan Dobreanu, Carmen Caldararu, Marius Sabau4. Analiza evolutiei in timp a efectelor stimularii auditive monotonale asupra biopotentialelor corticale ............................................................................................................18Marius Georgescu, Daniel Georgescu, Dragoş Alexandru, Daniela Puscasiu, Carmen Tatu, Maria Iancău
5. Fiziologia şi fiziopatologia encefalopatiei hepatice ..............................................................................................................................................................................................23Scheau Cristian, Lazăr Mihai, Bunea Magda, Ciornei Cătălina, Papacocea Raluca, Ion Daniela Adriana, Bădărău Anca Ioana6. Adenosine amine congener (ADAC) şi efectele sale asupra comportamentului şobolanilor Wistar supusi stresului sonor ..............................................................................26Goanţă CM, Sandu S, Pîslaru A, Zăgrean L7. Prevalenta erorilor de refractie la scolarii din mediul urban ................................................................................................................................................................................30Luminita Turcin8. Variaţii ale concentraţiilor de interleukină-12 în serul pacienţilor cu infecţie cronică cu virusul hepatitei C înaintea tratamentului cu interferon alpha ................................34Manole Cojocaru, Simona Alexandra Iacob, Dorina Banică, Eugenia Panaitescu, Diana Gabriela Iacob9. Epilepsia post accident vascular cerebral ..............................................................................................................................................................................................................36Vintilescu Raluca, Balseanu Adrian, Mitu Cristina, Dina Ciprian, Georgescu Marius, Iancau Maria10. Monitorizarea infectiilor nosocomiale dintr-un Institut Clinic Universitar cu profil cardiovascular ..................................................................................................................41Livia Stângă, Luminiţa Mirela Bădiţoiu, Matilda Rădulescu, Delia Berceanu-Văduva, Elena Hogea, Delia Muntean, Piluţ C., Monica Licker, Roxana Moldovan
Fiziologia ‑ Physiology 2010 supplement2
Official Journal of the Romanian Society of Physiological Sciences
Submission: Only original papers in English are considered and should be sent to:
Prof. dr. Francisc SchneiderChief Editor of “Fiziologia”PO Box 135300024, TIMISOARA, ROMANIATel./Fax: 40-256/490507
Manuscripts should be submitted in triplicate sets of illustrations (of which one is an original), typewritten doublespaced on one side of the paper, with a wide margin.
Conditions: All manuscripts are subject to editorial review. Manuscripts are received with the explicit understanding that they are not under simultaneous consideration by any other publication. Submission of an article for publication implies the transfer of the copyright from the author to the publisher upon acceptance. Accepted papers become the permanent property of “Fiziologia” (Physiology) and may not be reproduced by any means, in whole or in part, without the written consent of the publisher. It is the author’s responsibility to obtain permission to reproduce illustrations, tables, etc. from other publications.
Arrangement:Title page: The first of each paper should indicate the title
(main title underlined), the authors’ names, and the institute where the work was conducted. A short title for use as running head is also required.
Keywords: for indexing purposes, a list of 3-10 keywords in English and Romanian is essential.
Abstract: Each paper needs abstract and title in Romanian and English language, fonts size 9, Arial Narrow.
Bady text: fonts size 10, Arial Narrow.Small type: Paragraphs which can or must be set in smaller
type (case histories, test methods, etc.) should be indicated with a „p” (petit) in the margin on the left-hand side.
Footnotes: Avoid footnotes. When essential, they are numbered consecutively and typed at the foot of the appropriate page, fonts size 8, Arial Narrow.
Tables and illustrations: Tables (numbered in Roman numerals) and illustrations (numbered in Arabic numerals) should be prepared on separate sheets, fonts size 9, Arial Narrow. Tables require a heading, and figures a legend, also prepared on a separate sheet. For the reproduction of illustrations, only good drawings and original photographs can be accepted; negatives or photocopies cannot be used. When possible, group several illustrations on one block for reproduction (max. size 140x188 mm) or provide crop marks. On the back of each illustration indicate its number, the author’s name, and article title. Colour
illustration are reproduced at the author’s expense.References: In the text identify references by Arabic
figures, (in brackets), fonts size 9, Arial Narrow. Material submitted for publication but not yet accepted should be noted as “unpublished data” and not be included in the reference list. The list of references should include only those publications which are cited in the text. The references should be numbered and arranged alphabetically by the authors’ names. The surnames of the authors followed by initials should be given. There should be no punctuation signs other than a comma to separate the authors. When there are more than 3 authors, the names of the 3 only are used, followed by “et al”. abbreviate journal names according to the Index Medicus system. (also see International Committee of Medical Journal Editors: Uniform Requirements for manuscripts submitted to biomedical journals. Ann Intern Med 1982; 96: 766 – 771).
Examples:(a) Papers published in periodicals: Kauffman HF, van der
Heide S, Beaumont F, et al: Class-apecific antibody determination against Aspergillus fumigatus by mean of the enzyme-linked immunosorbent assay. III. Comparative study: IgG, IgA, IgM, ELISA titers, precipitating antibodies and IGE biding after fractionation of the antigen. Int Arch Allergy Appl Immunol 1986; 80: 300 – 306.
(b) Monographs; Matthews DE, Farewell VT: Using and Understanding Medical Statistics. Basel, Karger, 1985.
(c) Edited books: Hardy WD Jr, Essex M: FeLV-inducted feline acquired immune deficiency syndrome: A model for human AIDS; in Klein E(ed): Acquired Immunodeficiency Syndrome. Prog Allergy, Busel, Karger, 1986, vol 37, 353 – 376.
Full address: The exact postal address complete with postal code of the senior author must be given; if correspondence is handled by someone else, indicate this accordingly. Add the E-mail address if possible.
Page charges: There is no page charge for papers of 4 or fewer printed pages (including tables, illustrations and references).
Galley proofs: unless indicated otherwise, galley proofs are sent to the first-named author and should be returned with the least possible delay. Alternations made in galley proofs, other than the corrections of printer’s errors, are charged to the author. No page proofs are supplied.
Reprints: Order forms and a price list are sent with the galley proofs. Orders submitted after the issue is printed are subject to considerably higher prices. Allow five weeks from date of publication for delivery of reprints.
Instructions to Authors
Fiziologia - Physiology 2012.23.3 (75)4
DIAGNOSTIC ASPECTS IN ADULT PATIENTS WITH THYROID DISEASE AND TYPE 2 DIABETESADRIANA GHERBON, LAVINIA NOVEANU, GEORGETA MIHALAŞDepartment III-Functional Sciences, Physiology, “Victor Babes” University of Medicine and Pharmacy Timisoara
ABSTRACTPatients with diabetes have an increased prevalence of thyroid disease compared with non-diabetic population. In the case of type 2 diabetes mellitus, hypothyroidism is the most common disorder seen. Type 2 diabetes is often associated with hyperthyroidism (Basedow-Graves’ disease and multinodular toxic goiter).The purpose of this study is to determine the main diagnosis aspects of thyroid diseases in adult patients with type 2 diabetes. The adults group studied was represented by 290 cases, aged 18-80 years. Gender distribution was net in favor of women being repre-sented by 252 women and 38 men. They used clinical, imaging, biochemical, hormonal and immunological parameters.Keywords: type 2 diabetes, thyroid disease, diagnosis, thyroid ultrasound, thyroid hormones, antithyroid antibodies
Received 10th of July 2012. Accepted 20th of August 2012. Address for correspondence: Adriana Gherbon, MD, PhD, Department of Physiology, “Victor Babes” University of Medicine and Pharmacy Timisoara, Romania, Eftimie Murgu Square No. 2A, 300041, Timisoara, phone/fax: +40256220479; e-mail: [email protected]
INTRODUCTIONThe thyroid disorders are common in the general population;
their prevalence increases with age. The screening for thyroid disorders is indicated in certain high-risk groups as new born and elderly people (8).
The hypothyroidism is the most common thyroid disorder in adults and older women. Its origin is usually autoimmune, presenting as atrophic primary hypothyroidism or Hashimoto thyroiditis. It may be also secondary to radioactive iodine treatment or thyroid surgery. In rare cases, occurs secondary hypothyroidism to hypothalamic or pituitary disease (8).
By contrast, the hyperthyroidism is less common, with a ratio female/male 9/1. The Graves’s disease is most common and usually affects young adults. The toxic multinodular goiter usually occurs in older people (8).
The patients with diabetes mellitus (DM) have an increa-sed prevalence of thyroid disease compared with non-diabetic population (8).
The most common association is between thyroid disease and type 1 diabetes, but a number of studies also indicate a high prevalence of thyroid disorders in patients with type 2 diabetes, the hypothyroidism is the most common disorder encountered (1).
In the case of association of IGT and IFG with thyroid disor-ders, they usually occur as a result of excess thyroid hormones. It was found that these associations are more common in women.
In a U.S. study shows that at patients with thyroid disease, glucose intolerance was present in 38% of cases, and incidence of clinical diabetes was 2-3% (6, 7).
Other authors have obtained a prevalence of thyroid disor-ders in patients with type 2 diabetes of 2.5%, the most common endocrine disorder were sub clinical hypothyroidism (4.1%) (5).
DM type 2 is frequently associated with hyperthyroidism (Graves-Basedow disease and toxic multinodular goiter). DM type 2 is present in 11% of patients with Graves-Basedow
disease and in 5% of those with toxic multinodular goiter. The glucose intolerance is also frequently associated with hyper-thyroidism; its prevalence is much higher compared to type 2 diabetes (72.3%). In the case of the toxic multinodular goiter incidence of impaired glucose tolerance was much higher, namely 85%, and in the case of the Graves-Basedow disease around 54% (4).
Also, in the case of euthyroid diffuse goiter, its prevalence in the people with DM varies between 3.4% and 17%; being discussed the treatment with sulfonylurea involvement in its appearance (2).
The diagnosis of thyroid dysfunction in patients with dia-betes, based only on clinical manifestations, can be difficult. An unsatisfactory glycemic control can cause similar symptoms with the hyperthyroidism, such as weight loss despite increased appe-tite, and fatigue. On other hand, the severe diabetic nephropathy can be omitted in patients with hypothyroidism because these patients may present edemas, fatigue, and pallor and weight gain (8).
To further complicate the diagnostic process, unbalance DM, with or without complications, can cause alterations of thyroid function tests, which can occur in patients without associated thyroid disease. The typical changes are represented by the decrease of T3, determined by the decrease of T4 conversion in T3, decreased serum T4, due to lower fixing on protein and lower serum TSH (8).
The most sensitive test to detect the thyroid dysfunction is the determination of TSH, which allows the certain diagnosis of the hypo-and hyperthyroidism. It also allows the diagnosis of sub clinical thyroid dysfunction; characterized only through adjusting the level of TSH, with T3 or T4 in the normal range, the patients with this type of dysfunction is usually asympto-matic (8).
The thyroid dysfunction can produce significant biochemi-cal and clinical changes. Thus, the sub clinical hypothyroidism
2012.23.3 (75) Fiziologia - Physiology 5
may increase LDLc and aggravating pre-existing dyslipidemia, increasing the risk of arteriosclerosis. On other hand, the sub clinical hyperthyroidism may increase the risk of cardiac ar-rhythmias and can exacerbate a pre-existing coronary heart disease. Because the patients with diabetes are an increased risk for cardiovascular disease, the diagnosis and treatment of associated thyroid disease is important (8).
The presence on antiperoxidase thyroid antibodies (antiTPO AB) has a role in predicting occurrence of autoimmune thyroid disease, particularly of the hypothyroidism. Auto antibodies may occur long before obvious clinical manifestations of autoimmune thyroid disease and predict the appearance of clinical disease. The patients with polyglandular autoimmune syndrome may present auto antibodies against the same antigen. At the patients with present antiTPO AB must make their annual screening for early detection of thyroid dysfunction and establishment of an appropriate treatment (3).
Also, at all the patients with diabetes should be performed a screen for adrenal auto antibodies, celiac disease, steroid, gastric parietal and thyroid even at diagnosis. Also, at the patients who have one of the diseases listed above must be confirmed exist-ence of diabetes by determining the ICA, GAD, IA2, in absence of characteristic clinical manifestations (3).
At the family members of patients with diabetes must also determine auto antibodies, especially if the diabetic patient has thyroid auto antibodies. Identifying of the auto antibodies presence should be followed by hormonal assessment and the treatment of thyroid disease (3).
MATERIAL AND METHOD
Investigated population
The study included adult subjects with diabetes mellitus, which in time present thyroid disease, or adult subjects with thyroid disease that subsequently present diabetes mellitus.
The study group comprised 290 cases, aged 18-80 years. Gender distribution was net in favor of women being represented by 252 women and 38 men.
Methods of investigation
Methods of investigation were the clinical data - history, present status, and imaging - thyroid ultrasound, biochemistry - carbohydrate metabolism parameters: fasting blood glucose, urine glucose, glycosylated hemoglobin and thyroid hormones investigations and some immunological parameters
Glucose determination was performed by enzymatic tech-niques with glucose oxidase. Were considered normal fasting blood glucose between 70-110 mg%, diabetes mellitus - fasting blood glucose values above 126 mg%, impaired glucose toler-ance - fasting blood glucose values between 110-126 mg% and the oral glucose tolerance test (OGTT) at 2 h between 140-200 mg% and fasting impaired glucose tolerance - fasting blood glucose values between 110-126 mg% and OGTT at 2 h under
140 mg%.Determination of glycosylated hemoglobin (HbA1c) was
achieved through the DiaStat program for glycosylated hemo-globin HbA1c that measures the ratio of glycated hemoglobin to total HbA.
Determination of serum levels of TSH, free fraction of serum level of triiodothyronine (FT3), free fraction of thyroxin (FT4) were ARCHITECT quantitative method, which is an immunologic determination by chemiluminescence’s with small Chemilumnes-cent Micro particle Immunoassay (CMIA). The following values were considered normal: TSH = 0.465 - 4.68 mIU/ml, FT3 = 3.69 -10.4 pmol/l, FT4 = 10 - 28.2 pmol/l.
Immunological parameters were represented by some markers of thyroid autoimmunity – antiperoxidase (antiTPO) and antithyroglobulin (antiTG) antibodies (AB). To determine the serum titers of antiTPO AB, AxSYM antiTPO kit was used, the method is enzyme immunoassay with micro particles, Meia (Micro particle Enzyme Immunoassay). It was considered normal: antiTPO AB <35 IU / ml. To determine the serum titers of antiTG AB, AxSYM antiTG kit was used, the method is enzyme immunoassay with micro particles, Meia (Micro particle Enzyme Immunoassay). It was considered normal: antiTG AB <55 IU/ ml.
Thyroid ultrasound performed in all cases is a non-invasive method of exploration that allows measurement of thyroid vol-ume, thyroid study report with cervical anatomical structures and thyroid parenchyma changes.
RESULTS AND DISCUSSIONIn the case of the type 2 diabetes group, family history
was present in 1.96% cases. In terms of the clinical symp-toms, the patients with Graves-Basedow disease presented the specific thyreotoxic disease syndrome. In the case of ACT, some patients were asymptomatic, and some presented typical symptoms of hypothyroidism. In the case of the nodu-lar goiter, they were discovered incidentally at ultrasound examination (incidentalomas) or by clinical symptoms due to compression. In the case of the malignant tumors, the symptoms were very different: firm goiter, loco-regional adenopathy, quick growth of the formation spontaneous or by thyroxin suppression therapy. In the case of the euthyroid diffuse goiter, was no symptoms, the diagnosis was based on clinical examination and ultrasound. In the case of the sub acute thyroiditis, the symptoms occurred after an upper respiratory tract infection, framing local pain, inflammatory syndrome, functional disorders (transient hyperthyroidism, followed by transient hypothyroidism).
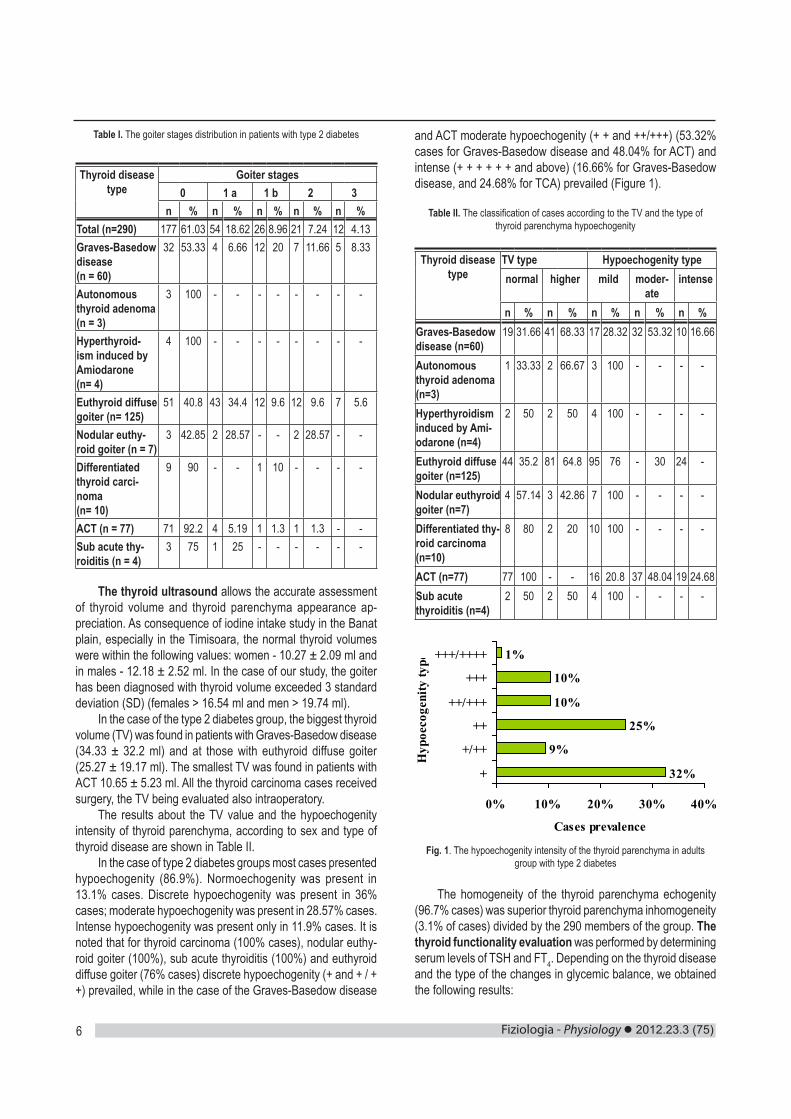
To assess the goiter was used inspection and palpation and were taken into account the WHO goiter staging criteria. Based on these criteria, at the studied group with type 2 diabetes we have obtained the results given in Table I.
A percentage of 18.62% cases presented the goiter stage 1 a, 8.96% had goiter stage 1 b, 7.24% stage 2 and 4.13% stage 3, with the relatively firm consistency. Most patients (61.03%) had no goiter on clinical examination (Figure 1).
Fiziologia - Physiology 2012.23.3 (75)6
Table I. The goiter stages distribution in patients with type 2 diabetes
Thyroid disease type
Goiter stages0 1 a 1 b 2 3
n % n % n % n % n %Total (n=290) 177 61.03 54 18.62 26 8.96 21 7.24 12 4.13Graves-Basedow disease(n = 60)
32 53.33 4 6.66 12 20 7 11.66 5 8.33
Autonomous thyroid adenoma (n = 3)
3 100 - - - - - - - -
Hyperthyroid-ism induced by Amiodarone (n= 4)
4 100 - - - - - - - -
Euthyroid diffuse goiter (n= 125)
51 40.8 43 34.4 12 9.6 12 9.6 7 5.6
Nodular euthy-roid goiter (n = 7)
3 42.85 2 28.57 - - 2 28.57 - -
Differentiated thyroid carci-noma(n= 10)
9 90 - - 1 10 - - - -
ACT (n = 77) 71 92.2 4 5.19 1 1.3 1 1.3 - -Sub acute thy-roiditis (n = 4)
3 75 1 25 - - - - - -
The thyroid ultrasound allows the accurate assessment of thyroid volume and thyroid parenchyma appearance ap-preciation. As consequence of iodine intake study in the Banat plain, especially in the Timisoara, the normal thyroid volumes were within the following values: women - 10.27 ± 2.09 ml and in males - 12.18 ± 2.52 ml. In the case of our study, the goiter has been diagnosed with thyroid volume exceeded 3 standard deviation (SD) (females > 16.54 ml and men > 19.74 ml).
In the case of the type 2 diabetes group, the biggest thyroid volume (TV) was found in patients with Graves-Basedow disease (34.33 ± 32.2 ml) and at those with euthyroid diffuse goiter (25.27 ± 19.17 ml). The smallest TV was found in patients with ACT 10.65 ± 5.23 ml. All the thyroid carcinoma cases received surgery, the TV being evaluated also intraoperatory.
The results about the TV value and the hypoechogenity intensity of thyroid parenchyma, according to sex and type of thyroid disease are shown in Table II.
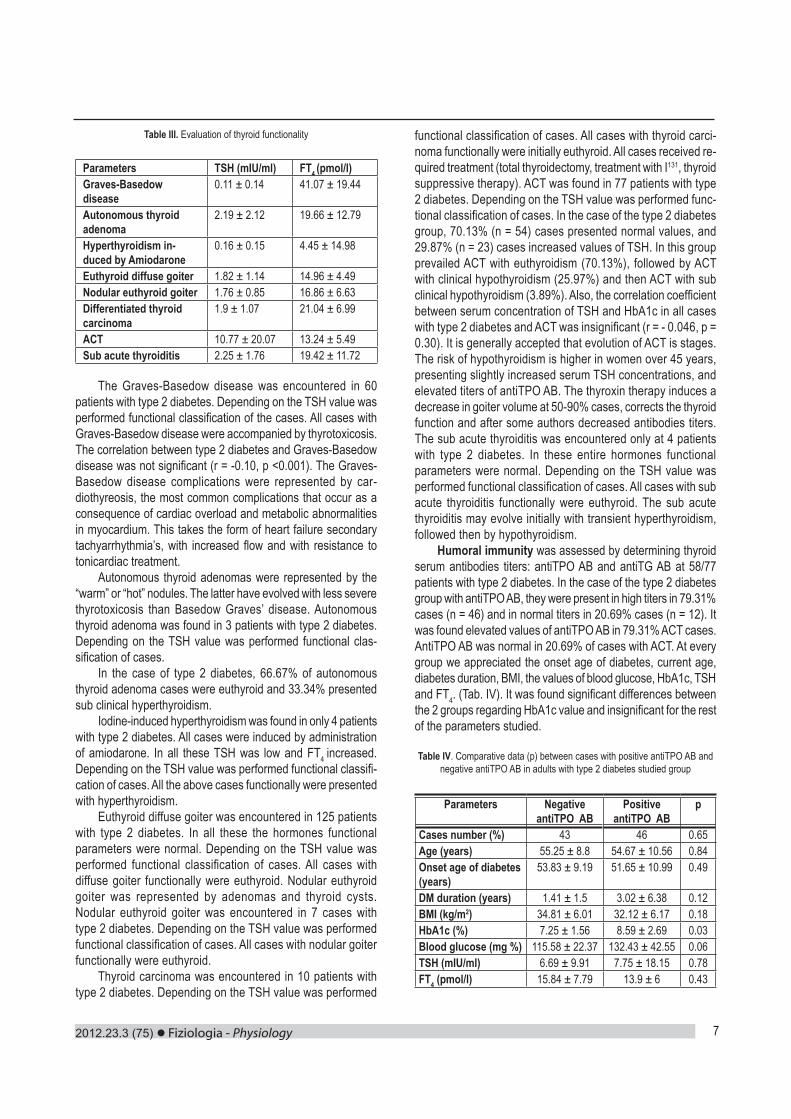
In the case of type 2 diabetes groups most cases presented hypoechogenity (86.9%). Normoechogenity was present in 13.1% cases. Discrete hypoechogenity was present in 36% cases; moderate hypoechogenity was present in 28.57% cases. Intense hypoechogenity was present only in 11.9% cases. It is noted that for thyroid carcinoma (100% cases), nodular euthy-roid goiter (100%), sub acute thyroiditis (100%) and euthyroid diffuse goiter (76% cases) discrete hypoechogenity (+ and + / + +) prevailed, while in the case of the Graves-Basedow disease
and ACT moderate hypoechogenity (+ + and ++/+++) (53.32% cases for Graves-Basedow disease and 48.04% for ACT) and intense (+ + + + + + and above) (16.66% for Graves-Basedow disease, and 24.68% for TCA) prevailed (Figure 1).
Table II. The classification of cases according to the TV and the type of thyroid parenchyma hypoechogenity
Thyroid disease type
TV type Hypoechogenity typenormal higher mild moder-
ateintense
n % n % n % n % n %Graves-Basedow disease (n=60)
19 31.66 41 68.33 17 28.32 32 53.32 10 16.66
Autonomous thyroid adenoma (n=3)
1 33.33 2 66.67 3 100 - - - -
Hyperthyroidism induced by Ami-odarone (n=4)
2 50 2 50 4 100 - - - -
Euthyroid diffuse goiter (n=125)
44 35.2 81 64.8 95 76 - 30 24 -
Nodular euthyroid goiter (n=7)
4 57.14 3 42.86 7 100 - - - -
Differentiated thy-roid carcinoma (n=10)
8 80 2 20 10 100 - - - -
ACT (n=77) 77 100 - - 16 20.8 37 48.04 19 24.68Sub acute thyroiditis (n=4)
2 50 2 50 4 100 - - - -
32%
9%
25%
10%
10%
1%
0% 10% 20% 30% 40%
+
+/++
++
++/+++
+++
+++/++++
Hyp
oeco
geni
ty ty
pe
Cases prevalence
Fig. 1. The hypoechogenity intensity of the thyroid parenchyma in adults group with type 2 diabetes
The homogeneity of the thyroid parenchyma echogenity (96.7% cases) was superior thyroid parenchyma inhomogeneity (3.1% of cases) divided by the 290 members of the group. The thyroid functionality evaluation was performed by determining serum levels of TSH and FT4. Depending on the thyroid disease and the type of the changes in glycemic balance, we obtained the following results:
2012.23.3 (75) Fiziologia - Physiology 7
Table III. Evaluation of thyroid functionality
Parameters TSH (mIU/ml) FT4 (pmol/l)Graves-Basedow disease
0.11 ± 0.14 41.07 ± 19.44
Autonomous thyroid adenoma
2.19 ± 2.12 19.66 ± 12.79
Hyperthyroidism in-duced by Amiodarone
0.16 ± 0.15 4.45 ± 14.98
Euthyroid diffuse goiter 1.82 ± 1.14 14.96 ± 4.49Nodular euthyroid goiter 1.76 ± 0.85 16.86 ± 6.63Differentiated thyroid carcinoma
1.9 ± 1.07 21.04 ± 6.99
ACT 10.77 ± 20.07 13.24 ± 5.49Sub acute thyroiditis 2.25 ± 1.76 19.42 ± 11.72
The Graves-Basedow disease was encountered in 60 patients with type 2 diabetes. Depending on the TSH value was performed functional classification of the cases. All cases with Graves-Basedow disease were accompanied by thyrotoxicosis. The correlation between type 2 diabetes and Graves-Basedow disease was not significant (r = -0.10, p <0.001). The Graves-Basedow disease complications were represented by car-diothyreosis, the most common complications that occur as a consequence of cardiac overload and metabolic abnormalities in myocardium. This takes the form of heart failure secondary tachyarrhythmia’s, with increased flow and with resistance to tonicardiac treatment.
Autonomous thyroid adenomas were represented by the “warm” or “hot” nodules. The latter have evolved with less severe thyrotoxicosis than Basedow Graves’ disease. Autonomous thyroid adenoma was found in 3 patients with type 2 diabetes. Depending on the TSH value was performed functional clas-sification of cases.
In the case of type 2 diabetes, 66.67% of autonomous thyroid adenoma cases were euthyroid and 33.34% presented sub clinical hyperthyroidism.
Iodine-induced hyperthyroidism was found in only 4 patients with type 2 diabetes. All cases were induced by administration of amiodarone. In all these TSH was low and FT4 increased. Depending on the TSH value was performed functional classifi-cation of cases. All the above cases functionally were presented with hyperthyroidism.
Euthyroid diffuse goiter was encountered in 125 patients with type 2 diabetes. In all these the hormones functional parameters were normal. Depending on the TSH value was performed functional classification of cases. All cases with diffuse goiter functionally were euthyroid. Nodular euthyroid goiter was represented by adenomas and thyroid cysts. Nodular euthyroid goiter was encountered in 7 cases with type 2 diabetes. Depending on the TSH value was performed functional classification of cases. All cases with nodular goiter functionally were euthyroid.
Thyroid carcinoma was encountered in 10 patients with type 2 diabetes. Depending on the TSH value was performed
functional classification of cases. All cases with thyroid carci-noma functionally were initially euthyroid. All cases received re-quired treatment (total thyroidectomy, treatment with I131, thyroid suppressive therapy). ACT was found in 77 patients with type 2 diabetes. Depending on the TSH value was performed func-tional classification of cases. In the case of the type 2 diabetes group, 70.13% (n = 54) cases presented normal values, and 29.87% (n = 23) cases increased values of TSH. In this group prevailed ACT with euthyroidism (70.13%), followed by ACT with clinical hypothyroidism (25.97%) and then ACT with sub clinical hypothyroidism (3.89%). Also, the correlation coefficient between serum concentration of TSH and HbA1c in all cases with type 2 diabetes and ACT was insignificant (r = - 0.046, p = 0.30). It is generally accepted that evolution of ACT is stages. The risk of hypothyroidism is higher in women over 45 years, presenting slightly increased serum TSH concentrations, and elevated titers of antiTPO AB. The thyroxin therapy induces a decrease in goiter volume at 50-90% cases, corrects the thyroid function and after some authors decreased antibodies titers. The sub acute thyroiditis was encountered only at 4 patients with type 2 diabetes. In these entire hormones functional parameters were normal. Depending on the TSH value was performed functional classification of cases. All cases with sub acute thyroiditis functionally were euthyroid. The sub acute thyroiditis may evolve initially with transient hyperthyroidism, followed then by hypothyroidism.
Humoral immunity was assessed by determining thyroid serum antibodies titers: antiTPO AB and antiTG AB at 58/77 patients with type 2 diabetes. In the case of the type 2 diabetes group with antiTPO AB, they were present in high titers in 79.31% cases (n = 46) and in normal titers in 20.69% cases (n = 12). It was found elevated values of antiTPO AB in 79.31% ACT cases. AntiTPO AB was normal in 20.69% of cases with ACT. At every group we appreciated the onset age of diabetes, current age, diabetes duration, BMI, the values of blood glucose, HbA1c, TSH and FT4. (Tab. IV). It was found significant differences between the 2 groups regarding HbA1c value and insignificant for the rest of the parameters studied.
Table IV. Comparative data (p) between cases with positive antiTPO AB and negative antiTPO AB in adults with type 2 diabetes studied group
Parameters Negative antiTPO AB
Positive antiTPO AB
p
Cases number (%) 43 46 0.65Age (years) 55.25 ± 8.8 54.67 ± 10.56 0.84Onset age of diabetes (years)
53.83 ± 9.19 51.65 ± 10.99 0.49
DM duration (years) 1.41 ± 1.5 3.02 ± 6.38 0.12BMI (kg/m2) 34.81 ± 6.01 32.12 ± 6.17 0.18HbA1c (%) 7.25 ± 1.56 8.59 ± 2.69 0.03Blood glucose (mg %) 115.58 ± 22.37 132.43 ± 42.55 0.06TSH (mIU/ml) 6.69 ± 9.91 7.75 ± 18.15 0.78FT4 (pmol/l) 15.84 ± 7.79 13.9 ± 6 0.43
Fiziologia - Physiology 2012.23.3 (75)8
CONCLUSIONS
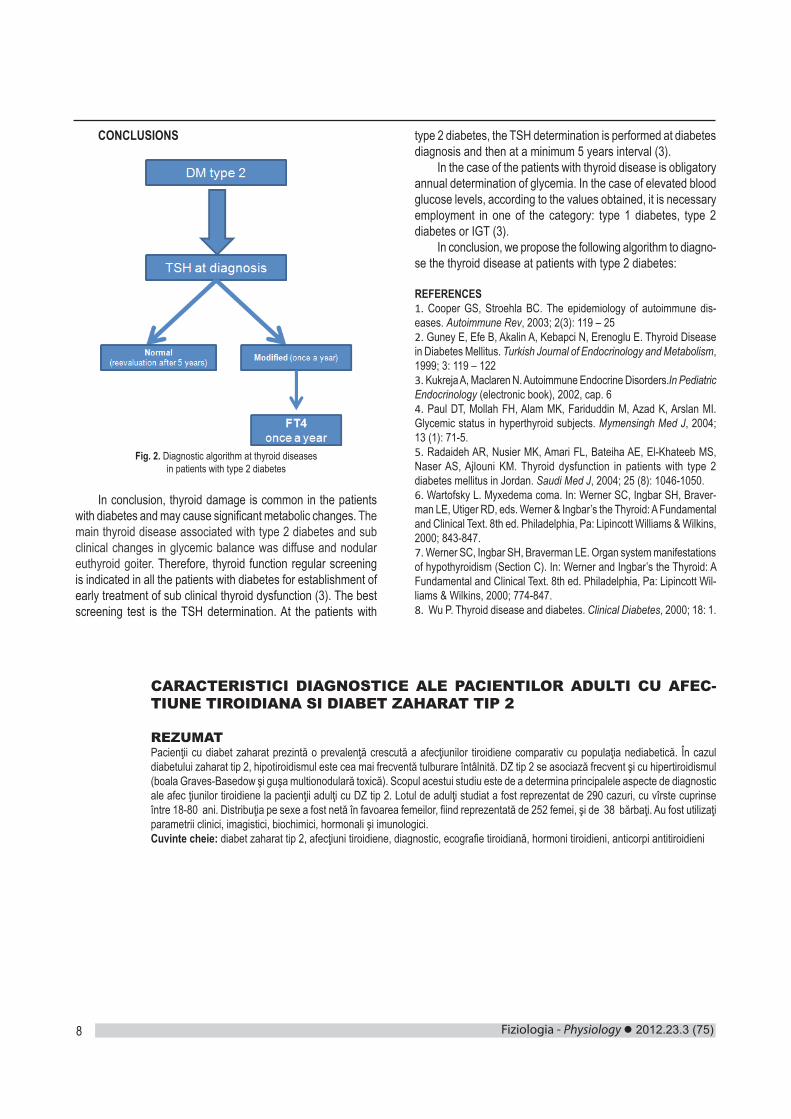
Fig. 2. Diagnostic algorithm at thyroid diseases in patients with type 2 diabetes
In conclusion, thyroid damage is common in the patients with diabetes and may cause significant metabolic changes. The main thyroid disease associated with type 2 diabetes and sub clinical changes in glycemic balance was diffuse and nodular euthyroid goiter. Therefore, thyroid function regular screening is indicated in all the patients with diabetes for establishment of early treatment of sub clinical thyroid dysfunction (3). The best screening test is the TSH determination. At the patients with
type 2 diabetes, the TSH determination is performed at diabetes diagnosis and then at a minimum 5 years interval (3).
In the case of the patients with thyroid disease is obligatory annual determination of glycemia. In the case of elevated blood glucose levels, according to the values obtained, it is necessary employment in one of the category: type 1 diabetes, type 2 diabetes or IGT (3).
In conclusion, we propose the following algorithm to diagno-se the thyroid disease at patients with type 2 diabetes:
REFERENCES1. Cooper GS, Stroehla BC. The epidemiology of autoimmune dis-eases. Autoimmune Rev, 2003; 2(3): 119 – 25 2. Guney E, Efe B, Akalin A, Kebapci N, Erenoglu E. Thyroid Disease in Diabetes Mellitus. Turkish Journal of Endocrinology and Metabolism, 1999; 3: 119 – 122 3. Kukreja A, Maclaren N. Autoimmune Endocrine Disorders.In Pediatric Endocrinology (electronic book), 2002, cap. 6 4. Paul DT, Mollah FH, Alam MK, Fariduddin M, Azad K, Arslan MI. Glycemic status in hyperthyroid subjects. Mymensingh Med J, 2004; 13 (1): 71-5. 5. Radaideh AR, Nusier MK, Amari FL, Bateiha AE, El-Khateeb MS, Naser AS, Ajlouni KM. Thyroid dysfunction in patients with type 2 diabetes mellitus in Jordan. Saudi Med J, 2004; 25 (8): 1046-1050. 6. Wartofsky L. Myxedema coma. In: Werner SC, Ingbar SH, Braver-man LE, Utiger RD, eds. Werner & Ingbar’s the Thyroid: A Fundamental and Clinical Text. 8th ed. Philadelphia, Pa: Lipincott Williams & Wilkins, 2000; 843-847.7. Werner SC, Ingbar SH, Braverman LE. Organ system manifestations of hypothyroidism (Section C). In: Werner and Ingbar’s the Thyroid: A Fundamental and Clinical Text. 8th ed. Philadelphia, Pa: Lipincott Wil-liams & Wilkins, 2000; 774-847. 8. Wu P. Thyroid disease and diabetes. Clinical Diabetes, 2000; 18: 1.
CARACTERISTICI DIAGNOSTICE ALE PACIENTILOR ADULTI CU AFEC-TIUNE TIROIDIANA SI DIABET ZAHARAT TIP 2
REZUMATPacienţii cu diabet zaharat prezintă o prevalenţă crescută a afecţiunilor tiroidiene comparativ cu populaţia nediabetică. În cazul diabetului zaharat tip 2, hipotiroidismul este cea mai frecventă tulburare întâlnită. DZ tip 2 se asociază frecvent şi cu hipertiroidismul (boala Graves-Basedow şi guşa multionodulară toxică). Scopul acestui studiu este de a determina principalele aspecte de diagnostic ale afec ţiunilor tiroidiene la pacienţii adulţi cu DZ tip 2. Lotul de adulţi studiat a fost reprezentat de 290 cazuri, cu vîrste cuprinse între 18-80 ani. Distribuţia pe sexe a fost netă în favoarea femeilor, fiind reprezentată de 252 femei, şi de 38 bărbaţi. Au fost utilizaţi parametrii clinici, imagistici, biochimici, hormonali şi imunologici.Cuvinte cheie: diabet zaharat tip 2, afecţiuni tiroidiene, diagnostic, ecografie tiroidiană, hormoni tiroidieni, anticorpi antitiroidieni
2012.23.3 (75) Fiziologia - Physiology 9
THE MORPHOLOGY OF COLONIES FROM BREAST CANCER SK-BR-3 CELLS IN SEMISOLID MEDIA DEPENDS ON THE MEDIA COMPOSITION
CEAN ADA1, ISTRATOAIE BOGDAN1, CRISTEA MIRABELA2, IVAN ALEXANDRA1, ANGHEL SIMONA2, BOJIN FLORINA1, TANASIE GABRIELA1,2, TATU CARMEN1,2, PANAITESCU CAR-MEN1,2, PAUNESCU VIRGIL1,2
1Department of Functional Sciences, “Victor Babes” University of Medicine and Pharmacy Timisoara, Romania2Immunophysiology and Biotechnologies Center, Clinical County Emergency Hospital Timisoara, Romania
ABSTRACT The 3D culture systems allows rich tissue-specific architecture and specific cell morphology, multiple interactions between cells, a strong cell adhesion, polarization of the cells, restricted cell mobility, cell growth in all directions and offers an extracellular matrix that mimics the native one. The aim of this study was to investigate the morphology of cancer cells colonies, from SK-BR-3 line, when cultured in three semisolid media (3D) and to investigate if surface markers expression and proliferation is influenced by the 3D culture conditions. For our experiments we used a commercial cell line SK-BR-3, human breast adenocarcinoma isolated from a pleural effusion. Confluent monolayer cultures were obtained after thawing SK-BR-3 cells frozen at passage 4. The confluent cultures were detached and four experimental groups were created: cells cultured in MethoCult, cells cultured in Human Methylcellulose Base Media, cells cultured in Matrigel and cells cultured in monolayer (control). After a culture period of 10 days cells were recovered from 3D matrixes and part of them was analyzed, while part of them were replated for subsequent analysis. Our experiments showed that the morphology of cell colonies from SK-BR-3 is highly dependent of the semisolid media in which the cells are cultured. The protein based semisolid media are better for supporting cellular proliferation compared with methylcellulose based media. The flowcytometry analysis of the surface markers showed no significant difference in expression, except for CD44. Cells cultured in Matrigel seem to have a low expression of CD44 compared with cells cultured in monolayer, MethoCult and MethylCellulose. Inclusion of cancer cells in semisolid media had no effect in reducing cell proliferation as shown by high Ki67 marker expression. Key words: SK-BR-3 cell line, 3D culture systems, phenotypic markers, cellular proliferation
INTRODUCTION
Monolayer cell culture is the most common technique used in laboratories all over the world, but recently the limitation of this technique has directed the research into finding techniques that allows culturing the cells in vitro but with morphology and interactions resembling more with in vivo conditions. Cells in monolayer culture have poor tissue-specific architecture, are flat and extended, have limited interactions, weak cell adhesion, fast or free mobility, high proliferation, a directional growth, partially polarization and absent or poor extracellular matrix remodeling. The 3D culture systems allows rich tissue-specific architecture and specific cell morphology, multiple interactions between cells, a strong cell adhesion, polarization of the cells, restricted cell mobility, cell growth in all directions and offers an extracellular matrix that mimics the native one (5).
The extracellular matrix (ECM) is a mixture of substances (proteoglycans, proteins, signaling molecules, etc.) that, in the past, was considered to have only a structural role in supporting cells and an environment for cell migration. Recent advancement in science showed that ECM plays an active role in cell adhesion (1), signaling (12) and cell differentiation (9).
Mammary gland cells are in tight contact with each other and with ECM, and trough cell-mediated contraction they sense the stiffness of their microenvironment and respond with appro-priate signaling regulating gene expression and differentiation. Mechanical regulation is playing an important role in breast carcinoma progression, since the alteration of ECM deposi-tions, composition, and organization results in stiffer matrices that activate signaling pathways that induce cell proliferation, facilitating tumor cell invasion, and promote progression of cancer. Schedin P. (11) underlined the important role of me-chanic forces in the mammary gland in maintaining physiologic function of cells (11). The aim of this study was to investigate the morphology of cancer cells colonies, from SK-BR-3 cell line, when cultured in three semisolid media (3D) and to investigate if surface markers expression and proliferation is influenced by the 3D culture conditions.
MATERIALS AND METHODS
Cell lineFor our experiments we used a commercial cancerous cell
Received 20th of August 2012. Accepted 10th of September 2012. Address for correspondence: Biotech Eng Ada Cean, MS, PhD, Department of of Functional Sciences, “Victor Babes” University of Medicine and Pharmacy Timisoara, Romania, Immunophysiology and Biotechnologies Center, Eftimie Murgu Square No. 2A, RO-30041, e-mail: [email protected]
Fiziologia - Physiology 2012.23.3 (75)10
line SK-BR-3, human breast adenocarcinoma. This cell line was derived by G. Trempe and L.J. Old in 1970 from a pleural effusion from a 43 years old female patient, diagnosed with mammary gland adenocarcinoma. This is a hypertriploid human cell line with the modal chromosome number of 84, occurring in 34% of cells.Cells having 80 chromosomes also occurring in 28% of the cells. The SK-BR-3 cell line overexpresses the HER2/c-erb-2 gene product, but has no expression for estrogen or proges-terone receptors. Ultrastructural features include microvilli and desmosomes, glycogen granules, large lysosomes, bundles of cytoplasmic fibrils.
Maintaining this cell culture requires the following condi-tions: culture medium McCoy’s 5a Medium Modified (ATCC, Manassas, USA), supplemented with 10% Fetal Calf Serum (PromoCell, Heidelberg, Germany) and 2% Pen/Strep (10,000 IU/mL, PromoCell) and incubation at 37°C, 5% CO2.
Experimental designConfluent monolayer cultures were obtained after thawing
SK-BR-3 cells frozen at passage 4. The confluent cultures were detached by standard trypsin method, live cells counted and four experimental groups were created: cells cultured in MethoCult, cells cultured in Human Methylcellulose Base Media, cells cultured in Matrigel and cells cultured in monolayer (control). After a culture period of 10 days cells were recovered from 3D matrixes and part of them was analyzed and part of them were replated for subsequent analysis.
Cell evaluation Cells were evaluated during the culture in semisolid matrix,
immediately after recovering them from matrix and after removal of matrix after a short 2D culture (4 days).
During the 3D culture period the evaluation was performed by monitoring each day, at inverted microscope (Olympus IX70), the development of the cells.
At the end of the 3D culture period the total number of live cells was determined by Trypan Blue exclusion method and the number was determined using Neubauer hemacytometer. Cells were analyzed using flowcytometric method for evaluation of surface receptors and adhesion proteins expression. Protein expression pattern was also evaluated and confirmed by im-munofluorescence analysis.
After recovery from matrix cells were replated in 2 cm2 glass chamber culture dishes (104 cells /cm2) and cultured for 4 days in monolayer system.
Semisolid media cell culture For our experiments we used three semisolid media,
MethoCult (Stem Cell, Vancouver, Canada), Human Methylcel-lulose Base Media (R&D Systems, Minneapolis, SUA), based on methylcellulose, and Matrigel Basement Membrane Matrix (BD Biosciences, San Jose, CA, USA), based on proteins. For the culture of cells in semisolid media a 10X cell suspension was prepared in McCoy’s Medium (Gibco, BRL, Invitrogen, Carlsbad, CA, USA) with 50% FCS (Fetal Calf Serum, PromoCell).
MethoCult and Methylcellulose media were warmed at 37°C, shortly before usage. The cell suspension and methylcel-lulose based media were mixed and dispensed, with a syringe with 18G, in 10 cm2 culture dishes. The thickness of the cell layer was approximately 1mm. The culture dishes were introduced in a 100 cm 2 dish, without lid and with additional 10cm2 with water, in order to prevent drying of the matrix. The 100 cm2 dish was covered with the lid and the cells were cultured in this system for 10 days. Cells were recovered from these matrixes by diluting, up to 10 times.
Matrigel matrix was thawed overnight at 4°C. The cell suspension was mixed with the matrix, and dispensed, with a precooled (-20°C, at least 2 hours) syringe, in 10 cm2 culture dish. We used 1-1,5 mL of Marigel for each culture dish of 10cm2, which resulted in a thickness of the cell layer of 1mm. The dish was introduced at incubator in humid atmosphere, at 37°C, for 30 minutes than 2 mL of culture media (McCoy’s, with 10% FCS) was laid on top on the stabilized matrix. Cells were cultured for 10 days, with the media refreshed at every 3 days. Cells were recovered from Matrigel using Dispase (BD Biosciences), 100 UI/10cm2 (aprox. 2mL).
Flowcytometry After 10 days of culture, and recovery of the cells from
matrix, the cells were resuspended in PBS (Phosphate Buffer Saline, Sigma, St. Louis, MO, USA), for flowcytometeric analy-sis. 105 cells were placed in each analysis tube, and mouse anti-human fluorochrome-conjugated antibodies were added at a dilution specified in the manufacturer’s protocol. The cells were incubated with the elected antibodies in the dark, at room temperature for 30 min. After the incubation period, cells were washed twice with 2 mL Cell Wash Solution (BD Biosciences, San Jose, CA, USA) and resuspended in 500 μL of the same solution, for further analysis.
The antibodies used for the flowcytometric analysis, pur-chased from BD Biosciences were the following: PE-conjugated, CD29 (Integrin beta-1), EpCAM (Epithelial cell adhesion mol-ecule), VEGF-R2 (Vascular Endothelial Growth Factor Receptor 2), CXCR4 (Chemokine Receptor Type 4), and FITC-conjugated CD90 (Thy-1), HER2 (Human Epidermal Growth Factor Receptor 2), CD24 (Heat Stable Antigen Homologue), CD44 (Receptor for hyaluronic acid).
The analysis was performed on a four-color capable FACS Calibur (Becton-Dickinson) flowcytometer. Data analysis was performed with Windows Multiple Document Interface Flow Cytometry Application software (WinMDI version 2.9).
Immunofluorescence analysisBy immunofluorescence assay the expression of CD29
(β1 integrin, Abcam, Cambridge, UK), Her2 (Human Epidermal Grow Factor Receptor 2, DakoCytomation, Glostrup, Denmark) and Ki67 (cellular marker for proliferation, Dako) was by im-munofluorescence assay.
Cells that were analyzed immediately after recovery from matrix were transferred on a microscope glass by spinning using
2012.23.3 (75) Fiziologia - Physiology 11
a cytocentrifuge (Thermo Scientific Cytospin 4). For each sample were used 5 104 cells. After spinning cells were fixed using methanol and placed at 4°C in PBS until staining was performed.
The immunofluorescence staining was performed as fol-lows: cells were fixed with methanol for 10 minutes at -20 oC, washed 2 times in PBS, and then the primary antibody was added (diluted according to manufacturer specifications). The samples were incubated for 24 h at 4°C, in a humidified chamber, washed 2 times with PBS, and then the secondary antibody was added, followed by 1 h incubation period, in the dark. The final step was nuclear staining using DAPI (Sigma).
The expression of CD29 was analyzed on cells fixed im-mediately after recovering from the semisolid matrix, using as primary antibody Mouse monoclonal to Integrin beta 1 (Abcam) and as secondary antibody Alexa Fluor 594 goat anti-mouse (Invitrogen, Carlsbad, CA, USA).
HER2 expression was analyzed on cells fixed immediately after recovery from matrix and also on cells fixed after 5 days of culture after recovery from semisolid matrix, using Polyclonal Rabbit Anti-Human c-erbB-2 Oncoprotein (Dako) as primary antibody, and Alexa Fluor 488 donkey anti-rabbit as secondary antibody. Cell proliferation was analyzed on fixed cells, cultured in 2D for 4 days after recovery from semisolid matrix using as primary antibody Monoclonal Mouse Anti-Human – Ki67 Antigen Clone MIB-1 (Dako) and as secondary antibody Alexa Fluor 594 goat anti-mouse (Invitrogen).
RNA extraction and RT-PCRRNA extraction was performed with GenElute Mam-
malian Total RNA (Sigma), and the extraction protocol was performed according to manufacturer protocol. RNA concen-tration was measured with Nandodrop ND-100 (Wilmington, DE, USA) spectrophotometer. For RT-PCR we used 200 ng/reaction and fragments of 113 bp from HER 2 (ERBB2 gene) mRNA were amplified. The primers used were the follow-ing: Forward CTG-GTG-ACA-CAG-CTT-ATC-CCC-T and Reverse ATC-CCC-TTG-GCA-ATC-TGC-A. The PCR was performed with Thermal Cycler 2720 (Applied Biosystems) and the program used was: 50°C - 31’, 95°C-15, (94°C-1’, 60°C-1’, 72°C-1’) x 35 cycles, 72°C-10’, 4°C-∞. Samples were migrated in 2% agarose gel (Sigma) with 1% ethidium bromide for nucleic acids staining, at 75V, 30’. Gels were analyzed in UV light with Flor-STM MultiImager (BioRad, BioRad, California, USA).
RESULTS AND DISCUSSIONS
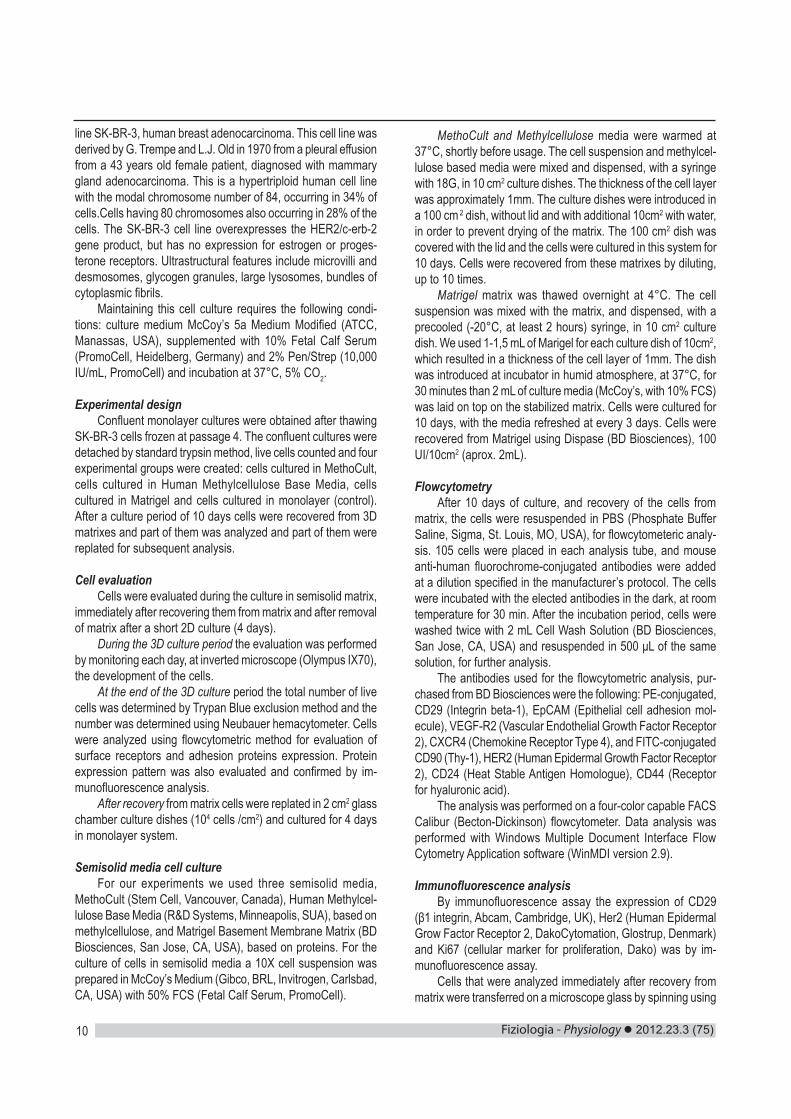
During the culture period cell development was monitored daily. In figure 1 the microscopic aspect of the cells, cultured in semisolid matrix, is represented, at the start of the culture period (day 1), in the middle (day 5) and at the end of the 3D culture (day 10).
During the culture period we observed that cells in Matrigel had a different morphological aspect when compared with cells
in MethylCellulose or MethoCult. Cells in Matrigel developed into large invasive colonies with numerous cellular extensions and protrusions that connected with each other at the end of the cultured period (fig. 1. C, F and I). Cells in MethoCult formed small, round, colonies that did not connect with each other during the culture period (fig.1. A, D and G). Cells that were cultured in MethylCellulose had an intermediate developmental pattern most of the colonies had no cellular extensions, but through the end of the culture period more cells started to exhibit extensions, the colonies were smaller in diameter that the cells in Matrigel but bigger than the one in MethoCult, some of them even connect with others (fig. 1. B, E and H).
Fig.1. Microscopic aspect of the SK-BR-3 cells during the culture in semisolid matrix, MethoCult A (day 1), D (day 5) and G (day 10), MethylCellulose B
(day 1), E (day 5) and H (day 10), Matrigel C (day 1), F (day 5) and I (day 10)
After removing the cells form matrix as described above the total number of viable cells was: 1.32 x 10⁶ for MethoCult, 1.44 x 10⁶ for cells in MethylCellulose, and 7.8 x 10⁶ for Matrigel. Our observations are consisted with the specialty literature, in which is mentioned the fact that cells in 3D matrix have different morphologies compared with cells in 2D (8). In specialty literature the colonies formed by the cells in 3D media are classified into four distinct morphological groups: round, mass, grape-like, stellate, and determined that SK-BR-3 cells fall into grape-like category (6, 8). Our observations showed that, according to Praic A. Kenney, (8) colonies classification, the cells from SK-BR-3 line cultured in MethoCult and Meth-ylCellulose can be classified as mass rather than grape-like colonies. Towards the end of the culture period, the cells in MethylCellulose developed into stellate colonies. Our studies revealed that colonies of cells in MethoCult and MethylCellu-lose are not uniform in morphology, some of them were stellate, mass or grape-like, but we noticed no round colonies. On the opposite, cells cultured in Matrigel formed uniform morphology colonies, and all of them were stellate. Our findings shows that the morphology of SK-BR-3 colonies depends greatly of the media in which they are cultured, thus explaining the difference between the morphology of the SK-BR-3 colonies formed within different media used.
Fiziologia - Physiology 2012.23.3 (75)12
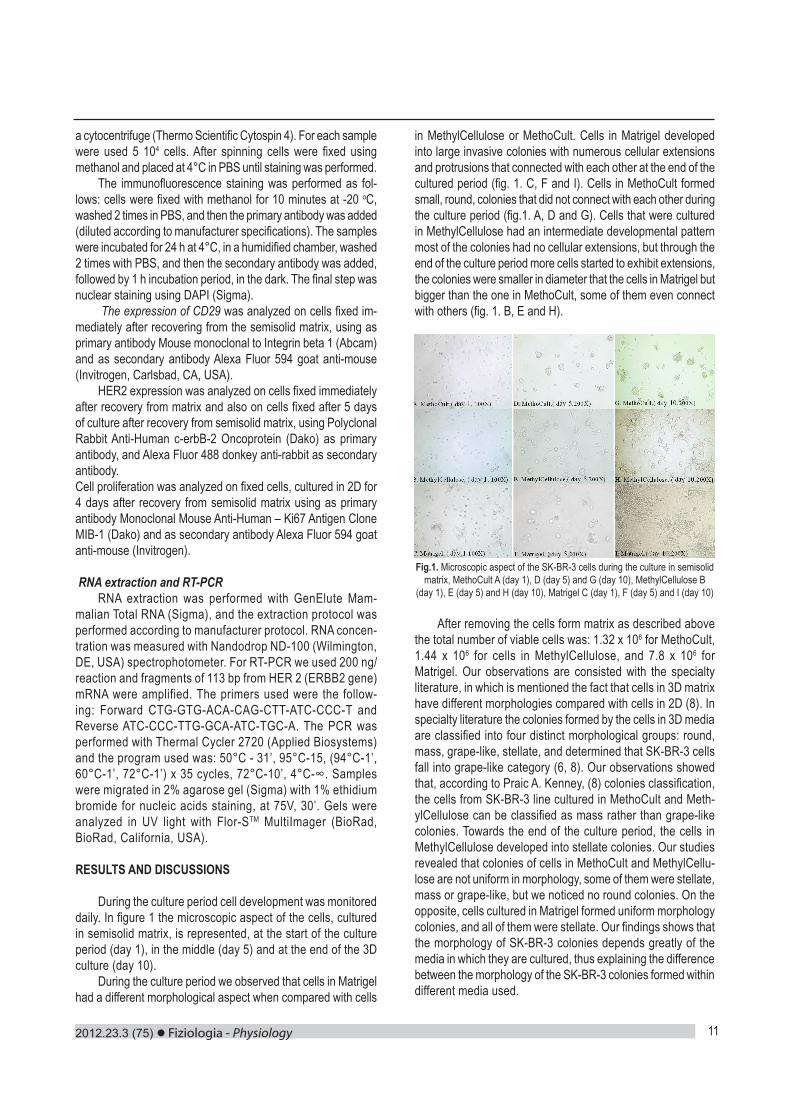
Fig.2. Flowcytometry histograms, showing negative cells for CD90 (A), EpCam (B), Her2 (C), VGF-R2 (D), CD24 (E) and positive for CD29 (F), re-
gardless of the media the cells were cultured in. Interestingly is that for CD44 (G) and CXCR4 (H) cells cultured in Matrigel were negative while cells from control were indicating a slightly more positive population for CD44. Cells
cultured in MethoCult and MethylCellulose seem to be two populations one CD44+ weak and one CD44-, but the overall expression of CD44 was week. For CXCR4 (G) the situation is similar with CD44 meaning that the control
cells seem positive meanwhile cells cultured in Matrigel are negative.
CD44 are cell adhesion molecules, glycoprotein members of hyaluronate receptor family, whose major function is to bind to the ligands from extracellular matrix (ECM) (7). The CD44- characteristic of SK-BR-3 cells is consistent with data in specialty literature in which SK-BR-3 cells are mentioned as 84% CD44-/CD24+ (13). After flowcytometric analysis of the cells cultured in 3D media we can say that no significant differences were observed between the three semisolid media and control, with the respect of the surface molecules expression.
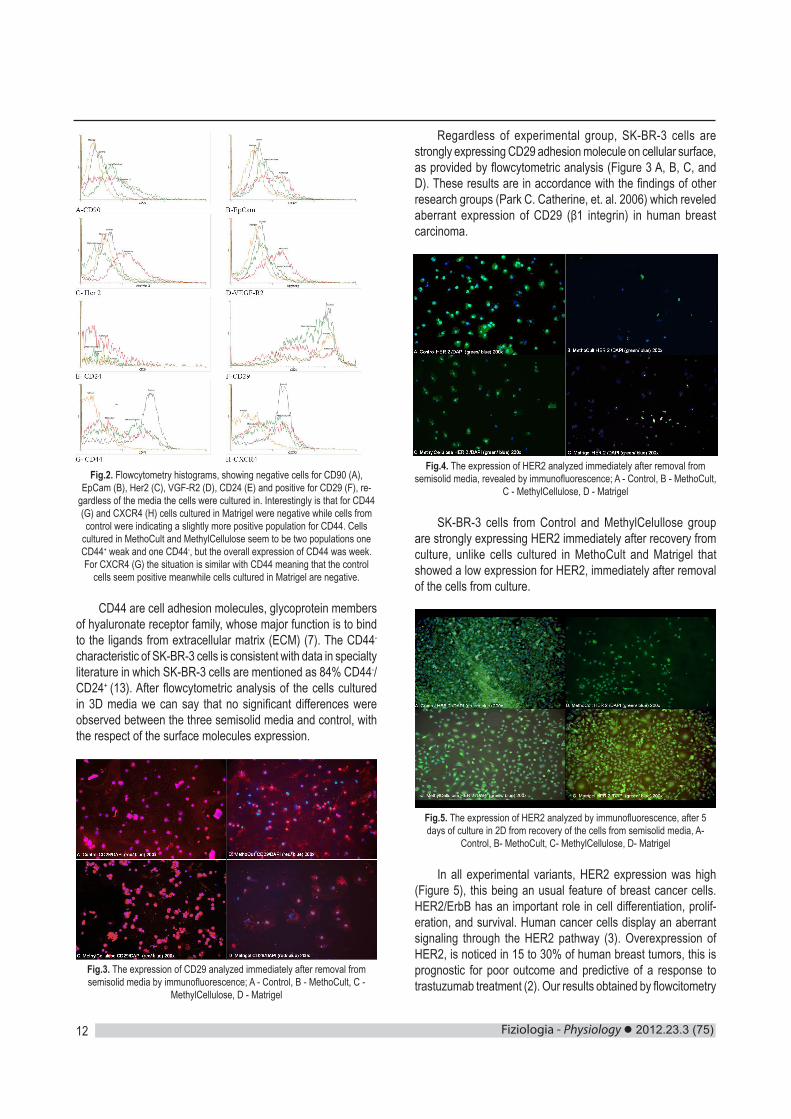
Fig.3. The expression of CD29 analyzed immediately after removal from semisolid media by immunofluorescence; A - Control, B - MethoCult, C -
MethylCellulose, D - Matrigel
Regardless of experimental group, SK-BR-3 cells are strongly expressing CD29 adhesion molecule on cellular surface, as provided by flowcytometric analysis (Figure 3 A, B, C, and D). These results are in accordance with the findings of other research groups (Park C. Catherine, et. al. 2006) which reveled aberrant expression of CD29 (β1 integrin) in human breast carcinoma.
Fig.4. The expression of HER2 analyzed immediately after removal from semisolid media, revealed by immunofluorescence; A - Control, B - MethoCult,
C - MethylCellulose, D - Matrigel
SK-BR-3 cells from Control and MethylCelullose group are strongly expressing HER2 immediately after recovery from culture, unlike cells cultured in MethoCult and Matrigel that showed a low expression for HER2, immediately after removal of the cells from culture.
Fig.5. The expression of HER2 analyzed by immunofluorescence, after 5 days of culture in 2D from recovery of the cells from semisolid media, A-
Control, B- MethoCult, C- MethylCellulose, D- Matrigel
In all experimental variants, HER2 expression was high (Figure 5), this being an usual feature of breast cancer cells. HER2/ErbB has an important role in cell differentiation, prolif-eration, and survival. Human cancer cells display an aberrant signaling through the HER2 pathway (3). Overexpression of HER2, is noticed in 15 to 30% of human breast tumors, this is prognostic for poor outcome and predictive of a response to trastuzumab treatment (2). Our results obtained by flowcitometry
2012.23.3 (75) Fiziologia - Physiology 13
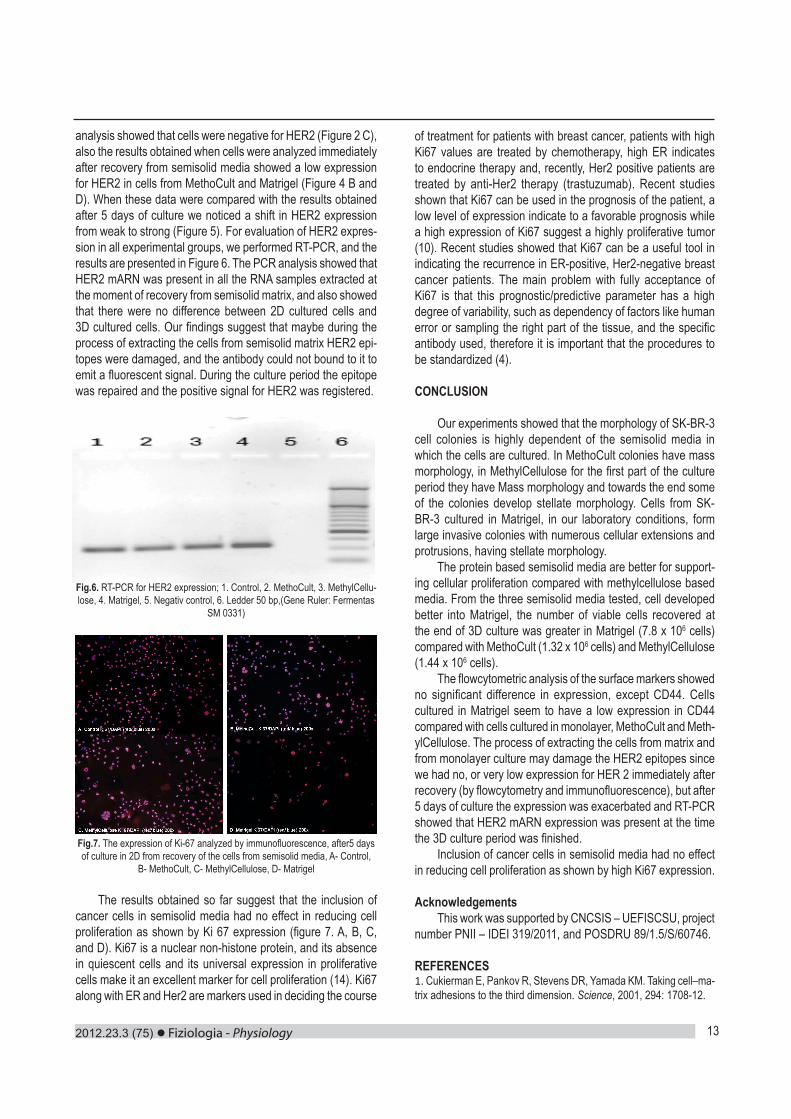
analysis showed that cells were negative for HER2 (Figure 2 C), also the results obtained when cells were analyzed immediately after recovery from semisolid media showed a low expression for HER2 in cells from MethoCult and Matrigel (Figure 4 B and D). When these data were compared with the results obtained after 5 days of culture we noticed a shift in HER2 expression from weak to strong (Figure 5). For evaluation of HER2 expres-sion in all experimental groups, we performed RT-PCR, and the results are presented in Figure 6. The PCR analysis showed that HER2 mARN was present in all the RNA samples extracted at the moment of recovery from semisolid matrix, and also showed that there were no difference between 2D cultured cells and 3D cultured cells. Our findings suggest that maybe during the process of extracting the cells from semisolid matrix HER2 epi-topes were damaged, and the antibody could not bound to it to emit a fluorescent signal. During the culture period the epitope was repaired and the positive signal for HER2 was registered.
Fig.6. RT-PCR for HER2 expression; 1. Control, 2. MethoCult, 3. MethylCellu-lose, 4. Matrigel, 5. Negativ control, 6. Ledder 50 bp,(Gene Ruler: Fermentas
SM 0331)
Fig.7. The expression of Ki-67 analyzed by immunofluorescence, after5 days of culture in 2D from recovery of the cells from semisolid media, A- Control,
B- MethoCult, C- MethylCellulose, D- Matrigel
The results obtained so far suggest that the inclusion of cancer cells in semisolid media had no effect in reducing cell proliferation as shown by Ki 67 expression (figure 7. A, B, C, and D). Ki67 is a nuclear non-histone protein, and its absence in quiescent cells and its universal expression in proliferative cells make it an excellent marker for cell proliferation (14). Ki67 along with ER and Her2 are markers used in deciding the course
of treatment for patients with breast cancer, patients with high Ki67 values are treated by chemotherapy, high ER indicates to endocrine therapy and, recently, Her2 positive patients are treated by anti-Her2 therapy (trastuzumab). Recent studies shown that Ki67 can be used in the prognosis of the patient, a low level of expression indicate to a favorable prognosis while a high expression of Ki67 suggest a highly proliferative tumor (10). Recent studies showed that Ki67 can be a useful tool in indicating the recurrence in ER-positive, Her2-negative breast cancer patients. The main problem with fully acceptance of Ki67 is that this prognostic/predictive parameter has a high degree of variability, such as dependency of factors like human error or sampling the right part of the tissue, and the specific antibody used, therefore it is important that the procedures to be standardized (4). CONCLUSION
Our experiments showed that the morphology of SK-BR-3 cell colonies is highly dependent of the semisolid media in which the cells are cultured. In MethoCult colonies have mass morphology, in MethylCellulose for the first part of the culture period they have Mass morphology and towards the end some of the colonies develop stellate morphology. Cells from SK-BR-3 cultured in Matrigel, in our laboratory conditions, form large invasive colonies with numerous cellular extensions and protrusions, having stellate morphology.
The protein based semisolid media are better for support-ing cellular proliferation compared with methylcellulose based media. From the three semisolid media tested, cell developed better into Matrigel, the number of viable cells recovered at the end of 3D culture was greater in Matrigel (7.8 x 10⁶ cells) compared with MethoCult (1.32 x 10⁶ cells) and MethylCellulose (1.44 x 10⁶ cells).
The flowcytometric analysis of the surface markers showed no significant difference in expression, except CD44. Cells cultured in Matrigel seem to have a low expression in CD44 compared with cells cultured in monolayer, MethoCult and Meth-ylCellulose. The process of extracting the cells from matrix and from monolayer culture may damage the HER2 epitopes since we had no, or very low expression for HER 2 immediately after recovery (by flowcytometry and immunofluorescence), but after 5 days of culture the expression was exacerbated and RT-PCR showed that HER2 mARN expression was present at the time the 3D culture period was finished.
Inclusion of cancer cells in semisolid media had no effect in reducing cell proliferation as shown by high Ki67 expression.
AcknowledgementsThis work was supported by CNCSIS – UEFISCSU, project
number PNII – IDEI 319/2011, and POSDRU 89/1.5/S/60746.
REFERENCES1. Cukierman E, Pankov R, Stevens DR, Yamada KM. Taking cell–ma-trix adhesions to the third dimension. Science, 2001, 294: 1708-12.
Fiziologia - Physiology 2012.23.3 (75)14
2. DeFazio-EL, Strommen K, Dao-Pick T, Parry G, Goodman L, Winslow J. Quantitative assays for the measurement of HER1-HER2 heterodimerization and phosphorylation in cell lines and breast tumors: applications for diagnostics and targeted drug mechanism of action. Breast Cancer Research 2011, 13:R44.3. Dua R, Zhang J, Nhonthachit P, Penuel E, Petropoulos C, Parry G. EGFR over-expression and activation in high HER2, ER negative breast cancer cell line induces trastuzumab resistance. Breast Cancer Research and Treatment, 2010; 122(3): 685-697.4. Fasanella S, Leonardi E, Cantaloni C, Eccher C, Bazzanella I, Aldovini D, et.al. Proliferative activity in human breast cancer: Ki-67 automated evaluation and the influence of different Ki-67 equivalent antibodies. Diagnostic Pathology, 2011, 6 (Suppl 1): S7.5. Geckil H, Feng Xu, Xiaohui Z, SangJun M, Utkan D. Engineering hydrogels as extracellular matrix mimics. Nanomedicine, 2010, 5(3); 469-484.6. Genee Y Lee, Kenny PA, Lee EH, and Bissell MJ. Three-dimensional culture models of normal and malignant breast epithelial cells. Nat Methods, 2007; 4(4): 359-365.7. Goodison SV, Urquidi DT. CD44 cell adhesion molecules. J Clin Pathol: Mol Pathol, 1999; 52:189-196.8. Kenny PA, Genee YL, Myers CA, Neve RM, Semeiks JR, Spellman
PT, Lorenz K, et.al. The morphologies of breast cancer cell lines in three-dimensional assays correlate with their profiles of gene expres-sion. Molecular Oncology, 2007; 1: 84-96.9. Lund AW, Yener B, Stegemann JP, Plopper GE. The Natural and Engineered 3D Microenvironment as a Regulatory Cue During Stem Cell Fate Determination. Tissue Eng Part B Rev., 2009; 15(3): 371-380. 10. Nishimura R, Tomofumi O, Yasuhiro O, Rumiko T, Yasuo T, Nobuyuki A. Changes in the ER, PgR, HER2, p53 and Ki-67, biological markers between primary and recurrent, breast cancer: discordance rates and prognosis. World Journal of Surgical Oncology, 2011; 9: 131.11. Schedin P. and Keely P. J., Mammary Gland ECM Remodeling, Stiffness, and Mechanosignaling in Normal Development and Tumor Progression, Cold Spring Harb Perspect Biol January 2011, 1;3(1). 12. Shawn C. O., Shoichet M. S., Design of three-dimensional bio-mimetic scaffolds, Journal of Biomedical Materials Research Part A, Volume 94A, Issue 4, pages 1321–133113. Sheridan C, Kishimoto H, Fuchs RK, Mehrotra S, Bhat- Nakshatri P, Turner CH, et. al. CD44+/CD24- breast cancer cells exhibit enhanced invasive properties: an early step necessary for metastasis. Breast Cancer Research, 2006; 8: R59.14. Urruticoechea A, Smith IE, Dowsett M. Proliferation Marker Ki-67 in Early Breast Cancer. Journal Of Clinical Oncology, Biology of Neoplasia, 2005; 23: 7212-20.
ASPECTELE MORFOLOGICE ALE COLONIILOR CELULARE FORMATE DE LINIA TUMORALA MAMARA SK-BR-3 SUNT CORELATE CU COMPO-ZITIA MEDIULUI DE CULTURA SEMISOLID
REZUMATSistemele 3D utilizate pentru culturile celulare permit dezvoltarea in vitro a arhitecturii specific tisulare, a unei morfologii celulare specific, a multiple interactiuni intercelulare, adeziune celulara ferma, polarizare, mobilitate celulara redusa, crestere celulara multidirectionala, oferind totodata o matrice extracelulara care mimeaza tesutul nativ. Scopul acestui studiu a fost de a investiga morfologia coloniilor celulelor tumorale ale liniei SK-BR-3, cultivate in 3 tipuri de medii semisolide (3D) si de a analiza expresia markerilor de suprafata si proliferarea sub influenta conditiilor de cultura 3D. Pentru experimentele desfasurate am utilizat linia celulara SK-BR-3 de adenocar-cionm mamar uman, izolata din efuzia pleurala. Culturile celulare monostrat confluente au fost obtinute dupa dezghetarea celulelor SK-BR-3 aflate la pasajul 4. Celulele aflate la confluenta au fost detasate enzimatic si au fost impartite in 4 grupuri experimentale: celule cultivate in MethoCult, celule cultivate in Human Methylcellulose Base Media, celule cultivate in Matrigel si celule cultivate in monostrat (control). Dupa o perioada de 10 de la initierea culturii, celulele au fost izolate din matricile 3D, iar o parte dintre acestea au fost analizate, in timp ce o alta parte au fost re-cultivate in vederea analizelor ulterioare. Rezultatele obtinute in urma experi-mentelor au aratat ca morfologia coloniilor celulare ale liniei SK-BR-3 este dependenta intr-o foarte mare masura de tipul mediului semisolid in care au fost cultivate. Mediile semisolide imbogatite in proteine asigura un suport nutritiv superior, inducand o crestere a proliferarii celulare, comparativ cu mediile pe baza de metilceluloza. Analiza flowcitometrica a markerilor de suprafata nu a relevat diferente semnificative in expresia acestora, comparativ cu grupul de control, cu exceptia CD44. Celulele cultivate in Matrigel au prezentat expresie scazuta a CD44, comparativ cu celulele cultivate in monostrat, MethoCult si MethylCellulose. Cultivarea celulelor tumorale in medii semisolide nu a avut efecte semnificate asupra proliferarii celulare, evaluata prin expresia markerului nuclear Ki67. Cuvinte cheie: linia celulara SK-BR-3, sisteme de cultura 3D, markeri fenotipici, proliferare celulara
2012.23.3 (75) Fiziologia - Physiology 15
A SIMPLE ECG RECORDING HARDWARE FOR LANGENDORFF ISOLATED HEART EXPERIMENTSMARCEL PERIAN, DAN DOBREANU, CARMEN CALDARARU, MARIUS SABAUTârgu Mureş University of Medicine and Pharmacy, Physiology Department
ABSTRACTThe isolated perfused small mammalian heart probably represents the optimal compromise in the conflict between the quantity and quality of data that can be acquired from an experimental model versus its clinical relevance. The ECG recording is done via circumferential electrode arrays around the heart. The amplifier needs to amplify useful heart-generated potentials and to reject as much as possible the parasitic signals picked up from environment. The amplifier designed by our team is based on AD623 integrated circuit produced by Analog Devices. This circuit have a very high CMRR (110 dB) over a large frequency range. The use of an optocoupler at the output of the amplifier ensures galvanic separation (as high as 3KV), but also allows the amplifier to operate in a very large range of output voltages (between 650mV and 24V). We had no need for filtering, but if it is necessary and a hardware filter is not available, the filtering can be done after the recording, using the analysis software features. The quality of the recorded trace is very good and we consider this amplifier a reliable alternative to the high-cost amplifiers offered for several Langendorff systems on the market.Key words: ECG, amplifier, CMRR, Langendorff, isolated heart, AD623, optocoupler
Received 15th of August 2012. Accepted 1st of September 2012. Address for correspondence: Dr. Marcel Perian, Târgu Mureş University of Medicine and Pharmacy, Physiology Department, Gh. Marinescu Street No. 38, 540000 Targu Mures, Mures, Romania, e-mail: [email protected]
INTRODUCTIONThe isolated perfused small mammalian heart probably repre-
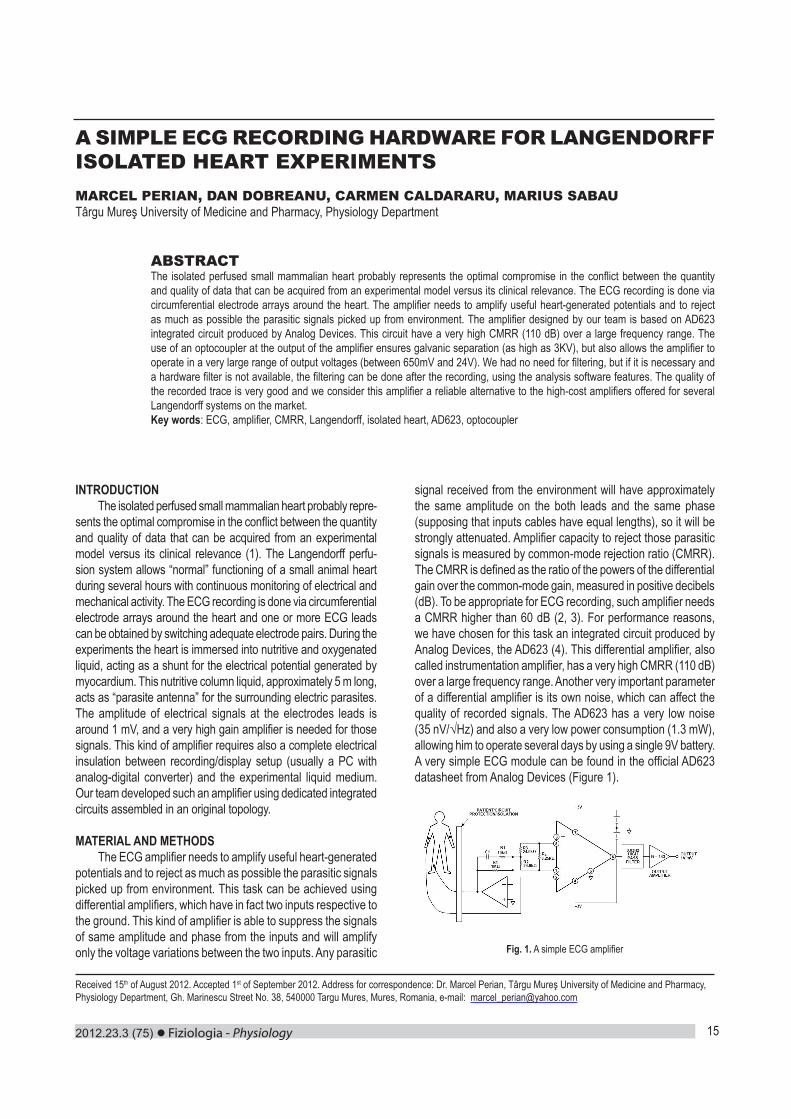
sents the optimal compromise in the conflict between the quantity and quality of data that can be acquired from an experimental model versus its clinical relevance (1). The Langendorff perfu-sion system allows “normal” functioning of a small animal heart during several hours with continuous monitoring of electrical and mechanical activity. The ECG recording is done via circumferential electrode arrays around the heart and one or more ECG leads can be obtained by switching adequate electrode pairs. During the experiments the heart is immersed into nutritive and oxygenated liquid, acting as a shunt for the electrical potential generated by myocardium. This nutritive column liquid, approximately 5 m long, acts as “parasite antenna” for the surrounding electric parasites. The amplitude of electrical signals at the electrodes leads is around 1 mV, and a very high gain amplifier is needed for those signals. This kind of amplifier requires also a complete electrical insulation between recording/display setup (usually a PC with analog-digital converter) and the experimental liquid medium. Our team developed such an amplifier using dedicated integrated circuits assembled in an original topology.
MATERIAL AND METHODSThe ECG amplifier needs to amplify useful heart-generated
potentials and to reject as much as possible the parasitic signals picked up from environment. This task can be achieved using differential amplifiers, which have in fact two inputs respective to the ground. This kind of amplifier is able to suppress the signals of same amplitude and phase from the inputs and will amplify only the voltage variations between the two inputs. Any parasitic
signal received from the environment will have approximately the same amplitude on the both leads and the same phase (supposing that inputs cables have equal lengths), so it will be strongly attenuated. Amplifier capacity to reject those parasitic signals is measured by common-mode rejection ratio (CMRR). The CMRR is defined as the ratio of the powers of the differential gain over the common-mode gain, measured in positive decibels (dB). To be appropriate for ECG recording, such amplifier needs a CMRR higher than 60 dB (2, 3). For performance reasons, we have chosen for this task an integrated circuit produced by Analog Devices, the AD623 (4). This differential amplifier, also called instrumentation amplifier, has a very high CMRR (110 dB) over a large frequency range. Another very important parameter of a differential amplifier is its own noise, which can affect the quality of recorded signals. The AD623 has a very low noise (35 nV/√Hz) and also a very low power consumption (1.3 mW), allowing him to operate several days by using a single 9V battery. A very simple ECG module can be found in the official AD623 datasheet from Analog Devices (Figure 1).
Fig. 1. A simple ECG amplifier
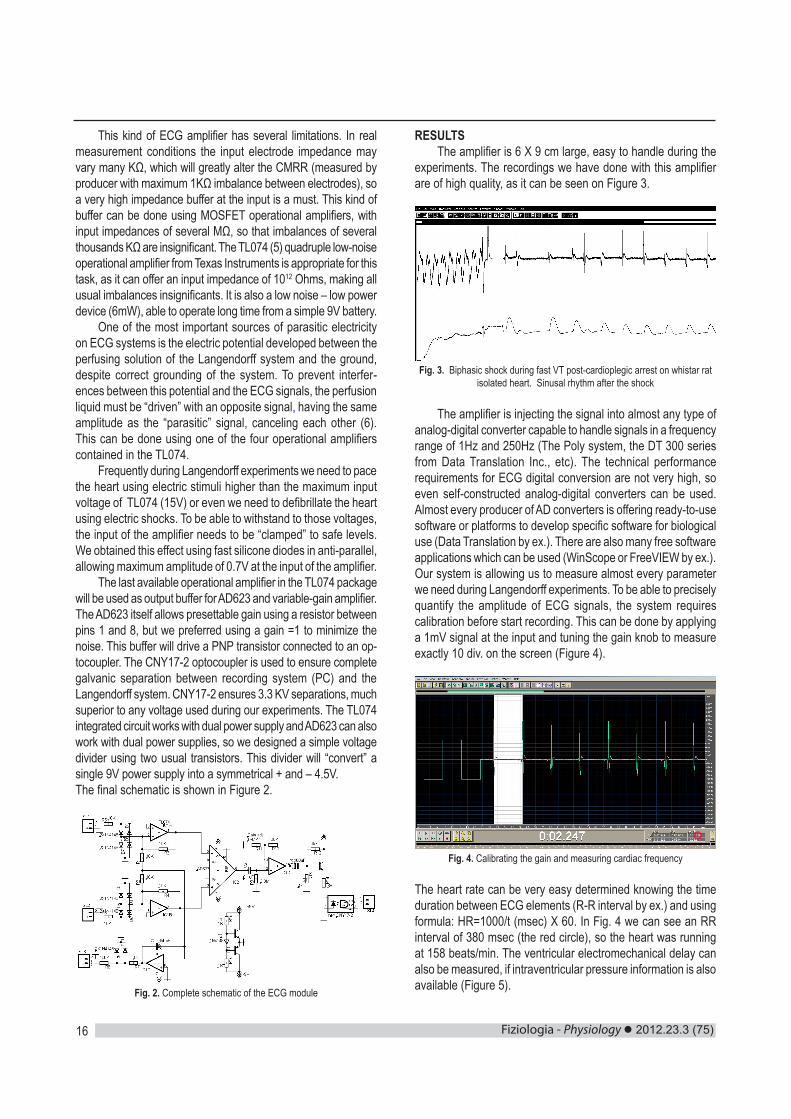
Fiziologia - Physiology 2012.23.3 (75)16
This kind of ECG amplifier has several limitations. In real measurement conditions the input electrode impedance may vary many KΩ, which will greatly alter the CMRR (measured by producer with maximum 1KΩ imbalance between electrodes), so a very high impedance buffer at the input is a must. This kind of buffer can be done using MOSFET operational amplifiers, with input impedances of several MΩ, so that imbalances of several thousands KΩ are insignificant. The TL074 (5) quadruple low-noise operational amplifier from Texas Instruments is appropriate for this task, as it can offer an input impedance of 1012 Ohms, making all usual imbalances insignificants. It is also a low noise – low power device (6mW), able to operate long time from a simple 9V battery.
One of the most important sources of parasitic electricity on ECG systems is the electric potential developed between the perfusing solution of the Langendorff system and the ground, despite correct grounding of the system. To prevent interfer-ences between this potential and the ECG signals, the perfusion liquid must be “driven” with an opposite signal, having the same amplitude as the “parasitic” signal, canceling each other (6). This can be done using one of the four operational amplifiers contained in the TL074.
Frequently during Langendorff experiments we need to pace the heart using electric stimuli higher than the maximum input voltage of TL074 (15V) or even we need to defibrillate the heart using electric shocks. To be able to withstand to those voltages, the input of the amplifier needs to be “clamped” to safe levels. We obtained this effect using fast silicone diodes in anti-parallel, allowing maximum amplitude of 0.7V at the input of the amplifier.
The last available operational amplifier in the TL074 package will be used as output buffer for AD623 and variable-gain amplifier. The AD623 itself allows presettable gain using a resistor between pins 1 and 8, but we preferred using a gain =1 to minimize the noise. This buffer will drive a PNP transistor connected to an op-tocoupler. The CNY17-2 optocoupler is used to ensure complete galvanic separation between recording system (PC) and the Langendorff system. CNY17-2 ensures 3.3 KV separations, much superior to any voltage used during our experiments. The TL074 integrated circuit works with dual power supply and AD623 can also work with dual power supplies, so we designed a simple voltage divider using two usual transistors. This divider will “convert” a single 9V power supply into a symmetrical + and – 4.5V. The final schematic is shown in Figure 2.
Fig. 2. Complete schematic of the ECG module
RESULTSThe amplifier is 6 X 9 cm large, easy to handle during the
experiments. The recordings we have done with this amplifier are of high quality, as it can be seen on Figure 3.
Fig. 3. Biphasic shock during fast VT post-cardioplegic arrest on whistar rat isolated heart. Sinusal rhythm after the shock
The amplifier is injecting the signal into almost any type of analog-digital converter capable to handle signals in a frequency range of 1Hz and 250Hz (The Poly system, the DT 300 series from Data Translation Inc., etc). The technical performance requirements for ECG digital conversion are not very high, so even self-constructed analog-digital converters can be used. Almost every producer of AD converters is offering ready-to-use software or platforms to develop specific software for biological use (Data Translation by ex.). There are also many free software applications which can be used (WinScope or FreeVIEW by ex.). Our system is allowing us to measure almost every parameter we need during Langendorff experiments. To be able to precisely quantify the amplitude of ECG signals, the system requires calibration before start recording. This can be done by applying a 1mV signal at the input and tuning the gain knob to measure exactly 10 div. on the screen (Figure 4).
Fig. 4. Calibrating the gain and measuring cardiac frequency
The heart rate can be very easy determined knowing the time duration between ECG elements (R-R interval by ex.) and using formula: HR=1000/t (msec) X 60. In Fig. 4 we can see an RR interval of 380 msec (the red circle), so the heart was running at 158 beats/min. The ventricular electromechanical delay can also be measured, if intraventricular pressure information is also available (Figure 5).
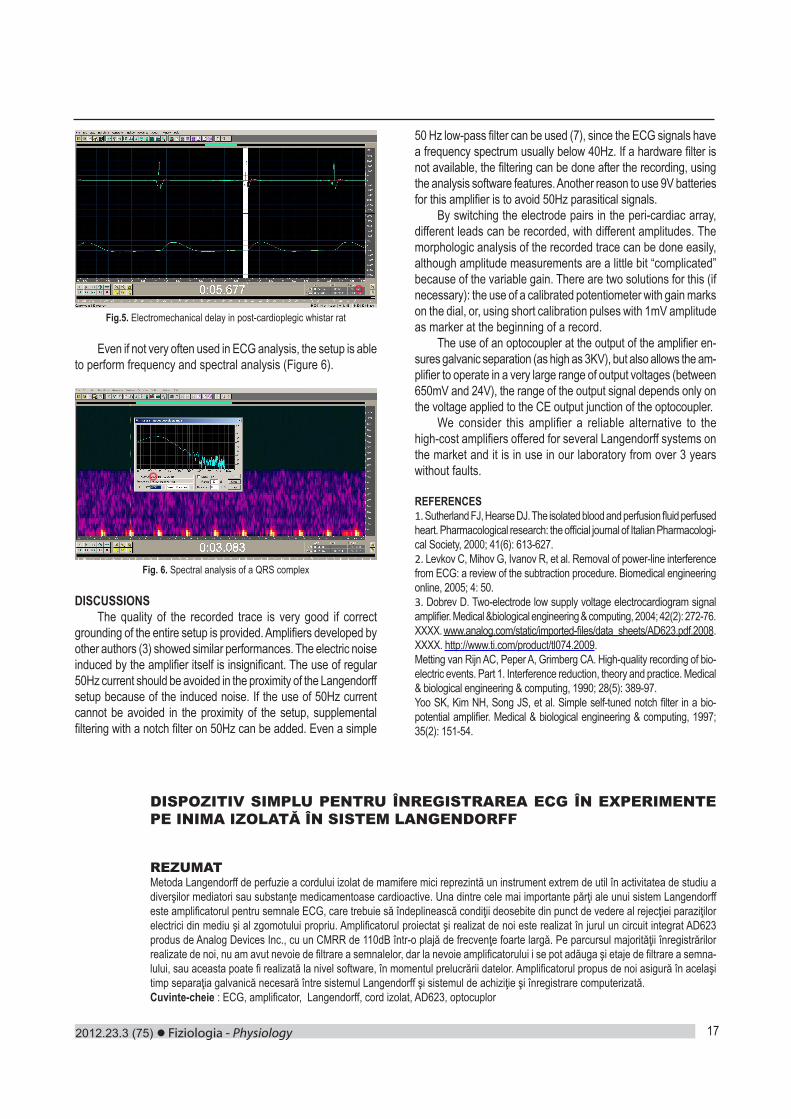
2012.23.3 (75) Fiziologia - Physiology 17
Fig.5. Electromechanical delay in post-cardioplegic whistar rat
Even if not very often used in ECG analysis, the setup is able to perform frequency and spectral analysis (Figure 6).
Fig. 6. Spectral analysis of a QRS complex
DISCUSSIONSThe quality of the recorded trace is very good if correct
grounding of the entire setup is provided. Amplifiers developed by other authors (3) showed similar performances. The electric noise induced by the amplifier itself is insignificant. The use of regular 50Hz current should be avoided in the proximity of the Langendorff setup because of the induced noise. If the use of 50Hz current cannot be avoided in the proximity of the setup, supplemental filtering with a notch filter on 50Hz can be added. Even a simple
50 Hz low-pass filter can be used (7), since the ECG signals have a frequency spectrum usually below 40Hz. If a hardware filter is not available, the filtering can be done after the recording, using the analysis software features. Another reason to use 9V batteries for this amplifier is to avoid 50Hz parasitical signals.
By switching the electrode pairs in the peri-cardiac array, different leads can be recorded, with different amplitudes. The morphologic analysis of the recorded trace can be done easily, although amplitude measurements are a little bit “complicated” because of the variable gain. There are two solutions for this (if necessary): the use of a calibrated potentiometer with gain marks on the dial, or, using short calibration pulses with 1mV amplitude as marker at the beginning of a record.
The use of an optocoupler at the output of the amplifier en-sures galvanic separation (as high as 3KV), but also allows the am-plifier to operate in a very large range of output voltages (between 650mV and 24V), the range of the output signal depends only on the voltage applied to the CE output junction of the optocoupler.
We consider this amplifier a reliable alternative to the high-cost amplifiers offered for several Langendorff systems on the market and it is in use in our laboratory from over 3 years without faults.
REFERENCES1. Sutherland FJ, Hearse DJ. The isolated blood and perfusion fluid perfused heart. Pharmacological research: the official journal of Italian Pharmacologi-cal Society, 2000; 41(6): 613-627.2. Levkov C, Mihov G, Ivanov R, et al. Removal of power-line interference from ECG: a review of the subtraction procedure. Biomedical engineering online, 2005; 4: 50.3. Dobrev D. Two-electrode low supply voltage electrocardiogram signal amplifier. Medical &biological engineering & computing, 2004; 42(2): 272-76.XXXX. www.analog.com/static/imported-files/data_sheets/AD623.pdf.2008.XXXX. http://www.ti.com/product/tl074.2009.Metting van Rijn AC, Peper A, Grimberg CA. High-quality recording of bio-electric events. Part 1. Interference reduction, theory and practice. Medical & biological engineering & computing, 1990; 28(5): 389-97.Yoo SK, Kim NH, Song JS, et al. Simple self-tuned notch filter in a bio-potential amplifier. Medical & biological engineering & computing, 1997; 35(2): 151-54.
DISPOZITIV SIMPLU PENTRU ÎNREGISTRAREA ECG ÎN EXPERIMENTE PE INIMA IZOLATĂ ÎN SISTEM LANGENDORFF
REZUMATMetoda Langendorff de perfuzie a cordului izolat de mamifere mici reprezintă un instrument extrem de util în activitatea de studiu a diverşilor mediatori sau substanţe medicamentoase cardioactive. Una dintre cele mai importante părţi ale unui sistem Langendorff este amplificatorul pentru semnale ECG, care trebuie să îndeplinească condiţii deosebite din punct de vedere al rejecţiei paraziţilor electrici din mediu şi al zgomotului propriu. Amplificatorul proiectat şi realizat de noi este realizat în jurul un circuit integrat AD623 produs de Analog Devices Inc., cu un CMRR de 110dB într-o plajă de frecvenţe foarte largă. Pe parcursul majorităţii înregistrărilor realizate de noi, nu am avut nevoie de filtrare a semnalelor, dar la nevoie amplificatorului i se pot adăuga şi etaje de filtrare a semna-lului, sau aceasta poate fi realizată la nivel software, în momentul prelucrării datelor. Amplificatorul propus de noi asigură în acelaşi timp separaţia galvanică necesară între sistemul Langendorff şi sistemul de achiziţie şi înregistrare computerizată.Cuvinte-cheie : ECG, amplificator, Langendorff, cord izolat, AD623, optocuplor
Fiziologia - Physiology 2012.23.3 (75)18
ANALYSIS OF THE EVOLUTION IN TIME OF THE EFFECTS OF MONOTONOUS AUDITORY STIMULATION ON CORTICAL BIOPOTENTIALSMARIUS GEORGESCU1, DANIEL GEORGESCU1*, DRAGOŞ ALEXANDRU1, DANIELA PUS-CASIU2, CARMEN TATU3, MARIA IANCĂU1
1Department of Functional Disciplines, University of Medicine and Pharmacy of Craiova, Romania2Department of Microscopic Morphology, University of Medicine and Pharmacy “Victor Babes” Timisoara, Romania3Department of Functional Sciences, University of Medicine and Pharmacy “Victor Babes” Timisoara, Romania
ABSTRACTMonotonous stimulation can be accomplished by using continuous, predictive or repetitive stimuli and results in a functional state of the central nervous system characterized by lowered cerebral activity. The present study investigates the effects of several monotonous auditory input on cerebral biopotentials. This was done by means of recording the electroencephalography (EEG) under stimulation by three auditory stimuli different in regards to frequencies, amplitudes, tonality and the induced psychoemotional state (S1, S2, S3), on 11 volunteers (average age 23 years). Data were acquisitioned during 20 minutes of auditory stimulation, minute per minute, for each of the 3 stimulation signals. By analysing the obtained EEG patterns, specific changes in cortical biopotentials were observed: the subjectively pleasant sounds, S2 and S3 exert a similar influence on cortical micropotentials, by increasing all frequency bands, except Alpha2, while the subjectively unpleasant one, S1 induces decrease of all EEG bands except low frequency ones (Delta and Theta). The obtained results can be partially explained by the nature of the sound stimulus and each induced psychoemotional state could be associated with a characteristic EEG pattern.Keywords: EEG, auditory stimulation, cortical biopotentials, music, brain rhythms
Received 20th of August 2012. Accepted 10th of September 2012. Address for correspondence: Daniel Georgescu, Department of Functional Disciplines, UMF Craiova, Petru Rareş Street No. 2-4, RO-200349, Craiova, Romania, e-mail: [email protected]
INTRODUCTIONMonotony is definable as a result of constant stimulations
that are predictive or repetitive. The environment in which those stimulations occur may also have an influence on performance in a degree that is equivalent to the monotony of the action itself (1). Monotony is characterized by decreased cerebral activation, accompanied by decreased vigilance, sleepiness, and a lower degree of attention (1,2).
Repetitive stimuli are generally recognized as being monoto-nous. They are associated with decreased performance and lack of attention (1). However Wertheim (3), suggests that monotony may be determined by the predictability of stimuli in the environ-ment rather than by repetitivity. The degree of complexity in a task is also deemed an important factor, and its effects are explained by two theories: the theory of excitement and the theory of ac-commodation (4). Thus, tasks that have decreased requirements lead to cognitive underload, lack of vigilance, lowered attention and monotony, while tasks that have increased requirements and cognitive overload lead to tiredness (5).
There are numerous studies that focus on the effect of external stimulation on cortical biopotentials, especially in case of responses to visual stimulation (6,7). The focus on using rhythmic auditory and visual stimulation as a way of inducing relaxation and hypnosis emerged towards the end of the XXth century (8). Varying repetitive visual stimulation in psycho-physiologic and neurophysiologic research are frequent, with repetitive visual stimulation patterns generally presented in
an on-off mode (for example flickering light) (9), or through inverted pattern changes (for example checkerboard pattern) (10). Leaving aside visual stimulation, auditory stimulation through repetitive acoustic stimuli, be they artificial or naturally produced, either solely or in association with different activities can provide useful new data regarding psychic sensorial and superior cognitive processes (11-13). Music has proved to be an essential instrument in the understanding of human emotion and knowledge, and the cerebral mechanisms that underline them. Some researchers maintain that human musical abilities achieved a key phylogenetic role in the evolution of language, and that musical behavior promoted and supported important evolutionary functions such as cooperation, communication, and social cohesion (14). From the dawn of society, music was used to stimulate emotions and treat a variety of diseases: epilepsy, migraine, arrhythmia, schizophrenia, dementia, anxiety, neurosis asthenia, stress, depression, autism, palpitations, cardiac insuf-ficiency, arterial hypertension, insomnia (15-20). Despite all this, EEG investigations of cerebral activity under acoustic stimulation in general, and in particular by music, are not abundant.
The present study focuses on investigating the cerebral electrical activity under the influence of three different types of monotonous sounds, both artificial and recorded from nature, dif-ferent in regards to their tonality, amplitudes, frequencies and the induced psychoemotional state. The effects of the three different auditory stimulations was tracked on all EEG frequency bands in time, minute per minute, during the whole stimulation period.
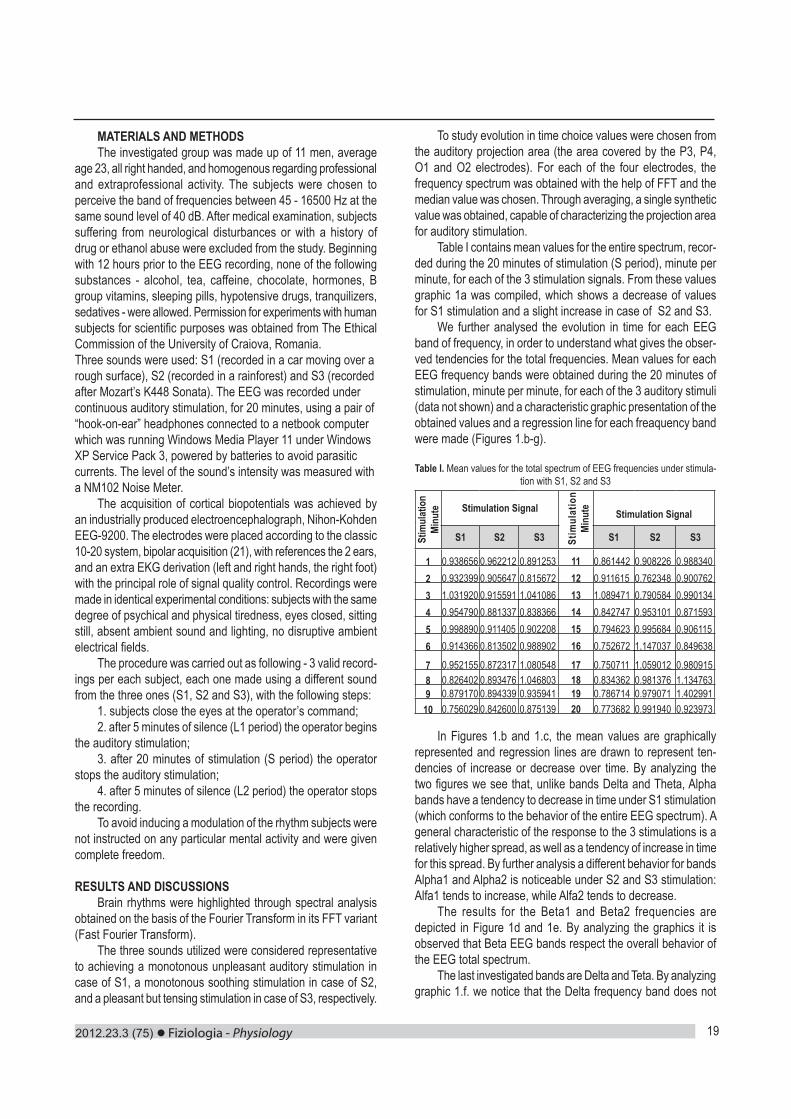
2012.23.3 (75) Fiziologia - Physiology 19
MATERIALS AND METHODS The investigated group was made up of 11 men, average
age 23, all right handed, and homogenous regarding professional and extraprofessional activity. The subjects were chosen to perceive the band of frequencies between 45 - 16500 Hz at the same sound level of 40 dB. After medical examination, subjects suffering from neurological disturbances or with a history of drug or ethanol abuse were excluded from the study. Beginning with 12 hours prior to the EEG recording, none of the following substances - alcohol, tea, caffeine, chocolate, hormones, B group vitamins, sleeping pills, hypotensive drugs, tranquilizers, sedatives - were allowed. Permission for experiments with human subjects for scientific purposes was obtained from The Ethical Commission of the University of Craiova, Romania. Three sounds were used: S1 (recorded in a car moving over a rough surface), S2 (recorded in a rainforest) and S3 (recorded after Mozart’s K448 Sonata). The EEG was recorded under continuous auditory stimulation, for 20 minutes, using a pair of “hook-on-ear” headphones connected to a netbook computer which was running Windows Media Player 11 under Windows XP Service Pack 3, powered by batteries to avoid parasitic currents. The level of the sound’s intensity was measured with a NM102 Noise Meter.
The acquisition of cortical biopotentials was achieved by an industrially produced electroencephalograph, Nihon-Kohden EEG-9200. The electrodes were placed according to the classic 10-20 system, bipolar acquisition (21), with references the 2 ears, and an extra EKG derivation (left and right hands, the right foot) with the principal role of signal quality control. Recordings were made in identical experimental conditions: subjects with the same degree of psychical and physical tiredness, eyes closed, sitting still, absent ambient sound and lighting, no disruptive ambient electrical fields.
The procedure was carried out as following - 3 valid record-ings per each subject, each one made using a different sound from the three ones (S1, S2 and S3), with the following steps:
1. subjects close the eyes at the operator’s command; 2. after 5 minutes of silence (L1 period) the operator begins
the auditory stimulation; 3. after 20 minutes of stimulation (S period) the operator
stops the auditory stimulation; 4. after 5 minutes of silence (L2 period) the operator stops
the recording. To avoid inducing a modulation of the rhythm subjects were
not instructed on any particular mental activity and were given complete freedom.
RESULTS AND DISCUSSIONS Brain rhythms were highlighted through spectral analysis
obtained on the basis of the Fourier Transform in its FFT variant (Fast Fourier Transform).
The three sounds utilized were considered representative to achieving a monotonous unpleasant auditory stimulation in case of S1, a monotonous soothing stimulation in case of S2, and a pleasant but tensing stimulation in case of S3, respectively.
To study evolution in time choice values were chosen from the auditory projection area (the area covered by the P3, P4, O1 and O2 electrodes). For each of the four electrodes, the frequency spectrum was obtained with the help of FFT and the median value was chosen. Through averaging, a single synthetic value was obtained, capable of characterizing the projection area for auditory stimulation.
Table I contains mean values for the entire spectrum, recor-ded during the 20 minutes of stimulation (S period), minute per minute, for each of the 3 stimulation signals. From these values graphic 1a was compiled, which shows a decrease of values for S1 stimulation and a slight increase in case of S2 and S3.
We further analysed the evolution in time for each EEG band of frequency, in order to understand what gives the obser-ved tendencies for the total frequencies. Mean values for each EEG frequency bands were obtained during the 20 minutes of stimulation, minute per minute, for each of the 3 auditory stimuli (data not shown) and a characteristic graphic presentation of the obtained values and a regression line for each freaquency band were made (Figures 1.b-g).
Table I. Mean values for the total spectrum of EEG frequencies under stimula-tion with S1, S2 and S3
Stim
ulat
ion
Minu
te Stimulation Signal
Stim
ulat
ion
Minu
te Stimulation Signal
S1 S2 S3 S1 S2 S3
1 0.938656 0.962212 0.891253 11 0.861442 0.908226 0.9883402 0.932399 0.905647 0.815672 12 0.911615 0.762348 0.9007623 1.031920 0.915591 1.041086 13 1.089471 0.790584 0.9901344 0.954790 0.881337 0.838366 14 0.842747 0.953101 0.8715935 0.998890 0.911405 0.902208 15 0.794623 0.995684 0.9061156 0.914366 0.813502 0.988902 16 0.752672 1.147037 0.849638
7 0.952155 0.872317 1.080548 17 0.750711 1.059012 0.9809158 0.826402 0.893476 1.046803 18 0.834362 0.981376 1.1347639 0.879170 0.894339 0.935941 19 0.786714 0.979071 1.402991
10 0.756029 0.842600 0.875139 20 0.773682 0.991940 0.923973
In Figures 1.b and 1.c, the mean values are graphically represented and regression lines are drawn to represent ten-dencies of increase or decrease over time. By analyzing the two figures we see that, unlike bands Delta and Theta, Alpha bands have a tendency to decrease in time under S1 stimulation (which conforms to the behavior of the entire EEG spectrum). A general characteristic of the response to the 3 stimulations is a relatively higher spread, as well as a tendency of increase in time for this spread. By further analysis a different behavior for bands Alpha1 and Alpha2 is noticeable under S2 and S3 stimulation: Alfa1 tends to increase, while Alfa2 tends to decrease.
The results for the Beta1 and Beta2 frequencies are depicted in Figure 1d and 1e. By analyzing the graphics it is observed that Beta EEG bands respect the overall behavior of the EEG total spectrum.
The last investigated bands are Delta and Teta. By analyzing graphic 1.f. we notice that the Delta frequency band does not
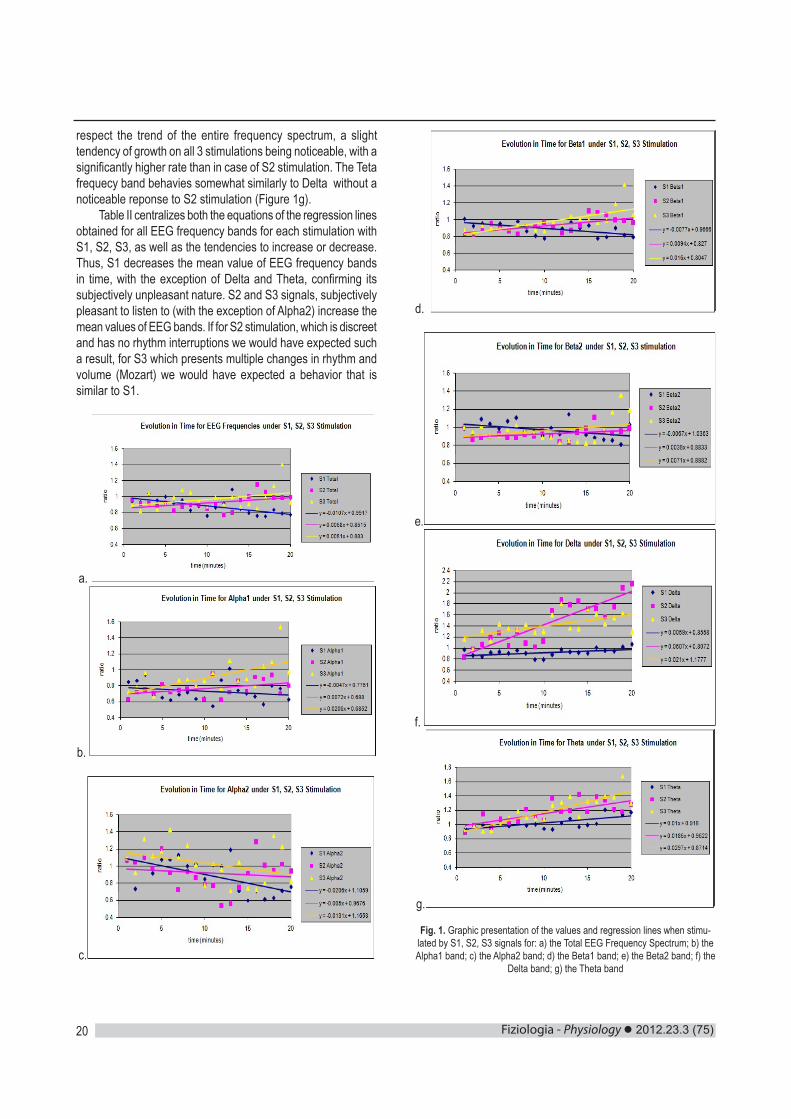
Fiziologia - Physiology 2012.23.3 (75)20
respect the trend of the entire frequency spectrum, a slight tendency of growth on all 3 stimulations being noticeable, with a significantly higher rate than in case of S2 stimulation. The Teta frequecy band behavies somewhat similarly to Delta without a noticeable reponse to S2 stimulation (Figure 1g).
Table II centralizes both the equations of the regression lines obtained for all EEG frequency bands for each stimulation with S1, S2, S3, as well as the tendencies to increase or decrease. Thus, S1 decreases the mean value of EEG frequency bands in time, with the exception of Delta and Theta, confirming its subjectively unpleasant nature. S2 and S3 signals, subjectively pleasant to listen to (with the exception of Alpha2) increase the mean values of EEG bands. If for S2 stimulation, which is discreet and has no rhythm interruptions we would have expected such a result, for S3 which presents multiple changes in rhythm and volume (Mozart) we would have expected a behavior that is similar to S1.
a.
b.
c.
d.
e.
f.
g.
Fig. 1. Graphic presentation of the values and regression lines when stimu-lated by S1, S2, S3 signals for: a) the Total EEG Frequency Spectrum; b) the Alpha1 band; c) the Alpha2 band; d) the Beta1 band; e) the Beta2 band; f) the
Delta band; g) the Theta band
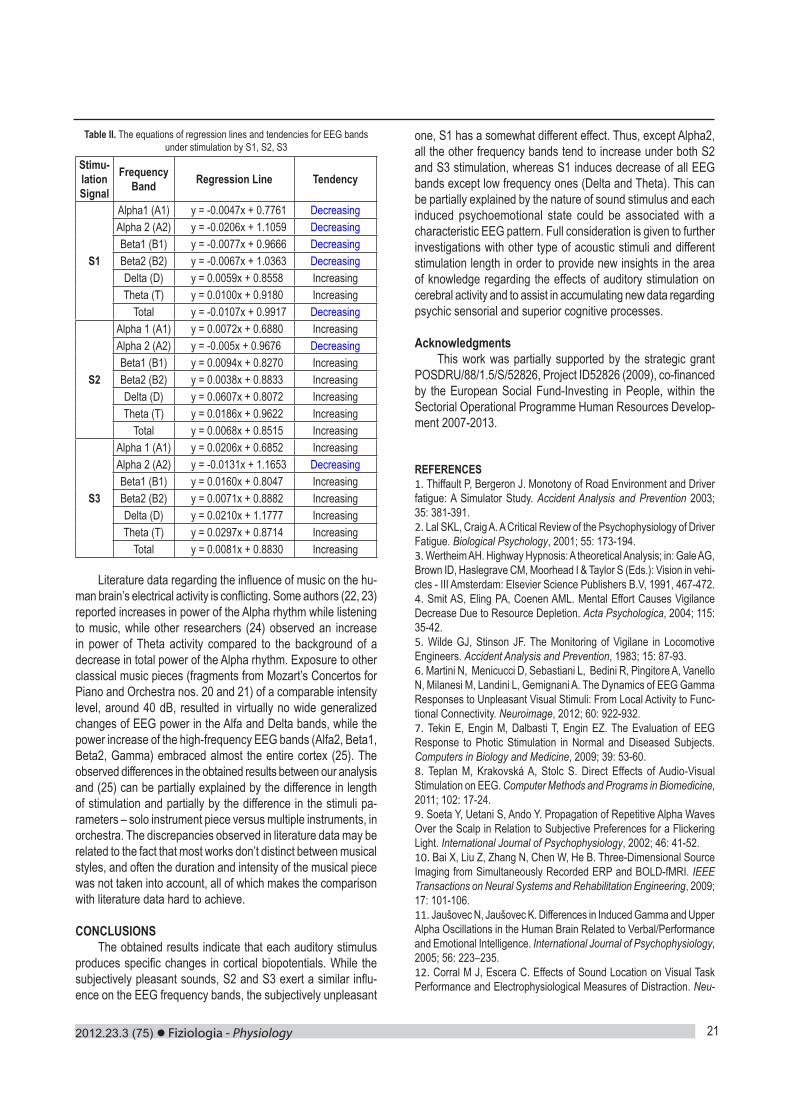
2012.23.3 (75) Fiziologia - Physiology 21
Table II. The equations of regression lines and tendencies for EEG bands under stimulation by S1, S2, S3
Stimu-lation Signal
Frequency Band Regression Line Tendency
S1
Alpha1 (A1) y = -0.0047x + 0.7761 DecreasingAlpha 2 (A2) y = -0.0206x + 1.1059 DecreasingBeta1 (B1) y = -0.0077x + 0.9666 DecreasingBeta2 (B2) y = -0.0067x + 1.0363 DecreasingDelta (D) y = 0.0059x + 0.8558 IncreasingTheta (T) y = 0.0100x + 0.9180 Increasing
Total y = -0.0107x + 0.9917 Decreasing
S2
Alpha 1 (A1) y = 0.0072x + 0.6880 IncreasingAlpha 2 (A2) y = -0.005x + 0.9676 DecreasingBeta1 (B1) y = 0.0094x + 0.8270 IncreasingBeta2 (B2) y = 0.0038x + 0.8833 IncreasingDelta (D) y = 0.0607x + 0.8072 IncreasingTheta (T) y = 0.0186x + 0.9622 Increasing
Total y = 0.0068x + 0.8515 Increasing
S3
Alpha 1 (A1) y = 0.0206x + 0.6852 IncreasingAlpha 2 (A2) y = -0.0131x + 1.1653 DecreasingBeta1 (B1) y = 0.0160x + 0.8047 IncreasingBeta2 (B2) y = 0.0071x + 0.8882 IncreasingDelta (D) y = 0.0210x + 1.1777 IncreasingTheta (T) y = 0.0297x + 0.8714 Increasing
Total y = 0.0081x + 0.8830 Increasing
Literature data regarding the influence of music on the hu-man brain’s electrical activity is conflicting. Some authors (22, 23) reported increases in power of the Alpha rhythm while listening to music, while other researchers (24) observed an increase in power of Theta activity compared to the background of a decrease in total power of the Alpha rhythm. Exposure to other classical music pieces (fragments from Mozart’s Concertos for Piano and Orchestra nos. 20 and 21) of a comparable intensity level, around 40 dB, resulted in virtually no wide generalized changes of EEG power in the Alfa and Delta bands, while the power increase of the high-frequency EEG bands (Alfa2, Beta1, Beta2, Gamma) embraced almost the entire cortex (25). The observed differences in the obtained results between our analysis and (25) can be partially explained by the difference in length of stimulation and partially by the difference in the stimuli pa-rameters – solo instrument piece versus multiple instruments, in orchestra. The discrepancies observed in literature data may be related to the fact that most works don’t distinct between musical styles, and often the duration and intensity of the musical piece was not taken into account, all of which makes the comparison with literature data hard to achieve.
CONCLUSIONS The obtained results indicate that each auditory stimulus
produces specific changes in cortical biopotentials. While the subjectively pleasant sounds, S2 and S3 exert a similar influ-ence on the EEG frequency bands, the subjectively unpleasant
one, S1 has a somewhat different effect. Thus, except Alpha2, all the other frequency bands tend to increase under both S2 and S3 stimulation, whereas S1 induces decrease of all EEG bands except low frequency ones (Delta and Theta). This can be partially explained by the nature of sound stimulus and each induced psychoemotional state could be associated with a characteristic EEG pattern. Full consideration is given to further investigations with other type of acoustic stimuli and different stimulation length in order to provide new insights in the area of knowledge regarding the effects of auditory stimulation on cerebral activity and to assist in accumulating new data regarding psychic sensorial and superior cognitive processes.
AcknowledgmentsThis work was partially supported by the strategic grant
POSDRU/88/1.5/S/52826, Project ID52826 (2009), co-financed by the European Social Fund-Investing in People, within the Sectorial Operational Programme Human Resources Develop-ment 2007-2013.
REFERENCES 1. Thiffault P, Bergeron J. Monotony of Road Environment and Driver fatigue: A Simulator Study. Accident Analysis and Prevention 2003; 35: 381-391.2. Lal SKL, Craig A. A Critical Review of the Psychophysiology of Driver Fatigue. Biological Psychology, 2001; 55: 173-194.3. Wertheim AH. Highway Hypnosis: A theoretical Analysis; in: Gale AG, Brown ID, Haslegrave CM, Moorhead I & Taylor S (Eds.): Vision in vehi-cles - III Amsterdam: Elsevier Science Publishers B.V, 1991, 467-472.4. Smit AS, Eling PA, Coenen AML. Mental Effort Causes Vigilance Decrease Due to Resource Depletion. Acta Psychologica, 2004; 115: 35-42.5. Wilde GJ, Stinson JF. The Monitoring of Vigilane in Locomotive Engineers. Accident Analysis and Prevention, 1983; 15: 87-93.6. Martini N, Menicucci D, Sebastiani L, Bedini R, Pingitore A, Vanello N, Milanesi M, Landini L, Gemignani A. The Dynamics of EEG Gamma Responses to Unpleasant Visual Stimuli: From Local Activity to Func-tional Connectivity. Neuroimage, 2012; 60: 922-932.7. Tekin E, Engin M, Dalbasti T, Engin EZ. The Evaluation of EEG Response to Photic Stimulation in Normal and Diseased Subjects. Computers in Biology and Medicine, 2009; 39: 53-60. 8. Teplan M, Krakovská A, Stolc S. Direct Effects of Audio-Visual Stimulation on EEG. Computer Methods and Programs in Biomedicine, 2011; 102: 17-24.9. Soeta Y, Uetani S, Ando Y. Propagation of Repetitive Alpha Waves Over the Scalp in Relation to Subjective Preferences for a Flickering Light. International Journal of Psychophysiology, 2002; 46: 41-52.10. Bai X, Liu Z, Zhang N, Chen W, He B. Three-Dimensional Source Imaging from Simultaneously Recorded ERP and BOLD-fMRI. IEEE Transactions on Neural Systems and Rehabilitation Engineering, 2009; 17: 101-106. 11. Jaušovec N, Jaušovec K. Differences in Induced Gamma and Upper Alpha Oscillations in the Human Brain Related to Verbal/Performance and Emotional Intelligence. International Journal of Psychophysiology, 2005; 56: 223–235.12. Corral M J, Escera C. Effects of Sound Location on Visual Task Performance and Electrophysiological Measures of Distraction. Neu-
Fiziologia - Physiology 2012.23.3 (75)22
roreport, 2008; 19: 1535-1539.13. Jaušovec N, Jaušovec K, Gerlic I. The Influence of Mozart’s Music on Brain Activity in the Process of Learning. Clinical Neurophysiology, 2006; 117: 2703-2714.14. Koelsch S, Offermanns K, Franzke P. Music in the Treatment of Affective Disorders: an Exploratory Investigation of a New Method for Music-Therapeutic Research. Music Perception, 2010; 27: 307-316.15. Bodner E, Iancu J, Gilboa A, Sarel A, Mazor A, Amir D. Finding Words for Emotions: the Reactions of Patients with Major Depressive Disorder Towards Various Musical Excerpts. Arts in Psychotherapy, 2007; 34: 142-150. 16. Peng S M, Koo M, Kuo JC. Effect of Group Music Activity as an Adjunctive Therapy on Psychotic Symptoms in Patients with Acute Schizophrenia. Archives of Psychiatric Nursing, 2010; 24: 429-434.17. Sherratt K, Thornton A, Hatton C. Music Interventions for People with Dementia: a Review of the Literature. Aging & Mental Health, 2004; 8: 3-12. 18. Rimland B, Edelson SM. A Pilot Study of Auditory Integration Training in Autism. Journal of Autism and Developmental Disorders, 1995; 25: 61-70.
19. Schneider S, Schönle PW, Altenmüller E, Münte TF. Using Musical Instruments to Improve Motor Skill Recovery Following a Stroke. Journal of Neurology, 2007; 254: 1339-46. 20. Hughes JR. The Mozart Effect: Additional Data. Epilepsy & Behavior, 2002; 3: 182-184.21. Niedermeyer E, da Silva FL. Electroencephalography: Basic Principles, Clinical Applications, and Related Fields, Lippincott Williams & Wilkins, 2011.22. Sulimov AV, Lyubimova Yu V, Pavlygina RA, Davydov VI. Spectral Analysis of Human EEG during Listening to Music. Zhurnal vyssheĭ nervnoĭ deyatelnosti imeni I P Pavlova, 2000; 50: 62-67.23. Ikeda T. Concentration-Effect and Underestimation of Time by Acoustic Stimuli. Shinrigaku Kenkyu, 1992; 63: 157-162.24. Yuan Q, Liu XH, Li DC, Wang HL, Liu YS. Effects of Noise and Music on EEG Power Spectrum. Space Medicine & Medical Engineer-ing, 2000; 19: 401-404.25. Pavlygina RA, Sakharov DS, Davydov VI. Spectral Analysis of the Human EEG during Listening to Musical Compositions. Human Physiology, 2004; 30: 54-60.
ANALIZA EVOLUTIEI IN TIMP A EFECTELOR STIMULARII AUDITIVE MONOTONALE ASUPRA BIOPOTENTIALELOR CORTICALE
REZUMATStimularea monotonala poate fi realizata prin utilizarea stimulilor continui, predictivi sau repetitivi si are ca rezultat un status functional al sistemului nervos central caracterizat prin scaderea activitatii cerebrale. Studiul prezent investigheaza efectele diversilor stimuli monotonali asupra biopotentialelor cerebrale. Evaluarea a fost realizata prin inregistrarea electroencefalografica (EEG) in urma stimularii cu trei tipuri diferite de stimuli, in ceea ce priveste frecventele, amplitudinile, tonalitatea si statusul psihoemotional indus (S1, S2, S3), la 11 voluntari (varsta medie de 23 ani). Achizitia datelor a fost realizata timp de 20 de minute de stimulare auditiva, in fiecare minut, pentru fiecare dintre cele 3 semnale de stimulare. Prin analiza modelelor EEG obtinute, au fost observate modificari specifice ale biopotentialelor corticale: sunetele subiectiv placute, S2 si S3, exercita o influenta similara asupra micropotentialelor corticale, prin cresterea tuturor benzilor de frecventa, cu exceptia alfa2, in timp ce sunetele subiectiv neplacute, S1, induc o scadere a tuturor benzilor EEG, cu exceptia celor cu frecventa scazuta (delta si teta). Rezultatele obtinute pot fi explicate partial prin natura stimului auditiv si fiecare status psihoemotional indus poate fi asociat cu un model EEG caracteristic. Cuvinte cheie: EEG, stimulare auditiva, biopotentiale corticale, muzica, ritmuri cerebrale
2012.23.3 (75) Fiziologia - Physiology 23
PHYSIOLOGY AND PHYSIOPATHOLOGY OF HEPATIC EN-CEPHALOPATHYSCHEAU CRISTIAN1, LAZĂR MIHAI2, BUNEA MAGDA1, CIORNEI CĂTĂLINA1, PAPACOCEA RALUCA1, ION DANIELA ADRIANA2, BĂDĂRĂU ANCA IOANA2
1 Department of Physiology I, “Carol Davila” University of Medicine and Pharmacy, Bucharest2 Department of Physiopathology, “Carol Davila” University of Medicine and Pharmacy, Bucharest
ABSTRACTA good knowledge of the physiological and physiopathological processes of hepatic encephalopathy (HE) can lead to a better understanding of this syndrome and to an improved approach on its treatment. A large number of mechanisms are involved in the pathogenesis of HE, some of which are tightly inter-connected. This paper summarizes the most important aspects implicated in the development of HE in the attempt to uncover future research directions, as well as provide useful information, with potential clinical impact.Keywords: Hepatic encephalopathy, physiology, physiopathology, mechanisms, theories, animal research, MRI, spectroscopy
Received 12th of July 2012. Accepted 20th of August 2012. Address for correspondence: Scheau Cristian, MD, PhD student, “Carol Davila” University of Medicine and Pharmacy, Bucharest, 8 Eroilor Sanitari Boulevard, 5th district, 050474, Romania; telephone: 0723.77.88.40; e-mail: [email protected]
INTRODUCTIONHepatic Encephalopathy (HE) is a syndrome characterized
by a series of potentially reversible neurological deficits which occur in a patient with chronic or acute significant liver disease and/or porto-systemic blood shunting. The neurological and neuropsychiatric alterations are summarized in Table I. The changes in consciousness, attention span, and orientation may vary, and so, the staging of the extent of neurological impairment is performed using the West Haven Criteria for Semi-quantitative Grading of Mental Status (1). Minimal HE is found in the majority of patients with liver cirrhosis, and can be detected by a series of neuropsychological tests, with variable sensitivity.
Table I. Neurological alterations in hepatic encephalopathy
Cognitive findings Motor findingsDisorientation HyperreflexiaAltered consciousness AsterixisShort attention span Extensor plantar reflexesMemory impairment RigidityAffective disorder TremorEmotional disturbances Hemiplegia (rare)
In the physiopathology of Hepatic Encephalopathy, a number of hypothesis have been suggested, some of which are listed below:
Ammonia as a direct neurotoxinThe suspicion that ammonium is involved in the develop-
ment of HE was first materialized by Eck in 1877, when he described the effect of nitrogenous substances in dogs with porto-systemic anastomosis (2). The healthy dogs with Eck-fistula developed severe neurologic symptoms when they were fed meat. Later, in 1952, Gabuzda (3) observed reversible
neuropsychiatric changes in cirrhotic patients treated for ascites with ion-exchange resins that absorb sodium and release am-monium ions.High blood concentrations of ammonia may not correlate with the presence of significant HE in at least 10% of cases (4). Furthermore, several tests showed no success in inducing HE in patients with chronic liver failure by administering ammonia. These facts suggest that there are other mechanisms involved.
Ammonia as an indirect neurotoxinThis theory states that ammonia in high amounts in the
central nervous system (CNS) induces astrocyte cells swelling. Ammonium crosses the blood-brain barrier (BBB) and in order to be cleared, it is used by the astrocytes in the conversion of glutamate to glutamine, which in excess causes cellular edema. Increased γ-aminobutyric acid (GABA) activity produces an inhibition of the energy usage by the other neuronal cells (5). Current methods, such as Magnetic Resonance Spectroscopy, allow a non-invasive quantification of these metabolites in the brain, with very good sensitivity and specificity.This theory also provides an explanation for the patients with HE and low ammonium blood levels – in this case, ammonia may have already crossed the BBB and started being metabolized.
Mercaptans as additional neurotoxinsMercaptans have been implicated as a pathogenic factor
in HE. High blood concentrations of methanethiol have been isolated in patients with hepatic dysfunction, and even more specific in patients with HE, but they did not correlate with the degree of the symptoms (6). Mercaptans are produced in the small intestine by bacteria through metabolizing amino-acids which contain sulphur. The neurotoxic effect of mercaptans is considered to be synergic and competing with ammonia (7). It has been proven that foetor hepaticus is produced by the pres-

Fiziologia - Physiology 2012.23.3 (75)24
ence of mercaptans in high concentrations.
False neurotransmitters theoryTyramine, octopamine, synephrine and beta-phenylethano-
lamines are neurotransmitters obtained as secondary products of hepatic insufficiency. Usually they have reduced or no effect, with the sole result of blocking the normal neurotransmission. High plasmatic levels correlate with the presence of liver cirrhosis and severe coma. The theory is well documented and has been introduced in the 1970’s (8).
Imbalance between aromatic amino-acids (AAA) and branched-chain amino-acids (BCAA)
First proposed by Fisher et al in 1974 (9), he stated that in patients with liver insufficiency there is an abnormally increased ratio between AAA and BCAA. This occurs mainly because of the decreased AAA hepatic metabolization doubled by an increased catabolism of BCAA in the skeletal muscles. The main AAA which accumulate in excess are tyrosine, tryptophan and phenylalanine, which pass the BBB and can lead to altered neurotransmission (through synthesis of false neurotransmitters, such as octapamine) (8).
The altered ratio also connects with the levels of ammonia in the plasma: in the hyperammonemia that occurs in hepatic insufficiency, increased levels of ammonia are normalized by combining with glutamate and resulting synthesis of glutamine; this process occurs in the brain and skeletal muscle, in the lat-ter BCAA metabolization results in forming glutamate, which is then converted to glutamine. The excess glutamine in the central nervous system facilitates AAA influx in the brain.
Gamma aminobutyric acid theoryIntroduced in the early 80’s, this theory relies on the fact
that intestinal gamma aminobutyric acid (GABA) crosses an abnormally permeable BBB to find excessive amounts of recep-tors, combined effect which induce an increased CNS sensitivity to GABA inhibition. In addition, the high amount of receptors allow binding of barbiturics and benzodiazepines, leading to an increased effect of the two (10). The experiments used a rabbit with liver failure induced by administering galactosamine, a very strong hepatotoxin. One of the most important features of GABA is that it can induce coma in high amounts, playing an important role in HE from this point of view.
Cerebral metals deposit theoryMetals such as manganese have been identified in the
brain of patients with HE, in the globus pallidus bilaterally, and correlate with Parkinsonian manifestations. The deposits can be easily identified by Magnetic Resonance Imaging and they appear as typical hyperintensities on T1 spin echo sequences. Manganese is implicated in the normal functioning of superoxide dismutase, synthetases and peroxidases, and in excess it is neu-rotoxic inducing astrocyte swelling (11). Variations in serum and cerebrospinal fluid levels of copper have also been speculated, but no correlation between them and the presence and degree
of HE have been found (12).
Endogenous opioids theoryStudies on rats with induced HE have demonstrated a hy-
persensitivity to morphine, as well as increased pain sensitivity, findings which are specific to the endogenous opioid system (13). The increased activation of the latter was also correlated with behavioral alterations, such as increased ethanol intake in cirrhotic patients (14). These findings suggest that the en-dogenous opioid system has a role in the physiopathology of neuropsychiatric symptoms in patients with liver failure.
Nitric oxide theoryNitric oxide is a gas molecule produced in the context of
hyperammonia leading to memory deficits and cerebral edema, through increased oxidative stress and decreased antioxidant mechanisms (15). In patients with liver insufficiency there is also an over expression of nitric oxide synthase (NOS) in the neuronal cells, which is responsible for the excessive production of nitric oxide. The mechanism was studied on rats with porto-caval anastomosis (16). The substrate for NOS is L-arginine, and its cerebral uptake and availability in hyperammonemia increases in parallel with that of NOS. Arginine can also function as a substrate for glutamate, thus explaining the replenishment of glutamate in the astrocytes in the case of increased glutamine production (17).
CONCLUSIONNumerous hypotheses have been introduced over time, in
the attempt to thoroughly and completely explain the pathogen-esis of hepatic encephalopathy. A series of in-vitro studies, as well as animal experiments have documented clear and statistically coherent correlations, and thus fundament new theories. Clinical evidence and new biological and imagistic investigations try to uncover the last less-known physiopathological processes, in the attempt to fully understand this syndrome. The large number of mechanisms involved suggests that the process of HE onset and development is a complex one, with multiple causes, some of which are intricate. A good knowledge and understanding of the physiopathology of HE can lead to a quick and correct diagnosis, and to a good insight in the management of this syndrome.
ACKNOWLEDGEMENT: This paper is supported by the Sectoral Operational Programme Human Resources Development (SOP HRD) 2007-2013, financed from the European Social Fund and by the Romanian Government under the contract number POSDRU/107/1.5/S/82839
REFERENCES1. Ferenci P, Lockwood A, Mullen K, et al. Hepatic encephalopathy – Definition, nomenclature, diagnosis and quantification: Final report of the working party at the 11th World Congresses of Gastroenterology, Vienna, 1998. Hepatology, 2002; 35: 716-721.2. Eck NV. Ligature of the portal vein. Voen Med J St. Petersburg (Russ), 1877; 130:1-2.

2012.23.3 (75) Fiziologia - Physiology 25
3. Gabuzda D Jr, Philips GB, Davidson CS. Reversible toxic manifesta-tions in patients with cirrhosis of the liver given cation-exchange resins. N Engl J Med, 1952; 246: 124-130. 4. Abou Assi S, Vlahcevic ZR. Hepatic Encephalopathy. Metabolic consequence of cirrhosis often is reversible, Postgrad Med 2001, 102: 52-60, 63.5. Ryan JM, Shawcross DL. Hepatic encephalopathy. Medicine, 2011; 39 (10): 617-620. 6. H Al Mardini, K Bartlett. CO Record, Blood and brain concentrations of mercaptans in hepatic and methanethiol induced coma. Gut., 1984; 25(3): 284-290.7. The Merck Manual, February 20108. Fischer JE, Baldessarini RJ. False neurotransmitters and hepatic failure. Lancet., 1971; 10(2):75.80.9. Fischer JE, Yoshimura N, Aguirre A, James JH, Cummings MG, Abel RM, Deindoerfer F. Plasma amino acids in patients with hepatic encephalopathy. Effects of amino acid infusions. Am J Surg., 1974; 127: 40-7.10. Schafer DF, Jones EA. Hepatic encephalopathy and the -y-amin-obutyric acid neurotransmitter system. Lancet, 1982; i:18-19. 11. Rose C, Butterworth RF, Zayed J, et al. Manganese deposition in basal ganglia structures results fromboth portal-systemic shunting and
liver dysfunction. Gastroenterology 1999; 117:640-44.12. Singh V, Bhattacharya SK, Kacchawaha JS. Cerebrospinalfluid copper in acute hepatic encephalopathy Indian Journal of Clinical Biochemistry 1992; 7(1): 31-32. 13. Salomon F, Beaubernard C, Thangapregassam MJ, Grange D, Bismuth H. Encéphalopathie hépatique expérimentale. II–Étude de la réaction à la douleur chez le rat avec anastomose porto-cave. Biol Gastroenterol, 1976; 9: 105-108. 14. De Waele JP, Audet RM, Rose C, Butterworth RF. The portacaval-shunted rat: A new model for the study of the mechanisms controlling voluntary ethanol consumption and ethanol dependence. Alcohol Clin Exp Res 1997; 21: 305-310.15. Rao VL. Nitric oxide in hepatic encephalopathy and hyperammone-mia. Neurochem Int., 2002; 41(2-3): 161-70.16. Rao VL, Audet RM, Butterworth RF. Portacaval shunting and hyperammonemia stimulate the uptake of L-3H-arginine but not L-3H-nitroarginine into rat brain synaptosomes. J Neurochem, 1997; 68: 337-343. 17. Mans AM, DeJoseph MR, Hawkins RA. Metabolic abnormalities and grade of encephalopathy in acute hepatic failure. J Neurochem, 1994; 63:1829-38.
FIZIOLOGIA ŞI FIZIOPATOLOGIA ENCEFALOPATIEI HEPATICE
REZUMATO bună cunoaştere a proceselor fiziologice şi fiziopatologice ale encefalopatiei hepatice (EH) poate conduce la o mai bună înţelegere a acestui sindrom, şi la o abordare terapeutică adecvată. În patogeneza EH sunt implicate un număr mare de mecanisme, unele dintre ele fiind strâns inter-conectate. Această lucrare sumarizează cele mai importante aspecte implicate în dezvoltarea EH, cu intenţia de a deschide noi direcţii de cercetare, şi de asemenea, de a aduce informaţii utile, cu potenţial impact clinic.Cuvinte cheie: Encefalopatie hepatică, fiziologie, fiziopatologie, mecanisme, teorii, studii pe animale, IRM, spectroscopie.
Fiziologia - Physiology 2012.23.3 (75)26
THE EFFECTS OF ADENOSINE AMINE CONGENER (ADAC) ON THE SOUND STRESS IN WISTAR RATS GOANŢĂ CM, SANDU S, PÎSLARU A, ZĂGREAN LDivision of Physiology and Neuroscience, University of Medicine and Pharmacy „Carol Davila”, Bucharest, Romania
ABSTRACTNoise is a stress factor that cannot be avoided in everyday life with significant implications in morbidity. Its effects are not limited to the inner ear but are reflected back to the entire body, psyche, and behavior. ADAC is a selective A1 adenosine receptor agonist which was used before to provide neuroprotection in experimental models of cerebral ischemia and Huntington’s disease.This study included 30 Wistar rats divided into 3 groups: one group was injected with ADAC for 7 days, a second group with saline for 7 days, and the third group was the control group. Rats injected with ADAC and saline were exposed to a white noise with an intensity of 100 dB, for 2 hours per day during 14 days and were subject to behavioral tests (Open Field Test, Elevated Plus Maze Test) before exposure and subsequently after 7 and 14 days respectively. Their weight was monitored daily during the first 7 days and then on day 14. We have noticed a slight weight gain in the noise exposed rats. Animals injected with ADAC have performed better on behavioral tests. Keywords: noise stress, ADAC, anxiety, depression, Open field test, Elevated plus maze.
Received 1th of April 2012. Accepted 21th of May 2012. Address for correspondence: Dr. Goanta CM, Division of Physiology and Neuroscience, University of Medicine and Pharmacy “Carol Davila”, Bucharest, Romania, phone: +40213180762, e-mail: [email protected]
INTRODUCTION
The World Health Organization informs that 275 million people worldwide are suffering from hearing loss (1). These worrying figures are a manifestation of growing exposure to increased noise. Noise pollution is due to the most basic things: cars in the streets, iPods, appliances, music in restaurants or clubs, background noise inside supermarkets. In large cities, it is es-timated that the noise level from the traffic areas is over 65 dB and 20% of Europe’s population is subject to this noise stress (2). The effects of noise on the human body have been extensively studied and historically it was concluded that acoustic stress affects not only the human ear but in an even more severe way it affects the nervous, endocrine, and cardiovascular systems. Furthermore these effects became apparent at a pollution level of 50 dB (3,4).
Prolonged exposure to noise and continuous changes of metabolic disorders due to endogenous factors associated to noise stress can lead to chronic diseases such as atheroscle-rosis, hypertension, and cardiac ischemia (5).
Studies to date on human subjects show that exposure to noise affects the sympathetic nervous and endocrine systems and leads to nonspecific physiological reactions such as in-creased blood pressure, increased heart rate (6), vasoconstric-tion, increased levels of stress hormones, and sometimes even changes visible on the electrocardiogram (7).
These reactions of the body to noise stress were recorded at moderate levels of noise, especially when the noise was superimposed to individual activities (learning, concentration,
attention) (8). Another interesting aspect is the reactions above do not occur only when people are awake but also during sleep (9). At the psychological level, people working or living in polluted noise have to deal with acute anxiety or depression (10,11).
Adenosine receptor agonists have been used successfully in treating cerebral and heart ischemia and their protective func-tion at the cellular level was successfully demonstrated (12). The same types of receptors have been located in the cochlea (13) so it would be possible these compounds are also effec-tive at this level. Adenosine amine congener may be a better option than other type A1 agonists because it has a reduced number of peripheral side effects (14). The most common side effects noticed in the administration of A1 receptor agonists are bradycardia, hypotension, and hypothermia. The lack of these side effects and the high affinity to receptors in the brain is due to its chemical structure which has been modified and its ability to cross the blood-brain barrier (15).
MATERIAL AND METHODS
Animals. For this study we used 30 Wistar rats, 12 weeks of age weighing 200-210 grams. Rats were divided into 3 groups: a control group, a group which was admin-istered ADAC, and another group which was administered a vehicle solution prepared similarly to the ADAC solution. Animals were housed 4 in each cage in a room with a constant temperature of 25 degrees with food and water ad libitum. Treatment. ADAC was obtained from Sigma Aldrich, and was prepared as follows: 6 mg of ADAC were dissolved in 200 µl of
a
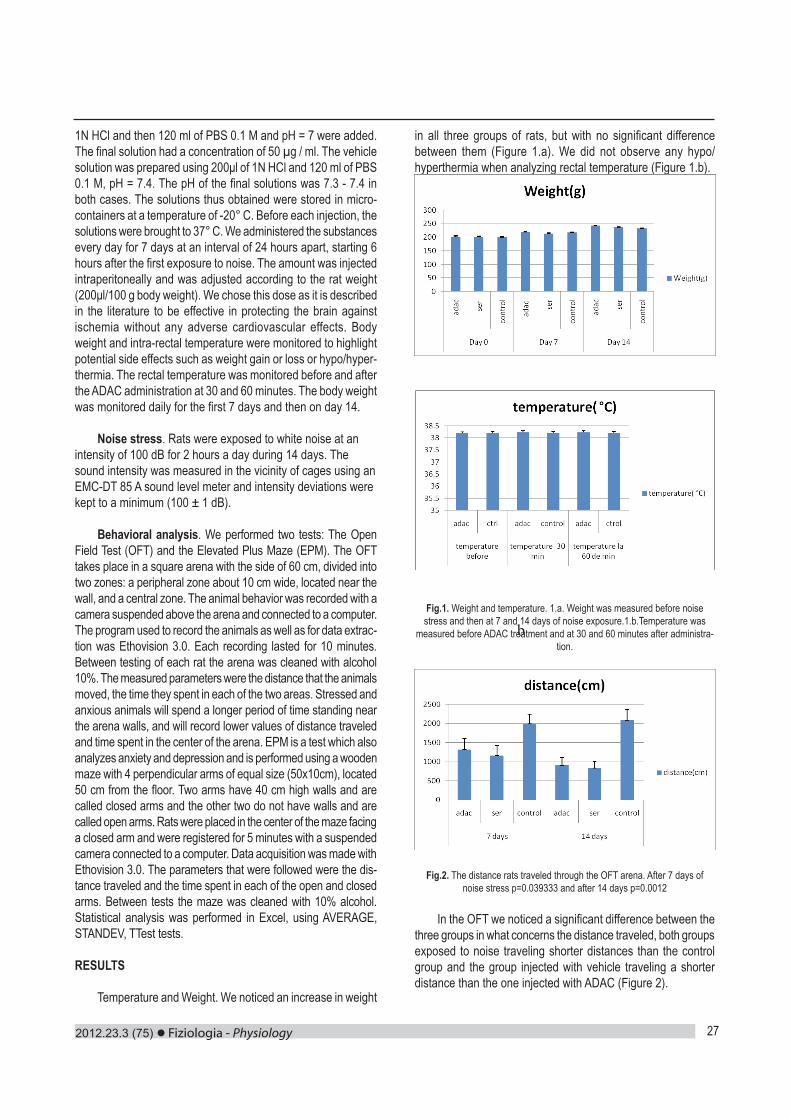
2012.23.3 (75) Fiziologia - Physiology 27
1N HCl and then 120 ml of PBS 0.1 M and pH = 7 were added. The final solution had a concentration of 50 µg / ml. The vehicle solution was prepared using 200μl of 1N HCl and 120 ml of PBS 0.1 M, pH = 7.4. The pH of the final solutions was 7.3 - 7.4 in both cases. The solutions thus obtained were stored in micro-containers at a temperature of -20° C. Before each injection, the solutions were brought to 37° C. We administered the substances every day for 7 days at an interval of 24 hours apart, starting 6 hours after the first exposure to noise. The amount was injected intraperitoneally and was adjusted according to the rat weight (200μl/100 g body weight). We chose this dose as it is described in the literature to be effective in protecting the brain against ischemia without any adverse cardiovascular effects. Body weight and intra-rectal temperature were monitored to highlight potential side effects such as weight gain or loss or hypo/hyper-thermia. The rectal temperature was monitored before and after the ADAC administration at 30 and 60 minutes. The body weight was monitored daily for the first 7 days and then on day 14.
Noise stress. Rats were exposed to white noise at an intensity of 100 dB for 2 hours a day during 14 days. The sound intensity was measured in the vicinity of cages using an EMC-DT 85 A sound level meter and intensity deviations were kept to a minimum (100 ± 1 dB).
Behavioral analysis. We performed two tests: The Open Field Test (OFT) and the Elevated Plus Maze (EPM). The OFT takes place in a square arena with the side of 60 cm, divided into two zones: a peripheral zone about 10 cm wide, located near the wall, and a central zone. The animal behavior was recorded with a camera suspended above the arena and connected to a computer. The program used to record the animals as well as for data extrac-tion was Ethovision 3.0. Each recording lasted for 10 minutes. Between testing of each rat the arena was cleaned with alcohol 10%. The measured parameters were the distance that the animals moved, the time they spent in each of the two areas. Stressed and anxious animals will spend a longer period of time standing near the arena walls, and will record lower values of distance traveled and time spent in the center of the arena. EPM is a test which also analyzes anxiety and depression and is performed using a wooden maze with 4 perpendicular arms of equal size (50x10cm), located 50 cm from the floor. Two arms have 40 cm high walls and are called closed arms and the other two do not have walls and are called open arms. Rats were placed in the center of the maze facing a closed arm and were registered for 5 minutes with a suspended camera connected to a computer. Data acquisition was made with Ethovision 3.0. The parameters that were followed were the dis-tance traveled and the time spent in each of the open and closed arms. Between tests the maze was cleaned with 10% alcohol. Statistical analysis was performed in Excel, using AVERAGE, STANDEV, TTest tests.
RESULTS
Temperature and Weight. We noticed an increase in weight
in all three groups of rats, but with no significant difference between them (Figure 1.a). We did not observe any hypo/hyperthermia when analyzing rectal temperature (Figure 1.b).
Fig.1. Weight and temperature. 1.a. Weight was measured before noise stress and then at 7 and 14 days of noise exposure.1.b.Temperature was
measured before ADAC treatment and at 30 and 60 minutes after administra-tion.
Fig.2. The distance rats traveled through the OFT arena. After 7 days of noise stress p=0.039333 and after 14 days p=0.0012
In the OFT we noticed a significant difference between the three groups in what concerns the distance traveled, both groups exposed to noise traveling shorter distances than the control group and the group injected with vehicle traveling a shorter distance than the one injected with ADAC (Figure 2).
b
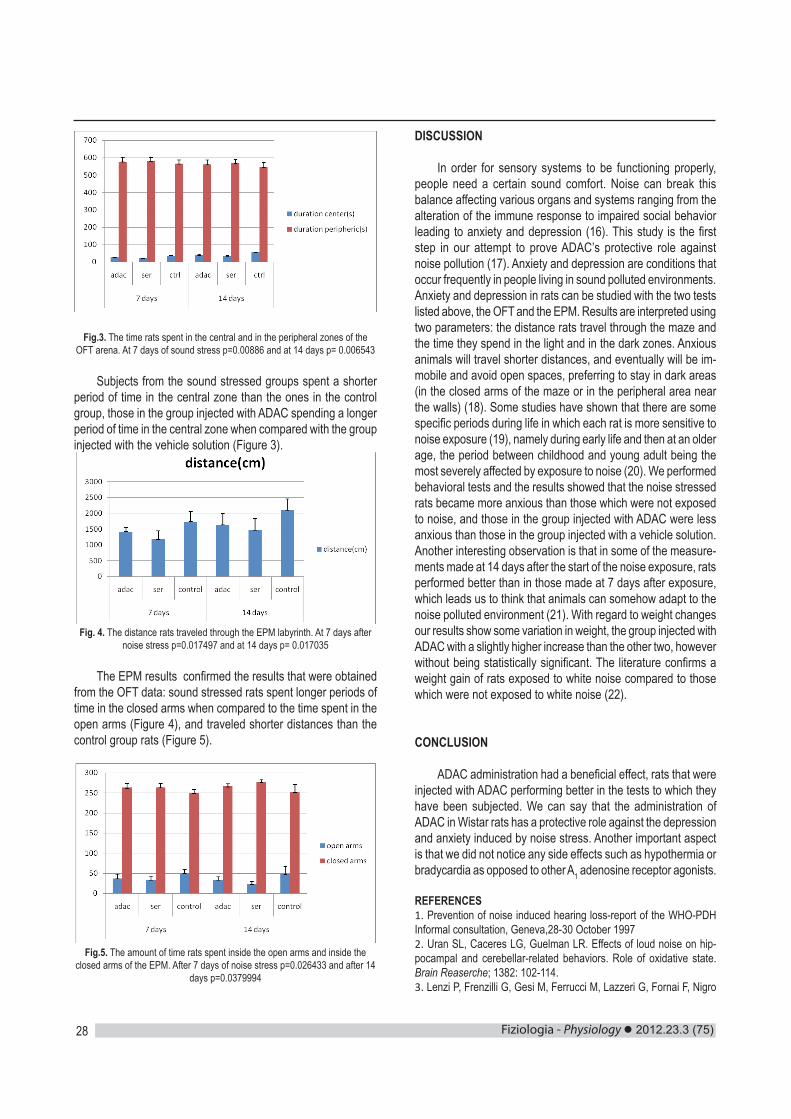
Fiziologia - Physiology 2012.23.3 (75)28
Fig.3. The time rats spent in the central and in the peripheral zones of the OFT arena. At 7 days of sound stress p=0.00886 and at 14 days p= 0.006543
Subjects from the sound stressed groups spent a shorter period of time in the central zone than the ones in the control group, those in the group injected with ADAC spending a longer period of time in the central zone when compared with the group injected with the vehicle solution (Figure 3).
Fig. 4. The distance rats traveled through the EPM labyrinth. At 7 days after noise stress p=0.017497 and at 14 days p= 0.017035
The EPM results confirmed the results that were obtained from the OFT data: sound stressed rats spent longer periods of time in the closed arms when compared to the time spent in the open arms (Figure 4), and traveled shorter distances than the control group rats (Figure 5).
Fig.5. The amount of time rats spent inside the open arms and inside the closed arms of the EPM. After 7 days of noise stress p=0.026433 and after 14
days p=0.0379994
DISCUSSION
In order for sensory systems to be functioning properly, people need a certain sound comfort. Noise can break this balance affecting various organs and systems ranging from the alteration of the immune response to impaired social behavior leading to anxiety and depression (16). This study is the first step in our attempt to prove ADAC’s protective role against noise pollution (17). Anxiety and depression are conditions that occur frequently in people living in sound polluted environments. Anxiety and depression in rats can be studied with the two tests listed above, the OFT and the EPM. Results are interpreted using two parameters: the distance rats travel through the maze and the time they spend in the light and in the dark zones. Anxious animals will travel shorter distances, and eventually will be im-mobile and avoid open spaces, preferring to stay in dark areas (in the closed arms of the maze or in the peripheral area near the walls) (18). Some studies have shown that there are some specific periods during life in which each rat is more sensitive to noise exposure (19), namely during early life and then at an older age, the period between childhood and young adult being the most severely affected by exposure to noise (20). We performed behavioral tests and the results showed that the noise stressed rats became more anxious than those which were not exposed to noise, and those in the group injected with ADAC were less anxious than those in the group injected with a vehicle solution. Another interesting observation is that in some of the measure-ments made at 14 days after the start of the noise exposure, rats performed better than in those made at 7 days after exposure, which leads us to think that animals can somehow adapt to the noise polluted environment (21). With regard to weight changes our results show some variation in weight, the group injected with ADAC with a slightly higher increase than the other two, however without being statistically significant. The literature confirms a weight gain of rats exposed to white noise compared to those which were not exposed to white noise (22).
CONCLUSION
ADAC administration had a beneficial effect, rats that were injected with ADAC performing better in the tests to which they have been subjected. We can say that the administration of ADAC in Wistar rats has a protective role against the depression and anxiety induced by noise stress. Another important aspect is that we did not notice any side effects such as hypothermia or bradycardia as opposed to other A1 adenosine receptor agonists.
REFERENCES1. Prevention of noise induced hearing loss-report of the WHO-PDH Informal consultation, Geneva,28-30 October 19972. Uran SL, Caceres LG, Guelman LR. Effects of loud noise on hip-pocampal and cerebellar-related behaviors. Role of oxidative state. Brain Reaserche; 1382: 102-114.3. Lenzi P, Frenzilli G, Gesi M, Ferrucci M, Lazzeri G, Fornai F, Nigro
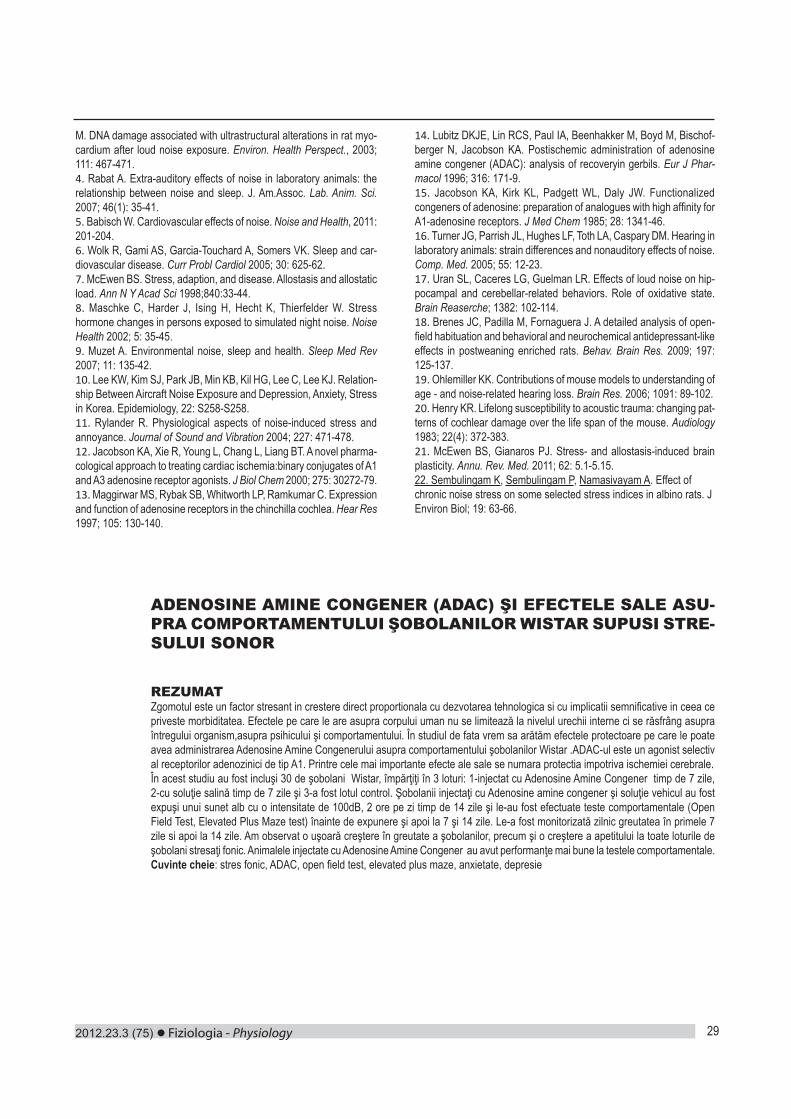
2012.23.3 (75) Fiziologia - Physiology 29
M. DNA damage associated with ultrastructural alterations in rat myo-cardium after loud noise exposure. Environ. Health Perspect., 2003; 111: 467-471.4. Rabat A. Extra-auditory effects of noise in laboratory animals: the relationship between noise and sleep. J. Am.Assoc. Lab. Anim. Sci. 2007; 46(1): 35-41.5. Babisch W. Cardiovascular effects of noise. Noise and Health, 2011: 201-204.6. Wolk R, Gami AS, Garcia-Touchard A, Somers VK. Sleep and car-diovascular disease. Curr Probl Cardiol 2005; 30: 625-62.7. McEwen BS. Stress, adaption, and disease. Allostasis and allostatic load. Ann N Y Acad Sci 1998;840:33-44.8. Maschke C, Harder J, Ising H, Hecht K, Thierfelder W. Stress hormone changes in persons exposed to simulated night noise. Noise Health 2002; 5: 35-45.9. Muzet A. Environmental noise, sleep and health. Sleep Med Rev 2007; 11: 135-42.10. Lee KW, Kim SJ, Park JB, Min KB, Kil HG, Lee C, Lee KJ. Relation-ship Between Aircraft Noise Exposure and Depression, Anxiety, Stress in Korea. Epidemiology, 22: S258-S258.11. Rylander R. Physiological aspects of noise-induced stress and annoyance. Journal of Sound and Vibration 2004; 227: 471-478.12. Jacobson KA, Xie R, Young L, Chang L, Liang BT. A novel pharma-cological approach to treating cardiac ischemia:binary conjugates of A1 and A3 adenosine receptor agonists. J Biol Chem 2000; 275: 30272-79.13. Maggirwar MS, Rybak SB, Whitworth LP, Ramkumar C. Expression and function of adenosine receptors in the chinchilla cochlea. Hear Res 1997; 105: 130-140.
14. Lubitz DKJE, Lin RCS, Paul IA, Beenhakker M, Boyd M, Bischof-berger N, Jacobson KA. Postischemic administration of adenosine amine congener (ADAC): analysis of recoveryin gerbils. Eur J Phar-macol 1996; 316: 171-9.15. Jacobson KA, Kirk KL, Padgett WL, Daly JW. Functionalized congeners of adenosine: preparation of analogues with high affinity for A1-adenosine receptors. J Med Chem 1985; 28: 1341-46.16. Turner JG, Parrish JL, Hughes LF, Toth LA, Caspary DM. Hearing in laboratory animals: strain differences and nonauditory effects of noise. Comp. Med. 2005; 55: 12-23.17. Uran SL, Caceres LG, Guelman LR. Effects of loud noise on hip-pocampal and cerebellar-related behaviors. Role of oxidative state. Brain Reaserche; 1382: 102-114.18. Brenes JC, Padilla M, Fornaguera J. A detailed analysis of open-field habituation and behavioral and neurochemical antidepressant-like effects in postweaning enriched rats. Behav. Brain Res. 2009; 197: 125-137.19. Ohlemiller KK. Contributions of mouse models to understanding of age - and noise-related hearing loss. Brain Res. 2006; 1091: 89-102.20. Henry KR. Lifelong susceptibility to acoustic trauma: changing pat-terns of cochlear damage over the life span of the mouse. Audiology 1983; 22(4): 372-383.21. McEwen BS, Gianaros PJ. Stress- and allostasis-induced brain plasticity. Annu. Rev. Med. 2011; 62: 5.1-5.15.22. Sembulingam K, Sembulingam P, Namasivayam A. Effect of chronic noise stress on some selected stress indices in albino rats. J Environ Biol; 19: 63-66.
ADENOSINE AMINE CONGENER (ADAC) ŞI EFECTELE SALE ASU-PRA COMPORTAMENTULUI ŞOBOLANILOR WISTAR SUPUSI STRE-SULUI SONOR
REZUMATZgomotul este un factor stresant in crestere direct proportionala cu dezvotarea tehnologica si cu implicatii semnificative in ceea ce priveste morbiditatea. Efectele pe care le are asupra corpului uman nu se limitează la nivelul urechii interne ci se răsfrâng asupra întregului organism,asupra psihicului şi comportamentului. În studiul de fata vrem sa arătăm efectele protectoare pe care le poate avea administrarea Adenosine Amine Congenerului asupra comportamentului şobolanilor Wistar .ADAC-ul este un agonist selectiv al receptorilor adenozinici de tip A1. Printre cele mai importante efecte ale sale se numara protectia impotriva ischemiei cerebrale.În acest studiu au fost incluşi 30 de şobolani Wistar, împărţiţi în 3 loturi: 1-injectat cu Adenosine Amine Congener timp de 7 zile, 2-cu soluţie salină timp de 7 zile şi 3-a fost lotul control. Şobolanii injectaţi cu Adenosine amine congener şi soluţie vehicul au fost expuşi unui sunet alb cu o intensitate de 100dB, 2 ore pe zi timp de 14 zile şi le-au fost efectuate teste comportamentale (Open Field Test, Elevated Plus Maze test) înainte de expunere şi apoi la 7 şi 14 zile. Le-a fost monitorizată zilnic greutatea în primele 7 zile si apoi la 14 zile. Am observat o uşoară creştere în greutate a şobolanilor, precum şi o creştere a apetitului la toate loturile de şobolani stresaţi fonic. Animalele injectate cu Adenosine Amine Congener au avut performanţe mai bune la testele comportamentale. Cuvinte cheie: stres fonic, ADAC, open field test, elevated plus maze, anxietate, depresie
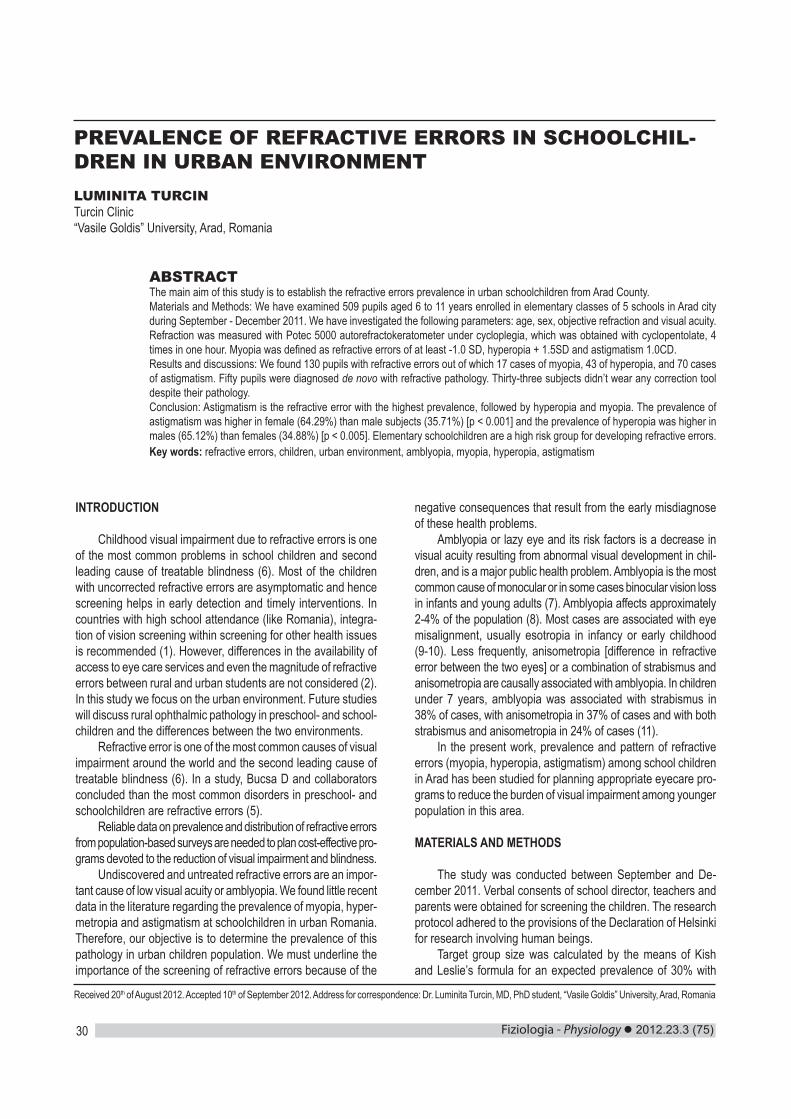
Fiziologia - Physiology 2012.23.3 (75)30
PREVALENCE OF REFRACTIVE ERRORS IN SCHOOLCHIL-DREN IN URBAN ENVIRONMENTLUMINITA TURCINTurcin Clinic“Vasile Goldis” University, Arad, Romania
ABSTRACTThe main aim of this study is to establish the refractive errors prevalence in urban schoolchildren from Arad County.Materials and Methods: We have examined 509 pupils aged 6 to 11 years enrolled in elementary classes of 5 schools in Arad city during September - December 2011. We have investigated the following parameters: age, sex, objective refraction and visual acuity. Refraction was measured with Potec 5000 autorefractokeratometer under cycloplegia, which was obtained with cyclopentolate, 4 times in one hour. Myopia was defined as refractive errors of at least -1.0 SD, hyperopia + 1.5SD and astigmatism 1.0CD. Results and discussions: We found 130 pupils with refractive errors out of which 17 cases of myopia, 43 of hyperopia, and 70 cases of astigmatism. Fifty pupils were diagnosed de novo with refractive pathology. Thirty-three subjects didn’t wear any correction tool despite their pathology.Conclusion: Astigmatism is the refractive error with the highest prevalence, followed by hyperopia and myopia. The prevalence of astigmatism was higher in female (64.29%) than male subjects (35.71%) [p < 0.001] and the prevalence of hyperopia was higher in males (65.12%) than females (34.88%) [p < 0.005]. Elementary schoolchildren are a high risk group for developing refractive errors.Key words: refractive errors, children, urban environment, amblyopia, myopia, hyperopia, astigmatism
Received 20th of August 2012. Accepted 10th of September 2012. Address for correspondence: Dr. Luminita Turcin, MD, PhD student, “Vasile Goldis” University, Arad, Romania
INTRODUCTION
Childhood visual impairment due to refractive errors is one of the most common problems in school children and second leading cause of treatable blindness (6). Most of the children with uncorrected refractive errors are asymptomatic and hence screening helps in early detection and timely interventions. In countries with high school attendance (like Romania), integra-tion of vision screening within screening for other health issues is recommended (1). However, differences in the availability of access to eye care services and even the magnitude of refractive errors between rural and urban students are not considered (2). In this study we focus on the urban environment. Future studies will discuss rural ophthalmic pathology in preschool- and school-children and the differences between the two environments.
Refractive error is one of the most common causes of visual impairment around the world and the second leading cause of treatable blindness (6). In a study, Bucsa D and collaborators concluded than the most common disorders in preschool- and schoolchildren are refractive errors (5).
Reliable data on prevalence and distribution of refractive errors from population-based surveys are needed to plan cost-effective pro-grams devoted to the reduction of visual impairment and blindness.
Undiscovered and untreated refractive errors are an impor-tant cause of low visual acuity or amblyopia. We found little recent data in the literature regarding the prevalence of myopia, hyper-metropia and astigmatism at schoolchildren in urban Romania. Therefore, our objective is to determine the prevalence of this pathology in urban children population. We must underline the importance of the screening of refractive errors because of the
negative consequences that result from the early misdiagnose of these health problems.
Amblyopia or lazy eye and its risk factors is a decrease in visual acuity resulting from abnormal visual development in chil-dren, and is a major public health problem. Amblyopia is the most common cause of monocular or in some cases binocular vision loss in infants and young adults (7). Amblyopia affects approximately 2-4% of the population (8). Most cases are associated with eye misalignment, usually esotropia in infancy or early childhood (9-10). Less frequently, anisometropia [difference in refractive error between the two eyes] or a combination of strabismus and anisometropia are causally associated with amblyopia. In children under 7 years, amblyopia was associated with strabismus in 38% of cases, with anisometropia in 37% of cases and with both strabismus and anisometropia in 24% of cases (11).
In the present work, prevalence and pattern of refractive errors (myopia, hyperopia, astigmatism) among school children in Arad has been studied for planning appropriate eyecare pro-grams to reduce the burden of visual impairment among younger population in this area.
MATERIALS AND METHODS
The study was conducted between September and De-cember 2011. Verbal consents of school director, teachers and parents were obtained for screening the children. The research protocol adhered to the provisions of the Declaration of Helsinki for research involving human beings.
Target group size was calculated by the means of Kish and Leslie’s formula for an expected prevalence of 30% with
2012.23.3 (75) Fiziologia - Physiology 31
confidence limit of 5% and confidence level 99%.We have examined 509 pupils aged 6 to 11 years enrolled
in elementary classes of 5 schools in Arad city. There was no acute pathology that would have influenced refraction. The distant vision of a child was tested utilizing Snellen’s Illiterate ‘E’ chart. The visual acuity was tested with the chart at 6 meters. If uncor-rected vision was <0.6 in either eye, the child was declared to have defective vision. A cover-uncover test was then performed to confirm the diagnosis of strabismus. If eyes moved after removal of the cover, the child was considered to have a “phoria”; and if the degree of deviation did not change on cover and uncover, the child was considered to have a “tropia” [> 5 degree / 10Δ diopter (D)]. The eye movements were tested in 6 cardinal directions to rule out paralytic or restrictive strabismus. Anterior segment was examined with flashlight to detect cataract; congenital anomalies like anophthalmos, microphthalmos, large corneas; and evidence of previous eye surgery. Objective refraction was measured with Potec 5000 autorefractokeratometer under cycloplegia which was obtained with cyclopentolate 1% 4 times in 1 hour. This procedure was applied to all children, regardless of visual acuity.
Statistic analysis was conducted with Epi Info 7.Emmetropia was defined as a spherical equivalent between
-1.00 and +1.00. Myopia was considered when the measured objective refraction was more than or equal to –1.0 spherical equivalent diopters in one or both eyes. Hyperopia was considered when the measured objective refraction was greater than +1.50 spherical equivalent diopters in one or both eyes provided no eye was myopic. Astigmatism was considered to be visually significant if ≥1.00 D. Results are presented in tables and charts below.
All children with uncorrected refractive error were given low cost spectacles. . Children with eye diseases were further examined and managed at the base clinic free of charge. The study results were shared with the scientific fraternity and policies for improving eye care of children were proposed.
RESULTS
We found the following results: out of the total of 509 children examined, 379 (74.46%) were emmetropic and 130 (25.54%) were found with refractive errors (ammetropic). There were 17 (3.34%) cases of myopia, 43 (8.45%) of hypermetropia and 70 (13.75%) cases of astigmatism. Results are shown in Table I.
Table I. Number of children and distribution of refractive errors over classesClass No. pupils Total refrac-
tive errorsMyopia Hyperopia Astigmatism
I. 139 32 5 9 18II. 149 40 5 12 23III. 112 29 3 10 16IV. 109 29 4 12 13
Total 509 130 17 43 70
This means that 25.54% of children from urban environ-ment included in the study have ophthalmic refractive pathology. 3.34% have myopia, 8.45% have hypermetropia and 13.75%
have astigmatism.There were no statistical differences in prevalence of refrac-
tive errors between genders. Chart 1 shows the proportion of the different types of refrac-
tive errors. Myopia represents 13.08%, hyperopia 33.08% and astigmatism 53.85% of discovered refractive errors.
Miopia
Hyperopia
Astigmatism
Chart 1. Proportion of the three types of refractive errors
In this study we examined 230 (45.18%) male and 279 (54.82%) female children. We discovered 7 (41.17%) cases of boys and 10 (58.83%) cases of girls with myopia. There is no statistically significant difference between sexes in myopia. We discovered 28 (65.11%) cases of boys and 15 (34.89%) cases of girls with hyperopia. We found 25 (35.71%) cases of boys and 45 (64.29%) cases of girls with astigmatism. Prevalence of astigmatism was higher in girls (64.29%) than in boys (35.71%) [p < 0.001], while hypermetropia was more prevalent in boys (65.11%) than in girls (34.89%) [p < 0.005]. Data are shown in Table II.
Table II. Distribution of refractive errors over sexesPupils Myopia Hyperopia Astigmatism Refractive
Males 230 7 28 25 60Females 279 10 15 45 70
Total 509 17 43 70 130
Out of the total number of 509 children examined, 130 (25.54%) were found with refractive errors. Fifty (38.46%) children were newly discovered with ophthalmic refractive pathology and 33 (25.38%) didn’t wear optical correction although they knew about their condition. Hence 83 pupils overall didn’t wear optical correction for their ophthalmologic pathology, because either they didn’t know about it or they were not compliant with the treatment.
Forty-seven (9.23%) of the 509 children examined wore optical correction at the time the study was conducted.
Table III. Newly and neglected refractive errors distributionNo. c Percent (%) Myo-
piaHyper-opia
Astig-matism
No. of pupils 509 100Total refractive errors 130 25.54 17 43 70Newly discovered refractive errors
50 9.82 5 18 27
Known and uncorrected refractive errors
33 6.48 4 14 15

Fiziologia - Physiology 2012.23.3 (75)32
We found 5 (3.84%) new myopia cases, 18 (13.86%) new hyperopia cases and 27 (20.76%) new astigmatism cases. The number of new cases, expressed as percentage of total number of children examined, was as follows: 0.98% myopia cases, 3.53% hyperopia cases and 5.39% astigmatism cases.
We found 4 (3.07%) known and neglected myopia cases, 14 (10.76%) known and neglected hyperopia cases and 15 (11.53%) known and neglected astigmatism cases. The number of known, yet neglected cases, expressed as percentage of total number of children examined, was: 0.78% myopia cases, 2.75% hyperopia cases and 2.94% astigmatism cases. Forty-seven (9.23%) from the 509 children examined wore optical correction at the time the study was conducted. Results are shown in Table III.
Considering each type of refractive error, we have 21.41% new myopia cases, 23.52% known and neglected myopia cases, 41.86% new hyperopia cases, 32.55% known and neglected hyperopia cases 38.54% new astigmatism cases and 21.42% known and neglected astigmatism cases.
52.94% of the children with myopia, 74.41% of the children with hyperopia and 60% of the children with astigmatism didn’t wear optical correction at the time of examination because either they didn’t know about their pathology or they have shown low compliance with the treatment.
Related to the total number of children examined, we found 1.77% untreated myopia cases, 6.17% untreated hypermetropia cases and 8.25% untreated astigmatism cases. Statistically significant differences can be seen between myopic and hy-permetropic cases (1.77% and 6.17% p < 0.001) and between myopic and astigmatism cases (1.77% and 8.25% p<0.0001). There was no statistically significant difference between hyper-metropic and astigmatism cases.
Table IV. Age groups distribution of refractive errors
Age No pu-pils
% Myo-pia
cases
% Hyper-opia
cases
% Astig-matism cases
%
6 23 4.52 2 11.76 3 6.98 5 7.147 111 21.81 3 17.65 7 16.28 13 18.578 87 17.09 4 23.53 11 25.58 17 24.299 99 19.45 4 23.53 8 18.6 9 12.86
10 109 21.41 2 11.76 6 13.95 11 15.7111 80 15.72 2 11.76 8 18.6 15 21.43
total 509 100 17 100 43 100 70 100
The prevalence of myopia, hyperopia and astigmatism over age groups after one year is shown in Table IV. There was no statistically significant difference in the prevalence evolution over these age groups in neither of the studied refractive pathologies.
DISCUSSION
In 2003 Budau M. and collaborators conducted a screening assessment of refractive errors of children investigated at “Luis
Turcanu” Hospital’s Ambulatory. They concluded that out of the 646 children, 407--63% (CI95 = 59.1-66.7) had refraction errors, out of which 1.5% (CI95 = 0.8-2.9) were myopic, whereas 49.8% (CI95 = 45.9-53.8) were hyperopic. Astigmatism was found in 11.8% (CI95 = 9.4-14.6) and the mean age was 10.7 years (4). Compared to our study myopia cases have similar prevalence (3.54% in our study and 1.5% in the cited study [p < 0.02]). The results are different in the case of astigmatism, which we found to be the most frequent; while in the above mentioned study hypero-pia had the highest prevalence. We believe the differences arise from the different definitions of the studied pathology. Also, the target group was different than ours. Patients who went to “Luis Turcanu” Hospital’s Ambulatory already had some symptoms and possibly a current disease. This could be a good explanation for the high percentage of refractive errors found (63%).
In a study Bucsa D. and collaborators concluded than the most common disorders in preschool - and schoolchildren are refractive errors (5). We found that 74.46% of children from the study were emmetropic and 25.54% ammetropic. This could mean that about one quarter of elementary schoolchildren have refractive errors.
In 2001, Hendrickson K and Bleything W conducted a screening of Romanian children and adults. They found the following data: 45% of the children were emmetropic, 27% were myopic, and 28% were hyperopic; 42% of the adults were emmetropic, 16% were myopic, and 42% were hyperopic. When compared with other nations the prevalence of myopia was higher in the Romanian children, whereas in adults the hyperopia was higher. With-the-rule astigmatism had the highest occur-rence when compared to other axis orientations, yet the overall occurrence of astigmatism was less than that found in other nations for both children and adults. Incidence of astigmatism was lower compared to other nations in both children and adults. The prevalence of strabismus and other ocular diseases was lower in the Romanian children as compared to other nations (3). CONCLUSIONS
The most prevalent ophthalmic pathology in urban school-children is astigmatism, followed by hyperopia and myopia. Astigmatism is more prevalent in girls and myopia is more prevalent in boys. There is no statistically significant difference in the prevalence of myopia cases in the two sexes.
We didn’t find any variation of prevalence between age groups from 6 to 11 in any of the studied refractive pathology.
The most prevalent newly discovered ophthalmic pathology in urban schoolchildren is astigmatism, followed by hyperme-tropia and myopia. Elementary schoolchildren are a high risk group for developing refractive errors. From those hyperopia and astigmatism are the main risk factors of developing amblyopia.
The most prevalent known and uncorrected (neglected, poor treatment compliance) ophthalmic pathology in urban school-children is astigmatism, followed by hypermetropia and myopia.
The screening of school and preschool children should be carried out periodically. Most children are unaware of their
and adults assessed through vision screenings. Pacific University, College of Optometry, Forest Grove, Oregon, USA. Optometry 2001; 72(6): 388-96.4. Budău M, Gamaniuc E, Moise C, Korbuly B. Study of refractive changes in Timiş County. Oftalmologia 2003; 58(3): 64-9.5. Bucşă D, Gavăt V, Albu A. Aspects of child and youth health revealed by medical check-up in Botosani County, Romania. Rev Med Chir Soc Med Nat Iasi 2011; 115(4): 1225-30. 6. Dandona R, Dandona L. Refractive error blindness. Bull World Health Organ. 2001; 79: 237-43. 7. Doshi NR, Rodriguez MLF. Amblyopia. Am Fam Physician 2007; 75: 361-7. 8. Chang CH, Tsai RK, Sheu MM. Screening amblyopia of preschool children with uncorrected vision and stereopsis tests in Eastern Taiwan. Eye 2007; 21: 1482-8. 9. Woodruff G, Hiscox F, Thompson JR, Smith LK. Factors affecting the outcome of children treated for amblyopia. Eye 1994; 8: 627-631. 10. The Pediatric Eye Disease Investigator Group. The Clinical Profile of Moderate Amblyopia in Children Younger Than 7 Years. Arch Ophthalmol 2002; 120: 281-287. 11. Shaw DE, Fielder AR, Minshull C, Rosenthal AR. Amblyopia: factors influencing age of presentation. Lancet 1988; 2: 207-209.12. Prevalence of Refractive Errors in Primary School Children [7-15 Years] of Qazvin City. Eur J Sci Res 2009; 28: 174-185.
2012.23.3 (75) Fiziologia - Physiology 33
refractive errors. Children aged 6 to 11 and their parents should be educated
about signs and symptoms of refractive errors, ocular hygiene and the risk factors involved in the development of these errors, especially amblyopia and other ocular pathological problems.
We believe that the newly discovered refractive errors can be addressed by screenings like this one. It is a good way to discover and treat children ophthalmic pathology and prevent amblyopia. Effective VA screening strategies and cycloplegic refraction measurements are needed to eliminate this easily treatable cause of visual impairment.
REFERENCES1. World Health Organization. Elimination of avoidable visual disability due to refractive error Report of an informal planning meeting. pp. 6-10. WHO/PBL/00.79.2. Amruta SP, Khandekar R, Dharmadhikari S, Dole K, Gogate K, Deshpande M. Prevalence of Uncorrected Refractive Error and Other Eye Problems Among Urban and Rural School Children. Middle East Afr J Ophthalmol 2009; 16(2): 69-74. 3. Hendrickson K, Bleything W. The visual profile of Romanian children
and adults assessed through vision screenings. Pacific University, College of Optometry, Forest Grove, Oregon, USA. Optometry 2001; 72(6): 388-96.4. Budău M, Gamaniuc E, Moise C, Korbuly B. Study of refractive changes in Timiş County. Oftalmologia 2003; 58(3): 64-9.5. Bucşă D, Gavăt V, Albu A. Aspects of child and youth health revealed by medical check-up in Botosani County, Romania. Rev Med Chir Soc Med Nat Iasi 2011; 115(4): 1225-30. 6. Dandona R, Dandona L. Refractive error blindness. Bull World Health Organ. 2001; 79: 237-43. 7. Doshi NR, Rodriguez MLF. Amblyopia. Am Fam Physician 2007; 75: 361-7. 8. Chang CH, Tsai RK, Sheu MM. Screening amblyopia of preschool children with uncorrected vision and stereopsis tests in Eastern Taiwan. Eye 2007; 21: 1482-8. 9. Woodruff G, Hiscox F, Thompson JR, Smith LK. Factors affecting the outcome of children treated for amblyopia. Eye 1994; 8: 627-631. 10. The Pediatric Eye Disease Investigator Group. The Clinical Profile of Moderate Amblyopia in Children Younger Than 7 Years. Arch Ophthalmol 2002; 120: 281-287. 11. Shaw DE, Fielder AR, Minshull C, Rosenthal AR. Amblyopia: factors influencing age of presentation. Lancet 1988; 2: 207-209.12. Prevalence of Refractive Errors in Primary School Children [7-15 Years] of Qazvin City. Eur J Sci Res 2009; 28: 174-185.
PREVALENTA ERORILOR DE REFRACTIE LA SCOLARII DIN MEDIUL URBAN
REZUMATScopul principal al acestui studiu a fost de a stabili prevalenta erorilor de refractie la scolarii din mediul urban din Judetul Arad. Materiale si metode: Au fost examinati 509 scolari cu varste cuprinse intre 6 si 11 ani, inscrisi in clasele elementare in 5 scoli din Arad, in perioada Septembrie-Decembrie 2011. Au fost investigati urmatorii parametri: varsta, sexul, refractia obiectiva si acuitatea vizuala. Refractia a fost determinata utilizand autorefractokeratomerul Potec 5000, pe ochiul cicloplegic, care a fost indus cu ciclo-pentolat, de 4 ori in decurs de 1 ora. Miopia a fost definita ca eroare de refractie de cel putin -1.0 SD, hypermetropia ca + 1.5 SD, iar astigmatismul ca 1.0 CD. Rezultate si discutii: Au fost determinate erori de refractie la 130 elevi, dintre care 17 au prezentat miopie, 43 hipermetropie si 70 au fost cazuri de astigmatism. 50 de scolari au fost diagnosticati de novo cu patologie refractiva. 33 de subiecti nu beneficiau de tratament corector in momentul investigatiei, indiferent de patologia determinata. Concluzii: Astigmatismul este eroarea de refractie cu cea mai crescuta prevalenta, fiind urmata de hipermetropie si miopie. Prevalenta astigmatismului a fost mai mare la scolarii de sex feminin (64.29%) comparativ cu subiectii de sex masculin (35.71%) [p < 0.001], iar prevalenta hipermetropiei a fost crescuta la elevii de sex masculin (65.12%), comparativ cu sexul feminin (34.88%) [p < 0.005]. Elevii aflati in scoala elementara reprezinta un grup cu risc inalt de a dezvolta erori de refractie. Cuvinte cheie: erori de refractie, copii, mediul urban, ambliopie, miopie, hipermetropie, astigmatism
Fiziologia - Physiology 2012.23.3 (75)34
CHANGES OF INTERLEUKIN-12 SERUM LEVELS IN PATIENTS WITH CHRONIC HEPATITIS C VIRUS INFECTION BEFORE INTERFERON ALPHA TREATMENTMANOLE COJOCARU1, SIMONA ALEXANDRA IACOB2, DORINA BANICĂ3, EUGENIA PA-NAITESCU2, DIANA GABRIELA IACOB2
1“Titu Maiorescu” University, Faculty of Medicine, Bucharest2“Carol Davila” University of Medicine and Pharmacy, Bucharest3“Marius Nasta” Institute of Pneumology, Bucharest
ABSTRACTInterleukin (IL)-12 is a cytokine secreted by antigen-presenting cells (APC) such as activated macrophages and dendritic cells (DC). IL-12 might play a crucial role in the course of HCV infection. In this study, we aimed to investigate the serum levels of IL-12 in patients with chronic hepatitis C virus (HCV) infection, its roles in the pathogenesis of chronic HCV infection and to analyze how IL-12 related to histologic findings and laboratory parameters. Serum IL-12 levels were measured by ELISA. Serum IL-12 levels of the patients with chronic HCV infection were found to be elevated when compared to those of healthy controls (274.3 pg/mL (107.5-469.7 pg/mL) vs. 43.6 pg/mL (38.3-76.2 pg/mL); p<0.001). There was significant correlation between IL-12 and ALT levels (r=0.512; p<0.001). The serum IL-12 was correlated with the histological activity score (p<0.001). In conclusion, since serum levels of IL-12 were higher in patients with chronic HCV infection, this citokine might play an important role in the inflammatory process in chronic HCV infection.Key words: interleukin-12, chronic hepatitis C virus infection
Received 1th of April 2012. Accepted 21th of May 2012. Address for correspondence: Dr. Manole Cojocaru, Titu Maiorescu University, Faculty of Medicine, Department of Physiology, Center for Rheumatic Diseases, Bucharest; Thomas Masaryk No. 5 Sector 2 Postal Code 020983, Bucharest, Romania, e-mail: [email protected]
INTRODUCTION
IL-12, a heterodimer composed of 2 subunits of p40 and p35 and secreted mainly by antigen-presenting cells (APC) such as activated macrophages and dendritic cells (DC), is a crucial mediator between innate and adaptive immune responses. IL-12 induces rapid and efficient production of IFN-γ (1,2). In addition, IL-12 correlates with virus clearance. Experimental studies have supported the role of immune response mechanisms in liver injury of HCV infections. The exact mechanism of hepatocellular damage in chronic HCV infection remains unclear (3-5).The aim of this study was to investigate the serum levels of IL-12 in chronic hepatitis C, its roles in the pathogenesis of chronic HCV infection and to analyze how IL-12 related to histological findings and laboratory parameters.
MATERIAL AND METHODS
Fifteen patients (6 male, 9 female, mean age 47.35±10.78 years) with chronic HCV infection and 14 healthy subjects (6 male, 8 female, mean age 35.00±15.45 years) were included in this study. The diagnosis of the patients with chronic HCV infection was established on the basis of clinical, laboratory, ultrasonographic and histopathology findings. The healthy subjects had negative hepatitis serology, normal liver function tests and normal ultrasonographic findings. Serum IL-12 levels were measured by ELISA. Each sample was tested in duplicate. The levels of the IL-12 were also compared with the traditional biochemical ALT and viral (HCV RNA) indicator of infection activity. Histological activity score was evaluated in the chronic
hepatitis C infected patients. The Mann-Whitney U test was used to compare IL-12 and alanine transaminase (ALT) levels between the cases and the controls. Discrete variables were evaluated with Chi-square test. Odds ratios (OR) and 95% confidence intervals (CI) were calculated for IL-12. Correlation analysis was done by the Spearman test. A value of p<0.05 was accepted as significant.The research was carried out with each patient’s informed consent and Ethics Committee approval.
RESULTS
All patients had positive HCV RNA with PCR. We found that HCV-infected patients with greater necro-inflammatory activity of liver showed greater IL-12 production. A significant increase in IL-12 production was observed only in patients with chronic hepatitis C who cleared the virus (P<0.001). The greater production of IL-12 associated with greater necro-inflammatory activity of liver in HCV infected patients. Serum IL-12 levels of the patients with chronic HCV infection were found to be elevated when compared to those of healthy controls (274.3 pg/mL (107.5-469.7 pg/mL) vs. 43.6 pg/mL (38.3-76.2 pg/mL); p<0.001). There was significant correlation between IL-12 and ALT levels (r=0.512; p<0.001). The serum IL-12 was correlated with the histologic activity score (p<0.001). There was statistically significant correlation between serum IL-12 levels and severity of necro-inflammatory changes in liver biopsy specimens (p<0.001). It may play an important role in promoting inflammatory reactions. Since serum levels of IL-12 were higher in patients with chronic HCV infection this cytokine might play an important role in the inflammatory process
2012.23.3 (75) Fiziologia - Physiology 35
in HCV infection.
DISCUSSION
Recent studies have suggested that IL-12 is one of the most important cytokines in the immune defense against intracellular pathogens. Few studies in adult patients report on the role in the course of HCV infection. Cytokines are key mediators of inflam-mation, apoptosis, necrosis and fibrosis and they are actively involved in the regeneration process of liver tissue after injury. Massive induction of the pro-inflammatory cytokines IL-12 and IFN-γ in liver specimens is apparently not counterbalanced by the anti-inflammatory cytokine IL-10. IL-12 has an important role against intracellular pathogens by promoting Th1 cell develop-ment, cell mediated cytotoxicity and IFN-γ production. Our results revealed higher values in the serum levels of IL-12 in patients with chronic HCV infection as compared to normal controls and it was correlated with the histological activity score (6-8).IL-12 stimulating NK cells activity, cytotoxic T lymphocytes prolif-eration and IFN-γ production, plays an important role in the patho-genesis of HCV infection. IL-12 is the dominant cytokine, which specifically promotes antigen-dependent Th1 cell differentiation, suppresses Th2 function and may contribute to the viral clearance. IL-12 is the dominant cytokine, which specifically promotes Th0 cell differentiation to Th1 cells, suppresses Th2, enhances IFN production and stimulates T and NK cells cytotoxicity (9).
The increase of serum IL-12 always followed the ALT flare, confirming the function of IL-12 in promoting Th1 cell develop-ment, and function of macrophage. In HCV infection massive hepatocytes are killed by macrophages. This explains why HCV infected patients with greater necro-inflammatory activity of liver showed greater IL-12 production, and why Th1 predominance in HCV infection was correlated with the direct cytotoxic effect and the inhibition of viral replication. This means that strategies to prevent macrophage influx may be beneficial to patients with hepatitis. The roles of cytokines in the liver damage are complex.
Serum IL-12 levels can inform about the inflammatory activ-ity in the liver. IL-12 serum levels seem to be reliable parameter informing about the inflammatory activity and extend of fibrosis in
the liver (10). Further research is needed to explore the aspects of this relationship.
CONCLUSION
Our results suggest that serum levels of IL-12 reflect the inflammatory activity of hepatitis. IL-12 shows correlation with biochemical and histopatological markers of hepatitis.
CONFLICT OF INTERESTThe authors have declared no conflicts of interest
REFERENCESWHO. Hepatitis C. Fact Sheet 164. 2000; http://www.who.int1. Alter MJ. Epidemiology of hepatitis C virus infection. World J Gas-troenterol. 2007; 13: 2436-41.2. Sun QL, Ran W. Review of cytokine profiles in patients with hepatitis. World J Gastroenterol. 2004; 10(12): 1709-153. Birk RW, Gratchev A, Hakly N, et al. Alternative activation of antigen-presenting cells: concepts and clinical relevance. Hautarzt 2001; 52: 193-2004. Jacobson Brown PM, Neuman MG. Immunopathogenesis of hepatitis C viral infection: Th1/Th2 responses and the role of cytokines. Clin Biochem. 2001; 34: 167-71.5. Sobue S, Nomura T, Ishikawa T. Th1/Th2 cytokine profiles and their relationship to clinical features in patients with chronic hepatitis C virus infection. J Gastroenterol. 2001; 36: 544-51.6. Liu M, Chang CW, Mcgilvray I, et al. Fulminant viral hepatitis: mo-lecular and cellular basis; a clinical implications. Expert Rev Mol Med. 2001; 28: 1-97. Viso AT R, Duarte MIS, Pagliari C, et al. Tissue and serum immune response in chronic hepatitis C with mild histological lesions. Mem Inst Oswaldo Cruz, Rio de Janeiro 2010; 105(1) 25-32.8. Schvoerer E, Navas MC, Thumann C, et al. Production of interleu-kine-18 and interleukine-12 in patients suffering from chronic hepatitis C virus infection before antiviral therapy. J Med Virol. 2003; 70: 588-93.9. Tilg H, Kaser A, Moschen AR. How to modulate inflammatory cy-tokines in liver diseases. Liver Int 2006; 26: 1029-39.
AcknowledgementThis paper was supported by CNCSIS-UEFISCSU, PNII, code 1165/2009
VARIAŢII ALE CONCENTRAŢIILOR DE INTERLEUKINĂ-12 ÎN SERUL PACIENŢILOR CU INFECŢIE CRONICĂ CU VIRUSUL HEPATITEI C ÎNAINTEA TRATAMENTULUI CU INTERFERON ALPHA
REZUMATInterleukina (IL)-12 este o citokină produsă de celulele prezentatoare de antigen (APC), precum macrofagele activate şi celulele dendritice (DC). IL-12 s-ar putea să prezinte un rol esenţial în cursul infecţiei cronice cu HCV. Obiectivele acestui studiu a fost să determinăm nivelurile de IL-12 în serul pacienţilor cu infecţie cronică cu virusul hepatitei C (HCV), importanţa acesteia în patogenia infecţiei cu HCV şi să analizăm relaţia IL-12 cu aspectele histologice şi cu unul dintre parametrii de laborator. Nivelurile de IL-12 în ser au fost determinate folosind tehnica ELISA. Nivelurile de IL-12 în serul pacienţilor cu infecţie cronică cu HCV au fost găsite crescute comparativ cu lotul martor (274,3 pg/ml (107,5-469,7 pg/ml) vs. 43,6 pg/ml (38,3-76,2 pg/ml); p<0.001). S-a observat o corelaţie semnificativă între IL-12 şi nivelurile de ALT (r=0,512; p<0,001). IL-12 s-a corelat cu scorul histologic de gravitate (p<0,001). În concluzie, deoarece nivelurile de IL-12 în ser au fost mai crescute la pacienţi cu infecţie cronică cu HCV, această citokină s-ar putea să joace un rol important în procesul inflamator în infecţia cronică cu HCV.Cuvinte cheie: interleukina-12, infecţia cronică cu virusul hepatitei C
Fiziologia - Physiology 2012.23.3 (75)36
ETIOLOGY AND PATHOPHYSIOLOGY OF SEIZURES, EPI-LEPSY AND STATUS EPILEPTICUS AFTER STROKEVINTILESCU RALUCA, BALSEANU ADRIAN, MITU CRISTINA, DINA CIPRIAN, GEORGESCU MARIUS, IANCAU MARIADepartment of Physiology, University of Medicine and Pharmacy of Craiova, Faculty of Medicine
ABSTRACTOver the age of 60, acute seizures, epilepsy and status epilepticus have the highest incidences. The primary etiological factor for the new onset seizures is the cerebrovascular disease. The cerebrovascular etiologies include cerebral infarction, cerebrovascular atherosclerosis, and cerebral hemorrhage. Cerebral infarction is the most frequent - 30%; it increases the risk of late-onset seizures 23 times. Epileptic seizures can be early and late-onset. This division is important, because the pathophysiology and prognosis of both are different. Early-onset seizures appear one or two weeks after stroke, but most of them occur after 24 hours. Late post-stroke seizures occur within several months to years after the injury. The development of epilepsy is accompanied by excessive glutamatergic activity and damage in the balance between glutamatergic and GABA-ergig synaptic transmission. Some of the risk factors of post-stroke seizures: ischemic stroke subtype, stroke location and stroke severity. Cortical location is associated with early-onset seizures after ischemic stroke. Stroke severity determines the outcome in stroke patients. The treatment of epileptic seizures depends on the clinical context.Keywords: epilepsy, stroke, risk factors
Received 10th of April 2012. Accepted 25th of May 2012. Address for correspondence: Balseanu Tudor-Adrian, MD, PhD, Department of Physiology, Faculty of Medi-cine, University of Medicine and Pharmacy of Craiova 2-4 Petru Rares Street, RO-200349 Craiova, Romania, Phone: +40 741015387, e-mail: [email protected], [email protected]
INTRODUCTIONCerebrovascular complications are a risk factor in the
development of seizures and epilepsy (1-4). Seizures may oc-cur in 2-20% of all patients with stroke (1-5). Two unprovoked seizures, separated 24 hours apart, are required to diagnose epilepsy. The latest definition of epilepsy shows that a single epileptic seizure is enough as long as there is a predisposition to generate epileptic seizures (6).
Epilepsy is expressed by recurrent, unprovoked, epileptic seizures, and by the cognitive, psycho-social and social conse-quences of this condition (7,8). It is very important to make a clini-cal distinction between provoked and unprovoked etiologies for seizures. Cardiac failure, vasovagal syncope, different metabolic conditions, different medications, alcohol and drug use are the causes of provoked etiologies. This category also includes acute head injuries or acute cerebrovascular events (9).
Etiologically, epilepsies are divided into three categories: idiopathic, symptomatic, and presumed symptomatic. Idiopathic epilepsies may have genetic causes, leading to the alteration of basic neuronal regulation. Symptomatic epilepsies are caused by the effects of an epileptic lesion, which can be focal (a tumor), or a metabolic defect, giving rise to widespread injury to the brain. Cryptogenic epilepsies imply a lesion that is difficult or impos-sible to discover during evaluation. In approximately 60% of all epilepsies the etiology is unknown. When the etiology is known, they include traumatic brain injury, ischemic stroke, intra-cerebral hemorrhage, infections, tumors, cortical dysplasia, several neu-rodegenerative diseases, or acute symptomatic seizures such as febrile seizures or status epilepticus (10).
Epidemiology and etiology of epilepsy in the elderly
Over the age of 60, acute seizures, epilepsy and status epilepticus have the highest incidences (11-14). The primary etiological factor for the new onset seizures is the cerebrovas-cular disease. The cerebrovascular etiologies include cerebral infarction, cerebrovascular atherosclerosis and cerebral hemorrhage. Cerebral infarction is the most frequent - 30%; it increases the risk of late-onset seizures 23 times (15). Other etiological factors of epilepsy in the elderly include brain tumor, toxic and metabolic abnormalities, neurodegenerative and (15) neuropsychiatric disorders. Dementia is an important cause for developing seizures. Alzheimer’s disease has a higher rate of epilepsy. The explanation for the higher rate of epilepsy in Al-zheimer’s disease may be the accumulation of amyloid plaques and neurofibirillary tangles and focal areas of disproportionate neuronal degeneration. After an ischemic stroke, patients often express delayed epileptic seizures. Epileptic seizures can be early and late-onset (16).
Early-onset seizures appear one or two weeks after stroke, but most of them occur after 24 hours. Late post-stroke seizures occur within several months to years after the injury. This divi-sion is important, because the pathophysiology and prognosis of both are different.
A large number of patients with early seizures do not de-velop late seizures or recurrent epilepsy, only about one third of them will develop these types of complications. The risk of subsequent epilepsy is much higher if a late seizure occurs (17).
2012.23.3 (75) Fiziologia - Physiology 37
Patients with ischemic stroke onset between 15 and 45 years develop seizures in the first year after the stroke (18).
Status epilepticus is characterized by recurrent epileptic seizures lasting hours-to-days, without return to baseline mental status between seizures. Status epilepticus can have convulsive or non-convulsive forms. In elderly patients status epilepticus has significant morbidity and mortality (19). Status epilepticus may be a symptom of acute stroke, about 24.8% (20). Non convulsive status is associated with early-onset post-stroke seizure patients (85%) and convulsive status (50%) is associated with late-onset group. The early onset status epilepticus has a higher mortality rate than the late onset status-epilepticus (21).
Pathophysiology of seizures
Some features of symptomatic epilepsy include the distinc-tion between early and late seizures, the latent period, the clinical phenomenology and response to treatment and the risk factors. The epilepsy is a pathological reaction of brain tissue to insult. Homeostatic or systemic disturbances are the causes of early seizures. For example, hyperglycemia at the time of ischemia enhances the risk for seizures (17).
Late-onset seizures may be caused by gliosis, the oc-currence of a meningocerebral cicatrix, selective neuronal cell death and apoptosis, changes in membrane properties, mitochondrial changes, receptor changes, deafferentation and collateral sprouting (22).
The brain depends on its blood flow which is a supply of oxygen and glucose. Ischemia induces a delayed selective dam-age of CA1 pyramidal neurons in the hippocampus, while CA3 and dentate gyrus neurons are resistant (23).
After acute ischemia, extracellular concentrations of glutamate are increased. The glutamate is an excitatory neu-rotransmitter, associated with secondary neuronal injury (24). The initial pathological and pathophysiological damage is influ-enced by excessive glutamatergic activity. There is no seizure activity after this initial damage, however pathophysiological and structural alterations occur in key brain regions, which culminate in the expression of epilepsy. Epileptogenesis is the process by which injured neuron surviving the acute insult together with well-preserved neurons form epileptic neuronal networks (25).
Overstimulation of glutamate receptors determines gluta-mate excitotoxicity. Excessive neuronal depolarization is followed by an increase in free intracellular calcium, entering through volt-age gated calcium channels and glutamate receptor/channels. Neuronal dysfunction and alteration in morphology/structure or death are determined by activation of the calcium-dependent signaling pathways (26, 27). An acute increased extracellular glutamate concentration, N-methyl-D-aspartate (NMDA) recep-tors and calcium-dependent mechanisms lead to neuronal cell death (28).
The development of epilepsy is accompanied by excessive glutamatergic activity and damage in the balance between glu-tamatergic and GABAergig synaptic transmission (29, 30). This imbalance may be followed by molecular and/or functional altera-
tion in glutamatergic transmission. The damage in the GABAergic system indirectly increases glutamatergic transmission (25).
An ischemic insult also affects GABAergic inhibitory trans-mission, in the area adjacent to cortical lesions and in remote brain regions. An important reduction in the number GABAergic interneurons is caused by global ischemia in the CA3 area of hip-pocampus. GABAergic cells form a population of neurons which are divided into two classes according to their axonal projection: somatic and dendritic targeting interneurons. They play different roles in the hippocampus. In the hippocampus there are two main kinetic classes of GABAA synaptic responses. GABA A fast synaptic events are mediated by somatic and proximal dendritic synapses and GABA A slow synaptic events are mediated by dendritic synapses (31, 32). There are three types of GABA receptors, GABAA, GABAB and GABAC. GABAA and GABAC are ionotropic receptors, which consist of membrane channels, whose opening permits the passage of Cl ¯ and HCO3¯. GA-BAB receptors are located pre- and post-synaptic, and they are coupled to G-proteins (33).
GABA A receptors consists of the following subunits: α, β, γ, and δ. A subunit subtype is important, because it confers dif-ferent pharmacological and physiological properties to receptor isoforms. α2, α3, and/ or α5 subunits are diminished during development, unlike the α1 subunit, which is up-regulated and is dominant during adulthood. The α1 subunit has an important decrease in the visual cortex one week after the injury. On the contrary, an important up-regulation of the α3 subunit occurs in the contra lateral cortex one month after the ischemia (34-37).
Epileptic activity can be suppressed by the GABAergic system. Epileptiform discharges are produced by the reduction or blockade of inhibitory transmission and, if repeated, it may cause epileptogenesis. Epileptogenesis can be prevented or delayed by enhancing GABAergic inhibition (25).
Studies suggest that in humans idiopathic epilepsies are connected with mutations at the GABAA receptor level (X H) (38).
The mechanism by which epileptogenesis is induced in the amygdale is the excessive activation of glutamate receptors. It is not yet clear which of the glutamate receptor subtypes should be activated for epileptogenesis. There are three types of glutamate receptors: AMPA receptor, NMDA receptor and kainat receptor (39).
Out of these receptors, NMDA receptors play an important role in inducing epileptogenesis in the amygdale, as in other brain regions (25).
Several months after stroke, functional map reorganization has been observed, leading to a partial recovery of function in the visual cortex. The consequence of this phenomenon is that the neurons that survive the injury suffer delayed morphologi-cal changes in the level of expression of proteins involved in dendritic and axonal plasticity (MAP-2, GAP 43) (40). Sev-eral months after global ischemia, there is a shift of the resting membrane potential of CA3 pyramidal neurons toward positive values. The regulation of the cell excitability depends on the Na+/K+-ATPase. Several weeks after ischemia of the CA3 pyramidal cells, a decrease of the Na+/K+-ATPase has been noticed (23).
Fiziologia - Physiology 2012.23.3 (75)38
Ischemia, besides producing neuronal degeneration leading to the damage of brain function, may also lead to important network recovery (23).
Environmental and pathological conditions can affect the rate of cell proliferation, migration and differentiation and this affects the neurogenesis. Seizures are the most common pathological conditions which have an important influence on neurogenesis (41).
Neurogenesis
Neurogenesis is the development of new functioning neu-rons, in the adult brain. The dentate gyrus of the hippocampus and the subventricular zone of the lateral ventricles are the two major neurogenic regions in the brain (42-46). A stimulation of forebrain subventricular zone cell proliferation and neurogenesis has been noticed after focal ischemia (47). The first studies showed that the increase in subventricular zone neurogenesis after stroke is transient, but later studies demonstrate that it persists for four months after ischemia (48-50).
The subventricular zone neuroblasts usually migrate to the olfactory bulb, via chain-like formations, in the rostral migratory stream. However, a large part of them migrate in chains toward the ischemic striatum after focal ischemia. Because of this redirected migration, fewer neuroblasts reach the ipsilateral bulb. The matrix metalloproteases and chemokine / chemokine receptor interaction are the molecular factors that induce this ectopic migration to peri-infarct regions. This migration, of subventricular zone neuroblast to the injured striatum lasts for up to a year after ischemia (51-55).
Seizures increase dentate granule cell neurogenesis and it contributes to aberrant network reorganization in the adult rat hippocampus (56). Dentate granule cells, generated after seizure activity, begin sending axons aberrantly into the dentate inner mo-lecular layer, by day 24 after stimulation (57-59). The population of newly generated migratory neurons in the subgranular zone of the dentate gyrus is enlarged by the periodic stimulation of the brain by seizure-evoking pharmacological manipulations, performed within the developmental range of hippocampus neurogenesis. These neurons can contribute to the formation of new, recurrent excitatory circuits within the hippocampus formation (60).
Risk factors of post-stroke seizures
Some of the risk factors of post-stroke seizures: ischemic stroke subtype, stroke location and stroke severity (24). Hyper-tension raised serum cholesterol and left ventricular hypertrophy lead to the development of seizures or epilepsy, even if there is no overt stroke (17).Stroke subtype
Early-onset seizuresThe frequency of early-onset seizures is higher in case of
hemorrhagic strokes (3-19%), cerebral vein thrombosis (12-34%) or subarachnoid hemorrhage (4-18%) than in case of ischemic stroke (61). Partial seizures with or without secondary generaliza-
tion are frequent in cerebral vein thrombosis (61).
Late-onset seizuresThe frequency of late-onset seizures is in case of hem-
orrhagic strokes 2.6-6%, cerebral vein thrombosis 5-26.6%, subarachnoid hemorrhage 7-9% and in case of ischemic stroke 2-4% (61).
Seizures are more common with cardioembolic infarction than other types of ischemic stroke (24). O possible explanation of seizures after cardioembolic stroke, induced by cortical emboli, is the depolarization within an ischemic penumbra, reperfusion after the fragmentation and distal migration of the embolus, or a combination of these two factors (62).
The risk of seizures is increased by hemorrhagic transforma-tion of ischemic lesions. The hemorrhagic transformation can be an independent factor for seizures, in patients with first stroke (17). The excitability of the cortical ischemic penumbra tissue could be increased the presence of hemorrhagic transformation in cortical regions, where it is associated with edema. The brain excitability in the presence of hemorrhagic transformation may be an inde-pendent predictor of status epilepticus in acute ischemic stroke. Middle cerebral artery aneurysms, intra-parenchyma hematoma, cerebral infarction, hypertension and thickness of the cistern clot are risk factor for seizures after subarachnoid hemorrhage (62).
Stroke location
Early-onset seizuresCortical location is associated with early-onset seizures
after ischemic stroke (24). Hemispheric subcortical lesions, determined by small vessel disease, induce seizures with a fre-quency between 0-3.5%, but this mechanism in not understood (62). Lobar site is the most epileptogenic location in intracerebral hemorrhage (62). Seizures are predicted by caudate, temporal or parietal involvement within the cortex (62). The risk factors of early-onset seizures after cerebral vein thrombosis are the existence of the focal deficits,the cortical vein thrombosis and parenchyma lesions (61).
Late-onset seizuresCortical location is associated with late-onset seizures after
ischemic stroke (61).
Stroke severity and size of infarct
The stroke severity is predictive of seizures independently of the ischemic lesion. There is a relation between the risk of seizures and the size of the infarct (17). Stroke severity and size of infarct are related to status epilepticus (62). Stroke severity determines the outcome in stroke patients. Increased in hospital mortality is caused by early post-ischemic seizures.
Seizure type in post-stroke epilepsy
All types of partial seizures can be observed. Early–on-
2012.23.3 (75) Fiziologia - Physiology 39
set seizures are most often simple partial (without impaired consciousness), with motor symptoms or complex partial (with impaired consciousness). They can be partial evolving into secondary generalized seizures. Stroke represents one of the most important causes of status epilepticus in adults (22-32%) Status epilepticus doesn’t seem to be influenced by the stroke type, ischemic or hemorrhagic, but it would be more frequent in case of severe stroke (61).
Treatment The treatment of epileptic seizures depends on the clinical
context. Status epilepticus requires urgent intravenous therapy. Early seizures did not require long-term antiepileptic therapy to prevent recurrence, but they require short-term antiepileptic drug treatment. Oral antiepileptic drug therapy is required in late-onset seizures.
t-PA is contraindicated to patients with seizures. Long-term anticoagulant therapy can’t be given to patients experiencing seizures with falls. In renal or hepatic impairment patients, anti-epileptic drugs should be use prudently and the dosage needs to be modified (17).
REFERENCES1. Myint PK, Staufenberg EF, Sabanathan K. Post-stroke seizure and post-stroke epilepsy. Postgrad Med J 2006; 82: 568-572.2. Silverman IE, Restrepo L, Mathews GC. Poststroke seizures. Arch Neurol 2002; 59: 195-201. 3. Hauser WA, Annegers JF, Kurland LT. Incidence of epilepsy and unprovoked seizures in Rochester, Minnesota: 1935-1984. Epilepsia 1993; 34: 453-468.4. Hauser WA, Annegers JF, Kurland LT. Prevalence of epilepsy in Rochester, Minnesota: 1940-1980. Epilepsia 1991; 32: 429-445.5. Burneo JG. Revisiting the well-established subject of stroke and epilepsy. Epilepsy Curr 2007; 7: 42-44.6. Fisher RS, van Emde Boas W, Blume W, et al. Epileptic seizures and epilepsy: definitions proposed by the International League Against Epilepsy (ILAE) and the International Bureau for Epilepsy (IBE). Epi-lepsia, 46: 470-472.7. Chang BS, Lowenstein DH. Epilepsy. N Engl J Med 2003; 349:1257-1266.8. Engel JJ and Pedley TA Epilepsy: A Comprehensive Textbook 2008; Lippincott Williams & Wilkins, Philadelphia9. Banerjee PN, Filippi D, and Allen Hauser W The descriptive epidemiol-ogy of epilepsy-a review. Epilepsy Res 2009; 85: 31-45.10. Hauser WA, Annegers JF, Kuland LT. Incidence of epilepsy and unprovoked seizures in Rochester, Minnesota 1935-1984. Epilepsia, 1993; 34: 453-468.11. Annegers JF, Hauser WA, Lee JR, et al. Incidence of acute symptomatic seizures in Rochester, Minnesota, 1935-1984. Epilepsia, 1995; 36: 327-333.12. DeLorenzo RJ, Hauser WA, Towne AR, et al. A prospective, population-based epidemiologic study of status epilepticus in Richmond, Virginia. Neurology 1996; 46: 1029-35.13. Cloyd J, Hauser V, Towne A, Ramsay R, et al. Epidemiological and medical aspects of epilepsy in the elderly. Epilepsy Research 2006; 68: S39-48.14. Rowan AJ, Ramsay RE, Collins JF et al. VA Cooperative Study 428 Group New onset geriatric epilepsy: a randomized study of gabapentin,
lamotrigine, and carbamazepine. Neurology, 2005; 64: 1868. 15. Varelas PN, Mirski MA. Seizures in the adult intensive care unit. J Neurosurg Anesthesiol 2001; 13:163-75.16. Menon B, Shorvon S. Epilepsy Research 2009; 87: 1-11.17. Naess H, Nyland HI, Thomassen L, et al. Long-term outcome of cer-ebral infarction in young adults. Acta Neurol. Scand. 2004; 110: 107-112.18. Cloyd J, Hauser W, Towne A, et al. Epidemiological and medical aspects of epilepsy in the elderly. Epilepsy Research 2006; 68: S39-48.19. DeLorenzo RJ, Hauser WA, Towne AR, et al. A prospective, population-based epidemiologic study of status epilepticus in Richmond, Virginia. Neurology 1996: 46; 1029-35.20. Nazire, Afsar, Dilaver, et al. Stroke and status epilepticus: stroke type, type of status epilepticus and prognosis. Seizure 2003; 12: 23-27.21. Jennett B. Posttraumatic epilepsy. Adv Neurol. 1979; 22:137-147.22. Epsztein J, Ben-Ari Y, Represa A, at al. Late-onset epileptogen-esis and seizure genesis: lessons from models of cerebral ischemia. Neuroscientist 2008; 14(1): 78-90. 23. Camilo O, Goldstein L. Seizures and Epilepsy after ischemic stroke. Stroke 2004; 35: 1769-75.24. Aroniadou-Anderjaska V, Fritsch B, Qashu F, et al. Pathology and pathophysiology of the amygdale in epilepstogenesis and epilepsy. Epilepsy Research 2008; 78 (2-3): 102-116.25. DeLorenzo RJ, Sun DA, Deshpande LS. Cellular mechanisms underlying acquired epilepsy: the calcium hypothesis of the induction and maintenance of epilepsy. Pharmacol Ther 2006; 111:288-325.26. McNamara JO, Huang YZ, Leonard AS. Molecular signalling mechanisms underlying epileptogenesis. Sci STKE 2006; 12.27. Krantic S, Mechawar N, Reix S, et al. Molecular basis of pro-grammed cell death involved in neurodegeneration. Trends Neurosci 2005; 28: 670-6.28. Bernard C. Dogma and dreams: experimental lessons for epilepsy mechanism chasers. Cell Mol. Life Sci 2005; 62: 1177-81.29. El-Hassar L, Milh M, Wendling F, et al. Cell domain-dependent changes in the glutamatergic and GABAergic drives during epileptogen-esis in the rat CA1 region. J. Physiol 2007; 578: 193-211.30. Freund TF, Buzsaki G. Interneurons of the hippocampus. Hip-pocampus 1996; 6: 347-470.31. Banks MI, White JA, Pearce RA. Interactions between distinct GABA(A) circuits in hippocampus. Neuron 2000; 25: 449-457.32. Panayiotopoulus CP. Atlas of Epilepsies 2007; 186.33. Taketo M, Yoshioka T. Developmental change of GABA(A) receptor-mediated current in rat hippocampus. Neuroscience 2000; 96: 507-14.34. Heinen K, Bosman LW, Spijker S, et al. GABAA receptor matura-tion in relation to eye opening in the rat visual cortex. Neuroscience 2004; 124:161-71.35. Laurie DJ, Wisden W, Seeburg PH. The distribution of thirteen GABAA receptor subunit mRNAs in the rat brain: III. Embryonic and postnatal development. J Neurosci 1992; 12: 4151-172.36. Pirker S, Schwarzer C, Wieselthaler A, Sieghart W, Sperk G. GABA(A) receptors: immunocytochemical distribution of 13 subunits in the adult rat brain. Neuroscience 2000; 101: 815-850.37. Lerche H, Weber YG, Jurkat-Rott K, et al. Ion channel defects in idiopathic epilepsies. Curr.Pharm. Des 2005; 11: 2737-52. 38. Kahle W, Frotscher M. Color atlas of human anatomy: Nervous system and sensory organs 2010.39. Zepeda A, Sengpiel F, Guagnelli MA, et al. Functional reorganization of visual cortex maps after ischemic lesions is accompanied by changes in expression of cytoskeletal proteins and NMDA and GABA(A) receptor subunits. J Neurosci 2004; 24: 1812-21.40. Eriksson PS, Perfilieva E, Bjork-Eriksson T, et al. Neurogenesis in the adult human hippocampus. Nat Med, 1998; 4: 1313-17.
Fiziologia - Physiology 2012.23.3 (75)40
41. Kaplan MS, Bell DH. Mitotic neuroblasts in the 9-dayold and 11-month-old rodent hippocampus. J Neurosci, 1984; 4: 1429-41.42. Luskin MB. Restricted proliferation and migration of postnatal generated neurons derived from the forebrain subventricular zone. Neuron, 1993; 11: 173-189.43. Doetsch F, Garcia-Verdugo JM, Alvarez-Buylla A. Cellular composi-tion and three-dimensional organization of the subventricular germinal zone in the adult mammalian brain. J Neurosci, 1997; 17: 5046-61.44. Luskin MB, Mc Dermott K. Divergent lineages for oligodendrocytes and astrocytes originating in the neonatal forebrain subventricular zone. Glia, 1994; 11: 211-226.45. Morschead CM, Reynolds BA, Craig CG, et al. Neural stem cells in the adult mammalian forebrain: a relatively quiescent subpopulation of subependymal cells. Neuron, 1994; 13: 1071-82.46. Arvidsson A, et al. Neuronal replacement from endogenous precur-sors in the adult brain after stroke. Nat Med 2002; 8: 963-970.47. Parent JM, et al. Rat forebrain neurogenesis and striatal neuron replacement after focal stroke. Ann Neurol 2002; 52: 802-813.48. Thored P, et al. Persistent production of neurons from adult brain stem cells during recovery after stroke. Stem Cells 2006; 24: 739-747.49. Yamashita T, et al. Subventricular zone-derived neuroblasts migrate and differentiate into mature neurons in the post-stroke adult striatum. J Neurosci 2006; 26: 6627-36.50. Lee SR, et al. Involvement of matrix metalloproteinase in neuroblast cell migration from the subventricular zone after stroke. J Neurosci 2006; 26: 3491-95.51. Liu XS, et al. Angiopoietin 2 mediates the differentiation and migra-tion of neural progenitor cells in the subventricular zone after stroke. J
Biol Chem 2009; 284: 22680-9.52. Ohab JJ, et al. A neurovascular niche for neurogenesis after stroke. J Neurosci 2006; 26: 13007-16.53. Robin AM, et al. Stromal cell-derived factor 1alpha mediates neural progenitor cell motility after focal cerebral ischemia. J Cereb Blood Flow Metab 2006; 26: 125-134.54. Yan YP, et al. Monocyte chemo attractant protein-1 plays a critical role in neuroblast migration after focal cerebral ischemia. J Cereb Blood Flow Metab 2007; 27: 1213-24.55. Parent JM, Yu TW, Leibowitz RT, et al. Dentate granule cell neuro-genesis is increased by seizures and contributes to aberrant network reorganization in the adult rat hippocampus. J. Neurosci. 1997; 17: 3727-38.56. Espósito MS, Piatti VC, Laplagne DA, et al. Neuronal differentia-tion in the adult hippocampus recapitulates embryonic development. J Neurosci. 2005; 25(44): 10074-86.57. Zhao C, Teng EM, Summers RG, et al. Distinct morphological stages of dentate granule neuron maturation in the adult mouse hippocampus. J. Neurosci. 2006; 26: 3-11.58. Kron MM, Zhang H, Parent JM. The developmental stage of dentate granule cells dictates their contribution to seizure-induced plasticity. J Neurosci. 2010; 30(6): 2051-59.59. Buckmaster PS, Zhang GF, Yamawaki R. Axon sprouting in a model of temporal lobe epilepsy creates a predominantly excitatory feedback circuit. J. Neurosci. 2002; 22: 6650-58.60. Leger JM, Mas J. Accidents vasculaires cerebraux 2009, 1071-1085.61. Silverman I, Restrepo L, Gregory C. Post stroke seizures. Arch. Neurol. 2002; 59: 195-201.
EPILEPSIA POST ACCIDENT VASCULAR CEREBRAL
REZUMATCrizele epileptice, epilepsia și statusul epileptic au o incidență crescută la pacienții cu vârsta peste 60 ani. Principalul factor etiologic pentru apariția crizelor epileptice este reprezentat de bolile cerebrovasculare. Etiologia bolilor cerebrovasculare include infarctul cerebral, ateroscleoroza cerebrală și hemoragia cerebrală. Infarctul cerebral este cel mai frecvent – 30% și crește riscul de apariție al crizelor epileptice de 23 de ori. Crizele epileptice pot apare precoce sau tardiv, această clasificare este importantă deoarece fiziopa-tologia și prognosticul este diferit.Crizele epileptice precoce apar în prima sau a doua săptămână post accident vascular cerebral, iar cele tardive pot apare după luni sau ani post accident vascular cerebral. Epilepsia se însoțește de o activitate glutamatergică excesivă și un dezechilibru al transmisiei sinaptice glutamatergice și GABAergice. Apariția crizelor epileptice post accident vascular cerebral ischemic depinde de subtipul, localizarea și severitatea accidentului vascular. Localizarea corticală se asociază cu apariția crizelor epileptice precoce. Severitatea accidentului vascular ischemic determină recuperarea pacințior. Tratamentul crizelor epileptice depinde de contextul clinic. Cuvinte cheie: epilepsia, accidentul vascular cerebral, factori de risc
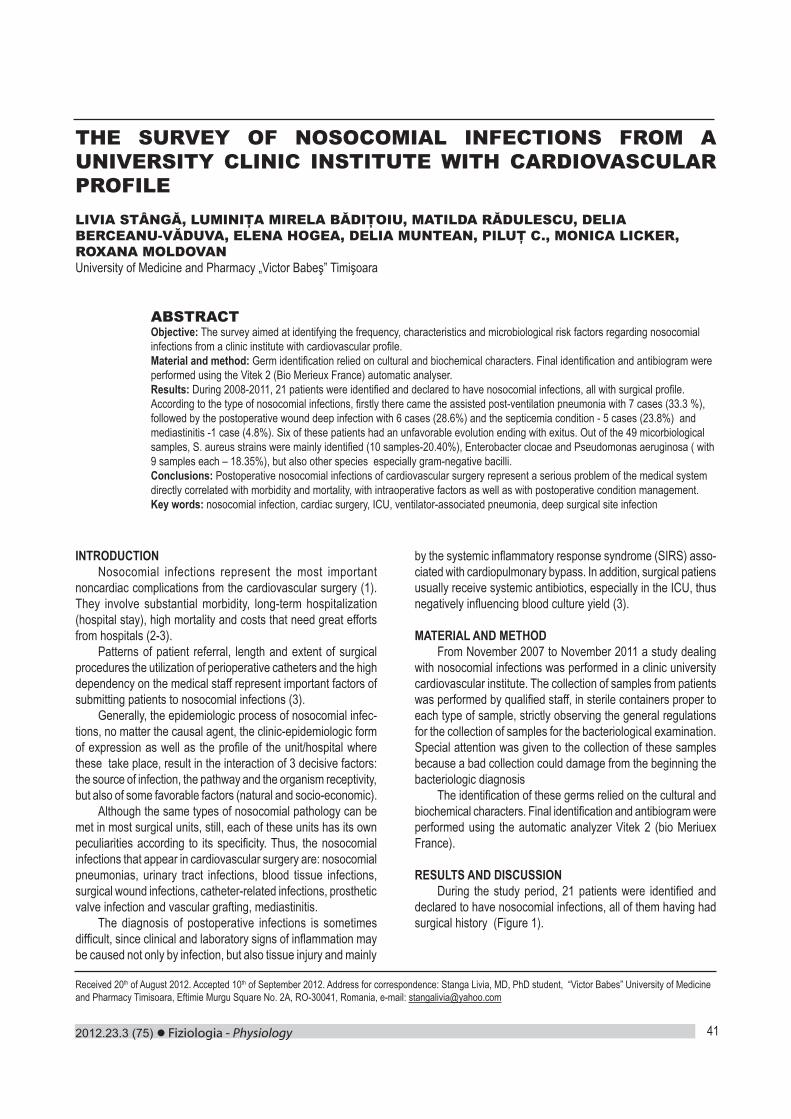
2012.23.3 (75) Fiziologia - Physiology 41
THE SURVEY OF NOSOCOMIAL INFECTIONS FROM A UNIVERSITY CLINIC INSTITUTE WITH CARDIOVASCULAR PROFILELIVIA STÂNGĂ, LUMINIŢA MIRELA BĂDIŢOIU, MATILDA RĂDULESCU, DELIA BERCEANU-VĂDUVA, ELENA HOGEA, DELIA MUNTEAN, PILUŢ C., MONICA LICKER, ROXANA MOLDOVANUniversity of Medicine and Pharmacy „Victor Babeş” Timişoara
ABSTRACTObjective: The survey aimed at identifying the frequency, characteristics and microbiological risk factors regarding nosocomial infections from a clinic institute with cardiovascular profile. Material and method: Germ identification relied on cultural and biochemical characters. Final identification and antibiogram were performed using the Vitek 2 (Bio Merieux France) automatic analyser. Results: During 2008-2011, 21 patients were identified and declared to have nosocomial infections, all with surgical profile. According to the type of nosocomial infections, firstly there came the assisted post-ventilation pneumonia with 7 cases (33.3 %), followed by the postoperative wound deep infection with 6 cases (28.6%) and the septicemia condition - 5 cases (23.8%) and mediastinitis -1 case (4.8%). Six of these patients had an unfavorable evolution ending with exitus. Out of the 49 micorbiological samples, S. aureus strains were mainly identified (10 samples-20.40%), Enterobacter clocae and Pseudomonas aeruginosa ( with 9 samples each – 18.35%), but also other species especially gram-negative bacilli. Conclusions: Postoperative nosocomial infections of cardiovascular surgery represent a serious problem of the medical system directly correlated with morbidity and mortality, with intraoperative factors as well as with postoperative condition management.Key words: nosocomial infection, cardiac surgery, ICU, ventilator-associated pneumonia, deep surgical site infection
Received 20th of August 2012. Accepted 10th of September 2012. Address for correspondence: Stanga Livia, MD, PhD student, “Victor Babes” University of Medicine and Pharmacy Timisoara, Eftimie Murgu Square No. 2A, RO-30041, Romania, e-mail: [email protected]
INTRODUCTIONNosocomial infections represent the most important
noncardiac complications from the cardiovascular surgery (1). They involve substantial morbidity, long-term hospitalization (hospital stay), high mortality and costs that need great efforts from hospitals (2-3).
Patterns of patient referral, length and extent of surgical procedures the utilization of perioperative catheters and the high dependency on the medical staff represent important factors of submitting patients to nosocomial infections (3).
Generally, the epidemiologic process of nosocomial infec-tions, no matter the causal agent, the clinic-epidemiologic form of expression as well as the profile of the unit/hospital where these take place, result in the interaction of 3 decisive factors: the source of infection, the pathway and the organism receptivity, but also of some favorable factors (natural and socio-economic).
Although the same types of nosocomial pathology can be met in most surgical units, still, each of these units has its own peculiarities according to its specificity. Thus, the nosocomial infections that appear in cardiovascular surgery are: nosocomial pneumonias, urinary tract infections, blood tissue infections, surgical wound infections, catheter-related infections, prosthetic valve infection and vascular grafting, mediastinitis.
The diagnosis of postoperative infections is sometimes difficult, since clinical and laboratory signs of inflammation may be caused not only by infection, but also tissue injury and mainly
by the systemic inflammatory response syndrome (SIRS) asso-ciated with cardiopulmonary bypass. In addition, surgical patiens usually receive systemic antibiotics, especially in the ICU, thus negatively influencing blood culture yield (3).
MATERIAL AND METHODFrom November 2007 to November 2011 a study dealing
with nosocomial infections was performed in a clinic university cardiovascular institute. The collection of samples from patients was performed by qualified staff, in sterile containers proper to each type of sample, strictly observing the general regulations for the collection of samples for the bacteriological examination. Special attention was given to the collection of these samples because a bad collection could damage from the beginning the bacteriologic diagnosis
The identification of these germs relied on the cultural and biochemical characters. Final identification and antibiogram were performed using the automatic analyzer Vitek 2 (bio Meriuex France).
RESULTS AND DISCUSSIONDuring the study period, 21 patients were identified and
declared to have nosocomial infections, all of them having had surgical history (Figure 1).
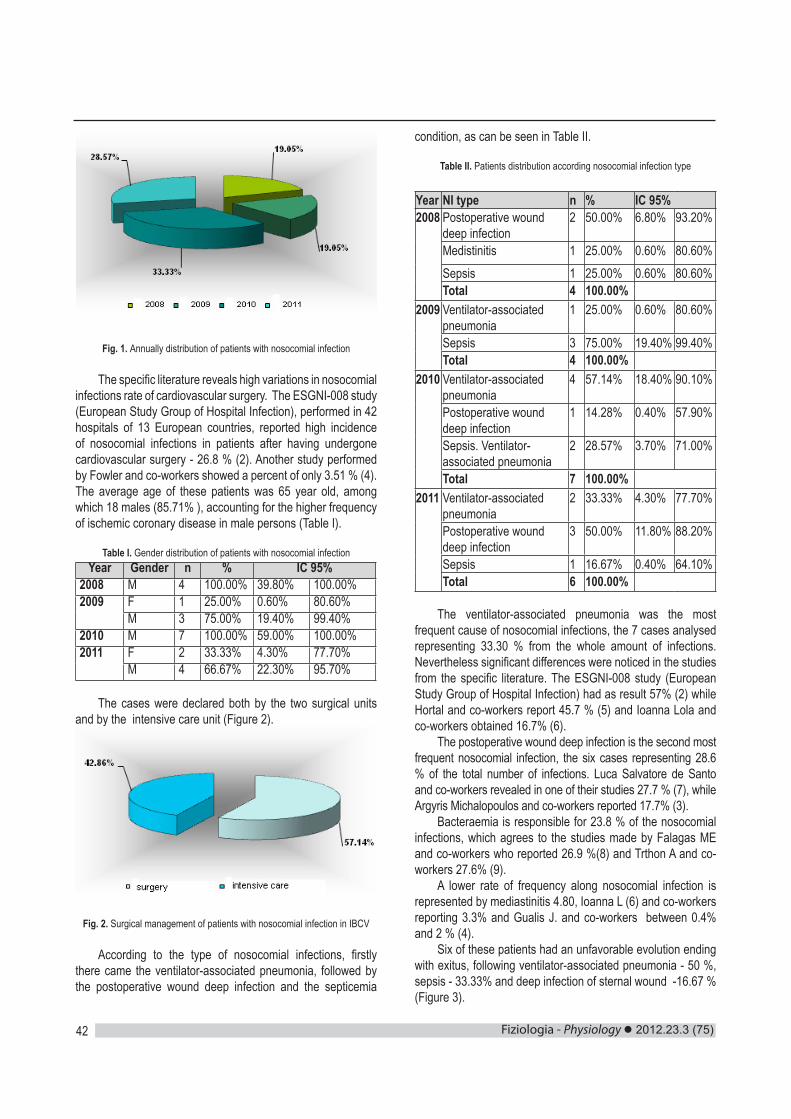
Fiziologia - Physiology 2012.23.3 (75)42
Fig. 1. Annually distribution of patients with nosocomial infection
The specific literature reveals high variations in nosocomial infections rate of cardiovascular surgery. The ESGNI-008 study (European Study Group of Hospital Infection), performed in 42 hospitals of 13 European countries, reported high incidence of nosocomial infections in patients after having undergone cardiovascular surgery - 26.8 % (2). Another study performed by Fowler and co-workers showed a percent of only 3.51 % (4).The average age of these patients was 65 year old, among which 18 males (85.71% ), accounting for the higher frequency of ischemic coronary disease in male persons (Table I).
Table I. Gender distribution of patients with nosocomial infectionYear Gender n % IC 95%
2008 M 4 100.00% 39.80% 100.00%2009
F 1 25.00% 0.60% 80.60%M 3 75.00% 19.40% 99.40%
2010 M 7 100.00% 59.00% 100.00%2011
F 2 33.33% 4.30% 77.70%M 4 66.67% 22.30% 95.70%
The cases were declared both by the two surgical units and by the intensive care unit (Figure 2).
Fig. 2. Surgical management of patients with nosocomial infection in IBCV
According to the type of nosocomial infections, firstly there came the ventilator-associated pneumonia, followed by the postoperative wound deep infection and the septicemia
condition, as can be seen in Table II.
Table II. Patients distribution according nosocomial infection type
Year NI type n % IC 95%2008
Postoperative wound deep infection
2 50.00% 6.80% 93.20%
Medistinitis 1 25.00% 0.60% 80.60%Sepsis 1 25.00% 0.60% 80.60%Total 4 100.00%
2009
Ventilator-associated pneumonia
1 25.00% 0.60% 80.60%
Sepsis 3 75.00% 19.40% 99.40%Total 4 100.00%
2010
Ventilator-associated pneumonia
4 57.14% 18.40% 90.10%
Postoperative wound deep infection
1 14.28% 0.40% 57.90%
Sepsis. Ventilator-associated pneumonia
2 28.57% 3.70% 71.00%
Total 7 100.00%2011
Ventilator-associated pneumonia
2 33.33% 4.30% 77.70%
Postoperative wound deep infection
3 50.00% 11.80% 88.20%
Sepsis 1 16.67% 0.40% 64.10%Total 6 100.00%
The ventilator-associated pneumonia was the most frequent cause of nosocomial infections, the 7 cases analysed representing 33.30 % from the whole amount of infections. Nevertheless significant differences were noticed in the studies from the specific literature. The ESGNI-008 study (European Study Group of Hospital Infection) had as result 57% (2) while Hortal and co-workers report 45.7 % (5) and Ioanna Lola and co-workers obtained 16.7% (6).
The postoperative wound deep infection is the second most frequent nosocomial infection, the six cases representing 28.6 % of the total number of infections. Luca Salvatore de Santo and co-workers revealed in one of their studies 27.7 % (7), while Argyris Michalopoulos and co-workers reported 17.7% (3).
Bacteraemia is responsible for 23.8 % of the nosocomial infections, which agrees to the studies made by Falagas ME and co-workers who reported 26.9 %(8) and Trthon A and co-workers 27.6% (9).
A lower rate of frequency along nosocomial infection is represented by mediastinitis 4.80, Ioanna L (6) and co-workers reporting 3.3% and Gualis J. and co-workers between 0.4% and 2 % (4).
Six of these patients had an unfavorable evolution ending with exitus, following ventilator-associated pneumonia - 50 %, sepsis - 33.33% and deep infection of sternal wound -16.67 % (Figure 3).
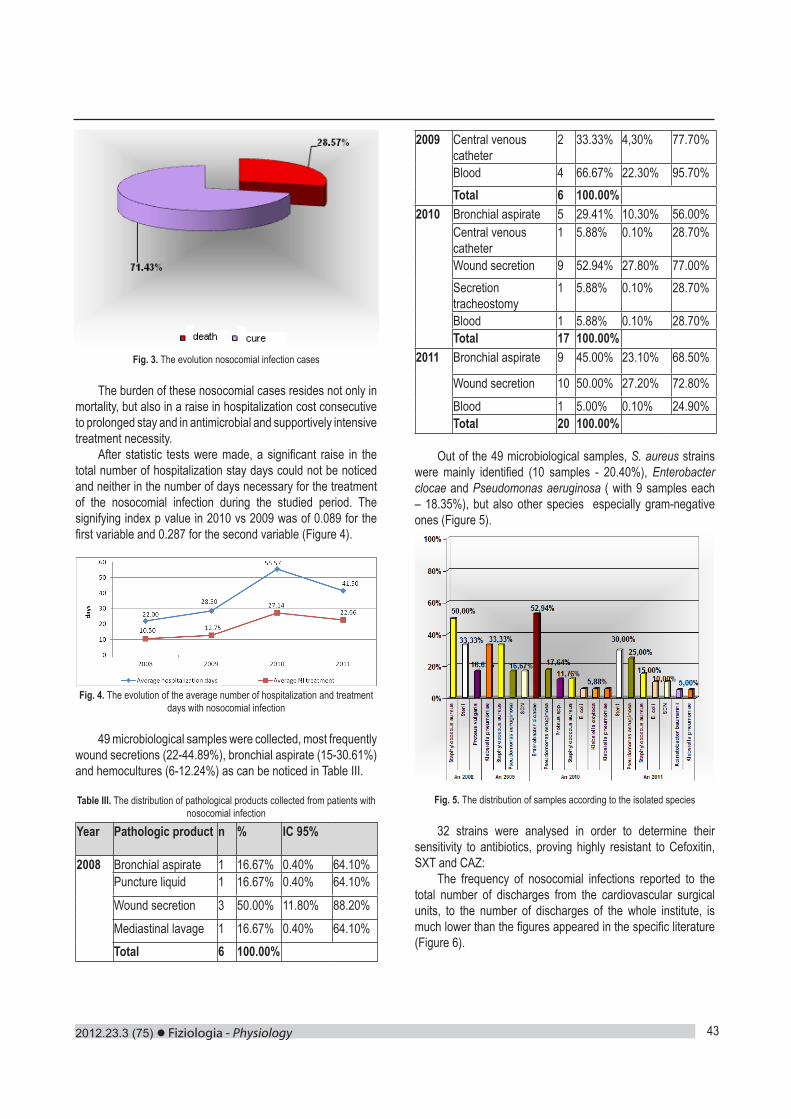
2012.23.3 (75) Fiziologia - Physiology 43
Fig. 3. The evolution nosocomial infection cases
The burden of these nosocomial cases resides not only in mortality, but also in a raise in hospitalization cost consecutive to prolonged stay and in antimicrobial and supportively intensive treatment necessity.
After statistic tests were made, a significant raise in the total number of hospitalization stay days could not be noticed and neither in the number of days necessary for the treatment of the nosocomial infection during the studied period. The signifying index p value in 2010 vs 2009 was of 0.089 for the first variable and 0.287 for the second variable (Figure 4).
Fig. 4. The evolution of the average number of hospitalization and treatment days with nosocomial infection
49 microbiological samples were collected, most frequently wound secretions (22-44.89%), bronchial aspirate (15-30.61%) and hemocultures (6-12.24%) as can be noticed in Table III.
Table III. The distribution of pathological products collected from patients with nosocomial infection
Year Pathologic product n % IC 95%
2008
Bronchial aspirate 1 16.67% 0.40% 64.10%Puncture liquid 1 16.67% 0.40% 64.10%
Wound secretion 3 50.00% 11.80% 88.20%
Mediastinal lavage 1 16.67% 0.40% 64.10%Total 6 100.00%
2009
Central venous catheter
2 33.33% 4,30% 77.70%
Blood 4 66.67% 22.30% 95.70%Total 6 100.00%
2010
Bronchial aspirate 5 29.41% 10.30% 56.00%Central venous catheter
1 5.88% 0.10% 28.70%
Wound secretion 9 52.94% 27.80% 77.00%Secretion tracheostomy
1 5.88% 0.10% 28.70%
Blood 1 5.88% 0.10% 28.70%Total 17 100.00%
2011
Bronchial aspirate 9 45.00% 23.10% 68.50%
Wound secretion 10 50.00% 27.20% 72.80%Blood 1 5.00% 0.10% 24.90%Total 20 100.00%
Out of the 49 microbiological samples, S. aureus strains were mainly identified (10 samples - 20.40%), Enterobacter clocae and Pseudomonas aeruginosa ( with 9 samples each – 18.35%), but also other species especially gram-negative ones (Figure 5).
Fig. 5. The distribution of samples according to the isolated species
32 strains were analysed in order to determine their sensitivity to antibiotics, proving highly resistant to Cefoxitin, SXT and CAZ:
The frequency of nosocomial infections reported to the total number of discharges from the cardiovascular surgical units, to the number of discharges of the whole institute, is much lower than the figures appeared in the specific literature (Figure 6).
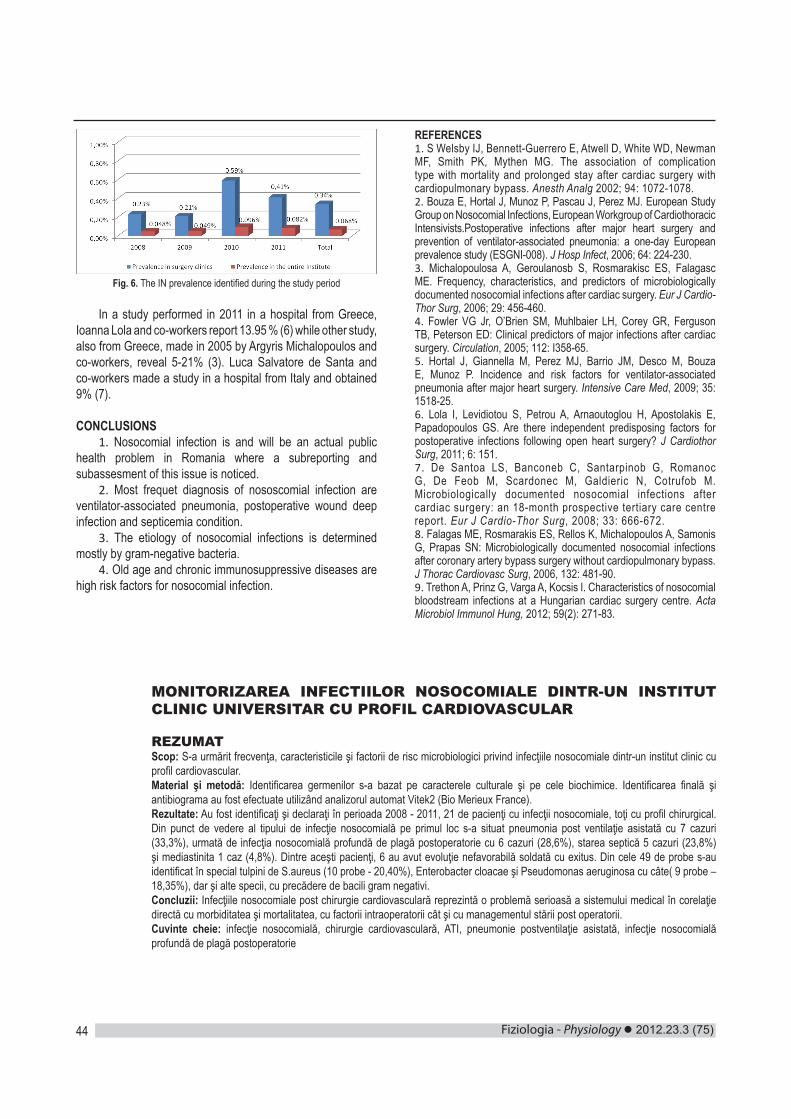
Fiziologia - Physiology 2012.23.3 (75)44
Fig. 6. The IN prevalence identified during the study period
In a study performed in 2011 in a hospital from Greece, Ioanna Lola and co-workers report 13.95 % (6) while other study, also from Greece, made in 2005 by Argyris Michalopoulos and co-workers, reveal 5-21% (3). Luca Salvatore de Santa and co-workers made a study in a hospital from Italy and obtained 9% (7).
CONCLUSIONS1. Nosocomial infection is and will be an actual public
health problem in Romania where a subreporting and subassesment of this issue is noticed.
2. Most frequet diagnosis of nososcomial infection are ventilator-associated pneumonia, postoperative wound deep infection and septicemia condition.
3. The etiology of nosocomial infections is determined mostly by gram-negative bacteria.
4. Old age and chronic immunosuppressive diseases are high risk factors for nosocomial infection.
REFERENCES1. S Welsby IJ, Bennett-Guerrero E, Atwell D, White WD, Newman MF, Smith PK, Mythen MG. The association of complication type with mortality and prolonged stay after cardiac surgery with cardiopulmonary bypass. Anesth Analg 2002; 94: 1072-1078.2. Bouza E, Hortal J, Munoz P, Pascau J, Perez MJ. European Study Group on Nosocomial Infections, European Workgroup of Cardiothoracic Intensivists.Postoperative infections after major heart surgery and prevention of ventilator-associated pneumonia: a one-day European prevalence study (ESGNI-008). J Hosp Infect, 2006; 64: 224-230. 3. Michalopoulosa A, Geroulanosb S, Rosmarakisc ES, Falagasc ME. Frequency, characteristics, and predictors of microbiologically documented nosocomial infections after cardiac surgery. Eur J Cardio-Thor Surg, 2006; 29: 456-460.4. Fowler VG Jr, O’Brien SM, Muhlbaier LH, Corey GR, Ferguson TB, Peterson ED: Clinical predictors of major infections after cardiac surgery. Circulation, 2005; 112: I358-65. 5. Hortal J, Giannella M, Perez MJ, Barrio JM, Desco M, Bouza E, Munoz P. Incidence and risk factors for ventilator-associated pneumonia after major heart surgery. Intensive Care Med, 2009; 35: 1518-25.6. Lola I, Levidiotou S, Petrou A, Arnaoutoglou H, Apostolakis E, Papadopoulos GS. Are there independent predisposing factors for postoperative infections following open heart surgery? J Cardiothor Surg, 2011; 6: 151. 7. De Santoa LS, Banconeb C, Santarpinob G, Romanoc G, De Feob M, Scardonec M, Galdieric N, Cotrufob M. Microbiologically documented nosocomial infections after cardiac surgery: an 18-month prospective tertiary care centre report. Eur J Cardio-Thor Surg, 2008; 33: 666-672.8. Falagas ME, Rosmarakis ES, Rellos K, Michalopoulos A, Samonis G, Prapas SN: Microbiologically documented nosocomial infections after coronary artery bypass surgery without cardiopulmonary bypass. J Thorac Cardiovasc Surg, 2006, 132: 481-90.9. Trethon A, Prinz G, Varga A, Kocsis I. Characteristics of nosocomial bloodstream infections at a Hungarian cardiac surgery centre. Acta Microbiol Immunol Hung, 2012; 59(2): 271-83.
MONITORIZAREA INFECTIILOR NOSOCOMIALE DINTR-UN INSTITUT CLINIC UNIVERSITAR CU PROFIL CARDIOVASCULAR
REZUMATScop: S-a urmărit frecvenţa, caracteristicile şi factorii de risc microbiologici privind infecţiile nosocomiale dintr-un institut clinic cu profil cardiovascular.Material şi metodă: Identificarea germenilor s-a bazat pe caracterele culturale şi pe cele biochimice. Identificarea finală şi antibiograma au fost efectuate utilizând analizorul automat Vitek2 (Bio Merieux France).Rezultate: Au fost identificaţi şi declaraţi în perioada 2008 - 2011, 21 de pacienţi cu infecţii nosocomiale, toţi cu profil chirurgical. Din punct de vedere al tipului de infecţie nosocomială pe primul loc s-a situat pneumonia post ventilaţie asistată cu 7 cazuri (33,3%), urmată de infecţia nosocomială profundă de plagă postoperatorie cu 6 cazuri (28,6%), starea septică 5 cazuri (23,8%) şi mediastinita 1 caz (4,8%). Dintre aceşti pacienţi, 6 au avut evoluţie nefavorabilă soldată cu exitus. Din cele 49 de probe s-au identificat în special tulpini de S.aureus (10 probe - 20,40%), Enterobacter cloacae şi Pseudomonas aeruginosa cu câte( 9 probe – 18,35%), dar şi alte specii, cu precădere de bacili gram negativi.Concluzii: Infecţiile nosocomiale post chirurgie cardiovasculară reprezintă o problemă serioasă a sistemului medical în corelaţie directă cu morbiditatea şi mortalitatea, cu factorii intraoperatorii cât şi cu managementul stării post operatorii.Cuvinte cheie: infecţie nosocomială, chirurgie cardiovasculară, ATI, pneumonie postventilaţie asistată, infecţie nosocomială profundă de plagă postoperatorie