editor’s - exterion media/media/files/uk/brochures/urban... · editor’s note methodology ......
TRANSCRIPT


EDITOR’S Note METHODOLOGYThe food retail market has seen a host of significant shifts in consumer behaviour, with different drivers having an influence.
Urban Bites aims to unpick the market forces driving the food category, in an attempt to identify the most effective touch points when trying to reach the urban audience.
This report aims to inform advertisers about the behaviour, lifestyle, attitudes and motivations of urbanites, while providing ideas and inspiration of how to reach and engage with the modern grocery shopper.
Using our award-winning 11,000-strong work.shop.play. community panel, we were able to delve deep into the urban audience’s motivations and behaviours, bringing together a total of 15 surveys and 9 ad effectiveness research projects. Additional data has been sourced from TGI, Touchpoints, Kantar Worldpanel & Mintel.
The Team
1 2

Sources: work.shop.play. survey 1, work.shop.play. survey 2, work.shop.play. survey 10, work.shop.play. survey 12, work.shop.play. survey 15, TGI
CONTENT Key AudiencesKey audiences likely to be driving the market
Strategic spendersYoung urbanites tend to be quite disciplined when it comes to food shopping. 2 in 5 go out to the shops with a list and stick to it, while 1 in 4 do one main weekly shop. 3 in 5 buy most of their groceries in convenience stores throughout the week, suggesting these shoppers are still inclined to impulse purchase. Their food choices tend be healthy, with 1 in 3 buying more healthy food this year compared to last and almost 2 in 5 constantly checking food labels before purchase. 47% of London Commuters who are 16-34, find themselves commuting between 5pm-8pm midweek – which is also when they regularly shop in convenience stores.
On a budget1 in 4 people with children in their household have a monthly budget, that they try and stick to. However, 1 in 5 often find themselves spending more. 1 in 3 will plan a big weekly shop in- store, but then often top-up with essentials – 2 in 5 buy food mainly in convenience stores midweek. These shoppers seem to be partly driving the online sector as well. Nearly 1 in 5 are shopping for groceries online more than a year ago and 1 in 4 have completed an order on their mobile or tablet. 34% of London Commuters who do regular top-up shops have children in their household.
Quality & provenanceThis group of shoppers is less driven by price - 1 in 2 seek quality when shopping for groceries, with 3 in 4 of those aged 35-44, in particular, prepared to pay extra for premium products. What’s more, 1 in 2 regularly shop on their local high street in order to support businesses in their areas and boost the local economy. 51% of London Commuters fall into the ABC1 35+ audience group.
ADULTS 16-34
KIDS IN HH
ABC1 35+
Key Audiences
Market ForcesAt a glanceThe weekly shopping routineShopping for convenience The ease of online shoppingTactical about targeting: in-store vs. onlineKey targeting opportunitiesRetailer perceptions: the shopping experienceRetailer perceptions: product rangeSupporting the community
The Commuting ShopperAt a glanceTrying to find the balancePivotal moments• Breakfast • Lunch • DinnerTakeaway dinnersUrban snackingSummaryAdditional sources
Using data for targeting
Case studies and creative galleryLondon Underground: driving response amongst commutersBus: driving action on the high streetCreative gallery
List of surveys
3 4

market Forces

AT A GLANCEFood is a key priority for the urban audience. Despite concerns around the UK economy following the Brexit vote, 78% of our urban consumers still intend to spend the same or perhaps even more on groceries in the coming months.
The explosion of food-centric media and a desire for a healthy lifestyle stand out as some of the key factors inspiring people to cook more, with 68% saying they now try and cook all of their meals from scratch. However, 1 in 5 urbanites find they have the same meals all the time and are actively seeking inspiration. The fact that 54% think about the groceries they need whilst out and about shows that there’s an opportunity for brands to engage with the urban audience on the move and help guide people’s decisions. With the supermarket wars still in full swing, retailers are seeking new points of differentiation. In this quest, we’re seeing that the high street is an ever more important battleground, as the extensive growth of the convenience grocery sector is further affecting shopping behaviours. As a result, 2 in 5 urbanites now do most of their food shopping in convenience stores throughout an average week.
At the same time, retailers are increasingly facing competition from the more local, specialist stores. Over 1 in 3 high street shoppers say they regularly go shopping on their local high street to help boost the local economy.
Online grocery shopping has seen slow growth in comparison to other online retail sectors. Nonetheless, technology is having a tremendous impact on the food sector, whether it’s the in-store experience or the flexibility of online orders. Consequently, 1 in 5 Londoners have already ordered at least one food shop on their mobile or tablet, and as players such as Amazon enter the online grocery market, we’re likely to see this segment of the market evolve in coming years.
work.shop.play. data reveals that 1 in 5 urbanites still like to stick to the main weekly shop. However, as life often gets in the way of careful planning, 1 in 3 urbanites often find themselves topping up their big weekly shop throughout the week. A further 1 in 5 are actively seeking inspiration for their meals, suggesting there’s an opportunity for advertisers to aid people’s decisions.
THE WEEKLYShopping Routine
24% 19% 24% 32% 34% 35% 20% 23% 15% 10% 11% 12% 6% 7% 10%
One main shop in-store that
lasts the week
One big weekly shop in-store and
top-up when needed
Shop on numerous occasions in-store
throughout the week
One big weekly shop online and top-up in-store when needed
One main shop online that lasts
the week
16-34s ABC1 35+ Kids in HH Urban audience
GROCERY SHOPPING ON THE HIGH STREET GROCERY SHOPPING ONLINE
7 8
Sources: work.shop.play. survey 6, work.shop.play. survey 10, Mintel, Online Grocery Retailing Mar 2015Sources: work.shop.play. survey 1, work.shop.play. survey 3, work.shop.play. survey 6, work.shop.play. survey 9, work.shop.play. survey 10, work.shop.play. survey 12
THE Ease of Online ShoppingShopping FOR Convenience
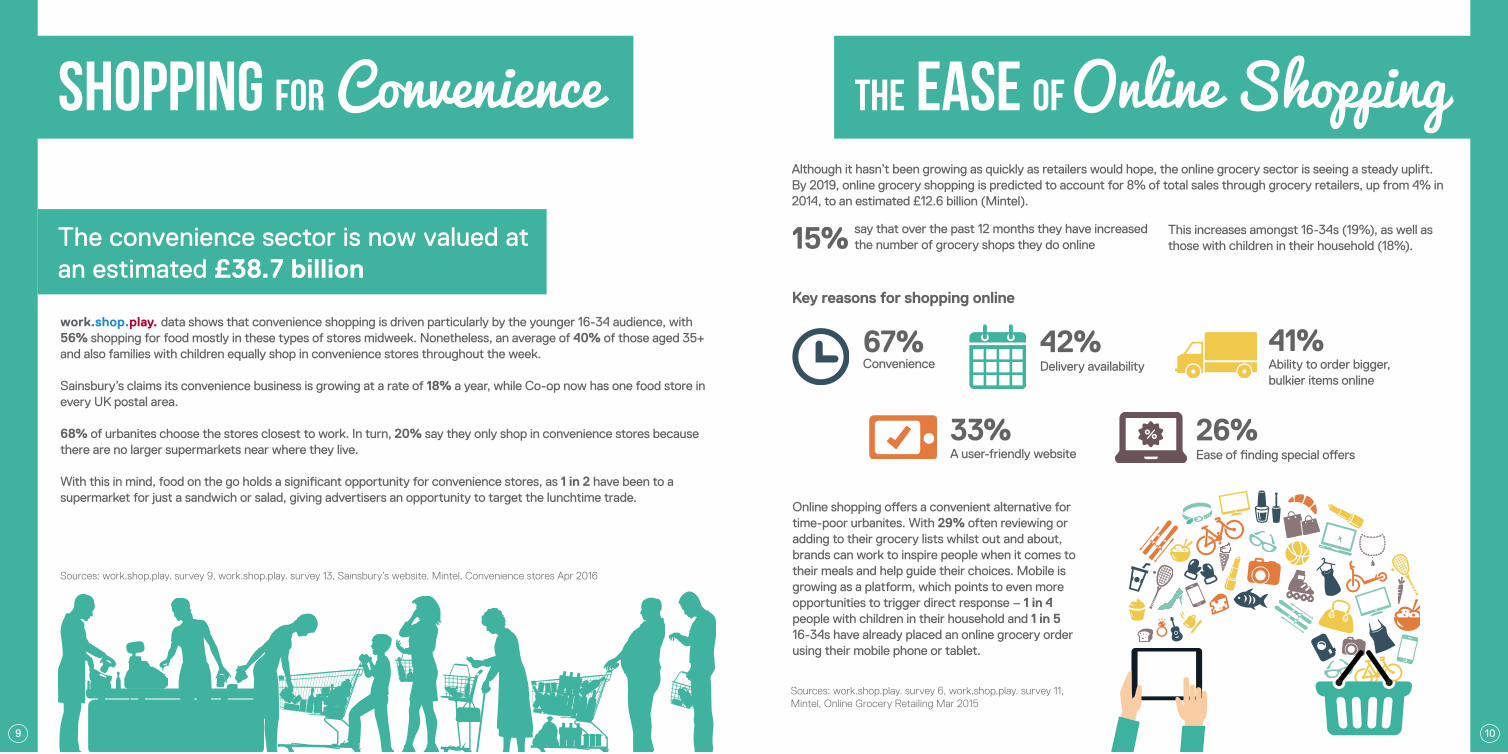
The convenience sector is now valued at an estimated £38.7 billion
work.shop.play. data shows that convenience shopping is driven particularly by the younger 16-34 audience, with 56% shopping for food mostly in these types of stores midweek. Nonetheless, an average of 40% of those aged 35+ and also families with children equally shop in convenience stores throughout the week.
Sainsbury’s claims its convenience business is growing at a rate of 18% a year, while Co-op now has one food store in every UK postal area.
68% of urbanites choose the stores closest to work. In turn, 20% say they only shop in convenience stores because there are no larger supermarkets near where they live.
With this in mind, food on the go holds a significant opportunity for convenience stores, as 1 in 2 have been to a supermarket for just a sandwich or salad, giving advertisers an opportunity to target the lunchtime trade.
Although it hasn’t been growing as quickly as retailers would hope, the online grocery sector is seeing a steady uplift. By 2019, online grocery shopping is predicted to account for 8% of total sales through grocery retailers, up from 4% in 2014, to an estimated £12.6 billion (Mintel).
Key reasons for shopping online
Online shopping offers a convenient alternative for time-poor urbanites. With 29% often reviewing or adding to their grocery lists whilst out and about, brands can work to inspire people when it comes to their meals and help guide their choices. Mobile is growing as a platform, which points to even more opportunities to trigger direct response – 1 in 4 people with children in their household and 1 in 5 16-34s have already placed an online grocery order using their mobile phone or tablet.
say that over the past 12 months they have increased the number of grocery shops they do online
Convenience Delivery availability
A user-friendly website Ease of finding special offers
Ability to order bigger, bulkier items online
This increases amongst 16-34s (19%), as well as those with children in their household (18%).15%
67% 42% 41%
33% 26%
9 10
Sources: work.shop.play. survey 6, work.shop.play. survey 11, Mintel, Online Grocery Retailing Mar 2015
Sources: work.shop.play. survey 9, work.shop.play. survey 13, Sainsbury’s website, Mintel, Convenience stores Apr 2016
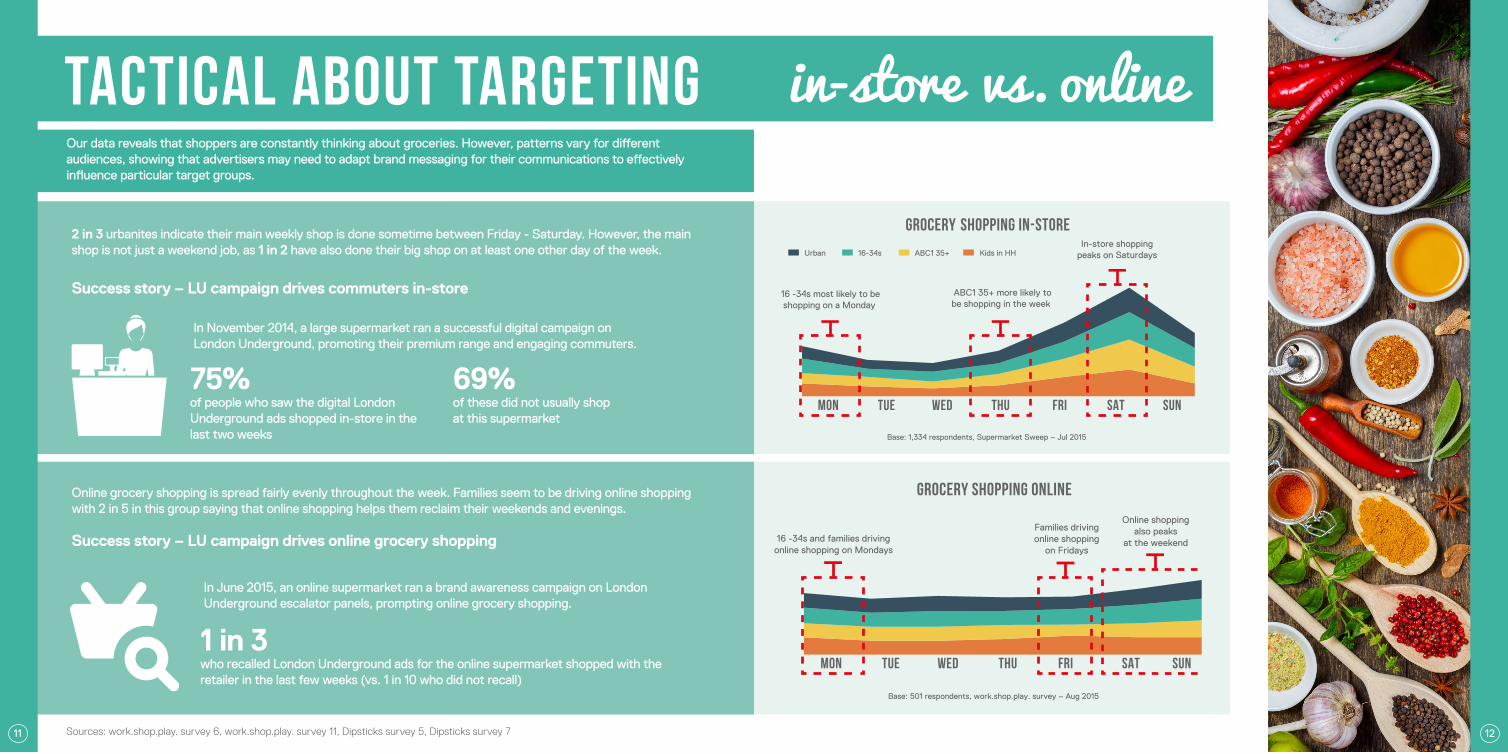
Urban 16-34s ABC1 35+ Kids in HH
16 -34s most likely to beshopping on a Monday
ABC1 35+ more likely tobe shopping in the week
In-store shoppingpeaks on Saturdays
MON TUE WED THU FRI SAT SUN
Base: 1,334 respondents, Supermarket Sweep – Jul 2015
SHOPPING IN-STOREGROCERY2 in 3 urbanites indicate their main weekly shop is done sometime between Friday - Saturday. However, the main shop is not just a weekend job, as 1 in 2 have also done their big shop on at least one other day of the week.
In November 2014, a large supermarket ran a successful digital campaign on London Underground, promoting their premium range and engaging commuters.
Success story – LU campaign drives commuters in-store
of people who saw the digital London Underground ads shopped in-store in the last two weeks
of these did not usually shop at this supermarket
75% 69%
TACTICAL ABOUT TARGETING in-store vs. online
GROCERY SHOPPING ONLINE
16 -34s and families drivingonline shopping on Mondays
Families drivingonline shopping
on Fridays
Online shoppingalso peaks
at the weekend
MON TUE WED THU FRI SAT SUN
Base: 501 respondents, work.shop.play. survey – Aug 2015
In June 2015, an online supermarket ran a brand awareness campaign on London Underground escalator panels, prompting online grocery shopping.
Our data reveals that shoppers are constantly thinking about groceries. However, patterns vary for different audiences, showing that advertisers may need to adapt brand messaging for their communications to effectively influence particular target groups.
who recalled London Underground ads for the online supermarket shopped with the retailer in the last few weeks (vs. 1 in 10 who did not recall)
1 in 3
Online grocery shopping is spread fairly evenly throughout the week. Families seem to be driving online shopping with 2 in 5 in this group saying that online shopping helps them reclaim their weekends and evenings.
Success story – LU campaign drives online grocery shopping
11 12Sources: work.shop.play. survey 6, work.shop.play. survey 11, Dipsticks survey 5, Dipsticks survey 7

Key Targeting OpportunitiesWith shoppers active throughout the week, we identified opportune moments for advertisers to prompt particular target audiences with relevant brand messaging whilst on the move.
Shopping in Convenience Stores
Convenience shopping peaks between 5pm-8pm midweek. This is driven by 16-34s, with 3 in 5 likely to be shopping within this time period on a regular basis.
Monday - Friday Saturday - Sunday
Shopping for Groceries Online
Close to half of all online grocery shopping is done midweek. 55% of urbanites who shop online for groceries do so between 5pm-11pm.
Shopping in Convenience Stores
Our data shows two peaks at the weekend - 1 in 5 people with children will shop between 9am – noon, while over 1 in 5 16-34s will shop in a convenience store between 2pm – 5pm at the weekend.
Shopping for Groceries Online
1 in 5 online grocery shoppers order at the weekend. Timing is more ad-hoc, but activity still tends to peak in the evenings, outside of regular store opening hours.
6am -8.59am
9am -11.59am
12noon -1.59pm
2pm -4.59pm
5pm -7.59pm
8pm - 11pm
Urban 16-34
ABC1 35+ Kids in HH
Base: 1,515 respondents, Supermarket Sweep – Jul 2014
6am -8.59am
9am -11.59am
12noon -1.59pm
2pm -4.59pm
5pm -7.59pm
8pm - 11pm
Base: 1,334 respondents, Supermarket Sweep – Jul 2015
6am -8.59am
9am -11.59am
12noon -1.59pm
2pm -4.59pm
5pm -7.59pm
8pm - 11pm
Urban 16-34
ABC1 35+ Kids in HH
Base: 1,515 respondents, Supermarket Sweep – Jul 2014
6am -
8.59am
9am -
11.59am
12noon -
1.59pm
2pm -
4.59pm
5pm -
7.59pm
8pm - 11pm
Base: 1,334 respondents, Supermarket Sweep – Jul 2015
13 14

RETAILER PERCEPTIONSthe Shopping Experience
Base: 1,308 respondents, Supermarket Sweep – Jul 2015
Sainsbury's
Waitrose
Morrisons
Aldi
M&S
Lidl
IcelandConvenient location
In-store experience
A wide range
Loyalty rewards
Value for money
Tesco
Co-op ASDA
Convenient locationCo-op’s high street presence - with 2,800 outlets up & down the country - has led the retailer to become the UK’s 5th largest supermarket. Nearly 3 in 4 urbanites chose Co-op for its convenient locations, above bigger competitors like Tesco, Sainsbury’s, Morrisons or ASDA.
Loyalty rewards1 in 2 urbanites said they were most satisfied with Tesco’s Clubcard scheme, while 2 in 5 mentioned Sainsbury’s Nectar card. Morrisons More card and Co-op’s membership card follow closely in the rankings, selected by 1 in 3 of their shoppers.
A wide rangeThe Big Four dominate this category, however, they are closely followed by Iceland, who was rated for its range by nearly 1 in 3 of its shoppers.
Value for moneyAldi & Lidl have a really strong position when it comes to their value for money proposition, chosen in this area by 9 out of 10 shoppers. The hard discounters are followed by Iceland (rated by 7 out of 10) and ASDA (rated by 6 out of 10).
To effectively compete within a fierce market landscape, retailers need a clearly defined brand proposition
We used the work.shop.play. to measure how customers rated the shopping experience for each retailer. Data suggests that shoppers now visit a range of supermarkets for different reasons. Therefore, retailers require well-defined strategies to strengthen their unique propositions.
In-store experience1 in 2 urbanites picked Waitrose for their in-store experience. They were followed by M&S, as well as Co-op, who were ranked for experience by 1 in 3 shoppers.
15 16
Sources: work.shop.play. survey 6

retailer PERCEPTIONSProduct Range
Shoppers have large brand repertoires and supermarkets need to carve their own unique propositions
When compared on overall ranges, Waitrose and M&S were rated highest. However, when delving deeper into things like fresh produce, Morrisons, Aldi & Lidl stood out most, which is in line with their recent marketing efforts.
Quality of produceWaitrose and M&S come up top in terms of quality produce, rated by nearly 7 out of 10 respondents. They are followed by Aldi & Lidl, who were picked by nearly 5 out of 10 respondents for the quality of their produce.
Fruit & vegThe highest ranking retailers in terms of fresh produce were Aldi, Morrisons and Lidl, above some of the bigger retailers like Tesco and Sainsbury’s. Morrisons’ position here reflects its push for fresh, local produce, with 60% of its range of fruit & veg produced by the retailer itself.
Value own labelAldi and Iceland scored highest for this segment of the market, with 30% of people satisfied with their value own label products. They were followed closely by ASDA. This is a lucrative sector, as 1 in 5 urbanites say they’ve increased their spend on value own label products in the past 12 months.
Fresh meat46% of shoppers trusted Morrisons for fresh meat, above other retailers perceived to stock good quality products such as Waitrose or M&S.
Frozen foodAs the traditional innovator in the frozen food sector, Iceland comes top, with 70% choosing the retailer for its freezer range. ASDA‘s frozen range was also picked by 39% of respondents. At the other end of the spectrum, Co-op has an opportunity to increase awareness of its convenience frozen meal deal offering.
Base: 1,308 respondents, Supermarket Sweep – Jul 2015
Sainsbury's
Waitrose
Morrisons
Aldi
M&S
Lidl
Iceland
Tesco
Co-op ASDA
Fresh Meat (exc fish)
Quality of produce
Fruit & Veg
Value Own Label
Frozen Food
17 18
Sources: work.shop.play. survey 6

SUPPORTING the Community
Evidence suggests that people want to shop more in their local areas. 44% of high street shoppers say they regularly shop on their local high street to support local businesses, rising to 50% of those aged 35+.
The way in which people feel about local produce is starting to affect supermarket activity, with retailers looking to tailor their products to feature local ranges and seeking to reassure customers about the provenance of food on offer in stores.
Last year, Morrisons started testing a new store format, with product ranges tailored to the areas where the stores are based. This aimed to create an experience that resonated with local customers. Meanwhile, in one of its latest campaigns, Waitrose wanted to reassure customers about the quality and provenance of their produce by live streaming video feeds from their farms, showing people where their food came from. Lidl have since also taken a similar approach in their latest campaign.
High street shoppers think that shopping on their high street is more pleasant than going to big city centres or shopping malls
will pay more for locally sourced produce
High street shoppers believe that they get a more personal service on their local high street
paying more attention to food provenance compared to last year
1 in 3
1 in 3
1 in 5
1 in 5
SummaryStats
What you need to know...With locals caring about their high street, Bus can offer the visibility that brands need
The main weekly shop2 in 3 urbanites do their main weekly shop sometime between Friday - Saturday. We know that 1 in 2 think about the groceries they need whilst on the move.
Top-up shopping1 in 3 urbanites will top up their big weekly shop at least once throughout the week, and 2 in 5 say most of their food shopping is done in convenience stores during the week. We know that nearly 1 in 2 urbanites shop in convenience stores between 5pm-8pm midweek.
An increasingly mobile grocery shopper1 in 4 people with children in their household and 1 in 5 urbanites aged 16-34s have already used their mobile or tablet to order a shopping delivery. When it comes to online shopping, 55% of urbanites will buy their groceries between 5pm-11pm midweek.
Shopping Local44% said they regularly shop on their local high street to support local businesses.
19 20
Sources: work.shop.play. survey 6, work.shop.play. survey 10 Sources: work.shop.play. survey 6, work.shop.play. survey 1, work.shop.play. survey 11

THE
COMMUTING Shopper

AT A GLANCENearly 1 in 3 urbanites say they want to take better care of themselves and eat more healthy food. What’s more, 1 in 4 say that they’re buying more wholesome food this year compared to last, with 29% closely checking labels before buying food and 1 in 3 saying they keep a close eye on what they eat.
However, for busy urbanites life often seems to get in the way – 63% of health-conscious urbanites say that a lack of time stops them from having a balanced diet. What’s more, 1 in 3 urbanites say they can’t make it through the day without a snack and 1 in 5 snack without thinking what about what they’re eating.
The following section explores the polarised nature of modern urbanites in terms of their behaviours and attitudes towards food. It attempts to unpick key moments in the day (with regards to people’s food choices) and enable advertisers to tailor campaign messaging according to what consumers demand.
Planning meals around their workoutAs urbanites are looking to adopt healthier lifestyles, 3 in 5 say they exercise on a regular basis and nearly half try and find time to work out at least three times a week. It seems that food plays an important role in maintaining a healthy active routine - 30% are more likely to plan meals on the days they work out and 34% tailor their diet to get the right nutrients for their workout. Technology is having an impact here too, as 46% have used mobile apps or wearables to keep track of their fitness and weekly diet.
Superfoods now a stapleWe know that urbanites want to consume more healthy food and it appears that superfoods, like avocado, blueberries and kale, are now a staple in people’s diets. 1 in 5 regularly eat superfoods in order to balance their diet and 3 in 4 of those who consume superfoods believe these types of foods can help improve health and well-being.
TRYING TO FIND The Balance
23 24
Sources: work.shop.play. survey 1, work.shop.play. survey 5, work.shop.play. survey 6, work.shop.play. survey 11 Sources: work.shop.play. survey 5, work.shop.play. survey 9, work.shop.play. survey 11

TRYING TO FIND The Balance PIVOTAL Moments
Responsible consumersNearly 7 out of 10 people say they would be prepared to pay extra for better quality products. As a result, over 1 in 4 across the country have consciously purchased Fairtrade and Organic products in the last month.
Purchasing ‘own label’ productsAt the height of the recession, supermarket ‘own-label’ products were at the heart of the supermarket wars, with retailers using them to gain market share. People are still quite careful with their spending and nearly 1 in 2 agree that ‘own brand’ products are just as good as other well known brands. As Mintel data shows that consumer confidence has slightly declined in the wake of the Brexit vote, it’s unlikely this behaviour will change any time soon. This suggests that there is still scope for supermarkets to invest and drive awareness in this area.
41% London
46% London
vs. 31% Urban
vs. 27% Urban
Fair Trade
Organic
ADULTS 16-34
ADULTS 16-34
KIDS IN HH
KIDS IN HH
ABC1 35+
ABC1 35+
62%
62%
60%
64%
64%
55%
have bought from a supermarket ‘value’ range in the last month
would buy fresh meat from a supermarket’s ‘premium own brand’ rather than other well known brands
have bought from a supermarket ‘premium’ range in the last month
60%
46%
63%
In order to devise impactful brand strategies, it is crucial for advertisers to identify people’s pivotal decision points throughout the day. With more than 1 in 2 urbanites thinking about food whilst on the move, the following subsection aims to identify key meal times and help advertisers understand how to tailor campaign messaging according to people’s behaviours, priorities and demands.
25 26
Sources: work.shop.play. survey 6 Sources: work.shop.play. survey 6

PIVOTAL Moments: Breakfast PIVOTAL Moments: LunchMore than 1 in 2 urbanites see breakfast as the most important meal of the day (rising to more than 3 in 5 of those with children in their household).
While it tends to be a habitual choice, with more than 2 in 5 buying the same things week in week out, there’s a clear difference between what people choose for breakfast midweek versus the weekend. Advertisers need to consider this and think about different approaches depending on the time of week.
Although lunches are often planned in the weekly shop, with 1 in 3 urbanites saying they buy items in advance, it can often be a spur of the moment decision. 50% of people across the UK and 68% in London get lunch on the go at least once a week.
For 62% of those who buy lunch on the move, this is usually a spontaneous decision, and more than half say their choice largely depends on their mood. 22% look for new products they can try, but 58% say they are often swayed by special offers and meals deals.
As people go out for lunch with an open mind, there is a significant opportunity for advertisers to inspire the urban audience and target the lunchtime trade - with Bus being the perfect environment to drive action on the high street.
Thoughts from the work.shop.play. communityWe asked our community about what influenced their choice of lunch on a particular day. Although the strongest influence is health (amongst 32% of urbanites), it’s not the only consideration.
Cereal / Muesli / Granola Eggs
Fruit Toast
Porridge / Oatmeal Full English
Toast Bacon / Sausage Butty
Yoghurt Cereal / Muesli / Granola
Monday - FridayQuick & Functional
Saturday - SundayThoughtful & Indulgent
Don’t have time to make
breakfast
Buy more specialist products
at the weekend (e.g. bagels)
Look for healthy options
Enjoy trying new things at the weekend
Seek quick & convenient
options
Make more of an effort with breakfast
Buy items they can consumeon-the-go
Think about their weekend breakfast
in the week
57% 73%
23% 53%
36% 62%
20%34%
55% 58%
36% 57%
32% 43%
32% 40%
25% 39%
‘I chose that lunch today because of convenience, as it was from the shop
opposite my office’. Female, 16-34
‘I had one of the expensive sandwiches because it’s payday and I wanted
something special’.Male, 35-44
‘‘I had soup for lunch because there was some leftover from yesterday and I don’t like to
waste stuff’. Female, 16-34
‘I was out, needed something quickly and a meal deal normally offers good value’.
Male, 35-44
Convenience is key
A treat on payday
Minimising food waste
Looking for value
27 28Sources: work.shop.play. survey 9, work.shop.play. survey 1, work.shop.play. survey 16
Sources: work.shop.play. survey 13, work.shop.play. survey 7

PIVOTAL Moments: Dinner Takeaway Dinners68% of urbanites say they try and cook all of their meals from scratch and 26% are doing so more than a year ago. 82% say they‘re proud of the meals they manage to prepare and feel that cooking gives them a sense of accomplishment.
Quite often, dinner plans are made spontaneously. For that reason, 22% frequently buy the groceries they need on the day and 26% decide what to have for dinner only once in-store. What’s more, 1 in 5 find they have the same meals all the time and are actively seeking help and inspiration.
Therefore, advertisers have a golden opportunity to reach out to commuters and seek to assist them with ideas at key points of influence throughout the day, when they’re likely to be thinking about their next meal, as highlighted by the figure below.
think about groceries whilst out and about 54%
Travelling Preparing food Tired6am 12am
Breakfast Lunch Dinner
An average week Mon-Fri (Avg day) – London BARB
Despite 8 in 10 urbanites saying they normally prefer to cook their own food, busy lifestyles can often get in the way, and takeaways can be a convenient alternative. work.shop.play. data reveals that 59% order takeaway food at least once a month (increasing to 68% of those aged 16-34). 72% say that ordering takeaway is usually a spontaneous decision and 39% think about it whilst at work or college, which shows that there may be scope for advertisers to think about targeting the lunchtime trade.
Online ordering platforms such as Deliveroo, Just Eat and Hungry House are now making it easy for more and more restaurants to enter the delivery market without having to set up their own infrastructure for distribution, intensifying competition in this sector.
Over 1 in 2 agree that apps are making it easier than ever to order food and as a result, 1 in 3 have already ordered using an app on their mobiles.
The fact that 1 in 5 say they sometimes order takeaway meals on their way back from work shows that advertisers have a great opportunity to reach commuters through OOH advertising and seek to drive direct response.
1 in 2Reasonstoorder
3 in 5 1 in 4‘I was tired and didn’t want to cook’
‘I wanted to treat myself’
‘There was no food in the house’
Convenience Comfort An easy alternative
29 30
Sources: work.shop.play. survey 2, work.shop.play. survey 6, work.shop.play. survey 9, Touchpoints 6 expanded hub including TGI
Sources: work.shop.play. survey 17, work.shop.play. survey 13

Trying to stay healthyNearly 1 in 3 urbanites say they want to take better care of themselves and eat more healthy food.
Demanding better foodNearly 7 out of 10 people say they would be prepared to pay extra for better quality products.
Time is the enemy63% of health-conscious urbanites say that a lack of time stops them from having a balanced diet.
Breakfast is essential55% of urbanites see breakfast as the most important meal of the day and 57% say they can’t function without it.
Lunch on the move1 in 3 urbanites plan lunches in their weekly shop, but 1 in 4 will buy lunch whilst out and about at least once a week.
On the lookout for ideas68% of urbanites say they try and cook all of their meals from scratch, but 1 in 5 find they have the same thing all the time and are actively seeking ideas.
Urban SnackingSnacking is common amongst 9 out of 10 urbanites and buying snacks is most often a spur of the moment decision. For example, 30% say their choice of snack depends on their mood. Our research identified two main types of snackers…
The fact that fruit is the number 1 snack consumed by UK urbanites underpins the overall trends towards healthy choices. However, seeing how chocolate, crisps and biscuits also make the top 5 shows that people still like to regularly treat themselves to indulgent food options.
1 in 4 normally snack to get an energy boost in-between lunch and dinner and 1 in 5 say that without fail, they always get hungry between meals. It can often go one of two ways…
Habitual & prepared
Conscious snacking
Impulsive & spontaneous
An indulgent occasion
plan their snacks at the start of the week
snack but try to eat some healthy options
are usually spontaneous with what they snack on
snack and don’t think about what they’re eating
20%
54%
62%
20%
Two types of snackers
Top 5 snacks consumed regularly Fruit Chocolate Crisps Nuts Biscuits
65% 60% 56% 42% 53%
SummaryStatsWhat you need to know...
31 32
Sources: work.shop.play. survey 16, work.shop.play. survey 1, work.shop.play. survey 9 Sources: work.shop.play. survey 5, work.shop.play. survey 6, work.shop.play. survey 9, work.shop.play. survey 11, work.shop.play. survey 13, work.shop.play. survey 17

SUMMARY ADDITIONALSources
33 34
Sources: work.shop.play. survey 17, work.shop.play. survey 3, work.shop.play. survey 6, Touchpoints 6 expanded hub including TGI
Despite economic uncertainty as a result of the Brexit vote, the evidence suggests that groceries remain a priority and shoppers are not intending to cut their spending in this area anytime soon.
In turn, opportunities are more significant than ever, as advertisers are dealing with an ‘always on’ consumer. work.shop.play. data suggests the main grocery shop is no longer just a weekend affair, as a half of all urbanites also stock up midweek.
As 2 in 5 shop mostly for convenience throughout the week, the top-up shop is now an established behaviour. What’s more, shoppers’ habits suggest they’re constantly on the lookout for inspiration– more than half think about the groceries they need whilst out and about.
Consumers have good intentions, and try to maintain a balance and sustain a healthy lifestyle. However, often under time pressure, this can be a challenge.
Touchpoints data suggests the daily commute is the time when people are most likely to be thinking about their meals. Therefore, advertisers have a golden opportunity to lend people a helping hand in the decision-making process and Exterion Media assets can enable them to reach the right audiences, at the right time.
Our online dashboards house a wealth of data that has been gathered from the urban audience through the work.shop.play. surveys. Updated on a monthly basis, the data can be segmented by more than 40 different audience breaks.
To find out more - insight.exterionmedia.co.uk
Exterion Media Dashboards
Exterion Media Case StudiesThere are over 80 campaign effectiveness case studies available on our website, illustrating the effectiveness of our assets across a wide range of categories, formats & regions.
To find out more - http://www.exterionmedia.com/uk/be-inspired/case-studies/

USING DATAFor Targeting

USING DATA FOR Targeting
Reaching convenienceshoppers near their homes
Reaching convenienceshoppers near their homes
Building top of mind awareness in proximity to stores
Using mobile digital footprints to optimise station selections
37 38
Sources: work.shop.play. survey 3, work.shop.play. survey 6, work.shop.play. survey 11, work.shop.play. survey 13, TGI, Experian Mosaic, Retail Locations, Government Workplace Zoning Data
urbanites mostly shop for food in convenience stores during the week
pick up lunch on the go at least once a
week
review or add items to their grocery lists whilst
out and about
urbanites do one big weekly shop in-store and
top-up with essentials
In this example, using TGI’s Shopper Archetypes and
Experian Mosaic, we were able understand who our audience
are and map out where they live.
Using Government Workplace data, we can profile London’s Workplace
zones to identify hotspots of workplaces, even by profession.
Telefonica data enables us to determine devices which, for instance, are frequently
using Grocery/Recipe websites or apps and identify the stations which deliver the most of
these audience, by time of day.
Using Retail Locations data, we can map out London Underground
stations to target commuters in proximity of particular stores.
Residential Audience Segmentation: Top-up Shoppers
London’s Workplace ZonesExample: Stores within 15min Walking Time Stockwell LU Station
2 in 5 1 in 2 29%1 in 3

CASE STUDIESCreative Gallery
AND

LONDON UNDERGROUNDDriving response amongst commuters
Improving Perceptions
In June 2015, an Online Supermarket ran a
campaign which aimed to place its brand front of mind with
commuters
Launch Platform
In 2015, a Breakfast Drink brand ran a Bus
advertising campaign to raise national awareness
of its new product
Increasing Consideration
In November 2014, an FMCG brand wanted to promote their Breakfast Bar and drive purchase
amongst commuters
Driving Action
In October 2015, a household brand ran a Bus
advertising campaign to raise national awareness of
their new Chocolate Bar
Driving Action
In November 2014, a Household Tea brand
wanted to promote their award-winning green
tea and engage London commuters
Driving Action
In November 2014, a nationwide Sandwich Shop wanted to drive awareness of their new lunch offering, and increase store footfall
in London
Click here to access over 80 ad-effectiveness case studies available on the Exterion Media website.
of those who recalled the ads thought this Online Supermarket was better than other online grocers
(vs. 13% who did not recall).
of people who recalled the ads said they would like to try the Breakfast Drink (vs. 24% of those who did not recall the bus ads).
of those who remembered the ads were non - cereal
bar eaters and half said they puchased the
Breakfast Bar.
of people who recalled the Bus ads went on to buy the Chocolate Bar
for them or for someone else (vs.11% who did not
recall).
of people exposed to the brand’s digital
Underground campaign are now likely to purchase their products (vs. 36%
control).
of those who saw the Bus ads visited the Sandwich
Shop during the two-week campaign (vs. 26% who
did not recall).
click here for more details click here for more detailsclick here for more details click here for more detailsclick here for more details click here for more details
39% 51%86% 40%57% 54%
41 42
Sources: Dipsticks Ad-effectiveness Research, Online supermarket Jun 2015, Breakfast bar Nov 2014, Household tea brand Nov 2014 Sources: Dipsticks Ad-effectiveness Research, Online supermarket Jun 2015, Breakfast bar Nov 2014, Household tea brand Nov 2014
BusDriving action on the high street

43 44
CREATIVE Gallery

45 46
LIST OF SurveysThis report includes findings from 17 surveys which ran across the work.shop.play. community:
work.shop.play. survey 1: Urban Snacking - Apr 2013work.shop.play. survey 2: Supermarket Sweep – Jul 2014work.shop.play. survey 3: Urban Food - Aug 2014work.shop.play. survey 4: Inside: Fast Food - Oct 2014work.shop.play. survey 5: Inside: Fitness For the Summer – Jun 2015work.shop.play. survey 6: Supermarket Sweep – Jul 2015work.shop.play. survey 7: Food Video Task – Jul 2015work.shop.play. survey 8: 3 Things in August – Aug 2015work.shop.play. survey 9: Ready, Steady, Cook! – Aug 2015work.shop.play. survey 10: Rugby World Cup and Health – Sep 2015work.shop.play. survey 11: Quick Fire Wednesday: Halloween – Sep 2015work.shop.play. survey 12: High Street Survey – Sep 2015work.shop.play. survey 13: Time to Power Up - Oct 2015work.shop.play. survey 14: Pre-Christmas Survey – Dec 2015work.shop.play. survey 15: State of The Nation - Dec 2015work.shop.play. survey 16: Inside: Fancy an ice cream sundae? – Feb 2016work.shop.play. survey 17: One minute Monday - Jul 2016 The ad-effectiveness insights included in this report were sourced from 9 bespoke research projects conducted in association with Dipsticks Research:
Dipsticks survey 1: Online Takeaway Provider – Oct 2014Dipsticks survey 2: Coffee Shop – Nov 2014Dipsticks survey 3: Sandwich Store – Nov 2014Dipsticks survey 4: Breakfast Bar – Nov 2014Dipsticks survey 5: Large Supermarket – Nov 2014Dipsticks survey 6: Breakfast Drink – Mar 2015Dipsticks survey 7: Online Supermarket – Jun 2015Dipsticks survey 8: Convenience Supermarket – Aug 2015Dipsticks survey 9: Chocolate Bar – Oct 2015

[email protected]@exterionmedia.co.uk