edk ii performance optimization guide - github · 8.3.4 enable spi prefetching ... this version of...
TRANSCRIPT

EDK II Performance Optimization Guide
February, 2010Revision 1.0

Acknowledgements
THIS SPECIFICATION IS PROVIDED "AS IS" WITH NO WARRANTIES WHATSOEVER, INCLUDING ANY WARRANTY OF MERCHANTABILITY, NONINFRINGEMENT, FITNESS FOR ANY PARTICULAR PURPOSE, OR ANY WARRANTY OTHERWISE ARISING OUT OF ANY PROPOSAL, SPECIFICATION OR SAMPLE. Intel products are not intended for use in medical, life saving, or life sustaining applications.
Intel may make changes to specifications and product descriptions at any time, without notice.
Designers must not rely on the absence or characteristics of any features or instructions marked "reserved" or "undefined." Intel reserves these for future definition and shall have no responsibility whatsoever for conflicts or incompatibilities arising from future changes to them.
A license is hereby granted to copy and reproduce this specification for internal use only.
No other license, express or implied, by estoppel or otherwise, to any other intellectual property rights is granted herein.
Intel disclaims all liability, including liability for infringement of any proprietary rights, relating to use of information in this specification. No license, express or implied, by estoppel or otherwise, to any intellectual property rights is granted herein.
Intel and the Intel logo are trademarks or registered trademarks of Intel Corporation or its subsidiaries in the United States and other countries.
*Other names and brands may be claimed as the property of others.
Copyright © 2009 - 2010, Intel Corporation. All rights reserved.

Revision History
Revision Revision History Date
0.1 Initial draft - Measurement Methodologies. June 2009
0.3.3 Incorporate Review comments January 2010
1.0 First Release February 2010
i February, 2010 Version 1.0

Performance Optimization
ii February, 2010 Version 1.0

CONTENTS
1 Introduction..................................................................................................... 11.1 Overview ........................................................................................................................... 11.2 Target Audience................................................................................................................ 21.3 Document Organization .................................................................................................... 21.4 Related Information........................................................................................................... 31.5 Terms................................................................................................................................ 31.6 Conventions Used in this Document................................................................................. 7
1.6.1 Pseudo-Code Conventions ................................................................................... 71.6.2 Typographic Conventions ..................................................................................... 7
2 Measurement Methodologies ........................................................................ 92.1 Software-Based Measurement ......................................................................................... 9
2.1.1 Tracing .................................................................................................................. 92.1.2 Statistical Profiling (SW)...................................................................................... 102.1.3 Measured Profiling .............................................................................................. 10
2.2 Hardware-Based Measurements .................................................................................... 102.2.1 Statistical Profiling (HW) ..................................................................................... 102.2.2 Logic Analyzers................................................................................................... 112.2.3 Elapsed Time Counters....................................................................................... 112.2.4 JTAG Based Debuggers ..................................................................................... 11
3 EDK II Facilities............................................................................................. 133.1 Overview ......................................................................................................................... 133.2 Trace Instrumentation ..................................................................................................... 133.3 Profiling Instrumentation ................................................................................................. 143.4 Instrumenting the Phases ............................................................................................... 16
3.4.1 SEC..................................................................................................................... 163.4.2 PEI ...................................................................................................................... 163.4.3 DXE..................................................................................................................... 173.4.4 BDS..................................................................................................................... 173.4.5 EFI Applications .................................................................................................. 173.4.6 OS Load and S3 Resume ................................................................................... 17
4 Dp Reporting Utility...................................................................................... 194.1 Description ...................................................................................................................... 194.2 Report Structure.............................................................................................................. 194.3 Common Report Features .............................................................................................. 20
4.3.1 Options................................................................................................................ 204.3.2 Report Heading ................................................................................................... 204.3.3 Statistics.............................................................................................................. 21
4.4 Grouped Reports ............................................................................................................ 21
iii February, 2010 Version 1.0

Performance Optimization
4.4.1 Major Phases ...................................................................................................... 214.4.2 Drivers by Handles.............................................................................................. 214.4.3 PEIMs.................................................................................................................. 224.4.4 General ............................................................................................................... 234.4.5 Cumulative .......................................................................................................... 23
4.5 Sequential Trace Reports ............................................................................................... 234.6 Raw Trace Reports ......................................................................................................... 24
5 Instrumenting the Code ............................................................................... 275.1 Establishing a Build Target ............................................................................................. 275.2 Editing the DSC file......................................................................................................... 275.3 Synchronize DP’s Timer Library ..................................................................................... 285.4 Editing a Module’s INF file .............................................................................................. 295.5 Adding Instrumentation ................................................................................................... 295.6 Controlling the Instrumentation ....................................................................................... 31
6 EDK II Performance Infrastructure.............................................................. 336.1 PCD Entries .................................................................................................................... 336.2 Library Classes ............................................................................................................... 33
6.2.1 PerformanceLib................................................................................................... 336.2.2 TimerLib .............................................................................................................. 346.2.3 ProfileLib ............................................................................................................. 35
7 Strategies ...................................................................................................... 377.1 Establish Goals ............................................................................................................... 387.2 Measure Performance .................................................................................................... 38
7.2.1 What to Measure................................................................................................. 387.2.2 Instrumenting the Code....................................................................................... 397.2.3 Gathering Statistics ............................................................................................. 39
7.3 Analyze Results .............................................................................................................. 39
8 Lessons Learned .......................................................................................... 418.1 Lessons by Phase........................................................................................................... 41
8.1.1 SEC Phase.......................................................................................................... 418.1.2 PEI Phase ........................................................................................................... 418.1.3 DXE Phase.......................................................................................................... 428.1.4 BDS Phase.......................................................................................................... 42
8.2 Cache.............................................................................................................................. 428.2.1 Enable code cache for boot block ....................................................................... 428.2.2 Configure C,D,E,F segments as WP................................................................... 438.2.3 Enable Caching of Flash ..................................................................................... 43
8.3 Flash ............................................................................................................................... 438.3.1 Be careful of all Flash-access operations ........................................................... 438.3.2 Do things in memory rather than in Flash ........................................................... 44
iv February, 2010 Version 1.0

8.3.3 S3 Resume: Access NV Storage as Little as Possible in Pre-Mem.................... 448.3.4 Enable SPI prefetching ....................................................................................... 448.3.5 Decompress FvMain block in memory ................................................................ 44
8.4 Drivers............................................................................................................................. 448.4.1 Avoid Legacy drivers/devices whenever possible............................................... 448.4.2 BiosVideo Driver Enhancement .......................................................................... 448.4.3 Keyboard Driver Enhancement ........................................................................... 45
8.5 Memory ........................................................................................................................... 458.5.1 Memory operation algorithms.............................................................................. 458.5.2 S3 Resume: Memory-related Operations............................................................ 468.5.3 BKMs to choose proper algorithms ..................................................................... 468.5.4 Shadow PEIMs after Memory Discovered .......................................................... 478.5.5 Shadow the PEI core .......................................................................................... 478.5.6 Run More Code in Post-Mem than in Pre-Mem .................................................. 48
8.6 HOBs .............................................................................................................................. 488.6.1 Reduce the number of FV Hobs.......................................................................... 488.6.2 Report CPU BIST as a Hob ................................................................................ 48
8.7 Boot Mode Utilization ...................................................................................................... 488.7.1 Minimal Configuration Path for Fast Boot ........................................................... 488.7.2 S3 Resume Boot Path......................................................................................... 498.7.3 PEI Dependency Expressions............................................................................. 508.7.4 Avoid PEG Training in S3 ................................................................................... 51
8.8 Debug Output.................................................................................................................. 518.8.1 PeiReportStatusCode ......................................................................................... 51
8.9 MP Configuration ............................................................................................................ 518.9.1 Use CPU number for synchronization................................................................. 51
8.10 General Coding Issues ................................................................................................. 528.10.1 Code Alignment Issue ....................................................................................... 528.10.2 Predicate Expressions ...................................................................................... 538.10.3 Structure Member Alignment ............................................................................ 54
A Sample Grouped Report ............................................................................... 55
B Sample Sequential Report ........................................................................... 59
C Sample Raw Report ...................................................................................... 61
D Pre-defined Measurements .......................................................................... 63
v February, 2010 Version 1.0

Performance Optimization
vi February, 2010 Version 1.0

vii February, 2010 Version 1.0
Figures
Figure 1. Report Heading 20Figure 2. Statistics Report Sample 21Figure 3. Major Phases Report Sample 21Figure 4. Drivers by Handle Report Sample 22Figure 5. PEIMs Report Sample 22Figure 6. General Section Report Sample 23Figure 7. Cumulative Report Sample 23Figure 8. Temporal Relationships 24Figure 9. Measurement Hierarchy 24Figure 10. Raw Trace Excerpt 25Figure 11. Minimal Configuration Path 49

Performance Optimization
viii February, 2010 Version 1.0
Tables
Table 1. C,D,E,F segments Caching Impact .................................................................... 45Table 2. Recommended Memory Operation Algorithms .................................................. 46Table 3. MdeModulePkg Measurement Points ................................................................ 63Table 4. IntelFrameworkModulePkg Measurement Points............................................... 64
Introduction
1Introduction
Failure caused by poor performance renders a system just as useless as failure caused by functional errors, and can be even more expensive to correct. This paper focuses on techniques and methodologies which can be used to characterize and optimize the performance of EDK II based firmware.
Performance Optimization, within the context of this paper, consists of those procedures and techniques needed to identify and remediate problems contributing to excessive boot and execution times.
In order to identify problem areas, one must be able to measure initial performance as well as performance during and after optimization. Depending upon the type of code being measured -- execution phases, device drivers, library routines, etc. -- several different measurement methodologies may be needed.
Once the measurements have been gathered, it is necessary to interpret the data and gain an understanding of what sections of the code are consuming excessive amounts of time. Suspect code must be examined and understood in order to determine if it is, in fact, taking too much time. Often, it will be necessary to take additional measurements, with finer granularity, as one narrows in on the problem.
When the problematic areas of the firmware have been identified, various processes and techniques are employed to reduce the execution time.
This is a highly iterative process, as described in Chapter 7, Strategies, consisting of two major loops:
1. Measure - Analyze; the inner loop which narrows in on the problem2. Measure - Analyze - Optimize; the outer loop used to validate optimizations and
measure the real improvement.
Once an area meets its performance goals, the focus can move to the next most valuable optimization candidate.
1.1 OverviewWithin this paper; measurement methodologies, analysis techniques, and firmware optimization strategies will be discussed. Performance measurement tools provided by EDK II will be described as well as how to interpret their output. Finally, a number of Best Known Methods (BKMs) for optimization will be provided.
Factors such as CPU speed, overall system design, FLASH device performance, or other hardware artifacts can affect measured performance as much as algorithm selection and firmware implementation quality. These factors will be discussed further in Chapter 7, Strategies.
This version of the EDK II Performance Optimization Guide describes the state-of-the-art of performance measurement in EDK II and introduces the EDK II performance display and reporting utility, “Dp”.
1 February, 2010 Version 1.0

Performance Optimization
The code base referenced by this document is based upon subversion revision 9680 from the EDK II repository on www.tianocore.org.
1.2 Target AudienceThis document is intended for persons doing EFI firmware development and support, using EDK II, as well as development and support for distributable modules. In addition to general information applicable to all developers, specifically targeted information is provided for:
Silicon Vendors in order to assist with making performance related hardware design trade-offs as well as producing performance optimized drivers.
Firmware Vendors and development Engineers to help ensure that their products meet performance goals.
Operating System Vendors to provide visibility into how the firmware affects OS performance and to facilitate the optimization of OS loaders and interactions with EFI Runtime services.
1.3 Document OrganizationThere are three major parts of this guide: Overview, Infrastructure, and Strategies. Part one, Overview, is composed of Chapter 1 and Chapter 2. These chapters define the scope of the paper as well as providing important background information required for performance measurement or optimization of any firmware system.
Infrastructure, Part two, includes Chapters 3 through 5 and describes the facilities present within the EDK II firmware which facilitate performance measurement and analysis. After describing EDK II’s instrumentation features and their relationship to the firmware’s execution chronology; the Performance Reporting utility, Dp, is described. Part 2 concludes with a discussion of EDK II’s internal constructs relating to performance.
The third and final part of this paper is made up of Chapters 6, 7, and 8; which cover strategies and Best Known Methods for performance measurement and optimization within EDK II.
Chapter 1, Introduction, provides the background information needed to understand key concepts within the remainder of this paper as well as the EDK II firmware. It lays out the scope of information to be presented, and continues with basic definitions. The various firmware and software development roles that the paper targets are then described. Chapter 1 finishes with a description of the typographic conventions which will be encountered throughout the paper.
Chapter 2, Measurement Methodologies, outlines several techniques used for various types of performance measurements.
Chapter 3, EDK II Facilities, describes features provided by EDK II for instrumenting one’s code and gathering performance statistics.
Chapter 4, Dp Reporting Utility, is EDK II’s performance reporting facility. Dp is described along with general methods for interpreting its output.
Chapter 5, Instrumenting the Code, provides guidance for the changes necessary to add performance instrumentation to existing EDK II based code.
2 February, 2010 Version 1.0

Introduction
Chapter 6, EDK II Performance Infrastructure, provides an overview of EDK II’s low-level performance measurement implementation.
Chapter 7, Strategies, begins by describing the general process for performance optimization. Next, strategies for specific scenarios are provided.
Chapter 8, Lessons Learned, is a collection of techniques developed and used during the development of EDK I which may have applicability to EDK II.
Appendix A, Sample Grouped Report, provides a complete report generated by the Dp utility on a sample platform.
Appendix B, Sample Sequential Report, shows a sequential report with the default interest threshold, -t, and record number, -n, limits.
Appendix C, Sample Raw Report, illustrates a default raw report. This report type shows the actual values recorded for each measurement record.
Appendix D, Pre-defined Measurements, describes the instrumentation that already exists in the standard EDK II release.
1.4 Related InformationThe following publications and sources of information may be useful to you or are referred to by this specification:
Unified Extensible Firmware Interface Specification, Version 2.1, Unified EFI, Inc, 2006, http://www.uefi.org.
Platform Initialization Specification, Version 1.1, Unified EFI, Inc., 2008, http://www.uefi.org.
The following publications are available at www.TianoCore.org:
EDK II Module Writers Guide, Intel, 2009 EDK II Module Development Environment Package Library Specification, Intel,
2009. EDK II Platform Configuration Database Architecture Specification, Intel, 2006. EDK II C Coding Standards Specification, Intel, 2009. EDK II DEC File Specification, Intel, 2008. EDK II DSC File Specification, Intel, 2008. EDK II Build Specification, Intel, 2008. EDK II User's Guide, Intel, 2008.
Code documentation for the MdePkg, MdeModulePkg, IntelFrameworkPkg, and IntelFrameworkModulePkg packages, in CHM format, is available in the EDK II Docs and Files repository under the Releases category. http://sourceforge.net/projects/edk2/files/
1.5 TermsThe following terms are used throughout this document:
BDSFramework Boot Device Selection phase.
3 February, 2010 Version 1.0
Performance Optimization
BNFBNF is an acronym for “Backus Naur Form.” John Backus and Peter Naur introduced, for the first time, a formal notation to describe the syntax of a given language.
ComponentAn executable image. Components defined in this specification support one of the defined module types.
DXEFramework Driver Execution Environment phase.
DXE SALA special class of DXE module that produces SAL Runtime Services. DXE SAL modules differ from DXE Runtime modules in that the DXE Runtime modules support Virtual mode OS calls at OS runtime and DXE SAL modules support intermixing Virtual or Physical mode OS calls.
DXE SMMA special class of DXE module that is loaded into the System Management Mode memory.
DXE RuntimeSpecial class of DXE module that provides Runtime Services
EBNFExtended “Backus-Naur Form” meta-syntax notation with the following additional constructs: square brackets “[…]” surround optional items, suffix “*” for a sequence of zero or more of an item, suffix “+” for one or more of an item, suffix “?” for zero or one of an item, curly braces “{…}” enclosing a list of alternatives and super/subscripts indicating between n and m occurrences.
EDK Compatibility Package (ECP)The EDK Compatibility Package (ECP) provides libraries that will permit using most existing EDK drivers with the EDK II build environment and EDK II platforms.
EFIGeneric term that refers to one of the versions of the EFI specification: EFI 1.02, EFI 1.10, UEFI 2.0 or UEFI 2.1.
FrameworkIntel® Platform Innovation Framework for EFI consists of the Foundation, plus other modular components that characterize the portability surface for modular components designed to work on any implementation of the Tiano architecture.
GUIDGlobally Unique Identifier. A 128-bit value used to name entities uniquely. A unique GUID can be generated by an individual without the help of a centralized authority. This allows the generation of names that will never conflict, even among multiple, unrelated parties. GUID values can be registry format (8-4-4-4-12) or C data structure format.
Library ClassA library class defines the API or interface set for a library. The consumer of the library is coded to the library class definition. Library classes are defined via a library class .h file that is published by a package.
Library InstanceAn implementation of one or more library classes.
ModuleA module is either an executable image or a library instance. For a list of module types supported by this package, see module type.
4 February, 2010 Version 1.0

Introduction
Module TypeAll libraries and components belong to one of the following module types: BASE, SEC, PEI_CORE, PEIM, DXE_CORE, DXE_DRIVER, DXE_RUNTIME_DRIVER, DXE_SMM_DRIVER, DXE_SAL_DRIVER, UEFI_DRIVER, or UEFI_APPLICATION. These definitions provide a framework that is consistent with a similar set of requirements. A module that is of module type BASE, depends only on headers and libraries provided in the MDE, while a module that is of module type DXE_DRIVER depends on common DXE components. For a definition of the various module types, see module type.
PackageA package is a container. It can hold a collection of files for any given set of modules.Packages may contain Source Modules, containing all source files and descriptions of a module; or Binary Modules, containing PI FFS Sections and a description file specific to linking and binary editing of features and attributes or both Binary and Source modules.Multiple modules can also be combined into a package. Multiple Packages can also be Bundled into a single Distribution Package.
ProtocolAn API named by a GUID as defined by the EFI specification.
PCDPlatform Configuration Database.
PCD C NameThe symbolic name for a PCD Token that follows the ANSI C naming conventions for the name of a variable.
PCD ElementA single configurable element within the Platform Configuration Database, uniquely identified by a Token Space GUID and Token Number.
PCD Token Space GUIDThe GUID value associated with a group of PCD Tokens. Using a GUID allows vendors to allocate their own Token Numbers for configuration elements that apply to their own modules, libraries or platforms without a centralized allocator. Within the Distribution Description file, a PCD Token Space GUID is referred to using the PCD Token Space GUID C Name.
PCD Token Space GUID C NameA symbolic name for a PCD Token Space GUID value that follows the ANSI C naming conventions for the name of a variable.
PEIPre-EFI Initialization Phase.
Platform Configuration Database (PCD)The collection of PCD elements that can be configured when building modules, libraries, or platform firmware images. These elements are identified by a Token Space GUID and Token Number. PCD elements are declared in packages by Package Developers. Modules Developers use PCD elements in the design of their modules to increase the portability of their modules to a wider array of platform targets. Platform Integrators set the values of PCD elements based on specific platform requirements. A Platform Integrator has many options when configuring PCDs for a specific platform. They may configure PCD elements to be set to static values at build time. They may also configure PCD elements so the binary image of a Module may be patched prior to integration into platform firmware images. They may also configure PCD elements so the binary image of platform firmware may be patched. They may also configure PCD elements so they can be accessed at runtime through the PCD services described in the PI 1.2 Specification.
5 February, 2010 Version 1.0
Performance Optimization
PPIA PEIM-to-PEIM Interface that is named by a GUID as defined by the PEI CIS.
Runtime ServicesInterfaces that provide access to underlying platform-specific hardware that might be useful during OS runtime, such as time and date services. These services become active during the boot process but also persist after the OS loader terminates boot services.
SECSecurity Phase is the code that contains the processor reset vector and launches PEI. This phase is separate from PEI because some security schemes require ownership of the reset vector.
UEFI ApplicationAn application that follows the UEFI specification. The only difference between a UEFI application and a UEFI driver is that an application is unloaded from memory when it exits regardless of return status, while a driver that returns a successful return status is not unloaded when its entry point exits.
UEFIUnified Extensible Firmware Interface
UEFI DriverA driver that follows the UEFI specification.
UEFI SpecificationThe UEFI Specification describes an interface between the operating system (OS) and the platform firmware. UEFI was preceded by the Extensible Firmware Interface Specification 1.10 (EFI). This specification is released by the Unified EFI Forum.This document references the UEFI Specification 2.1, with errata.
UEFI Platform Initialization SpecificationThis specification defines the core code and services that are required for an implementation of UEFI compliant firmware. The Platform Initialization Specification is divided into volumes to enable logical organization, future growth, and printing convenience. The Platform Initialization Specification consists of the following volumes:
• VOLUME 1: Pre-EFI Initialization Core Interface, defines the core code and services that are required for an implementation of the Pre-EFI Initialization (PEI) phase of the Platform Initialization (PI) specifications (hereafter referred to as the “PI Architecture”).
• VOLUME 2: Driver Execution Environment Core Interface, defines the core code and services that are required for an implementation of the driver execution environment (DXE) phase of the Unified Extensible Firmware Interface (UEFI) Foundation.
• VOLUME 3: Shared Architectural Elements, describes the basic concepts behind Plat-form Initialization (PI) firmware storage and Hand-Off Blocks implementation.
• VOLUME 4: System Management Mode, describes the optional SMM phase, which starts during the DXE phase and runs in parallel with the other PI Architecture phases into runtime.
• VOLUME 5: Standards, define the core code and services that are required for an implementation of the System Management Bus (SMBus) Host Controller Protocol and System Management Bus (SMBus) PEIM-to-PEIM Interface (PPI).
Each volume should be viewed in the context of all other volumes, and readers are strongly encouraged to consult the entire specification when researching areas of interest.This document references UEFI PI Specification 1.1.
Unified EFI ForumA non-profit collaborative trade organization formed to promote and manage the UEFI standard. For more information, see www.uefi.org.
6 February, 2010 Version 1.0
Introduction
1.6 Conventions Used in this DocumentThis document uses the typographic and illustrative conventions described below.
1.6.1 Pseudo-Code ConventionsPseudo code is presented to describe algorithms in a more concise form. None of the algorithms in this document are intended to be compiled directly. The code is presented at a level corresponding to the surrounding text.
In describing variables, a list is an unordered collection of homogeneous objects. A queue is an ordered list of homogeneous objects. Unless otherwise noted, the ordering is assumed to be FIFO.
Pseudo code is presented in a C-like format, using C conventions where appropriate. The coding style, particularly the indentation style, is used for readability and does not necessarily comply with an implementation of the UEFI Specification.
1.6.2 Typographic ConventionsThis document uses the typographic and illustrative conventions described below:
Plain text The normal text typeface is used for the vast majority of the descriptive text in a specification.
Plain text (blue) Any plain text that is underlined and in blue indicates an active link to the cross-reference. Click on the word to follow the hyperlink.
Bold In text, a Bold typeface identifies a processor register name. In other instances, a Bold typeface can be used as a running head within a paragraph.
Italic In text, an Italic typeface can be used as emphasis to introduce a new term or to indicate a manual or specification name.
BOLD Monospace Computer code, example code segments, and all prototype code segments use a BOLD Monospace typeface with a dark red color. These code listings normally appear in one or more separate paragraphs, though words or segments can also be embedded in a normal text paragraph.
Bold Monospace Words in a Bold Monospace typeface, that is underlined and in blue, indicate an active hyperlink to the code definition for that function or type definition. Click on the word to follow the hyperlink.
Italic Monospace In code or in text, words in Italic Monospace indicate placeholder names for variable information that must be supplied (i.e., arguments).
$(VAR) The symbol VAR defined by the utility or input files.
The following typographic conventions are used in this document to illustrate the Extended Backus-Naur Form.
[item] Square brackets denote the enclosed item is optional.
{item} Curly braces denote a choice or selection item, only one of which may occur on a given line.
<item> Angle brackets denote a name for an item.
(range-range) Parenthesis with characters and dash characters denote ranges of values, for example, (a-zA-Z0-9) indicates a single alphanumeric character, while (0-9) indicates a single digit.
7 February, 2010 Version 1.0

Performance Optimization
“item” Characters within quotation marks are the exact content of an item, as they must appear in the output text file.
? The question mark denotes zero or one occurrences of an item.
* The star character denotes zero or more occurrences of an item.
+ The plus character denotes one or more occurrences of an item.
item{n} A superscript number, n, is the number of occurrences of the item that must be used. Example: (0-9)8 indicates that there must be exactly eight digits, so 01234567 is valid, while 1234567 is not valid.
item{n,} A superscript number n, followed by a comma “,” and within curly braces, indicates the minimum number of occurrences of item, with no maximum number of occurrences.
item{,n} A superscript number, n, preceded by a comma “,” and within curly braces, indicates a maximum number of occurrences of item.
item{n,m} A super script number, n, followed by a comma “,“ and a number, m, with both enclosed within curly braces, indicates that the number of occurrences can be from n to m occurrences of item, inclusive.
8 February, 2010 Version 1.0

Measurement Methodologies
2Measurement Methodologies
There is no sense being precise about somethingwhen you do not even know what you are talking about.
John von Neumann
Before one can begin actual firmware optimization, it is necessary to know which areas of the code are consuming unreasonable amounts of time. In order to do this, the system’s performance must be measured. The various techniques used to take these measurements are referred to as measurement methodologies.
The following seven questions are critical to ensuring the validity of one’s measurement data:
1. Who collected these data? (Hopefully people who are trained in proper data collection techniques, or who have at least read this paper.)
2. How were the data collected? (Hopefully by automated means and at the same phase of the process.)
3. When were the data collected? (Hopefully all at the same time on the same day or at the same time in the process. )
4. What do the values presented mean? (Have you changed the process recently? Do these values really tell you what you want or need to know?)
5. How were these values computed from raw inputs? (Have you computed the data to arrive at the results you want, or to accurately depict the true voice of the process?)
6. What formulas were used? (Are they measuring what we need to measure? Are they working? Are they still relevant?)
7. Are we collecting the right data, and are we collecting the data right? (The data collected should be consistent, and the way data are collected should be consistent. Do the data contain the correct information for analysis?)
This chapter provides the basis for answering the first six questions. Question 7 is addressed in Chapter 7, Strategies.
The primary focus of this document will be Software-Based Measurement.
2.1 Software-Based MeasurementSoftware-based measurement methodologies add specialized software to the code base. This software is then used to instrument the code and gather performance data. There are two main types of software-based performance measurement: Tracing and Profiling. The two predominant types of profiling are Statistical Profiling and Measured Profiling.
2.1.1 TracingTracing produces a new record for each invocation of the measured code. It can provide chronological, context-specific, information about execution times of measured code regions, whereas profiling collects information for each measured region which is
9 February, 2010 Version 1.0

Performance Optimization
an aggregate of all invocations of the measured region.
Tracing can potentially consume significant resources depending upon the number of measurement points and how many times each measurement point is invoked.
2.1.2 Statistical Profiling (SW)Software based statistical profiling uses a periodic interrupt to periodically sample the processor state in order to determine where the processor is executing. That information is then correlated with firmware load maps to identify routines and modules. An advantage of this method is that once the sampling infrastructure is in place, it is not necessary to further modify the code in order to gather information. This allows measurements to be made post-production. Disadvantages include the coarse granularity of both measurement locality and times as well as the necessity of having access to load maps in order for the measurements to be meaningful.
2.1.3 Measured ProfilingMeasured profiling relies upon code, inserted at strategic locations within the firmware, which gathers performance information at runtime. Fine grained measurements can be achieved, within the limits of the time source, and correlation of measurements to source code is exact. Two variants of measured profiling are discussed here: Cumulative Profiling, and Min-Max Profiling.
2.1.3.1 Cumulative Profiling
In Cumulative Profiling, a name, cumulative time and invocation count is kept for each profiled region. Upon entry to the region, a time stamp is collected. When the region is exited, a new time stamp is collected, the starting time subtracted from it, and the remainder added to the cumulative execution time for the named region. For each execution of the region, the invocation count is incremented.
The invocation count allows one to extract two important pieces of information: total time and average time spent executing the measured code.
2.1.3.2 Min-Max Profiling
Min-Max profiling adds Minimum and Maximum time recording to the Cumulative Profiling operations. This type of profiling is suitable for measurement of operations that (may) take a variable amount of time to execute depending upon external factors – e.g. table lookup, device drivers for mechanical devices, …
2.2 Hardware-Based MeasurementsSome activities may require greater precision or finer time granularity than the internal timers can provide. In this case there are several techniques that can be used to facilitate time measurements using hardware devices.
2.2.1 Statistical Profiling (HW)Hardware based statistical profiling uses external hardware to periodically sample the
10 February, 2010 Version 1.0
Measurement Methodologies
processor state in order to determine where the processor is executing. That information is then correlated with firmware load maps to identify routines and modules. An advantage of this method is that it is not necessary to modify the code in order to gather information. This allows measurements to be made post-production. Disadvantages include the coarse granularity of both measurement locality and times as well as the necessity of having access to load maps in order for the measurements to be meaningful. These disadvantages are mitigated by certain emulator and debug hardware which can display time information alongside source code listings.
Logic Analyzers and JTAG Based Debuggers are among the most popular tools for hardware based Statistical Profiling.
2.2.2 Logic AnalyzersA logic analyzer, if it can be connected to the correct signals, can be an extremely flexible and useful tool. It can be set up to measure between addresses or almost any other event. The drawback is that all of the address, control, and data lines necessary to recognize the event must be accessible so that the logic analyzer can be connected to them. Logic analyzers also have a relatively limited number of events they can record before new data starts pushing out the old.
In order to make the logic analyzer more selective, it is possible to embed instructions within the code which toggle an easily accessible signal. By measuring or accumulating the duration of each toggle the execution time of the target code can be determined. Drawbacks to this method include the necessity to embed the instructions beforehand; availability of an easily accessible output port, or bit, for this use; and the need to use a different signal for each region to be measured.
The toggled signal can also be used as a trigger input to the logic analyzer. This allows data acquisition to be limited to specific points in time which permits much more relevant data to be stored in the analyzer.
2.2.3 Elapsed Time CountersInstead of using a logic analyzer, it is possible to use an event or elapsed time counter to measure the duration of the bit toggle. This equipment is easier to manage and set up than a logic analyzer but does not have the same flexibility.
2.2.4 JTAG Based DebuggersJTAG based debugging solutions can be used to make several different types of timing measurements. Each debugger provides different capabilities ranging from time annotated source code traces to measurement of the time spent executing between two addresses or resource accesses. Some debuggers have provision for external trigger inputs allowing targeted measurement capabilities similar to that provided by Logic Analyzers or Elapsed Time Counters.
11 February, 2010 Version 1.0

Performance Optimization
12 February, 2010 Version 1.0

EDK II Facilities
3EDK II Facilities
3.1 OverviewThe EDK II firmware provides both tracing and measured profiling capabilities, each accessed via two macros; one for starting measurement and one for ending the measurement. The start and end times, in timer ticks, for the region between the two macros is then saved in a list in memory which records the measurement’s name and times. Each invocation of the pair of trace macros creates a new record in the list, thus providing a chronological record of invocation and associated timing. Invocations of the profiling macros result in the cumulative time being updated in a single record associated with that measurement.
Use of the trace macros can impose a relatively high overhead during the DXE phase due to the process of searching and managing the list of measurement records. For coarse-grain measurements of code regions that are not executed frequently – tens of invocations as opposed to hundreds or thousands – the overhead is negligible.
Overhead imposed by the profiling macros is less than that of the trace macros, primarily due to a reduction in processing required for each measurement.
The time stamps are taken at the end of the START and beginning of the END macros which minimizes the amount of overhead that is included within the measurement.
Tracing macros, functions, and structures are declared in MdeModulePkg\Include\Guid\Performance.h, and MdePkg\Include\Library\PerformanceLib.h. Profiling macros, functions, and structures are declared in PerformancePkg\Include\Guid\Profile.h, and PerformancePkg\Include\Library\ProfileLib.h. Declarations for the Timer Library are contained within MdePkg\Include\Library\TimerLib.h.
Detailed documentation on these files, functions, macros, and other elements can be found using the resources detailed in Section 1.4.
Subsequent sections of this chapter will describe the instrumentation macros in detail. The Phases of Execution, and their impact on instrumentation and system performance are then described.
3.2 Trace InstrumentationTrace Instrumentation is added to the code by application of two performance measurement macros: PERF_START and PERF_END. These macros work as a pair with PERF_START creating a new, open, measurement record and PERF_END closing the measurement record. If the PERF_END macro is invoked for a previously closed record, it will return a NOT_FOUND status.
Though optional, it is recommended that one always provide an identifying string for Token. This will make it easier to differentiate between the measurement records
13 February, 2010 Version 1.0

Performance Optimization
when they are analyzed. Use the Module parameter to provide additional identifying information so that each macro pair is uniquely identified. When the macro pair occurs inside a loop, such as one of the dispatchers, the Handle parameter can be used to provide further differentiation between measurements.
When instrumenting within PEI, the Token and Module strings are limited to seven significant characters each; more than that will be discarded. This is due to the limited memory resources during PEI before main memory has been initialized.
PEI also places a fixed limit on the number of measurement records that may be collected during that phase. The PCD entry, PcdMaxPeiPerformanceLogEntries, controls the number of measurement records collected during PEI.
During DXE, BDS, or later phases, the Token and Module strings may contain up to 31 characters, each.
The trace instrumentation code is designed to minimize the instrumentation overhead included within each measurement. The overhead incurred by the instrumentation code in order to search tens of thousands of trace records, which occurs on some modern platforms, has a noticeable effect on total execution time. For example, by the time the 27000th trace measurement is added, a minimum of 365 million comparisons have been done for the PERF_END macro alone.
Regardless of execution phase, the performance tracing code can be turned on or off with the use of the PcdPerformanceLibraryPropertyMask PCD entry, described in Section 7. In addition to global control of performance tracing, this PCD entry can be used to limit tracing to specific modules. This will allow the number of active trace measurements to be minimized, reducing the total time required by the instrumentation code.
3.3 Profiling InstrumentationProfiling Instrumentation is added to the code by application of two performance measurement macros: PROF_START and PROF_END. These macros work as a pair with PROF_START starting a new measurement and PROF_END completing the measurement. If PROF_START is called for a new measurement, a new record is created. Subsequent PROF_END or PROF_START invocations which use the same Token will update the record.
For example:
MyFunction( void ){ PROF_START( “MyFunction”, 0); // Body of the function PROF_END( “MyFunction”, 0); return; // The single point of return}
will count the number of times MyFunction is executed and accumulate the time spent in each invocation of the function.
14 February, 2010 Version 1.0

EDK II Facilities
Each profiling measurement will record:
The number of times the measurement is invoked The accumulated duration, in timer ticks, of each invocation The shortest duration of all invocations The longest duration of all invocations
invocations without an intervening PROF_END, when for the same measurement, will result in the second and subsequent PROF_START invocations for that measurement being ignored. The number of PROF_START invocations is counted with a matching number of PROF_END invocations required. Each PROF_END will extend the duration of that measurement until a matching number have been encountered.
For example:
PROF_START( “Foo”, 1);PROF_END( “Foo”, 10);...PROF_START( “Foo”, 21);PROF_END( “Foo”, 30);
will result in two measurements totaling 18 timer ticks being added to measurement “Foo”. The following example:
PROF_START( “Foo”, 2);PROF_START( “Foo”, 3);PROF_START( “Foo”, 5);PROF_END( “Foo”, 6);PROF_START( “Bar”, 8);PROF_END( “Bar”, 10);PROF_END( “Foo”, 11);PROF_END( “Foo”, 19);...PROF_START( “Foo”, 29);PROF_END( “Foo”, 30);
also results in two measurements totaling 18 ticks being added to measurement “Foo”. The measurement, “Bar”, is valid and does not affect measurement “Foo”.
Unlike the tracing macros, the Token argument is not optional for profiling. The Token value is the only means of identifying a profiling measurement.
For performance reasons, profiling uses fixed size databases in which to store profiling measurements. There are separate databases for PEI and for DXE and subsequent phases. The PEI and DXE database sizes are specified with the PcdMaxPeiProfileLogEntries and PcdMaxDxeProfileLogEntries PCD entries respectively.
Similar to performance tracing, profiling code can be turned on or off by use of the PcdProfileLibraryPropertyMask PCD entry.
15 February, 2010 Version 1.0

Performance Optimization
3.4 Instrumenting the PhasesEffective performance instrumentation requires knowledge of the interaction between the instrumentation macros and the firmware’s execution phase at the time the instrumented code is executed. The following sections cover these interactions and identify considerations so that the researcher may select the best instrumentation points and methodologies to meet their goals.
3.4.1 SECThis phase contains the first code executed after power-on or reset. Not only have peripherals not been initialized, but memory may not be available. The SEC phase is not particularly suitable for software-based performance measurement.
Techniques described in section 2.2, Hardware-Based Measurements, are well suited for the SEC phase.
For most platforms, SEC’s total elapsed time can be determined by measuring from “the beginning of time” to the start of PEI. This is the mechanism used by EDK II.
3.4.2 PEIThe PEI phase actually consists of two sub-phases: PreMem and PostMem. PreMem is the state before main memory is available for use and PostMem refers to the state after main memory is usable.
After SEC phase transitions to PEI phase, the firmware is in the PreMem state. At this point, some temporary memory is usually available. On some IA platforms the temporary memory is actually a portion of the processor’s cache that has been placed in a special mode. While operating in this special mode a number of restrictions exist:
Temporary memory may only be used for data storage, not instruction execution. The size of temporary memory is usually small Temporary memory will not survive enabling of caching Initialized external or static variables can not be used since they will reside within
the read-only firmware device, not temporary memory. Global constants can be used, but they must be declared as CONST and treated as read-only.
In order to store performance tracing measurements made during the PreMem portion of PEI, a HOB, with space for PcdMaxPeiPerformanceLogEntries measurement records, is dynamically created in temporary memory. A HOB is also created for profiling measurements with space for PcdMaxPeiProfileLogEntries measurement records.
As soon as memory has been initialized and is ready for use, these HOBs, and other PEI data stored in temporary memory, are copied into main memory and the PEI phase continues on in the PostMem state.
Due to memory restrictions during the PreMem state, some differences exist between performance measurements made during PEI and measurements made later.
The Token and Module strings are limited to seven significant characters in trace records. Profiling records always allow up to 15 significant characters for the Token string.
16 February, 2010 Version 1.0
EDK II Facilities
Only a fixed number of tracing measurements, specified by the PcdMaxPeiPerformanceLogEntries PCD entry, may be made.
The PcdMaxPeiProfileLogEntries PCD entry specifies the number of profiling measurements that may be made.
3.4.3 DXEOne of the first things done after PEI transitions into DXE phase is to copy the PEI Performance tracing HOB into the DXE performance tracing list. As part of the copying operation, the PEI measurement records in the Performance HOB are translated into DXE measurement records within the dynamic DXE measurement list.
The PEI Performance profiling HOB is used to initialize the DXE profiling database. This database is created large enough to contain PcdMaxPeiProfileLogEntries + PcdMaxDxeProfileLogEntries profiling measurement records.
The differences between PEI and DXE performance measurements include:
DXE allows tracing measurements to have Token and Module strings up to 31 significant characters in length.
Profiling records always allow up to 15 significant characters for the Token string. The number of performance tracing measurements is limited by the amount of
memory available and not by an arbitrary pre-defined number. There are (PcdMaxPeiProfileLogEntries + PcdMaxDxeProfileLogEntries)
- <actual number of PEI profile measurements> profiling records allowed.
3.4.4 BDSThe instrumentation facilities work the same during the BDS phase as they worked during DXE. The main difference between BDS and DXE, from a performance measurement standpoint, is that a larger number of decisions are made as to which devices to connect and use for the boot process.
BDS may also invoke a Setup Browser which is used to set and change configuration and boot options. There are human interface related delays associated with the Setup Browser that can significantly affect performance.
3.4.5 EFI ApplicationsEFI Applications, of which the EFI Shell is the most commonly known, may also gather performance information. Even if the application itself is not instrumented, the services provided by the firmware may be and will produce additional measurement records as they are accessed.
Instrumenting an EFI Application is no different than instrumenting the DXE or BDS phases.
3.4.6 OS Load and S3 ResumeAn OS Loader is a special type of EFI Application. Unlike most applications, an OS loader is expected to eventually call the firmware’s ExitBootServices() service. Unless something special is done, calling ExitBootServices() will result in the loss of the performance measurement services and data. For this reason, EDK II stores a
17 February, 2010 Version 1.0

Performance Optimization
portion of the trace performance data in a reserved memory area. Unless changed, this area is 16,384 bytes long and begins at the address recorded in EFI variable “PerfDataMemAddr” under Vendor GUID PERFORMANCE_PROTOCOL_GUID.
An S3 Resume is, from a performance measurement standpoint, similar to booting through an OS Loader. The same mechanism is used, as described above, to allow performance data to persist from the firmware into the OS environment. The EDK II firmware, internally, follows a different execution path for an S3 Resume than it does for a normal boot. When adding instrumentation, it is necessary to ensure that the correct code path is instrumented.
Not all performance measurement records are saved for the OS. First, all completed measurement records with a handle value matching one recorded in the handle database are copied into the reserved memory area. Next, completed records with a handle value of zero are copied. Due to the limited size of the storage area, only the first N records are saved. At the time of this writing, N is 460.
Performance measurement records transferred to the OS using this mechanism consist of a 28 character, NULL terminated, ASCII string and a 32-bit, unsigned, duration in milliseconds. Note that measurements with durations less than 1 millisecond are treated specially based upon the handle value: measurements with a handle value of zero are copied with a duration of zero while measurements with a non-zero handle value are not copied at all.
The techniques described in chapter 5, Instrumenting the Code, show how to restrict performance measurements to specific modules. It is strongly recommended that these techniques be used for both S3 resume and OS Loader measurements in order to ensure that only relevant measurements are made.
An operating system loader, utility, or driver may retrieve the performance data by first reading EFI variable “PerfDataMemAddr” to get the physical address of the saved data, then reading from that address to retrieve the saved performance data. The structure of this data is declared in Include/Guid/Performance.h in MdeModulePkg. The first item is a header, as declared by PERF_HEADER. The header is followed by N measurement records where each measurement record is declared by PERF_DATA. N is 460, as described above, and calculated by taking the size of the reserved region, subtracting the size of the header, then dividing by the size of PERF_DATA. Unless the EDK II code is modified, this is the same as (16384 - 1644)/32, which produces 460 with a few bytes left over.
18 February, 2010 Version 1.0

Dp Reporting Utility
4Dp Reporting Utility
4.1 Description Dp is a Shell application that generates performance reports based upon the performance data recorded by the EDK II performance infrastructure. It will dump all data contained in the performance measurement list, for all phases of execution from PEI through DXE and BDS. The performance infrastructure is responsible for preserving performance data across execution phase boundaries and ensuring that a single measurement record format is used for all records in the performance list.
The Dp application dumps the performance data for:
Each completed execution phase (SEC, PEI, DXE, BDS, Shell) Each completed PEI module, DXE and BDS driver Other instrumented code.
Invoking Dp with the ‘-?’ or ‘-h’ option displays the following help information.
Display Performance metricsdp [-b] [-v] [-x] [-s | -A | -R] [-t value] [-n count] [-h | -?] -b display on multiple pages -v display additional information -x prevent display of individual measurements for cumulative items. -s display summary information only -A display all measurements in a list -R display all measurements in raw format -t VALUE Set display threshold to VALUE microseconds -n COUNT Limit display to COUNT lines in All and Raw modes -? display dp help information
The most common usage is to invoke Dp without any options or parameters. The default behavior, if no command line options are provided, is to produce a Grouped report with a minimum elapsed time of 1ms.
4.2 Report StructureDp produces three types of reports: Grouped, Sequential, and Raw. The Grouped report is the default. A Sequential report is selected with the ‘-A’ command line option and the Raw report is selected with ‘-R’. See Appendix A for an example of a Grouped report. Appendix B provides a sample of a Sequential report and Appendix C provides a sample of a Raw report.
The Dp utility outputs a line of the form “==[ name ]==” to mark the beginning of each new section. Possible values for “name” are:
Major Phases Drivers by Handle PEIMs
General Cumulative Statistics
Sequential Trace Records RAW Trace
19 February, 2010 Version 1.0

Performance Optimization
4.3 Common Report FeaturesAll reports track both complete and incomplete measurements. Incomplete measurements are usually major phase measurements where that phase has not completed; such as the Shell phase. Since Dp is a shell application, the shell is still active while Dp is running. For this reason, it is normal for there to be two incomplete measurements. If there are more than two, there may be an error in instrumentation where the measured region exited without encountering an END macro.
There are several report sections and options that are relevant for all report types. These are detailed below.
4.3.1 Options
The -v, -x, and -t options affect the output of all reports.
-v Verbose When present, this option causes extra information to be displayed. The specific information displayed is covered in the following descriptions for the individual report sections.
-x eXclude Specifying this option excludes the individual records for cumulative measurements from the report. Accumulated values for these measurements are still given in the Cumulative section.
-t Threshold The -t option must be followed, after one or more spaces, by a number. The number specifies the minimum elapsed time, in microseconds, required for a record to be included in the report. This option is useful for filtering out measurements that are too small to be relevant to the current activity.
4.3.2 Report HeadingAll reports begin with the same two lines which identify the version of Dp being run and the frequency of the performance timer used to make the measurements.
If the ‘-v’ command line option was specified, additional lines will be displayed specifying the count range of the performance timer as well as the minimum elapsed time value used to filter out measurements too small to be “interesting”.Note that counters can count in two directions, UP or DOWN. This affects the relative magnitude of time stamps, and elapsed time calculations.
DP Build Version: 2.2System Performance Timer Frequency: 2,267,684 (KHz)System Performance Timer counts UP from 0x0 to 0xFFFFFFFFFFFFFFFFMeasurements less than 1,000 microseconds are not displayed.
Figure 1. Report Heading
Dp uses the characteristics of the counter to ensure that elapsed time calculations are done correctly for the type of counter being used.
20 February, 2010 Version 1.0

Dp Reporting Utility
4.3.3 StatisticsThe Statistics section is displayed if either the ‘-v’ or ‘-s’ option is given.
==[ Statistics ]========There were 26389 measurements taken, of which: 2 are incomplete. 4 are major execution phases. 26,319 have non-NULL handles, 70 are NULL. 15 are PEIMs. 66 are global measurements.
Figure 2. Statistics Report Sample
The values displayed are a summary of all recorded trace measurements, both complete and incomplete.
4.4 Grouped ReportsGrouped Reports are the default reporting format for Dp. As long as the -A or -R command line options are not specified, a Grouped report will be generated.
The -s, or Summary, option results in a report containing only the Major Phases and Statistics sections. If -s is present, the Statistics section will be included regardless of whether -v was specified or not.
4.4.1 Major PhasesEDK II comes with measurement code in place to gather performance metrics for the major phases of execution: SEC, PEI, DXE, BDS, and SHELL. If the duration of the phase is non-zero, the phase duration information is included in the report.
==[ Major Phases ]======== SEC Phase Duration: 174589 (us) PEI Phase Duration: 2910 (ms) DXE Phase Duration: 10050 (ms) BDS Phase Duration: 12926 (ms)Total Duration: 26060 (ms)
Figure 3. Major Phases Report Sample
Note that the duration for the SEC phase is given in microseconds, us, while other times are in milliseconds, ms. This is because the SEC phase may vary between less than and greater than one ms. Since it’s time is still significant, the time is presented in microseconds to allow greater accuracy.This section is included in all Grouped Reports. Its contents are not affected by any option.
4.4.2 Drivers by HandlesFor this section, each measurement with a handle value is compared to the firmware’s handle database. If a match is found a report entry is generated that includes:
1. Index of the matching measurement record
21 February, 2010 Version 1.0

Performance Optimization
2. Handle from the handle database matching the handle in the measurement record
3. Name of the driver the handle is associated with. This name comes from the Pdb file name which is only included for DEBUG builds. If you want this information included, make sure that you build with “-b DEBUG” or set “TARGET = DEBUG” in the target.txt file.If the Pdb file name can not be resolved, “Unknown Driver Name” will be displayed instead.
4. A description which is the value of the Token parameter from the associated performance macros.
5. The elapsed time for this measurement, in microseconds.
==[ Drivers by Handle ]========Index: Handle Driver Name Description Time(us)------------------------------------------------------------------------------- 1091: [ AC] LegacyBiosDxe StartImage: 15850 2355: [ B0] PciBusDxe DB:Start: 9955 3431: [ B5] UsbKbDxe DB:Start: 1065025924: [123] LoadImage: 356725925: [123] StartImage: 544666
Figure 4. Drivers by Handle Report Sample
For example, the third line in Figure 4 is interpreted as meaning:
Measurement 3431 is for a driver with handle B5 which is the USB Keyboard Dxe driver. The measurement is of the Start method of the driver’s Driver Binding Protocol
(DB) which took 10.65 milliseconds to execute.
The -x command-line option has a significant effect in this section since the majority of measurements reported here are covered by the Cumulative section.
4.4.3 PEIMsEvery measurement with a Token value of “PEIM” and a non-zero ending time is listed in the PEIM section of the report. Instead of a handle value, the physical address of the PEIM being measured is displayed.
==[ PEIMs ]========Index Pointer Value Instance Information Token ET (us)------------------------------------------------------------------------------- 12: 0x0000000000000000 Unknown Driver Name PEIM 4236 15: 0x0000000000000000 Unknown Driver Name PEIM 2338678
Figure 5. PEIMs Report Sample
Because there is currently no mechanism in place for determining the human-readable name of a PEIM, one may use the Handle parameter of the performance tracing macros to record identifying information. The Dp utility assumes that the physical address of the PEIM is passed in this parameter.
22 February, 2010 Version 1.0

Dp Reporting Utility
4.4.4 GeneralThe General section lists measurements that:
Are not execution phases Have NULL Handles Are complete: Both Start and End times are non-zero
Logically, this section displays all remaining measurements that weren’t displayed in the preceding sections.
==[ General ]========Index Name(GUID) Description Time(us)------------------------------------------------------------------------------- 3: PreMem 2377641 16: PostMem 525775 23: DxeMain CoreDispatcher 9544115 2274: BDS PlatformBds 12905937
Figure 6. General Section Report Sample
The Module and Token fields of the performance tracing macros provide the values for the Name and Description fields, respectively, of this report section.
4.4.5 CumulativeSeveral measurements are taken hundreds or thousands of times. It is useful to be able to see the overall effect that these measurements have instead of examining each instance. The Cumulative section facilitates this by accumulating statistics from these measurements and presenting each measurement type along with its cumulative values.
==[ Cumulative ]========(Times in microsec.) Cumulative Average Shortest Longest Name Count Duration Duration Duration Duration------------------------------------------------------------------------------- LoadImage: 131 39072 298 5 3819 StartImage: 119 14460491 121516 1 8465003 DB:Start: 118 11049390 93638 0 5552333 DB:Support: 25965 11298 0 0 99
Figure 7. Cumulative Report Sample
Only complete measurements are accumulated. Be aware that many DB:Start: measurements occur as part of the StartImage: measurement. Because of this, the sum of Cumulative Durations will usually be larger than the total elapsed time. The Raw Trace Report, described in Section 4.6, can be used to determine the temporal relationships between each trace measurement by comparing the start and end counts of the measurements of interest.
4.5 Sequential Trace ReportsThere is no direct temporal relationship between groups in a Grouped report, only between the individual measurements within a particular group. Sequential Trace Reports are used when the temporal relationship between measurements is desired,
23 February, 2010 Version 1.0

Performance Optimization
regardless of group. Each measurement displayed starts after measurements with a lower index number and before measurements with a higher index number. Only the starting relationship is shown, not the duration. There are some measurements which overlap others. For example, the following report excerpt shows measurements during the PEI phase.
==[ Sequential Trace Records ]========
Index Handle Module Token ET (us)------------------------------------------------------------------------------- 2: 0x00000000 PEI 2913812 3: 0x00000000 PreMem 2382889 4: 0x00000000 PEIM 1592 14: 0x00000000 PEIM 598 15: 0x00000000 PEIM 2343782 16: 0x00000000 PostMem 524321 17: 0x00000000 DisMem 26343 19: 0x00000000 PEIM 1064 21: 0x00000000 DXE 3322102
Figure 8. Temporal Relationships
The measurements in Figure 8 could be visualized as shown in Figure 9 in order to represent hierarchy.
+-- PEI 2913812 +-- PreMem 2382889 +-- PEIM +-- PEIM +-- PEIM +-- PostMem 524321 +-- DisMem +-- PEIM+-- DXE
Figure 9. Measurement Hierarchy
This shows that the PEI phase was divided into two main measured units: PreMem and PostMem. Each of these units are comprised of other measurements.
Note that there are approximately 6 ms. unaccounted for between the sum of the PreMem and PostMem measurements and the PEI phase duration. This is because there are two unmeasured time periods: one is between the end of the PreMem measurement and the start of the PostMem measurement, the other is between the end of the PostMem measurement and the end of the PEI measurement.
4.6 Raw Trace ReportsWhether for debugging new measurements or determining fine-grained relationships between measurements, it is desirable to be able to see exactly what is contained in the measurement records. The Raw Trace Report, selected by the -R option, is used for this purpose.
The Raw Trace Report can be used to determine the source of the 6 ms. discrepancy described in Section 4.5.
24 February, 2010 Version 1.0
Dp Reporting Utility
==[ RAW Trace ]========
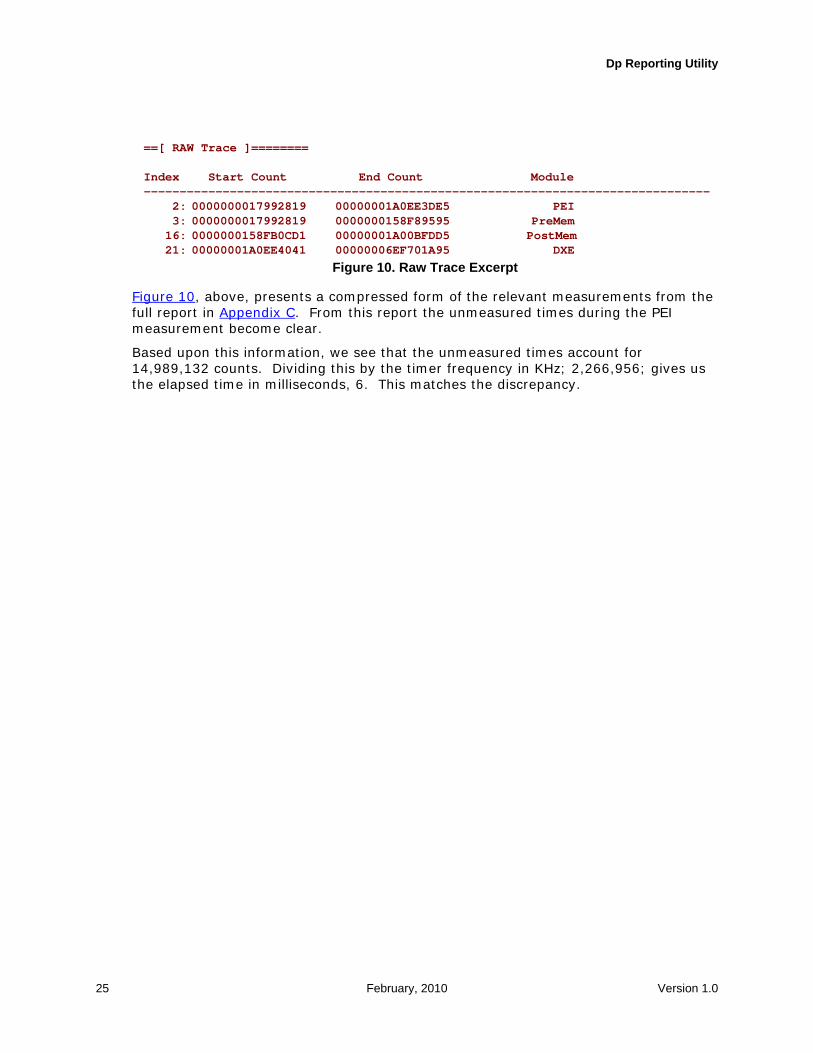
Index Start Count End Count Module------------------------------------------------------------------------------- 2: 0000000017992819 00000001A0EE3DE5 PEI 3: 0000000017992819 0000000158F89595 PreMem 16: 0000000158FB0CD1 00000001A00BFDD5 PostMem 21: 00000001A0EE4041 00000006EF701A95 DXE
Figure 10. Raw Trace Excerpt
Figure 10, above, presents a compressed form of the relevant measurements from the full report in Appendix C. From this report the unmeasured times during the PEI measurement become clear.
Based upon this information, we see that the unmeasured times account for 14,989,132 counts. Dividing this by the timer frequency in KHz; 2,266,956; gives us the elapsed time in milliseconds, 6. This matches the discrepancy.
25 February, 2010 Version 1.0

Performance Optimization
26 February, 2010 Version 1.0

Instrumenting the Code
5Instrumenting the Code
This chapter describes the process of adding performance instrumentation to existing EDK II projects. In section 5.1, Establishing a Build Target, the steps for adding performance measurement capabilities to the project’s configuration, INF and DSC files are described.
For illustrative purposes, the examples assume that x86 processors are being used. Feel free to modify the examples appropriately to support the intended architecture.
5.1 Establishing a Build TargetStart with a copy of a firmware source tree that you know you can successfully build running firmware from. This will give you a stable base for troubleshooting in case subsequent modifications cause problems.
Create a new directory within your target platform package. This document assumes “Profile” is used. Ex: MyPlatformPkg/Profile
Copy the build files used for your target platform into the new directory. At a minimum, this is the DSC file. You might also include the FDF file if you intend to modify it.
Rename the build files. ex: MyPlatformPkgProduction to MyPlatformPkgProfile
5.2 Editing the DSC fileEdit the [Defines] section of the DSC file to match the new target. While this is not absolutely necessary, it makes it much easier to keep the profiling builds separate from others. Key areas to focus on are:
PLATFORM_NAME = MyPlatformPkgProfilePLATFORM_GUID = 12345678-9012-3456-7890-123456789012OUTPUT_DIRECTORY = Build/MyPlatformPkgProfileFLASH_DEFINITION = MyPlatformPkg/MyPlatformPkg.fdf
Before continuing, verify that the firmware can still be built using the build target that was just created. In case of problems, double-check the OUTPUT_DIRECTORY and FLASH_DEFINITION definitions.
build -b DEBUG -a IA32 -a X64 -p MyPlatformPkg/Profile/MyPlatformPkgProfile.dsc
Note: The build target, -b, and architecture, -a, options may have already been specified within the source tree’s target.txt configuration file. If that is the case, the above example would not have had to include them. It is also possible to edit the target.txt file to point to the desired build target which will eliminate the need for the -p option.
Still within the DSC file, edit entries within the appropriate [LibraryClasses]
27 February, 2010 Version 1.0

Performance Optimization
sections to ensure that the correct timer and Performance libraries are used.
Keep BasePerformanceLibNull for the PerformanceLib instance in [LibraryClasses.common]. This will take care of any cases where it is not explicitly overridden.
Add instances of PeiPerformanceLib to [LibraryClasses.common.PEI_CORE] and [LibraryClasses.common.PEIM]
Add an instance of DxeCorePerformanceLib to [LibraryClasses.common.DXE_CORE]
Add instances of DxePerformanceLib to [LibraryClasses.common.DXE_DRIVER], [LibraryClasses.common.DXE_SMM_DRIVER], [LibraryClasses.common.UEFI_DRIVER] and to [LibraryClasses.common.DXE_RUNTIME_DRIVER] and [LibraryClasses.common.UEFI_APPLICATION] if either of those areas are applicable.
Determine which area(s) you wish to profile. Ensure that the Timer Library for that area is appropriate. Not all Timer Libraries work for all phases.
NOTE: It is necessary to ensure that all performance measurements are made using the same TimerLib instance.
More detailed information about the PerformanceLib and TimerLib instances is provided in chapter 6, EDK II Performance Infrastructure.
If Measured Profiling is to be used, edit the [LibraryClasses] sections again to select the correct ProfileLib instances: ProfileLibNull, PeiProfileLib, DxeCoreProfileLib, and DxeProfileLib.
Edit the [PcdsFixedAtBuild ] sections to ensure that PcdMaxPeiPerformanceLogEntries is sufficient (40 recommended)1, PcdPerformanceLibraryPropertyMask is 1 and PcdProfileLibraryPropertyMask is 1. The PropertyMask entries are necessary to enable the tracing and profiling capabilities.
Detailed information on all of the relevant PCD entries is provided in chapter 6. These include settings for controlling debug output as well as entries which can be set to improve performance by removing run-time bounds checking.
At this point you may wish to verify that you can still build functional firmware. If problems do occur, their cause is most likely within the single DSC file that has been edited so far.
5.3 Synchronize DP’s Timer LibrarySince a timer library has been selected, now is a good time to edit the [LibraryClasses] section of the DP utility’s DSC file, PerformancePkg.dsc, so that it uses the same timer library instance as the platform firmware.
1. 40 is a recommended starting value because that is sufficient for all default PEI measurements with room for a few more before the PCD entry needs to be changed. The author uses multiples of 10 for storage sizes in order to allow room for growth.
28 February, 2010 Version 1.0
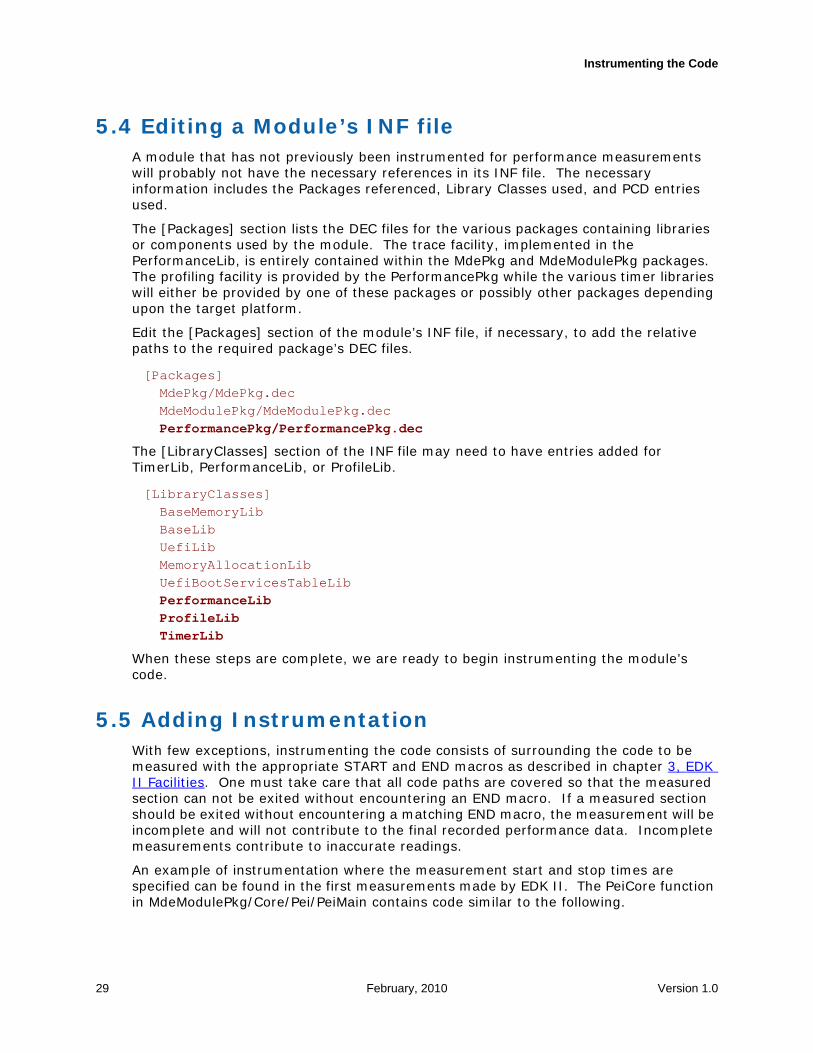
Instrumenting the Code
5.4 Editing a Module’s INF fileA module that has not previously been instrumented for performance measurements will probably not have the necessary references in its INF file. The necessary information includes the Packages referenced, Library Classes used, and PCD entries used.
The [Packages] section lists the DEC files for the various packages containing libraries or components used by the module. The trace facility, implemented in the PerformanceLib, is entirely contained within the MdePkg and MdeModulePkg packages. The profiling facility is provided by the PerformancePkg while the various timer libraries will either be provided by one of these packages or possibly other packages depending upon the target platform.
Edit the [Packages] section of the module’s INF file, if necessary, to add the relative paths to the required package’s DEC files.
[Packages] MdePkg/MdePkg.dec MdeModulePkg/MdeModulePkg.dec PerformancePkg/PerformancePkg.dec
The [LibraryClasses] section of the INF file may need to have entries added for TimerLib, PerformanceLib, or ProfileLib.
[LibraryClasses] BaseMemoryLib BaseLib UefiLib MemoryAllocationLib UefiBootServicesTableLib PerformanceLib ProfileLib TimerLib
When these steps are complete, we are ready to begin instrumenting the module’s code.
5.5 Adding InstrumentationWith few exceptions, instrumenting the code consists of surrounding the code to be measured with the appropriate START and END macros as described in chapter 3, EDK II Facilities. One must take care that all code paths are covered so that the measured section can not be exited without encountering an END macro. If a measured section should be exited without encountering a matching END macro, the measurement will be incomplete and will not contribute to the final recorded performance data. Incomplete measurements contribute to inaccurate readings.
An example of instrumentation where the measurement start and stop times are specified can be found in the first measurements made by EDK II. The PeiCore function in MdeModulePkg/Core/Pei/PeiMain contains code similar to the following.
29 February, 2010 Version 1.0

Performance Optimization
0 if (OldCoreData == NULL) { 1 Tick = GetPerformanceCounter (); 2 // 3 // Report Status Code EFI_SW_PC_INIT 4 // 5 REPORT_STATUS_CODE ( 6 EFI_PROGRESS_CODE, 7 FixedPcdGet32 (PcdStatusCodeValuePeiCoreEntry) 8 ); 9 10 PERF_START (NULL, "SEC", NULL, 1);11 PERF_END (NULL, "SEC", NULL, Tick);1213 PERF_START (NULL,"PEI", NULL, Tick);14 //15 // If first pass, start performance measurement.16 //17 PERF_START (NULL,"PreMem", NULL, Tick);1819 //20 // If SEC provided any PPI services to PEI, install them.21 //22 if (PpiList != NULL) {23 Status = PeiServicesInstallPpi (PpiList);24 ASSERT_EFI_ERROR (Status);25 }26 }
If OldCoreData is NULL, this is the first pass, or PreMem, phase of PEI. In line 1 we get the current count from the performance counter. This is done as soon as possible since we will use its value as the starting time for PEI. Lines 10 and 11 are used to determine the time spent in SEC. The tick value of 1 in line 10 specifies that SEC started at “the beginning of time”. The value 1 is used for this because 0 is used to request that the current value of the performance counter be used. Line 11 ends the SEC measurement at the time collected to indicate the beginning of PEI. Thus, the duration of the SEC phase is from processor start until the beginning of PEI.
Line 13 begins the measurement of the PEI phase duration and line 17 starts measuring the PreMem phase of PEI at the same time.
A common use of the performance instrumentation is to measure the duration of a complex function. An example of this can be found in DxeMain where the duration of the DXE CoreDispatcher is measured.
30 February, 2010 Version 1.0

Instrumenting the Code
1 // 2 // Invoke the DXE Dispatcher 3 // 4 PERF_START (NULL, "CoreDispatcher", "DxeMain", 0); 5 CoreDispatcher (); 6 PERF_END (NULL, "CoreDispatcher", "DxeMain", 0);
In both cases, a tick value of 0 is used which starts the measurement just before the call to CoreDispatcher and ends the measurement just after CoreDispatcher returns. Note that the Token and Module strings combine to unambiguously identify the measurement.
5.6 Controlling the InstrumentationIt is possible to specify the desired performance, profiling, or timer libraries for individual modules by editing their entries within the [Components] sections of the project’s DSC file. The following example shows how this may be done.
[Components] MdeModulePkg/Universal/Network/Tcp4Dxe/Tcp4Dxe.inf { <PcdsFixedAtBuild> gEfiMdePkgTokenSpaceGuid.PcdPerformanceLibraryPropertyMask|0 gPerformancePkgTokenSpaceGuid.PcdProfileLibraryPropertyMask|0x01 <LibraryClasses> TimerLib|PerformancePkg/Library/TscTimerLib/TscTimerLib.inf }
In this example, performance tracing is disabled, measured profiling is enabled, and the TSC Timer is used for performance measurements within the Tcp4Dxe module.
If all other instances of PcdProfileLibraryPropertyMask set the value to 0, for example, then only this single module will provide profiling information.
Note that it is required for tracing or profiling to be enabled in DXE_CORE in order to use the associated performance measurement facility. If not enabled in DXE_CORE, the necessary performance infrastructure will not be instantiated and no measurements will be recorded by any module. The migration of performance measurements from the PEI phase is also performed by the performance infrastructure in DXE_CORE. Thus, even PEI performance information will not be available if the appropriate tracing or profiling Property Mask value for DXE_CORE is zero, disabling that type of performance measurement.
31 February, 2010 Version 1.0

Performance Optimization
32 February, 2010 Version 1.0
EDK II Performance Infrastructure
6EDK II Performance Infrastructure
In this chapter, the elements of the EDK II performance infrastructure used for performance instrumentation are summarized. Detailed documentation for these items is available from uefi.org or tianocore.org. See “Related Information” on page 3.
6.1 PCD EntriesA number of PCD entries are used to control and tune performance measurement.
PcdPerformanceLibraryPropertyMaskSet to ZERO to disable performance tracing measurement code. Value definitions are in PerformanceLib.h.
PcdMaxPeiPerformanceLogEntriesMaximum number of performance trace log entries during PEI phase.
PcdProfileLibraryPropertyMaskSet to ZERO to disable performance profiling measurement code. Value definitions are in ProfileLib.h.
PcdMaxPeiProfileLogEntriesMaximum number of performance profiling records during PEI phase.
PcdMaxDxeProfileLogEntriesMaximum number of performance profiling records during DXE phase.
6.2 Library ClassesAll instances of a particular library class must provide the same public information and methods. A library class instance does not have to be valid in all execution phases, nor the same phases as other instances of the same class.
6.2.1 PerformanceLibPerformance library instances provide implementations of methods to start, end, and retrieve performance tracing measurements as well as to determine if performance tracing measurements are enabled.
These methods are used by the performance tracing macros, described in Chapter 3. It is intended that the developer use the macros defined in PerformanceLib.h instead of calling the defined methods directly. A brief summary of the performance library instances provided by EDK II follow. See the documentation referenced in Section 1.4 for more detail.
BasePerformanceLibNull
An instance of the Performance Library implementing stub functions that can be used as a template for the implementation of a full performance library instance.
33 February, 2010 Version 1.0

Performance Optimization
PeiPerformanceLibThis library implements the performance tracing library class for the PEI phase. It is valid for PEI_CORE as well as PEIMs or any other time during PEI phase.
DxeCorePerformanceLibThis library provides infrastructure enabling within DxeCore to log performance trace data. This library instance must be used in DxeCore if one wishes to retrieve performance tracing measurements, regardless of the phase they were taken in.
DxePerformanceLib
This library provides infrastructure for a DXE driver to log performance tracing data by using the services of the performance protocol.
6.2.2 TimerLibTimer library instances provide implementations of methods to pause for a specified period of time, retrieve the current count from a timer, and get information about that timer. The TimerLib methods and instances are summarized below.
6.2.2.1 TimerLib MethodsMicroSecondDelay
Stalls the CPU for at least the given number of microseconds.
NanoSecondDelayStalls the CPU for at least the given number of nanoseconds.
GetPerformanceCounterRetrieves the current value of a 64-bit free running performance counter.
GetPerformanceCounterPropertiesRetrieves the 64-bit counting frequency of the counter, in Hz, and the range of performance counter values.
6.2.2.2 TimerLib Instances
There are a number of Timer Library instances that take advantage of the different counters provided by a platform. The implementations present in EDK II are summarized below.
BaseTimerLibNullA non-functional instance of the Timer Library that can be used as a template for the implementation of a functional timer library instance. This library instance can also be used to test the build DXE Runtime, DXE SAL, and DXE SMM modules that require timer services as well as EBC modules that require timer services.
SecPeiDxeTimerLibCpuTimer Library that only uses CPU resources to provide calibrated delays on IA-32, x64, and IPF.
TscTimerLibThis is an implementation of the Timer Library that uses the TimeStamp Counter (TSC) in Intel Ia32 and X64 CPUs to provide precision time measurements. Beginning with Pentium-4, the TSC in Intel CPUs count at a constant rate regardless of power management state. The only time the counter stops is during reset or when the processor is put into a Deep Sleep state.
34 February, 2010 Version 1.0

EDK II Performance Infrastructure
6.2.3 ProfileLibProfiling library instances provide implementations of methods to start, end, and retrieve performance profiling measurements as well as to determine if performance profiling measurements are enabled.
These methods are used by the performance profiling macros, described in Chapter 3. It is intended that the developer use the macros defined in ProfileLib.h in preference to calling the defined methods directly.
BaseProfileLibNull
An instance of the Profile Library implementing stub functions that can be used as a template for the implementation of a full profile library instance.
PeiProfileLib
This library implements the performance Profiling library class for the PEI phase. It is valid for PEI_CORE as well as PEIMs or any other time during PEI phase.
DxeCoreProfileLibThis library provides infrastructure enabling within DxeCore to log performance profiling data. This library instance must be used in DxeCore if one wishes to retrieve performance profiling measurements, regardless of the phase they were taken in.
DxeProfileLib
This library provides infrastructure for a Dxe driver to log performance profiling data by using the services of the profiling protocol.
35 February, 2010 Version 1.0

Performance Optimization
36 February, 2010 Version 1.0

Strategies
Yes
Establish Goals.
Problem AreaIdentif ied?
!Optimize Code.
MeasurePerformance.
Analyze Results.
!Finished.
Performance GoalsMet?
No
7Strategies
The general strategy employed in this document is one of successive refinement: start with the most general investigation and coarsest measurements then successively identify and narrow in on problem areas. Once the problem area is identified, analysis of the code can be performed to discover potential optimizations. Performance is then re-measured and the results analyzed to determine how effective the optimizations were. If needed, more optimizations are performed and the whole process is repeated as many times as needed to achieve the desired results.
This highly iterative process is illustrated by the figure on the left. Subsequent sections will describe the components of this process and how they apply to Performance Optimization in EDK II.
37 February, 2010 Version 1.0

Performance Optimization
7.1 Establish GoalsFactors such as CPU speed, overall system design, FLASH device performance, or other hardware artifacts can affect measured performance as much as algorithm selection and firmware implementation quality. Performance optimization goals will determine which of these factors will be addressed.
It is crucial that a systematic approach be taken where only one thing changes between any two performance measurement runs. If more than one thing changes, it is difficult to determine which change affected the measurement and by how much.
7.2 Measure PerformanceMeasuring performance consists of:
1. Identifying what to measure.2. Instrumenting the code.3. Gathering the results.
Each of these activities is explained in detail below.
7.2.1 What to MeasureDetermining what to measure is at first guided by goals, as established in Section 7.1. The code is then instrumented so that the desired statistics can be gathered. Determining what to measure, though, requires an understanding of the modular structure of EDK II.
Phases of Execution: SEC, PEI, DXE, BDS, OS Loaders.Total elapsed time of the phase. Phases are sequential, only executed once, and mutually exclusive.
Major functional units: dispatchers, module startup, …These functional units have some relatively well defined rules for when they are invoked and their roles within a particular phase – within the context of the specific implementation being instrumented. Measurement is relatively coarse grained with recording and reporting expectations similar to that for the Phases of Execution.
Boot & Runtime ServicesServices can be invoked many times from diverse locations. Both single execution and cumulative measurements are significant.
Measure the time to perform the instrumented service. Need one or more of: Minimum time through the service Maximum time through the service Average time for the service Number of times executed Cumulative time for all invocations
Library functionalityLibrary functions can be invoked many times from diverse locations. Both single execution and cumulative measurements are significant.
Measure the time to perform the instrumented routine. Need one or more of: Minimum time through the routine Maximum time through the routine
38 February, 2010 Version 1.0

Strategies
Average time for the routine Number of times routine Cumulative time for all invocations
PPI and Protocol methodsProtocol methods can be invoked many times from diverse locations. Both single execution and cumulative measurements are significant.
Measure the time to perform the instrumented routine. Need one or more of: Minimum time through the routine Maximum time through the routine Average time for the routine Number of times routine Cumulative time for all invocations
Driver execution: disk read, console out, …
7.2.2 Instrumenting the CodeEven though one uses the same firmware image each time, the path through the firmware will vary depending upon the firmware’s execution mode. These modes include:
First boot with a new firmware image. Boot after power-on. Boot after a reset. Warm Boot Normal boot. Resume from S3. Resume from S4.
One must be aware of these different boot paths when selecting instrumentation points.
The PCD capability of EDK II can be leveraged to allow relatively fine-grained control of Data Collection. At a minimum, this allows collection or measurement to be selectively enabled or disabled for each Phase of Execution.
7.2.3 Gathering StatisticsOnce the code has been instrumented, new firmware is built following guidelines given in Chapter 5. When executed, the firmware will then generate statistics which can be reported by the Dp utility.
7.3 Analyze ResultsAfter the instrumented firmware has been executed and all the measurement data collected, an analysis is performed with the goal of deriving detailed interpretations of the collected data. The analysis is performed by one or more firmware engineers that are familiar with the code base. As a first step, the collected data is assessed for reasonableness and correctness. If any problems regarding the validity of the data are found, the reason has to be determined.
39 February, 2010 Version 1.0
Performance Optimization
Note: Any interrupts; such as SMI, PMI, Machine Checks, etc., that occur while a measurement is in progress will add the interrupt handler’s time to the measurement. One must be aware of the possibility of this event and take it into account during any analysis.
Depending on the identified reason, either the planning or the instrumentation may have to be revisited and performed again resulting in new measurement data. Once the validity of the collected data has been confirmed, the initially planned analyses are conducted. The results are interpreted to identify and understand problems in the investigated component. Based on the analysis results, preliminary conclusions and improvement suggestions are derived. If it is necessary, for example to gain confidence in the results or to draw sound conclusions, additional measurement and analyses passes are conducted. This might also include improving measurement definitions, data collection procedures, and analysis techniques as needed to ensure meaningful results that support measurement goals. To prevent misunderstandings of the analysis results and rework, initial and final results should be reviewed with all relevant stakeholders. Once the final analysis results are available, relevant stakeholders should be assisted in understanding and interpreting the results.
40 February, 2010 Version 1.0

Lessons Learned
8Lessons Learned
This chapter contains a summary of lessons learned and Best Known Methods (BKMs) acquired during boot performance optimization tuning work on platforms using Intel processors. The performance data mentioned is for normal, minimal and S3 boot modes, not the full configuration boot mode.
8.1 Lessons by Phase
8.1.1 SEC Phase SEC is a platform-specific phase. On some platforms, SEC does an optional early microcode update for all CPUs, collects BIST of all CPUs, sets MTRR for BSP and enables temporary memory.
SEC operates the same during normal and S3 Resume boot paths.
Relevant sections are:
8.2.1, Enable code cache for boot block 8.3.4, Enable SPI prefetching 8.9.1, Use CPU number for synchronization 8.10.1, Code Alignment Issue
8.1.2 PEI Phase PEI phase is composed of three sub-phases: Pre-Mem (before memory available), Mem-Dis (during memory detection), and Post-Mem (after memory available). The code in Pre-Mem phase and Mem-Dis runs out of the FD device, usually Flash.
If the CPU can’t support code cache or the cache size is not large enough, it is recommended to shadow the code to memory in Post-Mem to speed up execution. Sections, 8.5.4 and 8.5.5, describe this performance impact.
It’s recommended to cache the entire FV in Post-Mem phase to speed up the FLASH access and copy FvMain to memory (or decompress FvMainCompact).
Sections relevant to PEI are:
8.2.2, Configure C,D,E,F segments as WP 8.2.3, Enable Caching of Flash 8.3.5, Decompress FvMain block in memory 8.5.1, Memory operation algorithms 8.5.4, Shadow PEIMs after Memory Discovered 8.5.5, Shadow the PEI core 8.5.6, Run More Code in Post-Mem than in Pre-Mem 8.6.1, Reduce the number of FV Hobs 8.6.2, Report CPU BIST as a Hob
41 February, 2010 Version 1.0

Performance Optimization
8.8.1, PeiReportStatusCode 8.9.1, Use CPU number for synchronization
8.1.3 DXE PhaseLessons relevant to the DXE phase are:
8.4, Drivers 8.4.1, Avoid Legacy drivers/devices whenever possible 8.5.1, Memory operation algorithms 8.8.1, PeiReportStatusCode 8.9.1, Use CPU number for synchronization
8.1.4 BDS PhaseBDS phase lessons are:
8.4.2, BiosVideo Driver Enhancement 8.4.3, Keyboard Driver Enhancement 8.5, Memory 8.7.1, Minimal Configuration Path for Fast Boot 8.8.1, PeiReportStatusCode
8.2 CacheCPU cache is the fastest memory bank in the system. To make good use of CPU cache is critical for boot performance. For UEFI-compliant firmware development on IA platforms, setting MTRRs is the only way to properly use CPU cache.
It’s valuable to check the MTRR settings in each phase to look for potential enhancements.
8.2.1 Enable code cache for boot block Relevant for SEC Phase and S3 Resume.
When configuring MTRRs, the boot block can be set as WP to enhance the PEI performance.
Note: The WP mode, in IA processors, does not protect memory from writes. Instead, caching is enabled for reads while writes go directly to memory and the corresponding cache line (if any) is invalidated.
One should check the CPU type (using cpuid for example) before enabling the code cache. Until recently, IA processors could not support code cache while using Non-Eviction Mode (NEM). If it is supported, enabling the code cache is highly recommended. This can greatly enhance execution performance prior to memory initialization.
Below is the code sample to enable code cache in SEC.
42 February, 2010 Version 1.0

Lessons Learned
To enable code cache for 2-block FvRecovery (64KB for one block):
mov eax, 0FFFE0000h OR MTRR_MEMORY_TYPE_WP xor edx, edx mov ecx, CODE_CACHE_MTRR_PHYS_BASE wrmsr mov eax, NOT(20000h-1) OR MTRR_PHYSMASK_VALID mov edx, 0Fh mov ecx, CODE_CACHE_MTRR_PHYS_MASK wrmsr
To enable code cache for 3-block FvRecovery (64KB for one block):
mov eax, 0FFFC0000h OR MTRR_MEMORY_TYPE_WP xor edx, edx mov ecx, CODE_CACHE_MTRR_PHYS_BASE_1 wrmsr mov eax, NOT(40000h-1) OR MTRR_PHYSMASK_VALID mov edx, 0Fh mov ecx, CODE_CACHE_MTRR_PHYS_MASK_1 wrmsr mov eax, 0FFFC0000h OR MTRR_MEMORY_TYPE_UC xor edx, edx mov ecx, CODE_CACHE_MTRR_PHYS_BASE_2 wrmsr mov eax, NOT(10000h-1) OR MTRR_PHYSMASK_VALID mov edx, 0Fh mov ecx, CODE_CACHE_MTRR_PHYS_MASK_2 wrmsr
8.2.2 Configure C,D,E,F segments as WP Relevant during PEI phase.
In order to speed up some legacy drivers like BiosVideo, configure the C,D,E,F segments, in the 0xC0000 to 0xFFFFF memory range, as Write Protected (WP).
8.2.3 Enable Caching of Flash Relevant during PEI phase.
Enabling caching of the FLASH area, for example: 0xFFF0000 – 0xFFFFFFFF, will result in a significant improvement in pre-memory execution. On IA processors, use the MTRRs to select a cache mode such as WP.
8.3 Flash
8.3.1 Be careful of all Flash-access operations As the access to the Flash device is slow, attention should be paid to all Flash-access operations. Two guidelines might be helpful:
Never read FVs that we never use.
43 February, 2010 Version 1.0

Performance Optimization
Never read the same FV twice from Flash device.
Sections 8.6.1 and 8.4 have more details.
8.3.2 Do things in memory rather than in Flash The experiment shows that to read data or execute code in Flash is much slower than the operations on memory. It’s worthwhile to shadow the content from Flash to Memory after the memory is available.
We can move PEI services to memory by shadowing PEI core. (See Section 8.5.5) We can improve the PPI performance by shadowing PEIM to memory. (See
Section 8.5.4) We can improve the decompression of FvMain by copying the compressed FvMain
from Flash to Memory before decompressing. (See Section 8.3.5)
8.3.3 S3 Resume: Access NV Storage as Little as Possible in Pre-MemThe reason is the same for the code execution. Cache dominates the speed.
8.3.4 Enable SPI prefetching Relevant during SEC phase.
If the flash chip is SPI, SPI prefetching can be enabled in SEC. (For ICH8, Bus 0, Dev 31, Func 0, Register BIOS_CNTL[3:2]=10b)
8.3.5 Decompress FvMain block in memory Relevant during PEI phase.
On desktop, FvMain block is compressed as FvMainCompact FV and is decompressed in DxeIpl PEIM. The decompression on Flash is slower than the decompression in memory. So it’s recommended to copy the FvMainCompact FV to memory first and then do decompression. If the flash chip is SPI and SPI prefetching is enabled, the performance gap is not that big, but this trick is general for all types of flash chip and chip’s configurations.
8.4 Drivers
8.4.1 Avoid Legacy drivers/devices whenever possible Legacy Option ROMs use 16-bit code and need thunking from and to 32-bit or 64-bit mode resulting in poor performance for these drivers. Native drivers are thus preferred over legacy drivers.
For similar reasons, EFI boot is preferred over Legacy boot.
8.4.2 BiosVideo Driver Enhancement Relevant during BDS phase.
44 February, 2010 Version 1.0

Lessons Learned
As was mentioned in Section 8.2.2, if we configure C,D,E,F segments as WP in PEI, some legacy drivers will get improved performance. For BiosVideo, C segment is used for VideoRom and we saw a big improvement on an Integrated Graphics Device (IGD) and also some improvement with an external graphics card.
8.4.3 Keyboard Driver Enhancement Relevant during BDS phase.
Do not do a full reset when calling EFI_SIMPLE_TEXT_IN_PROTOCOL.Reset() by setting the second parameter to FALSE. This will save about 400ms.
Note: This optimization might leave some keyboards in an abnormal state after initialization.
8.5 MemoryMemory routines (copy, set and zero) are used in many places in the firmware code. There are several commonly used memory operation algorithms, and the performance analysis shows that different algorithms have different performance results depending upon the boot phase.
8.5.1 Memory operation algorithms
8.5.1.1 MMX
This algorithm uses MMX registers in the processor. The Intel MMX technology was introduced into the IA-32 architecture in the Pentium II processor family and Pentium processor with MMX technology. The registers are 64-bit wide so the data transaction unit is 64-bit (8 bytes).
8.5.1.2 XMM (SSE2)
The streaming SIMD extensions 2 (SSE2) were introduced into the IA-32 architecture in the Pentium 4 and Intel Xeon processors. The registers are 128-bit wide so the data transaction unit is 128-bit (16 bytes).
Table 1. C,D,E,F segments Caching Impact
Video Card
C seg UC (ms) C seg WP (ms) Overall Enhancement
(ms)ROM Dispatch
BiosVideoChildHandleInstall
ROM Dispatch
BiosVideoChildHandleInstall
IGD 2726 244 487 227 2256
GeForce2 MX400 PCI
4431 921 4308 846 188
Asus PCIe
599 822 453 677 291
45 February, 2010 Version 1.0
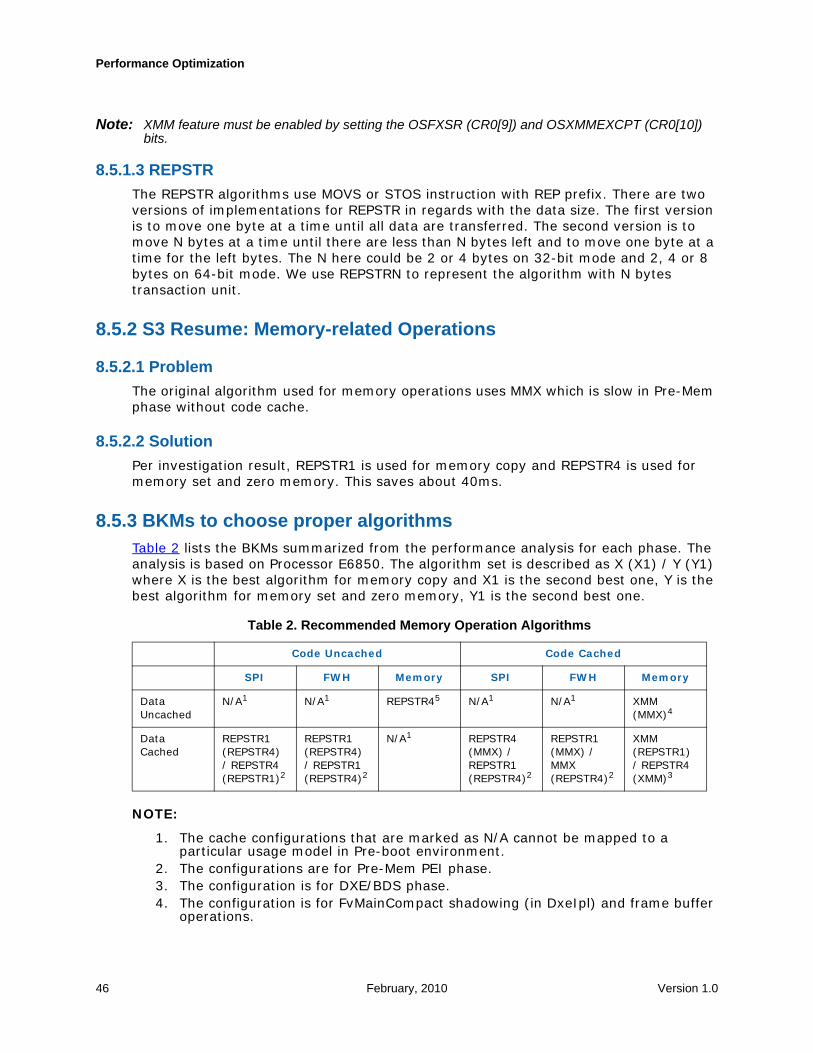
Performance Optimization
Note: XMM feature must be enabled by setting the OSFXSR (CR0[9]) and OSXMMEXCPT (CR0[10]) bits.
8.5.1.3 REPSTR
The REPSTR algorithms use MOVS or STOS instruction with REP prefix. There are two versions of implementations for REPSTR in regards with the data size. The first version is to move one byte at a time until all data are transferred. The second version is to move N bytes at a time until there are less than N bytes left and to move one byte at a time for the left bytes. The N here could be 2 or 4 bytes on 32-bit mode and 2, 4 or 8 bytes on 64-bit mode. We use REPSTRN to represent the algorithm with N bytes transaction unit.
8.5.2 S3 Resume: Memory-related Operations
8.5.2.1 Problem
The original algorithm used for memory operations uses MMX which is slow in Pre-Mem phase without code cache.
8.5.2.2 Solution
Per investigation result, REPSTR1 is used for memory copy and REPSTR4 is used for memory set and zero memory. This saves about 40ms.
8.5.3 BKMs to choose proper algorithms Table 2 lists the BKMs summarized from the performance analysis for each phase. The analysis is based on Processor E6850. The algorithm set is described as X (X1) / Y (Y1) where X is the best algorithm for memory copy and X1 is the second best one, Y is the best algorithm for memory set and zero memory, Y1 is the second best one.
NOTE:
1. The cache configurations that are marked as N/A cannot be mapped to a particular usage model in Pre-boot environment.
2. The configurations are for Pre-Mem PEI phase. 3. The configuration is for DXE/BDS phase. 4. The configuration is for FvMainCompact shadowing (in DxeIpl) and frame buffer
operations.
Table 2. Recommended Memory Operation Algorithms
Code Uncached Code Cached
SPI FWH Memory SPI FWH Memory
Data Uncached
N/A1 N/A1 REPSTR45 N/A1 N/A1 XMM (MMX)4
Data Cached
REPSTR1 (REPSTR4) / REPSTR4 (REPSTR1)2
REPSTR1 (REPSTR4) / REPSTR1 (REPSTR4)2
N/A1 REPSTR4 (MMX) / REPSTR1 (REPSTR4)2
REPSTR1 (MMX) / MMX (REPSTR4)2
XMM (REPSTR1) / REPSTR4 (XMM)3
46 February, 2010 Version 1.0
Lessons Learned
5. The configuration is for PEI core shadowing.
8.5.4 Shadow PEIMs after Memory Discovered If a PEIM will be used after memory is discovered, it is better to be shadowed.
Note: Make sure that PEIMs are NOT shadowed in S3 boot path to avoid S3 failure.
8.5.4.1 PEIM shadowing without PI support
8.5.4.1.1 PEIM that is loaded after memory available
If the PEIM is ensured to be loaded after memory is available, a private PPI can be installed as a sign indicating whether the PEIM is shadowed.
Please refer to the function PeimInitializeDxeIpl() in Edk\Sample\Universal\DxeIpl\Pei\DxeLoad.c or Edk\Sample\Universal\DxeIpl\Pei\DxeLoadX64.c for implementation details.
8.5.4.1.2 PEIM that is loaded before memory available
If the PEIM is loaded before memory is available, a callback can be registered for the installation of PEI FV File Loader PPI (GUID is EFI_PEI_FV_FILE_LOADER_GUID). DxeIpl will install this PPI so memory is available on callback.
8.5.4.2 PEIM shadowing with PI support
With the advent of PI support, the shadowing of PEIM is quite straight-forward. A new PEI service is provided for this purpose: RegisterForShadow(). Assume the entry point of PEIM is MyPeimInit().
EFI_STATUS EFIAPI MyPeimInit ( IN EFI_FFS_FILE_HEADER *FfsHeader, IN EFI_PEI_SERVICES **PeiServices );
Inside the MyPeimInit(), the PEIM can be shadowed like this:
(**PeiServices).RegisterForShadow ((EFI_PEI_FILE_HANDLE) FfsHeader);
Then when the memory is available, PEI core will shadow the PEIM automatically.
8.5.5 Shadow the PEI core
Note: PEI core shadowing is implemented in PI-compliant PEI but is not available in non-PI PEI. Also make sure that PEI core is NOT shadowed in S3 boot path to avoid S3 failures.
As all PEI services are implemented in PEI core, if PEI core is not shadowed, the code of PEI services will still be located on Flash after memory is installed. This will greatly impact the Post-memory performance.
47 February, 2010 Version 1.0
Performance Optimization
8.5.6 Run More Code in Post-Mem than in Pre-MemS3 Resume
In S3 boot path, the code cache will be turned on after the memory is installed. Code will run much faster in Post-Mem.
If the PEIM is dispatched in Post-Mem phase, nothing needs changing as all the code in this PEIM will be executed on cache.
If the PEIM is dispatched in Pre-Mem phase, the simplest way to schedule a piece of code to run in Post-Mem phase is to register a callback notification of MemoryDiscovered PPI.
8.6 HOBs
8.6.1 Reduce the number of FV Hobs PEI
The FV hob is created in some platform PEIMs and transfers the discovered FV’s information to DXE phase. DXE core searches DXE drivers in the FV reported in this FV hob list. It wastes time to search something in FV on Flash, so it is worth to only put necessary Flash-FV into FV hob list or put memory-FV into FV host list.
There are two possible enhancements.
Only build FV HOBs with FVs that contain DXE drivers. As the Recovery FV and NVStorage FV contains no DXE drivers, Dozens of milliseconds can be saved by removing FvRecovery & NVStorage from the HOB.
Don’t generate FvMainCompact FV or mark it as EFI_HOB_TYPE_UNUSED. As it has already been decompressed and put into memory. This prevents FvMainCompact FV from being decompressed again in DXE, saving hundreds of milliseconds.
PIWG specification gives a chance. It introduce a new protocol EFI_FIRMWARE_VOLUME2_PROTOCOL which contains GetInfo() interface to get Fv detail information. So the long term solution is that in PEI phase, all FV in flash are reported to Fv hob list but DXE core only search DXE driver in memory based FV in FV hob list by judging EFI_FIRMWARE_VOLUME2_PROTOCOL.GetInfo().
8.6.2 Report CPU BIST as a Hob The CPU BIST info is collected in SEC and passed to PEI. We can build this hob and pass to DXE so that MpCpu Driver doesn’t need to re-calculate the CPU number and can depend on the CPU number to do synchronization.
8.7 Boot Mode Utilization
8.7.1 Minimal Configuration Path for Fast Boot Relevant during BDS phase.
48 February, 2010 Version 1.0

Lessons Learned
To make a quick boot, not all devices need to be started. The basic idea of minimal configuration path enhancement is to only start devices that are necessary for booting. For example, during the EFI boot to HD, only the HD, console input and console output devices need to be started even if the USB, CDROM or other devices are also connected to board. Figure 11 shows the minimal configuration path.
The minimal configuration path solution will greatly speed up the boot, especially EFI boot. For example, a test platform with one HD and one USB disk connected was two seconds faster using a minimal configuration as compared with the full configuration boot path.
Figure 11. Minimal Configuration Path
8.7.2 S3 Resume Boot Path The S3 resume boot path is a special boot path that causes the Firmware to take actions different from those in the normal boot path. In this special path, the Firmware derives pre-saved data about the platform’s configuration from persistent storage and configures the platform before jumping to the operating system’s waking vector.
Platform initialization can be viewed as a flow of the following:
I/O operations Memory operations
49 February, 2010 Version 1.0

Performance Optimization
Accessing to the PCI configuration space A collection of platform-specific actions that can be abstracted by Pre-EFI
Initialization Module (PEIM) PEIM-to-PEIM Interface (PPIs)
The goal of an S3 resume is to restore the platform to its pre-boot configuration.
8.7.2.1 PEI Phase in S3 Resume Boot PathThe PEI phase initializes the platform with the minimum configuration that is needed to enable the execution of DXE phase. During the S3 resume boot path, the Firmware still needs to restore the PEI portion of configuration.
PEIMs can use the GetBootMode() PEI service function to become aware of what the current boot path is. This awareness enables the platform to restore more efficiently because the same PEIM can save the configuration during a normal boot path and take advantage of that configuration in the S3 resume boot path.
8.7.2.2 DXE Phase in S3 Resume Boot PathDXE phase in S3 resume boot path is not actually a DXE. In consideration of efficiency, the I/O and memory operations, the PCI configuration space access and SMBus configurations are saved as EFI Boot Script in normal boot path, retrieved and executed in S3 boot path. The Boot Scripts are executed in S3Resume PEIM.
8.7.3 PEI Dependency ExpressionsS3 Resume, PEI
8.7.3.0.1 Problem
Before dispatching each PEIM, the core dispatcher checks whether the prerequisite PPIs have been installed. This procedure provides a sound architecture, however, it burdens S3 resume time if the dependency expression is already satisfied.
8.7.3.0.2 Solution
The PI specification provides a way to impose a dispatching order of PEIMs in PEI phase. An apriori file can be added to the firmware to specify the exact order PEIMs are dispatched as is defined in the PI specification volume 1:
The PEI apriori file is a special file that may optionally be present in a firmware volume, and its main purpose is to provide a greater degree of flexibility in the firmware design of a platform. Specifically, the apriori file complements the dependency expression mechanism of PEI by stipulating a series of modules which need be dispatched in a prescribed order.
Note: Use extreme care when listing PEIMs in the apriori file since these files will NOT have their dependencies checked. This could potentially result in PEIMs being started that have not had their dependencies satisfied.
Non-PI builds don’t have this feature so PI builds are recommended for performance considerations.
50 February, 2010 Version 1.0

Lessons Learned
8.7.4 Avoid PEG Training in S3
8.7.4.1 Problem
On some platforms, it is mandatory to poll more than 200ms before MRC to train a PEG. But this is not necessary in S3 resume boot path as no hardware changes occur during S3 from the last normal boot.
8.7.4.2 Solution Save the state of PEG, IGD and PCI video card (whether they exist and their mode
etc.) in normal boot path to NV storage and retrieve it in S3. As there’s no restriction for the graphics initialization’s execution before MRC, we
can put the code to Post-Mem in S3.
8.8 Debug Output
8.8.1 PeiReportStatusCode
8.8.1.1 Problem
This is only for debug purpose and could be removed for production tip.
8.8.1.2 Solution
Disable PEI_REPORT_STATUS_CODE in Config.env.
8.9 MP Configuration
8.9.1 Use CPU number for synchronization Relevant during SEC, PEI, and DXE phases.
In order to execute the microcode update and collect BIST info, SEC needs to synchronize among all CPUs. We recommend that CPU number is used for synchronization wherever possible. The sequence could be:
BSP updates microcode BSP wakes up all APs to update microcode and collect CPU number at the same time BSP busy waits a constant amount of time (~10ms) for APs to finish BSP enables Temporary Memory (which will be used for store BIST) BSP wakes up all APs to collect BIST info BSP uses CPU number for synchronization
51 February, 2010 Version 1.0
Performance Optimization
8.10 General Coding Issues
8.10.1 Code Alignment Issue
8.10.1.1 Problem
The execution performance of code on SPI FLASH chip without code cache is very sensitive to the code alignment. And it is still unknown how to align the code to make the execution faster.
8.10.1.2 Solution
The loop code is normally a hotspot and more sensitive to alignment issue because it will be executed several times. NOP instructions can be put before the code to adjust the alignment to see if the performance is better.
To avoid writing code with loops is another option but it might enlarge the image size.
A technique to globally adjust the alignment is by putting the APRIORI file list FFS to the top of all PEIMS and declaring APRIORI property for PEIMs in build DSC file. This only applies to PI build tips though. The background is that the size of APRIORI file list FFS depends on the number of PEIMs that have the APRIORI property so the alignment of PEIMs after this FFS varies with the different size of APRIORI file list FFS or the number of PEIMs that have the APRIORI property. More or less APRIORI properties can be put to PEIMs to see if the Pre-Mem phase is faster or not. Normally all PEIMs before MemoryInit PEIM should be declared with APRIORI property and the PEIMs after MemoryInit PEIM could be used for alignment tuning.
The example below shows the way to tune the alignment by adding/removing APRIORI property to the PEIMs. The directory prefix is removed for convenience. Here is the initial declaration in a DSC.
AprioriList.inf FV=FvRecovery PEIM1.inf APRIORI=FvRecovery:1 MemoryInit.inf APRIORI=FvRecovery:2 PEIM2.inf PEIM3.inf
Now we try to add more APRIORIs to PEIMs after MemoryInit PEIM.
AprioriList.inf FV=FvRecovery PEIM1.inf APRIORI=FvRecovery:1 MemoryInit.inf APRIORI=FvRecovery:2 PEIM2.inf APRIORI=FvRecovery:3 PEIM3.inf
We assume that it is faster and try to add more.
AprioriList.inf FV=FvRecovery PEIM1.inf APRIORI=FvRecovery:1 MemoryInit.inf APRIORI=FvRecovery:2 PEIM2.inf APRIORI=FvRecovery:3 PEIM3.inf APRIORI=FvRecovery:4
We stop at the former configuration if it is slower or we continue the process until we find it slower.
52 February, 2010 Version 1.0

Lessons Learned
8.10.2 Predicate ExpressionsThe ordering of terms in predicate expressions can have a significant impact on performance. This is because only enough of the expression has to be evaluated to determine the outcome. For example, the first term in an OR expression that evaluates to TRUE is sufficient to determine that the entire OR expression will be TRUE.
The following code sample consists of a predicate expression within a for loop. The predicate expression is a compound AND expression with four terms. Each term is itself a simple predicate expression.
This is a real example from a previous version of the EDK II code and was used in the implementation of the PERF_END functionality. It finds the first open (EndTimeStamp is zero) performance trace record matching the Handle, Token, and Module parameters of a PERF_END invocation.
for (Index = 0; Index < NumberOfEntries; Index++) { if ((LogEntryArray[Index].Handle == (EFI_PHYSICAL_ADDRESS) (UINTN) Handle) && AsciiStrnCmp (LogEntryArray[Index].Token, Token, PEI_PERFORMANCE_STRING_LENGTH) == 0 && AsciiStrnCmp (LogEntryArray[Index].Module, Module, PEI_PERFORMANCE_STRING_LENGTH) == 0 && LogEntryArray[Index].EndTimeStamp == 0 ) { break; }}
While there is nothing really wrong with this code, a little knowledge of the data it will be working on will allow us to significantly speed things up. Again taking from a real-world example:
1. NumberOfEntries = 25,1722. Target entry is at Index 25,1593. There are 532 completed measurement records with the same Handle, Token,
and Module values prior to the target.4. There are 6 measurement records with the same Handle and different Token and
Module values prior to the target.5. There are 25,157 completed entries prior to the target.
From this information, we can see that the terms, in order of importance, are:
1. EndTimeStamp2. Handle3. Module4. Token
We also can determine that this ordering is valid for any measurement. Re-ordering the predicate expression using this information produces:
for (Index = 0; Index < NumberOfEntries; Index++) { if ( LogEntryArray[Index].EndTimeStamp == 0 && LogEntryArray[Index].Handle == (EFI_PHYSICAL_ADDRESS) (UINTN) Handle && AsciiStrnCmp (LogEntryArray[Index].Module, Module, PEI_PERFORMANCE_STRING_LENGTH) == 0 && AsciiStrnCmp (LogEntryArray[Index].Token, Token, PEI_PERFORMANCE_STRING_LENGTH) == 0 ) { break; }}
The new ordering results in 531 fewer 64-bit integer comparisons and 1,069 fewer string comparisons for this single PERF_END invocation. Considering that there will be 25,170 PERF_END invocations one can see how the savings add up to a sizable amount.
53 February, 2010 Version 1.0

Performance Optimization
8.10.3 Structure Member AlignmentThe way structure members are organized can affect both execution performance and code size. Unaligned data accesses incur a performance penalty. Alignment rules can result in additional space, padding, added between members. When data is properly organized there is no performance penalty in accessing it and code is smaller.
By applying some simple rules during the design of data structures, alignment can be maintained and memory use minimized.
The following rules apply to most modern microprocessors. It is easy to add rules for data types not covered here. In particular, pay attention to pointers which may change in length for different processor architectures.
1. Group members by the size of their base type: largest to smallest.2. Pointers should follow integer members that are the same size, or larger, than
the largest size of pointers. For example: on Intel Architecture processors pointers are either 64 bits or 32 bits in length. By placing pointers after INT64 members and before INT32 members the same structure will maintain alignment whether compiled for IA32, X64, or IPF; without wasted space due to padding.
An example of a structure following these rules follows. Any member can be removed and alignment will be maintained without padding. If the rules are followed while adding members, alignment will also be maintained without padding.
struct AnExample { INT64 BigNum; INT64 BigArray[5]; UCHAR *CharPtr; // May be 64 or 32 bit INT32 MediumNum; INT32 MediumArray[7]; INT16 ShortNum; INT16 ShortArray[9]; INT8 ByteNum; INT8 ByteArray[33];};
Instances of this structure will maintain alignment, without padding.
54 February, 2010 Version 1.0

Appendix A: Sample Grouped ReportShell> dp -v -t 2000
DP Build Version: 2.2System Performance Timer Frequency: 2,267,684 (KHz)System Performance Timer counts UP from 0x0 to 0xFFFFFFFFFFFFFFFFMeasurements less than 1,000 microseconds are not displayed.
==[ Major Phases ]======== SEC Phase Duration: 174589 (us) PEI Phase Duration: 2910 (ms) DXE Phase Duration: 10050 (ms) BDS Phase Duration: 12926 (ms)Total Duration: 26060 (ms)
==[ Drivers by Handle ]========Index: Handle Driver Name Description Time(us)------------------------------------------------------------------------------- 81: [ 45] FwBlockService StartImage: 4949 94: [ 4E] MiscSubclass StartImage: 559927 97: [ 4F] FtwLite StartImage: 36132 101: [ 51] VariableRuntimeDxe StartImage: 28974 109: [ 55] MonotonicCounterRuntimeDxe StartImage: 31615 121: [123] StartImage: 8465003 124: [ 5B] Platform StartImage: 8491 148: [ 69] MemorySubClass StartImage: 98715 155: [ 6C] MpCpu StartImage: 33989 163: [ 70] GenericMemoryTestDxe StartImage: 175475 179: [ 78] SmmBase StartImage: 4434 1091: [ AC] LegacyBiosDxe StartImage: 15850 2355: [ B0] PciBusDxe DB:Start: 9955 2442: [ 93] BiosVideoDxe DB:Start: 5552333 2464: [ 9E] GraphicsConsoleDxe DB:Start: 1522423 2480: [ 95] ConPlatformDxe DB:Start: 8394 2499: [ 99] ConSplitterDxe DB:Start: 1801058 2796: [ 9F] TerminalDxe DB:Start: 5517 2854: [ 94] ConPlatformDxe DB:Start: 4842 2869: [ 95] ConPlatformDxe DB:Start: 3780 2901: [ 99] ConSplitterDxe DB:Start: 420482 3035: [ B4] EhciDxe DB:Start: 23926 3071: [ B9] UsbBusDxe DB:Start: 23964 3118: [ B4] EhciDxe DB:Start: 23924 3154: [ B9] UsbBusDxe DB:Start: 346304 3235: [ B9] UsbBusDxe DB:Start: 59998 3316: [ B9] UsbBusDxe DB:Start: 59999 3397: [ B9] UsbBusDxe DB:Start: 287169 3431: [ B5] UsbKbDxe DB:Start: 10650 3628: [ B9] UsbBusDxe DB:Start: 60002 3709: [ B9] UsbBusDxe DB:Start: 60003 7277: [ 80] Unknown Driver Name DB:Start: 149014 7355: [ 82] SnpDxe DB:Start: 147272 7400: [ 85] Ip4Dxe DB:Start: 2019 7442: [ 8C] IScsiDxe DB:Start: 5861
55 February, 2010 Version 1.0

Performance Optimization
8313: [ 80] Unknown Driver Name DB:Start: 149030 8391: [ 82] SnpDxe DB:Start: 147277 8436: [ 85] Ip4Dxe DB:Start: 2021 8478: [ 8C] IScsiDxe DB:Start: 587510876: [ B9] UsbBusDxe DB:Start: 1908010928: [ A2] Fat DB:Start: 210510956: [ AF] PartitionDxe DB:Start: 289511046: [ A2] Fat DB:Start: 503011162: [ AF] PartitionDxe DB:Start: 289811749: [ A6] IdeBusDxe DB:Start: 4306811911: [ A6] IdeBusDxe DB:Start: 4307221329: [ B9] UsbBusDxe DB:Start: 289421819: [ AF] PartitionDxe DB:Start: 286322362: [ A6] IdeBusDxe DB:Start: 200522477: [ A6] IdeBusDxe DB:Start: 200723196: [ AF] PartitionDxe DB:Start: 289523949: [ B9] UsbBusDxe DB:Start: 326124332: [120] Shell LoadImage: 381925700: [123] LoadImage: 353225701: [123] StartImage: 1802425924: [123] LoadImage: 356725925: [123] StartImage: 54466625972: [123] LoadImage: 358325973: [123] StartImage: 401508826020: [123] LoadImage: 357026021: [123] StartImage: 11077626068: [123] LoadImage: 358226069: [123] StartImage: 7696426116: [123] LoadImage: 359226117: [123] StartImage: 7844126164: [123] LoadImage: 359926165: [123] StartImage: 7848626388: [122] Unknown Driver Name LoadImage: 3623
==[ PEIMs ]========Index Pointer Value Instance Information Token ET (us)------------------------------------------------------------------------------- 12: 0x0000000000000000 Unknown Driver Name PEIM 4236 15: 0x0000000000000000 Unknown Driver Name PEIM 2338678
==[ General ]========Index Name(GUID) Description Time(us)------------------------------------------------------------------------------- 3: PreMem 2377641 12: PEIM 4236 15: PEIM 2338678 16: PostMem 525775 17: DisMem 26528 22: DxeMain CoreInitializeDispatcher 506277 23: DxeMain CoreDispatcher 9544115 2274: BDS PlatformBds 12905937 2275: PlatformBdsPolicyBehavior PlatformBds 12889607 2276: Full Config PBPB BootMode 12886240 2277: PlatformBdsConnectConsole 10416684 2278: PlatformBdsForceActiveVga ConnectConsole 8904134
56 February, 2010 Version 1.0

2279: Top ForceActiveVga 15844 2399: GetGopDevicePath ForceActiveVga 8885326 2400: Top GetGopDevicePath 8885314 2541: Bottom ForceActiveVga 2947 2586: ConnectAllDefaultConsoles ConnectConsole 1449801 2986: BDS ConOut 22564156 3823: Diagnostics & Connect Seq. Full Config 2205635 3912: BDS ConOut 2413612311750: IDE DiscoverIdeDevice 2048111752: IDE DiscoverIdeDevice 2048011754: IDE Finish IDE detection 2502114411912: IDE DiscoverIdeDevice 2048011914: IDE DiscoverIdeDevice 2048011916: IDE Finish IDE detection 2507029522363: IDE Finish IDE detection 2563484222478: IDE Finish IDE detection 2564483023548: BDS ConOut 2572509724197: PlatformBdsEnterFrontPage Full Config 24948224199: Zero Timeout Full Config 14296
==[ Cumulative ]========(Times in microsec.) Cumulative Average Shortest Longest Name Count Duration Duration Duration Duration------------------------------------------------------------------------------- LoadImage: 131 39072 298 5 3819 StartImage: 119 14460491 121516 1 8465003 DB:Start: 118 11049390 93638 0 5552333 DB:Support: 25965 11298 0 0 99
==[ Statistics ]========There were 26389 measurements taken, of which: 2 are incomplete. 4 are major execution phases. 26,319 have non-NULL handles, 70 are NULL. 15 are PEIMs. 66 are global measurements.
57 February, 2010 Version 1.0

Performance Optimization
58 February, 2010 Version 1.0
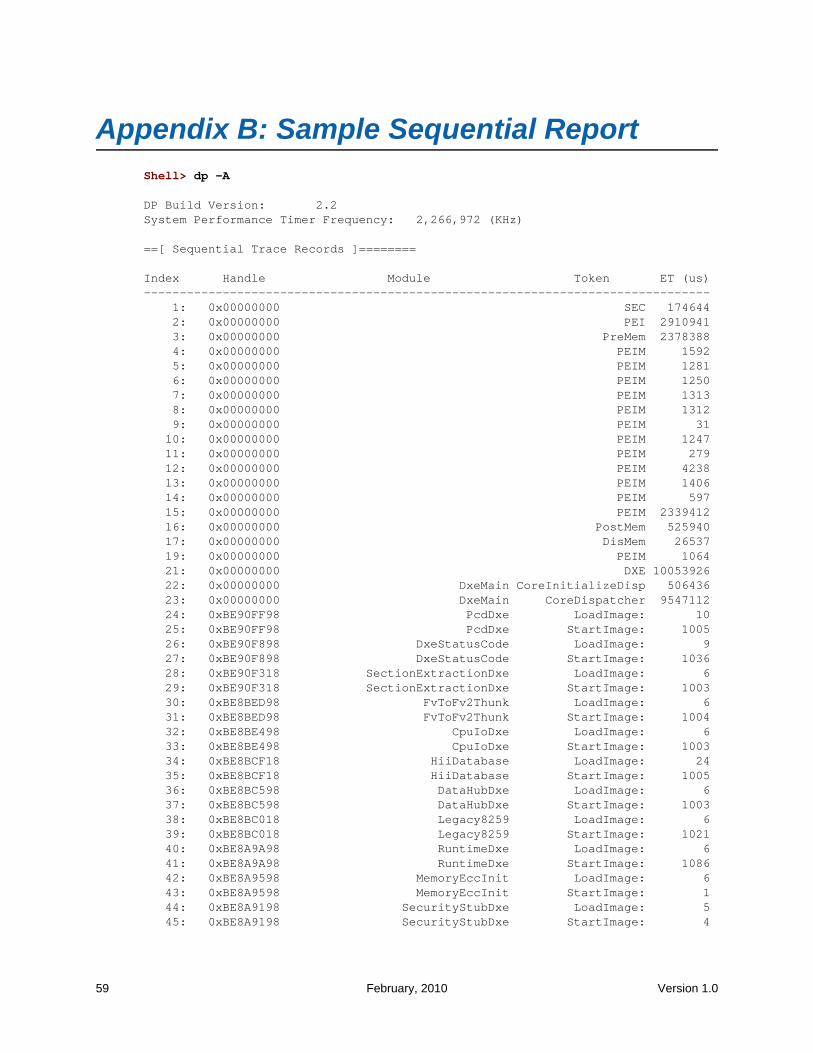
Appendix B: Sample Sequential ReportShell> dp -A
DP Build Version: 2.2System Performance Timer Frequency: 2,266,972 (KHz)
==[ Sequential Trace Records ]========
Index Handle Module Token ET (us)------------------------------------------------------------------------------- 1: 0x00000000 SEC 174644 2: 0x00000000 PEI 2910941 3: 0x00000000 PreMem 2378388 4: 0x00000000 PEIM 1592 5: 0x00000000 PEIM 1281 6: 0x00000000 PEIM 1250 7: 0x00000000 PEIM 1313 8: 0x00000000 PEIM 1312 9: 0x00000000 PEIM 31 10: 0x00000000 PEIM 1247 11: 0x00000000 PEIM 279 12: 0x00000000 PEIM 4238 13: 0x00000000 PEIM 1406 14: 0x00000000 PEIM 597 15: 0x00000000 PEIM 2339412 16: 0x00000000 PostMem 525940 17: 0x00000000 DisMem 26537 19: 0x00000000 PEIM 1064 21: 0x00000000 DXE 10053926 22: 0x00000000 DxeMain CoreInitializeDisp 506436 23: 0x00000000 DxeMain CoreDispatcher 9547112 24: 0xBE90FF98 PcdDxe LoadImage: 10 25: 0xBE90FF98 PcdDxe StartImage: 1005 26: 0xBE90F898 DxeStatusCode LoadImage: 9 27: 0xBE90F898 DxeStatusCode StartImage: 1036 28: 0xBE90F318 SectionExtractionDxe LoadImage: 6 29: 0xBE90F318 SectionExtractionDxe StartImage: 1003 30: 0xBE8BED98 FvToFv2Thunk LoadImage: 6 31: 0xBE8BED98 FvToFv2Thunk StartImage: 1004 32: 0xBE8BE498 CpuIoDxe LoadImage: 6 33: 0xBE8BE498 CpuIoDxe StartImage: 1003 34: 0xBE8BCF18 HiiDatabase LoadImage: 24 35: 0xBE8BCF18 HiiDatabase StartImage: 1005 36: 0xBE8BC598 DataHubDxe LoadImage: 6 37: 0xBE8BC598 DataHubDxe StartImage: 1003 38: 0xBE8BC018 Legacy8259 LoadImage: 6 39: 0xBE8BC018 Legacy8259 StartImage: 1021 40: 0xBE8A9A98 RuntimeDxe LoadImage: 6 41: 0xBE8A9A98 RuntimeDxe StartImage: 1086 42: 0xBE8A9598 MemoryEccInit LoadImage: 6 43: 0xBE8A9598 MemoryEccInit StartImage: 1 44: 0xBE8A9198 SecurityStubDxe LoadImage: 5 45: 0xBE8A9198 SecurityStubDxe StartImage: 4
59 February, 2010 Version 1.0
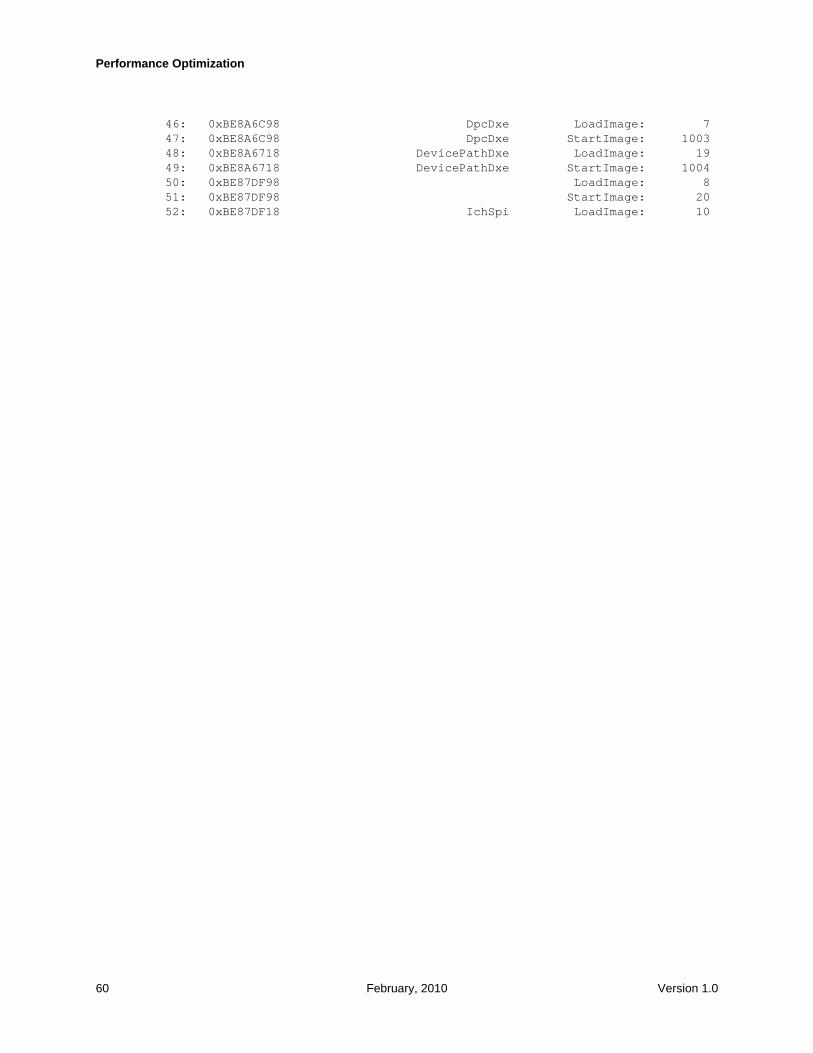
Performance Optimization
46: 0xBE8A6C98 DpcDxe LoadImage: 7 47: 0xBE8A6C98 DpcDxe StartImage: 1003 48: 0xBE8A6718 DevicePathDxe LoadImage: 19 49: 0xBE8A6718 DevicePathDxe StartImage: 1004 50: 0xBE87DF98 LoadImage: 8 51: 0xBE87DF98 StartImage: 20 52: 0xBE87DF18 IchSpi LoadImage: 10
60 February, 2010 Version 1.0
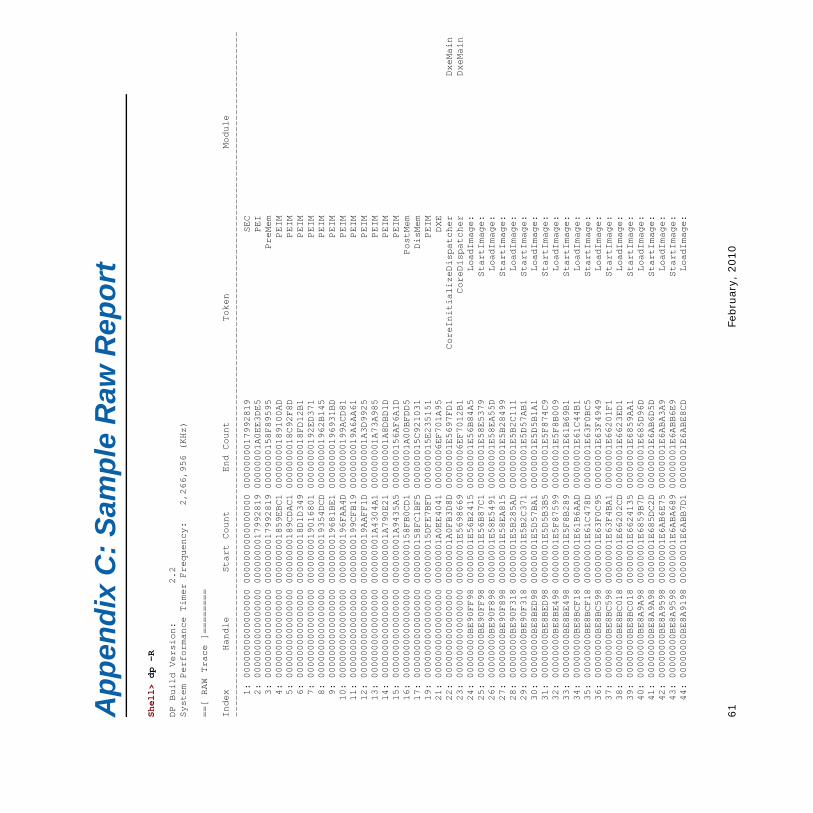
61
Febru
ary,
2010
Ver
sion 1
.0
---------
DxeMain
DxeMain
Ap
pen
dix
C:
Sam
ple
Raw
Rep
ort
Shell> dp -R
DP Build Version: 2.2
System Performance Timer Frequency: 2,266,956 (KHz)
==[ RAW Trace ]========
Index Handle Start Count End Count Token Module
------------------------------------------------------------------------------------------------------------------
1: 0000000000000000 0000000000000000 0000000017992819 SEC
2: 0000000000000000 0000000017992819 00000001A0EE3DE5 PEI
3: 0000000000000000 0000000017992819 0000000158F89595 PreMem
4: 0000000000000000 000000001859EBC1 00000000189100AD PEIM
5: 0000000000000000 00000000189CDAC1 0000000018C92F8D PEIM
6: 0000000000000000 0000000018D1D349 0000000018FD12B1 PEIM
7: 0000000000000000 0000000019016801 00000000192ED371 PEIM
8: 0000000000000000 0000000019354DCD 000000001962B145 PEIM
9: 0000000000000000 0000000019681BE1 00000000196931BD PEIM
10: 0000000000000000 00000000196FAA4D 00000000199ACD81 PEIM
11: 0000000000000000 00000000199CFB19 0000000019A6AA61 PEIM
12: 0000000000000000 0000000019AAFF1D 000000001A3D9925 PEIM
13: 0000000000000000 000000001A4304A1 000000001A73A985 PEIM
14: 0000000000000000 000000001A790E21 000000001A8DBD1D PEIM
15: 0000000000000000 000000001A9435A5 0000000156AF6A1D PEIM
16: 0000000000000000 0000000158FB0CD1 00000001A00BFDD5 PostMem
17: 0000000000000000 0000000158FC1BF5 000000015C921031 DisMem
19: 0000000000000000 000000015DFE7BFD 000000015E235151 PEIM
21: 0000000000000000 00000001A0EE4041 00000006EF701A95 DXE
22: 0000000000000000 00000001A0FB3D8D 00000001E5697FD1 CoreInitializeDispatcher
23: 0000000000000000 00000001E5698669 00000006EF7012B1 CoreDispatcher
24: 00000000BE90FF98 00000001E56B2415 00000001E56B84A5 LoadImage:
25: 00000000BE90FF98 00000001E56B87C1 00000001E58E5379 StartImage:
26: 00000000BE90F898 00000001E58E5491 00000001E58EA55D LoadImage:
27: 00000000BE90F898 00000001E58EA815 00000001E5B28499 StartImage:
28: 00000000BE90F318 00000001E5B285AD 00000001E5B2C111 LoadImage:
29: 00000000BE90F318 00000001E5B2C371 00000001E5D57AB1 StartImage:
30: 00000000BE8BED98 00000001E5D57BA1 00000001E5D5B1A1 LoadImage:
31: 00000000BE8BED98 00000001E5D5B3B5 00000001E5F874C9 StartImage:
32: 00000000BE8BE498 00000001E5F87599 00000001E5F8B009 LoadImage:
33: 00000000BE8BE498 00000001E5F8B289 00000001E61B69B1 StartImage:
34: 00000000BE8BCF18 00000001E61B6AAD 00000001E61C44B1 LoadImage:
35: 00000000BE8BCF18 00000001E61C478D 00000001E63F0BC5 StartImage:
36: 00000000BE8BC598 00000001E63F0C95 00000001E63F4949 LoadImage:
37: 00000000BE8BC598 00000001E63F4BA1 00000001E66201F1 StartImage:
38: 00000000BE8BC018 00000001E66202CD 00000001E6623ED1 LoadImage:
39: 00000000BE8BC018 00000001E6624135 00000001E6859AA1 StartImage:
40: 00000000BE8A9A98 00000001E6859B7D 00000001E685D96D LoadImage:
41: 00000000BE8A9A98 00000001E685DC2D 00000001E6AB6D5D StartImage:
42: 00000000BE8A9598 00000001E6AB6E75 00000001E6ABA3A9 LoadImage:
43: 00000000BE8A9598 00000001E6ABA689 00000001E6ABB6E9 StartImage:
44: 00000000BE8A9198 00000001E6ABB7D1 00000001E6ABE8CD LoadImage:

62
Febru
ary,
2010
Ver
sion 1
.0
45: 00000000BE8A9198 00000001E6ABF1C5 00000001E6AC1761 StartImage:
46: 00000000BE8A6C98 00000001E6AC18B1 00000001E6AC5A4D LoadImage:
47: 00000000BE8A6C98 00000001E6AC5D25 00000001E6CF1401 StartImage:
48: 00000000BE8A6718 00000001E6CF1509 00000001E6CFBD65 LoadImage:
49: 00000000BE8A6718 00000001E6CFC06D 00000001E6F27BD9 StartImage:
50: 00000000BE87DF98 00000001E6F27CDD 00000001E6F2C911 LoadImage:
51: 00000000BE87DF98 00000001E6F2CC19 00000001E6F384C9 StartImage:
52: 00000000BE87DF18 00000001E6F3862D 00000001E6F3E5CD LoadImage:

Appendix D: Pre-defined Measurements
The following tables list, by package, the measurement points which are pre-defined in EDK II. Platform-specific measurement points may also be present depending upon the codebase being used and are beyond the scope of this document.
Table 3. MdeModulePkg Measurement Points
Token Module Description
Core/Dxe/DxeMain.c
PEI The end of the PEI phase, and beginning of the DXE phase is in the DxeMain function following the point where all PEI data has been copied into Dxe and all of the Library constructors have been called.
DXE
CoreInitializeDispatcher DxeMain In the DxeMain function, the duration of the call to CoreInitializeDispatcher is measured.
CoreDispatcher DxeMain In the DxeMain function, the duration of the call to CoreDispatcher is measured.
Core/Dxe/Hand/DriverSupport.c
DB:Support Measurement from within the CoreConnectSingleController function of the duration of the call to DriverBinding-->Supported()
DB:Start Measurement from within the CoreConnectSingleController function of the duration of the call to DriverBinding-->Start()
Core/Dxe/Image/Image.c
LoadImage: Duration of the CoreLoadImageCommon() call from CoreLoadImage()
StartImage: CoreStartImage() duration, minus the time for the call to CoreLoadedImageInfo() at the beginning. There are two PERF_END macros used for this measurement in order to cover both the successful and failure returns.
Core/Pei/Dispatcher/Dispatcher.c
PEIM Shadow PEIM’s entry point duration when the PEIM is shadowed into main memory.
PEIM Dispatch PEIM’s entry point duration when the PEIM is dispatched due to a satisfied dependency expression.
PEIM PeimFileHandle PEIM’s entry point duration when the PEIM is dispatched due to a processing of notifies.
Core/Pei/PeiMain/PeiMain.c
PreMem Duration of the first invocation of PeiCore(), before main memory has been discovered and configured.
63 February, 2010 Version 1.0
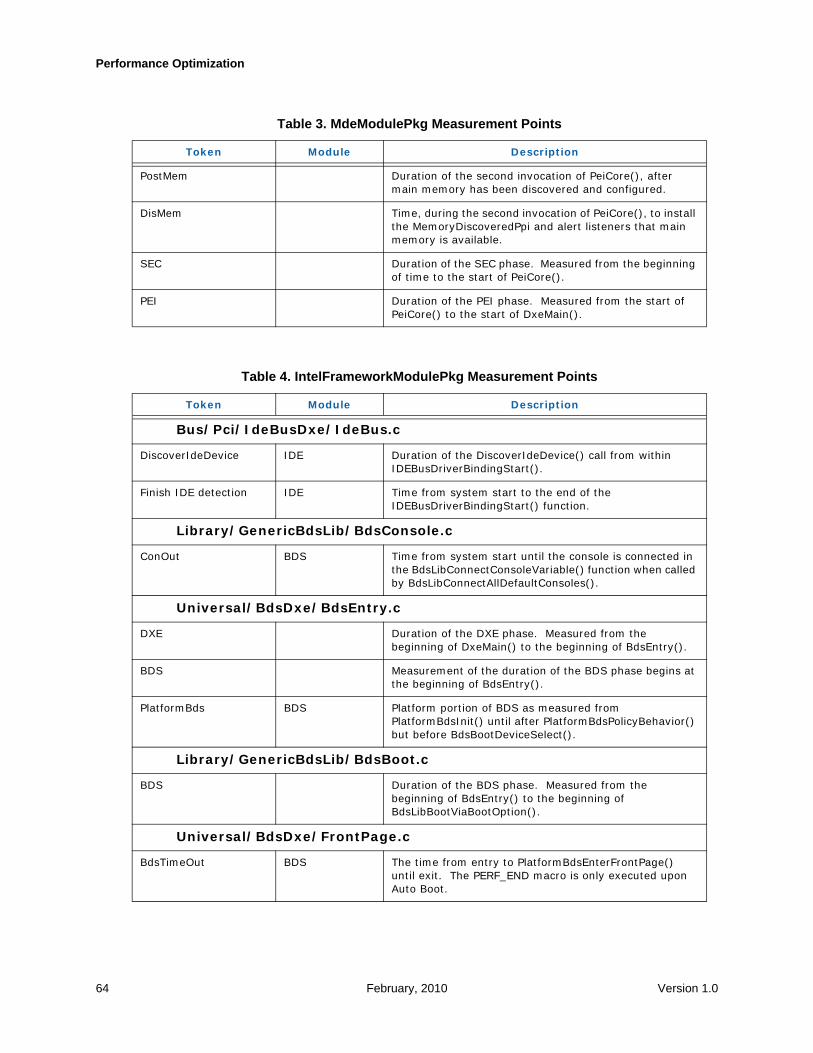
Performance Optimization
PostMem Duration of the second invocation of PeiCore(), after main memory has been discovered and configured.
DisMem Time, during the second invocation of PeiCore(), to install the MemoryDiscoveredPpi and alert listeners that main memory is available.
SEC Duration of the SEC phase. Measured from the beginning of time to the start of PeiCore().
PEI Duration of the PEI phase. Measured from the start of PeiCore() to the start of DxeMain().
Table 4. IntelFrameworkModulePkg Measurement Points
Token Module Description
Bus/Pci/IdeBusDxe/IdeBus.c
DiscoverIdeDevice IDE Duration of the DiscoverIdeDevice() call from within IDEBusDriverBindingStart().
Finish IDE detection IDE Time from system start to the end of the IDEBusDriverBindingStart() function.
Library/GenericBdsLib/BdsConsole.c
ConOut BDS Time from system start until the console is connected in the BdsLibConnectConsoleVariable() function when called by BdsLibConnectAllDefaultConsoles().
Universal/BdsDxe/BdsEntry.c
DXE Duration of the DXE phase. Measured from the beginning of DxeMain() to the beginning of BdsEntry().
BDS Measurement of the duration of the BDS phase begins at the beginning of BdsEntry().
PlatformBds BDS Platform portion of BDS as measured from PlatformBdsInit() until after PlatformBdsPolicyBehavior() but before BdsBootDeviceSelect().
Library/GenericBdsLib/BdsBoot.c
BDS Duration of the BDS phase. Measured from the beginning of BdsEntry() to the beginning of BdsLibBootViaBootOption().
Universal/BdsDxe/FrontPage.c
BdsTimeOut BDS The time from entry to PlatformBdsEnterFrontPage() until exit. The PERF_END macro is only executed upon Auto Boot.
Table 3. MdeModulePkg Measurement Points
Token Module Description
64 February, 2010 Version 1.0