edp energias do brasil | 2011 4q11 results presentation
TRANSCRIPT
EDP Energias do Brasil | 2011
4Q11 Results Presentation

This presentation may include forward-looking statements of future events or results according to regulations of the Brazilian and international securities and exchange commissions, These statements are based on certain assumptions and analysis by the company that reflect its experience, the economic environment and future market conditions and expected events, many of which are beyond the control of the company, Important factors that may lead to significant differences between the actual results and the statements of expectations about future events or results include the company’s business strategy, Brazilian and international economic conditions, technology, financial strategy, public service industry developments, hydrological conditions, financial market conditions, uncertainty of the results of future operations, plans, objectives, expectations and intentions, among others, Considering these factors, the actual results of the company may be significantly different from those shown or implicit in the statement of expectations about future events or results,
The information and opinions contained in this presentation should not be understood as a recommendation to potential investors and no investment decision is to be based on the veracity, current events or completeness of this information or these opinions, No advisors to the company or parties related to them or their representatives shall have any responsibility for whatever losses that may result from the use or contents of this presentation,
This material includes forward-looking statements subject to risks and uncertainties, which are based on current expectations and projections about future events and trends that may affect the company’s business, These statements include projections of economic growth and energy demand and supply, as well as information about the competitive position, the regulatory environment, potential opportunities for growth and other matters, Several factors may adversely affect the estimates and assumptions on which these statements are based,
Disclaimer
2
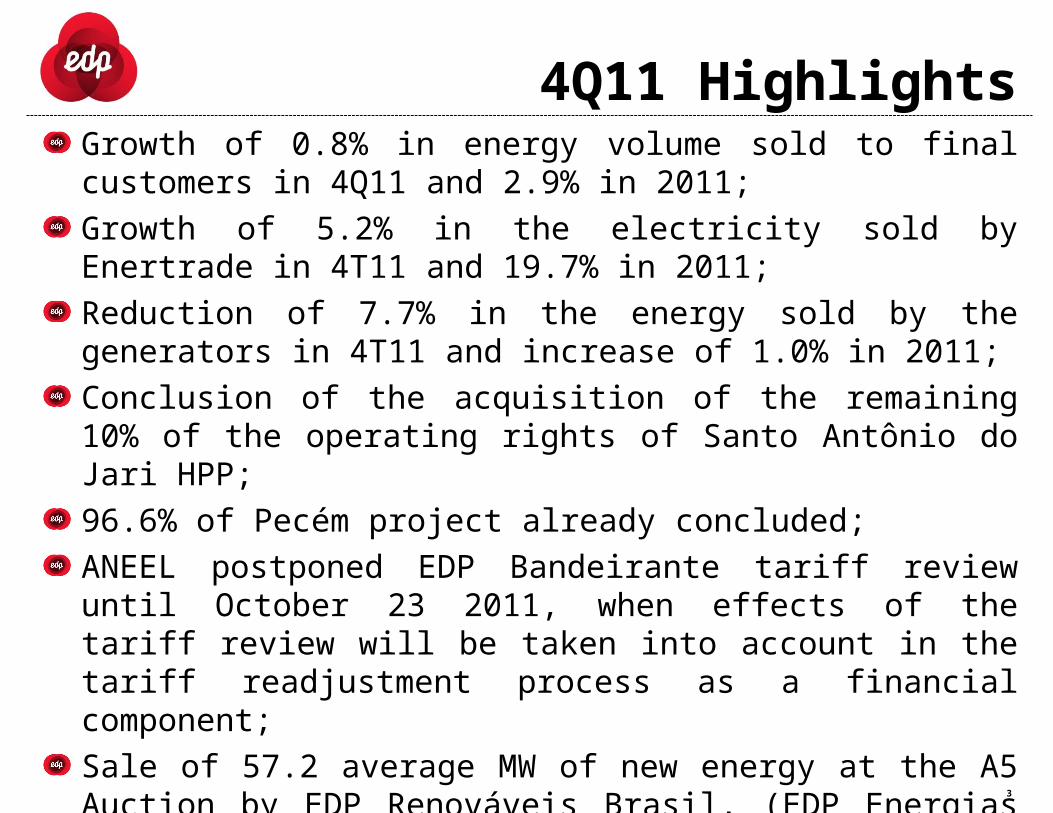
Growth of 0.8% in energy volume sold to final customers in 4Q11 and 2.9% in 2011;Growth of 5.2% in the electricity sold by Enertrade in 4T11 and 19.7% in 2011;Reduction of 7.7% in the energy sold by the generators in 4T11 and increase of 1.0% in 2011;Conclusion of the acquisition of the remaining 10% of the operating rights of Santo Antônio do Jari HPP;96.6% of Pecém project already concluded; ANEEL postponed EDP Bandeirante tariff review until October 23 2011, when effects of the tariff review will be taken into account in the tariff readjustment process as a financial component; Sale of 57.2 average MW of new energy at the A5 Auction by EDP Renováveis Brasil, (EDP Energias do Brasil stake: 45% );Reduction in distribution losses: -0.8 p.p. at EDP Bandeirante and -1.22 p.p. at EDP Escelsa in annual comparison.
4Q11 Highlights
3

Non-recurring Events (4Q11)Impacts on EBITDA: - R$ 10.5 million
Provision with respect to revenue from the billing of fines for surpassing demand limits and exceeding reactive energy levels, as from October 23 2011 to December 31 2011 (+R$ 7.3 million);Accounting gain from the acquisition of ECE Participações S.A. based on a market valuation report in accordance with international practices – CPC 15 and CPC 18 (-R$ 10.2 million);Expenditures with improvements to the company’s offices, installation and standardization of a new customer service outlet in São José dos Campos and the moving of the Guarulhos’s Distribution Center to a new site (+R$ 2.2 million);Provisions for contingencies related to the Cruzado Plan (+R$ 5.6 million) and arbitration proceedings of Energest with respect to the building of São João SHP (+R$ 5.6 million);Non-recurring impact in 4Q10 of a revaluation and partial reversal in the outstanding balance of actuarial liabilities for post-employment benefits provided by the distributors (+R$ 12.1 million).

LOSSESENERGY SALES VOLUME
Operating Performance
2,386 GWh4Q10
2,202 GWh4Q11-7.7%
Generation
Commercialization
5,967 GWh4Q10
6,087 GWh4Q112.0%
Distribution
DISTRIBUTION CONSUMPTION MIX2,225 GWh
4Q102,339 GWh
4Q115.2%
dec/10 -Band
sec/11 -Band
dec/11 -Band
dec/10 -Escelsa
sec/11 -Escelsa
dec/11 -Escelsa
5.5% 5.5% 5.5%8.3% 7.7% 7.4%
5.6% 4.8% 4.7%
5.7% 5.6% 5.4%
11.1% 10.3% 10.3%
14.0%13.2% 12.8%
Technical Comercial
Residential34.9%
Industrial29.2% Commercial
21.2%
Rural4.4%
Other10.3%

Financial Performance (R$ MM)
MANEAGEBLE EXPENDITURES (without D&A) OPEX/GROSS MARGIN EVOLUTION (%)
EBITDANET REVENUE
R$ 1,363 4Q10
R$ 1,355 4Q11
-0.6%
R$ 3824Q10
R$ 3014Q11-
21.3%
R$ 5,034 2010
R$ 5,402 2011
+7.3%
R$ 1,5092010
R$ 1,5382011+1.9%
2007 2008 2009 2010 2011
45.9%
37.8%33.3% 34.2%
35.9%
1.5%*
4Q11 4Q10 2011 2010
34% 31% 33% 32%
2% 3% 3% 3%
43% 46% 40% 41%
12% 7% 10% 11%8% 13% 14% 13%
247,853 198,972 861,194 784,184
Personnel Material Third-party services Provisions Other
* impacts of non-recurring effects in the periods.
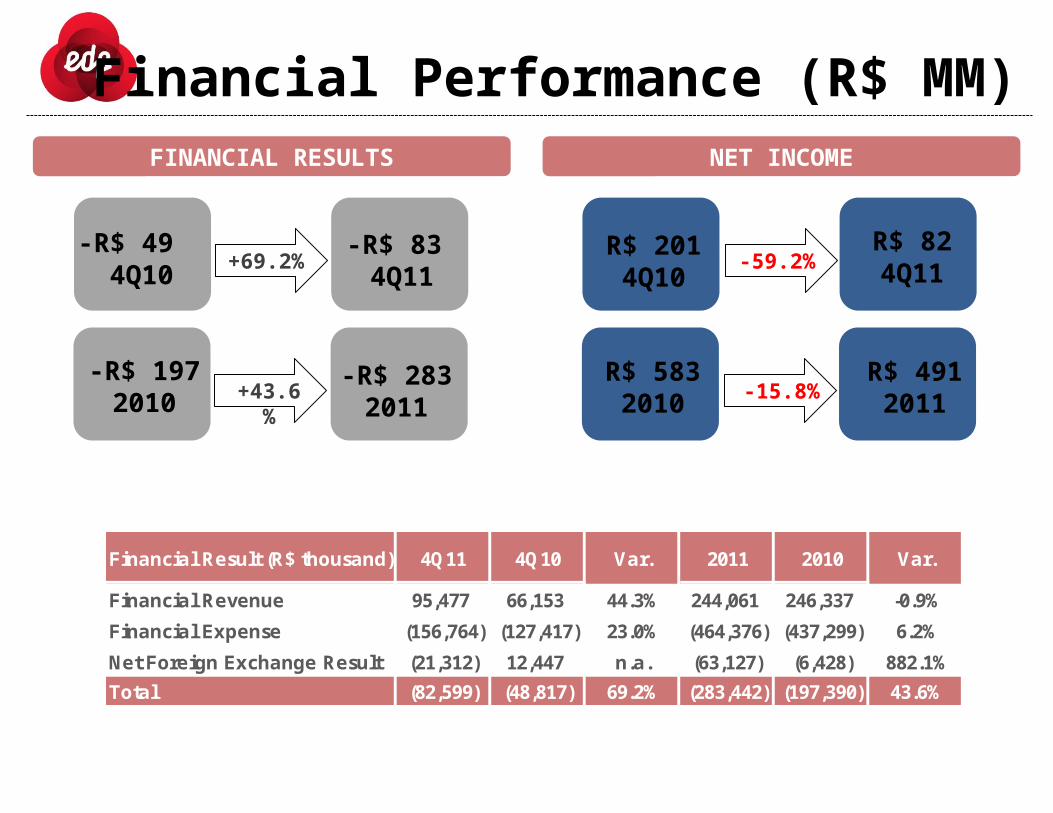
Financial Performance (R$ MM)FINANCIAL RESULTS NET INCOME
-R$ 49 4Q10
-R$ 83 4Q11
+69.2%
R$ 2014Q10
R$ 824Q11-
59.2%
-R$ 197 2010
-R$ 283 2011
+43.6%
R$ 5832010
R$ 4912011-
15.8%
Financial Result (R$ thousand) 4Q11 4Q10 Var. 2011 2010 Var.
Financial Revenue 95,477 66,153 44.3% 244,061 246,337 -0.9%
Financial Expense (156,764) (127,417) 23.0% (464,376) (437,299) 6.2%
Net Foreign Exchange Result (21,312) 12,447 n.a. (63,127) (6,428) 882.1%
Total (82,599) (48,817) 69.2% (283,442) (197,390) 43.6%
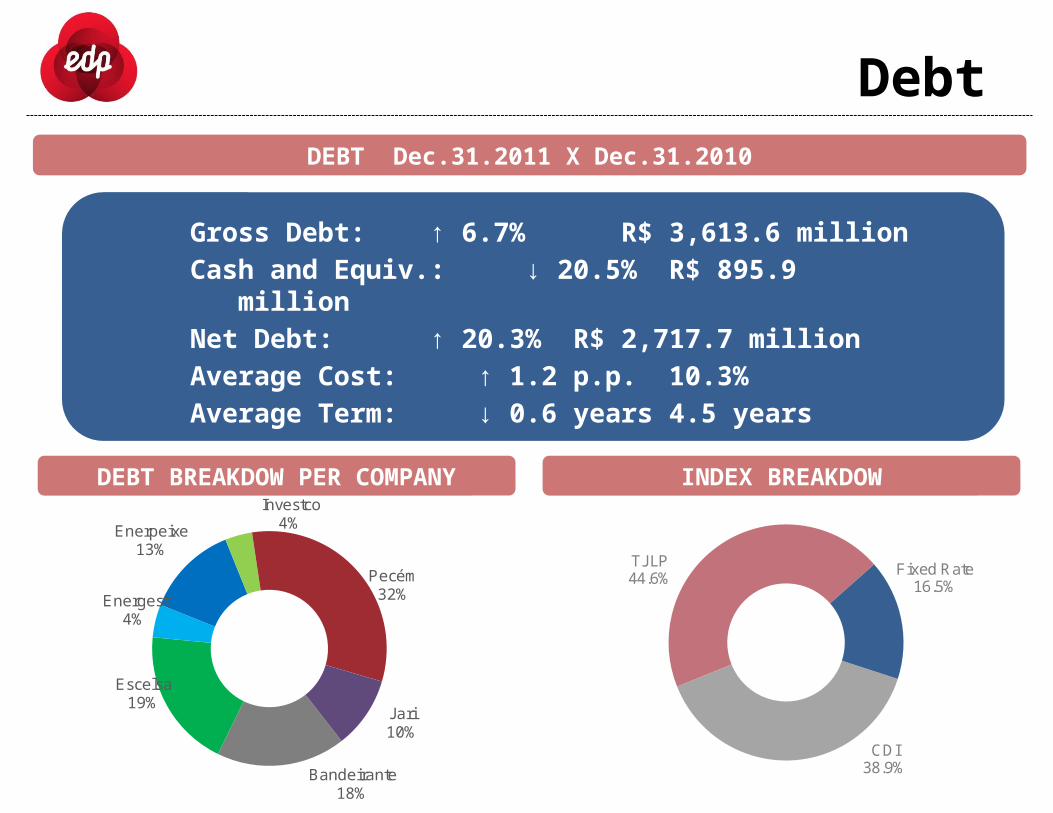
Debt DEBT Dec.31.2011 X Dec.31.2010
Gross Debt: ↑ 6.7% R$ 3,613.6 millionCash and Equiv.: ↓ 20.5% R$ 895.9 millionNet Debt: ↑ 20.3% R$ 2,717.7 millionAverage Cost: ↑ 1.2 p.p. 10.3%Average Term: ↓ 0.6 years 4.5 years
INDEX BREAKDOWDEBT BREAKDOW PER COMPANY
Bandeirante18%
Escelsa19%
Energest4%
Enerpeixe13%
Investco4%
Pecém32%
Jari10%
CDI38.9%
TJLP44.6%
Fixed Rate16.5%
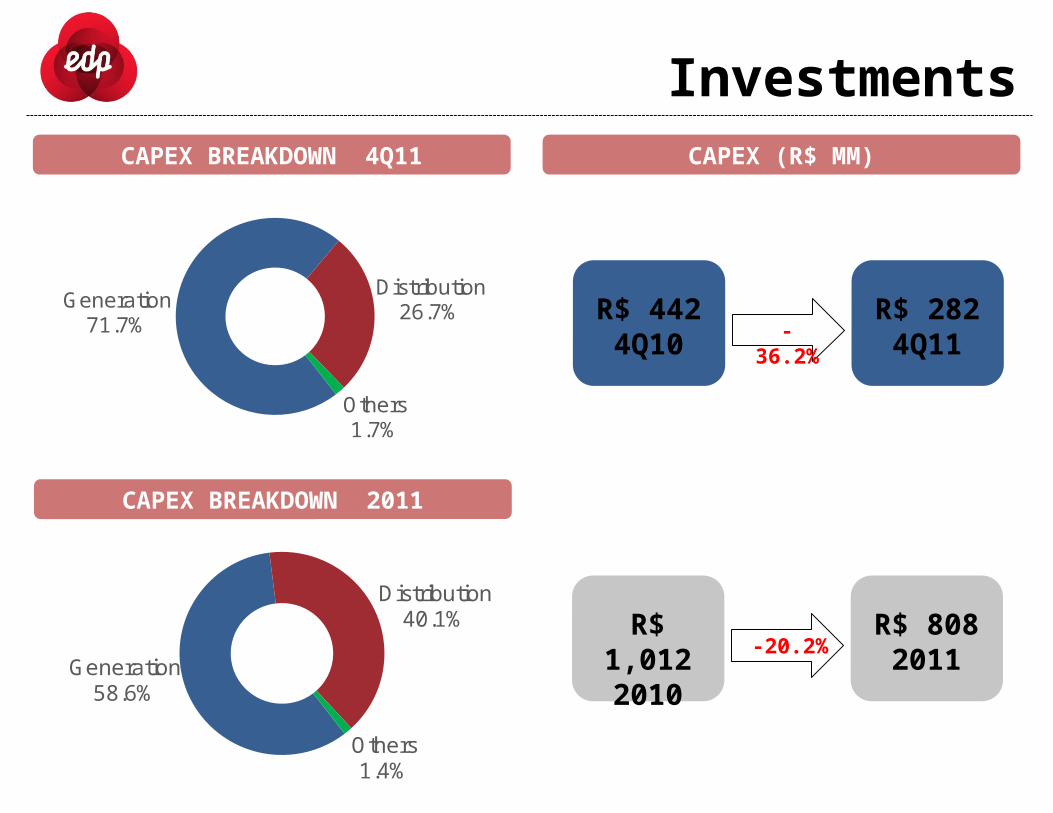
InvestmentsCAPEX BREAKDOWN 4Q11 CAPEX (R$ MM)
R$ 4424Q10
R$ 2824Q11-
36.2%
R$ 1,0122010
R$ 8082011-
20.2%
CAPEX BREAKDOWN 2011
Generation71.7%
Distribution26.7%
Others1.7%
Composição do Capex - 3T11
Generation58.6%
Distribution40.1%
Others1.4%
Composição do Capex - 2011
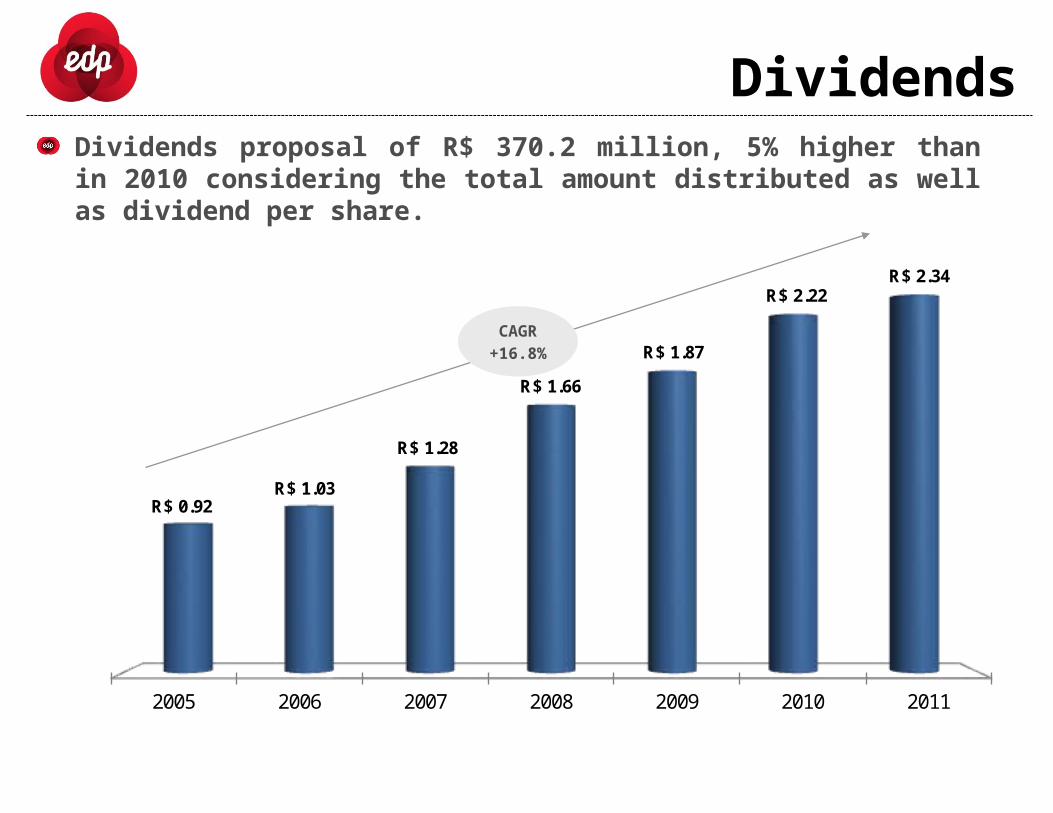
DividendsDividends proposal of R$ 370.2 million, 5% higher than in 2010 considering the total amount distributed as well as dividend per share.
CAGR
+16.8%
2005 2006 2007 2008 2009 2010 2011
R$ 0.92R$ 1.03
R$ 1.28
R$ 1.66
R$ 1.87
R$ 2.22R$ 2.34

www.edpbr.com.br/ri
Maytê Souza Dantas de AlbuquerqueLeandro Salles SantosMarilia Barbosa NogueiraRogério Kovacevic PachecoFelipe Rhavy de Campos Antunes
E-mail: [email protected]: +55 11 2185-5907Site: www.edpbr.com.br/ir