edsa. corner quezon avenue, philippine statistics · pdf filefood consumption and nutrition...
TRANSCRIPT
FOOD CONSUMPTION AND NUTRITION
PHILIPPINE STATISTICS AUTHORITY
ISSN-2012-0435
REPORT No. 2017-6
PHILIPPINE STATISTICS AUTHORITY 16
th Floor. ETON Cyberpod Centris 3
EDSA. Corner Quezon Avenue, Quezon City
www.psa.gov.ph
Republic of the Philippines
Philippine Statistics Authority

FOOD CONSUMPTION AND NUTRITION
PHILIPPINE STATISTICS AUTHORITY
TERMS OF USE Agricultural Indicators System (AIS) is a publication of the Philippine Statistics Authority. The PSA reserves exclusive right to reproduce this publication in whatever form. Should any portion of this publication be included in a report/article, the title of the publication and the PSA should be cited as the source of the data. The PSA will not be responsible for any information derived from the processing of data contained in this publication.
ISSN-2012-0435 OCTOBER 2017
FOOD CONSUMPTION AND NUTRITION
PHILIPPINE STATISTICS AUTHORITY
TABLE OF CONTENTS Table 4c.
Percentage shares of food in the total family expenditures
by region, Philippines, 2003, 2006, 2009, 2012 and 2015
Philippines 43.1 41.4 42.6 42.8 41.9
NCR 37.8 35.9 36.2 36.5 36.3
CAR 42.9 40.8 39.0 40.8 39.4
Ilocos Region 48 44.7 46.0 45.3 44.4
Cagayan Valley 46.6 44.3 44.6 49.4 46.9
Central Luzon 45.2 40.9 43.6 43.7 42.0
CALABARZON 41.2 39.3 41.9 40.6 39.8
MIMAROPA 44.8 44.6 45.0 46.4 44.4
Bicol Region 45.4 45.2 47.4 49.0 48.0
Western Visayas 44.1 44.1 44.5 44.4 45.6
Central Visayas 45.4 44.8 45.0 44.5 44.3
Eastern Visayas 46.4 43.2 45.5 45.8 44.9
Zamboanga Peninsula 46.5 45.9 46.5 49.0 48.2
Northern Mindanao 44 43.2 44.7 43.8 40.6
Davao Region 45.5 45.6 46.2 47.6 43.6
SOCCSKSARGEN 48.2 48 45.8 48.2 44.7
ARMM 53.5 53.9 56.4 59.8 59.0
Caraga 47.4 45.6 46.8 47.5 45.3
2015REGION 2003 2006 2009 2012
iii 12
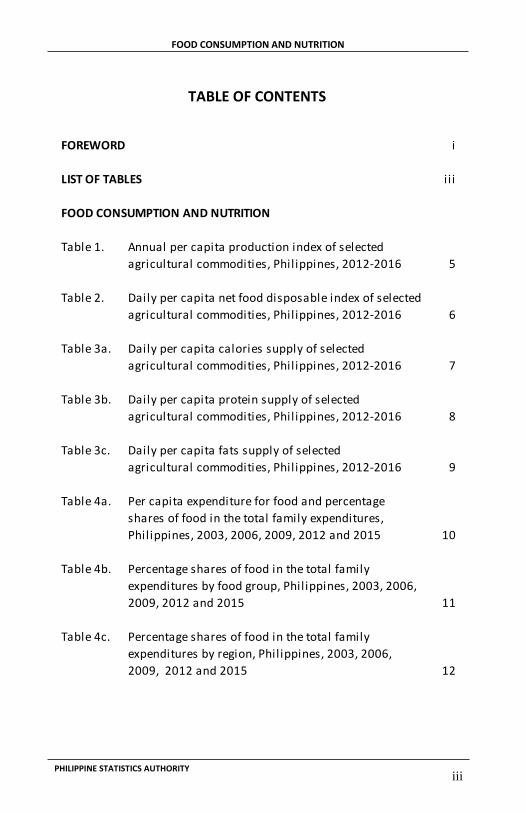
FOREWORD i
LIST OF TABLES i i i
FOOD CONSUMPTION AND NUTRITION
Table 1. Annual per capita production index of selected
agricultural commodities, Philippines, 2012-2016 5
Table 2. Daily per capita net food disposable index of selected
agricultural commodities, Philippines, 2012-2016 6
Table 3a. Daily per capita calories supply of selected
agricultural commodities, Philippines, 2012-2016 7
Table 3b. Daily per capita protein supply of selected
agricultural commodities, Philippines, 2012-2016 8
Table 3c. Daily per capita fats supply of selected
agricultural commodities, Philippines, 2012-2016 9
Table 4a. Per capita expenditure for food and percentage
shares of food in the total family expenditures,
Philippines, 2003, 2006, 2009, 2012 and 2015 10
Table 4b. Percentage shares of food in the total family
expenditures by food group, Philippines, 2003, 2006,
2009, 2012 and 2015 11
Table 4c. Percentage shares of food in the total family
expenditures by region, Philippines, 2003, 2006,
2009, 2012 and 2015 12
FOOD CONSUMPTION AND NUTRITION
PHILIPPINE STATISTICS AUTHORITY
10
Table 4a.
Per capita expenditure for food and percentage shares of food in the
total family expenditures, Philippines, 2003, 2006, 2009, 2012 and 2015
2003 2,038,471 10,730 43.1
2006 2,561,437 12,193 41.4
2009 3,239,186 14,962 42.6
2012 4,125,312 18,088 42.8
2015 4,882,860 20,144 41.9
Source of data: FIES, Philippine Statistics Authority
YEAR
TOTAL
EXPENDITURES
(in million persos)
SHARE OF FOOD
IN THE TOTAL
EXPENDITURES
(in percent)
PER CAPITA
EXPENDITURES
FOR FOOD
(in pesos)
FOOD CONSUMPTION AND NUTRITION
PHILIPPINE STATISTICS AUTHORITY
1 8
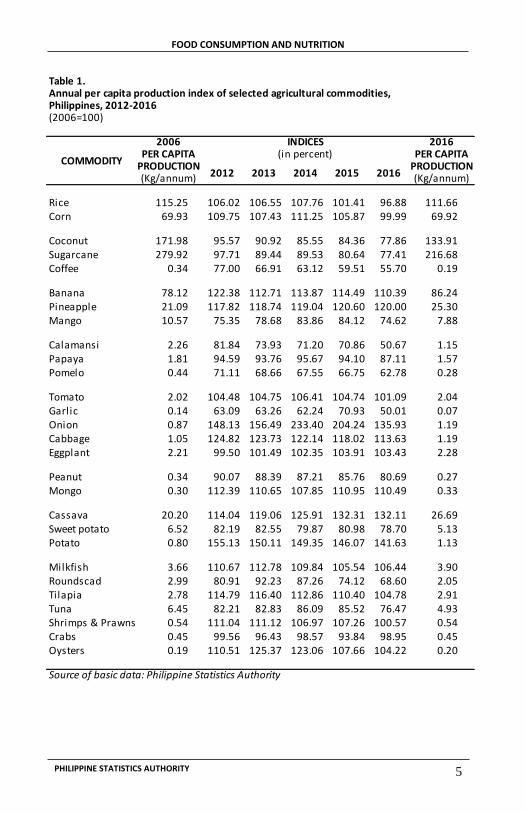
Per Capita Production Per capita production refers to the volume of production of a particular commodity available for each member of the population. Annual per capita production index provides information on the change in the per capita production of the commodity in a given year compared to a base year. It measures the capacity of the country’s agriculture sector to produce food commodities in pace with the growth of the population. In 2016, the annual per capita production of rice dropped to 111.66 kilograms and it was below the 2006 record. This was equivalent to production index of 96.88 percent indicating that the 2016 per capita production of rice was 3.12 percentage points lower than the base year level. Similarly, corn per capita production declined to 69.92 kilograms in 2016 by less than one percentage point from the 2006 level with its index estimated at 99.99 percent. The per capita production of coconut, sugarcane and coffee continued its downtrend in 2016 and remained lower than the 2006 production records. Their respective 2016 per capita production estimates were 133.91 kilograms, 216.68 kilograms and 0.19 kilogram. For the reference fruits, the 2016 production indices were 110.39 percent for banana and 120.00 percent for pineapple. This implies that the annual production levels per person of banana at 86.24 kilograms and pineapple at 25.30 kilograms exceeded the 2006 levels by 10.39 percentage points and 20.00 percentage points, respectively. Lower than the base year production levels were observed for mango, calamansi, papaya and pomelo. Vegetables and rootcrops such as tomato, onion, cabbage, eggplant, mongo, cassava and potato exhibited decresing per capita production in 2016 but still surpassed the base year levels. Potato production at 1.13 kilograms per person in 2016 posted the biggest production index of 141.63 percent. This was followed by onion and cassava with production indices of 135.93 percent and 132.11 percent, respectively. These corresponded to annual per capita production at 1.19 kilograms and 26.69 kilograms in 2016. The per capita production estimates of garlic, peanut and sweet potato in 2016 stayed lower than the base year records.
Table 3b.Daily per capita protein supply of selected agricultural commodities,Philippines, 2012-2016(in grams)
COMMODITY 2012 2013 2014 2015 2016
Rice 24.43 23.76 23.50 22.94 22.16Corn 4.57 4.99 5.71 5.35 5.86
Coconut 0.38 0.36 0.34 0.34 0.31Sugarcane 0.02 0.01 0.01 0.01 0.01Coffee 0.08 0.06 0.04 0.08 0.08
Banana 0.90 0.72 0.70 0.95 0.92Pineapple 0.06 0.05 0.06 0.06 0.05Mango 0.08 0.08 0.09 0.09 0.08
Calamansi 0.02 0.02 0.02 0.02 0.01Papaya 0.02 0.02 0.02 0.02 0.02Pomelo 0.00 0.00 0.00 0.00 0.00
Tomato 0.04 0.04 0.04 0.04 0.03Garlic 0.05 0.04 0.11 0.24 0.19Onion 0.04 0.04 0.06 0.06 0.07Cabbage 0.03 0.03 0.03 0.03 0.03Eggplant 0.05 0.05 0.05 0.05 0.05
Peanut 0.40 0.31 0.45 0.48 0.47Mongo 0.40 0.41 0.36 0.38 0.38
Cassava 0.06 0.06 0.06 0.07 0.07Sweet potato 0.10 0.10 0.09 0.10 0.09Potato 0.04 0.04 0.04 0.04 0.04
Beef 1.92 1.92 2.05 2.04 2.15Carabeef 0.76 0.68 0.75 0.75 0.73Pork 15.87 16.16 16.49 16.85 17.53Chevon 0.35 0.35 0.35 0.35 0.34
Chicken 10.67 10.91 11.37 11.98 12.24Duck 0.20 0.19 0.19 0.18 0.18Chicken egg 5.04 5.03 4.80 5.06 5.16
Milkfish 0.74 0.75 0.73 0.70 0.71Roundscad 0.44 0.50 0.48 0.41 0.38Tilapia 0.87 0.87 0.85 0.84 0.80Tuna 1.05 1.09 1.17 1.36 1.17Shrimps & Prawns 0.15 0.14 0.13 0.14 0.13Crabs 0.10 0.08 0.09 0.09 0.09Oysters 0.06 0.07 0.07 0.06 0.06
FOOD CONSUMPTION AND NUTRITION
PHILIPPINE STATISTICS AUTHORITY
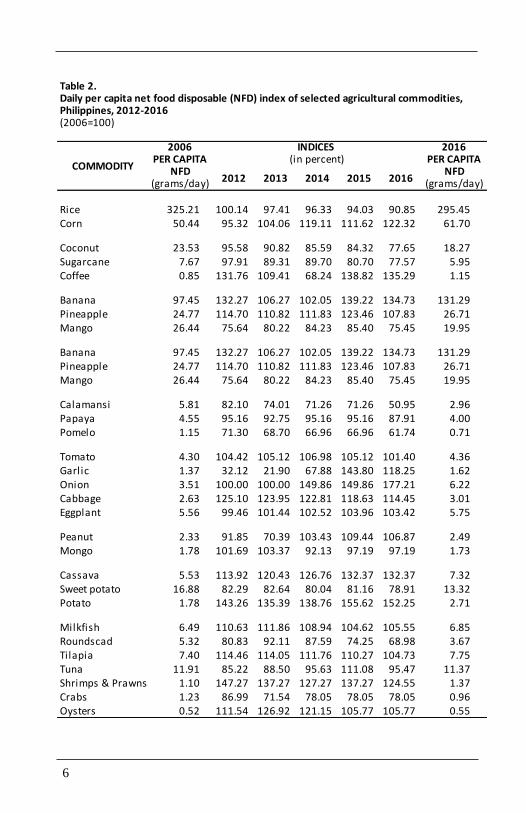
For the fishery products, tilapia, oysters and shrimps and prawns showed declining production indices ranging from 100.57 percent to 104.78 percent. However, their production levels in 2016 continued to exceed the 2006 levels. Per capita production of milkfish reached 3.90 kilograms in 2016 with index increasing to 106.44 percent. Below the base year per capita production was continuously recorded in roundscad, tuna and crabs (Table 1). Daily Per Capita Net Food Disposable (NFD) Net Food Disposable (NFD) refers to the volume of commodity available in its original (unprocessed) form for human consumption. Data on NFD are sourced from the Supply Utilization Accounts. It is the remaining balance after all the "use" parameters are taken into account. The daily net food disposable of a commodity of each member of the population measured through an index indicates the movement of food available for consumption in a specified year relative to a base year. The daily per capita NFD of rice in 2016 was reduced to 295.45 grams. At an estimated index of 90.85 percent, this shows that the quantity of rice available for consumption in 2016 was lower by 9.15 percentage points compared with the 2006 record. In contrast, the NFD of corn moved up to 61.70 grams per day in 2016. It posted an index of 122.32 percent, or 22.32 percentage points higher than the base year NFD. Below the base year’s daily per capita NFD continued for coconut and sugarcane with 2016 NFD recorded at 18.27 grams and 5.95 grams, respectively. NFD of coffee at 1.15 grams per day corresponded to an index of 135.29 percent in 2016. Despite the reduction in the NFDs of banana to 131.29 grams and pineapple to 26.71 grams in 2016, these still exceeded the 2006 levels. The highest NFD index was noted in banana at 134.73 percent while this was 107.83 percent in pineapple. Downtrends in NFD were likewise observed in mango, calamansi, papaya and pomelo and these remained lower than the base year records.
7 2
Table 3a.Daily per capita calories supply of selected agricultural commodities,Philippines, 2012-2016(in grams)
COMMODITY 2012 2013 2014 2015 2016
Rice 1162.64 1130.94 1118.45 1091.74 1054.76Corn 171.16 186.86 213.88 200.43 219.65
Coconut 41.38 39.32 37.06 36.51 33.62Sugarcane 2.25 2.06 2.06 1.86 1.79Coffee 0.53 0.44 0.27 0.55 0.54
Banana 77.34 62.14 59.67 81.40 78.77Pineapple 7.39 7.14 7.20 7.95 6.94Mango 9.00 9.54 10.02 10.16 8.98
Calamansi 1.24 1.12 1.08 1.08 0.77Papaya 1.13 1.10 1.13 1.13 1.04Pomelo 0.39 0.38 0.37 0.37 0.34
Tomato 0.76 0.77 0.78 0.77 0.74Garlic 0.57 0.39 1.21 2.56 2.11Onion 1.09 1.09 1.63 1.63 1.93Cabbage 0.63 0.62 0.61 0.59 0.57Eggplant 0.12 0.12 0.12 0.12 0.12
Peanut 8.86 6.79 9.98 10.56 10.31Mongo 6.17 6.27 5.59 5.90 5.90
Cassava 6.87 7.26 7.64 7.98 7.98Sweet potato 12.78 12.83 12.43 12.60 12.25Potato 1.71 1.61 1.65 1.86 1.82
Beef 13.29 13.29 14.18 14.13 14.89Carabeef 6.93 6.20 6.81 6.87 6.65Pork 166.67 169.80 173.26 176.99 184.12Chevon 2.95 2.95 2.95 2.95 2.88
Chicken 86.97 88.92 92.70 97.64 99.81Duck 3.16 3.03 3.03 2.90 2.82Chicken egg 65.40 65.28 62.31 65.58 66.88
Milkfish 4.60 4.65 4.52 4.35 4.38Roundscad 2.75 3.14 2.98 2.53 2.35Tilapia 5.42 5.40 5.29 5.22 4.96Tuna 6.50 6.75 7.29 8.47 7.28Shrimps & Prawns 0.76 0.71 0.66 0.71 0.64Crabs 0.50 0.41 0.45 0.45 0.45Oysters 0.41 0.47 0.45 0.39 0.39
Sources of basic data: Food and Agriculture Organization and Philippine Statistics Authority
FOOD CONSUMPTION AND NUTRITION
PHILIPPINE STATISTICS AUTHORITY
In 2016, the daily per capita NFD estimates of tomato, garlic, cabbage, eggplant, peanut and potato were going down but stayed higher than their 2006 records. NFD indices ranged from 101.40 percent in tomato to 152.25 percent in potato. Onion exhibited the biggest index at 177.21 percent as NFD surged from an 3.51 grams in 2006 to 6.22 grams in 2016. On the other hand, lower than the base year NFD was continuously reported for sweet potato and mongo. Among the fishery products, shrimps and prawns continued to register the biggest NFD index although it dropped to 124.55 percent in 2016. In this year, NFD of shrimps and prawns was placed at 1.37 grams per day per person. Similar trend was observed in tilapia with NFD estimates at 7.75 grams and an index at 104.73 percent. An increasing and above the base year NFD was recorded in milkfish at 6.85 grams per person per day in 2016. Its index was estimated at 105.55 percent. Below the 2006 NFD levels were noted for roundscad and crabs. Tuna exhibited significant reduction in NFD to 11.37 grams in 2016 as it fell below the 2006 record (Table 2).
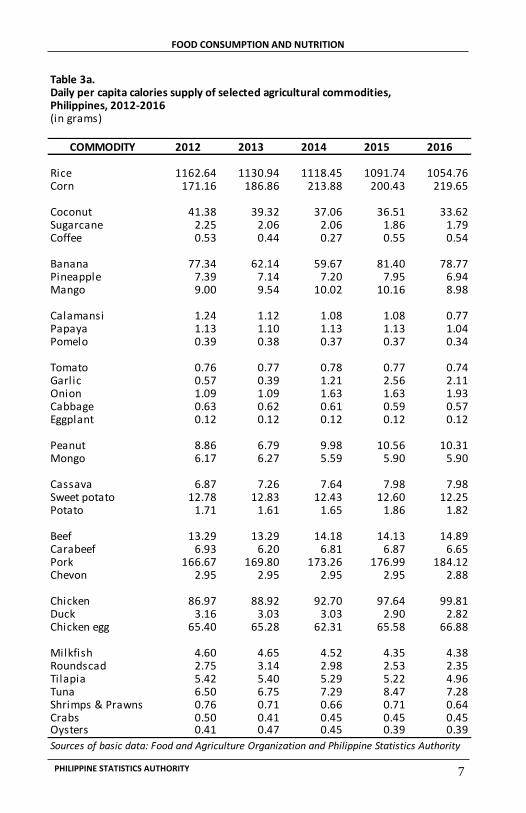
Per Capita Supply of Calories, Protein and Fats Information on the nutrient equivalents of the different food intake measured on per capita per day basis will show the food items that contributed the highest content of calories, protein and fats. Rice was the prime source of calories. In 2016, it provided 1,054.76 grams of calories per day per person. Corn contributed 219.65 grams of calories. Among the commercial crops, the highest daily calorie content was noted for coconut at 33.62 grams per person. Sugarcane supplied only 1.79 grams of calories while less than 1.0 gram of calorie was obtained from coffee. Among the fruits, banana provided the biggest quantity of calories at 78.77 grams per person daily. Only 6.94 grams were sourced from pineapple while 8.98 grams from mango. In the case of rootcrops, more calories were sourced from cassava at 7.98 grams, peanut at 10.31 grams and sweet potato at 12.25 grams. For the livestock and poultry products, pork, chicken and chicken eggs were the major sources of calories containing 184.12 grams, 99.81 grams and 66.88 grams, respectively. In the case of fishery products, bigger supply of calories came from milkfish, roundscad, tilapia and tuna ranging from 2.35 grams to 7.28 grams per person daily (Table 3a).
3 6
Table 2.Daily per capita net food disposable (NFD) index of selected agricultural commodities,Philippines, 2012-2016(2006=100)
2006 INDICES 2016PER CAPITA (in percent) PER CAPITA
NFD NFD(grams/day) (grams/day)
Rice 325.21 100.14 97.41 96.33 94.03 90.85 295.45Corn 50.44 95.32 104.06 119.11 111.62 122.32 61.70
Coconut 23.53 95.58 90.82 85.59 84.32 77.65 18.27Sugarcane 7.67 97.91 89.31 89.70 80.70 77.57 5.95Coffee 0.85 131.76 109.41 68.24 138.82 135.29 1.15
Banana 97.45 132.27 106.27 102.05 139.22 134.73 131.29Pineapple 24.77 114.70 110.82 111.83 123.46 107.83 26.71Mango 26.44 75.64 80.22 84.23 85.40 75.45 19.95
Banana 97.45 132.27 106.27 102.05 139.22 134.73 131.29Pineapple 24.77 114.70 110.82 111.83 123.46 107.83 26.71Mango 26.44 75.64 80.22 84.23 85.40 75.45 19.95
Calamansi 5.81 82.10 74.01 71.26 71.26 50.95 2.96Papaya 4.55 95.16 92.75 95.16 95.16 87.91 4.00Pomelo 1.15 71.30 68.70 66.96 66.96 61.74 0.71
Tomato 4.30 104.42 105.12 106.98 105.12 101.40 4.36Garlic 1.37 32.12 21.90 67.88 143.80 118.25 1.62Onion 3.51 100.00 100.00 149.86 149.86 177.21 6.22Cabbage 2.63 125.10 123.95 122.81 118.63 114.45 3.01Eggplant 5.56 99.46 101.44 102.52 103.96 103.42 5.75
Peanut 2.33 91.85 70.39 103.43 109.44 106.87 2.49Mongo 1.78 101.69 103.37 92.13 97.19 97.19 1.73
Cassava 5.53 113.92 120.43 126.76 132.37 132.37 7.32Sweet potato 16.88 82.29 82.64 80.04 81.16 78.91 13.32Potato 1.78 143.26 135.39 138.76 155.62 152.25 2.71
Milkfish 6.49 110.63 111.86 108.94 104.62 105.55 6.85Roundscad 5.32 80.83 92.11 87.59 74.25 68.98 3.67Tilapia 7.40 114.46 114.05 111.76 110.27 104.73 7.75Tuna 11.91 85.22 88.50 95.63 111.08 95.47 11.37Shrimps & Prawns 1.10 147.27 137.27 127.27 137.27 124.55 1.37Crabs 1.23 86.99 71.54 78.05 78.05 78.05 0.96Oysters 0.52 111.54 126.92 121.15 105.77 105.77 0.55
COMMODITY2012 2013 2014 2015 2016
FOOD CONSUMPTION AND NUTRITION
PHILIPPINE STATISTICS AUTHORITY
5 4
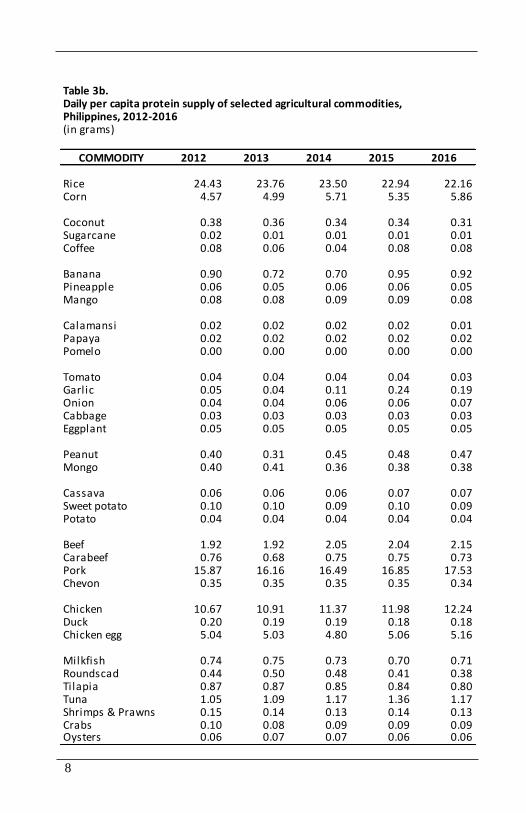
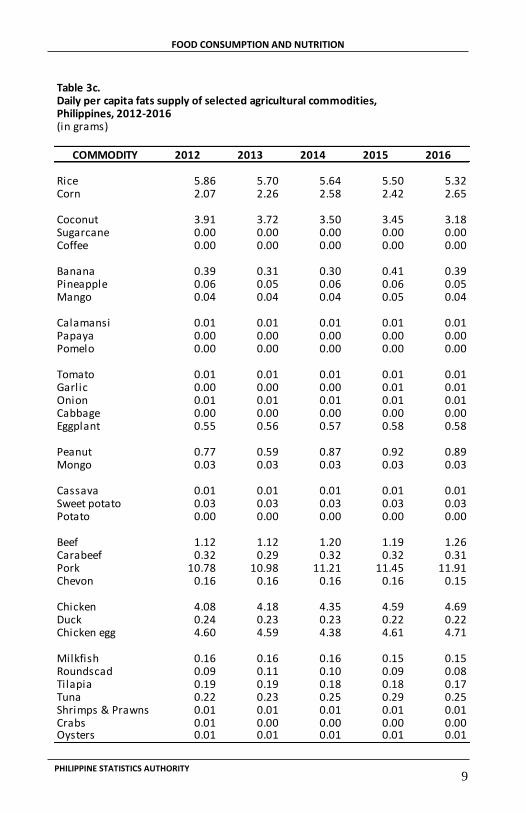
In 2016, the daily per capita protein supply of rice was 22.16 grams while that of corn, at 5.86 grams. Other leading sources of protein were pork at 17.53 grams and chicken at 12.24 grams. Chicken egg was another good source as it supplied 5.16 grams of protein. The protein content of beef was 2.15 grams. Among the reference fishery products, tuna contributed more protein supply at 1.17 grams (Table 3b). For fats supply, about 5.32 grams were derived from rice and 2.65 grams were obtained from corn. Coconut contributed 3.18 grams of fats per person daily. For livestock and poultry products, pork supplied about 11.91 grams of fats while chicken and chicken eggs contained around 5.0 grams of fats each. Minimal supply of fats came from other agricultural commodities (Table 3c).
Food Expenditures
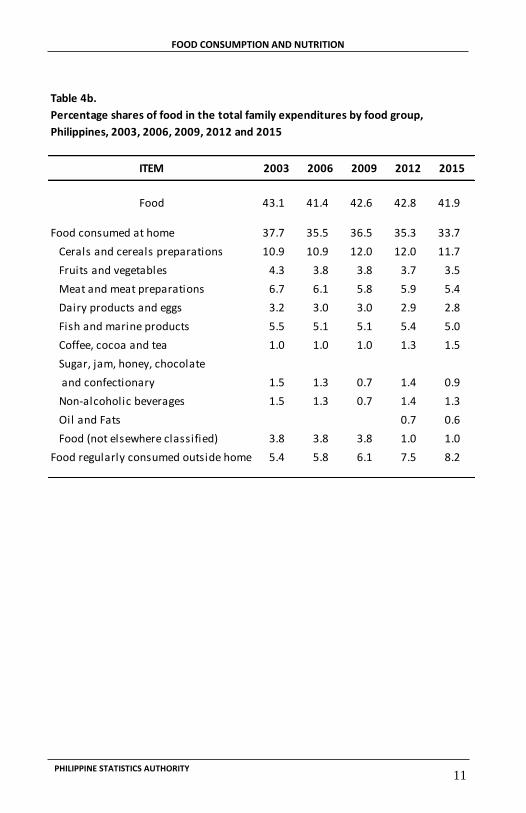
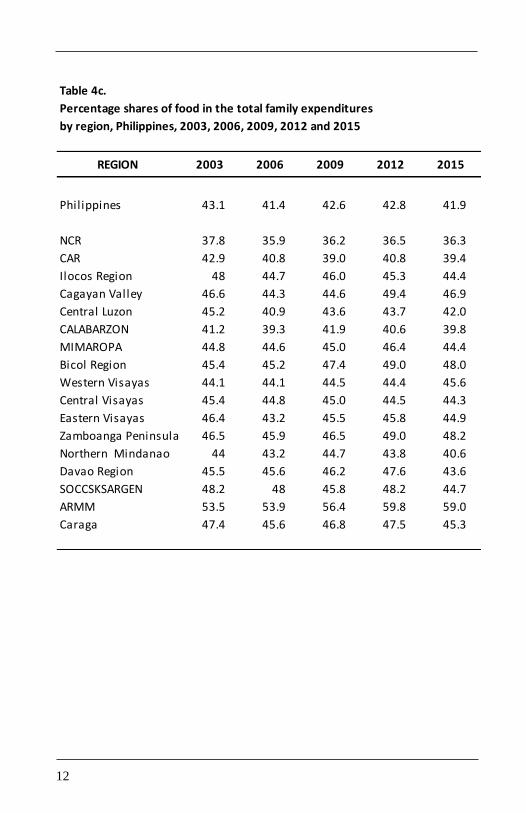
Based on the results of the 2015 Family Income and Expenditures Survey (FIES), the country’s expenditures summed up to 4.88 trillion in 2015, higher by 18.36 percent compared with 2012 record at 4.12 trillion. Similarly, food expenditures per person rose to P20,144 in 2015. This was 11.37 percent more than the 2012 estimates (Table 4a). In 2015, the proportion of food in the total family expenditures slid from 42.8 percent in 2012 to 41.9 percent in 2015. Of this proportion, 33.7 percent constituted the food consumed at home and 8.2 percent were spent for food regularly consumed outside the home. Among the foods eaten at home, cereals and cereals preparation got the biggest share at 11.7 percent. Around 5.0 percent each comprised the expenditures for meat and meat preparations and fish and marine products. Fruits and vegetables accounted for only 3.5 percent. Oil and fats shared the least at 0.6 percent (Table 4b). In all regions except Western Visayas, food recorded a declining shares in the total family expenditures in 2015 as compared with the 2012 records. The biggest proportion of food expenditures was reported in ARMM at 59.0 percent. This was followed by Zamboanga Peninsula at 48.2 percent and Bicol Region at 48.0 percent. About 44.3 percent to 46.9 percent shares were noted in Ilocos Region, Cagayan Valley, MIMAROPA, Western, Central and Eastern Visayas, SOCCSKSARGEN and Caraga. In NCR, only 36.3 percent of the total family expenditures were allocated for food (Table 4c).
Table 1.Annual per capita production index of selected agricultural commodities, Philippines, 2012-2016(2006=100)
2006 INDICES 2016PER CAPITA (in percent) PER CAPITA
PRODUCTION PRODUCTION(Kg/annum) (Kg/annum)
Rice 115.25 106.02 106.55 107.76 101.41 96.88 111.66Corn 69.93 109.75 107.43 111.25 105.87 99.99 69.92
Coconut 171.98 95.57 90.92 85.55 84.36 77.86 133.91Sugarcane 279.92 97.71 89.44 89.53 80.64 77.41 216.68Coffee 0.34 77.00 66.91 63.12 59.51 55.70 0.19
Banana 78.12 122.38 112.71 113.87 114.49 110.39 86.24Pineapple 21.09 117.82 118.74 119.04 120.60 120.00 25.30Mango 10.57 75.35 78.68 83.86 84.12 74.62 7.88
Calamansi 2.26 81.84 73.93 71.20 70.86 50.67 1.15Papaya 1.81 94.59 93.76 95.67 94.10 87.11 1.57Pomelo 0.44 71.11 68.66 67.55 66.75 62.78 0.28
Tomato 2.02 104.48 104.75 106.41 104.74 101.09 2.04Garlic 0.14 63.09 63.26 62.24 70.93 50.01 0.07Onion 0.87 148.13 156.49 233.40 204.24 135.93 1.19Cabbage 1.05 124.82 123.73 122.14 118.02 113.63 1.19Eggplant 2.21 99.50 101.49 102.35 103.91 103.43 2.28
Peanut 0.34 90.07 88.39 87.21 85.76 80.69 0.27Mongo 0.30 112.39 110.65 107.85 110.95 110.49 0.33
Cassava 20.20 114.04 119.06 125.91 132.31 132.11 26.69Sweet potato 6.52 82.19 82.55 79.87 80.98 78.70 5.13Potato 0.80 155.13 150.11 149.35 146.07 141.63 1.13
Milkfish 3.66 110.67 112.78 109.84 105.54 106.44 3.90Roundscad 2.99 80.91 92.23 87.26 74.12 68.60 2.05Tilapia 2.78 114.79 116.40 112.86 110.40 104.78 2.91Tuna 6.45 82.21 82.83 86.09 85.52 76.47 4.93Shrimps & Prawns 0.54 111.04 111.12 106.97 107.26 100.57 0.54Crabs 0.45 99.56 96.43 98.57 93.84 98.95 0.45Oysters 0.19 110.51 125.37 123.06 107.66 104.22 0.20
Source of basic data: Philippine Statistics Authority
2012 2013 2014 2015 2016COMMODITY
FOOD CONSUMPTION AND NUTRITION
PHILIPPINE STATISTICS AUTHORITY
5 4
In 2016, the daily per capita protein supply of rice was 22.16 grams while that of corn, at 5.86 grams. Other leading sources of protein were pork at 17.53 grams and chicken at 12.24 grams. Chicken egg was another good source as it supplied 5.16 grams of protein. The protein content of beef was 2.15 grams. Among the reference fishery products, tuna contributed more protein supply at 1.17 grams (Table 3b). For fats supply, about 5.32 grams were derived from rice and 2.65 grams were obtained from corn. Coconut contributed 3.18 grams of fats per person daily. For livestock and poultry products, pork supplied about 11.91 grams of fats while chicken and chicken eggs contained around 5.0 grams of fats each. Minimal supply of fats came from other agricultural commodities (Table 3c).
Food Expenditures
Based on the results of the 2015 Family Income and Expenditures Survey (FIES), the country’s expenditures summed up to 4.88 trillion in 2015, higher by 18.36 percent compared with 2012 record at 4.12 trillion. Similarly, food expenditures per person rose to P20,144 in 2015. This was 11.37 percent more than the 2012 estimates (Table 4a). In 2015, the proportion of food in the total family expenditures slid from 42.8 percent in 2012 to 41.9 percent in 2015. Of this proportion, 33.7 percent constituted the food consumed at home and 8.2 percent were spent for food regularly consumed outside the home. Among the foods eaten at home, cereals and cereals preparation got the biggest share at 11.7 percent. Around 5.0 percent each comprised the expenditures for meat and meat preparations and fish and marine products. Fruits and vegetables accounted for only 3.5 percent. Oil and fats shared the least at 0.6 percent (Table 4b). In all regions except Western Visayas, food recorded a declining shares in the total family expenditures in 2015 as compared with the 2012 records. The biggest proportion of food expenditures was reported in ARMM at 59.0 percent. This was followed by Zamboanga Peninsula at 48.2 percent and Bicol Region at 48.0 percent. About 44.3 percent to 46.9 percent shares were noted in Ilocos Region, Cagayan Valley, MIMAROPA, Western, Central and Eastern Visayas, SOCCSKSARGEN and Caraga. In NCR, only 36.3 percent of the total family expenditures were allocated for food (Table 4c).
Table 1.Annual per capita production index of selected agricultural commodities, Philippines, 2012-2016(2006=100)
2006 INDICES 2016PER CAPITA (in percent) PER CAPITA
PRODUCTION PRODUCTION(Kg/annum) (Kg/annum)
Rice 115.25 106.02 106.55 107.76 101.41 96.88 111.66Corn 69.93 109.75 107.43 111.25 105.87 99.99 69.92
Coconut 171.98 95.57 90.92 85.55 84.36 77.86 133.91Sugarcane 279.92 97.71 89.44 89.53 80.64 77.41 216.68Coffee 0.34 77.00 66.91 63.12 59.51 55.70 0.19
Banana 78.12 122.38 112.71 113.87 114.49 110.39 86.24Pineapple 21.09 117.82 118.74 119.04 120.60 120.00 25.30Mango 10.57 75.35 78.68 83.86 84.12 74.62 7.88
Calamansi 2.26 81.84 73.93 71.20 70.86 50.67 1.15Papaya 1.81 94.59 93.76 95.67 94.10 87.11 1.57Pomelo 0.44 71.11 68.66 67.55 66.75 62.78 0.28
Tomato 2.02 104.48 104.75 106.41 104.74 101.09 2.04Garlic 0.14 63.09 63.26 62.24 70.93 50.01 0.07Onion 0.87 148.13 156.49 233.40 204.24 135.93 1.19Cabbage 1.05 124.82 123.73 122.14 118.02 113.63 1.19Eggplant 2.21 99.50 101.49 102.35 103.91 103.43 2.28
Peanut 0.34 90.07 88.39 87.21 85.76 80.69 0.27Mongo 0.30 112.39 110.65 107.85 110.95 110.49 0.33
Cassava 20.20 114.04 119.06 125.91 132.31 132.11 26.69Sweet potato 6.52 82.19 82.55 79.87 80.98 78.70 5.13Potato 0.80 155.13 150.11 149.35 146.07 141.63 1.13
Milkfish 3.66 110.67 112.78 109.84 105.54 106.44 3.90Roundscad 2.99 80.91 92.23 87.26 74.12 68.60 2.05Tilapia 2.78 114.79 116.40 112.86 110.40 104.78 2.91Tuna 6.45 82.21 82.83 86.09 85.52 76.47 4.93Shrimps & Prawns 0.54 111.04 111.12 106.97 107.26 100.57 0.54Crabs 0.45 99.56 96.43 98.57 93.84 98.95 0.45Oysters 0.19 110.51 125.37 123.06 107.66 104.22 0.20
Source of basic data: Philippine Statistics Authority
2012 2013 2014 2015 2016COMMODITY
FOOD CONSUMPTION AND NUTRITION
PHILIPPINE STATISTICS AUTHORITY
In 2016, the daily per capita NFD estimates of tomato, garlic, cabbage, eggplant, peanut and potato were going down but stayed higher than their 2006 records. NFD indices ranged from 101.40 percent in tomato to 152.25 percent in potato. Onion exhibited the biggest index at 177.21 percent as NFD surged from an 3.51 grams in 2006 to 6.22 grams in 2016. On the other hand, lower than the base year NFD was continuously reported for sweet potato and mongo. Among the fishery products, shrimps and prawns continued to register the biggest NFD index although it dropped to 124.55 percent in 2016. In this year, NFD of shrimps and prawns was placed at 1.37 grams per day per person. Similar trend was observed in tilapia with NFD estimates at 7.75 grams and an index at 104.73 percent. An increasing and above the base year NFD was recorded in milkfish at 6.85 grams per person per day in 2016. Its index was estimated at 105.55 percent. Below the 2006 NFD levels were noted for roundscad and crabs. Tuna exhibited significant reduction in NFD to 11.37 grams in 2016 as it fell below the 2006 record (Table 2).
Per Capita Supply of Calories, Protein and Fats Information on the nutrient equivalents of the different food intake measured on per capita per day basis will show the food items that contributed the highest content of calories, protein and fats. Rice was the prime source of calories. In 2016, it provided 1,054.76 grams of calories per day per person. Corn contributed 219.65 grams of calories. Among the commercial crops, the highest daily calorie content was noted for coconut at 33.62 grams per person. Sugarcane supplied only 1.79 grams of calories while less than 1.0 gram of calorie was obtained from coffee. Among the fruits, banana provided the biggest quantity of calories at 78.77 grams per person daily. Only 6.94 grams were sourced from pineapple while 8.98 grams from mango. In the case of rootcrops, more calories were sourced from cassava at 7.98 grams, peanut at 10.31 grams and sweet potato at 12.25 grams. For the livestock and poultry products, pork, chicken and chicken eggs were the major sources of calories containing 184.12 grams, 99.81 grams and 66.88 grams, respectively. In the case of fishery products, bigger supply of calories came from milkfish, roundscad, tilapia and tuna ranging from 2.35 grams to 7.28 grams per person daily (Table 3a).
3 6
Table 2.Daily per capita net food disposable (NFD) index of selected agricultural commodities,Philippines, 2012-2016(2006=100)
2006 INDICES 2016PER CAPITA (in percent) PER CAPITA
NFD NFD(grams/day) (grams/day)
Rice 325.21 100.14 97.41 96.33 94.03 90.85 295.45Corn 50.44 95.32 104.06 119.11 111.62 122.32 61.70
Coconut 23.53 95.58 90.82 85.59 84.32 77.65 18.27Sugarcane 7.67 97.91 89.31 89.70 80.70 77.57 5.95Coffee 0.85 131.76 109.41 68.24 138.82 135.29 1.15
Banana 97.45 132.27 106.27 102.05 139.22 134.73 131.29Pineapple 24.77 114.70 110.82 111.83 123.46 107.83 26.71Mango 26.44 75.64 80.22 84.23 85.40 75.45 19.95
Banana 97.45 132.27 106.27 102.05 139.22 134.73 131.29Pineapple 24.77 114.70 110.82 111.83 123.46 107.83 26.71Mango 26.44 75.64 80.22 84.23 85.40 75.45 19.95
Calamansi 5.81 82.10 74.01 71.26 71.26 50.95 2.96Papaya 4.55 95.16 92.75 95.16 95.16 87.91 4.00Pomelo 1.15 71.30 68.70 66.96 66.96 61.74 0.71
Tomato 4.30 104.42 105.12 106.98 105.12 101.40 4.36Garlic 1.37 32.12 21.90 67.88 143.80 118.25 1.62Onion 3.51 100.00 100.00 149.86 149.86 177.21 6.22Cabbage 2.63 125.10 123.95 122.81 118.63 114.45 3.01Eggplant 5.56 99.46 101.44 102.52 103.96 103.42 5.75
Peanut 2.33 91.85 70.39 103.43 109.44 106.87 2.49Mongo 1.78 101.69 103.37 92.13 97.19 97.19 1.73
Cassava 5.53 113.92 120.43 126.76 132.37 132.37 7.32Sweet potato 16.88 82.29 82.64 80.04 81.16 78.91 13.32Potato 1.78 143.26 135.39 138.76 155.62 152.25 2.71
Milkfish 6.49 110.63 111.86 108.94 104.62 105.55 6.85Roundscad 5.32 80.83 92.11 87.59 74.25 68.98 3.67Tilapia 7.40 114.46 114.05 111.76 110.27 104.73 7.75Tuna 11.91 85.22 88.50 95.63 111.08 95.47 11.37Shrimps & Prawns 1.10 147.27 137.27 127.27 137.27 124.55 1.37Crabs 1.23 86.99 71.54 78.05 78.05 78.05 0.96Oysters 0.52 111.54 126.92 121.15 105.77 105.77 0.55
COMMODITY2012 2013 2014 2015 2016
FOOD CONSUMPTION AND NUTRITION
PHILIPPINE STATISTICS AUTHORITY
For the fishery products, tilapia, oysters and shrimps and prawns showed declining production indices ranging from 100.57 percent to 104.78 percent. However, their production levels in 2016 continued to exceed the 2006 levels. Per capita production of milkfish reached 3.90 kilograms in 2016 with index increasing to 106.44 percent. Below the base year per capita production was continuously recorded in roundscad, tuna and crabs (Table 1). Daily Per Capita Net Food Disposable (NFD) Net Food Disposable (NFD) refers to the volume of commodity available in its original (unprocessed) form for human consumption. Data on NFD are sourced from the Supply Utilization Accounts. It is the remaining balance after all the "use" parameters are taken into account. The daily net food disposable of a commodity of each member of the population measured through an index indicates the movement of food available for consumption in a specified year relative to a base year. The daily per capita NFD of rice in 2016 was reduced to 295.45 grams. At an estimated index of 90.85 percent, this shows that the quantity of rice available for consumption in 2016 was lower by 9.15 percentage points compared with the 2006 record. In contrast, the NFD of corn moved up to 61.70 grams per day in 2016. It posted an index of 122.32 percent, or 22.32 percentage points higher than the base year NFD. Below the base year’s daily per capita NFD continued for coconut and sugarcane with 2016 NFD recorded at 18.27 grams and 5.95 grams, respectively. NFD of coffee at 1.15 grams per day corresponded to an index of 135.29 percent in 2016. Despite the reduction in the NFDs of banana to 131.29 grams and pineapple to 26.71 grams in 2016, these still exceeded the 2006 levels. The highest NFD index was noted in banana at 134.73 percent while this was 107.83 percent in pineapple. Downtrends in NFD were likewise observed in mango, calamansi, papaya and pomelo and these remained lower than the base year records.
7 2
Table 3a.Daily per capita calories supply of selected agricultural commodities,Philippines, 2012-2016(in grams)
COMMODITY 2012 2013 2014 2015 2016
Rice 1162.64 1130.94 1118.45 1091.74 1054.76Corn 171.16 186.86 213.88 200.43 219.65
Coconut 41.38 39.32 37.06 36.51 33.62Sugarcane 2.25 2.06 2.06 1.86 1.79Coffee 0.53 0.44 0.27 0.55 0.54
Banana 77.34 62.14 59.67 81.40 78.77Pineapple 7.39 7.14 7.20 7.95 6.94Mango 9.00 9.54 10.02 10.16 8.98
Calamansi 1.24 1.12 1.08 1.08 0.77Papaya 1.13 1.10 1.13 1.13 1.04Pomelo 0.39 0.38 0.37 0.37 0.34
Tomato 0.76 0.77 0.78 0.77 0.74Garlic 0.57 0.39 1.21 2.56 2.11Onion 1.09 1.09 1.63 1.63 1.93Cabbage 0.63 0.62 0.61 0.59 0.57Eggplant 0.12 0.12 0.12 0.12 0.12
Peanut 8.86 6.79 9.98 10.56 10.31Mongo 6.17 6.27 5.59 5.90 5.90
Cassava 6.87 7.26 7.64 7.98 7.98Sweet potato 12.78 12.83 12.43 12.60 12.25Potato 1.71 1.61 1.65 1.86 1.82
Beef 13.29 13.29 14.18 14.13 14.89Carabeef 6.93 6.20 6.81 6.87 6.65Pork 166.67 169.80 173.26 176.99 184.12Chevon 2.95 2.95 2.95 2.95 2.88
Chicken 86.97 88.92 92.70 97.64 99.81Duck 3.16 3.03 3.03 2.90 2.82Chicken egg 65.40 65.28 62.31 65.58 66.88
Milkfish 4.60 4.65 4.52 4.35 4.38Roundscad 2.75 3.14 2.98 2.53 2.35Tilapia 5.42 5.40 5.29 5.22 4.96Tuna 6.50 6.75 7.29 8.47 7.28Shrimps & Prawns 0.76 0.71 0.66 0.71 0.64Crabs 0.50 0.41 0.45 0.45 0.45Oysters 0.41 0.47 0.45 0.39 0.39
Sources of basic data: Food and Agriculture Organization and Philippine Statistics Authority
FOOD CONSUMPTION AND NUTRITION
PHILIPPINE STATISTICS AUTHORITY
1 8
Per Capita Production Per capita production refers to the volume of production of a particular commodity available for each member of the population. Annual per capita production index provides information on the change in the per capita production of the commodity in a given year compared to a base year. It measures the capacity of the country’s agriculture sector to produce food commodities in pace with the growth of the population. In 2016, the annual per capita production of rice dropped to 111.66 kilograms and it was below the 2006 record. This was equivalent to production index of 96.88 percent indicating that the 2016 per capita production of rice was 3.12 percentage points lower than the base year level. Similarly, corn per capita production declined to 69.92 kilograms in 2016 by less than one percentage point from the 2006 level with its index estimated at 99.99 percent. The per capita production of coconut, sugarcane and coffee continued its downtrend in 2016 and remained lower than the 2006 production records. Their respective 2016 per capita production estimates were 133.91 kilograms, 216.68 kilograms and 0.19 kilogram. For the reference fruits, the 2016 production indices were 110.39 percent for banana and 120.00 percent for pineapple. This implies that the annual production levels per person of banana at 86.24 kilograms and pineapple at 25.30 kilograms exceeded the 2006 levels by 10.39 percentage points and 20.00 percentage points, respectively. Lower than the base year production levels were observed for mango, calamansi, papaya and pomelo. Vegetables and rootcrops such as tomato, onion, cabbage, eggplant, mongo, cassava and potato exhibited decresing per capita production in 2016 but still surpassed the base year levels. Potato production at 1.13 kilograms per person in 2016 posted the biggest production index of 141.63 percent. This was followed by onion and cassava with production indices of 135.93 percent and 132.11 percent, respectively. These corresponded to annual per capita production at 1.19 kilograms and 26.69 kilograms in 2016. The per capita production estimates of garlic, peanut and sweet potato in 2016 stayed lower than the base year records.
Table 3b.Daily per capita protein supply of selected agricultural commodities,Philippines, 2012-2016(in grams)
COMMODITY 2012 2013 2014 2015 2016
Rice 24.43 23.76 23.50 22.94 22.16Corn 4.57 4.99 5.71 5.35 5.86
Coconut 0.38 0.36 0.34 0.34 0.31Sugarcane 0.02 0.01 0.01 0.01 0.01Coffee 0.08 0.06 0.04 0.08 0.08
Banana 0.90 0.72 0.70 0.95 0.92Pineapple 0.06 0.05 0.06 0.06 0.05Mango 0.08 0.08 0.09 0.09 0.08
Calamansi 0.02 0.02 0.02 0.02 0.01Papaya 0.02 0.02 0.02 0.02 0.02Pomelo 0.00 0.00 0.00 0.00 0.00
Tomato 0.04 0.04 0.04 0.04 0.03Garlic 0.05 0.04 0.11 0.24 0.19Onion 0.04 0.04 0.06 0.06 0.07Cabbage 0.03 0.03 0.03 0.03 0.03Eggplant 0.05 0.05 0.05 0.05 0.05
Peanut 0.40 0.31 0.45 0.48 0.47Mongo 0.40 0.41 0.36 0.38 0.38
Cassava 0.06 0.06 0.06 0.07 0.07Sweet potato 0.10 0.10 0.09 0.10 0.09Potato 0.04 0.04 0.04 0.04 0.04
Beef 1.92 1.92 2.05 2.04 2.15Carabeef 0.76 0.68 0.75 0.75 0.73Pork 15.87 16.16 16.49 16.85 17.53Chevon 0.35 0.35 0.35 0.35 0.34
Chicken 10.67 10.91 11.37 11.98 12.24Duck 0.20 0.19 0.19 0.18 0.18Chicken egg 5.04 5.03 4.80 5.06 5.16
Milkfish 0.74 0.75 0.73 0.70 0.71Roundscad 0.44 0.50 0.48 0.41 0.38Tilapia 0.87 0.87 0.85 0.84 0.80Tuna 1.05 1.09 1.17 1.36 1.17Shrimps & Prawns 0.15 0.14 0.13 0.14 0.13Crabs 0.10 0.08 0.09 0.09 0.09Oysters 0.06 0.07 0.07 0.06 0.06
FOOD CONSUMPTION AND NUTRITION
PHILIPPINE STATISTICS AUTHORITY
9
Table 3c.Daily per capita fats supply of selected agricultural commodities,Philippines, 2012-2016(in grams)
COMMODITY 2012 2013 2014 2015 2016 Rice 5.86 5.70 5.64 5.50 5.32Corn 2.07 2.26 2.58 2.42 2.65
Coconut 3.91 3.72 3.50 3.45 3.18Sugarcane 0.00 0.00 0.00 0.00 0.00Coffee 0.00 0.00 0.00 0.00 0.00
Banana 0.39 0.31 0.30 0.41 0.39Pineapple 0.06 0.05 0.06 0.06 0.05Mango 0.04 0.04 0.04 0.05 0.04
Calamansi 0.01 0.01 0.01 0.01 0.01Papaya 0.00 0.00 0.00 0.00 0.00Pomelo 0.00 0.00 0.00 0.00 0.00
Tomato 0.01 0.01 0.01 0.01 0.01Garlic 0.00 0.00 0.00 0.01 0.01Onion 0.01 0.01 0.01 0.01 0.01Cabbage 0.00 0.00 0.00 0.00 0.00Eggplant 0.55 0.56 0.57 0.58 0.58
Peanut 0.77 0.59 0.87 0.92 0.89Mongo 0.03 0.03 0.03 0.03 0.03
Cassava 0.01 0.01 0.01 0.01 0.01Sweet potato 0.03 0.03 0.03 0.03 0.03Potato 0.00 0.00 0.00 0.00 0.00
Beef 1.12 1.12 1.20 1.19 1.26Carabeef 0.32 0.29 0.32 0.32 0.31Pork 10.78 10.98 11.21 11.45 11.91Chevon 0.16 0.16 0.16 0.16 0.15
Chicken 4.08 4.18 4.35 4.59 4.69Duck 0.24 0.23 0.23 0.22 0.22Chicken egg 4.60 4.59 4.38 4.61 4.71
Milkfish 0.16 0.16 0.16 0.15 0.15Roundscad 0.09 0.11 0.10 0.09 0.08Tilapia 0.19 0.19 0.18 0.18 0.17Tuna 0.22 0.23 0.25 0.29 0.25Shrimps & Prawns 0.01 0.01 0.01 0.01 0.01Crabs 0.01 0.00 0.00 0.00 0.00Oysters 0.01 0.01 0.01 0.01 0.01

FOOD CONSUMPTION AND NUTRITION
PHILIPPINE STATISTICS AUTHORITY
10
Table 4a.
Per capita expenditure for food and percentage shares of food in the
total family expenditures, Philippines, 2003, 2006, 2009, 2012 and 2015
2003 2,038,471 10,730 43.1
2006 2,561,437 12,193 41.4
2009 3,239,186 14,962 42.6
2012 4,125,312 18,088 42.8
2015 4,882,860 20,144 41.9
Source of data: FIES, Philippine Statistics Authority
YEAR
TOTAL
EXPENDITURES
(in million persos)
SHARE OF FOOD
IN THE TOTAL
EXPENDITURES
(in percent)
PER CAPITA
EXPENDITURES
FOR FOOD
(in pesos)
FOOD CONSUMPTION AND NUTRITION
PHILIPPINE STATISTICS AUTHORITY
Table 4b.
Percentage shares of food in the total family expenditures by food group,
Philippines, 2003, 2006, 2009, 2012 and 2015
Food 43.1 41.4 42.6 42.8 41.9
Food consumed at home 37.7 35.5 36.5 35.3 33.7
Cerals and cereals preparations 10.9 10.9 12.0 12.0 11.7
Fruits and vegetables 4.3 3.8 3.8 3.7 3.5
Meat and meat preparations 6.7 6.1 5.8 5.9 5.4
Dairy products and eggs 3.2 3.0 3.0 2.9 2.8
Fish and marine products 5.5 5.1 5.1 5.4 5.0
Coffee, cocoa and tea 1.0 1.0 1.0 1.3 1.5
Sugar, jam, honey, chocolate
and confectionary 1.5 1.3 0.7 1.4 0.9
Non-alcoholic beverages 1.5 1.3 0.7 1.4 1.3
Oil and Fats 0.7 0.6
Food (not elsewhere classified) 3.8 3.8 3.8 1.0 1.0
Food regularly consumed outside home 5.4 5.8 6.1 7.5 8.2
ITEM 2003 2006 2009 2012 2015
11
FOOD CONSUMPTION AND NUTRITION
PHILIPPINE STATISTICS AUTHORITY
TABLE OF CONTENTS Table 4c.
Percentage shares of food in the total family expenditures
by region, Philippines, 2003, 2006, 2009, 2012 and 2015
Philippines 43.1 41.4 42.6 42.8 41.9
NCR 37.8 35.9 36.2 36.5 36.3
CAR 42.9 40.8 39.0 40.8 39.4
Ilocos Region 48 44.7 46.0 45.3 44.4
Cagayan Valley 46.6 44.3 44.6 49.4 46.9
Central Luzon 45.2 40.9 43.6 43.7 42.0
CALABARZON 41.2 39.3 41.9 40.6 39.8
MIMAROPA 44.8 44.6 45.0 46.4 44.4
Bicol Region 45.4 45.2 47.4 49.0 48.0
Western Visayas 44.1 44.1 44.5 44.4 45.6
Central Visayas 45.4 44.8 45.0 44.5 44.3
Eastern Visayas 46.4 43.2 45.5 45.8 44.9
Zamboanga Peninsula 46.5 45.9 46.5 49.0 48.2
Northern Mindanao 44 43.2 44.7 43.8 40.6
Davao Region 45.5 45.6 46.2 47.6 43.6
SOCCSKSARGEN 48.2 48 45.8 48.2 44.7
ARMM 53.5 53.9 56.4 59.8 59.0
Caraga 47.4 45.6 46.8 47.5 45.3
2015REGION 2003 2006 2009 2012
iii 12
FOREWORD i
LIST OF TABLES i i i
FOOD CONSUMPTION AND NUTRITION
Table 1. Annual per capita production index of selected
agricultural commodities, Philippines, 2012-2016 5
Table 2. Daily per capita net food disposable index of selected
agricultural commodities, Philippines, 2012-2016 6
Table 3a. Daily per capita calories supply of selected
agricultural commodities, Philippines, 2012-2016 7
Table 3b. Daily per capita protein supply of selected
agricultural commodities, Philippines, 2012-2016 8
Table 3c. Daily per capita fats supply of selected
agricultural commodities, Philippines, 2012-2016 9
Table 4a. Per capita expenditure for food and percentage
shares of food in the total family expenditures,
Philippines, 2003, 2006, 2009, 2012 and 2015 10
Table 4b. Percentage shares of food in the total family
expenditures by food group, Philippines, 2003, 2006,
2009, 2012 and 2015 11
Table 4c. Percentage shares of food in the total family
expenditures by region, Philippines, 2003, 2006,
2009, 2012 and 2015 12

FOOD CONSUMPTION AND NUTRITION
PHILIPPINE STATISTICS AUTHORITY
MODULES OF THE AGRICULTURAL INDICATORS SYSTEM
1. Output and Productivity
2. Agricultural Structure and Resources
3. Economic Growth: Agriculture
4. Agricultural Exports and Imports
5. Food Sufficiency and Security
6. Food Consumption and Nutrition
7. Population and Labor Force
8. Redistribution of Land
9. Gender-based Indicators of Labor and Employment in Agriculture 10. Prices and Marketing of Agricultural Commodities
11. Agricultural Credit
12. Inputs
i

FOOD CONSUMPTION AND NUTRITION
PHILIPPINE STATISTICS AUTHORITY
ISSN-2012-0435
REPORT No. 2017-6
PHILIPPINE STATISTICS AUTHORITY 16
th Floor. ETON Cyberpod Centris 3
EDSA. Corner Quezon Avenue, Quezon City
www.psa.gov.ph
Republic of the Philippines
Philippine Statistics Authority