education and training policy in the european semester ... · education and training policy in the...
TRANSCRIPT

EDUCATION AND TRAINING POLICY IN THE EUROPEAN SEMESTERPUBLIC INVESTMENT, PUBLIC POLICY, SOCIAL DIALOGUE
AND PRIVATISATION PATTERNS ACROSS EUROPE
EUROPEAN TRADE UNION COMMITTEE FOR EDUCATIONCOMITE SYNDICAL EUROPEEN DE L’EDUCATION


This project has been funded with support from the European Commission. This publication reflects the views only of the author, and the Commission cannot be held responsible for any use which may be made of the information contained therein.
Published by the European Trade Union Committee for Education - Brussels 2017Reproduction of all or part of this publication is permitted without authorisation. However, accreditation to ETUCE
must be made and copies must be sent to the ETUCE secretariat.
EDUCATION AND TRAINING POLICY IN THE EUROPEAN SEMESTERPUBLIC INVESTMENT, PUBLIC POLICY, SOCIAL DIALOGUE
AND PRIVATISATION PATTERNS ACROSS EUROPE
Professor Howard StevensonLesley Hagger-Vaughan
Alison MilnerEmily Winchip
Faculty of Social Science University of Nottingham

4European Trade Union Committee for Education

5
Education and Training Policy in the European Semester
FOREWORD
Quality education has the primary purpose of developing each individual’s potential and of laying a solid foundation for a socially just, democratic and peaceful society. To do so, the principles underpinning education should be principles of fairness, equity and quality. Education is also being considered crucial to increase productivity, competitiveness and innovation leading to economic growth. However, since a decade, teaching professionals are dealing with the profound effects of the economic and financial crisis on young people and on society, as well as on their working conditions and rights.
The European Union has answered to these problems adopting the Europe 2020 Strategy plan for sustainable, smart economic growth. Education, employment, fighting poverty and social exclusion are at the hearth of the Europe 2020 Strategy and the EU-policy making, coordinated through the European Semester coordination. Since the inception of the European Semester, budgetary austerity and the rigid application of the fiscal targets (which limit government deficit to 3% and public debt to 60% of the GDP) framing the Europe 2020 Strategy, the attitude of governments adopting unilateral adjustments and decisions, and strong anti-union campaigns across some European countries led to an absence of, or limited involvement of trade unions in negotiations on education workers’ rights and working conditions, and national education and training reforms.
Especially in the area of social dialogue, education trade unions report increasing problems. Decisions affecting teachers and the school community are taken outside formal consultations with social partners, in particular when it comes to education and training reforms and to professional issues. The lack of involvement of education trade unions in education and training reforms is even more challenging at a time when a drift towards a ‘business model’ or commodification of education is evident.
To raise awareness and to trigger participation at national and European level within the ‘policy space’ of the European Semester on education and training, the European Trade Union Committee for Education (ETUCE) launched the project “Investing in education: Strengthening the involvement of teacher trade unions in the European Semester on education and training” in 2015. The University of Nottingham was contracted to carry on a study to investigate the effects of the European Semester policy coordination on national education and training reforms and investment as a result of the European Semester, and on the changing nature of education investment and public/private developments. The report in front of you is the result of a two-year study by the Education department of the University of Nottingham and the collaborative effort among members of the project Advisory Group from Denmark (DLF), Italy (FLC-CGIL), Lithuania (FLESTU), Malta (MUT) and Slovenia (ESTUS), who constantly gave fruitful and inspiring contribution to this important initiative.
Susan Flocken ETUCE European Director

6European Trade Union Committee for Education
CONTENTS1 INTRODUCING THE EUROPEAN SEMESTER 6
2 THE EUROPEAN SEMESTER AND EDUCATION POLICY IN MEMBER STATES: MAKING THE CONNECTIONS 8
3 THE EUROPEAN SEMESTER IN ACTION: INDIVIDUAL COUNTRY CASES 38
4 THE EUROPEAN SEMESTER AND EDUCATION POLICY IN EU MEMBER STATES 54
APPENDIX 1 RESEARCH METHODS AND DATA COLLECTION/ANALYSIS 58
APPENDIX 2 SURVEY RESPONDENTS 59
APPENDIX 3 EU MEMBER STATES WHICH EXPERIENCED A DECLINE IN GDP, DEFICIT/GROSS DEBT OUTSIDE SGP REQUIREMENTS AND CUT OVERALL PUBLIC EXPENDITURE BETWEEN 2008 AND 2015 62
APPENDIX 4 EU MEMBER STATES SUBJECT TO MACROECONOMIC IMBALANCE PROCEDURE AND EXCESSIVE DEFICIT PROCEDURE 64
APPENDIX 5 EU MEMBER STATES WHICH CUT OVERALL PUBLIC EXPENDITURE AND E DUCATIONAL EXPENDITURE 65
APPENDIX 6 SURVEY RESPONSES 67
ACRONYMS 74

7
Education and Training Policy in the European Semester
1 INTRODUCING THE EUROPEAN SEMESTER
1.1 THE EUROPEAN SEMESTER: WHAT IS IT?
Following the economic crisis in 2008, the European Union developed a ten-year strategy focused on boosting growth and jobs. The strategy, Europe 2020 (European Commission, 2010), sets out headline targets which relate to five key areas – employment and growth, investment, climate change, education, and poverty and social inclusion. Within these targets, EU2020 commits to ensuring fiscal responsibility, boosting investment and promoting structural reforms within and across EU Member States.
The European Semester is best described as a governance mechanism which provides an overview of EU Member States as they work towards meeting the objectives of EU 2020. The Semester is a process that both looks backwards (through annual monitoring and surveillance) and forwards (by providing recommendations for future action). It is principally a form of economic governance, concerned with fiscal and budget management in Member States, although EU2020 targets also relate to social (including education) and environmental concerns.
The Semester was established in 2011 as part of a package of reforms intended to assert more robust scrutiny of Member States’ finances following the economic crisis. Before the crash, budgetary policy and planning was the responsibility of Member States ‘with only a limited coordinated overview at EU level of the national efforts’ (European Commission, 2015a). In light of the economic crisis, the Semester seeks to address what is presented as a deficiency of governance and oversight. It comprises a raft of policy mechanisms, many of which continue to change and develop.
Fiscal targets for Member States were established in 1992 by the Maastricht Treaty, and these were reaffirmed in the Stability and Growth Pact (SGP) (1997) (European Commission, online). The key targets within the SGP are to maintain deficits within a maximum level of 3% of Gross Domestic Product (GDP), and total public debt within a maximum level of 60% of GDP. Enforcement of these financial commitments was strengthened in 1998 (Preventive Rules) and 1999 (Corrective Rules), and again in 2005 when increased clarity was provided relating to managing deficits.
However, these regulatory mechanisms have been reinforced considerably since the crisis, most notably with the ‘six pack’ legislation (2011), which introduced the Macroeconomic Imbalances Procedure (MIP), and the ‘two pack’ legislation (2013), which determines procedures for Commission assessment of deficits and budgets in Member States. These procedures have also been influenced by the introduction of a ‘Fiscal Compact’ in 2013 and, more recently in 2015, by Commission guidance relating to the more flexible use of deficits.
The Semester process is, in essence, a simple one in which a period of review and recommendations at European Commission level (the first part of the Semester) is followed by a period of implementation at Member State level (the second part of the Semester). The process formally starts in November with an EU-wide overview of economic prospects, called the Annual Growth Survey (AGS). This is followed by detailed, in-country reviews, which are published as Country Reports in February each year. Member States provide their own response to the Country Reports in the form of an action plan called the National Reform Programme (NRP), and this in turn is followed by the publication of Country Specific Recommendations (CSRs) for each Member State.
This very brief summary of Semester processes inevitably does not convey all of the complexity that is the reality of policy development and enactment. A more detailed account of how the Semester works in practice and the ways in which social partners engage with its processes can be found in the European Trade Union Committee for Education (ETUCE) publication ‘Practical Guide for an Effective Involvement of Education Trade Unions in the European Semester on Education and Training’ (ETUCE, 2017).

8European Trade Union Committee for Education
1.2 REPORT AIMS, OBJECTIVES AND STRUCTURES
This report seeks to make connections between the working of the European Semester and its impact on education provision and education policies in Member States. In order to make these connections, this report presents data in relation to four aspects of education, thus the main body of this report is presented in four sections:
1. Levels of public spending on education in Member States during the period the Semester has been in operation. A key aim of the Semester is to ensure ‘fiscal responsibility’ in Member States, and to maintain fidelity to the rules of the Stability and Growth Pact. In the first section of this report, we look at what has happened to public investment in education during the time the Semester has been in operation.
2. An analysis of Country Specific Recommendations (CSRs) and the extent to which these shape education policy priorities. CSRs are the key ‘action points’ of the Semester and a major driver of future activity at Member State level. In the second section of this report, we assess the extent to which CSRs reflect education issues, and how education issues are presented within the CSRs.
3. A summary of the extent to which teacher unions are involved in social dialogue about the issues that impact them and their members. The document ‘A new start in social dialogue’ (European Commission, 2015b), followed by the June 2016 Statement of the Presidency of the Council, the European Commission and the European social partners on “a new start for social dialogue”, specifically commits to developing social dialogue in relation to the European Semester. In this section, we present ETUCE member organisations’ views on the extent to which this happens.
4. ETUCE member organisations’ views about education privatisation processes, and privatisation trends in Member States. A downward pressure on public investment, combined with rising expectations on education systems to deliver growth and employment, opens up the possibility that private sector solutions will be sought to fill this gap between public resources and societal demand. In the fourth section of the report, we present data from a survey of ETUCE member organisations assessing experience and patterns of privatisation across the EU and Europe more widely.
In addition to the data above, this report presents five country cases studies (Denmark, Italy, Lithuania, Malta and Slovenia) which provide additional detail about the interface between EU agendas and their impact on the education policies of Member States. The case studies also highlight the extent to which education social partners in Member States believe they have had an input into the Semester process in their respective countries.
This report is based on research conducted between March 2016 and March 2017 for the project Investing in Education: Strengthening the involvement of teacher trade unions in the European Semester on education and training (European Commission reference - VS/2015/0329). Full details of the research methods and processes of data collection are included in Appendix 1. Details of the survey referred to above are included in Appendix 2.

9
Education and Training Policy in the European Semester
2 THE EUROPEAN SEMESTER AND EDUCATION POLICY IN MEMBER STATES: MAKING THE CONNECTIONS
2.1 THE EUROPEAN SEMESTER AND EDUCATION POLICY: THE IMPACT ON PUBLIC INVESTMENT
2.1.1 General government expenditure post-crisis
The 2007-2008 global financial crisis and associated recession placed the national economies of all EU Member States under extraordinary pressure. With fears over the long-term sustainability of public finances in the region, the European Commission and the EU-271 took measures to stabilise debt and consolidate fiscal deficits. These actions led to a curtailment of public sector spending and a re-prioritization of funding towards crisis-hit areas such as health and social protection. So, whilst public investment in high quality education and training was considered vital to renewed economic growth, productivity and competitiveness, somewhat paradoxically, the education sector was affected considerably by these wider budgetary constraints (European Commission / EACEA / Eurydice, 2013).
Figure 1. General government expenditure and educational expenditure as a % of GDP
According to the most recent financial data compiled by Eurostat, the statistical office of the European Union, EU-28 public expenditure on education as a ratio to GDP remained generally stable between 2006 and 2015, experiencing only a small overall decrease from 5.0% to 4.9% of GDP. During the same period, however, overall public expenditure as a ratio to GDP increased by 2.0% to 47.2%, whilst the relative share of public expenditure on education decreased from 11.0% in 2006 to 10.3% in 2015 (Eurostat, 2017). Analysis of EU-wide public expenditure on education as a percentage of GDP should therefore be viewed with caution since it fails to recognise not only the disparities in growth and decline
1 The EU-27 Member States are Belgium, Bulgaria, Czech Republic, Denmark, Germany, Estonia, Greece, Spain, France, Ireland, Italy, Cyprus, Latvia, Lithuania, Luxembourg, Malta, Hungary, Netherlands, Austria, Poland, Portugal, Romania, Slovenia, Slovak Republic, Finland, Sweden and United Kingdom. Croatia gained EU membership in 2013.
Source: Eurostat (2017)

10European Trade Union Committee for Education
of GDP at member state level, but also national shifts in funding priorities within and outside the sector. As noted by Eurostat, ‘the figures at EU level mask disparate situations in the Member States’ (Eurostat, 2017).
2.1.2 The Stability and Growth Pact and cuts to public spending
A more detailed year-on-year comparative analysis of government finance statistics against public expenditure reveals the extent of the crisis on the health of the EU28 economies and the impact of economic governance mechanisms on public finance sustainability (see Appendix 3). Whilst in 2008, GDP remained stable across most of the EU28, by 2009, all but one Member State experienced negative GDP growth. Although there were signs of recovery in 2010 and 2011, several national economies began to contract again in 2012 and 2013. Between 2005 and 2015, the overall development of real GDP was negative in Greece, Italy and Portugal. Moreover, between 2008 and 2015, nearly every EU Member State failed to meet the requirements of the Stability and Growth Pact in at least one financial year. From 2009 to 2015, twenty-five EU national economies experienced a general government deficit of more than -3.0% in one or more financial years; six countries (Croatia, France, Greece, Portugal, Spain and the United Kingdom) did not meet the requirements in any financial year. Some of the worst deficits were seen in Greece (-15.1% in 2009 and -13.2% in 2013) and Ireland (-13.8% in 2009 and -32.1% in 2010). By contrast, seventeen Member States had a gross debt of more than 60% of GDP in one or more financial years and eleven Member States (Austria, Belgium, France, Germany, Greece, Hungary, Ireland, Italy, Malta, Portugal and the United Kingdom) in every year between 2009 and 2015. Similarly, Croatia, Cyprus, the Netherlands and Spain saw an increase in debt in five or six financial years. The highest gross debts were recorded in Greece, which, year-on-year, rose from 126.7% of GDP in 2009 to a high of 179.7% in 2014; Italy, which increased from 112.5% in 2009 to a peak of 132.3% in 2015; and Ireland, which saw its gross debt almost double between 2009 and 2012 from 61.7% to 119.5%. The countries which failed to meet the requirements of the SGP for both government deficit and gross debt in every year between 2009 and 2015 were: France, Greece, Portugal and the United Kingdom (UK).
The scale of these problems is in part indicated by the number of countries subject to the Commission’s Excessive Deficit Procedure, and the number of times Member States have received In-Depth Reviews (including being subject to the Macroeconomic Imbalance Procedure). This data is presented in Appendix 4.
Figure 2. EU Member States with highest general government gross debt between 2009 and 2015 (as % of GDP).
It is perhaps unsurprising that many national governments, which experienced deficits and/or gross debts outside the SGP requirements, reduced overall public expenditure in subsequent years. What is of greater concern is that several countries chose to reduce public expenditure even though they had seemingly met the requirements of SGP in the two previous financial years. These countries (highlighted in red in Appendix 3) were Croatia, Sweden and Estonia. Whilst these reductions could be part of longer-term financial planning,
Source: Eurostat (2017)
% o
f GD
P

11
Education and Training Policy in the European Semester
they do nonetheless indicate that levels of national public expenditure are not driven entirely by EU governance mechanisms, but are the outcome of a complex range of national and EU level factors.
2.1.3 The reprioritization of public expenditure away from education
When Member States implemented cuts to public expenditure2, it was extremely common to see a decline in educational expenditure as a percentage of total public expenditure and/or a nominal value. Despite the claim that the education sector experienced a delayed reaction to the financial crisis and only really began to feel the real term effects in 2010 (OECD, 2015), many Member States had already reduced educational spending as a percentage of total expenditure in 2008 and/or 2009 (see Appendix 5). Fourteen countries made cuts in 2008 and nineteen in 2009. Given that national budgets are often determined well in advance, any shifts in funding priorities at this stage would appear to be the consequence of a reprioritization of national funding and the Stability and Growth Pact, rather than a direct response to the economic crisis and the European Semester, which was yet to be implemented. Of those twenty-four Member States which made cuts in either 2008 and/or 2009, seven (Bulgaria, Ireland, Italy, Latvia, Romania, Slovenia and Spain) continued to make cuts in 2010 and ten (Croatia, Cyprus, Finland, France, Hungary, Italy, Portugal, Slovenia, Spain and the United Kingdom) made further cuts in 2011. Between 2008 and 2015, the Member States which made the most year-on-year cuts to educational expenditure as a percentage of total expenditure were Finland (6), Hungary (6), Italy (6), Slovenia (6), Estonia (5), Ireland (5), Lithuania (5), Portugal (5), Romania (5), Spain (5) and the United Kingdom (5). Most significantly, educational expenditure as a percentage of total government expenditure has not returned to pre-crisis levels in twenty EU28 countries.
Figure 3. Member States with largest year-on-year cuts to educational expenditure as a % of total government expenditure between 2008 and 2015
2 Publicexpenditureisclassifiedasdirectexpenditureforeducationalinstitutionsortransfertoprivatehouseholdsandfirms(student scholarships and loans, and subsidies for educational activities). According to Eurostat, total public spending on education usually comprises spending by many different levels of authority (central, regional, local), as well as from other sources such as the European Social Fund (ESF). There is a 2.5-year time-lag on the reporting of government expenditure on education to Eurostat. Financial data is currently only available for the period 2006 to 2015.
Source: Eurostat (2017)

12European Trade Union Committee for Education
2.1.4 Nominal cuts to expenditure on education
Whilst the above analysis provides an interesting insight into the extent of Member State commitment to education in the period following the economic crisis, it is also important to examine these cuts in nominal terms to explore shifts in funding priorities over time (see Appendix 5). In this regard, an analysis of expenditure in million euro reveals a certain level of instability across all the Member States. Of the EU28, twenty-three countries experienced nominal cuts to educational funding in one or more financial years between 2008 and 2015. In 2009 and/or 2010, seventeen Member States reduced educational expenditure and, amongst this group, five reduced spending in both years. In 2009 and/or 2010, eleven countries had cuts of over 5%3. Amongst this group, the largest cuts were seen in Romania (24%), Latvia (18%) and Poland (17%).
Table 1. EU Member States with nominal cuts to educational expenditure in 2009 and/or 2010
2009 2010
Nominal cuts to educational expenditure of over 5%
EstoniaHungaryIrelandLatviaPolandRomaniaSwedenUnited Kingdom
BulgariaGreeceLatviaLithuaniaRomania
Nominal cuts to educational expenditure of 1% to 5%
Croatia (p) Lithuania
EstoniaItalySpain
Nominal cuts to educational expenditure of less than 1%
Czech Republic IrelandSlovenia
In 2011 and/or 2012, there were nominal spending reductions in fourteen Member States. Of those governments that implemented cuts in 2011, six had already reduced spending in 2009 and/or 2010. Of those governments that implemented cuts in 2012, nine had already reduced spending in 2009 and/or 2010. In 2011, the largest reductions in spending were seen in Portugal (7%), Hungary (6%) and the United Kingdom (6%), whilst in 2012, the most drastic were visible in Romania (27%) and Portugal (18%). In fact, the Romanian education sector in 2012 experienced the biggest cut by any single EU Member State during this entire period.
Table 2. EU Member States with nominal cuts to educational expenditure in 2011 and/or 2012
2011 2012
Nominal cuts to educational expenditure of over 5%
HungaryPortugalUnited Kingdom
CyprusGreeceHungaryPortugalRomaniaSpain
3 Percentages are rounded to the nearest whole percent.
Source: Eurostat (2017)

13
Education and Training Policy in the European Semester
Nominal cuts to educational expenditure of 1% to 5%
Croatia (p)CyprusDenmarkGreeceItalySpain
Croatia (p)Czech RepublicIrelandItalySlovenia
Nominal cuts to educational expenditure of less than 1%
Netherlands
For the period 2013 to 2015, the final three years for which data is available, educational expenditure was reduced in eighteen EU Member States in one or more financial years. In 2013, the reduction in funding appeared to be less severe than in previous years with only the United Kingdom (6%), Greece (5%), Ireland (4%) and Spain (3%) notably significant. Still, although some Member States only experienced cuts of one or two per cent, many of them had already reduced educational expenditure in one or more previous years e.g. Cyprus, the Czech Republic and the Netherlands. Whilst in 2013, ten Member States implemented nominal cuts, in 2014, ten did so and by a greater degree. The most significant reductions were seen in Cyprus (15%), Croatia (8%), Greece (5%) and Slovenia (4%).
Table 3. EU Member States with nominal cuts to educational expenditure in 2013, 2014 and/or 2015
2013 2014 2015
Nominal cuts to educa-tional expenditure of over 5%
United Kingdom Croatia (p)CyprusGreece
Nominal cuts to educa-tional expenditure of 1% to 5%
GreeceIrelandLuxembourgNetherlandsSpain
EstoniaSlovenia
GreeceSlovenia
Nominal cuts to educa-tional expenditure of less than 1%
CyprusCzech RepublicPolandSlovakia
Czech RepublicItalyLithuaniaPortugalSweden
ItalyFinland (b)
Although the most recent data from 2015 would appear to indicate a greater commitment by Member States to increase expenditure on education, since only four countries reduced nominal spending during this financial year, we must treat these data with caution as the public finance statistics for 2015 are yet to be revised. Still, for this year, Slovenia and Greece are again the most notable Member States with 5% and 3% cuts respectively.
All in all, the countries which had the greatest frequency of nominal cuts to educational expenditure between 2008 and 2015 were Croatia, Cyprus, the Czech Republic, Greece, Ireland, Italy, Slovenia, Spain and the United Kingdom. Of the EU28, eleven countries had a lower level of nominal investment in 2015 than 2008: Croatia, Cyprus, Greece, Hungary, Ireland, Italy, Latvia, Portugal, Romania, Slovenia and Spain. So, even where there were no reductions to expenditure on education as a percentage of total government expenditure, nominal cuts were still felt by the education sector in certain Member States.
At this point, it is worth highlighting the limitations to analysis of spending as a nominal value. Whilst useful for year-on-year analyses of increases or reductions in expenditure, the data does not account for inflation or deflation within each Member State and therefore the potential hidden deficits experienced by the education sector. For instance, where certain Member States might appear to be increasing investment in education, many
Source: Eurostat (2017)

14European Trade Union Committee for Education
within the sector could have experienced real term cuts due to a rise in educational costs during this period (e.g. staff salary increases and capital expenditure). It is not uncommon for the rate of inflation experienced by the education sector to exceed that of the respective Member State. It is therefore inappropriate to make inter-national comparisons with the above method.
2.1.5 Cuts to expenditure on education per pupil/student
According to IEG Indicator Expert Group on Education Expenditure, the recommended indicator to compare expenditure on education across countries4 is based on expenditure per capita (pupils/students in full time equivalent) which is corrected using purchasing power parities (PPP)5 as a convertor unit (Sánchez-Barrioluengo, 2016). This approach permits an analysis of expenditure in the context of pupil/student demographic changes. In this regard, a familiar pattern emerges. Although there was overall growth across the EU28 between 2007 and 20106, almost a third of Member States made cuts to educational expenditure per pupil/student in the same period. The Member States7 which implemented the highest frequency of cuts were predominantly in Southern and South Eastern Europe. Although it is important to exercise caution when making comparisons across two datasets, Spain and Romania appear to make the most year-on-year cuts to per-pupil spending, whilst Bulgaria, Croatia, the Czech Republic, Latvia and Malta reduced expenditure in three separate financial years.
Table 4. Member States which cut expenditure per pupil/student – PPS based on full-time equivalents8
2008 2009 2010 2011 2012 2013 2014
Czech RepublicMaltaPortugal (d) United Kingdom (d)
Belgium (d) BulgariaEstonia Spain (d) Croatia (d) Italy Latvia Lithuania Sweden
BulgariaCzech Republic SpainCroatiaItaly(d)LatviaRomania
SpainRomaniaUnited Kingdom (d)
BulgariaSpainCroatia (d)CyprusLatvia (d) MaltaRomania
Czech Republic IrelandSpainFranceCyprus Netherlands RomaniaFinland
MaltaPortugal Slovenia
Although the overall accuracy of UOE statistics is considered high, these data are incomplete. In terms of private expenditure on education, there is little information on the payments of other private entities (e.g. firms, non-profit organisations, religious institutions) to educational institutions. Consequently, it is difficult to ascertain the extent to which private expenditure from these other entities is being used to compensate for cuts to government expenditure on education.
4 TheInternationalStandardClassificationofEducation,whichistheframeworkforcomparingeducationsectorsinternationally,changedin2011.Thus,thedataiscollatedintwoseparatedatabases:thefirstto2011,thesecondfrom2012to2014.Evenwithinthesetables,data is missing from several countries in several years.5 PPP as a currency convertor enables the transfer of different currencies to a common currency and equalizes purchasing power eliminating differences in price levels. 6 EU28dataisonlyavailableuptothe2011financialyear.7 For which data is available.8 Annual expenditure on public and private educational institutions per pupil/student by level of education (PPS based on full-time equivalents) http://appsso.eurostat.ec.europa.eu/nui/show.do?dataset=TPS00067&lang=enAnnual expenditure on educational institutions per pupil/student on FTE, by education level and programme orientationhttp://appsso.eurostat.ec.europa.eu/nui/submitViewTableAction.do
Source: Eurostat (2017)

15
Education and Training Policy in the European Semester
2.1.6 Conclusion
The data provided here shows the impact of the economic crisis on education spending across the EU, which has still failed to return to pre-crisis levels. The picture is inevitably complex, with variations between countries, and between education sectors within countries. However, we would want to highlight the following key issues:
1. The economic crisis of 2008 has had a significant impact on public spending generally across the EU Member States. Twenty-six of the EU28 have at some point been part of the Excessive Deficit Procedure, indicating that SGP rules have been broken and that corrective action is required. Some countries have faced particularly severe situations with public spending still substantially below 2008 levels. Those countries facing declining GDP experience additional problems as SGP rules act as a deflationary pressure on the economy.
2. Public expenditure as a % of GDP has generally risen across the European Union, however, between 2006 and 2015, educational expenditure as a proportion of public expenditure has fallen. This suggests that education has been particularly squeezed during the crisis. The economic crisis has clearly placed pressure on public finances, and these pressures are compounded by the requirements of the SGP. However, at the same time, the social consequences of recession have been driving up the demand for other budget headings, most obviously, social protection. The data presented in this research suggests that education spending has been sacrificed when faced with this problem.
3. The EU is beginning to make progress in terms of post-crisis recovery, although this overall picture should not mask the chronic problems that continue to be faced by some countries. Despite this recovery, there is some evidence that investment in education continues to lag behind as individual Member States appear reluctant to commit to boosting education investment. The paradox is that an area of public investment seen as central to driving recovery continues to suffer with the potential to impact on growth and employment. Failure to address the issues results in a vicious circle of extended recession, continued pressure on social protection spending, and a crowding out of investment in education and human capital development.

16European Trade Union Committee for Education
2.2 THE EUROPEAN SEMESTER AND EDUCATION POLICY: THE IMPORTANCE OF COUNTRY SPECIFIC RECOMMENDATIONS
Country Specific Recommendations are the ‘end-point’ of the European Commission level element of the Semester process. They represent the ‘action points’ for Member State implementation. Within the research, we were informed that CSRs were the outcome of extensive discussion between the European Commission and each Member State, and therefore the result of a process of ‘co-production’. However, the CSRs are the ownership of the European Commission, and their final form is signed off at the highest level of the Commission. The status of CSRs as ‘recommendations’ means there is no requirement for Member States to ensure implementation, although Commission officials argued that the co-produced nature of the recommendations points to the logical alignment of CSRs with Member States’ own agendas and priorities.
As ‘action points’, CSRs have the potential for considerable impact on education policy in Member States. However, there is no doubt that economic issues dominate, given the Semester’s role as a form of economic governance and the aim to give the European Commission greater strategic oversight of Member States’ economic performance. The dominance of this fiscal surveillance function is reflected in the CSRs for each Member State which always begin with recommendations relating to economic policy and deficit management. These link very explicitly to the requirements of the Stability and Growth Pact, the Fiscal Compact and related procedures.
In the following sections, we firstly analyse the extent to which CSRs reflect education content (or can be described as ‘education-related’) and, in the second section, we explore in more detail some of the content of education-related CSRs.
2.2.1 Education recommendations within the European Semester process
This analysis covers CSRs since the establishment of the European Semester in 2011. All CSRs have been analysed and education-related CSRs identified. Within this analysis, CSRs have been allocated to three broad headings: general education (including early years), skills and lifelong learning, and research and innovation (higher education). These are presented in Table 5.
Such allocations of CSRs to these three headings inevitably has an arbitrariness and there is no claim that the categorisations in Table 5 can be considered as precise. For example, Lithuania has a CSR in 2014 to ‘address persistent skills mismatches by improving the labour market relevance of education and promote life-long learning.’ Clearly, this is related to skills and lifelong learning, but might also be said to apply to general and higher education. This problem of ‘categorisation’ was common and needs to be kept in mind when analysing this data.
However, with this caveat in mind, Table 5 is helpful in highlighting some key points.
The data immediately demonstrates the importance of the Semester for education issues. In 2011, only five countries that received reports had no education-related CSRs, whilst in 2012 and 2013, only two countries had no education-related CSRs (in some years, certain countries received no reports or no CSRs, usually because they were subject to separate processes based on their financial situation). In 2014, every country within the Semester process received an education-related CSR (Greece and Cyprus remained outside as they were part of the Economic Adjustment Programme).
In 2014, when every country received an education-related CSR, more than a quarter of the twenty-six countries had recommendations which related to all of the education sectors identified in Table 5, that is, general education, skills and lifelong learning, and research and innovation. In 2015 and 2016, this pattern starts to change as the Commission moves towards presenting fewer and clearer CSRs. We were informed in this research that the Commission is seeking where possible to limit CSRs to three per country, hence allowing countries to prioritise and focus. It might therefore be expected that this process will result in some ‘thinning out’ of

17
Education and Training Policy in the European Semester
education-related CSRs. However, as the table illustrates, there is little evidence of this and education-related CSRs maintain a central role. In 2015, a large majority of the twenty-six Member States had education-related CSRs, whilst in 2016, only three countries had no education-related CSRs.
Table 5. Country Specific Recommendations – education-related CSRs (2011-16)

18European Trade Union Committee for Education
It is clear that even with the new ‘slimmed down’ Semester, with fewer CSRs, education remains a key part of the process, and the vast majority of countries continue to have an education-related CSR that focuses on at least one of the categories presented in this table.
2.2.2 Analysing the content of education-related Country Specific Recommendations:
Given the shift towards fewer CSRs, it is instructive to analyse in more detail the recommendations made in 2016 (at the time of writing the last available set of CSRs). The focus within the European Semester on economic considerations is illustrated by the number of CSRs that make recommendations relating to the role of education in addressing skills shortages and education-related labour market problems. Eleven of the twenty-three countries with education-related CSRs had recommendations in this area. These examples from 2016 are typical – they highlight the way in which education policy within the Semester is often perceived in terms of supply-side economic policy.
Improve the links between the education sector and the labour market, in particular by reforming apprenticeship and vocational training, with emphasis on the low skilled. (France, CSR, 2016)
Strengthen investment in human capital and address skills shortages, by improving the labour market relevance of education, raising the quality of teaching and pursuing more active labour market policies and adult learning. Strengthen the role of social dialogue mechanisms. (Lithuania, CSR, 2016)
The examples above, which connect education policy and labour market policy, might be considered the most common type of recommendation and feature heavily in every year of the Semester.
However, the 2016 CSRs also highlight the fact that the education focus in the Semester is not restricted to the labour market and economic growth. For example, seven countries had recommendations relating to the education of migrants. This has emerged as a critical issue in many EU Member States and is a key challenge for educators as they adapt to new and more complex teaching environments. To face these challenges, educators need support in the form of resources and professional development and these recommendations now feature prominently in the CSRs of several countries. Another common issue relates to teacher supply/quality. Clearly, this can be addressed in many different ways, and thus has the potential for significant variance in effectiveness. Such issues emphasise the need for teacher union involvement given the possible implications for teachers’ working lives and the critical insight teachers can bring to debates.
The dominance of labour market considerations in education-related CSRs, identified above, is evident in all phases of education, from early years through to higher. This is not restricted to a narrow focus on ‘skills development’. For example, thirteen countries have received CSRs related to the provision of early years’ education. From 2011 through to 2016, this was reflected in thirty-five separate recommendations, with several countries receiving recommendations over consecutive years. Two cases provide typical examples of CSRs in this area:
Reinforce efforts to increase the labour market participation of women and raise enrolment rates of children in both early childcare and pre-school education, by ensuring stable funding and investment in public infrastructure, provision of qualified staff and affordable access. (Poland, CSR, 2012)
19
Education and Training Policy in the European Semester
Facilitate the employment of women, in particular by extending the provision of affordable, quality childcare. (Slovakia, CSR, 2016)
The CSRs make clear that a key motivation for extending affordable childcare provision is to facilitate women’s participation in the labour market. Hence, an ostensibly ‘social demand’ (the expansion of quality early years’ education and care) is often also driven by economic imperatives. Indeed, one European Semester Officer in interview was quite explicit that the ‘social dimension’ of the Semester was conceived almost purely in terms of employment and inclusion, in and through the labour market. The Semester Officer argued social benefits are only of concern where there is ‘an impact on employment’, and went on to assert:
Employment is the key thing here - whether you get benefits or not for being home with the children - it is not of interest. If it effects employment then we are interested.
However, within the Early Childhood Education-related CSRs there are many examples of recommendations being located within an obvious inclusion agenda (for example, the Czech Republic received recommendations which would make Early Childhood Education (ECE) more available to Roma children), whilst the calls for affordable care, qualified staff, stable funding and investment in public infrastructure (see Poland above) all offer positive possibilities for expanding high quality public sector early years’ provision. More frequently, however, recommendations lack any specificity regarding policy detail. For example, in 2016, the UK was recommended to ‘further improve the availability of affordable, high-quality, full-time childcare’ (UK, CSR, 2016). Such general recommendations are common and are intended to leave decision-making on detail at Member State level. The danger is that these recommendations cannot be uncoupled from other CSRs; in the same year, for example, the UK is urged to ‘correct the excessive deficit in a durable manner by 2016-17’. It is against this context - urging increases in provision, whilst simultaneously applying a tight fiscal corset - that governments will likely pursue low cost options, often involving private providers and using unqualified staff. (In the next section of this report, we suggest that this type of provision is common in early years’ education).
In other education sectors, the nature of the recommendations was often more specific and, rather than urge expansion (as is typically the case in relation to ECE), the focus was on increasing ‘efficiencies’. This was very visible in relation to recommendations focused on higher education. Between 2011 and 2016, twelve countries received Country Specific Recommendations relating to higher education, with a total of thirty-five recommendations focused on this sector. Many recommendations were supportive of reform agendas being developed within individual countries, and again this provides evidence of a form of co-production of CSRs, certainly where education-related CSRs are concerned. However, it is also possible to discern the promotion of very specific policy directions in which private sector solutions are encouraged. For example, nearly one third of higher education related CSRs advocate increasing public-private partnerships in some form and, specifically, promoting private sector investment in higher education research. Typical examples include:
. . . pursue the reform of higher education, in particular through better aligning outcomes to labour-market needs and strengthening cooperation between education, research and business. (Bulgaria, CSR, 2013)
Promote private investment in research, development and innovation, including by strengthening cooperation between academia and businesses (Estonia, CSR, 2016)
Such collaborations between higher education and industry are not novel and may be considered an established feature of knowledge transfer and exchange. However, the active promotion of private investment must also be seen against the background of on-going fiscal restraint and therefore increases the potential for private sector investment to become a substitute, not a complement, to public finance.

20European Trade Union Committee for Education
A similar number of recommendations urge Member States to link higher education institution funding much more explicitly to performance and to adopt ‘incentive-related’ funding mechanisms. Typical examples include (emphases added by researchers).
Accelerate the development and introduction of a new methodology for evaluating research and allocating funding in view of increasing the share of performance-based funding of research institutions (Czech Republic, CSR, 2014)
Take further measures to improve the labour market relevance of tertiary education, including by providing incentives for cooperation between universities, firms and research. Increase performance-based funding of public research bodies and universities and foster R&I investment by the private sector. (Spain, CSR, 2016)
Incentivise cooperation between universities and the business sector. (Portugal, CSR, 2016)
Here the trend towards marketisation and commercialisation within higher education starts to become more explicit, as CSRs actively promote competitive funding models that in turn are likely to lead to greater hierarchy and inequality in university systems. Whilst we make no claim that these CSRs amount to a ‘policy orthodoxy’ within the Semester process, it is possible to discern a trend towards promoting private sector solutions in higher education and it is unlikely to be a coincidence that our survey data (reported in Section 2.3) suggests higher education institutions increasingly behave as if they are commercial organisations operating in a global market.
This overview of the education content of CSRs highlights the significant role education plays in CSRs and the diverse range of issues covered across all education sectors. In the table below, we provide a summary of this data:
Table 6: Education and Training CSRs 2012-2016
Country receiving the CSRs in 2012
Country receiving the CSRs in 2013
Country receiving the CSRs in 2014
Country receiving the CSRs in 2015
Country receiving the CSRs in 2016
Improve quality of education and educational outcomes, the educational achievement of disadvantaged children, the participation of disadvantaged or minorities and the inclusion of the most disadvantaged (in particular with migrant background) into mainstream education
AT, BG, HU, SK, ES
AT, BG, DE, HU, LUX, RO, SK
AT, BG, HR, CZ, DK, FR, DE, HU, IT, LT, MT, PT, RO, SK, ES, UK
AT, BG, CZ, HU, RO, SK
AT, BE, CZ, BG, RO, HU, SK
Improve access to good-quality early schooling and reduce early school leaving
HU, IT, LV, MT, PL, ES
ES, AT, HU, IT, MT, RO
AT, BE, BG, CZ, FR, DE, HU, IT, MT, PT, RO, SK, ES
BE, BG, SK, MT, RO
CZ, RO

21
Education and Training Policy in the European Semester
Support poorly performing schools and improve teaching of essential competences
HU, CZ CZ
Improve teaching of essential compe-tences/attainment of basic skills and reduce number of young people with low basic skills
UK DK CZ, MT, SE, UK
HU, LT, MT, UK
Raise the attractiveness of the teaching profession and the quality of teaching
PL, SK CZ, SK SK CZ, LT, SK
Ensure adequate teachers’ training and teachers’ continuous professional devel-opment. Improve the attractiveness of teaching as a profession
BG IT CZ, HU, MT, SK
CZ, HU, MT, SK
Adopt and implement education/school reforms
BG BG, DK BG, FR, ES BG, IT
Reform curricula BG LV LV LV
Improve evaluation frameworks/quality assurance and qualification systems/monitoring system of students’ performances
IT, CZ, SK CZ, ES HR, CZ, IT, LV
Improve the labour-market relevance of education, in particular by addressing skills mismatches and skills shortages to improve employability, with a focus on vocational education and training, apprenticeship systems, life-long and adult learning. Develop job-relevant skills
BE, CY, DK, FI, FR, IT, LV, LT, LUX, MT, PL, SK, SI, ES, UK
BE, BG, DK, ES, EE, FI, FR, HU, IT, LV, LT, LUX, MT, PL, RO, SE, SK, SI
BE, BG, HR, DK, EE, FI, FR, HU, IE, IT, LV, LT, LUX, MT, PL, PT, RO, SK, SI, ES, UK
BE, EE, FI, IT, LV, LT, UK
BE, FR, LV, LT, MT, SI, ES, UK, HR, FI, FR, PL
Improve transition between different stages of education and between educa-tion and the labour market
EE, IT HU, ES, SE HU, HR, DK, FR, SE
HU
Enhance investment in education and research
DE, NL CZ, NL, DE NL, DE DE BE, DE, IE, LT
Improve the quality/adequacy/sustain-ability/cost-effectiveness of public spending in education
AT, BG, CZ, DK, HU
DK, PL PT IE
Support research and innovation. Invest in infrastructure, innovation and research
LV, ES EE, IT, NL, LV, DE
EE, NL, LV, DE
BE, IE, NL

22European Trade Union Committee for Education
Increase private investment in higher education and research, enhancing the cooperation between businesses and universities and performance-based funding
EE, LV BG, CZ, EE, LV, SK
BG, CZ, EE, IT, PT, SK
LV DK, PT, EE, ES
Higher education HU, LV AT, EE, LV AT, BG, CZ, HU, LV
CZ, LV LV
Reduce drop-outs from higher education AT, IT AT AT
2.2.3 Conclusions
The data provided here shows the importance of Country Specific Recommendations to the European Semester process. We would want to highlight the following key issues:
1. The European Semester is principally a mechanism of economic governance, focused on fiscal surveillance and budget monitoring. As a system of economic governance, it is unsurprising that the emphasis in CSRs is on achieving the EU’s goals in relation to growth, investment and deficit management. However, it is clear that education-related CSRs feature prominently. Education goals are an important part of the EU2020 targets, and this is reflected in the significance of education-related CSRs within the Semester process.
2. The dominance of economic issues has a significant impact on education-related CSRs in two important respects. First, it is clear that educational objectives are often prioritised because of their potential to impact economic goals, i.e. education policy is seen as a tool of supply-side economic policy. This can mean that education policies are seen only to be instrumental to the needs of the economy. Second, it is important to see all CSRs in the whole. Hence, CSRs committed to expanding education provision may sit alongside CSRs exhorting public investment restraint. In trying to reconcile this contradiction, our assessment is that economic CSRs triumph as they link to punitive elements of the process, whereas education-related CSRs can be seen as ‘second order’ recommendations.
3. Notwithstanding the points above, it would be mistaken to represent education policy and education-related CSRs as crudely driven by economic demands. EU2020 goals, and therefore the European Semester, can be considered to have an important social dimension, and within this research we were informed several times that these social goals were being ‘rebalanced’ within the EU. This shift reflects a number of linked challenges including the migrant crisis and the long-term impact of austerity and recession on social cohesion. There are therefore opportunities to open up this ‘policy space’ (Lawn and Grek, 2012), and to use it to press the social demands of EU citizens. This becomes possible within the Semester given the emphasis on co-production of CSRs between the European Commission and Member States, and with the involvement of social partners. To what extent this is achieved in reality is clearly a function of the extent to which there is genuine social dialogue within the process.

23
Education and Training Policy in the European Semester
2.3 SOCIAL DIALOGUE: INVOLVING SOCIAL PARTNERS IN THE DEVELOPMENT AND ENACTMENT OF EDUCATION POLICY
2.3.1 Involvement of education unions in social dialogue
The European Semester is a form of governance underpinned by principles of social dialogue, which are central to EU policy making and which have been reaffirmed in the Commission’s commitment to a ‘new start’ in social dialogue (European Commission, 2015b). Social dialogue is a specific form of policy development which may involve negotiation, consultation or communication between the European Commission and social partners (representatives of employers and employees respectively). At Member State level, social dialogue may be between national governments and employers’ and employees’ representatives. Research by Sabato et al. (2017) indicates that social dialogue at a cross-sectoral level within the Semester remains underdeveloped.
In this study, our survey invited ETUCE member organisations to indicate the extent to which they are involved in social dialogue in the education sector. The data is presented below by sector:
Table 7. Percentage of teacher union involvement in social dialogue (by education sector)
Early Childhood Education Very common
Fairly Common
Rare Not at all
There are established collective bargaining arrangements for negotiating pay in the early childhood education sector
57.6 18.2 18.2 6.1
There are established collective bargaining arrangements for negotiating non-pay employment conditions in the early childhood education sector
57.6 18.2 18.2 6.1
Unions are involved in a social partnership to determine overall policy in the early childhood education sector
60.6 15.2 24.2 0
Significant changes in the early childhood education sector are only introduced with the involvement of relevant unions
33.3 36.4 21.2 9.1
There is consultation between unions and EU agencies about the impact of EU policies on the early childhood education sector*
6.1 21.2 42.4 30.3

24European Trade Union Committee for Education
School Sector (primary and secondary)
Very common
Fairly Common
Rare Not at all
There are established collective bargaining arrangements for negotiating pay in the primary and/or secondary education sectors
75.0 9.1 6.8 9.1
There are established collective bargaining arrangements for negoti-ating non-pay-related employment conditions in the primary and secondary education sectors
70.5 15.9 9.1 4.5
Unions are involved in a social part-nership to determine overall policy in the primary and/or secondary education sectors
61.4 18.2 20.5 0
Significant changes in the primary and/or secondary education sectors are only introduced with the involve-ment of relevant unions
29.5 38.6 25.0 6.8
There is consultation between unions and EU agencies about the impact of EU policies on the primary and/or secondary education sectors
4.5 20.5 50.0 25.0
Technical and Vocational Education and Training (TVET)
Very common
Fairly Common
Rare Not at all
There are established collective bargaining arrangements for negoti-ating pay in the TVET sector
59.5 18.9 8.1 13.5
There are established collective bargaining arrangements for negotiating non-pay employment conditions in the TVET sector
43.2 35.1 13.5 8.1
Unions are involved in a social part-nership to determine overall policy in the TVET sector
45.9 27.0 18.9 8.1
Significant changes in the TVET sector are only introduced with the involvement of relevant unions
27.0 35.1 24.3 13.5
There is consultation between unions and EU agencies about the impact of EU policies on the TVET sector
8.1 13.5 51.4 27.0

25
Education and Training Policy in the European Semester
Higher Education and Research Very common
Fairly Common
Rare Not at all
There are established collective bargaining arrangements for nego-tiating pay in the higher education and research sector
75.9 10.3 6.9 6.9
There are established collective bargaining arrangements for negotiating non-pay employment conditions in the higher education and research sector
58.6 27.6 6.9 6.9
Unions are involved in a social partnership to determine overall policy in the higher education and research sector
34.5 37.9 27.6 0
Significant changes in the higher education and research sector are only introduced with the involve-ment of relevant unions
17.2 41.4 37.9 3.4
There is consultation between unions and EU agencies about the impact of EU policies on the higher education and research sector
10.3 10.3 65.5 13.8
*This item did not scale with the other items
For the survey items focused on social dialogue, a total of forty-six unions responded, representing all the twenty-eight EU Member States. Only the responses from EU Member States are presented in the table above.
The survey items cover the extent of collective bargaining in negotiations for pay and non-pay-related employment conditions (e.g. working hours), union involvement in policy reforms, and consultation between the union and EU agencies for each sector. Representatives of ETUCE member organisations were invited to respond to five individual survey items in relation to their own education sector(s). Of the twenty items (five items across four sectors), nineteen generated a set of related items that are statistically linked and that identify patterns of social dialogue across the sectors.
Reinforced by our more detailed statistical analysis9, the raw data in Table 7 shows that collective bargaining is the most common form of social dialogue across all sectors. Conversely, union involvement in significant policy changes and consultation between unions and EU agencies are the least common forms of social dialogue.
Our qualitative data supports these findings. In the five case study countries, social dialogue arrangements at Member State level varied in form and effectiveness, but were generally well established. In some cases, these processes might be considered highly developed and robust, by which we mean there are agreed procedures which are understood and respected by all social partners. Further details are provided in the country case studies in Section 3 of this report.
9 [The detailed statistical analysis referred to here is presented in more detail in a separate technical paper. For a copy of the paper, contact the research team via [email protected]].
26European Trade Union Committee for Education
However, in only one country (Denmark) was it possible to identify significant education trade union involvement in social dialogue with EU institutions in relation to issues raised by the European Semester. There is therefore a gap, or disconnect, between the European Semester as a process, that has much to say about education and the extent to which educators, through their collective organisations, are involved in meaningful social dialogue about the changes being discussed.
We would go further and suggest that where social dialogue is more established and robust at national level, it is more likely to occur within the Semester process. Although we recognise that our evidence base for this claim is limited, it has high potential significance. It suggests that if the European Commission wishes to develop social dialogue at European level in policy making, beyond the traditional scope of Article 153-154 TFEU, it is necessary to ensure that there is meaningful social dialogue at Member State level.
Whilst our survey evidence points to the very limited engagement of education trade unions as recognised social partners in dialogue and consultations with national and European decision-makers about the impact of EU policies at the milestones of the European Semester on all the sectors of education, our interviews with European Commission officials were more positive about future prospects. These senior civil servants acknowledged that social dialogue with education unions at Member State level had not always been well developed and that, in the period following the crisis, the Semester had been more ‘adversarial’ (EC official). However, it was commonly articulated that this situation was changing and that new opportunities to develop social dialogue were opening
up.
2.3.2 Conclusion
The European Commission has recently reaffirmed its commitment to social dialogue as a key principle underpinning EU governance. Within the ‘new start for social dialogue’ (EC 2015b), this commitment is made specifically in relation to the European Semester. Our research points to the following conclusions:
1. As indicated in Section 2.2 of this report, it is clear that the European Semester has significant implications for shaping education policy in Member States, most notably through the Country Specific Recommendations. However, this research points to a ‘democratic deficit’ in which education unions have very limited involvement in social dialogue with European institutions relating to the Semester. There is therefore a significant disconnect between the importance of education issues in the Semester process, the EC’s commitment to social dialogue within the process and the actual experience of education unions who report very limited engagement.
2. The quality of social dialogue at European level involving national education unions appears closely related to the quality of social dialogue within Member States. This suggests that if the EU is committed to deepening social dialogue at European level, it must also work to deepen and embed social dialogue within some Member States.
3. Social dialogue arrangements are not static, but are the outcome of wider political developments and contexts. Evidence in this report points to the limited involvement of education unions in social dialogue in relation to the Semester. However, this situation may be changing and is open to change. We believe that the Semester is a process that can be ‘opened up’ and that more strategic interventions in the process by individual unions can facilitate this.

27
Education and Training Policy in the European Semester
2.4 PRIVATISATION DEVELOPMENTS IN EDUCATION: EUROPEAN PERSPECTIVES
In this section of the report, we set out the outcomes of a survey of ETUCE member organisations that present the views and experiences of education unions of privatisation in their respective countries (a full list of survey respondents is provided in Appendix 2).
In the survey, we have adopted a broad definition of privatisation, drawing on a framework developed by Ball and Youdell (2008). This starts by representing privatisation as any practice whereby public sector activity is displaced by private sector activity. This can assume many forms but might typically include the direct promotion of private over public sector provision (such as a private education institutions), the use of the private sector to provide public services (most commonly in the form of contracting-out) or shifts towards ‘consumer pays’ models (for example increased tuition fees).
Within our definition of privatisation, and drawing on Ball and Youdell (2008), we also include those institutional practices which public institutions have imported from the commercial sector. Examples might include a shift towards individualised and performance-related pay or the development of quasi-markets which link institutional performance to rewards and sanctions.
This survey covers both these forms of privatisation, sometimes referred to as the privatisation of, and in, education.
It is important to note that a survey cannot accurately demonstrate the precise ‘level’ of privatisation by simply asking respondents what is privatised, how much privatisation is occurring or how widespread they think it is. Rather, we can use this survey to help us understand ‘patterns of privatisation’, namely, which types of privatisation are evident, which particular indicators of privatisation are found together and which systemic traits indicate lower or higher levels of privatisation.
Given our focus on patterns of privatisation rather than raw data or individual responses, we do not present the raw percentage data in the main body of the report. For completeness, this is presented in Appendix 6, along with a list of all the survey items. Whilst the raw percentage data is interesting at a basic level, it has very limited statistical validity, therefore, any conclusions drawn from it should be treated with considerable caution.
The approach we have adopted is to use two methods of statistical analysis that have particular strengths in demonstrating patterns and relationships across survey items: Mokken scale analysis and Rasch analysis. This is necessarily a technical process and, in order to ensure accessibility of the report to a wide audience, we have avoided the use of detailed statistics in this text. Rather, our approach is to describe the data in ways that are readily understandable to both a technical and non-technical audience. This inevitably sacrifices some detail, but can be provided on request in a separate technical paper from the research team.
The data presented here refers to four different sectors of education: Early Childhood Education (ECE), Primary and/or Secondary Education, Technical and Vocational Education (TVET) and Training and Higher Education and Research (HE).
2.4.1 Early Childhood Education
For the items about Early Childhood Education (ECE), a total of forty-four unions responded, representing twenty-one of the twenty-eight EU Member States (see Appendix 2).
In the sector, it was possible to identify three different ‘clusters’ of responses. A ‘cluster’ refers to the features of privatisation identified in the survey items which were found to increase together, i.e. they were statistically related. Below we set out the three ‘clusters’. However, the scales did not contain enough items to make solid comparisons across systems.

28European Trade Union Committee for Education
Figure 4. ECE privatisation – ECE social dialogue
The items listed as ECE social dialogue relate to collective bargaining and social dialogue arrangements in the ECE sector. In essence, where there is an absence of collective bargaining and social dialogue it is much more likely that decisions about employment and working conditions will be determined at the level of the individual institution. Thus, the system is more individualised with employees having limited collective representation.
Figure 5. ECE privatisation – ECE ownership and funding
Employment conditions not related to pay are
determined at the centre level (for ex-
ample, working hours, holidays, etc.)
Significant changes in There are established collective bargaining arrangements for negotiating non-pay employment conditions in the early childhood education and care sector (Reversed)
Significant changes in the early childhood edu-cation and care sector are only introduced with the involvement of relevant unions. (Reversed)
Unions are involved in a social partnership to determine overall policy in the early childhood education and care sector. (Reversed)
There are established collective bargaining ar-
rangements for negotiating pay in the early childhood education and care sector.
(Reversed)
The government provides financial
incentives for parents to send their children
to private fee-charging early childhood centres
Early chilhood provision is offered by for-profit organisations
Early chilhodd centres exist which are publicly funded, bu privately managed
Private fee-charging centres provide early childhood care in this country
The government provides funding direct to private
fee-charging early childhood centres (for example, subsi-
dies, tax breaks, etc.
29
Education and Training Policy in the European Semester
The items listed as ‘ECE ownership and funding’ relate mostly to the financial arrangements in the sector. They show the link between publicly funded but privately managed centres, private for-profit providers, fee-charging centres, and government involvement through financial incentives and direct government funding of private fee-charging centres. This highlights the high level of ‘porosity’ between public and private provision in the sector. Where private provision in ECE is common, it depends heavily on public support in the form of government funding, subsidies and other incentives.
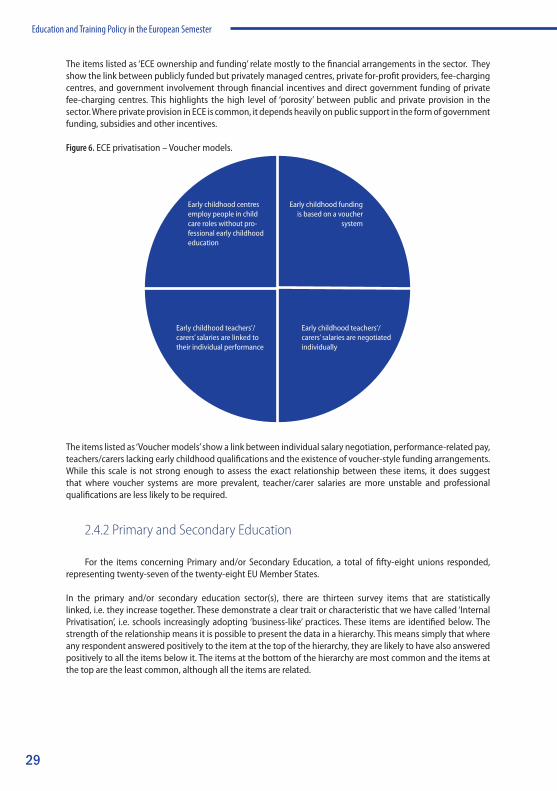
Figure 6. ECE privatisation – Voucher models.
The items listed as ‘Voucher models’ show a link between individual salary negotiation, performance-related pay, teachers/carers lacking early childhood qualifications and the existence of voucher-style funding arrangements. While this scale is not strong enough to assess the exact relationship between these items, it does suggest that where voucher systems are more prevalent, teacher/carer salaries are more unstable and professional qualifications are less likely to be required.
2.4.2 Primary and Secondary Education
For the items concerning Primary and/or Secondary Education, a total of fifty-eight unions responded, representing twenty-seven of the twenty-eight EU Member States.
In the primary and/or secondary education sector(s), there are thirteen survey items that are statistically linked, i.e. they increase together. These demonstrate a clear trait or characteristic that we have called ‘Internal Privatisation’, i.e. schools increasingly adopting ‘business-like’ practices. These items are identified below. The strength of the relationship means it is possible to present the data in a hierarchy. This means simply that where any respondent answered positively to the item at the top of the hierarchy, they are likely to have also answered positively to all the items below it. The items at the bottom of the hierarchy are most common and the items at the top are the least common, although all the items are related.
Early childhood funding is based on a voucher
system
Early childhood teachers’/carers’ salaries are linked to their individual performance
Early childhood centres employ people in child care roles without pro-fessional early childhood education
Early childhood teachers’/carers’ salaries are negotiated individually

30European Trade Union Committee for Education
Figure 7. Item hierarchy for Internal Privatisation in Primary and/or Secondary Education.
The items demonstrate the connection between this type of privatisation in primary and/or secondary schools and the features of New Public Management and high stakes accountability for teachers. Internal privatisation as a scale includes devolved human resources, marketing, and employment conditions and salaries determined at school level. The scale also contains items about specific features of teachers’ work, such as teachers being required to teach outside their specialism, annual performance management reviews, standardised tests to evaluate teacher performance, the deregulation of teacher qualifications, and salaries linked to students’ test scores. The data suggests that, in the statutory years of education, the most common forms of privatisation are those which encourage schools to behave like commercial businesses, rather than provision by private providers.
In Table 8 and Figure 8, we present how these patterns of privatisation are reflected across Europe (EU and non-EU countries). In this sector (and for TVET and Higher Education and Research), the statistical relationships are stronger and it is therefore possible to analyse the patterns across countries.
The private sector provides school inspection services to public school
Teachers’ salaries are linked to their students’ test scores
Teacher qualifications have been deregulated
Teachers’ salaries are negotiated individually
Teachers’ salary scales are determined at the school level
Teachers salaries are linked to their indiviual performance
Public schools can gain additional funding through competitively awarded government funds
Employment conditions not reltaed to pay are determined at the school level (for example, working hours, holidays etc)
Standardised testing is used to evaluate teacher performance in public schools
Teachers must undergo an annual performance management review
Public schools use marketing strategies to attract students
Teachers may be required to teach outside their specialism (for example, teaching a different ago group or subject)
Personnel/Human Resource decisions are devolved to the school level

31
Education and Training Policy in the European Semester
Table 8 Countries identified by degree of internal privatisation in Primary and/or Secondary Education
Widespread internal privatisation (Dark Red)
Very common internal privatisation (Medium Red)
Fairly common internal privatisation (Light Red)
Limited internal privatisation (Light Blue)
Rare internal privatisation (Medium Blue)
Very rare internal privatisation (Dark Blue)
EU Member States
X England** UK* Bulgaria Estonia
Scotland** Romania Sweden* Czech Republic Belgium* Slovakia* Netherlands Slovenia Denmark* Latvia
Spain* Poland France* Hungary Italy* Malta Germany* Lithuania Portugal* Ireland*
Finland Austria Cyprus Greece Luxembourg
Non-EU Member States
Kyrgyzstan Russia Switzerland* Iceland Norway Georgia Ukraine
ArmeniaAlbania
MontenegroSerbia
*Value was calculated to reflect the average of more than one response**England and Scotland demonstrated significantly different results, so they are listed separately in the chart but color-coded as a single country for the mapNote: No data was available for Croatia
Figure 8. Levels of internal privatisation in Primary and/or Secondary Education.

32European Trade Union Committee for Education
2.4.3 Technical and Vocational Education and Training
For the items concerning Technical and Vocational Education and Training (TVET), a total of forty-six unions responded, representing twenty-five of the twenty-eight EU Member States.
In the TVET sector, there are fourteen survey items that are statistically linked and demonstrate a clear trait which we have called ‘Internal and External Privatisation in TVET’, i.e. the TVET sector is adopting business-like practices and institutions are experiencing private sector provision/funding. These linked items are identified below. The strength of the relationship means it is possible to present the data in a hierarchy. Simply, this means that respondents who answered positively to the item at the top of the hierarchy were likely to have also answered positively to all the items below it. The items at the bottom of the hierarchy are most common and the items at the top are the least common, although all the items are related.
The linked items encompass different types of external privatisation in TVET, including private sector provision of TVET programmes, private sector funding of capital projects in public TVET institutions, private sector provision of consultancy services to public TVET institutions, and private sector provision of inspection services to public TVET institutions. Interestingly, these items are also found to be connected to other items that demonstrate internal privatisation including the use of marketing, devolved human resources and financial management, pay and employment conditions decided at institutional level, and salaries related to the teacher/educator performance or students’ outcomes. Equally, they are also related to items which indicate students pay fees for TVET programmes and TVET teachers/educators are not required to hold professional teaching qualifications. This cluster of items is particularly interesting because of the mix of both internal and external privatisation.
In Table 9 and Figure 10, we show how these patterns of privatisation in the TVET sector are reflected across Europe (EU and non-EU countries). The statistical relationships are strong enough to analyse the patterns across countries.

33
Education and Training Policy in the European Semester
Figure 9. Item hierarchy for the mix of internal and external privatisation in Technical and Vocational Education and Training.
The private sector provides inspection services to public TVET institutions
Salaries are linked to their students’ outcomes (for example, students’ examination results)
TVET teachers’ salaries are negotiated individually
Teachers at TVET institutions do not require a professional teaching qualification
TVET teachers’ salaries are linked to their individual performance
The private sector provides consultancy services to public TVET institutions
The private sector funds capital projects in public TVET institutions (for example, new buildings)
Students pay fees for TVET programmes
TVET teachers’ salary scales are determined at institution level
Employment conditions not related to pay are determined at the institution level (for example, working hours, holidays etc)
TVET programmes are offered by private institutions
The financial management of TVET institution budgets is decentralised
Personnel/human resources decisions are devolved to the institution level.
TVET institutions use marketing strategies to attract students

34European Trade Union Committee for Education
Table 9. Countries identified by degree of Mixed Internal and External Privatisation in Technical and Vocational Education and Training
Widespread mixed privatisation (Dark Red)
Very common mixed privatisation (Medium Red)
Fairly common mixed privatisation (Light Red)
Limited mixed privatisation (Light Blue)
Rare mixed privatisation (Medium Blue)
Very rare mixed privatisation (Dark Blue)
EU Member States
X UK* Sweden* Ireland* France
Denmark Estonia Belgium Netherlands Slovakia* Germany* Czech Republic Malta Spain*Italy* Latvia Poland*
Portugal Romania Slovenia Lithuania Finland Austria
Hungary Greece Luxembourg
Non-EU Member States
X Kyrgyzstan Switzerland* Russia
UkraineNorway
ArmeniaSerbiaAlbaniaMontenegro
*Value was calculated to reflect the average of more than one responseNote: No data was available for Bulgaria, Croatia or Cyprus
Using the scale above, the countries can be categorised by their level of mixed internal and external privatisation.
Figure 10. Degree of a mix of internal and external privatisation in Technical and Vocational Education and Training.

35
Education and Training Policy in the European Semester
2.4.4 Higher Education and Research
For the items about Higher Education and Research, a total of thirty-nine unions responded, representing twenty-one of the twenty-eight EU Member States.
In the higher education and research sector, there are fourteen items that are statistically linked and demonstrate a clear trait which we have called the ‘Higher Education and Research Commercialisation’. In this context, the term commercialisation is used to describe a mix of internal privatisation and external privatisation, but with a heavy skew towards significant external privatisation, i.e. the direct involvement of the private sector in higher education and research activity. In essence, higher education institutions are seen to behave as commercial entities, not least because they have significant private sector input.
This appears to be the most highly developed privatised sector when compared to the other sectors involved in this study. Once again, the strength of the relationship means it is possible to present the data in a hierarchy. This means simply that where any respondent answered positively to the item at the top of the hierarchy, they are also likely to have answered positively to all the items below it. The items at the bottom of the hierarchy are the most common and the items at the top are the least common, although all the items are statistically related.
Figure 11. Item hierarchy for the commercialisation of higher education and research
The private sector provides continuing professional development and training to public university
Public universities operate international for-profit campuses overseas
The private sector provides consultancy services to public universities
Academic staff must undergo an annual performance management review
Private sector institutions that are not universities provide higher education courses
Students use private sector loans to finance their tuition fees and/or living expenses (e.g. accommodation, IT and study materials, food, leisure, etc.)
Government assessments rank public universities according to their research activities
Private businesses co-fund public university activities (for example, awards, research etc.)
Public universities engage in private sector funded research
Public universities gain additional funding through partnerships with businesses
Public universities use marketing strategies to attract students
Universities use flexible employment practices (for example, short-term contracts)
Academic staff can be hired on temporary contracts
The private sector funds capital projects in public universities (for example, new buildings)
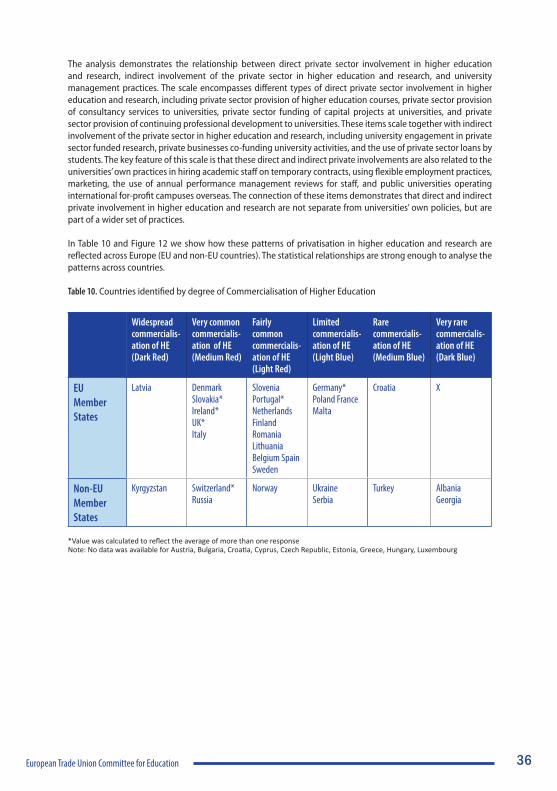
36European Trade Union Committee for Education
The analysis demonstrates the relationship between direct private sector involvement in higher education and research, indirect involvement of the private sector in higher education and research, and university management practices. The scale encompasses different types of direct private sector involvement in higher education and research, including private sector provision of higher education courses, private sector provision of consultancy services to universities, private sector funding of capital projects at universities, and private sector provision of continuing professional development to universities. These items scale together with indirect involvement of the private sector in higher education and research, including university engagement in private sector funded research, private businesses co-funding university activities, and the use of private sector loans by students. The key feature of this scale is that these direct and indirect private involvements are also related to the universities’ own practices in hiring academic staff on temporary contracts, using flexible employment practices, marketing, the use of annual performance management reviews for staff, and public universities operating international for-profit campuses overseas. The connection of these items demonstrates that direct and indirect private involvement in higher education and research are not separate from universities’ own policies, but are part of a wider set of practices.
In Table 10 and Figure 12 we show how these patterns of privatisation in higher education and research are reflected across Europe (EU and non-EU countries). The statistical relationships are strong enough to analyse the patterns across countries.
Table 10. Countries identified by degree of Commercialisation of Higher Education
Widespread commercialis-ation of HE (Dark Red)
Very common commercialis-ation of HE (Medium Red)
Fairly common commercialis-ation of HE (Light Red)
Limited commercialis-ation of HE(Light Blue)
Rare commercialis-ation of HE (Medium Blue)
Very rare commercialis-ation of HE(Dark Blue)
EU Member States
Latvia Denmark Slovakia* Ireland* UK* Italy
Slovenia Portugal* Netherlands Finland Romania Lithuania Belgium Spain Sweden
Germany* Poland France Malta
Croatia X
Non-EU Member States
Kyrgyzstan Switzerland* Russia
Norway UkraineSerbia
Turkey AlbaniaGeorgia
*Value was calculated to reflect the average of more than one responseNote: No data was available for Austria, Bulgaria, Croatia, Cyprus, Czech Republic, Estonia, Greece, Hungary, Luxembourg

37
Education and Training Policy in the European Semester
Figure 12. Degree of commercialisation of Higher Education and Research
2.4.5 Conclusions
The data provided here reports a survey of ETUCE member organisations in relation to their experiences and perceptions of education privatisation in their jurisdictions. The survey makes no attempt to draw a direct link between these developments and the European Semester, but rather the data presented here needs to be located within a broader policy picture of which the Semester forms a part. We would want to highlight the following key issues:
1. Statutory sector education (the years of compulsory education) appears to be most insulated from traditional forms of privatisation, referred to as ‘external privatisation’ in this study and drawing on Ball and Youdell (2008). This is almost certainly because the years of statutory education are most likely to be publicly provided as well as publicly financed (although in many EU Member States there can be a substantial private sector within the ‘public system’, see Verger et al. 2016). However, survey respondents report significant ‘internal privatisation’ in the years of statutory schooling, in which private sector and business practices are common. It may be mistaken therefore to see statutory schooling as immune from privatisation as the survey suggests this form of hidden and creeping privatisation is widespread.
2. Non-statutory aspects of education are more likely to represent a mixed economy of public and private provision. This is the case for Early Childhood Education, Technical and Vocational Education and

38European Trade Union Committee for Education
Training and Higher Education and Research. However, the Higher Education sector stands out as that part of the education system most exposed to privatisation pressures. This appears in multiple forms – increasingly transferring costs to students, encouraging the direct involvement of private providers (for teaching and research) and adopting ‘business-like’ management practices. The danger is that universities become increasingly driven by commercial imperatives, with concomitant risks to their public mission and to academic freedom.
3. Patterns of privatisation differ significantly across Member States, and attitudes towards public and private provision are framed by multiple and complex factors. Global economic factors are clearly an issue, but it is important to take account of wider cultural factors when assessing these issues.

39
Education and Training Policy in the European Semester
3 THE EUROPEAN SEMESTER IN ACTION: INDIVIDUAL COUNTRY CASES

40
DENMARK
Denmark’s education system is considered to perform well by EU standards. Its performance in relation to EU2020 targets is as follows:
Table 11. Denmark country profile
Early leavers from education and training (%)
Tertiary education attainment (% of 30-34 year olds)
EU target <10% 40%
EU State of Play (2015) 11% 38.7%
Denmark national target <10% >40%
Denmark State of Play (2015) 7.8% 47.6%
The 2016 Education and Training Monitor identified the following highlights in the Danish education system:
• Denmark has low early school leaving rates and participation in higher education is one of the highest rates in the EU.
• Denmark has the highest proportion of students in vocational education on work-based learning programmes, and the highest proportion of adults in lifelong learning programmes in all of the EU.
Denmark is also the highest spender on education within the EU. In 2014 Denmark devoted 7.2% of GDP to education (EU average = 4.9%). This figure represented 12.8% of total government expenditure.
Various EU reports highlight this issue as a problem. In 2016 the Education and Training Monitor reported:
The Danish Government introduced budgetary cuts across the education sector in the 2016 Budget Act. The cuts have the dual aim of reducing the overall cost of the public sector whilst improving the efficiency of the public sector as a whole, including the education sector.
The suggestion that Denmark spends ‘too much’ on education is exemplified by Country Specific Recommendations. For example, in 2012 the CSR specified Denmark should ‘Implement announced measures, without delay (our emphasis) to improve the cost-effectiveness of the education system’, whilst the following

41
Education and Training Policy in the European Semester
year the recommendations stated ‘Implement the reform of primary and lower secondary education in order to raise attainment levels and improve the cost-effectiveness of the education system.’ At the same time these recommendations were being made, the government sought to impose contract changes on Danish school teachers which would result in extending the working hours of teachers. This involved the Danish government disrupting the agreed collective bargaining process between teachers’ unions and the employers (the municipalities) and, in April 2013, this resulted in a protracted industrial dispute in the form of a lock-out (BBC online, 2013).
Figure 13. Government expenditure on education as a % of GDP in Denmark (2006 – 2015)
Figure 14. Government expenditure on education in million euro in Denmark (2006 – 2015)
Source: Eurostat (2017)
Source: Eurostat (2017)
42European Trade Union Committee for Education
Between 2011 and 2016, Denmark had education-related CSRs in all years except 2015. A significant proportion of these relate to the need to improve skills alignment within the labour market through reform of TVET provision. This focus on labour market issues highlights the dominance of economic considerations when discussing education policies. These account for the large majority of Denmark’s education-related CSRs during the years under consideration. In several years, there is a particular focus on the needs of workers ‘at the margins of the labour market’, whilst CSRs in 2013 and 2014 make specific reference to meeting the needs of migrant workers. These CSRs led one teacher union official to comment:
The CSRs are not always bad for teacher unions. Sometimes they make important points that we can use to apply pressure on our own government.
Higher education made only one appearance, in 2016, when the country was urged to ‘incentivise’ the co-operation between universities and business. In this short recommendation in 2016, we see two of the features which have emerged prominently in CSRs recent years. First is the promotion of private sector solutions (in this case through public-private partnerships) and second is the active encouragement of performance-related funding mechanisms by which public resources are tied to targets.
Denmark’s experience of the European Semester stands out as having the most developed social dialogue within the Semester process. Danish education unions give the process a high priority and have targeted the Semester specifically as one of the focus areas of their activity. This is supported by the shared funding of a union officer who is based for part of their week in Brussels. The officer is a member of the DLF, but all education unions contribute to the cost of the post with the officer reporting back to all unions through an agreed procedure.
As in other EU countries, the principal channel for social dialogue is with the Danish union confederation. The confederation gives the Semester a high priority and there is good communication between the confederation and the education unions. However, the education unions themselves have a significant and growing role in the Semester process.
Danish education unions have established links with both the Desk Officer for the European Commission Directorate-General for Education and Culture (DGEAC) and the European Semester Officer. Throughout this study, we have realised that developing personal relationships at this level, where possible, is important. We say ‘where possible’ because it is clear that this is not always a straightforward process. There are many factors which may make this a difficult relationship to develop (disposition of individuals, wider social dialogue context, relative importance of education in Semester debates). However, where conditions are favourable there are clear benefits to making these connections.
In the case of the Danish education unions this has resulted in them being invited to key stakeholder events including meetings to discuss the Education and Training Monitor and also participating in the fact-finding mission meetings prior to publication of the Country Report. It is the aim of the Danish education unions to intervene at all key points in the process, but most directly during the period when Country Reports and National Reform Programmes are being drafted.
Danish unions also benefit from being involved in a special committee, convened by the Danish parliament which includes government and social partners and exists to discuss the impact of EU policy and debates on Danish domestic policy.
Despite this highly-developed model, the unions report a challenge when seeking to communicate the outcome of their engagement with the Semester to others in their organisation but who are not involved in the process. It can be accorded a low priority given what are often seen as more immediate and pressing challenges there needs to be an ongoing effort to raise awareness and interest.
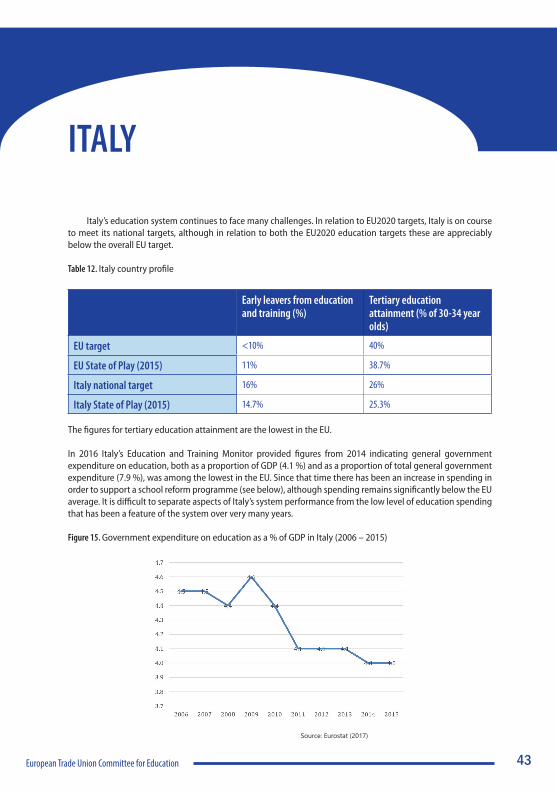
43European Trade Union Committee for Education
ITALY
Italy’s education system continues to face many challenges. In relation to EU2020 targets, Italy is on course to meet its national targets, although in relation to both the EU2020 education targets these are appreciably below the overall EU target.
Table 12. Italy country profile
Early leavers from education and training (%)
Tertiary education attainment (% of 30-34 year olds)
EU target <10% 40%
EU State of Play (2015) 11% 38.7%
Italy national target 16% 26%
Italy State of Play (2015) 14.7% 25.3%
The figures for tertiary education attainment are the lowest in the EU.
In 2016 Italy’s Education and Training Monitor provided figures from 2014 indicating general government expenditure on education, both as a proportion of GDP (4.1 %) and as a proportion of total general government expenditure (7.9 %), was among the lowest in the EU. Since that time there has been an increase in spending in order to support a school reform programme (see below), although spending remains significantly below the EU average. It is difficult to separate aspects of Italy’s system performance from the low level of education spending that has been a feature of the system over very many years.
Figure 15. Government expenditure on education as a % of GDP in Italy (2006 – 2015)
Source: Eurostat (2017)

44European Trade Union Committee for Education
Figure 16. Government expenditure on education in million euro in Italy (2006 – 2015)
This limited spending also needs placing in the context of Italy’s overall reduced spending and its negative economic growth (negative economic growth 2012-2014, followed by very modest growth since).
Italy has therefore been the subject of In-Depth Reviews and has received additional surveillance as part of the Macroeconomic Imbalance Procedure.
The influence of the EU on shaping education policy in Italy is reflected in an analysis of Italy’s Country Specific Recommendations. Given the country’s financial problems, and the problems associated with its banking sector, then CSRs relating to these issues dominate. However, between 2011 and 2016 Italy had education specific CSRs in four of the six years. In one year (2014), Italy’s education CSR contained no fewer than five different elements covering the schools sector, vocational education and universities. This brief analysis highlights the importance of the Semester to education policy, and although most CSRs relate to labour market related issues (for example, strengthening the connection between education and work) CSRs range over all education sectors and apply to funding, curriculum content, accountability mechanisms and teachers’ contracts.
Closer analysis of Italy’s education-related CSRs illustrate the way in which the Semester is used to reinforce what might be considered global policy orthodoxies. Our research does not support the view that CSRs are imposed on Member States in any crude and mechanistic way. There are punitive elements of the process, but they do not relate to education. Rather, we see how the Semester acts as one part of a ‘policy ensemble’ with the potential promote and reinforce particular policy options. In this sense, it must be seen as working alongside national agendas and the way that these are shaped by discourses associated with global institutions, such as OECD.
In Italy’s case this is best illustrated by the introduction of a major school reform known as La Buona Scuola (‘The Good School’), which passed into law in 2015. This legislation was wide ranging and highly controversial. Many aspects claimed to tackle longstanding problems in the Italian school system, including for example the precarious employment status of many teachers. It also claimed to increase school accountability.
However, many of the features of the system were criticised by teachers (across all three union confederations) and by students (who organised large demonstrations to oppose the reforms). Criticisms focused on increasing the power of school principals (seen as a challenge to Italy’s more collegial approach to school organisation), the divisive nature of changes to teachers’ employment and pay (through introducing a system of rationed performance pay) and the threat of privatisation. La Buona Scuola reforms promoted privatisation through the encouragement of private funding into the public school system. Susanna Camusso, General Secretary of the
Source: Eurostat (2017)

45
Education and Training Policy in the European Semester
Italian General Confederation of Labour (CGIL), argued the reforms ‘favour the rich and divide the precarious’.
Different aspects of these reforms were consistently promoted through Italy’s CSRs in 2014 and 2015, when Italy was urged to ‘adopt and implement the planned school reform’. CSRs in 2015 also made the following recommendation.
Swiftly and thoroughly implement the privatisation programme, and use windfall gains to make further progress towards putting the general government debt on an appropriate downward path.
The above CSR does not refer to education. It does, however, demonstrate the way in which privatisation emerges as a policy solution to a country’s debt problems, and we would argue that the Semester often acts to reinforce policies considered unpopular by citizens, such as La Buona Scuola reforms. La Buona Scuola reforms were intended to be the product of widespread consultation, although significantly, this deliberately denied any special status to Social Partners (employers’ and workers’ organisations). This should also be seen in the context of a suspension of collective bargaining rights for teachers in 2009, which still have not been restored. As it transpired, the population showed a huge appetite to debate the reforms through an online survey and in public meetings. In the end, however, debate was guillotined by the government and the law was passed using the procedural device of a confidence vote. Over 2,600 amendments were left undebated.
Social dialogue in Italy appears in a state of disrepair, with the sense of urgency created by the financial crisis used to undermine the influence and role of organised labour. In this research, the fragile nature of social dialogue at a national level was also reflected in engagement with the Semester process. This suggests that social dialogue within the Semester process is often a reflection of social dialogue in that Member State outwith the Semester, i.e. where social dialogue at a national level is weak, it is more likely that social dialogue within the Semester process will also be weak.
In the period following our initial research in Italy, the Constitutional Referendum was defeated (December 2016) and Prime Minister Renzi resigned. This precipitated a cabinet reshuffle and the appointment of a new education minister. This immediately resulted in an opening of negotiations with teacher unions, and the signing of important agreements relating to precarious teachers’ contracts. It remains to be seen to what extent this development presages a new period of more open and constructive social dialogue, which may in turn feed into the European Semester process. It does, however, point to the importance of personalities (a point emphasised by several interviewees in our research) and the way in which new possibilities can emerge quite quickly.

46
LITHUANIA
Lithuania has achieved its Europe 2020 national targets and is below the EU average for early school leavers and above the EU average for tertiary level education. Still, these results do conceal educational inequities such as gender differences and gaps between urban and rural schools. Moreover, whilst tertiary levels are among the highest in Europe, the continued emigration of young, educated Lithuanians, which began following the 2008 crisis, has led to a shortage of high-skilled workers.
Table 13. Lithuania country profile
Early leavers from education and training (%)
Tertiary education attainment (% of 30-34 year olds)
EU target <10% 40%
EU State of Play (2015) 11% 38.7%
Lithuania national target <9% 48.7%
Lithuania State of Play (2015) 5.5% 57.6%
The skills mismatch is a major concern; youth unemployment, particularly amongst the low-skilled, is still higher than pre-crisis levels (EC, 2016) and although the number of people not in employment, education or training (NEET) has improved, it remains below the EU average.
Lithuania has one of the fastest growing economies in the EU. Even so, two thirds of public investment in Lithuania is supported by European Structural and Investment Funds (ESIF). For the period 2014 to 2020, Lithuania will receive up to 8.4 billion euros. These funds, subject to the ex-ante conditions, must be invested in priority areas linked to the Europe 2020 and European Semester (ES) targets such as active labour market policies (ALMP) for the low-skilled and long-term unemployed and improving the labour market relevance of education. In 2012-2013, ESIF were redirected towards vocational training reforms which included the creation of a job seeker voucher scheme. However, much of the ALMP budget was spent on subsidised employment initiatives such as ‘Raising Youth Employment’ (GRL, 2013). More recently, ESIF have funded an adult e-learning service.
A decrease in educational expenditure is justified by the declining school-age population, and investment as a percentage of GDP is predicted to fall to 3.8% by 2020 (EC, 2015). According to an official from the Ministry of Education, private investment is encouraged in all areas of the economy. In 2014, the number of non-public pre-school education institutions increased by 11 percent from the previous year. More hidden forms of privatisation are visible in the decentralisation of financial administration. Since 2009, higher education has been funded by the ‘student’s basket’ and private sources and, to limit public expenditure, a state-sponsored loan is available to those without state-funded places. To foster competitiveness, a goal of the Euro Plus Pact, an increase in competitive research funding and cooperation between universities and businesses have been encouraged. At pre-school level, a student basket was created in 2011 to increase diversity of provision and encourage competition between municipal and private educational institutions and reduce the equity gap in urban and rural areas (GRL, 2011).

47
Education and Training Policy in the European Semester
Figure 17. Government expenditure on education as a % of GDP in Lithuania (2006 – 2015)
Figure 18 Government expenditure on education in million euro in Lithuania (2006 – 2015)
Following a public sector pay freeze (GRL, 2011), wages are rising again but teachers’ salaries remain below the national average and amongst the lowest in the EU when compared with GDP per capita (Eurydice, 2016). Poor starting salaries based on contact hours and limited CPD mean that teaching is not an attractive profession. By contrast, with poor state pensions, older teachers are reluctant to retire (EC, 2017). Issues of teacher quality were raised for the first time in 2015 (EC, 2015).
Even before the financial crisis, Lithuania was subject to commitments on joining ERM II (EC, 2012) and there is some cohesion between these requirements and those of the ES. Between 2011 and 2013, the CSRs focused on a revision of the labour code, sufficient ALMP investment, flexible labour legislation, apprenticeships, a qualification forecasting system, and a Youth Guarantee to improve the employability of young people. Lithuania has seemingly followed these recommendations and, perhaps in response to certain criticism on their limited progress, with greater exactitude over time. For instance, in 2013, the Ministry of Social Security and
Source: Eurostat (2017)
Source: Eurostat (2017)

48European Trade Union Committee for Education
Labour approved the Intensive Assistance Programme for Unemployed Young School Drop-outs and a plan for the implementation of a Youth Guarantee to ensure all under 29 year olds a job offer, study, apprenticeship or internship within four months of losing a job or completing formal learning. Later, in 2014 and 2015, CSRs focused on increasing adult participation in lifelong learning and improving the labour market relevance of education. In 2015 and 2016, Lithuania reported on an analysis of the Specialist Qualifications Map and, a new law on higher education and research which included compulsory pre-entry career guidance and the redirection of ESIF towards expanding the network of regional adult education coordinators (GRL, 2015; 2016). The stimulus for Lithuanian educational reforms seems to emerge from the Commission, however, an official at the Ministry for Education and Science felt the influence was mutual. He stated confidently that ‘we know the data ourselves’ and claimed CSRs were developed from their own strategies.
The early National Reform Programmes (2011-2013) make limited reference to social dialogue. The Ministry of Economy wrote to social and economic partners regarding the planned 2013-2020 structural reforms; responses came from The Lithuanian Free Market Institute, Investors’ Forum, The European Economic and Social Committee and UAB ‘Eksponentė’, a technology company. In 2015, discussions with social and economic partners took place at the Ministry of Economy with no education trade union present (GRL, 2015). The 2017 Country Report states that social dialogue remains weak despite the introduction of the new Labour Code; there is low union and employer organisation density and recent reforms to collective bargaining limit the capacity of trade unions to represent all employees. The Minister for Education and Science noted that debates on the ES often take place within an economic context and the question is ‘how do we bring teacher voices into this conversation?’.
A union representative felt that there was little knowledge of and involvement in the ES. He believed that they need to meet with other ministries than the Ministry for Education and Science, but this is difficult as there is resistance to social partner involvement and the ES is considered outside their remit. At national level, he highlighted that negotiations take place on the collective agreement except on areas which require public funding (salaries), which undermines the substance of the instrument.

49European Trade Union Committee for Education
MALTA
In recent years, Malta has undertaken significant curriculum reform as it seeks to modernise its education system, and transition from what is perceived as a traditional curriculum model. The 2016 Education and Training Monitor identifies the early school leaving rate (the second highest in Europe) and tertiary educational attainment as problems. By contrast, the transition from education to the labour market is considered easier than elsewhere in the EU and investment in education and training has been on an upward trajectory since 2008. In 2014, this was 5.8% of GDP (5.25% in 2008, and 2014 EU average = 4.9%). This figure represents 13.5% of total public expenditure in 2014, quite considerably higher than the EU average of 10.2%.
Figure 19. Government expenditure on education as a % of GDP in Malta (2006 – 2015)
Figure 20. Government expenditure on education in million euro in Malta (2006 – 2015)
Source: Eurostat (2017)
Source: Eurostat (2017)

50European Trade Union Committee for Education
Malta’s performance in relation to EU2020 targets is as follows:
Table 14. Malta country profile
Early leavers from education and training (%)
Tertiary education attainment (% of 30-34 year olds)
EU target <10% 40%
EU State of Play (2015) 11% 38.7%
Malta national target 10% 33%
Malta State of Play (2015) 19.8% 27.8%
These concerns are reflected in the CSRs for Malta between 2011 and 2016. In each year, Malta received education related CSRs. All sectors of the Maltese education system received recommendations from early years through schools to TVET and higher education.
In 2013, the recommendation for early childhood education highlighted the way in which progressive social issues can emerge on the back of agendas driven by economic considerations when an expansion of provision was recommended to support women’s entry into the labour market. Whether such recommendations are experienced as positive by women depends very much on the precise way policies are implemented and the level of accompanying investment. In many ways, such examples emphasise the important role of social partners to ensure that the generic exhortations in EU generated country specific recommendations are implemented in positive and progressive ways at national level.
In 2015, Malta’s education CSR focused on the development of teachers, linking this to improved outcomes in basic skills and reductions in early school drop-out rates. The CSR urged Malta to ‘Take measures to improve basic skills and further reduce early school-leaving by promoting the continuous professional development of teachers.’ This focus on the professional development of teachers, a CSR with considerable progressive potential, in fact only appears once in the CSRs. It appears to coincide with Malta’s introduction of an Institute of Teachers, described by Malta’s Education and Training Monitor in 2016 as:
The newly established Institute for Education is an autonomous body and will carry out functions related to continuous professional development and training of educators. The main objectives of the institute are to:
1) provide educators with skills to be used in their daily professional activities; 2) provide relevant and accessible accredited courses in a variety of areas; 3) act as a hub for teachers to meet and share common experiences; 4) promote educational leadership.
This CSR illustrates the way in which CSRs are sometimes determined by national agendas, with the CSRs acting as a type of legitimator of national policies. Several interviewees across the study argued that the EU, and CSRs in particular, can be used to deflect criticism from national governments when unpopular policies are being introduced.
This particular CSR also illustrates a problem identified in the training workshops, and acknowledged by EU officials, namely that the Semester cycle is a short one and that any recommendation that appears one year, but is absent the next, is unlikely to have resolved the issue it sought to address. As one Commission official

51
Education and Training Policy in the European Semester
commented:
If TVET is identified as a problem in one year, it will still be a problem the following year. These are not issues that are capable of being fixed in a single year.
Those areas of education policy that feature most strongly in Malta’s CSRs are those that relate to education to work transitions, and alignment with the labour market. Once again, they illustrate the dominance of economic agendas in relation to education policy. In interviews with senior civil servants in Malta, these officials observed that in the years following the crisis the EU’s agenda had emphasised economic agendas at the expense of social ones, and this was identified as a source of regret. There was a sense that the EU had lost sight of its social mission.
In terms of the education union involvement in social dialogue relating to the Semester this is best described as limited. Teachers in Malta are represented by the Malta Union of Teachers (MUT), and the union is well represented in national debates about issues impacting on teachers, both in terms of contractual issues and wider policy issues. The union, because of its size and its ability to represent across the sector, is a significant voice in shaping Maltese education discourse.
However, the union had little or no involvement in the Semester process as at 2016, and this despite the fact that one of the CSRs in 2015 had a very specific focus on teachers.
Take measures to improve basic skills and further reduce early school-leaving by promoting the continuous professional development of teachers.
Elsewhere within the Maltese education system other social partners reflected a similarly limited involvement in social dialogue. Overall the level of understanding of the Semester process was very restricted, and hence engagement was at a similarly low level.

52
SLOVENIA
A commitment to the provision of high quality public education for all underpinned the reform of education following the establishment of Slovenia as an independent country in 1991. The reforms were predicated on the notion that improving education would contribute to the well-being and development of individuals and also to the growth and prosperity of Slovenia. The last decade has been marked by the need to respond to the economic crisis. In Slovenia the policy response has been to reduce investment in education significantly as a means of securing economic and financial stability. There is concern that this will undermine the reforms and progress of the past two decades and will render fragile the commitment of educators who have invested in establishing the system.
The current high quality of education is reflected in strong and improving student performance. In relation to the Europe 2020 education headline targets Slovenia has already achieved its national targets and ranks above the EU average. Slovenia has one of the lowest rates of early leavers from education and training in the EU.
Table 15. Slovenia country profile
Early leavers from education and training (%)
Tertiary education attainment (% of 30-34 year olds)
EU target 10% 40%
EU State of Play (2015) 11% 38.7%
Slovenia national target 5% 40%
Slovenia State of Play (2015) 5% 43.4%
According to the 2015 Organisation for Economic Co-operation and Development (OECD) Programme for International Student Assessment (PISA) data, Slovenia was the third best performing EU country in science with performance in maths and reading showing improvement. The proportion of low achievers in reading, maths, science and reading is also lower than the EU average. Adult participation in learning remains above the EU average but there has been a decline in participation since 2012. The Education and Training Monitor (2016) also reported a reduction in the employment rate of recent graduates and a fall in participation in early childhood education and care. Programmes are in place to address these issues but there is a shared concern amongst educators from all sectors that an ongoing lack of investment in education may impact on future outcomes.
A significant effect of the European Semester on education and training reforms in Slovenia relates to Slovenia’s reduced investment in education. In spite of EU calls to protect growth-enhancing investments such as education, one element of Slovenia’s response to the continual demands to bring down public debt and to pursue fiscal consolidation within the framework of the European Semester has been to reduce investment in education. Public expenditure on primary through to tertiary education as a share of total public expenditure is well below the OECD average. Whereas the trend in expenditure by educational institutions has been generally increasing across the OECD between 2008 and 2013, in Slovenia expenditure fell across all levels (OECD, 2016). However,

53
Education and Training Policy in the European Semester
between 2008 and 2013, total public expenditure for all services increased by 24% while public expenditure on education fell by 12%. Slovenia is one of only two countries which reduced educational expenditure while increasing public expenditure. Teachers’ salaries, already below the EU-21 average, have been frozen and a range of measures has been adopted to prevent the rise of salaries. Although education in Slovenia is largely publicly funded, a controversial ruling in 2015 declared that all private basic school programmes had to be 100% publicly funded. This was opposed by the teacher trade unions. At a time when the financing of public education was being reduced, raising the share of money invested in private education is not seen to be ‘in the public interest’.
Figure 21. Government expenditure on education as a % of GDP in Slovenia 2006 - 2015
Figure 22. Government expenditure on education in million euro in Slovenia (2006 – 2015)
Of particular significance is the fact that the European Semester process is driven by the Ministry of Finance, necessitating an adept, agile and assertive negotiation by the education sector (the Ministry of Education, teacher trade unions and other key education actors) to make the case for high quality publicly funded education. Considerable political churn has resulted in three changes of government and several different Education Ministers in the recent past. This has made coherent and informed interventions in the process more difficult. Here, the support from the European Commission’s Directorate General for Education and Culture is regarded as
Source: Eurostat (2017)
Source: Eurostat (2017)

54European Trade Union Committee for Education
important in making the case for investment in high quality education. It has also been suggested that Slovenia’s strong performance in the EU2020 headline indicators and the PISA outcomes - the result of sustained longer-term education reform- may have in fact back-fired and served to legitimise cuts to the education budget as a short-term solution to meeting fiscal policy goals. There is a fear that this lack of investment will impact on future outcomes and on the country’s ability to provide high quality public education for all.
An analysis of the Country Reports, the Country Specific Recommendations and the National Reform Programme sheds light on the ability of the European Semester to influence Slovenia’s education policy priorities. Although education is a national competence there is growing evidence that since the introduction of the European Semester, the European Union has acquired greater influence over education and training in Slovenia. The EU has provided a valued umbrella for collaborative working and additional funding for the development of Slovenian education priorities. This includes, for example, the establishment of regional Special Education Needs Centres across the country to support mainstream schools with inclusion. However, the increased external scrutiny via the ES process and the ability to steer policy priorities brings particular tensions and a concern that national education priorities are subservient to those of the ES, which appear to be largely driven by labour market needs. A review of the education-related CSRs illustrates how these serve to foreground specific education policy priorities. In the case of Slovenia, since 2013 a particular emphasis has been placed on addressing ‘the skills mismatch’ and improving the labour market relevance of education. For 2016-17 the education related CSR is as follows:
In consultation with social partners, increase the employability of low-skilled and older workers, including through targeted lifelong learning and activation measures.
The proactive involvement of the Slovenian Institute for Adult Education in European lifelong learning development projects means that Slovenia is well placed to draw on significant national expertise to support the enactment of this recommendation. However, it would appear that little direct involvement and consultation with key actors in the field of adult education has taken place. It is worth noting that at European level responsibility for adult learning has moved from Directorate-General Education and Culture to Directorate-General Employment, Social Affairs and Inclusion, illustrating how, on the European stage, the role of education in meeting the needs of the economy is promoted and reinforced. This instrumental and narrow discourse does not sit well with the much broader conceptualisation of the purposes of education which underpin the Slovenian education system. There is also concern that other fundamental goals of ET 2020, including promoting equity, social cohesion and active citizenship, fostering creativity and innovation, feature less prominently in what is essentially a financially driven process.
Although teacher trade unions have been closely involved in the reform of the Slovenian education system since independence in 1991, within a well-established tradition of social dialogue, there has been limited direct engagement in the ES process. Formal and informal contact between the Ministry of Education and the Education, Science and Culture Trade Union of Slovenia (ESTUS) is well-established. However, involvement in the ES process has been limited to representation through the Economic and Social Council and attendance at presentations of the Education and Training Monitor. There is a growing awareness of the important influence of the European Semester on education and training and the pressing need for a more proactive and systematic engagement in the ES process in order to shape policy, fight for investment and to maintain a focus on offering quality public education to all. The ETUCE project has acted as a catalyst to strengthen teacher trade union involvement in the process, bring key actors together and deepen social dialogue. ESTUS is currently in the process of constructing an action plan to ensure that they capitalise on the opportunities to intervene more effectively in the process and to re-shape discourses around education policy priorities and their implementation and make the case for investment in education.

55
Education and Training Policy in the European Semester
4 CONCLUSION: THE EUROPEAN SEMESTER AND EDUCATION POLICY IN EU MEMBER STATES
This research report has explored the link between the European Semester and education policy in EU Member States. It has focused on four aspects of this relationship.
1. The impact on public investment in education
2. The role of Country Specific Recommendations within the Semester process
3. The extent of social dialogue in relation to European Semester processes
4. The perception and experience of privatisation in and of education across Europe
In presenting the following conclusions, we would want to counsel against arguing there is any crude and mechanistic relationship between the EU and education policy in Member States. Education is a national competence, which remains the responsibility of national governments. The relative influence of the European institutions in relation to Member States is both complex and contested, in particular in relation to education policy.
The European Semester therefore cannot be perceived as some crude mechanism of policy implementation whereby an almighty EU imposes its will on recalcitrant Member States. Rather, the Semester needs to be seen as a system of governance within which policy actors seek to shape policy, and whereby particular policy mechanisms frame the possibilities for action. In this sense, it can be seen as a ‘policy space’ in which both hard and soft power is exercised. The challenge for those seeking to influence this process is to identify where there are opportunities to open up this ‘policy space’ and lever power within it.
In relation to the four areas that are the focus of study we would highlight the following conclusions.
1 THE IMPACT ON PUBLIC INVESTMENT IN EDUCATION1.1 The economic crisis of 2008 has had a significant impact on public spending generally across the EU Member
States. Twenty-six of the EU28 have at some point been part of the Excessive Deficit Procedure, indicating that SGP rules have been broken and that corrective action is required. Some countries have faced particularly severe situations with public spending still substantially below 2008 levels. Those countries facing declining GDP experience additional problems as SGP rules act as a deflationary pressure on the economy.
1.2 Public expenditure as a % of GDP has generally risen across the European Union, however, between 2006 and 2015, educational expenditure as a proportion of public expenditure has fallen. This suggests that education has been particularly squeezed during the crisis. The economic crisis has clearly placed pressure on public finances, and these pressures are compounded by the requirements of the SGP. However, at the same time, the social consequences of recession have been driving up the demand for other budget headings, most obviously, social protection. The data presented in this research suggests that education spending has been sacrificed when faced with this problem.
1.3 The EU is beginning to make progress in terms of post-crisis recovery, although this overall picture should not mask the chronic problems that continue to be faced by some countries. Despite this recovery, there is some evidence that investment in education continues to lag behind as individual Member States appear reluctant to commit to boosting education investment. The paradox is that an area of public investment seen as central to driving recovery continues to suffer with the potential to impact on growth and employment.
56European Trade Union Committee for Education
Failure to address the issues results in a vicious circle of extended recession, continued pressure on social protection spending, and a crowding out of investment in education and human capital development.
2 THE ROLE OF COUNTRY SPECIFIC RECOMMENDATIONS WITHIN THE SEMESTER PROCESS
2.1 The European Semester is principally a mechanism of economic governance, focused on fiscal surveillance and budget monitoring. As a system of economic governance, it is unsurprising that the emphasis in CSRs is on achieving the EU’s goals in relation to growth, investment and deficit management. However, it is clear that education-related CSRs feature prominently. Education goals are an important part of the EU2020 targets, and this is reflected in the significance of education-related CSRs within the Semester process.
2.2 The dominance of economic issues has a significant impact on education-related CSRs in two important respects. First, it is clear that educational objectives are often prioritised because of their potential to impact economic goals, i.e. education policy is seen as a tool of supply-side economic policy. This can mean that education policies are seen only to be instrumental to the needs of the economy. Second, it is important to see all CSRs in the whole. Hence, CSRs committed to expanding education provision may sit alongside CSRs exhorting public investment restraint. In trying to reconcile this contradiction, our assessment is that economic CSRs triumph as they link to punitive elements of the process, whereas education-related CSRs can be seen as ‘second order’ recommendations.
2.3 Notwithstanding the points above, it would be mistaken to represent education policy and education-related CSRs as crudely driven by economic demands. EU2020 goals, and therefore the European Semester, can be considered to have an important social dimension, and within this research we were informed several times that these social goals were being ‘rebalanced’ within the EU. This shift reflects a number of linked challenges including the migrant crisis and the long-term impact of austerity and recession on social cohesion. There are therefore opportunities to open up this ‘policy space’ (Lawn and Grek, 2012), and to use it to press the social demands of EU citizens. This becomes possible within the Semester given the emphasis on co-production of CSRs between the European Commission and Member States, and with the involvement of social partners. To what extent this is achieved in reality is clearly a function of the extent to which there is genuine social dialogue within the process.
3 THE EUROPEAN SEMESTER AND SOCIAL DIALOGUE3.1 As indicated in Section 2.2 of this report, it is clear that the European Semester has significant
implications for shaping education policy in Member States, most notably through the Country Specific Recommendations. However, this research points to a ‘democratic deficit’ in which education unions have very limited involvement in social dialogue with European institutions relating to the Semester. There is therefore a significant disconnect between the importance of education issues in the Semester process, the EC’s commitment to social dialogue within the process and the actual experience of education unions who report very limited engagement.
3.2 The quality of social dialogue at European level involving national education unions appears closely related to the quality of social dialogue within Member States. This suggests that if the EU is committed to deepening social dialogue at European level, it must also work to deepen and embed social dialogue within some Member States.
3.3 Social dialogue arrangements are not static, but are the outcome of wider political developments and contexts. Evidence in this report points to the limited involvement of education unions in social dialogue in relation to the Semester. However, this situation may be changing and is open to change. We believe that the Semester is a process that can be ‘opened up’ and that more strategic interventions in the process by
57
Education and Training Policy in the European Semester
individual unions can facilitate this.
4 THE PERCEPTION AND EXPERIENCE OF PRIVATISATION IN AND OF EDUCATION ACROSS EUROPE
4.1 Statutory sector education (the years of compulsory education) appears to be most insulated from traditional forms of privatisation, referred to as ‘external privatisation’ in this study and drawing on Ball and Youdell (2008). This is almost certainly because the years of statutory education are most likely to be publicly provided as well as publicly financed (although in many EU Member States there can be a substantial private sector within the ‘public system’, see Verger et al. 2016). However, survey respondents report significant ‘internal privatisation’ in the years of statutory schooling, in which private sector and business practices are common. It may be mistaken therefore to see statutory schooling as immune from privatisation as the survey suggests this form of hidden and creeping privatisation is widespread.
4.2 Non-statutory aspects of education are more likely to represent a mixed economy of public and private provision. This is the case for Early Childhood Education, Technical and Vocational Education and Training and Higher Education and Research. However, the Higher Education sector stands out as that part of the education system most exposed to privatisation pressures. This appears in multiple forms – increasingly transferring costs to students, encouraging the direct involvement of private providers (for teaching and research) and adopting ‘business-like’ management practices. The danger is that universities become increasingly driven by commercial imperatives, with concomitant risks to their public mission and to academic freedom.
4.3 Patterns of privatisation differ significantly across Member States, and attitudes towards public and private provision are framed by multiple and complex factors. Global economic factors are clearly an issue, but it is important to take account of wider cultural factors when assessing these issues.

58European Trade Union Committee for Education
REFERENCES
Ball, S. J. (2007) Education PLC: Understanding private sector participation in public sector education. London: Routledge.
Ball, S. J. (2012) Global education Inc: New policy networks and the neo-liberal imaginary. London: Routledge.
Ball, S. J., & Youdell, D. (2008). Hidden privatisation in public education. Brussels: Education International.
BBC online (2013) Denmark teacher lock-out paralyses schools, available online at http://www.bbc.co.uk/news/world-europe-22014697
ETUCE (2017) ‘Practical Guide for an Effective Involvement of Education Trade Unions in the European Semester on Education and Training’ (ETUCE, 2017).
European Commission (2010) Europe 2020: A strategy for smart, sustainable and inclusive growth, available online at http://eur-lex.europa.eu/LexUriServ/LexUriServ.do?uri=COM:2010:2020:FIN:EN:PDF
European Commission (2015a) The EU’s economic governance explained, available online at europa.eu/rapid/press-release_MEMO-15-6071_en.pdf
European Commission (2015b) A new start for social dialogue, available online at ec.europa.eu/social/BlobServlet?docId=16099&langId=en
European Commission (online) Stability and Growth Pact, available online at https://ec.europa.eu/info/business-economy-euro/economic-and-fiscal-policy-coordination/eu-economic-governance-monitoring-prevention-correction/stability-and-growth-pact_en
European Commission/EACEA/Eurydice (2013) Funding of Education in Europe 2000-2012: The Impact of the Economic Crisis. Eurydice Report. Luxembourg: Publications Office of the European Union.Eurostat (2017) Education and Training Data Main Tables. Available at: http://ec.europa.eu/eurostat/web/education-and-training/data/main-tables [Accessed on 1 March 2017].http://www.keepeek.com/Digital-Asset-Management/oecd/education/education-at-a-glance-2016/slovenia_eag-2016-79-en#page2
Lawn, M. and Grek, S. (2012) Europeanizing education: Governing a new policy space. Oxford: Symposium Books.
Molenaar. I. W. and Sijtsma, (2000) User’s Manual MSP 5, IEC,e Programme. Netherlands.
OECD (2015) Education at a Glance 2015: OECD Indicators. Paris: OECD Publishing.
OECD (2016) Education at a Glance, 2016: OECD Indicators, OECD Publishing, Paris.
Rasch, G. (1960) Probabilistic models for some intelligence and achievement tests. Copenhagen: Danish Institute for Educational Research.
Sabato, S., Vanhercke, B. with Spasova, S. (2017) Listened to, but not heard? Social partners multilevel involvement in the European Semester, OSE Paper Series, Research Paper 35, March.
Sánchez-Barrioluengo M. (2016) Expenditure on education in Purchasing Power Standards: A comparison of three alternative deflators EUR 28261 EN. DOI: 10.2791/690227. Brussels: European Commission.
Verger, A., Fontdevila, C. and Zancajo, A. (2016) The privatization of education: A political economy of global education reform. New York: Teachers’ College Press.

59European Trade Union Committee for Education
APPENDIX 1
RESEARCH METHODS AND DATA COLLECTION/ANALYSIS
The data presented in this report was collected throughout the duration of the project (between March 2016 to March 2017). The principal data sources are as follows:
Project workshops – These were conducted in Malta (March 2016), Lithuania (June 2016), Italy (October 2016) and Slovenia (January 2017). Invitations to attend were extended to all ETUCE member organisations, and in all 78 delegates attended representing 52 different unions. The workshops were a combination of presentations and interactive small group activities. Typically, presentations were made by ETUCE officials, a host country union, the host country’s European Semester Officer and Ministry officials. Other presenters varied according to the programme for particular countries. Members of the research team were present at all the workshops.
Interviews – Following each of the workshops, interviews were scheduled with key actors in order to develop the country cases in this report. These programmes typically included interviews with education union officials, senior Ministry officials, employer representatives and the local European Semester Officer. In addition to interviews conducted in the four workshop countries, additional data collection visits were undertaken to Denmark (December 2016) and Brussels (February 2017). This involved interviews with senior officials in the Directorate-General for Employment, Social Affairs and Inclusion and Directorate-General for Education and Culture, ETUC, ETUCE, European Employers’ organisations (at cross sector and sector level) and those representing civil society organisations (though the European Semester Alliance). A total of 40 people was involved in interviews across the six sites.
Survey – A survey was conducted to establish the views and experiences of ETUCE member organisations in relation to education privatisation. The survey was distributed to all 131 ETUCE members (ETUCE’s membership is pan-European and is not co-terminous with EU membership). The survey was distributed in French and English and a total of sixty-eight responses were received (response rate = 52%). All countries of the EU were represented, although not all the education sectors across every EU country. A table indicating the range of responses across countries and sectors is provided in appendix 2.
Document analysis – A wide range of documents were collected and analysed as part of this study, including EU level policy documents and country specific documents such as the Country Report, National Reform Programme, Country Specific Recommendations and Education and Training Monitor for each Member State. Given the centrality of the CSRs to this project, these documents were converted into Word to allow easier analysis and then a detailed text analysis was undertaken. Data relating to education spending was largely collated via Eurostat reports (the statistical office of the European Union).

60
APPENDIX 2
SURVEY RESPONDENTS
The following indicates all ETUCE member organisations that responded to the survey. The table indicates whether the organisation represents an EU Member State, and which education sectors they provided responses for are marked with an X.
Country EU/Non- EU
ECE Gen TVET HER Union
Albania N X X X X Independent Trade Union of Education of Albania (SPASH-ITUEA) and Trade Union Federation of Education and Science Albania (SPASH)
Armenia N X X X 0 Branch Republican Union of Trade Union Organizations Workers of Education and Science of Armenia (CRSTESA)
Austria Y 0 X X 0 Gewerkschaft Öffentlicher Dienst (GÖD-Lehrer)
Belgium Y X X 0 0 Christelijk Onderwijzersverbond (COV)
Belgium Y 0 0 0 X Christelijke Onderwijs Centrale (COC)
Bulgaria Y X X 0 0 Syndicat des Enseignants Bulgares (SEB)
Croatia Y 0 0 0 X Independent union of research and higher education in Croatia
Czech Republic
Y X X X 0 Českomoravský Odborový Svaz Pracovníků Školství (ČMOS-PS)
Denmark Y X X 0 0 The Danish National Federation of Early Childhood and Youth Educators (BUPL)
Denmark Y 0 X 0 0 Danish Union of Teachers (DLF)
Denmark Y 0 X 0 0 Gymnasieskolernes Laererforening (GL)
Denmark Y 0 0 X X Dansk Magisterforening (DM)
Estonia Y X X X 0 Eesti Haridustöötajate Liit (EEPU)
Finland Y 0 0 0 X Finnish Union of University Researchers and Teachers (FUURT)
Finland Y X X X X Opetusalan Ammattijärjestö (OAJ)
France Y 0 X 0 0 Syndicat national des enseignements de second degré (SNES-FSU)
Georgia N X X 0 X Educators and Scientists Free Trade Union of Georgia (ESFTUG)
Germany Y X X X X Verband Bildung und Erziehung (VBE)
Germany Y X X X X Gewerkschaft Erziehung und Wissenschaft (GEW)
Greece Y 0 X X 0 Greek Federation of Secondary Education Public School Teachers (OLME)

61
Education and Training Policy in the European Semester
Iceland N X X 0 0 Kennarasamband Islands (KI)
Ireland Y 0 X X X Teachers' Union of Ireland (TUI)
Ireland Y X X 0 0 Irish National Teachers' Organisation (INTO)
Ireland Y 0 X 0 0 Association of Secondary Teachers of Ireland (ASTI)
Ireland Y 0 0 0 X Irish Federation of University Teachers (IFUT)
Italy Y X X X X Federazione Lavoratori della Conoscenza CGIL (FLC CGIL)
Italy Y X X X 0 UIL Scuola (UIL-S)
Kyrgyzstan N X X X X Trade Union of Education and Science Workers of Kyrgyztan Republic (TUESWK)
Latvia Y X X X X Latvijas Izglītības un zinātnes darbinieku arodbiedrība (LIZDA)
Lithuania Y X X X X Federation of Lithuanian Education and Science Trade Unions (FLESTU)
Malta Y X X X X Malta Union of Teachers (MUT)
Montenegro N X X X 0 Trade Union of Education of Montenegro (TUEM)
Netherlands Y 0 X X X Algemene Onderwijsbond (AOb)
Norway N X X X X Utdanningsforbundet (UEN)
Poland Y 0 0 X X Krajowej Sekcji Nauki NSZZ "Solidarność" (KSN "Solidarność")
Poland Y X X X 0 Sekcja Krajowa Oświaty i Wychowania NSZZ "Solidarność" (SKOIW "Solidarność")
Portugal Y X X X X Federação Nacional da Educação (FNE)
Romania Y X X X 0 Fédération des Syndicats Libres de l'Enseignement (FSLE)
Romania Y 0 0 0 X Federaţia Naţională Sindicală ALMA MATER
Russia N X X X X Education and Science Employees' Union of Russia (ESEUR)
Serbia N X X X X Teachers Union of Serbia (TUS)
Slovakia Y X X X X Union des Travailleurs de l’Enseignement et de la Science du Syndicat Indépendant de la Slovaquie (ZPŠaV NKOS)
Slovakia Y X X X X Odborový zväz pracovníkov školstva a vedy na Slovensku (OZPŠaV)
Slovenia Y X X X X Education, Science and Culture Trade Union of Slovenia (ESTUS)
Spain Y X X X X Federación de Empleadas y Empleados de los Servicios Públicos de la UGT. Enseñanza (FeSP-UGT Enseñanza)
Spain Y X X X X Confederación de Sindicatos de Trabajadoras y Trabajadores de la Enseñanza – Intersindical (STEs-Intersindical)
Spain Y X X X X Central Sindical Independiente de Funcionarios. Sector de Enseñanza (CSI·F Enseñanza)
Spain Y X X X X Federación de Enseñanza CC.OO (FE.CC.OO)
Sweden Y X X X 0 Läraras Riksförbund (LR)
Sweden Y X X X X Lärarförbundet

62European Trade Union Committee for Education
Switzerland N 0 X X X Dachverband Lehrerinnen und Lehrer Schweiz (LCH)
Turkey N 0 X 0 X Education and Science Workers’ Union of Turkey (EGITIM SEN)
United Kingdom
Y 0 0 0 X University and College Union (UCU)
United Kingdom
Y X X X 0 National Union of Teachers (NUT)
United Kingdom
Y X X X 0 Association of Teachers and Lecturers (ATL)
United Kingdom
Y X X X X Educational Institute of Scotland (EIS)
United Kingdom
Y 0 X 0 0 Scottish Secondary Teachers' Association (SSTA)
Ukraine N X X X X Trade Union of Education and Science Workers of Ukraine (STESU)

63European Trade Union Committee for Education
APPENDIX 3
EU MEMBER STATES WHICH EXPERIENCED A DECLINE IN GDP, DEFICIT/GROSS DEBT OUTSIDE SGP REQUIREMENTS AND CUT OVERALL PUBLIC EXPENDITURE BETWEEN 2008 AND 2015
Real GDP volume decline on previous financial year
Deficit above -3.0% of GDP
Gross debt above 60% of GDP
Decrease in overall public expenditure in million euro
2008 Denmark, Estonia, Ireland, Greece, Italy, Latvia, Luxembourg, Sweden, United Kingdom
France, Greece, Hungary, Ireland, Latvia, Lithuania, Malta, Poland, Portugal, Romania, Spain, United Kingdom
Austria, Belgium, France, Germany, Greece, Hungary, Italy, Malta, Portugal
United Kingdom
2009 Austria, Belgium, Bulgaria, Croatia, Cyprus, Czech Republic, Denmark, Estonia, Finland, France, Germany, Greece, Hungary, Ireland, Italy, Latvia, Lithuania, Luxembourg, Malta, Netherlands, Portugal, Romania, Slovakia, Slovenia, Spain, Sweden, United Kingdom
Austria, Belgium, Bulgaria, Croatia, Cyprus, Czech Republic, France, Germany, Greece, Hungary, Ireland, Italy, Latvia, Lithuania, Malta Netherlands, Poland, Portugal, Romania, Slovakia, Slovenia, Spain, United Kingdom
Austria, Belgium, France, Germany, Greece, Hungary, Ireland, Italy, Malta, Portugal, United Kingdom
Croatia (p), Estonia, Hungary, Latvia, Lithuania, Malta, Poland, Romania, Sweden, United Kingdom
2010 Croatia, Greece, Latvia, Romania Austria, Belgium, Bulgaria, Croatia, Cyprus, Czech Republic, France, Germany, Greece, Hungary, Ireland, Italy, Latvia, Lithuania, Malta Netherlands, Poland, Portugal, Romania, Slovakia, Slovenia, Spain, United Kingdom
Austria, Belgium, France, Germany, Greece, Hungary, Ireland, Italy, Malta, Portugal, Spain, United Kingdom
Bulgaria, Croatia (p), Estonia, Greece, Italy, Latvia, Lithuania, Spain
2011 Croatia, Greece (p), Spain, Portugal
Belgium, Croatia, Cyprus, France, Greece, Hungary, Ireland, Italy, Latvia, Lithuania, Netherlands, Poland, Portugal, Romania, Slovakia, Slovenia, Spain, United Kingdom
Austria, Belgium, Croatia, Cyprus, France, Germany, Greece, Hungary, Ireland, Italy, Malta, Netherlands, Portugal, Spain, United Kingdom
Germany, Greece, Ireland, Latvia, Netherlands, Portugal, Spain, United Kingdom

64European Trade Union Committee for Education
2012 Croatia, Cyprus, Czech Republic, Finland, Greece (p), Hungary, Ireland, Italy, Netherlands, Portugal, Slovenia, Spain, Sweden
Belgium, Croatia, Cyprus, Czech Republic, Denmark, France, Greece, Ireland, Lithuania, Malta, Netherlands, Poland, Portugal, Romania, Slovakia, Slovenia, Spain, United Kingdom
Austria, Belgium, Croatia, Cyprus, France, Germany, Greece, Hungary, Ireland, Italy, Malta, Netherlands, Portugal, Spain, United Kingdom
Croatia (p), Cyprus, Greece, Hungary, Ireland, Lithuania, Poland, Portugal, Romania, Slovenia
2013 Belgium, Croatia, Cyprus, Czech Republic, Finland, Greece (p), Italy, Netherlands, Portugal, Slovenia, Spain
Croatia, Cyprus, France, Greece, Ireland, Poland, Portugal, Slovenia, Spain, United Kingdom
Austria, Belgium, Croatia, Cyprus, France, Germany, Greece, Hungary, Ireland, Italy, Malta, Netherlands, Portugal, Slovenia, Spain, United Kingdom
Cyprus, Czech Republic, Denmark, Ireland, Italy, Netherlands, Spain, United Kingdom
2014 Croatia, Cyprus, Finland Belgium, Bulgaria, Croatia, Cyprus, Finland, France, Greece, Ireland, Poland, Portugal, Slovakia, Slovenia, Spain, United Kingdom
Austria, Belgium, Croatia, Cyprus, Finland, France, Germany, Greece, Hungary, Ireland, Italy, Malta, Netherlands, Portugal, Slovenia, Spain, United Kingdom
Croatia (p), Czech Republic, Greece, Slovenia, Spain, Sweden
2015 Greece (p) Croatia, France, Greece, Portugal, Spain, United Kingdom
Austria, Belgium, Croatia, Cyprus, Finland, France, Germany, Greece, Hungary, Ireland, Italy, Malta, Netherlands, Portugal, Slovenia, Spain, United Kingdom
Croatia (p), Cyprus, Netherlands (p), Portugal, Slovenia
Source of data: EurostatLast update: 15.03.2017Date of data extraction: 24 March 2017Hyperlinks to the tables: http://ec.europa.eu/eurostat/tgm/web/_download/Eurostat_Table_tec00115PDFDesc_44d526ae-366a-4c6c-af16-ac9f86969c24.pdfhttp://ec.europa.eu/eurostat/tgm/table.do?tab=table&init=1&language=en&pcode=tec00127&plugin=1 http://ec.europa.eu/eurostat/tgm/table.do?tab=table&init=1&language=en&pcode=teina225&plugin=1http://appsso.eurostat.ec.europa.eu/nui/submitViewTableAction.do

65European Trade Union Committee for Education
APPENDIX 4
EU MEMBER STATES SUBJECT TO MACROECONOMIC IMBALANCE PROCEDURE AND EXCESSIVE DEFICIT PROCEDURE (by year)

66
APPENDIX 5
EU MEMBER STATES WHICH CUT OVERALL PUBLIC EXPENDITURE AND EDUCATIONAL EXPENDITURE (as a % of total expenditure and in million euros)
Cuts in overall public expenditure on previous year in million euros
Cuts to educational expenditure on previous year as a % of total expenditure
Cuts to educational expenditure on previous year in million euros
2008 United Kingdom Belgium16 , Estonia, Finland, Germany, Greece, Hungary Ireland, Italy, Malta, Poland, Slovakia, Slovenia, Spain, United Kingdom
Italy, United Kingdom
2009 Croatia (p), Estonia, Hungary, Latvia, Lithuania, Malta, Poland, Romania, Sweden, United Kingdom
Austria, Belgium, Bulgaria, Croatia, Cyprus, Czech Republic, Estonia, Finland, France, Hungary, Ireland, Italy, Latvia, Netherlands, Poland, Portugal, Romania, Slovenia, Spain
Croatia (p), Czech Republic, Estonia, Hungary, Ireland, Latvia, Lithuania17, Poland, Romania, Sweden, United Kingdom
2010 Bulgaria, Croatia (p), Estonia, Greece, Italy, Latvia, Lithuania, Spain
Bulgaria, Ireland, Italy, Latvia, Lithuania, Romania, Slovenia, Spain, Sweden
Bulgaria, Estonia, Greece, Ireland, Italy, Latvia, Lithuania, Romania, Slovenia, Spain
2011 Germany, Greece, Ireland, Latvia, Netherlands, Portugal, Spain, United Kingdom
Croatia, Cyprus, Denmark, Finland, France, Hungary, Italy, Lithuania, Portugal, Slovenia, Spain, United Kingdom
Croatia (p), Cyprus, Denmark, Greece, Hungary, Italy, Netherlands, Portugal, Spain, United Kingdom
2012 Croatia (p), Cyprus, Greece, Hungary, Ireland, Lithuania, Poland, Portugal, Romania, Slovenia
Belgium, Bulgaria, Cyprus, Czech Republic, Denmark, Estonia, Finland, France, Germany, Hungary, Italy, Malta, Netherlands, Portugal, Romania, Slovakia, Spain, Sweden, United Kingdom
Croatia (p), Cyprus, Czech Republic, Greece, Hungary, Ireland, Italy, Portugal, Romania, Slovenia, Spain
2013 Cyprus, Czech Republic, Denmark, Ireland, Italy, Netherlands, Spain, United Kingdom
Estonia, Finland, France, Greece, Hungary, Ireland, Lithuania, Luxembourg, Poland, Portugal, Romania, Slovakia, Slovenia, Sweden, United Kingdom
Cyprus, Czech Republic, Greece, Ireland, Luxembourg, Netherlands, Poland, Spain, United Kingdom
2014 Croatia (p), Czech Republic, Greece, Slovenia, Spain, Sweden
Austria, Bulgaria, Croatia, Cyprus, Estonia, Finland, Germany, Italy, Lithuania, Malta, Portugal
Croatia (p), Cyprus, Czech Republic, Estonia, Greece, Italy, Lithuania, Portugal, Slovenia, Sweden
16 Member States highlighted in red in this column are nations which have reduced expenditure on education as a % of total public expendituredespiterealtermsincreasesinoverallpublicexpenditureinthesamefinancialyear.17 Member States highlighted in red in this column are nations which made real terms cuts to education expenditure despite no reductions to expenditure on education as a % of total public expenditure.

67
Education and Training Policy in the European Semester
2015 Croatia (p), Cyprus, Netherlands (p), Portugal, Slovenia
Czech Republic, Denmark, Greece, Hungary, Ireland, Lithuania, Luxembourg, Malta, Romania, Slovenia, Slovakia, United Kingdom
Finland, Greece, Italy, Slovenia
Source of data: EurostatLast update: 15.03.2017Date of data extraction: 24 March 2017Hyperlinks to tables:http://appsso.eurostat.ec.europa.eu/nui/submitViewTableAction.dohttp://appsso.eurostat.ec.europa.eu/nui/submitViewTableAction.dohttp://appsso.eurostat.ec.europa.eu/nui/submitViewTableAction.do

68
APPENDIX 6
SURVEY RESPONSES (raw data)
Early Childhood Education (ECE)
Below is the raw data for ECE. There are insufficient items to scale significantly, but it was possible to discern three statistical patterns (see main report). The raw data is set out below, as per these three ‘clusters’:
ECE ‘Cluster 1’ (Responses as %)
Item Not at all
Rare Fairly Common
Very Common
Employment conditions not related to pay are determined at the centre level (for example, working hours, holidays etc)
15.6 26.7 28.9 28.9
There are established collective bargaining arrangements for negotiating pay in the early childhood education and care sector
6.7 20.0 20.0 53.3
There are established collective bargaining arrangements for negotiating non-pay employment conditions in the early childhood education and care sector
8.9 20.0 20.0 51.1
Unions are involved in a social partnership to determine overall policy in the early childhood education and care sector
0 20.0 24.4 55.6
Significant changes in the early childhood education and care sector are only introduced with the involvement of relevant unions
6.7 20.0 44.4 28.9

69
Education and Training Policy in the European Semester
ECE ‘Cluster 2’
Item Not at all
Rare Fairly Common
Very Common
Early childhood centres exist which are publicly funded, but privately managed
35.6 22.2 22.2 20.0
Early childhood provision is offered by for-profit organisa-tions
11.1 31.1 35.6 22.2
Private fee-charging centres provide early childhood care in this country
8.9 26.7 42.2 22.2
The government provides funding direct to private fee-charging early childhood centres (for example, subsidies, tax breaks etc.)
28.9 20.0 17.8 33.3
The government provides financial incentives for parents to send their children to private fee-charging early childhood centres
55.6 20.0 13.3 11.1
ECE ‘Cluster 3’
Item Not at all
Rare Fairly Common
Very Common
Early childhood funding is based on a voucher system 75.6 13.3 4.4 6.7
Early childhood teachers’/carers' salaries are negotiated individually
44.4 35.6 13.3 6.7
Early childhood teachers’/carers' salaries are linked to their individual performance
33.3 48.9 11.1 6.7
Early childhood centres employ people in child care roles without professional early childhood education qualifica-tions
26.7 46.7 17.8 8.9
The government provides financial incentives for parents to send their children to private fee-charging early childhood centres
55.6 20.0 13.3 11.1
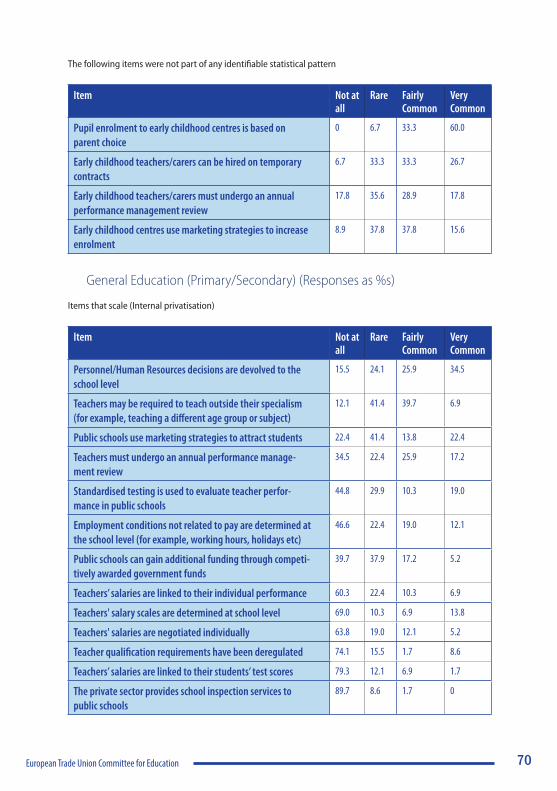
70European Trade Union Committee for Education
The following items were not part of any identifiable statistical pattern
Item Not at all
Rare Fairly Common
Very Common
Pupil enrolment to early childhood centres is based on parent choice
0 6.7 33.3 60.0
Early childhood teachers/carers can be hired on temporary contracts
6.7 33.3 33.3 26.7
Early childhood teachers/carers must undergo an annual performance management review
17.8 35.6 28.9 17.8
Early childhood centres use marketing strategies to increase enrolment
8.9 37.8 37.8 15.6
General Education (Primary/Secondary) (Responses as %s)
Items that scale (Internal privatisation)
Item Not at all
Rare Fairly Common
Very Common
Personnel/Human Resources decisions are devolved to the school level
15.5 24.1 25.9 34.5
Teachers may be required to teach outside their specialism (for example, teaching a different age group or subject)
12.1 41.4 39.7 6.9
Public schools use marketing strategies to attract students 22.4 41.4 13.8 22.4
Teachers must undergo an annual performance manage-ment review
34.5 22.4 25.9 17.2
Standardised testing is used to evaluate teacher perfor-mance in public schools
44.8 29.9 10.3 19.0
Employment conditions not related to pay are determined at the school level (for example, working hours, holidays etc)
46.6 22.4 19.0 12.1
Public schools can gain additional funding through competi-tively awarded government funds
39.7 37.9 17.2 5.2
Teachers’ salaries are linked to their individual performance 60.3 22.4 10.3 6.9
Teachers' salary scales are determined at school level 69.0 10.3 6.9 13.8
Teachers' salaries are negotiated individually 63.8 19.0 12.1 5.2
Teacher qualification requirements have been deregulated 74.1 15.5 1.7 8.6
Teachers’ salaries are linked to their students’ test scores 79.3 12.1 6.9 1.7
The private sector provides school inspection services to public schools
89.7 8.6 1.7 0

71
Education and Training Policy in the European Semester
The non-scale items
Item Not at all
Rare Fairly Common
Very Common
The financial management of school budgets is decen-tralised
27.6 22.4 15.5 34.5
School funding is based on a voucher system 84.5 8.6 3.4 3.4
Pupil enrolment to schools is based on parent choice 6.9 15.5 27.6 50.0
The government has established quasi-independent schools which are publicly funded, but privately managed (like US Charter Schools)
48.3 27.6 12.1 12.1
Parents pay additional fees for essential items in public schools (for example, textbooks, paper, pencils)
44.8 29.9 10.3 19.0
Parents pay additional fees for essential items in public schools (for example textbooks, paper, pencils)
12.1 27.6 17.2 43.1
Parents pay additional fees for extra-curricular activities in public schools
10.4 14.9 32.8 28.4
Private fee-charging schools provide primary and/or second-ary education in this country
5.2 32.8 37.9 24.1
The government provides funding direct to private fee-charging schools (for example, subsidies, tax breaks etc.)
19.0 20.7 34.5 25.9
The government provides financial incentives for parents to send their children to private fee-charging schools
77.6 15.5 3.4 3.4
Public schools are ranked nationally in league tables of student performance
34.5 22.4 19.0 24.1
Teachers can be hired on temporary contracts 1.7 32.8 34.5 31.0
Public schools lead initial teacher training programmes 41.4 25.9 25.9 6.9
Non-teaching services in public schools are contracted out to private providers (for example, estates management, payroll etc.)
27.6 39.7 24.1 8.6
The private sector funds capital projects in public schools (for example new buildings)
51.7 34.5 12.1 1.7
The private sector provides continuing training/professional development to public school teachers
34.5 36.2 22.4 6.9
The private sector provides consultancy services to public school
48.3 34.5 10.3 6.9

72European Trade Union Committee for Education
Technical and Vocational Education and Training (VET) (Responses as %’s)
Items that scale (Internal and external privatisation of TVET)
Item Not at all
Rare Fairly Common
Very Common
TVET institutions use marketing strategies to attract students
4.2 18.8 37.5 39.6
Personnel/human resources decisions are devolved to the institution level
8.3 20.8 22.9 47.9
The financial management of TVET institution budgets is decentralised
25.0 14.6 29.2 31.3
TVET programmes are offered by private institutions 14.6 43.8 25.0 16.7
Employment conditions not related to pay are determined at the institution level (for example, working hours, holidays etc)
31.3 25.0 27.1 16.7
TVET teachers’ salary scales are determined at institution level
41.7 18.8 14.6 25.0
Students pay fees for TVET programmes 31.3 37.5 16.7 14.6
The private sector funds capital projects in public TVET institutions (for example, new buildings)
31.3 50.0 14.6 4.2
The private sector provides consultancy services to public TVET institutions
41.7 35.4 16.7 6.3
TVET teachers’ salaries are linked to their individual perfor-mance
50.0 33.3 10.4 6.3
Teachers at TVET institutions do not require a professional teaching qualification
47.9 35.4 12.5 4.2
TVET teachers’ salaries are negotiated individually 54.2 31.3 10.4 4.2
TVET teachers’ salaries are linked to their students' outcomes (for example, students' examination results)
60.4 31.3 4.2 4.2
The private sector provides inspection services to public TVET institutions
70.8 20.8 8.3 0

73
Education and Training Policy in the European Semester
TVET Non-Scale Items
Item Not at all
Rare Fairly Common
Very Common
TVET institution budgets are based directly on student numbers
8.3 10.4 35.4 45.8
The funding of TVET institutions is based on institutional performance (for example, student completion rates)
41.8 43.8 10.4 4.2
TVET institutions are ranked nationally in league tables of performance
45.8 33.3 8.3 12.5
TVET teachers can be hired on temporary contracts 0 25.0 39.6 35.4
Non-teaching services are contracted out to private providers (for example, estates management, payroll etc.)
14.6 43.8 29.2 12.5
There is regular external evaluation of TVET institutions 22.9 33.3 20.8 22.9
Higher education and Research (HER) (responses as %’s)
Items that scale (Commercialisation of HER)
Item Not at all
Rare Fairly Common
Very Common
Academic staff can be hired on temporary contracts 0.0 0.0 34.1 65.9
Universities use flexible employment practices (for example, short-term contracts)
0.0 7.3 34.1 58.5
Public universities use marketing strategies to attract students
4.9 12.2 34.1 48.8
Public universities engage in private sector funded research 2.4 22.0 34.1 41.5
Public universities gain additional funding through partner-ships with businesses
4.9 14.6 48.8 31.7
Private businesses co-fund public university activities (for example, awards, research etc.)
4.9 34.1 36.6 24.4
The private sector funds capital projects in public universities (for example, new buildings)
22.0 48.8 14.6 14.6
Public universities operate international for-profit campuses overseas
24.4 53.7 14.6 7.3
The private sector provides continuing professional develop-ment and training to public university academic staff
29.3 41.5 24.4 4.9
The private sector provides consultancy services to public universities
14.6 51.2 31.7 2.4

74European Trade Union Committee for Education
HER Non-Scale Items
Item Not at all
Rare Fairly Common
Very Common
Students fund their own study and living expenses at public universities (e.g. accommodation, IT and study, materials, food, leisure etc.)
2.4 9.8 17.1 70.7
Personnel management in public universities is decen-tralised (for example, recruiting, contracts, etc.)
4.9 2.4 26.8 65.9
Students pay tuition fees at public universities 17.1 17.1 9.8 56.1
The financial management of public university budgets is decentralised
14.6 7.3 24.4 53.7
Private universities provide higher education programmes. 4.9 19.5 22.0 53.7
Public universities are ranked nationally in league tables of performance
24.4 14.6 19.5 41.5
Government assessments rank public universities according to their research activities
17.1 26.8 19.5 36.6
Salary scales are determined at university level 22.0 29.3 24.4 24.4
The government provides funding direct to private universi-ties (for example, subsidies, tax breaks etc.)
22.0 39.0 14.6 24.4
Students use private sector loans to finance their tuition fees and/or living expenses (e.g. accommodation, IT and study materials, food, leisure etc.)
0.0 48.8 29.3 22.0
Students can use government subsidised loans to finance their studies in private institutions
22.0 26.8 29.3 22.0
Academic staff salaries are linked to their individual perfor-mance (for example, publications, research grant income etc.)
24.4 31.7 26.8 17.1
Academic staff teacher qualifications have been de-regu-lated
39.0 29.3 19.5 12.2
‘Non-teaching’ services in public universities are contracted out to private providers (for example, IT, estates manage-ment, payroll, etc.)
9.8 34.1 46.3 9.8
Academic staff must undergo an annual performance management review
14.6 41.5 36.6 7.3
Private sector companies provide courses within public universities (for example, university preparation courses, language training, academic skills, etc.)
22.0 46.3 24.4 7.3
75
Education and Training Policy in the European Semester
ACRONYMS
AGS Annual Growth Survey
ALMP Active Labour Market Policies
CGIL Confederazione Generale Italiana del Lavoro (Italian General Confederation of Labour)
CSRs Country Specific Recommendations
DGEAC European Commission Directorate-General for Education and Culture
EACEA Education, Audiovisual and Culture Executive Agency
ECE Early Childhood Education
ERM II Exchange Rate Mechanism (successor to ERM)
ES European Semester
ESIF European Structural and Investment Funds
ESTUS Education, Science and Culture Trade Union of Slovenia
ETUCE European Trade Union Committee for Education
EU European Union
EU-28 European Union 28 Member States
GDP Gross Domestic Product
HER Higher Education and Research
IEG Indicator Expert Group on Education Expenditure
IT Information Technology
MIP Macroeconomic Imbalances Procedure
MUT Malta Union of Teachers
NEET Not in Employment, Education or Training
NRP National Reform Programme
OECD Organisation for Economic Co-operation and Development
PISA Programme for International Student Assessment
PPP Purchasing Power Parities
PPS Per pupil spending
SGP Stability and Growth Pact
TVET Technical and Vocational Education and Training
UK United Kingdom
UOE United National Educational, Scientific and Cultural Organisation (UNESCO) Institute for Statistics, Organisation for Economic Cooperation and Development (OECD) and Eurostat joint data collection

EDUCATION INTERNATIONALINTERNATIONALE DE L’EDUCATIONINTERNACIONAL DE LA EDUCACIÓN
5, bd du Roi Albert II - 9ème
B-1210 Brussels, BelgiumTel. +32-(0)2 224 06 91 / [email protected]
5, bd du Roi Albert II1210 Brussels, BelgiumTel. +32-(0)2 224 06 11Fax +32-(0)2 224 06 [email protected]
EUROPEAN TRADE UNION COMMITTEE FOR EDUCATIONCOMITE SYNDICAL EUROPEEN DE L’EDUCATION