education: back to basics - codexeducation: back to basics is education fit for the future ‘in...
TRANSCRIPT

Citi GPS: Global Perspectives & Solutions
July 2017
EDUCATION: BACK TO BASICSIs Education Fit For The Future?
Citi is one of the world’s largest fi nancial institutions, operating in all major established and emerging markets. Across these world markets, our employees conduct an ongoing multi-disciplinary global conversation – accessing information, analyzing data, developing insights, and formulating advice for our clients. As our premier thought-leadership product, Citi GPS is designed to help our clients navigate the global economy’s most demanding challenges, identify future themes and trends, and help our clients profi t in a fast-changing and interconnected world. Citi GPS accesses the best elements of our global conversation and harvests the thought leadership of a wide range of senior professionals across our fi rm. This is not a research report and does not constitute advice on investments or a solicitation to buy or sell any fi nancial instrument. For more information on Citi GPS, please visit our website at www.citi.com/citigps.

Citi GPS: Global Perspectives & Solutions July 2017
Authors
Thomas A Singlehurst, CFA Head of European Media Team
+44-20-7986-4051 | [email protected]
Nithin Pejaver, CFA Global Education Research Coordinator
+44-20-7986-2812 | [email protected]
Elizabeth Curmi, Ph.D. Global Thematic Research Analyst
+44-20-7986-6818 | [email protected]
Benjamin Nabarro Global Thematic Research Associate
+44-20-7986-2056 | [email protected]
Robert Garlick Head of Research, EMEA
+44-20-7986-3547 | [email protected]
Citi Global Education Research Team
Lucio Aldworth Latin America
+55-11-4009-2058 | [email protected]
Jason B Bazinet North America
+1-212-816-6395 | [email protected]
Mark Li, CFA China
+852-2501-2783 | [email protected]
Nithin Pejaver, CFA Global
+44-20-7986-2812 | [email protected]
Taher Safieddine, CFA Middle East
+971-4-509-9668 | [email protected]
Thomas A Singlehurst, CFA Europe
+44-20-7986-4051 | [email protected]

July 2017 Citi GPS: Global Perspectives & Solutions
© 2017 Citigroup
3
EDUCATION: BACK TO BASICS Is Education Fit For The Future
‘In some parts of the world, students are going to school every day. It’s their normal life. But in other parts of the world, we are starving for education… it’s like a precious gift. It’s like a diamond’
Malala Yousafzai, Education Activist and Nobel Laureate1
There is no shortage of inspiring quotations about the impact education can have on an individual but Malala Yousafzai’s comment from 2013 has a special resonance in our view. This is because it not only highlights the importance of education but also the profound asymmetry of access worldwide. If education truly is the ‘oxygen of opportunity’, we have to acknowledge that not everyone enjoys this privilege and even those that do may still face challenges as the tectonic plates of demography and automation shift beneath them.
In this report we look more carefully at the role education plays both for individuals and society. We also consider the asymmetries of access that exist both across and within markets.
We look at the value of education but also the challenges faced in continuing to provide access as governments grapple with the headwinds posed by changing demographics and disruption in the workplace, in particular from automation.
Finally we consider potential solutions to these challenges both in terms of securing access for more people worldwide but also improving productivity and driving better outcomes.
The thread running through all of this is a fundamental question – are the benefits from education diminishing and what role will governments, corporates, investors, and individuals play in making sure that how education is provided is fit for the future?
The conclusions are at once encouraging but sobering. On the positive side, it is clear that education has had and is still having a very positive impact on society both economically and in terms of social well-being. This said, supply and demand imbalances as well as disruption from automation represent a significant challenge for governments and society more broadly. It is also hard to avoid the conclusion that the benefits of education are unevenly distributed both across and within markets and even between people of different social backgrounds, ethnicities, and genders. This needs urgent attention.
Although the precise prescriptions differ between developed and developing markets and from primary to secondary to tertiary education, we think the answer to these challenges lies in broadening the sources of financing for education, in embracing the role of technology and the impact it can have on increasing productivity, and in trying to change attitudes to learning and education, encouraging individuals to think about it as a lifelong process.
The especially encouraging thing is that if this works, there is not only a better chance that more people can get more access to education driving benefits for society and individuals alike, but there is an active role to be played by – and opportunity to be exploited by – governments, corporates and investors along the way.
1 Yousafzai, Malala. ‘Death Did Not Want to Kill Me’. Interview with Diane Sawyer. ABC News. 7 October 2013. http://abcnews.go.com/WNT/video/diane-sawyer-sits-inspirational-malala-yousafzai-20499735

© 2017 Citigroup
Making Education Fit For the FutureEDUCATION IS COSTLY BUT WORKS FOR INDIVIDUALS, GOVERNMENT, AND SOCIETYSource: Global Silicon Valley, Citi Research
Global Education Market
$2,800bn
K-12 Post-Secondary Corporate Childcare and Pre-Primary School
$1,500bn
$340bn $200bn $50bn $50bnABC
Language Learning
Lifelong Learning (Non-Degree)
BENEFITS
COSTS
Total Global Education
$4,906 billion
In the OECD, people who have a tertiary education earn 55% more vs. those with upper secondary education.
In the OECD, the net public return for tertiary education is roughly $96,000 on a purchase price parity-adjusted basis.
In the OECD, a 30-year old man with a tertiary education is expected to live 8 years longer than a man with upper secondary education.
Individual Government Social

CHALLENGES FOR THE EDUCATION MARKET COME FROM DEMAND AND DISRUPTION
THREE SOLUTIONS TO ADDRESS THE CHALLENGES IN EDUCATION
Broadening sources of financing
Despite historical heavy reliance on government financing, international finance’s contribution to education spend is expected to rise. Source: The Education Commission
Today just 2% of the $4.9trn global education market is digital but digitization will play a key role in increasing productivity in the future.
Source: McKinsey & CoSource: Citi
Embracing the role of technology
Uzb
ekis
tan
Lith
uani
a
Mal
ta
Latv
ia
Kyr
gyz
Rep
ublic
Mon
golia
Cyp
rus
Sey
chel
les
Tajik
stan
Bul
gari
aD
omin
ican
Rep
ublic
Geo
rgia
Uru
guay
Cro
atia
Par
agua
y
Wes
t Ban
k an
d G
aza
Ukr
aine
Arg
enti
na
Nig
eria
Pan
ama
Nic
arag
uaS
erbi
a
Sou
th A
fric
a
Bol
ivia
Mau
riti
us
Mal
aysi
a
Mac
edon
ia
Cos
ta R
ica
Ecua
dor
Rom
ania
Indi
a
Tha
iland
Alb
ania
Ang
ola
El S
alva
dor
Gua
tem
ala
Ban
glad
esh
Chi
na
Cam
bodi
a
Nep
al
Ethi
opia
Sha
re o
f E
mpl
oym
ent
at
‘Hig
h-R
isk’
of
com
pute
riza
tion
0
10
20
30
40
50
60
70
80
90
69% of youth surveyed felt Vocational Education Training was most helpful for getting a job.
1 2 32% 69%
1970 20502010
10,000,000,000
1,000,000,000
Post Secondary
Upper Secondary
Lower Secondary
PrimaryIncomplete PrimaryNo Education
Under 15
Source: Rose and Nagdy, Citi Research
Currently 11% of the global population has no education at all. This is expected to fall to just 5% by 2050.
11%
$1,060bn$2,690bn
$197bn$198bn
$89bn$16bn
Government
Household
International Finance
Source: World Bank Development Report based on Frey & Osbourne (2013) methodology
2015 (Current Spend) 2030 (Financing Plan)
Changing attitudes to education - from stage of life to lifelong learning

Citi GPS: Global Perspectives & Solutions July 2017
© 2017 Citigroup
6
Contents Is Education Fit For the Future? 7 What We Think 7 Roadmap to the Report 9 Introduction 10
Education, Education, Education – The Basics 10 1. What is Education Worth? 15
An Individual’s Net Financial Gains of Investing in Education 15 Public Expenditure on Education and Public Net Financial Gains 28 Other Social Benefits 32 Implications: Education Works 33
2. How Will Demand for Education Evolve? 34 Demand for Education in Different Countries 34 Education as a Global Commodity 37 Implications: Supply/Demand Imbalance Creates Pressure Points that Vary by Market 38
3. What Are the Future Challenges for Education? 40 1. Organic Challenges 40
A. The Productivity Challenge: Primary and Secondary Schooling 41 B. The Productivity Challenge: Tertiary Education 44 C. Access to Education: A Growing Challenge 47 D. Finance and Education 52
2. Disruptive Challenges 55 Implications: Obvious Challenges, Not So Simple Solutions 61 4. Making Education Fit for Purpose: Potential Solutions to Future Challenges 62 Demand and Supply Side Interventions 63
Demand Side Interventions 64 Supply Side Interventions 68 Financing of Education Improvement 74
Is There A Student Debt Problem? How Do We Solve It? 81 Education Technology 83 Bespoke Learning 99 Education to Employment 103 Lifelong Learning 105
Competency-Based Education 110 MOOCs 113 Implications: Distinguishing Between First- and Second-Order Solutions 117
5. Conclusions & Implications for Stakeholders 118 For Policy Makers 118 For Investors 119 For Corporates 119 For Us as Individuals 119
Education System in the United States 122 Education System in the United Kingdom 128 Education System in China 133 Education System in India 139 Education System in Brazil 143 References 148
July 2017 Citi GPS: Global Perspectives & Solutions
© 2017 Citigroup
7
Is Education Fit For the Future? What We Think How much is education worth? How will this change over time? And if education is truly about the ‘advancement of knowledge and the dissemination of truth’, how can we make sure education systems around the world are ‘fit for purpose’?
Starting with the general conclusions, we make four points:
First, it is important to reiterate that education has had — and continues to have — a very positive impact on society both economically and in terms of social well-being. This point cannot be understated.
Second, while educational progress has been immense over the last few decades, it is evident that the current system — or rather systems — face a number of challenges. The largest is that with the benefits still greater than costs, demand will almost certainly exceed supply and meeting this demand will require more funding and improved efficiency.
Third, disruption of workforces in particular at the hands of automation, will not only potentially create even more demand, in particular for adult retraining, but have an impact on what skills will need to be learned in the first place.
Fourth, the answer to these problems lies in: (1) broadening the sources of financing for education, in particular encouraging private expenditure on education as well as encouraging new modes of financing via financial markets; (2) embracing the role of technology and the impact it can have on increasing productivity in an educational environment; and (3) trying to change attitudes to learning and education, by encouraging individuals to think about it as a lifelong process.
And what does this mean for the various stakeholders? Going through them in turn:
For policy makers: Governments still get a good deal from education — typically getting more back from funding education than they pay in the first place — but pressures are building. Not only are financial resources increasingly tight, but there is growing Vox Populi risk associated with segments of the population disrupted by technology but without the requisite skills to get back into the workforce. Supporting greater student numbers who need more skills but at a lower cost per outcome is a big challenge but the answer lies in encouraging new sources of capital both in the form of private spend and more innovative modes of financing/lending (e.g., educational bonds). We also think governments will need to play an active role in encouraging vocational training and lifelong learning.
Four main conclusions: 1. Education has a positive impact on society 2. With benefits greater than costs, demand outstrips supply. Education will require more funding and needs to become more efficient
3. Disruption at the hands of automation will create even more demand in particular for adult retraining and vocational education 4. The answer to these problems lies in broadening sources of financing, embracing the role of technology, and changing attitudes to lifelong learning

Citi GPS: Global Perspectives & Solutions July 2017
© 2017 Citigroup
8
For investors: What is striking is that education provides a range of potential investment opportunities across the spectrum of different risk/reward profiles. For investors with lower risk tolerances, some of the new financial instruments picking up the mantle of educational investment from government (again e.g., education bonds) potentially provide compelling opportunities to generate income with comparatively low capital risk. On the equity side, too, there are segments of the traditional education space that show relatively low volatility, e.g., private schools. Meanwhile, at the riskier end of the spectrum the emerging educational technology (EdTech) space is a volatile but yet significant potential opportunity. We argue that in EdTech lies the potential answer to the challenge of increasing productivity, but at present just 2% of the almost $5 trillion education market is digitized. EdTechXGlobal estimates that the global EdTech market will grow at a 17% compound annual growth rate (CAGR) to $252 billion by 2020 and this could/should be a significant opportunity for investors with a greater risk appetite.
For corporates: We think corporates have a significant role to play in terms of encouraging learning and development as a lifelong process. As what is required of employees evolves, the best employers will make sure employees gain the requisite skills on the job with appropriate professional certification. This will not only drive better business outcomes but also a halo effect in terms of the ability to attract and retain the very best talent.
And, finally, for us as individuals: Obviously governments and corporates have a role to play in encouraging us to get the right skills, but we argue that we, as individuals, also have to change our attitude to education – to think of it less as a stage or a destination and more as a process or journey. By doing this, we will make sure not only that we have the appropriate skills to face the challenges of the modern world but the ability to adapt when disruption inevitably occurs.
Implications for stakeholders: Policy makers: must encourage new sources of financing, in particular private spend and new financial instruments as well as play an active role in encouraging vocational training and lifelong learning Investors: should exploit the opportunity to invest in education across a range of new financial instruments from those with a low risk profile (education bonds/school infrastructure) to those with high risk but high reward (EdTech) Corporates: have a significant role to play in terms of encouraging learnings and development in the workplace. The best/most proactive will not only see better business outcomes but attract/retain the best talent Individuals: should change the way they think about education from a stage/destination to a process/journey

July 2017 Citi GPS: Global Perspectives & Solutions
© 2017 Citigroup
9
Roadmap to the Report We divide this report into 5 main sections:
In the first section we consider in detail how much an education is worth looking at the costs and benefits for individuals, governments, and society at large. The findings are encouraging: it is clear that education, in particular at the tertiary level, leads to more income for graduates, more tax for governments, and benefits for society in the form of increased social mobility, longer life expectancy, and higher levels of wellbeing. Quite simply, more education has historically meant more growth and better outcomes. But we cannot be complacent. There are signs the algorithm is under stress given constraints on the amount of government support/spending on education and there are also early signs of diminishing returns.
If the first section is a retrospective on the returns from education, section two looks at the changing patterns of demand for education we can expect in the future. With the benefits of education still exceeding their costs, it is no surprise that we expect demand for education to continue to grow, but simple demographics play a very significant role in where we anticipate potential imbalances between supply and demand with some surprising effects. Population trends within developed markets suggest that there will be significant pressure in the coming years at the primary/secondary level while the supply/demand imbalance in developing markets will be more pronounced at the tertiary level.
In section three we dig into the challenges driving supply/demand imbalances in more depth identifying two main factors: organic challenges posed by changing demographics and disruptive challenges arising from changes in the workplace, in particular from automation. The headline solutions to these are at once straightforward and extremely complex. For the former, the solution is clearly to be found in greater access to education but also increased productivity; for the latter, it is more about changing attitudes to learnings – making sure that, as much as possible, students are getting the right skills in the first place, but also making sure that there is infrastructure in place to help people re-skill when disruption occurs.
In section four we look in a lot more depth at what needs to be done in order to make education ‘fit for purpose’ from a bottom-up perspective. We consider first-order solutions to the problems of access both in terms of supply (how to get access to new schools/better materials, etc.) and demand (increasing demand for/reducing opportunity cost of getting an education for under-penetrated parts of society). We also consider potential second-order solutions relating to the problem of productivity and skills. Finally we look at the importance of vocational education and training (VET) and lifelong learning.
In the Appendix we include detailed introductions to the education systems in the U.K., U.S., India, China, and Brazil. In each section we look at the structure of the market and consider the specific challenges facing both policy makers and individuals. The purpose of this, though, is to highlight that there is no one standard approach. Each market has its own idiosyncrasies based on history and culture and, as such, its own particular challenges which in turn may require their own specific tailored solutions.
Four big questions: 1. What is education worth? 2. How will demand for education develop? 3. What challenges lie ahead for education? 4. What are the potential solutions to these challenges?

Citi GPS: Global Perspectives & Solutions July 2017
© 2017 Citigroup
10
Introduction We start this report by trying to answer some of these questions and while some of the headline conclusions are encouraging – that education demonstrably drives better outcomes for individuals, society and even taxpayers – it is important to note that there are also clearly challenges: the skills needed are changing, marginal returns appear to be diminishing, and increasingly it is clear that individuals can no longer depend on the state for untrammelled access to education and lifelong learning. But before getting bogged down in the detail, let’s start at the beginning.
Education, Education, Education – The Basics Education is a crucial social resource. In most countries basic education is seen as a right — governments are duty bound to provide education, while individuals are often required by law to attend education up to a certain age or level. There has been a great expansion in global education over the past two centuries. In 1800, only 12% of the global population could read and write; by 2014, this had increased to 85% (refer to Figure 1). However, despite this incredible progress, there are still many countries especially in Sub-Saharan Africa, where literacy rates among young adults are below 50%.2
Education has a key role in improving economic wellbeing. Many economic studies have indicated that there is a close correlation between education and economic growth. The Organisation for the Economic Co-operation and Development (OECD) estimate that ‘if a country is able to attain literacy scores 1% higher than the international average, it will achieve higher levels of labor productivity and gross domestic product (GDP) per capita that are 2.5 and 1.5% higher, respectively, than those of other countries’.3 Education increases the skilled human capital inherent in the workforce, improves the innovative capacity of an economy, and facilitates the diffusion of important knowledge.4
Figure 1. Literacy Levels from 1800 to 2014
Source: Citi Research; Max Roser and Esteban Ortiz-Ospina (2016 )
2 Roser, M. & Ortiz-Ospina, E. (2016). ‘Global Rise of Education’. Published online at OurWorldInData.org. Retrieved from: https://ourworldindata.org/global-rise-of-education 3 OECD (2016). Education at a Glance 2016: OECD Indicators, OECD Publishing, Paris. http://dx.doi.org/10.1787/eag-2016-en 4Hanushek, E.A & Wobmann, L (2010). Education and Economic Growth, International Encyclopedia of Education, vol.2 pp 245-252. http://dx.doi.org/10.1787/eag-2016-en
0
1
2
3
4
5
6
7
8
1800
1820
1870
1880
1890
1900
1910
1920
1930
1940
1950
1960
1970
1980
1990
1999
2004
2014
Billio
ns
Illiterate Literate
Access to education has been increasing over time… …and this has had a direct positive impact on economic wellbeing

July 2017 Citi GPS: Global Perspectives & Solutions
© 2017 Citigroup
11
Governments have become widely responsible for ensuring the adequate provision of education. On average in OECD countries, the government spend on educational institutions is equal to 4.5% of GDP. Private companies also play a small part in investing in global education, albeit at a much lower rate when compared to investment in other public sectors such as health. On a per capita basis, the U.S. spends the most money on education ($3,400 per capita), followed closely by the U.K. ($3,200 per capita). India has the lowest per capita spend of the countries shown in Figure 2, estimated at $84. However, it is important to note that capital spending for education is not the answer to everything — a country can reach the same quality of education by more efficient spending on education as discussed in a later chapter. For example China’s spend per capita on education is much lower than other countries such as the U.S. and the U.K., however their PISA score (a score that ranks scholastic performance of 15-year olds across the globe) on average (see Figure 7) in certain areas of China is higher than the U.K. or the U.S.
Figure 2. Per Capita Education Spend in Different Countries, 2013
Source: OECD, Citi Research
Governments enjoy direct financial benefits from a more educated workforce — for example in the U.S. the total public costs to government for a male to attain a tertiary education are estimated at $64,200, while the benefits to the government from increases in income earnings and social contribution for a male who attained a tertiary education are estimated at $328,000, giving a total net benefit of $264,0005. The net direct financial benefits for government for a woman attaining a tertiary education are lower, estimated at $112,000 - the result of lower rates of labour force participation later in life. There are also net benefits to individuals for attaining a higher education degree in the form of higher earnings as described further in the next chapter of this report.
Higher levels of education are also typically associated with higher levels of educational accessibility. This improves rates of social mobility, economic equality, and social cohesion. Additionally, education has a series of intrinsic individual and public benefits. Higher levels of individual and social education are strongly associated with lower levels of crime, better life satisfaction, and have been shown to result in improved health outcomes.6 All in all, education holds tremendous power as a means to generate social improvement.
5 OECD (2016). Education at a Glance 2016: OECD Indicators, OECD Publishing, Paris. http://dx.doi.org/10.1787/eag-2016-en 6OECD (2016). Education at a Glance 2016: OECD Indicators, OECD Publishing, Paris. http://dx.doi.org/10.1787/eag-2016-en
0 500 1000 1500 2000 2500 3000 3500 4000
U.S.
U.K.
France
Germany
Brazil
China
India
Per Capita Spend ($)
For the main part governments have been responsible for investment in education with the U.S. and U.K. spending the post per capita of population
The payback for government is simple: a more educated workforce earns more money and pays more tax… …while for the individual, education is not only a pathway to better economic wellbeing but also better social outcomes (better health, longer life, more social mobility, better social cohesion)

July 2017 Citi GPS: Global Perspectives & Solutions
© 2017 Citigroup
11
Governments have become widely responsible for ensuring the adequate provision of education. On average in OECD countries, the government spend on educational institutions is equal to 4.5% of GDP. Private companies also play a small part in investing in global education, albeit at a much lower rate when compared to investment in other public sectors such as health. On a per capita basis, the U.S. spends the most money on education ($3,400 per capita), followed closely by the U.K. ($3,200 per capita). India has the lowest per capita spend of the countries shown in Figure 2, estimated at $84. However, it is important to note that capital spending for education is not the answer to everything — a country can reach the same quality of education by more efficient spending on education as discussed in a later chapter. For example China’s spend per capita on education is much lower than other countries such as the U.S. and the U.K., however their PISA score (a score that ranks scholastic performance of 15-year olds across the globe) on average (see Figure 7) in certain areas of China is higher than the U.K. or the U.S.
Figure 2. Per Capita Education Spend in Different Countries, 2013
Source: OECD, Citi Research
Governments enjoy direct financial benefits from a more educated workforce — for example in the U.S. the total public costs to government for a male to attain a tertiary education are estimated at $64,200, while the benefits to the government from increases in income earnings and social contribution for a male who attained a tertiary education are estimated at $328,000, giving a total net benefit of $264,0005. The net direct financial benefits for government for a woman attaining a tertiary education are lower, estimated at $112,000 - the result of lower rates of labour force participation later in life. There are also net benefits to individuals for attaining a higher education degree in the form of higher earnings as described further in the next chapter of this report.
Higher levels of education are also typically associated with higher levels of educational accessibility. This improves rates of social mobility, economic equality, and social cohesion. Additionally, education has a series of intrinsic individual and public benefits. Higher levels of individual and social education are strongly associated with lower levels of crime, better life satisfaction, and have been shown to result in improved health outcomes.6 All in all, education holds tremendous power as a means to generate social improvement.
5 OECD (2016). Education at a Glance 2016: OECD Indicators, OECD Publishing, Paris. http://dx.doi.org/10.1787/eag-2016-en 6OECD (2016). Education at a Glance 2016: OECD Indicators, OECD Publishing, Paris. http://dx.doi.org/10.1787/eag-2016-en
0 500 1000 1500 2000 2500 3000 3500 4000
U.S.
U.K.
France
Germany
Brazil
China
India
Per Capita Spend ($)
For the main part governments have been responsible for investment in education with the U.S. and U.K. spending the post per capita of population
The payback for government is simple: a more educated workforce earns more money and pays more tax…
…while for the individual, education is notonly a pathway to better economic wellbeing but also better social outcomes (better health, longer life, more social mobility, better social cohesion)

Citi GPS: Global Perspectives & Solutions July 2017
© 2017 Citigroup
12
There are a number of different indicators that are used to assess educational attainment. These include enrollment rates, attainment rates, and number of years people attend school. Most developed countries have high primary and secondary education enrollment rates. For example, approximately 100% of children aged between 11 and16 years old in France, Germany, and the U.K. enrolled in secondary school. In the U.S. and China this is slightly lower, estimated at 87% and 83%, respectively, while in India the figure stands at 62%. Enrollment in tertiary education has also increased over the last two centuries. For example in the U.K. in 1820, less than 1% of people enrolled in tertiary education; this has increased to 61% in 2010. Enrollment rates do not necessarily reflect educational attainment in a particular country. There are a percentage of children/students who enroll in school but do not complete their course; this percentage is often used as an indicator of educational efficiency with a lower repetition rate implying greater efficiency
The highest level of education that individuals complete is another measure used to assess educational attainment in different countries. In most countries the highest level of education attained by the total population is secondary school. The exception to this is the U.S., where over 50% of the population have attained some form of tertiary education. In India in 2010, over 30% of population had no schooling; this is higher than other developing countries such as Brazil, Mexico, and South Africa (see figures below).
Figure 3. Percent of People Enrolled in Secondary Education Figure 4. Percent of People Enrolled in Tertiary Education
Source: Lee, J.W. & H. Lee, Citi Research Source: Lee, J.W. & H. Lee, Citi Research
Figure 5. Highest Level of Education Attained in Select Countries, 2010 Figure 6. Average Years of Total Schooling, 2010
Source: Lee, J.W. & H. Lee, Citi Research Source: Lee, J.W. & H. Lee, Citi Research
0
10
20
30
40
50
60
70
80
90
100
1820
1830
1840
1850
1860
1870
1880
1890
1900
1910
1920
1930
1940
1950
1960
1970
1980
1990
2000
2010
% France Germany U.S.
UK China IndiaU.K.
0
10
20
30
40
50
60
70
80
90
100
1820
1830
1840
1850
1860
1870
1880
1890
1900
1910
1920
1930
1940
1950
1960
1970
1980
1990
2000
2010
% France Germany U.S.
UK China IndiaU.K.
0%10%20%30%40%50%60%70%80%90%
100%
Aust
ralia
Fran
ce
Ger
man
y
U.S
.
U.K
.
Chi
na
Indi
a
Braz
il
Mex
ico
S. A
frica
%Tertiary Secondary Primary No Schooling
0
2
4
6
8
10
12
14
1870
1880
1890
1900
1910
1920
1930
1940
1950
1960
1970
1980
1990
2000
2010
YearsAustralia France GermanyU.S. U.K. ChinaIndia Brazil Mexico
In developed markets, participation in education (at least at the primary/secondary level) is almost 100% In developing markets, however, enrolment in secondary education can be much lower

July 2017 Citi GPS: Global Perspectives & Solutions
© 2017 Citigroup
13
The above indicators provide some quantification about the education situation in different countries. However, none of these indicators directly take into consideration the quality of the education given. This is best measured using metrics that assess educational outcomes. Literacy rates are often used in conjunction with enrolment data. Within countries, employment and wage numbers are often used to evaluate the relative effectiveness of a particular education program or initiative. Cross-nationally, one of the most common measures of educational attainment is the OECD’s Programme for International Student Association (PISA). This tests 15-year old students’ knowledge of science, mathematics, reading, collaborative problem solving, and financial literacy and provides a rough indication of the relative quality of school education. In 2015, Singapore received the highest average PISA scores, followed by Canada and China (Beijing, Shanghai, Jiangsu, and Guandong). Brazil had one of the lowest PISA scores as shown in Figure 7.
Figure 7. PISA Scores in Select Countries
Source: OECD, Citi Research Note: B-S-J-G refers to Beijing, Shanghai, Jiangsu, and Guangdong
The global education market has increased from $4.4 trillion in 2012 to almost $5 trillion today. It is estimated to reach $6.3 trillion in 2020 (see figures below). K-12 (primary plus secondary education) is currently the largest sector (57% of the current market), followed by post-secondary (30% of the current market). To put this in context, the global retail industry is $22.6 trillion in size, while the healthcare and media industries amount to about $1.7 trillion. On average across OECD countries, public sources accounts for 84% of all funding from primary to tertiary education. Private financing is highest in tertiary education at 30% and lowest in primary/ secondary at just 9%.
0 100 200 300 400 500 600
International Average (OECD)Singapore
CanadaB-S-J-G (China)
GermanyNetherlands
AustraliaUnited Kingdom
FranceRussia
United StatesMexico
Brazil
PISA Scores
Average Science Reading Mathematics
However, it’s not all about quantity – quality is important, too, as the PISA scores show
Global education is a $5 trillion market

Citi GPS: Global Perspectives & Solutions July 2017
© 2017 Citigroup
14
Between 2008 and 2013, while private sources of expenditure on primary, secondary, and post-secondary non-tertiary educational institutions increased by 16%, public sources increased by only 6%. In the U.S., the education market in 2015 was estimated at $1.6 trillion; by 2020 it is estimated to grow to over $2 trillion. Over the last five years, venture capital investment into education companies has been growing at a 45% growth rate. In 2015, it was estimated that more than $3.1 billion7 was invested in EdTech alone, and is expected to reach $252 billion globally by 2020.8. Companies such as Facebook, Apple, and Google are all showing an interest in the EdTech space.
Figure 8. Global Education Market Spend in 2015 Figure 9. Global Education Market in 2015 and 2020 Divided by Sector
Note: K-12: Pre-Primary, Primary, and Secondary Schools Source: Global Silicon Valley,9 Citi Research;
Note: K-12: Pre-Primary, Primary, and Secondary Schools Source: Global Silicon Valley, Citi Research
7Kovalskys, G. (2016, June 24). Here’s why the Big Four’s investment in education are great for ed-tech entrepreneurs. Recode. Retrieved from https://www.recode.net/2016/6/24/12014994/ed-tech-entrepreneurs-educational-technology-investment-big-four 8 Bainbridge, D. (2016, August 13). Edtech is the next fintech. Tech Crunch. Retrieved from https://techcrunch.com/2016/08/13/edtech-is-the-next-fintech/ 9 Global Silicon Valley (2016). 2020 Vision: A History of the Future, GSV Media, California.
57%30%
7%4%
1%1% K-12
Post-Secondary
Corporate
Childcare & Pre-Primary School
Language Learning
Lifelong Learning(Non-Degree)
$4.9 trillion 0
0.51
1.52
2.53
3.54
K-12
Post
-Sec
onda
ry
Cor
pora
te
Chi
ldca
re &
Pre
-Pr
imar
y Sc
hool
Lang
uage
Lea
rnin
g
Life
long
Lea
rnin
g(N
on-D
egre
e)
US$
Tril
lions
2015 2020

July 2017 Citi GPS: Global Perspectives & Solutions
© 2017 Citigroup
15
1. What is Education Worth? There has been a growing debate in recent years around the benefits of education, in lieu of increases in tuition fees and the stagnation of wages. Does higher education still open the doors to better job opportunities and higher earnings and does education still have a positive impact on the economy? What benefit does education generate for society and the individual?
The answer to these questions depends on a number of factors including the quality of the education one attains, the nature of the education, the specific course one studies, the cost of tuition, and likely future earnings, to name a few. This chapter analyzes the above indicators to understand the full costs and benefits of tertiary education to an individual, to government, and to society. The results show that even with high fees the net individual benefits of education still outweigh the costs. However the type of education, the subject studied, and the type of institution are all important factors in determining the return on tertiary education.
An Individual’s Net Financial Gains of Investing in Education An individual’s net financial gain of investing in education is calculated by comparing the costs of education — which include direct costs such as tuition fees and foregone earnings over the period of study — with the benefits of education such as future earnings. In this chapter we focus on the costs and benefits of tertiary education staring with a discussion on tuition costs of tertiary education in a number of different economies followed by a discussion on benefits of education and finally calculate the net benefits/costs of obtaining different forms of tertiary education.
Direct Costs: Tertiary Education and Funding Mechanisms
Countries charge different fees and operate different funding models across their respective tertiary education systems. For example students in many Nordic countries make almost no personal financial contribution to their tertiary education, while in the U.S. and U.K., personal contributions are relatively extensive. In the U.K. in particular, there remains extensive public support for individual students in the form of subsidized loans. Tuition fees in Japan and Korea are also relatively high, however, in contrast to the U.K. students receive limited or no direct public support. In France tuition fees are rather low, as are levels of direct public support to students (see Figure 10). Hence, we can disaggregate public support for tertiary education depending on its extent, and whether it predominantly supports individuals, educational structures, or both (see figures below). The implication of this is that students must pay radically different amounts for their education on an upfront basis, and students are supported to a lesser and greater degree in paying this bill.
Tertiary education fee and funding models differ across the globe

Citi GPS: Global Perspectives & Solutions July 2017
© 2017 Citigroup
16
Figure 10. Higher Education Funding Structure Figure 11. Spending on Tertiary Education, % GDP (2012)
Supp
ort f
or In
divid
ual S
tude
nts
Direct Public Support for Tertiary Educational Teaching
High Low
High
Sweden Norway
New Zealand Denmark
Netherlands Australia
U.K.
Low
France United States
Germany Finland Austria Turkey
Belgium Switzerland
Japan Korea Ireland
Italy Hungary
Source: Citi Research Source: OECD (2014),10 Citi Research
Bachelor’s or advanced university/college qualifications are typically more expensive than other forms of tertiary education, such as foundation/associates degrees or professional training course. On average, across the OECD, the annual costs of short-cycle tertiary education (see ‘Different Types of Tertiary Education’ box below) are roughly half that of university/college costs (see Figure 13). When the opportunity cost and length of study is included, the overall cost of a university/college degree increases to roughly 4-5 times more than the cost of short-cycle tertiary training. University/college qualifications therefore usually constitute the largest one-off education cost on a per student basis, especially for students themselves.
10 OECD (2014). Education at a Glance 2014: OECD Indicators, OECD Publishing, Paris. http://dx.doi.org/10.1787/19991487
0.0%
0.5%
1.0%
1.5%
2.0%
2.5% Direct Public Expenditure for Institutions Public Financial Aid to Students
The cost of differs greatly among tertiary education segments with university degrees more expensive than short-cycle tertiary training

July 2017 Citi GPS: Global Perspectives & Solutions
© 2017 Citigroup
17
Figure 12. Costs of Short-Cycle Tertiary vs. University/College Degree
Note: * European Union = 22 members in OECD. Annual figures multiplied by 2 in the case of Short-Cycle Tertiary and 3 in the case of University/College, reflecting the typical length of each type of qualification. Source: OECD (2016),11 Citi Research
Different Types of Tertiary Education
Short-Cycle Tertiary Education is the lowest intensity of tertiary education. While they typically equip students with specific skills to be used in the labor force, they can also act as a pathway to other tertiary programs. The notable examples of such qualifications are academically-focused Foundation degrees in the U.K. and Associate degrees in the U.S.[1] However, mostly the qualifications are designed to provide participants with professional knowledge, skills, and competencies. Typically, they are practically-based and occupationally-specific; developing skills that are directly applicable to a specific occupational context. For example, in the U.K., Higher National Diplomas (HNDs) are used to denote the wide range of advanced technical qualifications. These qualifications are provided in areas such as computing & information technology (IT), construction & civil engineering, electrical engineering, and health & social care. To be admitted to this program, participants must be at least 18 years old and have school level qualifications. The aim of these programs is to develop skills relevant to vocational jobs and roles. For example, an Electrical Engineering HND is usually undertaken alongside work, and is assessed through project work that evaluates practical skills. The focus of such qualifications is often to push individuals into senior technician positions in industry by developing expertise in relevant IT and assembly areas.
Bachelor’s Degrees are the second lowest level of tertiary education. Typically, these degrees last three to four years, depending on the country, are studied full time, and are usually academically focused.
Master’s Degrees are the next level of tertiary education. This category encompasses enormous variety. Degrees can be studied for on a full- or part-time basis, and include a range of courses that are either professionally or academically focused.
Doctorates are the highest level of tertiary education. These can also be studied on a full-or part-time basis, but are exclusively academic and often combine research with some teaching responsibilities.
11 OECD (2016). Education at a Glance 2016: OECD Indicators, OECD Publishing, Paris. http://dx.doi.org/10.1787/eag-2016-en [1] OECD (2017). ‘ISCED 5: Short-cycle tertiary education’. Retrieved from: http://uis.unesco.org/en/glossary-term/isced-5-short-cycle-tertiary-education
0
10000
20000
30000
40000
50000
60000
70000
80000
Aust
ralia
Aust
riaBe
lgiu
mC
hile
Cze
ch R
epub
licFr
ance
Ger
man
yH
unga
ryIc
elan
dIs
rael
Italy
Japa
nKo
rea
Latv
iaN
ethe
rland
sN
ew Z
eala
ndPo
land
Slov
ak R
epub
licSl
oven
iaSp
ain
Swed
enO
ECD
- Av
erag
eEu
rope
an U
nion
*
Tota
l Cas
h C
osts
(201
3, U
SD)
Cash Cost: Short-Cycle Tertiary
Cash Cost: University/College

Citi GPS: Global Perspectives & Solutions July 2017
© 2017 Citigroup
18
Over the last decade, tuition fees at colleges and universities and other forms of tertiary education have broadly increased to meet the growing funding demands of these institutions. Despite this broad increase, university/college tuition fees still vary significantly across countries with some still sustaining an undergraduate provision that is free at the point of use (see figure below).
Figure 13. Tuition Fees Charged by Public and Private Institutions at Bachelor’s or Equivalent Level (Year 2013/14)
Notes: This figure does not take into account grants, subsidies or loans that partially or fully offset the student’s tuition fees. Tuition fees should be interpreted with caution as they result from the weighted average of the main tertiary programs and do not cover all institutions. However, the figures reports can be considered as good proxies and show the difference among countries in tuition fees charged by main educational institutions and for the majority of students. Footnotes: 1. Reference year 2012/13. 2. Reference year 2014/15. 3. Financial reference year 2013 and academic reference year 2012/13. 4. No tuition fees are charged by public authorities. 5. No tuition fees are charged by public and government-dependent private institutions. 6. Data refers to England only Source: OECD (2016), Citi Research
The U.S. and the U.K. stand out as having particularly high university/college tuition fees. On average in the U.S., the fee for a 4-year undergraduate course at a public institution was estimated at $18,600 ($8,550 tuition fees, $10,100 for room and board) per year in 2014/15, whilst the cost for the same degree at a non-profit private institution was estimated at $38,000 per year ($26,800 tuition, $11,200 room and board). Over the last ten years the average cost for an undergraduate course at a non-profit private institution increased by more than $4,000 per year.12 Students often use scholarships, student loans, or grants to supplement their tuition costs. A number of universities also offer full-need financial-based aid, which allows students to only pay what their families can afford. Federal grant programs, the largest of which is the Pell Grant, are also available and targeted at the most financially disadvantaged students.13
12 U.S. Department of Education. Tuition costs of colleges and universities, National Center for Education Statistics. 13 Amromin, G. & Eberly, J. (2016). Education Financing and Student Lending. Annual Review of Financial Economy, 8: 289-315.
0
5000
10000
15000
20000
25000
Uni
ted
Stat
es¹
Japa
n²
Kore
a²
Can
ada²
Aust
ralia
New
Zea
land
Isra
el
Net
herla
nds
Italy
Switz
erla
nd³
Aust
ria
Belg
ium
(Fl.)
²
Col
ombi
a
Belg
ium
(Fr.)
Den
mar
k⁴
Esto
nia⁵
Finl
and⁵
Nor
way
² ⁴
Slov
ak R
epub
lic⁴
Slov
enia
² ⁵
Swed
en⁵
Turk
ey⁴
Mex
ico
Uni
ted
King
dom⁶
Public InstitutionsGovernment-Dependent Private InstitutionsIndependent Private Institutions
Data notavailable or not applicable for public institutions
The cost of tertiary education has increased broadly
University/college fees in the U.S. and U.K. stand out as being particularly high and are rising

July 2017 Citi GPS: Global Perspectives & Solutions
© 2017 Citigroup
19
Even though grants and scholarships are available, many students are borrowing heavily in the belief that continuing education after high school is a path to greater job prospects and therefore greater earnings over time. It is estimated that total U.S. student debt at the end of 2016 was a staggering $1.35 trillion — more than triple the amount from a decade earlier14 — spread over 43.3 million people. The government usually bears the credit risk of these student loans and the responsibility for its collection. The average debt per borrower at a public school for an undergraduate degree was estimated at over $26,000; this increases to nearly $32,000 at a private school. It increases even further to $42,000 for a Masters of Business Administration (MBA) student and $51,000 for a Masters of Science (MSC) student.
Figure 14. Cost of Tertiary Education (Tuition Fees Only) in the U.S. Figure 15. Tertiary Tuition (Undergraduate) Fees in the U.K.
Note: Includes degree-granting institutions, which are defined as post-secondary institutions that grant an associate’s or higher degree. Source: U.S. Department of Education,15 Citi Research
Source: Citi Research
In the U.K., the costs of tertiary education have also risen threefold, from £3,000 in 2012/13 to a current maximum of £9,000 ($11,200) per year (see figure above). The U.K. government offers tuition loans for all tuition expenses and maintenance loans that cover living costs to full-time students based on location. A maximum of £11,002 ($13,700) is available for maintenance for a student living in London in the academic year 2017-2018; this decreases to £8,430 ($10,500) per year for a student outside London. On average a student in the U.K. leaves university with total debts of £44,000 ($55,000),16 pre-2012 the average student debt burden was estimated at £25,000 ($31,000). The loan will start being repaid as soon as the borrower earns more than £21,000 ($26,000) per year and a real interest rate will be charged at a maximum of 3% above inflation when earnings reach £41,000 ($51,000) per year. Currently more than £10 billion ($12.5 billion) is loaned to students each year and the government expects the value of outstanding loans to reach £100 billion ($125 billion) in 2018 (based on 2014-2015 prices)17 — at the end of 2015/16 the publicly-owned debt for English and EU students was estimated £76.3 billion ($95 billion). 14 Gitlen, J. (2016, July 1). Student Loan Debt Statistics 2017. Lendedu. Retrieved from: https://lendedu.com/blog/student-loan-debt-statistics 15 U.S. Department of Education, National Center for Education Statistics, (2016). Digest of Education Statistics, 2015 (NCES 2016-014), Chapter 3. 16 BBC News (2016, April 28). England degree debt 'highest in English-speaking world'. BBC. Retrieved from: http://www.bbc.com/news/education-36150276 17 Bolton, P. (2016). Briefing Paper, 1079: Tuition Fee Statistics, House of Commons Library, London.
0
5,000
10,000
15,000
20,000
25,000
30,000
1979
-80
1981
-82
1983
-84
1985
-86
1987
-88
1989
-90
1991
-92
1993
-94
1995
-96
1997
-98
1999
-200
020
01-0
220
03-0
420
05-0
620
07-0
820
09-1
020
11-1
220
13-1
4Tuiti
on fe
es (c
onst
ant $
201
4-20
15)
All InstitutionsPublic InstiutionsAll Private (Profit and Non Profit)
0
1000
2000
3000
4000
5000
6000
7000
8000
9000
10000
1989
/99
1999
/200
020
00/0
120
01/0
220
02/0
320
03/0
420
04/0
520
05/0
620
06/0
720
07/0
820
08/0
920
09/1
020
10/1
120
11/1
220
12/1
320
13/1
420
14/1
520
15/1
620
16/1
7
UK
Ter
tiary
tuiti
on fe
es (
£ pe
r Yea
r)
Student borrowing in both the U.S. and U.K. is also rising with student debt in the U.S. now at $1.35 trillion
Average debt per student in the U.K. is more than £44,000, up from £25,000 just five years ago

Citi GPS: Global Perspectives & Solutions July 2017
© 2017 Citigroup
20
Figure 16. Student Loans, Value, and Take-Up in the U.K., Academic Years
Date Number (thousands)
Value (£ million)
Average value (£)
Proportion of eligible
students taking loans
1990/91 180 70 390 28% 1995/96 560 701 1,250 59% 2000/01 760 2,204 2,900 78% 2005/06 881 2,933 3,330 Not available England Only 2012/12 Maintenance 932 3,558 3,820 89% Tuition fees 926 4,408 4,760 89% Combined 987 7,794 7,900 2013/14 Maintenance 973 3,784 3,890 89% Tuition fees 966 5,938 6,150 90% Combined 1,031 9,493 9,210 2014/15 Maintenance 963 3,785 Tuition fees 973 7,291 Combined 1,033 10,783 10,440 2015/16 Maintenance 985 3,942 4,000 Tuition fees 1,007 8,032 7,980 Combined 1,061 11,623 10,960 2016/17 Maintenance 962 4,554 4,740 Combined 1,027 8,652 8,430
Note: 2016/17 – amount awarded up to November 2016 Source: Bolton P (2016), Citi Research
The cost of going to university/college in the U.S. and the U.K. has increased dramatically over the past few decades. Students are leaving university with a mountain of debt leaving them with less money to spend on other purchases such as housing. In this context, many are increasingly urging a further expansion in short-cycle tertiary education on the basis of cost. Outside the U.S. and U.K., tuition fees are much lower — for example it is estimated that the cost of an undergraduate course in Chinese universities is between $2,000-4,500 per academic year, depending on the institution and subject.18 In India the cost tends to be substantially lower.
Figure 17. U.S. Student Loans Owned and Securitized, Outstanding ($bn, not seasonally adj.)
Source: Federal Research Bank of St. Louis
18 The Complete University Guide (2017). Peking University, China: Fees. Retrieved from: https://www.thecompleteuniversityguide.co.uk/international/asia/china/peking-university/fees
0
200
400
600
800
1000
1200
1400
1600
01-2
006
06-2
006
11-2
006
04-2
007
09-2
007
02-2
008
07-2
008
12-2
008
05-2
009
10-2
009
03-2
010
08-2
010
01-2
011
06-2
011
11-2
011
04-2
012
09-2
012
02-2
013
07-2
013
12-2
013
05-2
014
10-2
014
03-2
015
08-2
015
01-2
016
06-2
016
11-2
016
Outside the U.S. and U.K., tuition fees are much lower

July 2017 Citi GPS: Global Perspectives & Solutions
© 2017 Citigroup
21
Direct Benefits: Future Potential Earnings Due to Higher Education
The potential for higher earnings and better job prospects can be one of the most important incentives for individuals to continue education. It is estimated that on average across OECD countries, those who have a tertiary qualification earn 55% more compared to those adults with only an upper secondary education.
There are however, significant differences between the returns from different forms of tertiary education. Across the OECD on average, those with a bachelor’s degree typically earn 23% more than those with short-cycle tertiary qualifications (who themselves earn 20% more than those with secondary qualifications alone). However, those with postgraduate degrees typically earn 29% more than those with bachelor’s degrees. This is shown in Figure 18 below.
Figure 18. Relative Earnings of Adults Working Full Time, by Educational Attainment (OECD Average 2014)
Source: OECD (2016); Citi Research
Further, there are also significant differences between economies. The largest relative returns to tertiary education are in Brazil, Chile, Hungary, and Mexico and the smallest in Denmark, Sweden, and Norway (see figure below).19 One of the reasons given is that the potential share of tertiary educated people in Brazil and Chile is rather low when compared to Nordic countries. Earnings are highest for people with masters and doctoral degrees.
19 OECD (2016). Education at a Glance 2016: OECD Indicators, OECD Publishing, Paris. http://dx.doi.org/10.1787/eag-2016-en
0
20
40
60
80
100
120
140
160
180
200
Below UpperSecondary
UpperSecondary
Short-CycleTertiary
Bachelor's orequivalent
Master's,Doctoral, orequivalent
Rel
ativ
e Ea
rnin
gs (U
pper
Sec
onda
ry =
100)
Those with a tertiary education earn 55% more compared to adults with only an upper secondary education
But the type of tertiary education matters….
…as does the region in which the student is located

Citi GPS: Global Perspectives & Solutions July 2017
© 2017 Citigroup
22
Figure 19. Relative Earnings of Adults Working Full Time, by Educational Attainment (2014)
Note: Tertiary education includes short-cycle tertiary, bachelor's, master's, doctoral, or equivalent degrees. Working life is assumed to be 39 years. 1. Year of reference differs from 2014. 2. Some levels of education are included with others. 3. Index 100 refers to the combined ISCED Levels 3 and 4 of the educational attainment levels in the ISCED 2011 or ISCED-97 classification. 4 Earnings net of income tax 5. Data for upper secondary attainment include completion of a sufficient volume and standard of programs that would be classified individually as completion of intermediate upper secondary programs (18% of the adults are under this group). 6. Data refer to all earners. Countries are ranked in ascending order of the relative earnings of 25-64 year-olds with tertiary education. Source: OECD (2016); Citi Research
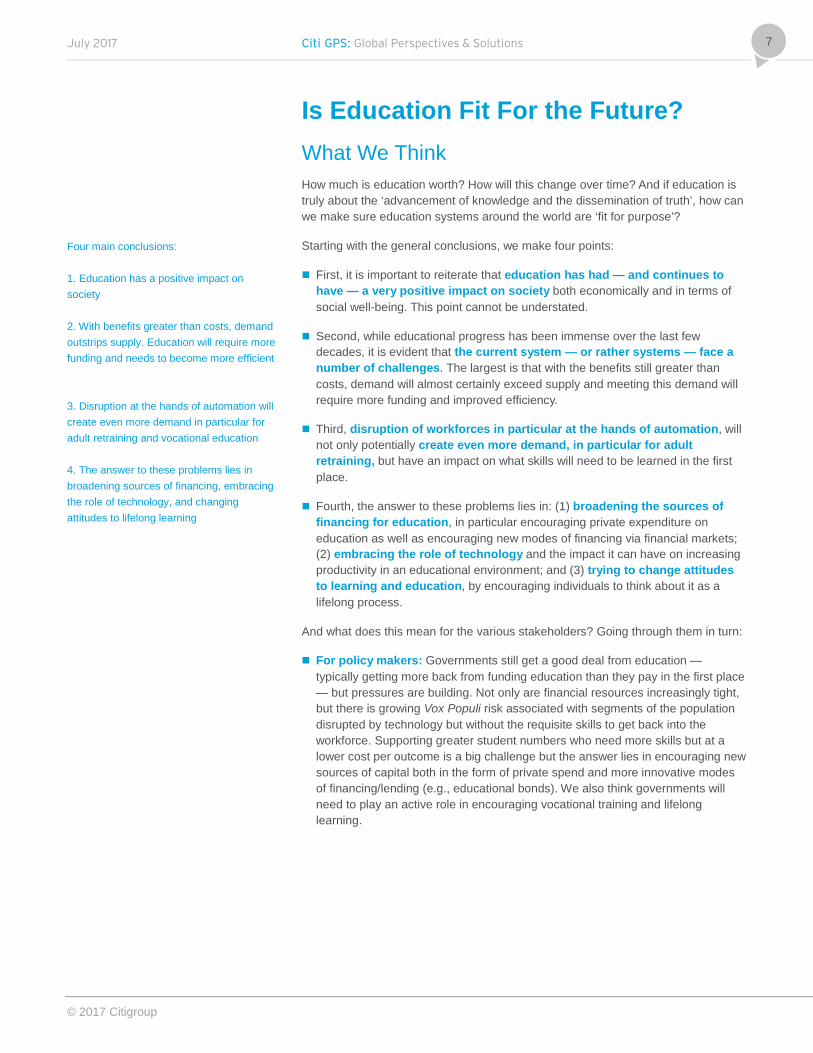
Earnings also differ by subject and by type of institution. Across the OECD countries, the subjects associated with higher earnings are engineering, manufacturing & construction, social sciences, business & law, science, and mathematics & computing. On average workers who studied in these fields at a tertiary level earn 10% more than the average earnings of all tertiary-educated full-time workers. On the other hand, the average earnings for students who graduated in education (teacher training), humanities, and language & arts earned about 15% lower than the average earnings of all tertiary-educated full-time workers.
40
60
80
100
120
140
160
180
200
220
240
260
280
300
Below Upper Secondary All TertiaryShort-Cycle Tertiary Bachelor's or EquivalentMaster's, Doctoral or Equivalent
Index Note: Master's, Doctoral or Equivalent figures for Brazil (434) Chile (444), Mexico (307)
Earning potential is also affected by the subject studied and type of institution attended
July 2017 Citi GPS: Global Perspectives & Solutions
© 2017 Citigroup
23
Figure 20. Relative Earnings of Adults with Tertiary Education by Field of Study – All Fields of Education = 100
Figure 21. Relative Median Earnings of Young Tertiary Graduates 3 Years After Completing a Master’s Degree, by Field of Study
Source: OECD (2016), Citi Research
Note: Young tertiary graduations with income from employment (upper secondary education = 100), average across countries. Source: OECD (2016), Citi Research
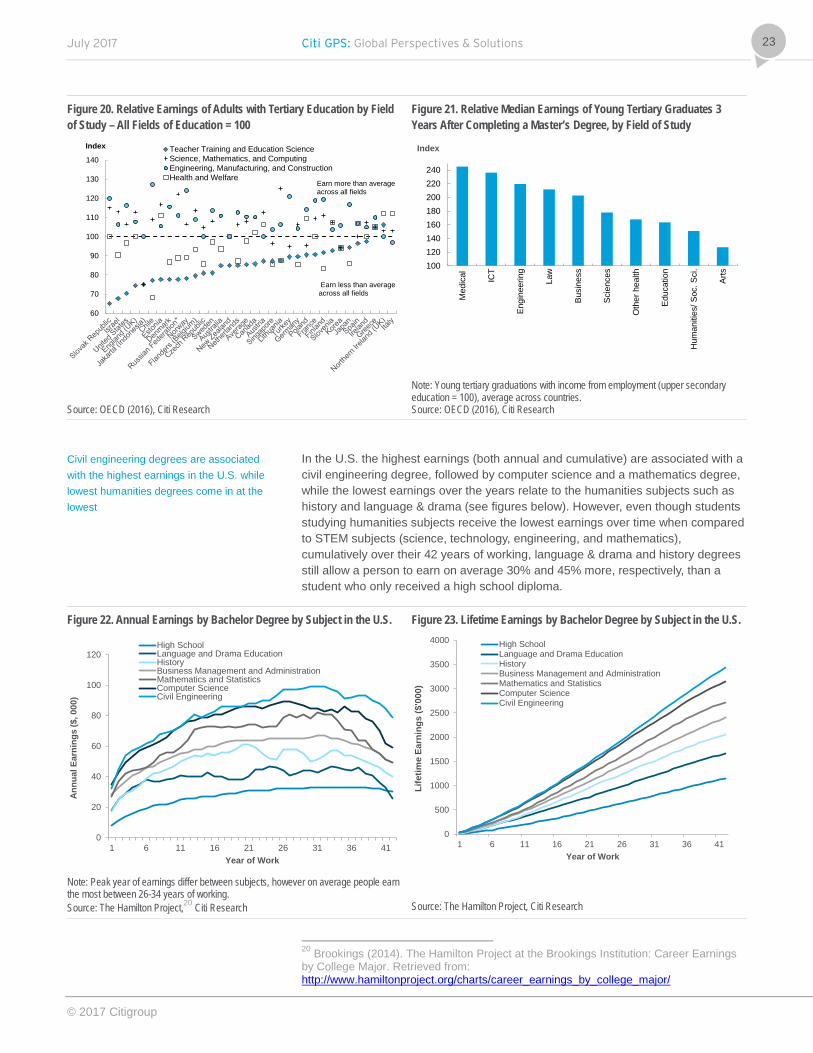
In the U.S. the highest earnings (both annual and cumulative) are associated with a civil engineering degree, followed by computer science and a mathematics degree, while the lowest earnings over the years relate to the humanities subjects such as history and language & drama (see figures below). However, even though students studying humanities subjects receive the lowest earnings over time when compared to STEM subjects (science, technology, engineering, and mathematics), cumulatively over their 42 years of working, language & drama and history degrees still allow a person to earn on average 30% and 45% more, respectively, than a student who only received a high school diploma.
Figure 22. Annual Earnings by Bachelor Degree by Subject in the U.S. Figure 23. Lifetime Earnings by Bachelor Degree by Subject in the U.S.
Note: Peak year of earnings differ between subjects, however on average people earn the most between 26-34 years of working. Source: The Hamilton Project,20 Citi Research
Source: The Hamilton Project, Citi Research
20 Brookings (2014). The Hamilton Project at the Brookings Institution: Career Earnings by College Major. Retrieved from: http://www.hamiltonproject.org/charts/career_earnings_by_college_major/
60
70
80
90
100
110
120
130
140
Index Teacher Training and Education ScienceScience, Mathematics, and ComputingEngineering, Manufacturing, and ConstructionHealth and Welfare
Earn less than averageacross all fields
Earn more than average across all fields
100120140160180200220240
Med
ical ICT
Engi
neer
ing
Law
Busi
ness
Scie
nces
Oth
er h
ealth
Educ
atio
n
Hum
aniti
es/ S
oc. S
ci.
Arts
Index
0
20
40
60
80
100
120
1 6 11 16 21 26 31 36 41
Annu
al E
arni
ngs
($, 0
00)
Year of Work
High SchoolLanguage and Drama EducationHistoryBusiness Management and AdministrationMathematics and StatisticsComputer ScienceCivil Engineering
0
500
1000
1500
2000
2500
3000
3500
4000
1 6 11 16 21 26 31 36 41
Life
time
Earn
ings
($'0
00)
Year of Work
High SchoolLanguage and Drama EducationHistoryBusiness Management and AdministrationMathematics and StatisticsComputer ScienceCivil Engineering
Civil engineering degrees are associated with the highest earnings in the U.S. while lowest humanities degrees come in at the lowest

Citi GPS: Global Perspectives & Solutions July 2017
© 2017 Citigroup
24
It is not only the degree earned that can affect future earnings, but the ‘perceived’ quality of education received, which in many cases refers to the education institution one attends. For example, Deming et al. (2014) found that students with a bachelor’s degree in business from a for-profit online institution were 22% less likely to receive a callback than those with a bachelor’s degree in the same field from a non-selective public institution.21 The 2016/2017 College Study Report in the U.S. shows that on average, the earnings potential from achieving an MBA from Harvard is estimated at $122,000 per year (early-career pay), while earnings potential for the same degree from West Virginia University (ranked 100) is estimated at $52,90022 per year. In the U.K., graduates from Oxford and Cambridge earn approximately £7,600 more per year on average, than graduates from post-199223 universities and are also more likely to receive a call back for an interview.24 Therefore, the type of subject and institution matter when calculating the benefits of tertiary education. This is important when assessing whether it is worth undertaking a university / college degree given the costs of tuition and the foregone earnings during this period. We analyze this in the next section.
Private Net Financial Gains/Losses from Tertiary Education
Calculating private net financial gains can help students understand the benefits of attending tertiary education. We calculate these gains by estimating the difference between the costs and benefits associated with attaining an additional level of education. Costs include both the direct costs for attaining education (tuition and living expenses) as well as foregone earnings, while benefits include both earnings from employment and unemployment benefits. For us to determine the return from education, we calculate the net present value of the investment — the OECD in their report use a discount rate of 2% which is the average real interest rate of government bonds. According to their analysis, the benefits of education outweigh the costs in all OECD countries studies. For example, in the U.S. the private net financial gains of undertaking tertiary education are estimated to average $458,000 for men and $298,000 for women. In OECD countries the average private net financial returns are lower than the U.S., estimated at $258,000 and $168,000 for men and women, respectively. The lower rates for women can be attributed to lower earnings, higher unemployment rates, and a higher share of part-time work. Unfortunately the gender gap in earnings persists in many countries even though women generally have a higher level of educational attainment. Across OECD countries women on average earn only 73% of the earnings of tertiary-educated men. Lower net benefits for women could also be due to the type of degrees earned by women as more women are studying health and humanities rather than STEM subjects such as engineering and mathematics. Citi’s ‘Women in the Economy’ report discusses some of these issues in more detail.
21 Deming D., Yuchtman, N., Abulafi, A. et al (2015). The Value of Postsecondary Credentials in the Labor market An Experimental Study. Harvard University. Cambridge. 22 Payscale (2016). ‘College Salary Report: Best Graduate Schools by Salary Potential’. Retrieved from: https://www.payscale.com/college-salary-report/grad?page=43 23 Post-1992 Universities, also known as ‘new’ or ‘modern’ universities, were established as such under the 1992 Higher Education Act. The predominant change was to allow institutions that previously provided technical and vocational education to volunteer for full university status, offering degrees as well as technical courses. Though this also made it easier to establish new universities. Combined, the one off change in 1992, and the subsequent easing of restrictions on founding new universities, has significantly boosted university numbers. 24 de Vries, R. (2014). Earning by Degrees: Differences in the career outcomes of UK graduates, The Sutton Trust, London.
The perceived quality of the institution where the degree was studied is also a factor in future earnings
The OECD average [private net financial gain from tertiary education is estimated at $258,000 for men and $168,000 for women – values in the U.S. are higher

July 2017 Citi GPS: Global Perspectives & Solutions
© 2017 Citigroup
25
Figure 24. Private Costs and Benefits of Education on Attaining Tertiary Education (by Gender, 2012, in Equivalent USD Converted using PPPs for GDP)
Figure 25. Private Net Financial Returns on Attaining Tertiary Education (by Gender, 2012) as Compared with Adults Attaining Upper Secondary or Post-Secondary Non-Tertiary Education (USD Converted using PPPs)
Source: OECD (2016), Citi Research Note 1 = Year of references differs from 2012 Source: OECD (2016), Citi Research Note 1 = Year of references differs from 2012
Net financial returns from higher education are typically higher in developing markets, however absolute cash flows are usually lower. This is the result of supply and demand effects; generally, less developed economies have a lower proportion of graduates in their overall labor force, which drives up returns, on a relative basis, on advanced skills. For example, in the figure below, we compare the skills profile in India and the U.S. and relative wage earnings. A much higher percentage of the U.S. workforce have secondary and tertiary level qualifications however, the relative earnings boost those qualifications afford, the so called ‘wage premium,’ is depressed relative to India. At each stage, a higher level qualification gives a higher relative boost to earnings for Indian students compared to American students. This also holds true in other developing countries. In China, the graduate wage premium has been estimated by Ge (2012) at roughly 52% while in Brazil, obtaining an undergraduate degree typically boosts income by 119% above the average annual income of someone with a secondary school qualification alone. Both are above OECD averages of 48% and well above the European average of 39%.
What does this mean for cash returns? As this chapter has discussed, the costs of higher education also tend to be lower in less-developed markets, even if public support and financial structures are typically less-developed. However, average wages are also lower. The implication is that tertiary education tends to give graduates a greater proportional boost on a smaller initial wage. For example, Mexican graduates enjoy wages that are 105% greater than those with a secondary school education alone. Tuition fees are, in general, much lower at $5,000 in comparison to the U.S. However, the overall cash return is stilted by the lower wage level. Hence while the U.S., tertiary education boosts per hour earnings by $13 on a purchasing power parity (PPP) basis, in Mexico the value is $4.10 on the same basis.25 It is a similar story in India. Here, tertiary skills boost wages by 131% compared to just 68% in the United States. However, the total annual cash boost totals just $9,000, compared to roughly $35,000 in the United States.26 The
25 International Labor Organization (ILO) 2016. ILOSTAT Labor Database, ILOSTAT, Switzerland. 26 Rani, G. (2014). Disparities in earnings and education in India. Cogent Economics & Finance, 2: 941510. https://doi.org/10.1080/23322039.2014.941510
-150000
-50000
50000
150000
250000
350000
450000
550000
650000 Man - total costs Man - total benefits
Woman - total costs Woman - total benefits
0
100000
200000
300000
400000
500000
600000 Man Woman
Returns in developing markets are higher than developed markets based on the supply/demand of tertiary-educated workers
Tertiary-educated workers in emerging markets get a greater proportional boost on a smaller initial wage

Citi GPS: Global Perspectives & Solutions July 2017
© 2017 Citigroup
26
implication tends to be that net private returns on higher education are positive in developing countries, but often slightly below the OECD average.
Figure 26. Comparison of U.S. and India’s Adult Skills and Wage Premium
Source: Lee and Lee, OECD, Citi Research
There are also important differences between private returns and the different forms of tertiary education. Using the same discount rate noted above, the OECD measured the net returns to different forms of tertiary education. Just as with benefits, it appears that returns increase the greater the duration of education. Hence, postgraduate qualifications typically earn the greatest returns, followed by bachelor’s degrees and short-cycle tertiary qualifications.
Figure 27. Private Financial Returns on Attaining Tertiary Education (2012)
Note: Figures are based on data from Australia, Canada, Finland, Italy, New Zealand, and Norway. Source: OECD (2016) Education at a Glance, Citi Research.
0
50
100
150
200
250
0
5
10
15
20
25
30
35
40
Below upper secondary Upper Secondary All tertiary
Rel
ativ
e W
age
Leve
ls (U
pper
Sec
onda
ry
Educ
atio
n=10
0)
% o
f tot
al A
dult
Popu
latio
n w
ith Q
ualif
icat
ions
U.S. Education Level India Education LevelU.S. Wage Premium India Wage Premium
Below UpperSecondary
All Tertiary
0
50000
100000
150000
200000
250000
Short-CycleTertiary
Bachelor's orEquivalent
Master's, Doctoralor Equivalent
All Tertiary
Life
time
Ret
urns
(USD
, $ P
PP)
Higher private returns are also correlated with longer duration of education

July 2017 Citi GPS: Global Perspectives & Solutions
© 2017 Citigroup
27
We also assess the net returns of education for different degrees in the U.S. To calculate this, we use the future earnings potential of attaining a tertiary degree based on different subjects over the lifetime of that individual (as described in the section above). We then compare this with tuition and living costs for a private non-profit institution — estimated at $41,000 per year over four years — and the students’ foregone earnings for this time period —estimated at annual earnings based on a high school diploma. The benefits include the difference between the annual earnings of each degree minus the annual earnings of a high school diploma over a 42 year period (a discount rate of both 2% and 3% was used to calculate the net present value of future earnings). The results show that undertaking an undergraduate course in civil engineering yielded the highest net benefits at over $1.3 million over the working life of the individual, followed by computer science ($1.1 million) and mathematics ($0.6 million). History and language & drama had the lowest net benefits estimated at $0.3 and $0.1 million, respectively, over the same period. The discount rate used in the analysis makes a difference in the result, with lower net earnings benefit estimated when a higher discount rate is used. To reach parity between costs and benefits, tuition costs would need to increase by 44% for a language & drama course, assuming a 2% discount rate and future earnings based on Figure 22 above. Given that net benefits for civil engineering and mathematics are much higher compared to language & drama, tuition costs would need to increase by over 100% to reach parity. This opens the discussion as to whether subjects that have the highest net benefits should subsidize other courses which have lower net benefits.
Figure 28. Private Net Financial Returns in the U.S. – Bachelor Degree by Subject
Source: Citi Research
While further education does still have huge benefits for individuals as shown above, the private benefits from investing in education also depend on countries’ tax and social benefits systems. Higher income taxes and social contributions (such as a national income insurance contribution), and low social transfers (e.g., child benefits) related to higher earnings can act as disincentives to investing in further education by creating a wedge between the level of gross earnings needed to recover the cost of education and final net earnings perceived by the individual. However on average, the net benefits associated with undertaking tertiary education outweigh the net costs. We note that it is important to distinguish the benefits by subject with STEM subjects having larger benefits and by the quality of education or institution where high tuition costs are justified by better job prospects and better earnings.
0
200,000
400,000
600,000
800,000
1,000,000
1,200,000
1,400,000
CivilEngineering
ComputerScience
Mathematicsand Statistics
BusinessManagement
History Language andDrama
2% Discount Rate 3% Discount Rate
Private benefits of education to an individual can be affected by a country’s tax and social benefit system

Citi GPS: Global Perspectives & Solutions July 2017
© 2017 Citigroup
28
Public Expenditure on Education and Public Net Financial Gains It is not only individuals that invest in education; governments for many years have invested in the education of their citizens. In many developed countries the public expenditure on education over the last 12 years has remained rather stable (refer to Figure 30). On average in OECD countries, public spend on education is equal to 4.5% of GDP. This differs between different countries – for example in the U.K. educational spend is the third largest sector to receive public spending (5.2% of GDP in 2013) after pensions (8% of GDP) and health care (7.4% of GDP). In the U.S. the figure stands at 4.2% of GDP, whilst in Nordic countries (such as Denmark and Sweden) over 6% of GDP is spent on educational institutions. On the other hand in many developing countries such as China, India, and Brazil, there has been an increase in public investment. In China, public spending on education has increased from 1.9% of GDP in 1998 to just under 4% of GDP in 2011. Increasing public expenditure on educational institutions does not however mean that the education system in a country is good or that no improvements are needed. What really matters is the quality of the outcomes that are achieved over the years.
Figure 29. Public and Private Expenditure on Primary to Tertiary Education Institutions as a Percentage of GDP (2013)
Figure 30. Public Expenditure on Education as a Percentage of GDP
Source: OECD (2016),27 Citi Research Source: World Bank, Citi Research
In the U.S., a total of 12.2% of public expenditure was spent on education — 3.6% of this was spent on primary education, 4.3% on secondary education and 3.1% on tertiary education. A similar percentage of public expenditure (12.1%) was spent on education in the U.K. — of this 5.3% was spent on secondary education, followed by primary (3.7%) and tertiary (3.1%) (see Figure 31 below).
27 OECD (2016). Education at a Glance 2016: OECD Indicators, OECD Publishing, Paris. http://dx.doi.org/10.1787/eag-2016-en
1
2
3
4
5
6
7
8
9
Cos
ta R
ica
Uni
ted
King
dom
Col
ombi
aN
ew Z
eala
ndD
enm
ark
Nor
way
Uni
ted
Stat
esPo
rtuga
lC
anad
a3Is
rael
Chi
le4,
5Ic
elan
dKo
rea4
Belg
ium
Finl
and
Aust
ralia
4N
ethe
rland
sAr
gent
ina
Swed
enFr
ance
Irela
ndM
exic
oEs
toni
aTu
rkey
Aust
riaSl
oven
iaPo
land
Latv
iaJa
pan
Lith
uani
aG
erm
any
Spai
nC
zech
Rep
ublic
Italy
Slov
ak…
Hun
gary
Rus
sian
…
% of GDP Private expenditure on education institutionsPublic expenditure on education institutions
OECD average (total expenditure)
0
1
2
3
4
5
6
7
1995 2000 2005 2010 2015
Gov
ernm
ent e
xpen
ditu
re o
n ed
ucat
ion
as a
% o
f GD
P
Brazil
China
Germany
France
U.K.
India
U.S.
OECD countries, on average, publically spend the equivalent of 4.5% of GDP on education
The majority of public spending in the U.S. is on primary and secondary education

July 2017 Citi GPS: Global Perspectives & Solutions
© 2017 Citigroup
29
Figure 31. Public Expenditure on Education as a Percentage of Total Public Expenditure (2013)
Source: OECD (2016), Citi Research
So why do governments invest in education? The main reasons are to help foster economic growth, to enhance productivity and to contribute to personal and social development, and reduce social inequality. There is plenty of evidence available that shows how education can spur economic growth by increasing productivity that comes along with an increase in knowledge and skills. It is estimated that an increase in educational achievement by 50 PISA points translates to a 1 percentage point increase in the rate of economic growth in the long run.28
Direct Costs and Benefits of Public Investment in Education
Governments not only spend money on educating their citizens but also make money from investing in the education of its citizens — highly skilled people (and therefore higher earners) are more likely to be gainfully employed. They are also likely to increase the tax they pay to the government over their working life as a result of their enhanced earnings. The rates of return from public investment into education are calculated the same way as private net returns — by estimating the costs of education which include the direct costs for supporting education and foregone tax revenues on earnings against the benefits of investment which include income tax, social contributions, social transfers, and unemployment benefits.
Figure 32 shows the public costs and benefits of investing in tertiary education in a number of different OECD countries. In the U.S., the total public costs for a male to attain a tertiary education are estimated at $64,200, while the benefits to government are estimated at $328,000, giving a total net benefit of $264,000. The net benefits to government for a woman attaining a tertiary education are lower, estimated at $112,000. On average the costs and benefits to governments in OECD countries are lower than the U.S. — the net costs for government for a male attending tertiary education are estimated at $53,500, while the benefits are estimated at $197,000, giving a total net benefit of $144,000, >$100,000 less than the U.S.
28 Woessmann, L. (2014). The Economic Case for Education. EENEE Analytical Report No. 20, Prepared for the European Commission. European Expert Network on Economics of Education (EENEE).
0
2
4
6
8
10
12
14
16
18
20
Publ
ic e
xpen
ditu
re o
n ed
ucat
ion
as a
%
of to
tal p
ublic
exp
endi
ture
Primary Secondary Post Secondary (Non Tertiary) All Tertiary
Governments make money by investing in education; in the form of higher tax collections from educated workers
The total net benefit for men attaining a tertiary education to the government is $264,000 in the U.S.
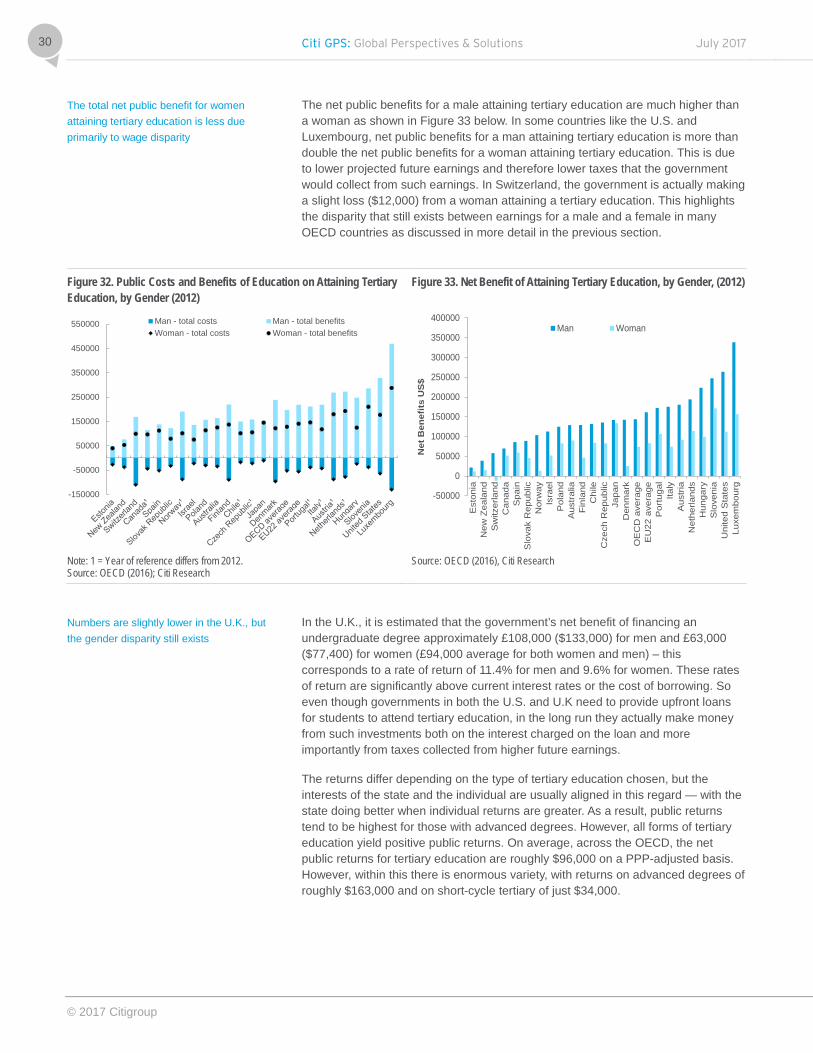
Citi GPS: Global Perspectives & Solutions July 2017
© 2017 Citigroup
30
The net public benefits for a male attaining tertiary education are much higher than a woman as shown in Figure 33 below. In some countries like the U.S. and Luxembourg, net public benefits for a man attaining tertiary education is more than double the net public benefits for a woman attaining tertiary education. This is due to lower projected future earnings and therefore lower taxes that the government would collect from such earnings. In Switzerland, the government is actually making a slight loss ($12,000) from a woman attaining a tertiary education. This highlights the disparity that still exists between earnings for a male and a female in many OECD countries as discussed in more detail in the previous section.
Figure 32. Public Costs and Benefits of Education on Attaining Tertiary Education, by Gender (2012)
Figure 33. Net Benefit of Attaining Tertiary Education, by Gender, (2012)
Note: 1 = Year of reference differs from 2012. Source: OECD (2016); Citi Research
Source: OECD (2016), Citi Research
In the U.K., it is estimated that the government’s net benefit of financing an undergraduate degree approximately £108,000 ($133,000) for men and £63,000 ($77,400) for women (£94,000 average for both women and men) – this corresponds to a rate of return of 11.4% for men and 9.6% for women. These rates of return are significantly above current interest rates or the cost of borrowing. So even though governments in both the U.S. and U.K need to provide upfront loans for students to attend tertiary education, in the long run they actually make money from such investments both on the interest charged on the loan and more importantly from taxes collected from higher future earnings.
The returns differ depending on the type of tertiary education chosen, but the interests of the state and the individual are usually aligned in this regard — with the state doing better when individual returns are greater. As a result, public returns tend to be highest for those with advanced degrees. However, all forms of tertiary education yield positive public returns. On average, across the OECD, the net public returns for tertiary education are roughly $96,000 on a PPP-adjusted basis. However, within this there is enormous variety, with returns on advanced degrees of roughly $163,000 and on short-cycle tertiary of just $34,000.
-150000
-50000
50000
150000
250000
350000
450000
550000 Man - total costs Man - total benefitsWoman - total costs Woman - total benefits
-50000
0
50000
100000
150000
200000
250000
300000
350000
400000
Est
onia
New
Zea
land
Sw
itzer
land
Can
ada
Spa
inS
lova
k R
epub
licN
orw
ayIs
rael
Pol
and
Aus
tral
iaF
inla
ndC
hile
Cze
ch R
epub
licJa
pan
Den
mar
kO
EC
D a
vera
geE
U22
ave
rage
Por
tuga
lIta
lyA
ustr
iaN
ethe
rland
sH
unga
ryS
love
nia
Uni
ted
Sta
tes
Luxe
mbo
urg
Net
Ben
efits
US
$
Man Woman
The total net public benefit for women attaining tertiary education is less due primarily to wage disparity
Numbers are slightly lower in the U.K., but the gender disparity still exists

July 2017 Citi GPS: Global Perspectives & Solutions
© 2017 Citigroup
31
Figure 34. Public Financial Returns on Attaining Tertiary Education by Educational Level (2012)
Figure 35. Average Net Benefit to Government of Financing and Undergraduate and a Master’s Degree in the U.K.
Source: OECD (2016), Citi Research Source: London Economics,29 Citi Research
Falling Returns and Investment in University Education
The results above do not necessarily mean that increased public investment in education will generate the same large economic returns on an ongoing basis. The recent experience of the U.K. is particularly notable in this regard.30 Recent patterns of U.K. graduate employment suggest that further investment in some undergraduate university degrees may not result in extensive economic benefits. Non-manual, managerial jobs31 are growing at a slower rate than has been the case historically, especially in comparison to the growth rate of the managerially qualified workforce.32 As a result, increasing numbers of graduates are moving into jobs that were previously fulfilled by those without an expensive university education33 — a trend known as ‘downgrading.’34 Recent attempts to expand university education to a mass system have accelerated this.
‘Downgrading’ does not necessarily mean that education is not being put to productive use. Richard Blundell at the Institute for Fiscal Studies argues that these jobs increasingly employ new technologies that make graduates more productive.35 This explains why the U.K. wage premium between graduates and non-graduates
29 London Economics (2013). What’s the value of a UK degree? million+ and London Economics, London. 30 Holmes, C & Mayhew, K. (2016). The economics of higher education. Oxford Review of Economic Policy 2016; 32 (4): 475-496. https://doi.org/10.1093/oxrep/grw031 31 As defined by Goldthorpe’s classification 32 Goldthorpe, J. (2013). Understanding – and Misunderstanding – Social Mobility in Britain: The Entry of the Economists, the Confusion of Politicians and the Limits of Educational Policy. Journal of Social Policy, 42(3), 431-450. https://doi.org/10.1017/S004727941300024X 33 Beaudry, Green and Sand (2016) have observed this is U.S. labor market, while Holmes and Mayhew (2016) show the same phenomenon in the U.K. 34 A good example of this is nursing. In the United Kingdom, nursing was traditionally a vocational qualification; it now largely requires a university degree. 35 Blundell, R., Green, D., & Jin, W. (2016). The UK wage premium puzzle: how did a large increase in university graduates leave the education premium unchanged? IFS Working Paper (W16/01). DOI: 10.1920/wp.ifs.2016.1601
0
20000
40000
60000
80000
100000
120000
140000
160000
180000
200000
Short-CycleTertiary
Bachelor's orEquivalent
Master's,Doctoral orEquivalent
All Tertiary
Life
time
Ret
urns
(USD
, $ P
PP)
£179,564 (incl £108,293
undergraduate)
£108,293
£109,912 (incl £62,871
undergraduate)
£62,871
0 50,000 100,000 150,000 200,000
Masters
Undergraduate
Women Men
Increasing investment in education can hamper economic returns if graduates are ‘downgraded’, i.e. move into jobs previously filled by those without a university education

Citi GPS: Global Perspectives & Solutions July 2017
© 2017 Citigroup
32
has been sustained, despite increased numbers of graduates.36 However, there is growing evidence that university education may not be generating the broader economic returns it once did. Studies looking directly at the nature of work suggest that increasing numbers of graduates have not been associated with changes in the nature of work that might require a degree.37 Between 20% and 33% of all graduates in the U.K. are in jobs that do not require graduate skills.38 Similar trends have been observed in the United States, where roughly 50% of all employed recent graduates were ‘underemployed’ in jobs that did not require graduate skills.39
Growing inequality between different graduates illustrates that while on average graduates may be more productive, many degrees are producing lower and lower returns. The problem is that recent expansions in graduate numbers have typically produced a greater proportion of these low productivity degrees. Ongoing expansions in university/college education need to focus more on producing high quality, in-demand degrees to generate good economic returns in the future.
Other Social Benefits Education can also provide a number of social benefits. These include, amongst others, an increase in life expectancy, high life satisfaction, less crime in society, and active involvement in society. For example, it is estimated that on average amongst OECD countries, a 30-year old tertiary educated man can expect to live eight years longer than a 30-year old man who has not completed upper secondary school. Figure 36 and Figure 37 show that on average a person with tertiary education is more likely to have less activity limitation due to health problems and better life satisfaction when compared to a person with upper or lower secondary education.
Figure 36. Percent of Adults Reporting Activity Limitation due to Health Problems, by Educational Attainment and Age Group (2014)-
Figure 37. Trends in Life Satisfaction Based on Educational Attainment
Source: Citi Research Source: Citi Research
36 Blundell, R., Green, D., & Jin, W. (2016). The UK wage premium puzzle: how did a large increase in university graduates leave the education premium unchanged? IFS Working Paper (W16/01). DOI: 10.1920/wp.ifs.2016.1601 37 Elias, P. & Purcell, K (2013). Classifying graduate occupations for the knowledge society. SOC(HE) Futuretrack Working paper No. 5, Institute for Employment Research. 38 Behle, H. (2016). Graduates in non-graduate occupations. Report to HEFCE and SRHE by Warwick Institute for Employment Research. 39 Associated Press (2012, April 23). ‘Half of recent college grads underemployed or jobless, analysis says’. Cleveland.com. Retrieved from: http://www.cleveland.com/business/index.ssf/2012/04/half_of_recent_college_grads_u.html
0
10
20
30
40
50
60
70
25-34 year-olds
35-44 year-olds
45-54 year-olds
55-64 year-olds
65-74 year-olds
75-year-oldsand over
% o
f adu
lts
Average- Below upper secondary
Average- Upper secondary or post-secondarynon-tertiaryAverage- Tertiary
70
75
80
85
90
95
100
2010
2011
2012
2013
2014
2015
% o
f 25-
64 y
ears
old
s
Upper Secondary or Post-Secondary Non-Tertiary
Tertiary
Many degree are producing lower and lower returns as increasing numbers of students are choosing low productivity degrees
The social benefits of education include longer life spans and higher quality of life

July 2017 Citi GPS: Global Perspectives & Solutions
© 2017 Citigroup
33
Even though some of these social benefits are difficult to quantify in monetary terms, they are still extremely important in assessing whether investing in education is worth it. Policy makers should take into account the wider social benefits of education when allocating resources across public policies and not just the monetary benefits, while individuals should be aware that higher education also leads to better life satisfaction and well-being.
Implications: Education Works It is clear that education, in particular at the tertiary level, leads to more income for graduates, more tax for governments, and benefits for society in the form of increased social mobility, longer life expectancy, and higher levels of wellbeing. Quite simply: more education has historically meant more growth and better social outcomes — everyone wins.
But it is also clear that we cannot be complacent. There are signs the algorithm is under stress given constraints on the amount of government support/spending on education and early signs of diminishing returns. We also note that the benefits of education are not as evenly spread as perhaps one would like. In particular the gap between men and women is something that society should worry about and focus on.
But this is meant to be a scene setter; a picture in time. So, if this is what the picture looks like now, how can we expect it to change over time? It is this we turn to in the next chapter.
Education leads to more income for graduates, more tax for governments and societal benefits...
…but inequality and particularly gender gaps need to be watched

Citi GPS: Global Perspectives & Solutions July 2017
© 2017 Citigroup
34
2. How Will Demand for Education Evolve? The world has gone through a great expansion of education over the past two centuries, with literacy rates increasing in most countries. With benefits outweighing the costs of education as described in the previous chapter, it comes as no surprise that the global demand for education is expected to continue to increase over time (see figure below). Globally the number of people with no education is estimated to decrease from 0.8 million in 1970 to just over 0.4 million in 2050. It is also predicted that by 2050 only five countries in the world would have a rate of no education above 20% — these are Burkino Faso, Ethiopia, Guinea, Mali, and Niger.40
Figure 38. Demand for Education from 1970-2050
Note: Children under 15 are not yet classified – it is not yet known at this point what sort of education this group of people have attained. Source: Roser and Nagdy, Citi Research
Demand for Education in Different Countries The demand for education differs between countries and is affected by a number of issues such as population growth, government policies, income levels, costs of education, enrollment rates, etc. Demography in particular, directly affects student enrollments because the size of a younger generation cohort affects the number of future students. However student numbers also depend on access to education and student enrollment numbers. In some countries student population numbers for different education levels may decrease, however a rise in enrollment and entrance rates may offset this decrease or in some cases accelerate their growth.
To calculate the future demand for primary, secondary, and tertiary education, we use the population projections from the United Nations and calculate future enrollment numbers. Future enrollment rates in each of the education categories are extrapolated linearly on the basis of trends in each of the countries studied between the years 2000 and 2010. The only exception to this rule is secondary enrollment education in the U.S. which has remained flat over these years and therefore we assume that it will continue to do so for the next 15 years. India’s target for tertiary enrollment in 2030 is based on a government target of 50%, rather than extrapolated over the years. The results are presented in Figure 39 below.
40 Roser, M. & Nagdy, M. (2016). ‘Projections of Future Education’. Our World in Data. Retrieved from: https://ourworldindata.org/projections-of-future-education/
0
1
2
3
4
5
6
7
8
9
10bn Post Secondary Upper Secondary Lower Secondary
Primary Incomplete Primary No EducationUnder 15
Literacy rates have increased significantly over recent years
Demographics will play a big role in future demand for education

July 2017 Citi GPS: Global Perspectives & Solutions
© 2017 Citigroup
35
Figure 39. School Enrollment Rates (% of Population in that Age Group and Numbers in Millions)
Enrollment Rates (%) Primary % Secondary % Tertiary % 2010 2015 2030 2010 2015 2030 2010 2015 2030 U.K. 100% 100% 100% 99% 99% 99% 61% 62% 67% U.S. 100% 100% 100% 87% 87% 87% 93% 93% 93% Germany 100% 100% 100% 100% 100% 100% 57% 61% 74% China 100% 100% 100% 83% 100% 100% 23% 36% 58% India 100% 100% 100% 62% 71% 98% 18% 24% 50% Brazil 100% 100% 100% 86% 86% 86% 30% 37% 57%
Enrollment Numbers (millions) Primary Secondary Tertiary
2010 2015 2030 2010 2015 2030 2010 2015 2030 U.K. 5 5 6 5 4 5 3 3 3 U.S. 29 29 30 22 21 22 24 23 24 Germany 5 5 5 5 5 4 3 3 3 China 107 109 99 93 90 98 34 42 55 India 177 178 171 91 107 143 25 34 74 Brazil 24 22 20 18 18 15 6 7 10
Source: Citi Research calculations - 2010 figures from Lee, J.W. & H. Lee
Using the UN population statistics (median scenario) we calculate the net change in population by different school-age cohorts from 2015 to 2030 (Figure 40). It is estimated that in the U.K. all school-age cohorts (primary, secondary, and tertiary) will increase in 2030 when compared to 2015. We see a similar situation happening in the U.S. where primary and secondary age cohorts are expected to increase over the coming years; while the population aged 18-23 years old will decrease slightly in 2030 when compared to 2015 figures.
In China, India, and Brazil, the situation is different; population numbers in the different school-age cohorts are expected to decrease over time, with the exception of secondary-aged students in China and tertiary-aged students in India. However due to the expected increase in enrollment numbers in education in these countries, a reduction in population in these age cohorts has a limited effect. India is expected to see a huge increase in tertiary students — increasing from 34 million in 2015 to over 70 million in 2030. Reaching these numbers would mean the enrollment ratio for tertiary education would increase from 18% in 2010 to 50% in 2030. In China, the number of tertiary students is expected to increase by over 15 million in 2030 when compared to 2015 for total of 55 million. We also see an increase in students attending tertiary education in Brazil — rising from 7 million to 10 million in 2015 and 2030, respectively. The number of students attending secondary education is also expected to increase in both China and India, reflecting a nearly 100% enrollment ratio for people in that age group. It is important to note that the enrollment rates used are adjusted gross enrollment figures given by Lee and Lee. Adjusted gross enrollment figures are usually higher than net enrollment figures,41 therefore the results given in this analysis could be slightly inflated (see box below). We, however, think these adjusted gross enrollment rates closely track net enrollment rates.42
41 Gross enrollment ratio is constructed by dividing the number of all persons enrolled in a given school by the population of the age group that should be enrolled at a level according to national regulation. Net enrollment ratio is defined as the ratio of students in a designated age group at a given level of schooling to the total population of that age group 42 This is on the basis of two observations. The first is that there is very high densities of adult learners have previously attended school. Hence a disproportionate number of
The U.S. and U.K. both look to have increasing school-age cohorts out to 2030…
…while China, India and Brazil are expected to mainly see school-age cohorts decrease over time

Citi GPS: Global Perspectives & Solutions July 2017
© 2017 Citigroup
36
The estimates also do not reflect the international aspect of education and only estimate the domestic demand for education. Education is a global commodity with student mobility increasing over the years as described in more detail in the next section.
School Enrollment Definitions
Gross Enrollment Rate: The number of people enrolled in a given level of education divided by the total population of the age group that is officially associated with that level of education.
Net Enrollment Rate: The number of people enrolled in a given level of education that is of the official age-group for that level divided by the total population of that age.
Adjusted Gross Enrollment Rate: The number of people enrolled in a given level of education divided by the total population of that age adjusted such that those repeating a year of education are not counted.
Figure 40. Population by School Age Group, % Change 2030 vs. 2015 Figure 41. Student Numbers Based on Population and Enrollment Figures, % Change 2030 vs. 2015
Source: Citi Research calculations, Population numbers from UN Population Statistics (Median Scenario)
Source: Citi Research calculations
these learners are removed by adjusting for grade repetition. The second is to note that, for the economies we are looking at, Lee and Lee’s adjustment methodology both increases the covariance with UNESCO net enrollment measures, but also extensively reduces the divergence to, predominantly, within 1-2%.
-25
-20
-15
-10
-5
0
5
10
15
20
U.K. U.S. Germany China India Brazil
Pre-primary (0-4) Primary (5-11)Secondary (12-17) Tertiary (18-23)
-20
0
20
40
60
80
100
120
U.K. U.S. Germany China India Brazil
Primary Secondary Tertiary

July 2017 Citi GPS: Global Perspectives & Solutions
© 2017 Citigroup
37
Education as a Global Commodity Education has over the years become a global commodity traded across political and geographic boundaries. The global population of students who move to another country to study continues to rise reaching 5 million in 2014, and estimated to reach over 8 million students per year by 2025.43 Student mobility has increased over the years due to an increase in demand for tertiary education worldwide and the perceived value of studying at prestigious universities. It therefore comes as no surprise that the U.S. hosts the largest number of international students at the master’s and doctoral level, estimated at 26% of the total, followed by the U.K. at 15%.44 According to NAFSA, the Association of International Educators, there were over 1 million international students studying at U.S. colleges and universities who contributed over $32 billion to the U.S. economy and supported more than 400,000 jobs during the 2015-2016 academic year.45 Students from Asia represent more than half (53%) of the international students enrolled in master’s and doctoral programs in the various OECD countries.
Figure 42. Distribution of International Mobile Students in OECD Countries at Master’s and Doctoral Level by Source Country
Figure 43. Distribution of International Mobile Students in OECD Countries at Master’s and Doctoral Level by Destination
Source: OECD, Education at a Glance (2016), Citi Research
Note: Canada date refers to foreign instead of international students; Korea data year of reference is 2013. Source: OECD, Education at a Glance (2016), Citi Research.
43 University of Oxford (2015). International Trends in Higher Education 2015. University of Oxford, Oxford. 44 OECD (2016). Education at a Glance 2016: OECD Indicators, OECD Publishing, Paris. http://dx.doi.org/10.1787/eag-2016-en 45 NAFSA (2016). NAFSA International Student Economic Value Tool. Indiana University Office of International Services, Indiana.
Total from Asia
Total from Europe
Total from Africa
Total from Latin
America and the
Caribbean
Total from North
America
Total from Oceania
United States
United Kingdom
France
Germany
Australia
Canada¹Japan
Italy²Austria
Switzerland
Belgium Netherlands Korea²
Others
The global populati9on of students who move to another country to study is expected to rise to 8 million students by 2025

Citi GPS: Global Perspectives & Solutions July 2017
© 2017 Citigroup
38
Tertiary education is becoming more international through a number of schemes such as distance learning, offshore satellite campuses, and massive open online courses (MOOCs). The competition for international students is also heating up between different countries. ASEAN states are working to encourage domestic students to study in Asia rather than continue heading to western universities. They have established a ‘Common Space of Higher Education’ to encourage cross-border student mobility across Southeast Asia. Countries such as Australia and Canada are also gaining an important edge in student mobility.46 The race to attract international students requires universities to invest more to support recruitment, which requires investment in international staff support, investment in marketing, overseas representative offices, etc. There are a number of private companies such as Kaplan Inc. in the U.S., Navitas Ltd. in Australia, and INTO University Partnerships in the U.K. that are helping to support international recruitment in these countries.47
Government policies also make a huge difference to the international education market. For example, changes to the U.K. visa regulation have led to a reduction in the number of Indian students coming to the U.K. On the other hand the number of students coming from China to U.K. universities is predicted to increase by 44% over the next decade. At the moment it is not yet quite clear whether Brexit will have an effect on international student numbers in the U.K. Currently over 130,000 tertiary students (including postgraduate and research students) come from European Union (EU) countries equivalent to 28% of the total international students attending U.K. universities.48 EU students are offered the same deal as U.K. students, which include lower tuition costs when compared to non-EU students and access to tuition and maintenance grants. Competition for universities to attract overseas students remains stronger than ever. Due to their reputations, we believe renowned institutions such as Cambridge, Oxford, and Imperial College will continue to attract overseas students even if immigration policies get tougher for EU and overseas students — the question remains whether other institutions would continue to remain competitive or not.
Implications: Supply/Demand Imbalance Creates Pressure Points that Vary by Market In the first section we concluded that the benefits of education exceed the costs. Given this, it is no surprise to find that broad demand for education and educated people exceeds supply. There is good reason to suppose that this gap might continue to grow. There are two elements of under-supply. One is that there are simply not enough educational opportunities in absolute terms, and prohibitions and obstacles preventing more being provided. The second is that funding structures and capital requirements in particular, inhibit the ability of people to take opportunities that otherwise might be in their interest. Both mean that while social demand for education might be increasing, the supply of educational opportunities needed to fulfill this might not grow in conjunction.
46 University of Oxford (2015). International Trends in Higher Education 2015. University of Oxford, Oxford. 47 Kemp, N. (2016). The International Education Market: Some Emerging Trends. Center for International Higher Education, Number 85, pages 13-15. DOI: 10.6017/ihe.2016.85.9238 48 UK Council for International Student Affairs (2016). ‘International student statistics: UK higher education’. Retrieved from: https://institutions.ukcisa.org.uk/Info-for-universities-colleges--schools/Policy-research--statistics/Research--statistics/International-students-in-UK-HE/#
Competition for international students is heating up requiring universities to spend more on recruitment
Government policies such as visa regulations also affect demand and supply for international education

July 2017 Citi GPS: Global Perspectives & Solutions
© 2017 Citigroup
39
What is surprising, though, is the pattern of this supply/demand imbalance differs across markets largely driven by population trends – in developed markets we see greater pressure at the primary/secondary level, while in developing markets the greatest squeeze is likely to come at the tertiary level.
The challenge now is understanding the specific factors that are impacting the supply/demand imbalances. Only then can we consider potential solutions. It is the driver of the challenges we look at in more depth in the next chapter.
Citi GPS: Global Perspectives & Solutions July 2017
© 2017 Citigroup
40
3. What Are the Future Challenges for Education? With global demand for education estimated to increase over the next 10 to 20 years, it is important that the education system overcomes some of the challenges it currently faces. These include challenges stemming directly from demography, which we term ‘organic challenges, and disruptive challenges arising from the increase in technology and automation and its effect on jobs. We have already seen a number of jobs, such as financial traders or telemarketers in call centres, being replaced by automation. These displaced workers will need to be re-trained to ensure future employability and prevent them from leaving the labour market. Technological change is also a key demand driver of both the level and type of skills needed in the future. Many companies are already complaining that they are not able to find applicants with the skills that are needed to hire for open positions. The education system needs to change and adapt to ensure it can meet the demand of people needing to re-skill, while ensuring that students acquire the right skills needed in the workplace.
1. Organic Challenges Stagnating productivity, unsustainable and inadequate financing, and unequal access to education are some of the challenges facing the current education market. Demographic and secular trends (and to some extent automation and technology) will result in a significant surge in the demand for education. Meeting this demand does not necessarily mean building new schools, creating more classrooms, etc., but could ultimately mean improving the efficiency and productivity of the education system.
The future education productivity problem is about producing much higher student achievement with stable resources. Increasing educational productivity by doing more with less will not be easy. It will mean graduating a significantly greater number of students, with higher levels of skills and expertise at a lower cost per outcome. In many countries this is far from the current reality — many economies are spending large amounts of money on primary and secondary education, but are achieving mixed results, as discussed in the next section.
Demographic and secular trends will result in a surge in demand for education
Producing higher student achievement with stable resources is a key issue for the future

July 2017 Citi GPS: Global Perspectives & Solutions
© 2017 Citigroup
41
A. The Productivity Challenge: Primary and Secondary Schooling Investment at lower education levels remains crucial to cementing basic skills necessary to learn, and re-learn, more specific expertise later. The most widely used cross-national measure of such skills are PISA scores. These assess educational attainment at age 15 in fundamental areas such as literacy and mathematics.49 The literature shows that there is an ongoing, strong correlation between PISA scores and economic growth. A 50 point improvement in a country’s PISA score yields, on average, a 1% improvement in GDP per capita growth.50 However, among developed economies increased spending on primary and secondary education has little effect on such standards. The analysis shows that spending (public and private) above $6,500 per student (PPP-adjusted) results in a weak, negative cross-national correlation with PISA Scores (as shown in Figure 44).
The comparative returns on investment imply expanding school education spending per student can yield significant benefits when spending is initially low, however once spending is roughly $6,500 per student, the increased spending becomes relatively indeterminate. This analysis complements existing work by the OECD, which suggests a $5,500 average spend per student is optimal,51 with spending above this being relatively indeterminate compared to other factors, such as the quality of teaching.
Figure 44. Cross-National Total Public and Private Spending per Student and Average PISA Scores for High-Spending Countries per Student
Figure 45. Cross-National Total Public and Private Spending per Student and Average PISA Scores for Low-Spending Countries per Student
Source: OECD Education at a Glance (2016), OECD PISA Scores, Results in Focus (2016), World Bank (2016), Citi Research
Source: OECD Education at a Glance (2016), OECD PISA Scores, Results in Focus (2016), World Bank (2016), Citi Research.
49 Woessmann, L. (2014). The Economic Case for Education. EENEE Analytical Report No. 20, Prepared for the European Commission. European Expert Network on Economics of Education (EENEE). 50 Woessmann, L. (2014). The Economic Case for Education. EENEE Analytical Report No. 20, Prepared for the European Commission. European Expert Network on Economics of Education (EENEE). 51 OECD (2012). ‘Does Money Buy Strong Performance in PISA?’, PISA in Focus, No. 13. OECD Publishing, Paris. http://dx.doi.org/10.1787/5k9fhmfzc4xx-en
EST
PRT
KOR
ESP
NZL
SVNAUS
ISLFRA
FIN
DEUIRL
GBR
CANNLD
SWE
DNKBEL
AUTNOR
CHE
y = 0.0007x + 498R² = 0.0107
350
370
390
410
430
450
470
490
510
530
5000 7000 9000 11000 13000 15000 17000
PISA
Sco
re
Spending Per Student ($, 2011 PPP)
IDN
MEXTUR
HUN
CHL
LVARUS
SVK
POL
ISR
CZE
BRA
y = 0.0213x + 360.05R² = 0.8017
350
370
390
410
430
450
470
490
510
530
0 1000 2000 3000 4000 5000 6000 7000
PISA
Sco
res
Spending Per Student ($, 2011, PPP)
Excluding Brazil
There is a strong correlation between quality of education and economic growth…
...however increased spending becomes relatively indeterminate once spending hits $6,500 per student

Citi GPS: Global Perspectives & Solutions July 2017
© 2017 Citigroup
42
Contrary to the findings for high-spending countries, there are substantial opportunities for many middle income and developing economies to generate growth by investing more in primary and secondary education. The strong correlation, illustrated in Figure 45 above, suggests that if Indonesia, for example, increased its annual spending per student by $4,300 (PPP-adjusted) to roughly $5,400, from current levels of $1,130, the PISA score would theoretically improve by roughly 100 points, resulting in a potential boost to Indonesian economic growth (all else being equal) of 2 percentage points on a long-term basis.
Education, generally, is becoming increasingly important for development. Automation in manufacturing and global industrial overcapacity mean developing economies cannot rely on the manufacturing sector solely for growth and need to focus more on services than has been the case historically.52 This reaffirms education’s centrality in the development agenda. According to the International Institute for Applied Systems Analysis (IIASA), school populations in many of the world’s largest populations are approaching peak levels.53 Increasing per student spending offers an important path for many developing economies to improve their growth prospects. However, such a large number of potential students make this costly. We have modeled three scenarios to estimate the potential funding implications of changes in education demand.
Population Scenario: This illustrates the funding implications of changes in the school-age population with enrollment and funding per student fixed
Enrollment Scenario: This illustrates the funding implications of moving to the enrollment rate estimated in chapter 2 for future school-age cohorts. This combines the effect of a change in enrollment rates and the change in population illustrated in the population series, but assumes funding per student to be fixed.
Funding Scenario: This illustrates the funding implications of moving to a ‘sufficiently funded’ system ($6,500 per student) for future enrollment rates and future cohorts. This encapsulates the funding change, as well as changes in enrollment and population illustrated in the previous scenario.
Figure 46. Drivers of Change in Annual School Education Funding in 2030 (3 Scenarios)
Source: Citi Research
52 Woessmann, L. (2014). The Economic Case for Education. EENEE Analytical Report No. 20, Prepared for the European Commission. European Expert Network on Economics of Education (EENEE). 53 UN Population Department Estimates (2016). Retrieved from: https://esa.un.org/unpd/wpp/Download/Standard/Population/
-10%
-5%
0%
5%
10%
15%
20%
25%
30%
35%
40%
Brazil China Chile Indonesia Mexico India
Fund
ing
Cha
nge
as a
% o
f 201
2 G
DP
Population Enrollment Funding
Substantial opportunities exist with investment in primary and secondary education for middle income and developing economies

July 2017 Citi GPS: Global Perspectives & Solutions
© 2017 Citigroup
43
Figure 46 illustrates some interesting trends. Demographic trends in Brazil, China, Chile, and India will make it easier to increase both enrollment rates and financial resources per student, as the school-age population is expected to fall. Additionally, in Chile and Brazil there is already sufficient cash investment per student in these education systems, according to our models, to generate good returns on primary and secondary education. This is suggested in Figure 45 where both countries fall significantly below the PISA score that, cross-nationally, is associated with their respective level of per student school spending. However, a country like India has extensive capacity to generate economic returns by investing further in their school systems on a per student basis. The key challenge is securing financing. Just as we argued in our Citi GPS report ‘Infrastructure for Growth’,54 in many developing economies productive investment is held back by difficulties securing credit. In this context, demonstrating the best possible return on education is crucial, along with improving affordability and credit access.
Effective management is instrumental in converting increased spending into genuine educational improvement. Brazil has invested extensively in its education system, spending an average of 4.3% of its GDP annually.55 However, in the absence of effective management, the results have been disappointing. Despite spending almost $1,000 more per student (PPP-adjusted), the country actually achieves worse outcomes than the Chilean education system. Three factors are key in mediating the relationship between spending and educational outcomes, contributing to the relative inefficiency of Brazilian education:
High Grade Repetition Rates: Low grade repetition rates imply an efficient education system as, year-on-year, it implies most students are learning the material they are supposed to and can progress through the education system. In 2004, school grade repetition rates were estimated at 21% and 17.5% of total primary and secondary enrollment, respectively, in Brazil.56 While repetition rates did fall substantially in 2011, primary repetition rates were almost double the rate of Chile and roughly 32 times the rate in China.57
Teacher Absenteeism: Clearly, for an education system to function effectively, teachers have to turn up and do their job. If absenteeism rates are high, this suggests large quantities of money are being spent to employ people who are not actually contributing and improving educational outcomes. Brazil has a real problem with this. In a recent study in Pernambuco, Brazil found teachers in several towns to be absent 40% of the time.58
Poor Pedagogy: Teaching quality and techniques are poor, meaning that even when teachers are in the classroom, material is not being effectively imparted to children.59
54 Citi GPS & Channell, J. et al (2016). Infrastructure for Growth. New York, NY: Citi. 55 OECD (2017). Public spending on education. OECD Data. 56 United Nations Economic Commission for Latin American and the Caribbean (ECLAC) (2004). Progress Report on the Activities of the Programme of International Statistical Work for Latin American and the Caribbean, July 2003-June 2005. Chile: United Nations. 57 Ikeda, M. & Garcia, E. (2014). Grade repetition: A comparative study of academic and non-academic consequences. OECD Journal: Economic Studies, Vol. 2013/1. http://dx.doi.org/10.1787/19952856 58 Abadzi, H. (2007). Absenteeism and Beyond: Instructional Time Loss and Consequences. Policy research working paper series no: WPS4376. Washington, D.C.: World Bank. 59 Sandoval, L (2012): The effect of Education on Brazil’s Economic Development, global Majority e-Journal, Vol. 3, No. 1 (June 2012), pp. 4-19.
A country like India has extensive capacity to generate economic returns by investing further in the school systems
Management of education, in addition to investment is key to genuine educational improvement
Citi GPS: Global Perspectives & Solutions July 2017
© 2017 Citigroup
44
The Brazil example shows that good management is needed alongside robust funding. It can play a key role in making education more resource efficient and, subsequently, improving access to finance. This should also be the focus of many developed market school systems. Developing new forms of teaching that reduce repetition alongside new governance structures that improve accountability are likely to be the most effective means to improve school productivity.60 Though these are not without controversy, the latter, in particular, often excites opposition from the teaching profession. There are other solutions to improving the productivity of primary and secondary education – for example moving to competency-based learning. Please refer to the next chapter for more details.
B. The Productivity Challenge: Tertiary Education Effective use of resources is also a serious concern in the delivery of tertiary education. In the current environment of increasing tuition fees and shrinking public funds, a sense of urgency has emerged to better track the performance of tertiary educational institutions in the hope that their costs can be contained while not compromising the quality of education.61 In many countries the demand for tertiary education is expected to increase significantly over the next 15 to 20 years, as described in the previous chapter. Meeting this increase in demand will require universities and colleges to increase their output of graduates. Typically this would require larger classrooms, more teachers and, crucially, more financial resources.
To avoid becoming unaffordable in the face of growing demand, educational institutions will have to improve their productivity levels. This will not be easy. While difficult to measure, productivity in higher education appears to have proceeded at snail’s pace.62 Real costs have increased as the rest of the economy has become relatively more productive. Commonfund data,63 shown in Figure 47 shows that the costs of university provision in the United States have increased at almost twice the rate of consumer prices.
60 Woessmann, L. (2014). The Economic Case for Education. EENEE Analytical Report No. 20, Prepared for the European Commission. European Expert Network on Economics of Education (EENEE). 61 National Research Council (2012). Improving Measurement of Productivity in Higher Education. Panel on measuring higher education productivity: Conceptual Framework and Data Needs. 62 Bosworth, B. (2004). Productivity in Education and the Growing Gap with Service Industries. Paper delivered to the The Internet and the University Forum, Aspen. 63 Higher Education Price Index (HEPI) (2016). Commonfund. N.p.. accessed from the web, 4 February 2017.
Demand for tertiary education is expected to increase significantly in many countries
Productivity at educational institutions will have to improve to avoid unaffordability

July 2017 Citi GPS: Global Perspectives & Solutions
© 2017 Citigroup
45
Figure 47. Costs of Higher Education Services Provision in the U.S. (1993=100)
Source: Commonfund Higher Education Price Index (2016),64 Citi Research
Universities have suffered from ‘Baumol’s disease.’ This is the idea that universities have lower rates of productivity growth as the core elements of their service have not been fundamentally innovated or productively re-organized. Universities still employ, predominantly, the same technologies to teach students as they did fifty years ago. Professors teach or lecture students using means that would be fundamentally recognizable to a student from the 1950s. The implication is that, as the rest of the economy has become more productive, the costs of university have risen faster than inflation. Universities have to pay more for space, for professors and for other resources as these could have been put to, now, more productive use elsewhere in the economy. Staff costs have been especially important. Not only have wages gone up, but other benefits in kind such as healthcare and pensions have pushed up liabilities and forced costs up. However, universities cannot convert these, more expensive, inputs into degrees at any greater rate, as they still employ the same fundamental technologies and processes.
The net result is the cost of university education (as well as ancillary goods and services, e.g. textbooks and course materials) has increased at a much greater rate compared to the rest of the economy. University education has also, thus far, not proven easily scalable, with marginal costs increasing with expansion.65 This means the problem of cost could get even worse as student numbers continue to grow.
64 Higher Education Price Index (HEPI), (2016), Commonfund N.p., accessed from the web, 4 February 2017. 65 Wolf, A., Dominguez-Reig, G, & Sellen, P. (2016). Remaking Tertiary Education: can we create a system that is fair and fit for purpose? Education Policy Institute, King’s College London, London.
50
100
150
200
250
300
350
1983 1988 1993 1998 2003 2008 2013
Pric
e In
dex
(198
3=10
0)
Higher Education Price Index Consumer Price Index
The cost of university education has increased faster than the rest of the economy

Citi GPS: Global Perspectives & Solutions July 2017
© 2017 Citigroup
46
Even though returns for certain higher education degrees could be substantial, as described in a previous chapter, there comes a point when it becomes simply unfeasible to send more people to university on a cost basis. Annual tuition fees and room & boarding costs at a four-year private nonprofit undergraduate program are now about 75% of the median U.S. household income vs. 50% about 25 years ago. While public in-state programs are cheaper, accounting for about 34% of household income, out-of-state public programs amount to about 56% of household income. To realize the full benefits of education, productivity improvements will be needed; meaning a significantly greater number of students, with higher levels of expertise and skills, at a lower cost per student.66 McKinsey estimate that the U.S. needs to produce one million more post-secondary degrees by 2020. To achieve this goal without increasing public funding would imply an improvement in the average degree productivity of between 15% and 34% depending on which institutions need improvement — an overall average of 23%.67
Figure 48. U.S. Median Household Income vs. 4-Year Undergrad Tuition Fee and Room & Board
Source: Federal Reserve Economic Data, College Board, Citi Research
We see two factors that need to be taken into consideration when assessing productivity — completion and cost. Completion efficiency of tertiary education is a critical measure of the productivity of a particular education institution, together with the cost per number of full-time student equivalents. In the U.S., even though gross enrollment rates in 2010 were estimated at 93% for adults aged 18-23 years old, it does not mean that all of the students enrolled would actually attain a tertiary degree. In fact it is estimated that approximately 45% of people enrolled in a bachelor’s degree program would not finish the course that they started (OECD, 2014). Figure 49 below shows the only 46% of 24-34 year olds in the U.S. had
66 U. S. Department of Education. ‘Increasing Educational Productivity: Innovations Approaches & Best Practices.’ Retrieved from: https://www.ed.gov/oii-news/increasing-educational-productivity 67 McKinsey & Auguste, B. (2010). Winning by Degrees: The Strategies of Highly Productive Higher-education Institutions. McKinsey , Social Sector.
$0
$10,000
$20,000
$30,000
$40,000
$50,000
$60,000
$70,000
83-8
484
-85
85-8
686
-87
87-8
888
-89
89-9
090
-91
91-9
292
-93
93-9
494
-95
95-9
696
-97
97-9
898
-99
99-0
000
-01
01-0
202
-03
03-0
404
-05
05-0
606
-07
07-0
808
-09
09-1
010
-11
11-1
212
-13
13-1
414
-15
15-1
616
-17
Private Nonprofit Four-Year Public Four-Year Real Median Household Income
With university costs becoming a greater percentage of median household income, productivity improvements are needed
Completion and cost need to be taken into consideration when assessing productivity

July 2017 Citi GPS: Global Perspectives & Solutions
© 2017 Citigroup
47
attained some sort of tertiary education level in 2014. This is less than the U.K. and Japan, where nearly 50% and 60%, respectively, of 25-34 years olds attained a tertiary education. Given that tertiary skills are in greatest demand, education attainment needs to reach higher levels over the years.
Figure 49. Percentage of Adults With Tertiary Educational Attainment by Age Group in 2014
Figure 50. Percent of Graduates in 2015 by Gender
Source: OECD (2016), Citi Research Source: OECD (2016), Citi Research
It is also important that universities proactively manage the cost and the value of what they do; this means continuing to reduce their running costs while staying on top of their infrastructure investment and continuing to improve their teaching mechanisms, research capabilities, and other important services.68 Many reports on educational efficiency have focused on online learning as one of the potential solutions to reduce overall costs, as the cost of online courses is considerably less than physically attending courses at a university. PWC predicts that the connected education market will be worth almost $446 billion globally by 2020 ($205 billion in higher education), representing a 32% average annual growth rate over the period. However providing online courses is not the only solution; other solutions for improving productivity in tertiary education include reducing redundant costs, outsourcing a number of ancillary services, investing in short-cycle tertiary education, and vocational courses.69 These are discussed in more detail in the next chapter on solutions and opportunities.
C. Access to Education: A Growing Challenge Ensuring equal access to education is an extremely important social issue which needs to be tackled. One of the most pressing issues is educational equality at a school level. Education is sequential; without effective training at the primary and secondary level, access to good higher education is impossible. For example in India while nearly all children attend primary school, the gross enrollment rate for secondary students only stands at 63.5%.70 This affects the number of people that could attend tertiary education and is a huge loss for a nation that will soon have the largest and youngest workforce in the world.
68 Universities UK Modernisation and Efficiency Task Group & Diamond, I. et al (2011). Efficiency and effectiveness in higher education: A report by the Universities UK Efficiency and Modernisation Task Group. Universities UK, London. 69 Eyring H.C., (2011). Unexploited efficiencies in higher education. Contemporary Issues in Education Research, 4(7), 1-18. 70 UNESCO Institute for Statistics (2017). Retrieved from: http://uis.unesco.org/
0 10 20 30 40 50 60 70
25_34
55_64
25_34
55_64
25_34
55_64
25_34
55_64
25_34
55_64
DEU
DEU
JPN
JPN
ME
XM
EX
GBR
GBR
USA
USA
% of educational attainment 0 10 20 30 40 50 60 70 80
Men
Women
Men
Women
Men
Women
Men
Women
Men
Women
Men
Women
DEU
DEU
JPN
JPN
MEX
MEX
GBR
GBR
USA
USA
CH
NC
HN
% of graduates in 2014
Online learning is one of the potential solutions to reducing the cost of education
Education equality must be raised every school level

Citi GPS: Global Perspectives & Solutions July 2017
© 2017 Citigroup
48
Schools play a crucial role in guiding students on their abilities and prospect- building aspirations. In doing so, they reduce uncertainty, opening up access to higher education. In those countries suffering most from an absence of social mobility, school quality is often the most significant, singular mechanism that links individual parental background and child educational achievement. The literature shows that the socio-economic and school background have an effect on secondary school achievement (refer to Figure 51). ‘School effects’ illustrate the impact of less-effective schooling for those from poorer backgrounds. Individual effects refer to those factors that affect academic attainment that are outside the scope of the school system, i.e., differences in household environment. Generally, and especially in those countries with the lowest rates of social mobility, school effects are greater.
Access to higher education seems to be also independently affected by the level of parental education. A study undertaken by the OECD found that there is a strong correlation between parents with a tertiary education and the likelihood that their child would attend university. On average across almost all OECD countries, children of parents with a tertiary education were 30% more likely to go to university than children of parents with less than a secondary school education (see Figure 52).71
Figure 51. Comparative Individual, and School Effects Associated with Socio-Economic Background on Educational Attainment at a Secondary Level
Figure 52. Access to Tertiary Education: Difference in Probability of Attaining Tertiary Education Between Those with Tertiary Educated Parents and Those Without
Source: OECD (2010): Economic Policy Reforms: Going for Growth, Citi Research Source: OECD (2010): Economic Policy Reforms: Going for Growth, Citi Research
In developing countries, access to education also differs spatially especially between rural and urban areas. In India there are wide inequalities between different states and areas in terms of the number of colleges, institutions, and available infrastructure. The gross enrollment ratio for people attending tertiary education in rural communities was estimated at approximately 16.5%, while for urban communities it was more than double this, estimated at 39%. It is a similar story in China. According to 2010 Census Data, roughly 55% of all urban Chinese 25 year olds had attained upper secondary educational qualifications in urban areas, while only 18% of rural 25 year olds have achieved the same standard.72 Both countries will need to invest significantly in rural areas to generate ongoing human capital growth.
71 OECD (2010). Economic Policy Reforms: Going for Growth, pages 181-197. 72 Chang, F. et al. (2016). China’s looming human capital crisis: Upper secondary educational attainment rates and the middle income trap. Stanford Center for International Development, Working Paper No. 546.
-10
0
10
20
30
40
50
60
70
80
90
Stud
ent t
est (
PISA
) sco
re p
oint
diff
eren
ce Individual background effect School environment effect
0
10
20
30
40
50
60
70
80 Men, 35-44 years old
Women, 35-44 years old
School quality can be the most significant, secular mechanism to help with social mobility
There is a strong correlation between parents with tertiary education and the likelihood their child would attend university
There is also inequality in education opportunities between rural and urban areas

July 2017 Citi GPS: Global Perspectives & Solutions
© 2017 Citigroup
49
Access to Education: Gender and Ethnicity
In the U.S. and the U.K. women increasingly outnumber men on university campuses and outperform men throughout primary and secondary school.73 At the university level, women still outperform men, with 73% of women getting the highest grade levels, compared to 69% of men in the U.K. 74 Vincent-Lancrin (2008), writing for the OECD, shows that this is a cross-national trend among developed countries.75 Despite increasing numbers of women in tertiary education, there remains a significant gender gap in subjects studied, especially entry into STEM subjects. For example in the U.K., there are 13,000 more male students studying computer science than female students. In India, today, approximately 40% of the students in higher education are women. There has been significant improvement in women’s participation in higher education over the years — there were only 14 women for every 100 men in higher education in the early 1950’s. However women only constitute 11% of students in engineering and 4% in medicine in India.
Figure 53. Enrollment Ratio in Higher Education in India, by Gender Figure 54. Growth in Higher Education Attainment Among Adults (15-64), by Gender
Gross Enrollment Ratio Women Men Coefficient of inequality
1983-84 4.49 10.87 2.42 1987-88 5.37 11.82 2.2 1993-94 5.9 11.7 1.98 1999-2000 8 12.1 1.51 2004-05 10.4 14.8 1.42 2009-10 18.7 27 1.44
Source: Tilak (2015),76 Citi Research Source: Tilak (2015), Citi Research
Educational inequality by race also remains a key issue. In the United States, minority groups are over-represented in less selective tertiary institutions, and significantly under-represented in more selective universities. The same is true in the U.K., with minority groups being over-represented in the ‘post 1992’ universities compared to more established universities associated with higher graduate wages.77 Minority groups are also less likely to achieve a top degree classification in the U.K. — for example in 2012/13, 57.1% of U.K.-domiciled black, Asian, and other minority ethnic groups received a top degree with the highest grade levels , compared with 73.2% of white British students; a gap of 16.1%.78
73 Hillman, N. & Robinson, N. Boys to Men: The underachievement of young men in higher education – and how to start tackling it. Higher Education Policy Institute, HEPI Report 84. 74 Weale, S. (2016, May 11). UK’s university gender gap is a national scandal, says thinktank. The Guardian. Retrieved from: 75Vincent-Lancrin, S. (2008). The Reversal of Gender Inequalities in Higher Education: an Ongoing Trend. In Higher Education to 2030: Demography (Vol. 1, pp. 265–298). OECD Publishing, Paris. 76 Tilak, J. B. G. (2015). How Inclusive is Higher Education in India? Social Change, Vol. 45, pages 185-223. https://doi.org/10.1177/0049085715574178 77 Bhattacharyya, G., Ison, L. & Blair, M. (2003). Minority Ethnic Attainment and Participation in Education and Training: The Evidence. Department for Education and Skills London, Research Topic Paper No. RTP01-03. 78 Equality Challenge Unit. ‘Degree attainment gaps’.
0
2
4
6
8
10
12
1993-84 1987-88 1993-94 1999-2000 2004-05 2007-08 2009-10
% o
f adu
lts th
at h
ad h
ighe
r edu
catio
n Women Men
Women are increasingly outnumbering men in tertiary education but they tend to choose different areas of study
Racial inequality, as well as gender inequality, needs to be addressed in edcuation
Citi GPS: Global Perspectives & Solutions July 2017
© 2017 Citigroup
50
Access to Education: Income and Financing
Beyond schooling and family and ethnic background, the most pressing constraints for many students relate to financing. The growing upfront cost of higher education disproportionately discourages the poorest. Doyle (2016) noted that every $1,000 increase in fees typically drives down enrollment by 3%.79 Notably this seems to be driven predominantly by individuals from poorer backgrounds. Hemel and Marcotte (2011) noted, for example, that the effect of a cut in Pell Grant funding (a means-tested benefit) on enrollment was roughly twice that of an aggregate fee increase.80 This implies poorer students are much more price-sensitive compared to their wealthier counterparts.
While the wealthy are able to afford subsidizing their children’s higher education, for most the cost of higher education compared to average living costs renders this impossible. Despite this, students in many developed economies are able to access finance for tertiary education in some form or another. Poorer students remain discouraged, however, by a lower quantity of loss absorbing capital, greater subsequent risk, and a greater degree of uncertainty. The last implies an important difference between ex-ante and ex-post returns to education.81 Students borrowing to enroll in a course run the risk that they may not complete the course — this being the point at which most of the wage benefits are realized.82 This is true for all, but is especially true for those from low-income backgrounds. Less well-off students typically have less well-educated parents and less school support, meaning they have less guidance in evaluating this risk.
The effect of this is especially significant among the most elite tertiary education institutions. Typically, the more elite the institution, the greater the correlation between household background and enrollment composition. In the U.K., for example, Oxford, Cambridge, University College London, London School of Economics, and Imperial College have collectively the greatest proportion of students who are privately educated. Such children tend to be among the wealthiest 5% of the population, with the vast majority having graduate parents.83 Similarly, in the United States, the most prestigious private universities have recently been highlighted as performing particularly poorly as far as social mobility is concerned, however they are trying to respond to this (see box below). An advantaged student is twice as likely to get a place at one of these institutions compared to a student from a less well-off background.84
Furthermore, even when students from less privileged backgrounds win access to more elite academic institutions, they do not perform as well as their student peers. In the U.K., dropout rates are almost twice as high for those attending U.K. universities from the lowest socio-economic backgrounds, compared to the
79 Institute for Research on Higher Education, (2016). College Affordability Diagnosis: National Report. Institute for Research on Higher Education, Graduate School of Education, University of Pennsylvania. 80 Hemelt, S. & Marcotte, D. (2011). The Impact of Tuition Increases on Enrollment at Public Colleges and Universities. Educational Evaluation and Policy Analysis, Vol 33, Issue 4, pp. 435 – 457. https://doi.org/10.3102/0162373711415261 81 Altonji, J., Blom, E. & Meghir, C. (2012). Heterogeneity in Human Capital Investments: High School Curriculum, College Major, and Careers. Annual Review of Economics, vol. 4(1): 185- 223, 07. 82 Hungerford, T., & Solon, G. (1987). Sheepskin Effects in the Returns to Education. Review of Economics and Statistics, 69 (1): 175–177. 83 Sutton Trust (2010). Responding to the New Landscape for University Access. The Sutton Trust, London. 84 Jerrim, J., Chmielewski, A., & Parker, P. (2015). Socioeconomic Inequality in Access to High-Status Colleges: A Cross-Country Comparison. Research in Social Stratification and Mobility, 42: 20-32.
Financing of education is an important factor in the attainment of tertiary education
The is a correlation between the perceived quality of an institution and the household background and enrollment composition of its students
Students with less privileged backgrounds who do attend elite universities tend not to perform as well as their peers
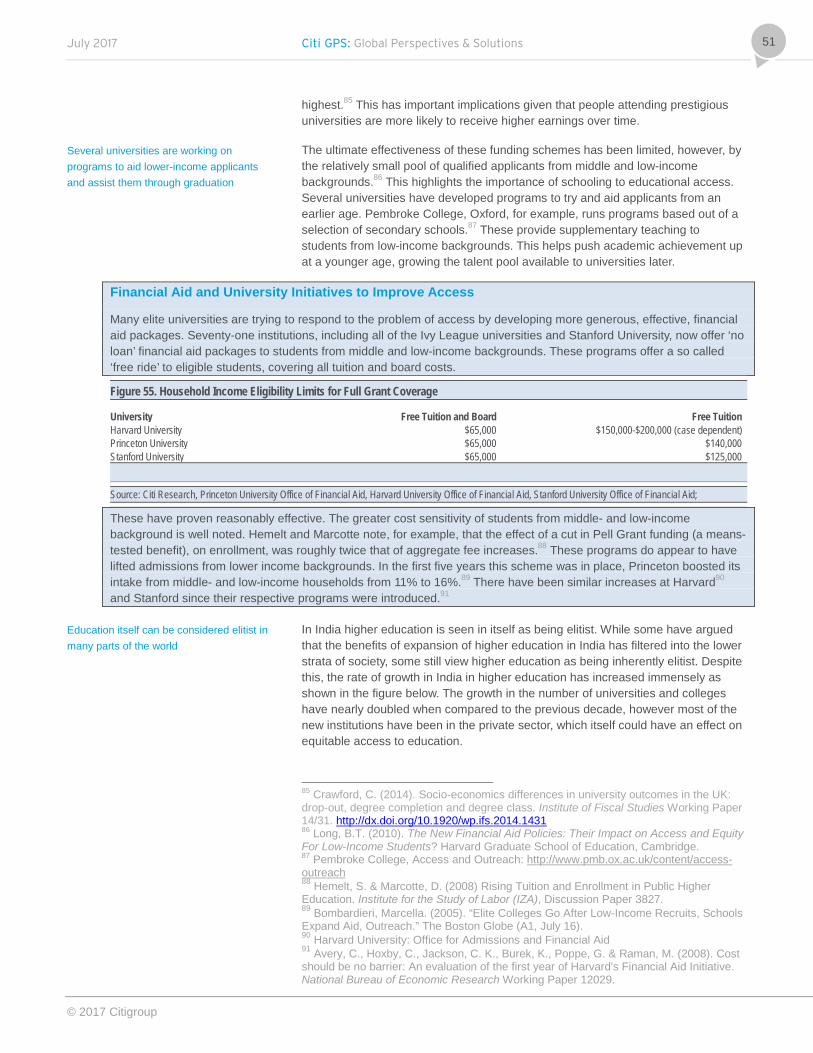
July 2017 Citi GPS: Global Perspectives & Solutions
© 2017 Citigroup
51
highest.85 This has important implications given that people attending prestigious universities are more likely to receive higher earnings over time.
The ultimate effectiveness of these funding schemes has been limited, however, by the relatively small pool of qualified applicants from middle and low-income backgrounds.86 This highlights the importance of schooling to educational access. Several universities have developed programs to try and aid applicants from an earlier age. Pembroke College, Oxford, for example, runs programs based out of a selection of secondary schools.87 These provide supplementary teaching to students from low-income backgrounds. This helps push academic achievement up at a younger age, growing the talent pool available to universities later.
Financial Aid and University Initiatives to Improve Access
Many elite universities are trying to respond to the problem of access by developing more generous, effective, financial aid packages. Seventy-one institutions, including all of the Ivy League universities and Stanford University, now offer ‘no loan’ financial aid packages to students from middle and low-income backgrounds. These programs offer a so called ‘free ride’ to eligible students, covering all tuition and board costs.
Figure 55. Household Income Eligibility Limits for Full Grant Coverage
University Free Tuition and Board Free Tuition Harvard University $65,000 $150,000-$200,000 (case dependent) Princeton University $65,000 $140,000 Stanford University $65,000 $125,000
Source: Citi Research, Princeton University Office of Financial Aid, Harvard University Office of Financial Aid, Stanford University Office of Financial Aid;
These have proven reasonably effective. The greater cost sensitivity of students from middle- and low-income background is well noted. Hemelt and Marcotte note, for example, that the effect of a cut in Pell Grant funding (a means-tested benefit), on enrollment, was roughly twice that of aggregate fee increases.88 These programs do appear to have lifted admissions from lower income backgrounds. In the first five years this scheme was in place, Princeton boosted its intake from middle- and low-income households from 11% to 16%.89 There have been similar increases at Harvard90 and Stanford since their respective programs were introduced.91
In India higher education is seen in itself as being elitist. While some have argued that the benefits of expansion of higher education in India has filtered into the lower strata of society, some still view higher education as being inherently elitist. Despite this, the rate of growth in India in higher education has increased immensely as shown in the figure below. The growth in the number of universities and colleges have nearly doubled when compared to the previous decade, however most of the new institutions have been in the private sector, which itself could have an effect on equitable access to education.
85 Crawford, C. (2014). Socio-economics differences in university outcomes in the UK: drop-out, degree completion and degree class. Institute of Fiscal Studies Working Paper 14/31. http://dx.doi.org/10.1920/wp.ifs.2014.1431 86 Long, B.T. (2010). The New Financial Aid Policies: Their Impact on Access and Equity For Low-Income Students? Harvard Graduate School of Education, Cambridge. 87 Pembroke College, Access and Outreach: http://www.pmb.ox.ac.uk/content/access-outreach 88 Hemelt, S. & Marcotte, D. (2008) Rising Tuition and Enrollment in Public Higher Education. Institute for the Study of Labor (IZA), Discussion Paper 3827. 89 Bombardieri, Marcella. (2005). “Elite Colleges Go After Low-Income Recruits, Schools Expand Aid, Outreach.” The Boston Globe (A1, July 16). 90 Harvard University: Office for Admissions and Financial Aid 91 Avery, C., Hoxby, C., Jackson, C. K., Burek, K., Poppe, G. & Raman, M. (2008). Cost should be no barrier: An evaluation of the first year of Harvard's Financial Aid Initiative. National Bureau of Economic Research Working Paper 12029.
Several universities are working on programs to aid lower-income applicants and assist them through graduation
Education itself can be considered elitist in many parts of the world

Citi GPS: Global Perspectives & Solutions July 2017
© 2017 Citigroup
52
Figure 56. Growth of Higher Education in India
Teachers Enrollment Gross Enrollment Universities Colleges ('000s) (Million) Ratio(%)
1950-51 28 578 24 0.17 1.5 1960-61 45 1,819 62 0.56 4.2 1970-71 93 3,277 190 1.96 4.7 1980-81 123 4,577 244 2.75 5.9 1990-91 184 6,627 271 4.4 8.1 2000-01 254 10,152 395 8.94 15 2010-11 559 32,964 2011-12 700 35,539 933.7 21.7 21.1
Source: Tilak (2015),92 Citi Research
Education is important for society and should therefore be available to everyone. Solutions need to be put in place by governments to ensure people that come from lower income backgrounds, rural communities, and others are not marginalized. There are a number of ways to improve access to education for all. Government policies that provide adequate finance to students can reduce some of the uncertainty associated with taking on a degree, as repayments are linked to future earnings. Other solutions involve improving the infrastructure of education in rural communities and investment in new technologies that can aid the distribution of good quality education.
D. Finance and Education Many countries provide direct public support for primary, secondary, and tertiary educational institutions. Governments have over the years come to realize that they need to invest in all sections of the education system to ensure that the necessary skills for the economy are available.
Philip Hammond, the Chancellor of the U.K. in his 2017 budget document stated that ‘Weaknesses in the U.K.’s skills base have contributed to its longstanding productivity gap with France and Germany’. It therefore comes as no surprise (especially in lieu of Brexit) that the Chancellor has allocated £500 million per year to improving and extending technical courses in subjects such as engineering, manufacturing, and social care. This is in addition to the £320 million dedicated to creating more than 70,000 new places at schools which are independent of local authorities.
Governments also provide backing for student loan financing for tertiary education. For example, 19 OECD countries now run state-backed student loans, compared to 16 in 2014 and all have seen dramatic growth in user numbers. There is however a growing concern on the sustainability of these public programs. Taking the U.K. as an example, 92% of all university students currently take government-backed loans.93 Even though the U.K. government makes a good return on investment on tertiary education (refer to chapter 2), it still has to provide loans upfront. The Institute for Fiscal Studies estimates that the annual capital requirement needed in the U.K. is £12 billion. It remains to be seen whether in a budget constrained environment, developed economies can sustain this kind of upfront support.
92 Tilak, J. B. G. (2015). How Inclusive is Higher Education in India? Social Change, Vol. 45, pages 185-223. https://doi.org/10.1177/0049085715574178 93 Sutton Trust (2010). Responding to the New Landscape for University Access. The Sutton Trust, London.
Governments have realized the need to invest in all sections of the education system to ensure the necessary skills for the economy are available
State-backed student loans are used in 19 OECD countries, up from 16 in 2014

July 2017 Citi GPS: Global Perspectives & Solutions
© 2017 Citigroup
53
Currently many schemes offer students a discounted interest rate. Denmark, Sweden, Australia, and Korea all provide financing at rates well below ordinary consumer financing rates, with student loan rates between one and three percent.94 Additionally, many schemes use income-backed repayment structures with substantial built-in ‘loan forgiveness’. ‘Income Contingent’ student loans are used in the United States, the U.K., Australia, and the Netherlands. These schemes link repayment to earnings. This means that when students do not have a sufficient income, they do not pay off their loans. In the U.K., two-thirds of all students are now expected not to pay off their student loan in full.95 The implication of this is that the government is providing a £17,000 subsidy to graduates on average, meaning the government could potentially lose £5.2 billion of the £11-£12 billion it provides annually in student financing.96
Expansion in education demand and increasing public credit constraints, render a system that is less state-dominated more likely. Increasing the opportunity for private providers to invest capital alongside the state could alleviate problems with government credit constraints. This may prove valuable in the context of developing economies too. Brazil, for example, has been forced to significantly cut back its public student loan program as a result of budgetary pressures, halving the number of loans.97 In OECD countries private sources of expenditure on primary, secondary and post-secondary education averaged less than 10% of the total, this increases to 30% for tertiary education. In the U.S. over 60% of expenditure on tertiary education comes from private investment, however only 8% of the total spent on primary, secondary and post-secondary non-tertiary education comes from private sources.
Figure 57. Share of Private Expenditure on Educational Institutions (2013)
Note: Canada data year of reference is 2012 Source: OECD Education at a Glance, 2016, Citi Research.
94 OECD (2016), Education at a Glance 2016: OECD Indicators, OECD Publishing, Paris 95 Tetlow, G. (2016, April 27). Two-thirds Of UK ‘students will never pay off debt’. The Financial Times. Retrieved from: https://www.ft.com/content/55f4a6f6-3eab-11e6-9f2c-36b487ebd80a?mhq5j=e3 96 Crawford, C., Crawford R. & Jin, W. (2014). Estimating the public cost of student loans. Institute for Fiscal Studies, IFS Report R94. 97 "Eisenhammer, S. (2016 January 17). Dreams of Brazil’s youth fade as student loans cut. Reuters. Retrieved from: http://www.reuters.com/article/brazil-education-idUSL2N14V295
01020304050607080
Primary, Secondary and Post-Secondary Non-Tertiary Education
Tertiary Education
Investment schemes for tertiary education vary greatly from country to country
Increasing the support of private providers to invest alongside the state could alleviate issues with government credit constraints

Citi GPS: Global Perspectives & Solutions July 2017
© 2017 Citigroup
54
Currently, the private and corporate sectors play a minimal role in educational programs in many countries and they do not yet play an influential role in improving global education systems — a role which it has successfully assumed in other arenas such as global health. In fact corporations nowadays invest 16 times more in global health than in global education.98 The main challenge to private funding for education is the fact that education is considered a public good. Investors usually shy away from investing in public goods due to unknown risk and potential political hurdles that can need to be overcome. In some cases it is also difficult to ascertain with any certainty the return of investment from a public good such as education.
Education investment opportunities are largely at an early stage and small scale and there is also a lack of diverse opportunities in the business. However, the good news is that in countries like the U.S., private equity firms are recognizing the investment opportunities and potential significant growth in the education market. A study in 2013 found that over 260 U.S private equity firms have made significant investments in education-related companies.99 Some of the most active firms in this sector are specialized non-profit ventures such as CharterSchool Growth Fund and Silicon Valley Social Venture Fund. For-profit funds included Quad Ventures, Palm Ventures, Leeds Equity Partners, and others. The EdTech space is also attracting many large companies who are investing in new technology-enabled services and products such as Apple, Google, Microsoft, and Amazon. It is estimated that more than $3.1 billion100 was invested in EdTech in 2015 alone and according to Tech Crunch101 the market is expected to reach $252 billion globally by 2020.
Additionally, there are growing opportunities for corporates to provide financial support to educational institutions on a more involved close-knit basis. Corporate funding for research and development purposes is already a well-established practice. Several corporates have invested heavily in tertiary institutions specifically for skills development. For example, Google is investing in Trinity College, Dublin, to develop digital skills which the company sees as being in short supply.102The Audi Corporation has supported over 100 PhD’s at the Technical University of Munich on advanced research relevant to the company — 80% of which went to work for the company. Going forward, such corporate investment could be an increasingly important source of funding for educational institutions.
There are several possibilities for private investment in education. Private capital, operating alongside government funding, could play an increasingly prominent role in financing education. Encouraging private engagement could also help foster financial innovation. Education will likely become more varied and dynamic which will require financial support. A more responsive and innovative education finance market could also complement the development of new vocational training structures. This will be especially important to adult education especially in lieu of the risk of automation replacing jobs as described in the next section.
98 Winthrop, R., Bulloch, G., Bhatt, P., & Wood, A. (2013). Investment in Global Eduation: A Strategic Imperative for Business. The Center for Universal Education at the Brookings Institution, Washington, D.C. 99 Leventhal, M. & Tang, I. (2013 October 14). A Sector of Interest: Institutions & Schools, Private Equity for Education. Equity for Education. Retrieved from: 100 Kovalskys, G. (2016, June 24). Here’s why the Big Four’s investment in education are great for ed-tech entrepreneurs. Recode. 101 Bainbridge, D. (2016, August 13). Edtech is the next fintech. Tech Crunch. Retrieved from https://techcrunch.com/2016/08/13/edtech-is-the-next-fintech/ 102 RTE (2016 May 13). Experts call for investment in digital skills in schools. RTE. Retrieved from: https://www.rte.ie/news/2016/0513/788107-digital-education-skilss/
Corporations currently invest 16x more in global health than in global education
Private equity firms are starting to recognize the investment opportunities and potential growth in the education market
Encouraging private investment could help foster financial innovation

July 2017 Citi GPS: Global Perspectives & Solutions
© 2017 Citigroup
55
2. Disruptive Challenges In our ‘Technology at Work’ GPS report, we reported that 47% of the U.S. workforce is at risk of automation. In the report, Carl Frey and Michael Osborne state that no single industry is completely immune to the expanding scope of automation and technology — even relatively skilled workers such as in finance and insurance are susceptible to automation. The adoption of automation and technology is also changing the skill mix needed in different occupations, i.e., technological changes will call for a different type of health worker. In fact O*NET have identified a number of new and emerging jobs in the health sector such as clinical data managers. The rise in digital healthcare is also fuelling demand for specialized skills in this sector103.
We are currently not prepared for such a change. Go-ON UK, a leading digital skills charting, state that in the U.K. over 12 million people do not have the adequate skills to prosper in the digital era. This is not only a U.K. problem as there is currently a mismatch and a shortage of skills needed in many countries. The challenge for the education and training sector is to ensure that students are taught the right skills needed for future employment. It is also important, especially in the digital era, that people regularly re-train to ensure that they are constant re-learning during their working life.
The Impact of Automation and Technology on the Workforce
There have been many studies that have analyzed the impact automation and technology could have on the current and future workforce in different economies. The most cited is the paper written by Carl Frey and Michael Osborne who have stated that 47% of the U.S. workforce could be susceptible to automation. Subsequent studies put the equivalent figure for Britain at 35% and Japan at 49%. The study used an occupation-based approach where whole occupations could be automated by technology. Their methodology has been used by many different studies. For example in our ‘Technology at Work v2.0’ report we used data from the World Bank Group to highlight a number of developing countries susceptible to automation (See figure below).
103 Citi GPS & Oxford Martin School (2015). Technology at Work. New York, NY: Citi.
47% of the U.S. workforce is likely to be at risk from automation
Globally, there is a mismatch and shortage of skill needed
Outside the U.S., the level of risk varies

Citi GPS: Global Perspectives & Solutions July 2017
© 2017 Citigroup
56
Figure 58. Developing Countries Susceptible to Automation
Source: Citi GPS; World Bank Development Report 2016; based on Frey and Osbourne (2013) methodology
Arntz et al. (2016) in their study called ‘The Risk of Automation for Jobs in OECD Countries’ use a different approach to Frey and Osborne — they use a task-based approach in their analysis which reflects the heterogeneity of workers’ tasks within occupations (Figure 59).

July 2017 Citi GPS: Global Perspectives & Solutions
© 2017 Citigroup
57
Figure 59. Percent of Workforce Susceptible to Automation (Based on Different Studies)
Country Frey & Osborne, (2013) 702
occupations
Frey & Osborne; Deloitte (2014) 369
occupations
Brugel (2014) 22 occupations
Arntz, Gregory and Zierahan, (2016) Job
Tasks
World Bank Group (2016)- adjustment w/
technological feasibility & adoption time
World Bank Group (2016)- w/o adjustment
Austria 54% 12% Argentina 65% 65% Belgium 50% 7% Canada 9% China 55% 77% Czech Republic 54% 10% Denmark 50% 9% Estonia 54% 6% Finland 51% 7% France 50% 9% Germany 51% 12% Ireland 49% 8% Italy 56% 10% Japan 7% Korea 6% Netherlands 49% 10% Norway 10% OECD 57% 57% Poland 56% 7% Slovak Republic 55% 11% Spain 55% 12% Sweden 47% 7% Thailand 52% 72% UK 35% 47% 10% USA 47% 9%
Source: Citi Research
According to Frey and Osborne (2013), the susceptibility to automation and computerization varies substantially between different industries (refer to the figure below). For example, 86.7% of workers in the accommodation and food industry could be at risk of automation, while only 10% of workers in information are at risk.104 In our ‘Technology at Work v2.0’ report, we highlight a number of industries and jobs where automation is already having an effect — for example casual dining operators have increased automation through the use of table-top tablet systems. In the media sector, the Associated Press is already using natural language processing systems to produce hundreds of reporting pieces, whilst cognitive diagnostic engines such as IBM Watson are already being used in hospitals for diagnostic purposes.
104 Frey C. B. & Osborne, M. A. (2013). THE FUTURE OF EMPLOYMENT: HOW SUSCEPTIBLE ARE JOBS TO COMPUTERISATION? Oxford Martin School, University of Oxford, Oxford.
Risk of automation also varies greatly based on industry and job

Citi GPS: Global Perspectives & Solutions July 2017
© 2017 Citigroup
58
Figure 60. Employment Share at Risk by Industry
Low Risk % Medium Risk % High Risk % Accommodation & Food 2.8% 10.5% 86.7% Administrative & Support Services 1.6% 38.2% 62.2% Agriculture, Forestry, Fishing & Hunting 75.6% 12.0% 12.3% Arts, Entertainment & Recreation 47.9% 12.5% 39.6% Construction 21.6% 19.8% 58.6% Education Services 63.1% 19.7% 17.2% Finance & Insurance 28.9% 17.3% 53.7% Government 46.2% 30.6% 23.2% Health Care & Social Assistance 39.4% 25.0% 35.6% Information 51.6% 38.3% 10.1% Management of Companies & Enterprises 82.8% 6.2% 11.0% Manufacturing 19.9% 18.4% 61.7% Mining, Quarrying, AND Oil & Gas Extraction 7.8% 46.3% 45.9% Other Services (ex-Public Admin) 44.9% 24.7% 30.4% Professional, Scientific & Technical Services 54.0% 10.9% 35.1% Real Estate and Rental & Leasing 0.7% 32.0% 67.2% Retail Trade 14.5% 18.9% 66.6% Self-Employed 60.4% 8.9% 30.7% Transportation & Warehousing 5.5% 19.4% 75.0% Utilities 40.3% 27.8% 31.9% Wholesale Trade 15.9% 18.4% 65.7%
Source: Frey and Osborne, Citi Research
Arntz, Gregory and Zierahn (2016)105 show that education — in particular the education structure of the workers — seems to play a large role in what jobs are automated. They state that countries with a strong focus on highly qualified workers typically have lower shares of workers that are at risk of automation. ‘Automatibility strongly decreases in the level of education and the income of the workers’. Therefore to sustain employment rates and to ensure a tolerable degree of equality in society, they believe governments need to significantly expand education access or provide retraining opportunities to the current workforce to allow people to leapfrog and side-step oncoming automation.
In recent years, it has been those in the middle of the income distribution, with non-academic skills, that have suffered the most in income terms as a result of automation.106 Providing these individuals with the means to participate and work with new technology, rather than moving into lower skilled jobs, will improve aggregate equality and economic productivity. As automation becomes increasingly pervasive and technology falls in cost, this will become increasingly crucial. There is a real risk, based on current trends that a large cluster of workers in low-skilled work develops at the bottom of the income distribution. Subsequent technological developments will likely only push wages down for these workers. Education is crucial in avoiding this trap. The current education system needs to be able to adapt and produce the skills that are needed for future employment. Investment in retraining workers is also a must. Both will be crucial to ensuring workers can participate and work with technology, rather than finding themselves trapped underneath it.
105 Arntz, M., Goregory, T. & Zierahn, U. (2016). The Risk of Automation for Jobs in OECD Countries: A Comparative Analysis. OECD Social, Employment and Migration Working Papers, No. 189. http://dx.doi.org/10.1787/5jlz9h56dvq7-en 106 Acemoglu, D. & Autor, D. (2012). What Does Human Capital Do? A Review of Goldin and Katz’s The Race between Education and Technology. Journal of Economic Literature 2012, 50:2, 426-263. DOI10.1257/jel.50.2.426
Education seems to play a large role in what jobs are automated
In coming years, there is a real risk that low-skilled workers will be hit hardest by automation

July 2017 Citi GPS: Global Perspectives & Solutions
© 2017 Citigroup
59
Figure 61. Share of People with High Automatibility by Education Figure 62. Share of People with High Automatibility by Income
Source: Arntz, M., T. Gregory and U. Zierahn (2016), Citi Research Source: Arntz, M., T. Gregory and U. Zierahn (2016), Citi Research
Skills Needed for the Current and Future Workforce
Technology and automation are changing the skills that are needed in the workforce. The education system is currently being criticized for not providing these needed skills for the current workforce. In fact the Economist Intelligence Unit stated in a recent report that only 34% of executives they surveyed are satisfied with the level of education and skill-attainment of young people entering their workforce. A staggering 52% confirmed that a skills gap is actually affecting their organization’s performance. According to the U.K. Commission for Employment and Skills, 22% of job vacancies in 2013 were not filled because of the lack of appropriate skills and training.107 The challenge for the education and training sector is to ensure that students leave with skills that are relevant for areas that are needed in the current and future labor market and the economy as a whole.
In our ‘Technology at Work v2.0’ we reported that many countries have long-standing problems along both these dimensions. In fact many students feel that their current skills are being underutilized, while at the same time employers are struggling to find the appropriate skills needed for their workforce (see figures below taken from our Technology at Work V.2 publication). Part of the problem may be that many educational institutions are compelled to follow a particular curriculum which does not reflect ‘21st century skills’ needs.108
107 Harding, A. H. (2015 March 6). Back to School: The Importance of Adult Learning. HuffPost UK. Retrieved from: http://www.huffingtonpost.co.uk/andrew-h-harding/back-to-school-the-import_b_7468792.html 108 The Economist (2015). Driving the skills agenda: Preparing students for the future. An Economist Intelligence Unit Report, sponsored by Google. The Economist Intelligence Unit, London.
0%
10%
20%
30%
40%
50%
60%
70%
80%
90%
100%
France Germany Sweden UnitedKingdom
UnitedStates
% o
f Wor
kers
at E
ach
Educ
atio
n Le
vel
with
Hig
h Au
tom
otib
ility
Primary Education Lower SecondaryUpper Secondary Post-Secondary, Non-TertiaryTertiary
0%
5%
10%
15%
20%
25%
30%
35%
France Germany Sweden UnitedKingdom
United States
<10% 10%-25% 25-50% 50%-75% 75-90% 90-100%
Lack of skills for job vacancies is a growing problem and a challenge for education

Citi GPS: Global Perspectives & Solutions July 2017
© 2017 Citigroup
60
Figure 63. Rates of Graduate Skill Underutilization 2005 and 2010 Figure 64. Skills Shortage and Mismatch
Source: European Working Conditions Survey 2005 and 2010, Citi Research. Notes: Graduate only. Underutilised defined as those who report they have skills to cope with more demanding duties
Source: Hays Global Research, Citi Research; Notes: Each element of the index scored out of 10.
It is also rather difficult to understand the types of future skills that are needed especially in a world where technology is changing at such a fast pace and affecting everything we do — from the way we communicate with others to the job tasks at our workplace. One obvious choice would be for educational institutions and students to focus on classical STEM subjects given that the rate of returns from the investment in these subjects are amongst the highest as described in a previous chapter. In ‘Technology at Work v2.0’ we suggest that the Information Technology sector should continue to create new employment opportunities including: security analysts, data scientists, cloud architects, and the implementation and analysis of the Internet of Things. Robots will replace jobs but also generate new jobs for engineers and technicians. More broadly, in the EU it is estimated that there will be job openings in all sectors with additional jobs estimated at over 9.5 million and replacement jobs at 98 million between 2013 and 2025. In the U.S. the largest number of job openings is predicted to be in the health sector (> 4 million). New jobs are also needed in the green and industrial sectors. However, even the skills set needed by traditional jobs such as medical practitioners and engineers have changed over time. Other solutions include teaching students skills that are difficult to automate. For example human creativity, originality, and service orientation (i.e., actively looking for ways to help people) are skills that are difficult to automate. However, they are also skills which are not particularly taught in schools.
In the U.S., federal and state governments, industry, and education partners are working together to consolidate the best practices in teaching relevant skills to the workforce of tomorrow. The Partnership for 21st Century Learning (as the organization is known) has already highlighted a number of areas and skill sets to ensure that students graduate with the right skills needed. These include:
Learning key subjects such as English, reading, language skills, mathematics, economics, sciences, etc.
Promoting an understanding of academic content at much higher levels which include key subjects such as global awareness, financial and business literacy, civic literacy, health literacy, and environmental literacy;
0%
10%
20%
30%
40%
50%
60%Be
lgiu
mBu
lgar
iaC
roat
iaC
zech
Rep
ublic
Den
mar
kEs
toni
aFi
nlan
dFr
ance
Ger
man
yG
reec
eH
unga
ryIre
land
Italy
Latv
iaLi
thua
nia
Luxe
mbo
urg
Mal
taN
ethe
rland
sN
orw
ayPo
land
Portu
gal
Rom
ania
Slov
akia
Slov
enia
Spai
nSw
eden
Uni
ted
King
dom
% o
f rat
es o
f gra
duat
e sk
ill u
nder
utili
zatio
n 2005 2010
0
2
4
6
8
10
12
U.S
.
Spai
n
Japa
n
U.K
.
Italy
Swed
en
Den
mar
k
Aust
ralia
Net
herla
nds
Ger
man
y
Talent mismatchEducation inflexibilityWage pressure in high skill industries
Identifying the skills that will be needed in the future is difficult, although health care is cited and IT as areas of growth

July 2017 Citi GPS: Global Perspectives & Solutions
© 2017 Citigroup
61
Learning and innovation skills such as creativity, innovation, critical thinking, and problem solving;
Information and media and technology skills, e.g. ICT literacy; and
Life and career skills, i.e., flexibility and adaptability, leadership, productivity, and accountability, etc.
Implications: Obvious Challenges, Not So Simple Solutions We have identified two main groups of factors that will impact demand for education in the future.
The first group is loosely organic and relates principally to the impact of changing demographics across the world. The second group is inorganic and largely driven by the disruptive challenges arising from changes in the workplace in particular from automation.
In principle the solutions to these problems are quite straightforward. For the former the solution is clearly to be found in greater access to education but also increased productivity.
For the latter, it is more about changing attitudes to learning – making sure that, as much as possible, students are getting the right skills in the first place, but also making sure that there is infrastructure in place to help people reskill when disruption occurs.
But while these prescriptions seem simple at an abstract level, in practice solving these challenges is a lot more complex. In the next section we look in a lot more depth at what needs to be done in order to make education ‘fit for purpose’ from a bottom-up perspective.

Citi GPS: Global Perspectives & Solutions July 2017
© 2017 Citigroup
62
4. Making Education Fit for Purpose: Potential Solutions to Future Challenges As we have seen, the challenges facing education are many and varied. In some cases the education system is failing to prepare society for tomorrow’s challenges. In some other instances the system has failed at preparing them even for today’s challenges. In many other cases the system itself is a constraint against individuals achieving their full potential. The common underlying themes here are (lack of) access, personalization, engagement, flexibility, efficiency, and productivity. A harsher analysis might conclude that the education system is not fit for purpose.
While there is no silver bullet, we do believe none of these challenges are insurmountable. In low- and middle-income countries we need to start at the beginning — focus on both enrollments and outcomes. While supply-side interventions such as building more schools and hiring quality teachers are certainly important, equally critical are strategies to induce demand. Apart from conveying information on the long-term benefits of education, efforts need to be made towards reducing the opportunity cost to less well-off families of sending their children to school. All this will require resource mobilization along the lines of current efforts dedicated towards the health and infrastructure sectors. Governments, private households, international bodies, and private institutions all have a role to play.
More developed regions have managed to offer all of their citizens the opportunity to participate in the education process, but outcome levels have stagnated in several countries. While education has typically been mass produced, there is a growing realization that the learning experience needs to be tailored around an individual’s unique abilities. Further, once out of college, many struggle to convert the knowledge they acquired into skills relevant in the job market. Continuous knowledge acquisition and skill upgrades, which will be required in a world increasingly disrupted by technology, are a challenge for working professionals due to the rigid structure of the traditional education system. We think of these more as second-order challenges where more of the same (money, manpower, and physical resources) is unlikely to yield satisfactory results. While some of these issues can be solved simply through greater coordination between the existing stakeholders, other challenges demand greater personalization, flexibility, efficiency, and productivity from the education system. We believe education technology (EdTech) can be a major enabler.
Thus, we start this section by considering demand and supply interventions to improve enrollments and outcomes in low and middle-income countries, i.e. the first order solutions. We then look at how all this can be financed including the nature of the student debt problem.
Before moving on to second order solutions, we introduce the role of technology in education which, we believe, can enable greater personalization and thus drive an improvement in stagnating outcome levels. We then consider the potential for smoothening the transition from education to employment and also look for ways of promoting and facilitating lifelong learning — an imperative in a world where the half-life of knowledge is fast declining.
Low- and middle-income countries need to start focusing on both enrollment and outcomes
Continuous knowledge acquisition and skills upgrades can help combat jobs lost to technological change

July 2017 Citi GPS: Global Perspectives & Solutions
© 2017 Citigroup
63
Demand and Supply Side Interventions Delivery and attainment of high quality education is determinant on several factors including a household’s ability to cover the cost of schooling, the proximity of the school to the place of residence, the availability and quality of teachers, a child’s health and nutritional status, and the opportunity cost of sending a child to school. First order solutions are aimed at meeting these challenges.
Interventions aimed at improving enrollment and learning outcomes have typically focused on supply side investments such as increasing the supply of physical infrastructure, hiring a greater number of teachers, and increasing the supply of learning materials. Of late there has also been increasing attention on the demand side including reducing the cost of education, increasing the child’s preparedness for education, and providing greater information to children and parents on the benefits of education. Below we consider a variety of such interventions, propounded by 3ie, aimed at improving primary and secondary enrollment and learning outcomes in developing countries.
Figure 65. Demand and Supply Interventions in Education
Source:3ie
We look at a variety of interventions aimed at improving primary and secondary enrollment and learnings outcomes in developing countries
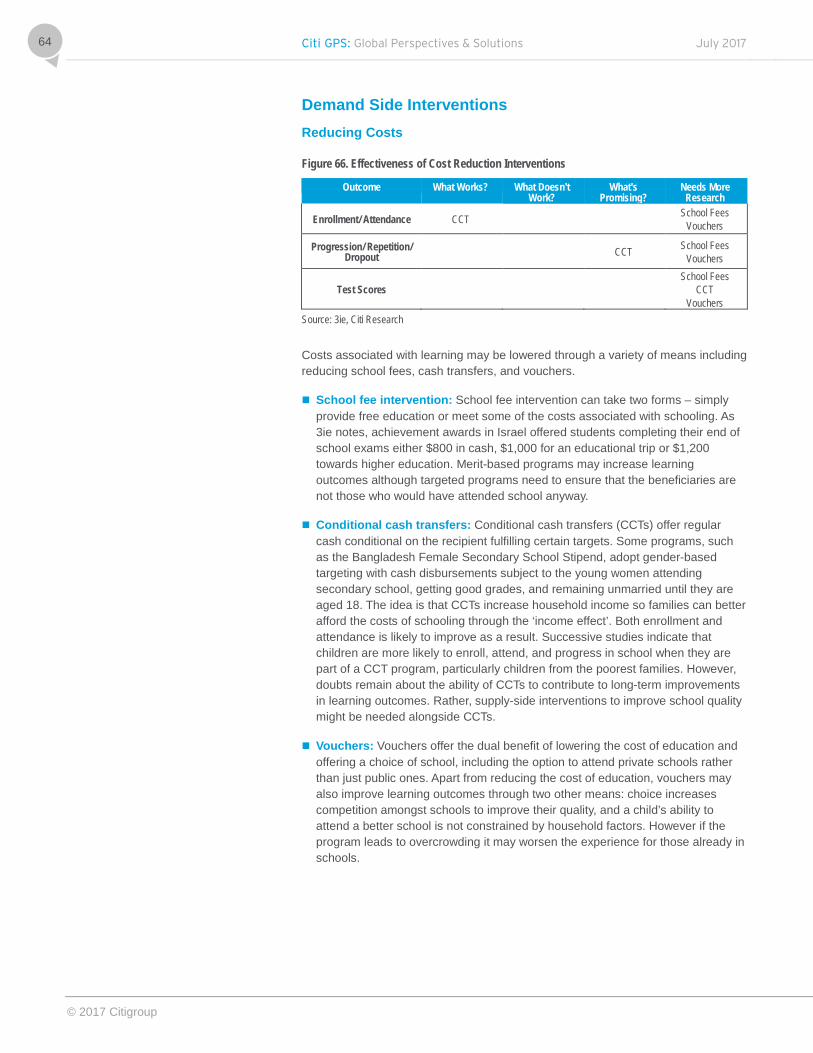
Citi GPS: Global Perspectives & Solutions July 2017
© 2017 Citigroup
64
Demand Side Interventions Reducing Costs
Figure 66. Effectiveness of Cost Reduction Interventions
Outcome What Works? What Doesn't Work?
What's Promising?
Needs More Research
Enrollment/ Attendance CCT School Fees Vouchers
Progression/ Repetition/ Dropout CCT School Fees
Vouchers
Test Scores School Fees
CCT Vouchers
Source: 3ie, Citi Research
Costs associated with learning may be lowered through a variety of means including reducing school fees, cash transfers, and vouchers.
School fee intervention: School fee intervention can take two forms – simply provide free education or meet some of the costs associated with schooling. As 3ie notes, achievement awards in Israel offered students completing their end of school exams either $800 in cash, $1,000 for an educational trip or $1,200 towards higher education. Merit-based programs may increase learning outcomes although targeted programs need to ensure that the beneficiaries are not those who would have attended school anyway.
Conditional cash transfers: Conditional cash transfers (CCTs) offer regular cash conditional on the recipient fulfilling certain targets. Some programs, such as the Bangladesh Female Secondary School Stipend, adopt gender-based targeting with cash disbursements subject to the young women attending secondary school, getting good grades, and remaining unmarried until they are aged 18. The idea is that CCTs increase household income so families can better afford the costs of schooling through the ‘income effect’. Both enrollment and attendance is likely to improve as a result. Successive studies indicate that children are more likely to enroll, attend, and progress in school when they are part of a CCT program, particularly children from the poorest families. However, doubts remain about the ability of CCTs to contribute to long-term improvements in learning outcomes. Rather, supply-side interventions to improve school quality might be needed alongside CCTs.
Vouchers: Vouchers offer the dual benefit of lowering the cost of education and offering a choice of school, including the option to attend private schools rather than just public ones. Apart from reducing the cost of education, vouchers may also improve learning outcomes through two other means: choice increases competition amongst schools to improve their quality, and a child’s ability to attend a better school is not constrained by household factors. However if the program leads to overcrowding it may worsen the experience for those already in schools.

July 2017 Citi GPS: Global Perspectives & Solutions
© 2017 Citigroup
65
Increasing Preparedness
Figure 67. Effectiveness of Increasing Preparedness
Outcome What Works? What Doesn't Work?
What's Promising?
Needs More Research
Enrollment/ Attendance Health ECD School feeding
ECD (attendance) Health (enrollment)
Progression/ Repetition/ Dropout
ECD School feeding
Health
Test Scores School feeding ECD Health
Source: 3ie, Citi Research
Increased preparedness involves getting children involved in the education process at an early stage, and once in the education system, focus intervention towards improving their health and nutrition to ensure that they are better able to participate in school and learn.
Early Child Development: 3ie notes that enhancing a child’s cognitive and social skills through early child development (ECD) programs can increase their school preparedness and hence their performance once they enroll in school. Examples of ECD initiatives include (1) developing pre-school infrastructure; (2) promoting at-home day care programs — 3ie cites the example of Colombia where local women provide day care in their own homes for up to 15 under-7 year-old children in a nationwide program reaching one million poor children; and (3) increasing parental engagement with young children. Home visits were carried out in rural Bangladesh to families with undernourished children, demonstrating play activities using homemade toys and promoting positive mother-child interaction. According to a few studies, ECD interventions increased school enrollment, lowered dropout rates, and increased math and language scores. In the specific instance of rural Mozambique, 3ie states that “children who had attended preschool were 24% more likely to be enrolled in primary school than the control group, and 21% more likely to enroll at the intended age. School enrollment also increased for their elder siblings. Cognitive and problem-solving abilities improved, as did behavioral outcomes, with preschool children spending an extra 7.2 hours studying per week”. A study in Turkey revealed that 86% of children who had enjoyed daily games and activities with their mothers continued in school seven years after the intervention, compared to only 67% of children who did not play with their mothers. An ECD intervention in Jamaica revealed that stunted children too can benefit in the form of improvement in test scores, and significantly reduced dropout rates.
Nutrition: School feeding programs either provide meals on the school premises or give out food parcels to be taken home. Programs may be targeted at the most disadvantaged children or to girls and take-home rations can be linked to attendance requirements. 3ie highlights that in the Sahel region of Burkina Faso, 10 kg of cereal flour per month is issued to girls if they have attendance rates of 90%. In Bangladesh, the nationwide Food for Education program gives poor families a free monthly foodgrain parcel, conditional on having one primary-aged child in school who attended at least 85% of classes. Studies have confirmed that school-feeding has a positive impact on enrollment and attendance. However the impact on learning outcomes is more uncertain.

Citi GPS: Global Perspectives & Solutions July 2017
© 2017 Citigroup
66
Health: School-based health programs can cover both the prevention and treatment of disease and malnutrition. Treatment services include deworming for intestinal worms, as well as malaria treatment and prevention programs. Prevention interventions may include the provision of micronutrient supplements or eye tests. 3ie concludes that programs which treat children in school for malaria appear not only to reduce absenteeism and dropout rates, but also improve test scores. Deworming, however, does not always lead to an increase in school enrollment and attendance, or an increase in test scores. Similarly the results for micronutrient and vitamin supplementation vary. Access to water and sanitation can also support education. For example, according to UNESCO, reducing the time taken to collect water and firewood can improve education outcomes by freeing time for educational activities, especially for women and girls. In Ghana, research by UNESCO found that halving the time taken to fetch water increased school attendance by 2.4 percentage points, on average, among girls aged 5 to 15, and the impact was stronger in rural areas. Similarly in 2001, UNESCO found that female literacy rates in Uttar Pradesh, India were almost 5% higher for women in villages with better water access.
Providing Information
Figure 68. Effectiveness of Providing Information and Other Interventions
Outcome What Works? What Doesn't Work?
What's Promising?
Needs More Research
Enrollment/ Attendance Electricity Providing Information
Progression/ Repetition/ Dropout
Electricity Social Protection
Schemes Providing
Information
Test Scores Electricity Providing Information
Source: 3ie, Citi Research
Providing information to both children and parents about the potential future benefits of education in terms of income, employment, social status, and the quality of education could drive greater school participation. 3ie provides examples of several such projects. In Bangladesh, the Campaign for Popular Education provided information about the poor skill levels of 11- and 12-year olds, while in Pakistan, the Learning and Education Achievement in Pakistan Schools Project gave parents two report cards in 112 randomly selected rural communities — one detailing their child’s test scores and ranking relative to their cohort and the other ranking schools in each village by performance. Pratham, a non-governmental organization (NGO) in India, produces an annual report on learning outcomes based on tests delivered through a household survey.
Various studies in Chile, China, the Dominican Republic, and Madagascar suggest school participation outcomes improved through information programs after information was provided on education. For example, a program in Madagascar that provided information about the economic returns on education led to relatively large improvements in school attendance, while in the Dominican Republic, a similar program improved enrollment rates. Evidence on learning outcomes is more limited.

July 2017 Citi GPS: Global Perspectives & Solutions
© 2017 Citigroup
67
Other
Electricity: Greater availability of electricity can improve study time and education outcomes by facilitating night-time studying, improving access to technology, and, when demand is high, through the potential use of double shifts. A comprehensive review by UNESCO of studies discussing pro-poor electricity provisions in 74 developing countries, mostly from sub-Saharan Africa, and South and East Asia, found consistent positive impacts of electrification on education in terms of improvements in study time, enrollment, and years of schooling.
Social institutions: There is typically a negative relationship between the prevalence of discriminatory social institutions and the gender gap in lower secondary completion rates. According to UNESCO, girls were often found to attend school longer in countries with less discriminatory social institutions, and the reverse was true in countries with more discriminatory institutions. This relationship, however, is not always consistent.
Social protection schemes: Social protection schemes, such as pensions, employment initiatives, social security, and microfinance can improve educational access. For instance, in South Africa, the expansion of the government pension program to the black population in the early 1990s led to a sudden large increase for many in household income. Evidence collated by UNESCO suggests pensions received by women had a systematic positive impact on young girls living with them: girls’ height for age and weight for height improved, and girls were significantly more likely to be in school. Studies found no effects when pensions were received by men.

Citi GPS: Global Perspectives & Solutions July 2017
© 2017 Citigroup
68
Supply Side Interventions New Schools and Infrastructure
Figure 69. Effectiveness of New Schools and Infrastructure
Outcome What Works? What Doesn't Work?
What's Promising?
Needs More Research
Enrollment/ Attendance Buildings
Progression/ Repetition/ Dropout
Test Scores
Source: 3ie, Citi Research
3ie found that building schools in communities with no educational facilities reduces travel time and thus increases enrollment by parents who were otherwise reluctant to send young children, or girls of any age, to schools located at a distance. Improving facilities may also drive learning outcomes. For example, repaired classrooms facilitate uninterrupted lessons even when it is raining, while reducing journey time to school can make children less fatigued.
3ie makes a strong case for the establishment of new schools: (1) in Afghanistan, building ‘village-based schools’ led to an increase in primary school enrollment of 42%; (2) new girls’ schools in rural Pakistan increased female enrollment by 22%, and had a spillover effect of 9% higher enrollment for boys who may have enrolled to escort their sisters to and from school; and (3) school enrollment increased by 20% in Burkina Faso through the Burkinabé Response to Improve Girl’s Chances to Succeed program. The success of these programs, 3ie believes, perhaps disproves the notion that parents in rural or remote areas are intrinsically disinterested in educating their daughters. In fact, the Burkina Faso study confirmed with parents that having a school at close proximity was one of the primary motivations for sending their child to school, while an equal number of parents in the control group said the prospect of a long journey dissuaded them from enrolling their children in school.
All of these projects consistently had a greater impact on girls than on boys, including when there was no explicit gender focus. For example, the increase in enrollment in Burkina Faso was 23% for girls compared to 18% for boys. According to one study in Afghanistan, boys and girls are equally likely to attend a school that is nearby, but if the school is more than 1.5 km away, girls are 10% less likely to attend.
On the supply side, building schools is of greatest demand but can be linked with other programs to increase enrollment, especially for girls

July 2017 Citi GPS: Global Perspectives & Solutions
© 2017 Citigroup
69
Materials
Figure 70. Effectiveness of Materials
Outcome What Works? What Doesn't Work?
What's Promising?
Needs More Research
Enrollment/ Attendance Materials (Attendance) Materials
(Enrollment)
Progression/ Repetition/ Dropout Materials
Test Scores Materials (Maths) Materials (Language)
Source: 3ie, Citi Research
Learning materials could drive positive outcomes. 3ie argues that ”the provision of learning materials, such as textbooks, posters, flip charts, and chalkboards can help children follow along with a teacher’s instructions. New materials can also help teachers with their lessons. New technology, such as computer-based learning materials, can lead to self-learning”.
However, access to learning materials is lacking in several countries. Evidence from the 2014 PASEC learning achievement survey shows that in Burundi only 18% of students had their own mathematics textbook, while 31% had to share with another student and 51% had to share with two or more students. In Chad, about 90% of students in grades 2 and 6 reading and mathematics classes had to share textbooks with at least two students.
In order to reduce the cost of textbooks, Uganda in 2002 contracted a private publisher which resulted in the cost of textbooks falling by two-thirds and their quality increasing. Brazil in 1990 benefited from a 30% to 40% fall in costs. However, the challenge remains that to reach economies of scale; publishers need to have the full range of skills involved in book publishing, from conceptualization, to writing and development to printing the finished product.
According to UNESCO, a number of countries in sub-Saharan Africa have decentralized their textbook supply systems which allow schools to choose from government approved textbook lists and schools then purchase different combinations of textbooks in small numbers.
In terms of cost reduction, UNESCO argues that increasing durability from 1 to 3 years can reduce the annual per pupil cost of textbooks by more than two-thirds of the unit cost. Further, tweaking the curriculum to reduce the number of textbooks per child from 5 to 3, together with increasing durability, may reduce annual per pupil cost by nearly four-fifths. UNESCO cites the example of India wherein if a primary school book’s specifications give it a four-year shelf life rather than just one year, the cost per textbook per year falls from $0.36 to $0.14. It is also contended that a textbook with a four-year life may only be 20% more expensive than that with a one-year life. According to the UN agency, economies of scale can also drive down prices for textbooks — 30,000–50,000 copies for full-color books; and 7,500–10,000 copies for black-and-white books.

Citi GPS: Global Perspectives & Solutions July 2017
© 2017 Citigroup
70
The International Commission on Financing Global Education Opportunity argues that “more than 500 million primary and secondary school children, or half of all children in low and middle-income countries, are not taught in their native language. In sub-Saharan Africa, the level is over 90% of students. Learning outcomes in middle-income countries in sub-Saharan Africa are more than 50% lower than comparable middle-income countries in Asia and Latin America. Language of instruction policies accounts for one-quarter of this learning gap”.
Teachers
Figure 71. Effectiveness of Teachers
Outcome What Works? What Doesn't Work?
What's Promising?
Needs More Research
Enrollment/ Attendance Teacher Resources Teacher Resources (Enrollment)
Progression/ Repetition/ Dropout Teacher Resources Teacher Resources
Test Scores Teacher Resources
Source: 3ie, Citi Research
According to The Commission teacher salaries at low and middle-income countries accounted for 73% of all expenditures on preschool, primary, and secondary education. As demand for education increases, the demand for teachers between 2015 and 2030 in middle-income countries is projected to rise by 25% and in low-income countries it will need to nearly double. They further contend that in a number of the poorest countries, these increases are equal to half or more of the projected graduates of tertiary education. Apart from recruitment of more teachers, quality of teaching could be improved through induction and mentoring programs, and periodic in-service training. Further, interventions to improve school quality through additional teaching resources, as suggested by 3ie, include:
Providing for additional teaching manpower: In Chile, the 900 Schools Program provided training to 18 to 20-year olds from the local community, who then held after-school workshops for children lagging behind in grades three and four, to reinforce school teaching. According to 3ie “education systems in many developing countries are geared towards the stronger students and focus on end-of-year exams. The expansion of primary education has raised the teacher-pupil ratio, and brought more marginalized children into the classroom from poor households with illiterate parents who struggle to keep up with the curriculum. Employing additional contract teachers reduces class size for all children, and can offer more targeted teaching at a slower rate for those children falling behind. Training current teachers to adapt their style for these disadvantaged children through new pedagogical methods can also help”.
Financial incentives for teachers: A program in Andhra Pradesh, India offered bonus payments to teachers based on the average improvement of their students’ test scores. Such incentives ensure that teachers are actually present in the classroom and incentivize them to help students learn. However, the risk here is that teachers may be tempted to force weaker students to repeat grades or even to drop out to keep average exam scores high.

July 2017 Citi GPS: Global Perspectives & Solutions
© 2017 Citigroup
71
Providing teachers with new resources and teaching aids: This may help improve enrollment, attendance, and outcomes. Studies suggest that parents are more likely to send their children to school if they see an improvement in schooling quality or if children themselves are keen to attend and use resources such as computers. A direct consequence of classes seeming more worthwhile, and children doing better at school, is that they are less likely to drop out.
Studies reviewed by 3ie suggest teacher interventions have positive effects on attendance, enrollment, and dropout rates and also at improving math and language scores. One cited example is that of Pakistan where “teaching qualifications were lowered to allow local women with only eight years of education to teach, as part of the Community Support Process to set up new girls’ schools in remote villages in Pakistan. This led to a marked increase in enrollment among girls in this area. Prioritizing the teacher’s gender over her experience was seen as instrumental in encouraging girls to attend school”. In Rajasthan, India, financial incentives were used to encourage better teacher attendance at non-formal education centers. The relatively less-qualified para-teachers received a flat salary of Rs500 if they attended fewer than ten days in a month, but received an incremental Rs50 for every additional teaching day. This had a positive impact on attendance and enrollment. In the case of the Extra Teacher Program in Kenya, student absenteeism dropped by 11% among primary school pupils taught by contract teachers, who themselves were 30% more likely to be in class than regular teachers. Contract teachers also covered the full curriculum. The increased effort among contract teachers was likely driven by the annual contract renewal cycle and the aspiration to graduate to a permanent civil service teaching position. 3ie cites another program in Kenya which gave teachers of grades four through eight prize money equivalent to 21-43% of their monthly salary for the best performing classes, and for those with the strongest improvement. To discourage teachers from forcing dropouts or repetitions by weaker students, any child who did not take the test was automatically given a low grade. This resulted in small, but positive, outcomes.
School-Based Management
Figure 72. Effectiveness of School-Based Management
Outcome What Works? What Doesn't Work?
What's Promising?
Needs More Research
Enrollment/ Attendance
Progression/ Repetition/ Dropout SBM
Test Scores SBM SBM
Source: 3ie, Citi Research
The idea here, according to 3ie, is that local communities are better informed and more motivated to ensure good school performance than government officials, who may tend to focus on quantity rather than quality. Mechanisms for empowering the local community, as suggested by 3ie, include:
School improvement funds to be deployed by local committees. “The Quality Schools Program in Mexico provided $15,000 cash grants over five years to implement school improvement plans developed by parents and teachers in poor urban areas. Most of the funding had to be spent on school supplies and infrastructure, though in the final year, half was allocated for teacher and principal training programs”.

Citi GPS: Global Perspectives & Solutions July 2017
© 2017 Citigroup
72
Disseminating information about relative school performance.
Delegating teacher performance monitoring, and hire and fire responsibilities to the local level: “Under the Extra Teacher Program in Kenya, school committees were trained to evaluate the performance of contract teachers and made the decision whether to renew their contract at the end of the year. Under the Community Support Process in Pakistan, parents identified suitable local women to teach at the school and then monitored their performance. In Madagascar, the Associations of Parents of School Children raised funds to pay for extra community teachers, and they had a say in the hiring and firing of these new staff”.
Figure 73. Summary of the Effectiveness of Various Education Interventions
Outcome What Works? What Doesn't Work?
What's Promising? Needs More Research
Enrollment/ Attendance CCT Materials Teacher Resources Teacher Resources (enrollment)
Health Buildings Health (enrollment) Electricity ECD ECD (attendance) School Feeding Materials (enrollment) Vouchers School Fees Providing Information Progression, Repetition, Dropout
Electricity Teacher Resources Teacher Resources
Social Protection Schemes
CCT Health
SBM ECD (attendance) Materials School Feeding Vouchers School Fees Providing Information Test Scores Materials (Math) Materials
(Language) Teacher Resources Health (global)
Electricity SBM CCT School Feeding ECD Materials (global) School Feeding Vouchers School Fees
Providing Information
Source: 3ie, Citi Research
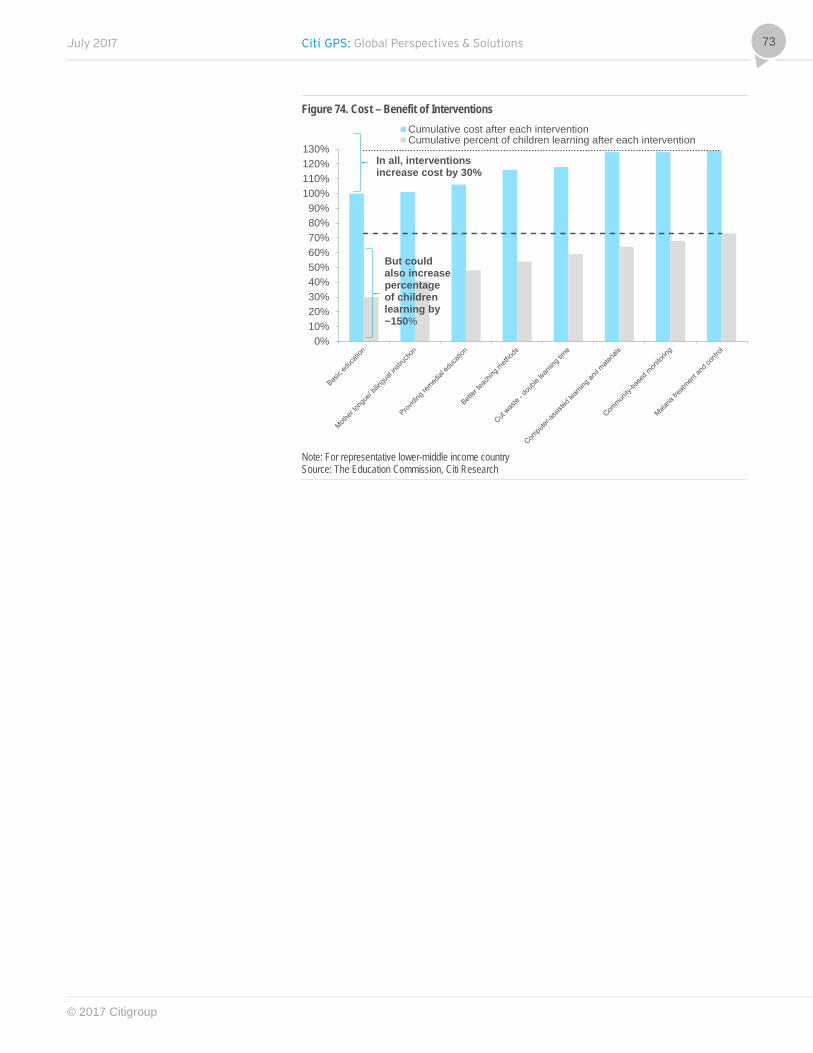
July 2017 Citi GPS: Global Perspectives & Solutions
© 2017 Citigroup
73
Figure 74. Cost – Benefit of Interventions
Note: For representative lower-middle income country Source: The Education Commission, Citi Research
0%10%20%30%40%50%60%70%80%90%
100%110%120%130%
Cumulative cost after each interventionCumulative percent of children learning after each intervention
In all, interventions increase cost by 30%
But could also increase percentage of children learning by ~150%

Citi GPS: Global Perspectives & Solutions July 2017
© 2017 Citigroup
74
Financing of Education Improvement The International Commission on Financing Global Education Opportunity, a group comprised of heads of states, Nobel laureates, and leaders from diverse fields, has drawn up a plan of action to get all young people into school within a generation. The plan aims to leverage a variety of interventions which we discussed in the previous section in order to enable all lower- and middle-income countries to accelerate their progress to match the world’s top 25% fastest education improvers.
Figure 75. Financing and Costing of Education Improvement Targets
Source: The Education Commission, Citi Research
This envisions education expenditure across all low- and middle-income group countries rising from about $1.2 trillion per year in 2015 to $3 trillion per year by 2030. An increase in the total spending (public and private) on education from an average of 6% of a country’s GDP currently to 8.5% by 2030 across low and middle-income countries.
$144Bn
$657Bn
$884Bn
$1,293Bn
0
500
1,000
1,500
2,000
2,500
3,000
2015 - Current spend 2030 - Financing plan 2030 - Costs
$ B
illio
n
Domestic public
$1.06Tn
Domestic public
$2.69Tn
Pre-Primary
Post-Secondary
Secondary
Primary
Households $197Bn
Households$198Bn
Int'l finance $16Bn
Int'l finance $89Bn

July 2017 Citi GPS: Global Perspectives & Solutions
© 2017 Citigroup
75
Domestic Public Expenditure
Domestic public spending will continue to be the single largest source of funding for education and will in fact account for 90% of all educational funding by 2030, up from ~82% currently. Robust GDP growth, greater tax collection, and higher total expenditure have together driven growth in public spending on education. However what has been missing is greater prioritization of spend on education. On average, from 2000 to 2014, total public expenditure grew by 5.8% per year versus average GDP growth of 4.7%, but the share of education in public expenditures declined by 0.2%. As The Commission notes, the net effect of this is that the 5.7% average growth witnessed in public spend on education over the 15 year is less than the 6.8% growth rate required to achieve The Commission’s 2030 goals – i.e., increase domestic public expenditure on education from 4.0% to 5.8% of GDP.
The Commission suggests that additional public funds can be raised by optimizing taxation. While the tax-to-GDP ratio is 19.3% for upper middle-income countries, for lower middle-income it stands at 17.8%, and is just 14.1% at low-income countries. In fact, in countries like Pakistan and Bangladesh it is as low as 10%. Research from the International Monetary Fund (IMF) suggests that, by reducing both tax avoidance and evasion, the revenue base could be expanded by as much as an average of 9 percentage points in low-income countries. The Commission estimates a potential to increase tax revenues in developing countries by 6% to 13% just from multinational corporations. Developing countries are estimated to lose up to $800 billion every year in corporate tax avoidance. In 37 low-income and lower middle-income countries, The Commission suggests illicit flows as a share of GDP were in fact larger than what governments spent on education.
Reallocation of public funding from fossil fuel subsidies is another potential area of resource mobilization for education apart from the ancillary benefits to the environment. The Commission estimates that on average, an extra 1% of GDP allocated to subsidies results in a reduction of public spending on education and health by 0.6% of GDP. This effect is more pronounced for countries with weaker institutions and limited fiscal headroom. Across 40 developing countries, 5% of GDP and between 25 and 30 percent of government revenues are spent on subsidizing fossil fuels – often much higher than education spending. However, interestingly, studies suggest that fuel subsidies typically benefit the rich more than the poor while spend on education can be significantly more equitable. If fuel subsidies across 53 low and middle-income countries were reduced by half and a half of these savings were allocated to basic education, the net benefit to the poorest 20% would be $3 billion.
Earmarking resources for education can provide a steady source of funding. India’s Sarva Shiksha Abhiyan program applies a 3% education surcharge on income, corporate, and other taxes. In fact earmarking taxes for social causes could also reduce resistance to tax increases. The Commission further suggests that earmarked revenue from newly discovered natural resources also has the potential to be a vital source of finance for education in some developing countries. In six African countries, newly discovered natural resources will raise annual government revenue in the coming years by between 9% and 31%.
Figure 76. Annual Growth in Public Expenditure to Education Between 2000 and 2014
Source: The Education Commission, Citi Research
One way to increase funds for education is to reallocate public funding from fossil fuel subsidies
4.7%
5.8% 5.7%
0.0%
1.0%
2.0%
3.0%
4.0%
5.0%
6.0%
7.0%
GDP growth Total publicexpenditure growth
Public expenditureon education
growth

Citi GPS: Global Perspectives & Solutions July 2017
© 2017 Citigroup
76
International Finance
International finance currently accounts for a little over 1% of education funding in low and middle-income countries. The Education Commission targets for this to rise to 3% by 2030, representing a 15-year CAGR of 12% to $89 billion. While this might seem achievable given the low base, in reality, donor support for education has been declining over the years. The Commission estimates that education’s share of sector-allocable ODA (official development assistance, a measure of aid coined by OECD) has fallen from 13% to 10% from 2002 to 2014. Against this, the share from health has risen from 15% to 18% and infrastructure from 24% to 31%. Similarly, non-concessional loans for education decreased from a peak of $2.7 billion in 2010 to $1.6 billion in 2014. In terms of share of non-concessional lending, this has meant a decline from more than 7% in 2002 to less than 4% in 2014. Further, U.S. foundations have reduced their share of funding for education from 7% in 2005 to 4% in 2015, but at the same time increased their financing for health from 39% to 44%. Even among multilateral donors, education has seen a decline from 10% to 7% of total aid over the past decade.
Analysis by UNESCO suggests that even the allocation of available aid does not always correlate with need. Assuming the percentage of children completing primary school is a potential measure of country need, the average child in Mongolia received $45 in aid to basic education in 2014 despite achieving a primary completion rate of 97% in 2010. By contrast, Chad, where the primary completion rate was 28% in 2010, received $3 per primary school-age child in 2014. UNESCO’s analysis further reveals that in Liberia and Mauritania, about half the children complete primary school, but Liberia receives 10 times the amount of aid to basic education per school-age child.
All this is compounded by too large a share of external financing, particularly in the case of ODA, going to upper middle-income countries at the expense of low-income and fragile countries. According to The Commission just 68% of education aid actually reached recipient countries in 2014, in part because close to 70% of aid to higher education is spent on scholarships for students studying in donor countries. Similarly, there is a lack of attention to and financing of specific priority issues in education. Only 1% of ODA for education in 2014 was allocated to early childhood development.
According to The Commission, if ODA levels were to rise from the current 0.3% of GDP to at least 0.5%, still well below the previously self-affirmed target of 0.7% by the donors, funding can increase from $13 billion today to $49 billion by 2030. Bilateral and multilateral donor agencies will be required to increase the share of aid which goes to education from 10% to 15% of total ODA, approximately the share donors now allocate to health. Further non-DAC donors (DAC refers to an OECD forum of bilateral donors) are called upon to allocate 15% of their aid to education by 2030. This would mean $11 billion for education out of a total ODA of $75 billion if they can increase the share of national income that they give to aid from its current 0.1% to 0.2%. The Commission also calls for non-concessional finance for education from World Bank and other multilateral development banks to be increased from $1.5 billion today to an annual average of $5 billion by 2020, and at least $13 billion by 2030. Another $7 billion by 2020 and $20 billion by 2030 could be raised from philanthropists, corporations, and charitable organizations. To inspire and mobilize new giving, the Education Commission has called for the development of an “Education Giving Pledge,” encouraging high net worth individuals — millionaires and not just billionaires — to make a substantial and public commitment to education and in doing so motivate their peers to do likewise. Private giving in the form of remittances is also seen as an important contributor to education.
Figure 77. Trends in Sectoral ODA
Source: The Education Commission, OECD
0
5
10
15
20
25
30
35
40 EducationHealthGovt. and civil societyInfrastructure

July 2017 Citi GPS: Global Perspectives & Solutions
© 2017 Citigroup
77
The Commission also calls for funding for education in humanitarian crises to be increased to a level of 4-6% of humanitarian assistance. Finally, The Commission recommends that the Global Financing Facility (GFF) in support of Every Woman Every Child should include Early Childhood Development (ECD) and adolescent girls in its mandate.
Potential Financing Mechanisms for Education109
Based on the readiness of proposals and the feasibility of implementation in the near-term, The Commission has identified several financing mechanisms:
Education Bonds: An estimated $80 trillion of savings resides in institutional assets (such as pension funds, insurance companies, and mutual funds), with more than $3 trillion in developing countries. Specialized bonds have the potential to tap into these assets as well as those from high net worth individuals interested in low-risk and long-term investment opportunities. Green bonds, for example, have grown from zero to $42 billion in the past ten years, and are expected to reach $100 billion by 2017. Vaccine bonds, and the Inter-American Development Bank’s (IADB’s) Education, Youth, Employment (EYE) Bond have also sought to tap into these sources of savings. Education bonds could be used for education projects that demonstrate measurable results and require significant initial capital, such as school infrastructure development, infrastructure for teacher education institutions, or ICT equipment and connectivity. Bonds for education could be issued by multilateral financial institutions or by countries, with or without external guarantees from a donor institution or private guarantor. Repayment risk could potentially be reduced by linking the amortization schedule to economic conditions in the country: a country would repay more during a high GDP growth period and pay less when the economy is underperforming. Diaspora bonds could also be used to tap into the interest that diaspora populations have in promoting education in their home countries. One further proposal to explore is the creation of education bonds directed towards teacher or public employee pension funds, which look for ethical investment opportunities. The pension funds would receive a market rate of return and the capital invested would be directed to finance education.
Post-Secondary Student Financing: Student financing mechanisms provide funding directly to students or their families, typically to pay for higher or vocational education. Income Share Agreements, which modify traditional loans by linking repayment terms to the borrower’s expected future income rather than existing collateral, and student financing by specialized non-banking financial institutions (NBFIs) for whom student financing is a core product are potential innovations that can be considered. Models for engaging employers should also be explored, whereby they agree to pay a portion of the costs of higher or vocational education upon hiring new employees recently graduating from such programs. These approaches could also help to spur quality improvement by encouraging providers to deliver programs that result in employment.
Disaster Insurance: Disaster insurance has been growing rapidly, but to date, education has been largely neglected. Education disaster insurance would get funds very quickly to developing countries to enable them to maintain and rebuild their education systems after natural disasters. Education tends to suffer both from the initial impact of a disaster on educational infrastructure and from the fact that it is not typically a priority sector for rebuilding using emergency funds. Insurance, based on risk assessment and countries’ disaster resilience plans, has the potential to quickly provide emergency funds to countries after disasters so that education provision can be reinstated rapidly.
Impact Investing: Impact investments are intended to achieve positive social outcomes beyond financial return. Only an estimated 2% of impact investments currently under management are in education, but in a recent survey of investors, 22% indicated they plan to increase their investments in the sector. Education-specific impact investment funds could bring more attention to the sector and increase overall funding for education. One form of impact investing that has attracted significant attention is Social and Development Impact Bonds (SIBs and DIBs). Here investors provide upfront capital to service providers and are repaid, contingent on whether pre-agreed outcomes are achieved, by either governments (SIBs) or donors (DIBs). A particularly promising area for the use of impact bonds is early child development (EXS), because there is greater flexibility in provision and financing, and governments are often unwilling to fund ECD services unless outcomes can be guaranteed.
109 The Learning Generation – A report by The International Commission on Financing Global Education Opportunity

Citi GPS: Global Perspectives & Solutions July 2017
© 2017 Citigroup
78
Solidarity Levies: A global solidarity levy aims to “levy global economic activity to pay for global public goods”. One example of this is the air ticket levy used to fund over 50% of UNITAID over the past five years.
Multilateral Development Bank Investment Mechanism: This mechanism would increase banks’ leadership and financing of education, leverage their capital bases to raise billions more for education, improve coordination between the banks, and innovate to encourage in new sources of financing. The Education Commission estimates that establishing such a mechanism could mobilize upwards of $20 billion annually for education by 2030 (up from $3.5 billion today).
Private Sector Participation in Education
Private participation in education has generally been on the ascendance in recent years. Private share of primary enrollments remained largely stable at a little under 10% between the early 1970’s and the late 1990’s, however since 1999 this has risen sharply to reach about 13.5% by 2014. Data for private secondary enrollment dates back only to the late 1990’s and the proportion of total enrollments have risen from around 19% to 25% by 2014. By private schools we refer to those institutions that are managed by a non-government organization.
Figure 78. Global Private Enrollment Rate in Primary and Secondary Education (%)
Source: World Bank
The preference for private schools is perhaps well justified on account of superior outcome levels. That OECD, using data across 26 countries, estimates that the typical private school student outperforms the typical public school student by 30 points, as measured by PISA reading scores — the equivalent of three-quarters of a year’s worth of formal schooling. Although to be sure, about two-thirds of this difference is explained by private schools’ ability to attract socioeconomically advantaged students. Desire for high-quality, English-medium education from the aspirational middle class has driven demand for international schools, a subset of the private school market. At the turn of the millennium, the global international school market contained a little over 2,500 schools with less than one million students and generated slightly less than $5 billion in fee income.
0.0%
5.0%
10.0%
15.0%
20.0%
25.0%
30.0%Primary Secondary
Private participation in education has been rising

July 2017 Citi GPS: Global Perspectives & Solutions
© 2017 Citigroup
79
By 2016 this had risen to over 8,000 schools, catering to over 4 million children, and generating fee income of ~$39 billion. According to industry estimates,110 during the early part of the next decade, fee income will rise to $60 billion and to $89 billion by 2026, including 16,000 schools and 8.75 million students. At the other end of the social strata — overcrowding, higher teacher absenteeism, or simply a lack of public schools nearby in low-income countries —means close to a fourth of all primary enrollments in low-income countries is at private schools, up from a tenth about two decades ago. Universities, vocational training, and tutoring are other sub-segments witnessing private sector involvement. A word on private tutoring — it is driven by the need to keep pace with classroom teaching, improve overall competency, and enhance knowledge and skill level. The global market for private tutoring services is estimated to reach $227 billion by 2022.111 But the adoption of private tutoring is concentrated in urban areas due to greater competition, high educational qualifications of parents, and better socio-economic status of the urban population. Asia-Pacific accounts for ~60% of the global tutoring market and is estimated to register a CAGR in excess of 10% over the next five years. Specifically, the Chinese market is forecasted to grow at an 11% CAGR to $40 billion by 2021.112The growth in China is primarily lead by intense competition for admission to local universities where acceptance rates are notoriously low (9% at top 150 Chinese universities).
Figure 79. Private Sector Involvement in Financing and Provision of Education Services
Provision Private Public
Finance
Private
Private schools Private universities
Home schooling Tutoring
User fees Student loans
Public
Vouchers Contract schools Charter schools Contracting out
Public schools Public universities
Source: World Bank
While private involvement in education can certainly be on an exclusive basis, i.e., the private entity is responsible for both the financing and provision of service, several education projects are also being delivered through Public Private Partnerships (PPPs). Such partnerships may take several forms:113
110 Bushweller, K. & Glass, D. (2016). Spanning the Globe: Doing K-12 Business in the U.S. and Abroad [PowerPoint slides]. Retrieved from http://www.edweek.org/media/160519presentation.pdf 111 Global Industry Analysts, Inc. (2016). Intense Competition among Students and the growing Need to Achieve Academic Excellence Drive the Global Private Tutoring Market. Global Industry Analysts, Inc. Retrieved from: http://www.strategyr.com/MarketResearch/Private_Home_Tutor_Services_Market_Trends.asp 112 Business Wire (2017 April 21). Private Tutoring Marketing in China – Drivers and Forecast From Technavio. Business Wire. Retrieved from: http://www.businesswire.com/news/home/20170421005379/en/Private-Tutoring-Market-China---Drivers-Forecast] 113 Mounmé, R. & Saudemont, C. (2015). Overview of the role of private providers in education in light of the existing international legal framework. Investments in private education: undermining or contributing to the full development of the human right to education? UNESCO Working Papers on Education Policy N°. UNESCO, Paris.

Citi GPS: Global Perspectives & Solutions July 2017
© 2017 Citigroup
80
Private management of public schools: Here public authorities provide financing but contract private parties to operate the school or certain aspects of the school operations. Charter schools fall in this category. The governing principle is that schools should be held accountable for student outcomes but to achieve superior outcomes they require a certain degree of autonomy. Charter schools have considerable autonomy over key matters of curriculum, personnel, and budget and are also not restricted by district and zoning limitations while deciding enrollments. The schools however are not allowed to charge tuition as they receive public funds, and the ‘charter’ itself acts as a performance contract between the school and the public authority. According to one estimate, enrollment in U.S. charter schools topped 3 million in 2016-17.
Voucher programs: UNESCO defines vouchers programs as “an entitlement that parents can use to pay for the education of their children at a public or private school of their choice, rather than the public school that is closest to them or to which they have been assigned. Vouchers are paid from a public entity either directly to parents or to schools on the parents’ behalf.”
School adoption programs: This aims at attracting private sector expertise in upgrading and modernizing the public education system. Private entities may ‘adopt’ public schools with established goals for performance and quality. For example in the Philippines private participants receive tax incentives.
Capacity building initiatives: This refers to private sector involvement in management, training and development, curriculum and pedagogical development, and supply of materials.
Schools infrastructure partnership: Similar to a build-operate-transfer (BOT) project, the private sector provides financing and then operates the school over a specified contract period subject to service level requirements stipulated by the public authority.
Government purchase of education services from private schools: Apart from subsidies and sponsorship to students this also involves contracting private schools for ad-hoc student enrollment when there is a shortage of places in public schools.
Private sector philanthropy: Mainly refers to donations made to public schools.
Arguments against PPP in education include –
PPPs will lead to part/ full-privatization of a public service;
Greater choices in education could lead to socioeconomic segregation;
PPPs can be very expensive due to the involvement of equity funding; and
PPPs may lead to poorer students being left behind in the deteriorating public schools that lose the support of more educated parents.

July 2017 Citi GPS: Global Perspectives & Solutions
© 2017 Citigroup
81
Is There A Student Debt Problem? How Do We Solve It? U.S. student loan balances topped $1.3 trillion in 2016 and have nearly doubled since 2009. After mortgages, student loans are the second largest category of debt held by U.S. citizens, accounting for 11% of all loans. However, worryingly, the rise in student loan default and delinquencies has been equally impressive. Default and 90-day delinquency rates are about 11%. To some this might appear eerily reminiscent of the mortgage crisis where delinquency rates had peaked at 11.5% in 2010.
Figure 80. US Federal Student Loans Disbursed and Delinquency Rate Figure 81. Student Loan Default Rates by Balance(2009 Cohort as of 4Q14)
Source: Datastream, Citi Research Source: Federal Reserve Bank of New York Consumer Credit Panel / Equifax, Citi
Research
The results of a closer analysis of default rates are strikingly unintuitive.114 Default rates are highest for the smallest loan balances and lowest for the largest balances. Using data available in the fourth quarter of 2014 for the 2009 cohort (i.e. those who entered loan repayment in 2009), who arguably might have higher incidences of default, of those borrowing less than $5,000 for college, 34% end up in default, while for those borrowing more than $100,000 the default rate is 18%. Slicing default rates in another manner, by institution type, it is highest at for-profit (+25%), and lowest among graduate borrowers (<5%). One way of explaining this is that larger borrowers tend to be those who attended graduate school, or who earned undergraduate degrees at expensive institutions. These borrowers spent many years in college, and so have many years of debt. But they have also developed a lot of human capital during this time which fetches them a premium in the labor market and helps them to pay off their debts. In contrast, small borrowers tend to either be drop-outs or those who spent just a year or two at a for-profit or community college. Although they took on lower debt they also may have developed lesser human capital.
114 Looney, W. & Yannelis, C. (2015). A Crisis in Student Loans? How Changes in the Characteristics of Borrowers and in the Institutions They Attended Contributed to Rising Loan Defaults. Brookings Papers on Economic Activity, 2015, vol. 46, issue 2 (Fall), pages 1-89.
0.0
0.2
0.4
0.6
0.8
1.0
1.2
1.4
6
7
8
9
10
11
12
Q1
2003
Q3
2003
Q1
2004
Q3
2004
Q1
2005
Q3
2005
Q1
2006
Q3
2006
Q1
2007
Q3
2007
Q1
2008
Q3
2008
Q1
2009
Q3
2009
Q1
2010
Q3
2010
Q1
2011
Q3
2011
Q1
2012
Q3
2012
Q1
2013
Q3
2013
Q1
2014
Q3
2014
Q1
2015
Q3
2015
Q1
2016
Q3
2016
Q1
2017
US$
Tril
lions
Del
inqu
ency
Rat
e %
Student Loan Delinquency Federal Student Loans (RHS)
0%
5%
10%
15%
20%
25%
30%
35%
1-5k 5k-10k 10k-25k 25k-50k 50k-100k 100k+
Share of Borrowers by School-Leaving Balance
21% 22% 29% 16% 9% 3%
In the U.S., student loan balances have increased, as has student loan default and delinquencies
Figure 82. Student Loan Default Rates by Institution Type
Source: Brookings.edu, Citi Research
Graduate only
Selective
Somewhat-selective
Non-selective
2-Year
For-profit
2011 2000

Citi GPS: Global Perspectives & Solutions July 2017
© 2017 Citigroup
82
We note that when viewed over a period of time, default rates are actually in secular decline from 14.7% in 2013 to the current 11.3%. However this is still at an elevated level. Potential solutions to reduce student debt levels could be to:
Lengthen the duration of loan repayment from the standard ten years. In Sweden, students pay their loans back over 25 years. For a $20,000 loan with an interest rate of over 4%, this longer repayment would mean a monthly payment of $100 instead of $200.
Link payments to income. The U.S. does have income-based repayment options for student borrowers, such as the Pay As You Earn (PAYE) program. In theory, PAYE holds payments to 10% of income but in reality PAYE can actually consume a much larger share of a borrower’s earnings as in a given year loan payments are calculated as a percent of the previous year’s disposable income.
Flexible remote learning models. Lack of a flexible schedule and higher costs are the main reasons for dropping out. According to one survey, two-thirds of young Americans said they stopped their education in order to support a family, while 48% said they could not afford the expense. Flexible remote learning models such as competency-based education (CBEs) and MOOCs could be viable alternatives for such students.
Increase cost efficiency. This is not to say that traditional colleges cannot be more cost-efficient beyond the use of EdTech. For example they can increase physical infrastructure utilization through special sessions between semesters or classes during the evening or the weekends. A year round calendar with three tracks – Spring/Fall, Fall/Winter, Winter/Spring – can increase credit hour production for a given building and faculty allocation by half of what it would be with a two semester calendar. Concurrent enrollment and more comprehensive credit transfer policies can lower the cost per graduate. A modular curriculum which reconstructs majors as collections of cross-disciplinary units of courses, rather than individual courses entirely unique to the given major ensures limited credit hours are lost in the event of a student changing majors.115
115 Eyring H.C., (2011). Unexploited efficiencies in higher education. Contemporary Issues in Education Research, 4(7), 1-18.

July 2017 Citi GPS: Global Perspectives & Solutions
© 2017 Citigroup
83
Education Technology Education has experienced limited disruption from technology and to a large extent the teaching model wherein the instructor imparts knowledge by lecturing to an audience, has essentially been unchanged for generations. A 2015 survey of executives from 13 industries revealed that education executives ranked fourth from the bottom in terms of expectations of massive digital disruption impacting their industry in the next 12 months. At present, education technology is miniscule as compared to its underlying market. The education industry at $5 trillion is 8x the size of the software market and 3x size of the media and entertainment industry, however only 2% of this market is digitized. Growth to a certain extent has been stymied by the increased number of gatekeepers involved in digital transition decisions including teachers, institutions, governing bodies, districts, and policy makers amongst others.
Figure 83. Executives Who Expect Moderate or Massive Digital Disruption in Next 12 Months(2015)
Source: Russell Reynolds Associates, Citi Research
How does one improve stagnating education outcome levels in wealthy countries? In a world of mass customization why must education be mass produced? Is it possible to bridge the gap between the acquisition of knowledge and its application (i.e., employability)? How does one practice lifelong learning when the current centers of learning (universities) are not set up to cater to the working professional? These are the second-order challenges the education sector is grappling with and potential solutions go beyond just greater funding and greater physical infrastructure.
We go through each of these issues in detail, but first we start with an introduction of EdTech as we believe it is the common link to the underlying themes – personalization, greater engagement, flexibility, efficiency, and productivity. Although, to be sure, we don’t offer EdTech as an elixir for all that ails the education sector. In fact the solutions we cite for popularizing vocational education and training (VET), and preparing lower-skilled employees for a dynamic job market have a distinctly ‘low-tech’ flavor.
0% 20% 40% 60% 80%
Industrial
Asset wealth management
Health care
Education
Business & professional services
Consumer products
Nonprofit
Insurance
Retail
Technology
Consumer financial services
Telecom
Media
Only 2% of the almost $5 trillion education market has been digitized

Citi GPS: Global Perspectives & Solutions July 2017
© 2017 Citigroup
84
“The 2 Sigma Problem”
In the early 1980’s, education psychologist Benjamin Bloom conducted a series of tests where students were randomly assigned to one of three learning conditions – Conventional (30 students per teacher with periodic tests solely for determining marks), Mastery Learning (30 students per teacher but tests are given for purposes of feedback followed by corrective procedures), and Tutoring (not more than three students per teacher with tests followed by feedback/corrective procedures). Holding everything else constant, the study116 observed that the average student under Tutoring was about 2 standard deviations above the control group, i.e. the students being taught under Conventional conditions. This meant the average tutored student outperformed 98% of the students in the control group. The average student under even Mastery Learning was one standard deviation, or 84% above the control group.
Figure 84. Outcome Distribution for Students Under Conventional, Mastery Learning, and Tutorial Instruction
Source: ASCD.org, Citi Research
The main takeaway is that most students possess the potential to achieve a high level of learning. However, given that historically natural constraints have existed against widespread adoption of one-to-one tutoring, the trick is to attain tutoring-like learning outcomes in a group environment — referred to as the “2 Sigma” problem. This suggests education outcome levels, even in developed nations, could stagnate after a point unless the education model is able to resemble something close to one-to-one tutoring.
116 Bloom, B. S. (1984). The Search for Methods of Group Instruction as Effective as One-to-One Tutoring. Educational Researcher, Vol 13, Issue 6, pp. 4-16.

July 2017 Citi GPS: Global Perspectives & Solutions
© 2017 Citigroup
85
Figure 85. Average Internet Speed and Average PISA Scores for 57 Countries
Figure 86. Average Internet Speed and Average PISA Scores for Countries With High Education Spend per Student`
Source: OECD, Akamai Source: OECD Education at a Glance (2016), Akamai
In one of the previous sections we noted that there is limited correlation between education spend per student and education outcomes (as defined by PISA) for countries which already spend a significant amount on education. Revisiting PISA, this time in the context of broadband speeds, one can see that there is a strong relationship between higher Internet speeds and education outcomes across a sample size of about 60 countries. An argument could be made that wealthy countries generally tend to spend more on all forms of infrastructure – including communications and education – and thus one (communications infrastructure) doesn’t necessarily cause the other (education infrastructure). This is true to an extent, although, as highlighted in Figure 85, even when we focus exclusively on countries that already have a relatively high spend on education, we note that there is a reasonable relationship between the quality of Internet and the quality of education outcomes. For example South Korea, which has the fourth highest PISA score, has all of its schools connected by high-speed broadband. In contrast, in the U.S., which has the 21st best PISA score, only 37% of schools have adequate broadband for digital learning. One way to think about this is the better the Internet infrastructure, the higher the scope to effectively deploy EdTech resources. The outliers here – relatively low PISA despite high broadband for example — could potentially be explained by the way technology has typically been used in education; as a means to automate and support existing practices rather than as a tool to transform the learning process. While it is not hard to imagine the benefit to developing countries from EdTech, even developed countries, some of which are witnessing diminishing marginal returns from their incremental education spend, could improve their quality of education through effective deployment of technology.
350
400
450
500
550
600
0 5 10 15 20 25 30
PISA
Sco
re
Avg. Internet Speed (Mbps)
480
490
500
510
520
530
540
5 10 15 20 25 30
PISA
Sco
re
Avg. Internet Speed (Mbps)
U.S.
South Korea
SpainAustria
United Kingdom
SwedenFrancePortugal
ItalyLuxembourg
Finland
Switzerland
NorwayDenmarkBelgium
Japan
Netherlands
There is a strong relationship between higher Internet speeds and education outcomes

Citi GPS: Global Perspectives & Solutions July 2017
© 2017 Citigroup
86
Figure 87. Closed Loop Instructional System
Source: BCG
However using technology for the sole purpose of improving the current system at the margin might throw up underwhelming results. The real opportunity lies in redesigning educational processes. BCG recommends a closed loop — an integrated instructional system wherein clear objectives are established, a curriculum is designed to meet those objectives, instructors teach the curriculum in a compelling fashion, frequent assessments are used to spot problems and intervene as necessary, and finally outcomes are monitored carefully to modify and improve the closed loop for future students.
As an example, this could involve clearly identifying supporting digital resources while designing the curriculum, adopting blended techniques while delivering instruction, online assessment and data on skill mastery can be linked to a personalized learning plan with immediate intervention when learning gaps are identified, and progress is continuously tracked through the learning plan.
Thus technology can play a role in transforming each segment of the education process including content creation, distribution, and learning management. The greater prevalence of mobile devices is increasing the number of access points to e-learning while simultaneously the inability of physical infrastructure to keep up with the rapid growth in students worldwide, and stagnating student outcomes are driving greater adoption of EdTech. EdTechXGlobal estimates that the global EdTech market will grow at 17% CAGR to $252 billion by 2020.
Mobile devices can also increase the access points for e-learning

July 2017 Citi GPS: Global Perspectives & Solutions
© 2017 Citigroup
87
Figure 88. EdTech Funding and Deal Volume Figure 89. Cumulative 2011-15 EdTech Funding and Deal Volume by Market Segment
Source: CB Insights, Citi Research Source: BCG, Citi Research
EdTech companies have raised almost $10 billion in funding since 2012.
Currently annual fundraising is trending at a run-rate of slightly below $2.5 billion, after peaking at just under $3.5 billion in 2015.
It is worth noting here that fourth quarter of 2015 was an outlier with a few companies raising unusually large sums — HotChalk ($230 million), TutorGroup ($300 million), and Udacity ($105 million) alone raised over $600 million.
In Figure 89, we analyze funds raised between 2011 and 2015 across the various segments of the EdTech market:
Multimedia content delivery and platforms attracted the most funds at $2.3 billion, over the five years. This includes interactive products and services in formats such as video, music, social media, blogs, presentations, and surveys.
Online courses and tutoring received just under $2 billion in funding. This includes MOOCs and tutoring and test-preparation services.
Management tools including business, systems, security, and learning received a little over $4 billion in funds during the five-year period.
Next we consider the emerging areas in EdTech, which all aim to achieve one or more of the following:
– Personalize the learning process;
– Make the content more immersive and engaging;
– Make learning flexible; and
– Reduce the cost of education through efficiency and productivity.
0
100
200
300
400
500
600
0
500
1000
1500
2000
2500
3000
3500
4000
2012 2013 2014 2015 2016 LTM1Q17
Funding ($ Mn) Deals (RHS)
050100150200250300350400450500
0.0
0.5
1.0
1.5
2.0
2.5
Mul
timed
ia c
onte
nt d
eliv
ery
Onl
ine
cour
ses
and
tuto
ring
Bus
ines
s m
gmt a
nd fi
n te
ch
Sys
tem
s, s
ecur
ity ,
and
infra
Hig
her e
d pr
ogra
ms
and
serv
ices
Ble
nded
lear
ning
and
LM
Sto
ols
Lang
uage
and
lite
racy
Aca
dem
ic s
tand
ards
-bas
edan
d C
omm
on C
ore
prog
.A
dapt
ive
curr
icul
a an
dm
achi
ne le
arni
ngS
ocia
l pla
tform
s an
d le
arni
ngco
mm
uniit
esP
rogr
ams
for s
peci
al-n
eeds
popu
latio
nsC
aree
r and
voc
atio
nal
educ
atio
n Gam
es
Pro
vide
rs a
nd d
istri
buto
rs o
fed
mat
eria
lsIn
tera
ctiv
e st
imul
ator
s an
dse
nsor
s
Funding ($ Bn) Deals (RHS)

Citi GPS: Global Perspectives & Solutions July 2017
© 2017 Citigroup
88
Digital Books and Courseware
According to the National Association of College Stores (NCAS), students in the U.S. spend an average of $602 per year on course materials. The College Board estimates that actual spend is more than double this figure at $1,298. Given that a textbook is typically recommended by the course instructor who does not play a part in the actual purchase of the book, the textbook market does not lend itself very well to the dynamics witnessed in other free markets – i.e. price setting through interactions between buyers and sellers. This has led to the creation of robust markets for used and rental books. In fact, earlier this year, Pearson entered into a partnership with Chegg to provide students with affordable rental options for both print and e-book versions of popular Pearson higher education titles. According to one research study, the used textbook market accounts for nearly a fifth of the U.S. college book market and 40% of students rented at least one item of course material in Spring 2016, up from 35% in Spring 2014. McKinsey117 estimates that a quarter of all textbooks sold are custom publications, which typically get updated annually, or contain consumable elements such as workbooks, and thus are not well suited for the used or rental market. Thus eventually the new book print market could potentially be restricted to this 25% apart from when new editions are published.
Figure 90. Share of Media Used in U.S. College Courses, 2015 Figure 91. Preferred Textbook Formats in U.S. Colleges
Source: Simba Information, Citi Research Source: NCAS, Citi Research
Given that the marginal cost of an e-book is zero, it would not be unreasonable for one to expect them to dominate the textbook market. However, according to one survey, print is still the single most preferred textbook format with 40% of students indicating it as their first choice. Only 7% said a stand-alone e-book was their most preferred format. Portability and lower price are the top reasons for preferring digital material while print formats are preferred for being easier to study from, easier to flip through, and easier to read. The reasons listed for preferring print are perhaps more critical to the learning process, and even on the issue of cost, used and rental books can offer print textbooks at a compelling price point.
117 Benson-Armer, R., Sarakatsannis, J., & Wee, K. (2014 August). The future of textbooks. McKinsey. Retrieved from: http://www.mckinsey.com/industries/social-sector/our-insights/the-future-of-textbooks
New Textbooks40%
Used Textbooks18%
Digital Media42%
0% 10% 20% 30% 40%
No preference
Digital textbook with anadditional digital component
Custom course pack
Digital textbook (ebook)
Depends on the course
Print textbook with a digitalcomponent
Print textbook
The textbook market is unique in that there is a strong used book market
Students today still prefer print textbooks to digital offerings

July 2017 Citi GPS: Global Perspectives & Solutions
© 2017 Citigroup
89
However blended products — a hybrid of print and digital tools — are gaining greater acceptance in higher education. Referred to as Courseware in the industry, it integrates a textbook (print or e-book) with digital supplements, i.e. assessment tools. This model has worked particularly well with quantitative STEM courses where practice-based learning and problem solving is important. Some publishers also offer an integrated digital product, for example Pearson’s REVEL, which combines content, assessment, and feedback in a fully digital and mobile model that replaces the traditional textbook. Here the content and user experience can be reimagined based on learning design and it is suited to a broader range of courses, including soft science or non-quantitative subjects. These blended models can also be integrated with adaptive learning systems, which at its core recognizes that not every student learns the same way or at the same time. We will cover the topic of adaptive learning in greater detail in a later section. There are several other models looking to disrupt the textbook space:
– Open Educational Resource (OER) providers like Khan Academy offer content at little to no cost. OER is useful in instruction models such as a flipped classroom where students do their assigned reading and listen / view online lectures at home, and concept engagement takes place in the class room with the help of the instructor. OER has proven relatively popular for maths and statistics, but even here, faculty adoption rates are low at just under 4%.
– Online Courseware Creators go a step beyond OER and incorporate assessments, adapt the learning experience based on the students’ needs, and use the data captured for analytics. Several leading MOOCs provide online courseware.
– Flat World offers a type of limited self-publishing service. Essentially, it offers a selection of textbooks on a variety of disciplines which the course instructors can customize based on their requirements – typically re-ordering or deleting chapters. Once the instructor ‘adopts’ a book, a unique URL is sent to students from which they can buy a print or online copy at a price that is lower than that of a traditional textbook.
Figure 93. Global Educational Books Revenue (US$ Bn)
Source: PWC, Citi Research
35
36
37
38
39
40
41
42
2015 2016 2017 2018 2019 2020
US$
Bn
Print/digital blended products are gaining acceptance with students
Figure 92. OER Faculty Adoption Rate
Source: NAVSTEM, Citi Research
3.6%
1.0%
3.9%
1.0%
0.0%
0.5%
1.0%
1.5%
2.0%
2.5%
3.0%
3.5%
4.0%
4.5%
Maths & Statistics Science2014 2015

Citi GPS: Global Perspectives & Solutions July 2017
© 2017 Citigroup
90
PWC118 estimates the global educational books market will register a 1.9% CAGR between 2015 and 2020. The marginal shrinkage of the print market is estimated to be more than offset by strong growth in digital.
Artificial Intelligence
Technavio defines Artificial Intelligence (AI) as a technology that uses machine intelligence and human-like thinking ability to make decisions, predictions, and recommendations. The global AI market in education is estimated to grow by a CAGR of 47% to $82.5 billion through 2021.119 Technavio attributes this growth to the adoption of Intelligent Tutoring Systems (ITS) which are designed to interpret complex human responses and simultaneously impart knowledge on various subjects.
Carnegie Learning’s “Mika” software is one example of the use of ITS platforms in education. According to its creators, it uses a combination of cognitive science and AI to provide personalized feedback to students. A Department of Education-funded randomized trial of more than 18,000 students at 147 middle and high schools in seven states found that, in the second year of implementation, Carnegie Learning’s approach nearly doubled growth in performance on standardized tests relative to typical students. A subsequent study found that student gains were even larger for students who completed more curriculums in the Carnegie Learning Software. Carnegie estimates the cost of remedial learning currently totals $6.7 billion per year, with only a 33% success rate for math courses.
Figure 94. Carnegie Learning Blended Approach Doubled Growth in Performance vs. Control Group
Figure 95. Virtual Human Agent Prototype
Note: Higher completion students completed more than 27 hours in Carnegie Learning Software Source: Carnegie Learning, Citi Research
Source: USC Institute for Creative Technologies
118 PwC (2016). Global Entertainment and Media Outlook 2016-2020. PwC. 119 Business Wire (2017 February 20). Top 3 Trends Impacting the Artificial Intelligence Market in the US Education Sector Through 2021: Technavio. Business Wire. Retrieved from: http://www.businesswire.com/news/home/20170220005208/en/Top-3-Trends-Impacting-Artificial-Intelligence-Market
0
0.1
0.2
0.3
0.4
0.5
0.6
Control Carnegie LearningAlgebra I
Carnegie LearningAlgebra I Higher
Completion
Stan
dard
Dev
iatio
ns
Intelligent Tutoring Systems are increasing the market for AI in education

July 2017 Citi GPS: Global Perspectives & Solutions
© 2017 Citigroup
91
Along with ITS, smart content, and virtual instructors are other potential applications of AI in the field of education.120 According to Daniel Faggella at Techemergence, “Smart content creation, from digitized guides of textbooks to customizable learning digital interfaces, are being introduced from elementary to post-secondary to corporate environments”. Specific applications include breaking down textbooks into smaller modules, and also automatically creating summaries of the content. The University of Southern California (USC) Institute for Creative Technologies has created ‘Bill’ a ‘SimCoach’ who draws upon AI, 3-D gaming, and computer animation techniques to develop realistic social interactions. Each conversation helps ‘Bill’ to improve his realism. While this virtual character is currently being used to assist military families dealing with Post–Traumatic Stress Disorder (PTSD) and depression, similar characters could potentially be created for an educational setting.
The ubiquitous IBM Watson has found applications in education too. For example the AI platform has been embedded into Pearson’s courseware and is able to assess student responses to guide them with hints, feedback, explanations, and help identify common misconceptions, working at the student’s pace to help them master the topic. Students are also able to ask the AI platform specific questions, on a particular topic, in real time.
Wearable Technology
Wearables refer to any electronic technology that is incorporated into items of clothing and/or accessories which can be comfortably worn on the body. The market for classroom wearable technology in the U.S. is estimated to grow at a CAGR of nearly 46% by 2020 to $3.7 billion.121 The wrist-worn equipment product segment specifically is estimated to account for more than 44% of this market. Application of wearables can vary in the learning environment.
Magic Leap uses a head-mounted display to create augmented reality. It enables people to generate digital images indistinguishable from physical objects, superimposing them seamlessly into the world around them. This results in a digital experience that can be unobtrusively integrated into the classroom, augmenting learning activities and animating key ideas.
Thync has developed a wearable for neurosignaling — i.e., the device sends signals to the brain to affect mental states like relaxation, calm, energy, or focus, delivering cognitive enhancement.
Oral Roberts University uses Fitbit devices to track the fitness activities required of its students as part of its Whole Person Education program. The information collected by the wearable is directly transferred to the gradebook maintained by the D2L learning management system.
120 Faggella, D. (2017 March 7). Examples of Artifical Intelligence in Education. Techemergence. Retrieved from: https://www.techemergence.com/examples-of-artificial-intelligence-in-education/ 121 Business Wire (2016 April 20). Technavio Expects the Classroom Wearables Technology Market in the US to Reach USD 3.7 Billion by 2020. Business Wire. Retrieved from: http://www.businesswire.com/news/home/20160420005037/en/Technavio-Expects-Classroom-Wearables-Technology-Market-Reach
Virtual instructors are another potential application of AI that education can use

Citi GPS: Global Perspectives & Solutions July 2017
© 2017 Citigroup
92
M-learning
M-learning, or mobile learning, involves the use of mobile technology to enable learning anytime and anywhere. M-learning can help facilitate access, creation, collaboration, and also management of the entire education process. The global M-learning market is estimated to register an 11% CAGR to reach $14.5 billion by 2019.122 Along with the proliferation of mobile devices, growth is likely to be driven by the following factors:
Several developing countries have low personal computer (PC) penetration, but high mobile subscription rates. According to Ambient Insight, 67 of the 119 countries analyzed by it had mobile Internet access rates higher than PC access. Several of these countries are likely to skip developing their PC infrastructure in favor of mobile devices.
Mobile learning Value Added Services, wherein the mobile network operators license content from third parties and sell a subscription-based product directly to consumers, is growing at a rapid pace. In 2013 Brazilian telecom Vivo combined all of its mobile learning products into one subscription and marketed it directly to consumers. The service gained six million active users in a span of two years.
Education apps are likely to register a 28% CAGR between 2016 and 2020. The three dominant types of mobile learning apps are language learning, early childhood learning, and brain teasers.
The rise of smartphone-enabled virtual reality apps, i.e., Google Expeditions which is a virtual reality teaching tool with close to 500 ‘expeditions’ available and more in development.
Learning Management System
The Center for Educational Leadership and Technology describes a learning management system (LMS) as an online database that links curriculum, instructional resources, assessment strategies, student data, and staff proficiencies. Through the LMS, learning facilitators are able to articulate learning goals, align content and assessments, and adhere to standards as they relate to selected curricula and instructional programs. Instructional resources, such as textbooks, podcasts, web-based apps, videos, e-books, and manipulatives can be connected to specific learning activities with a description as to the use of such materials. The learning process is connected and contextual. Teachers can document, record, and electronically share classroom lessons that have been successful in achieving specific student outcomes with unique and diverse student needs. The correlation of measurable results to instructional resources shifts the emphasis away from a curriculum dictated and limited by the textbook, to one encouraging inquiry and the development of lifelong learning skills.
122 Adkins, S. S. (2015). The 2014-2019 Worldwide Mobile Learning Market. Ambient Insight.
M-learning helps facilitate the access, creation, collaboration and management of the entire education process
LMS databases, link curriculum, instructional resources, assessment strategies, student data, and staff proficiencies

July 2017 Citi GPS: Global Perspectives & Solutions
© 2017 Citigroup
93
Figure 96. LMS Platforms by Number of U.S. Higher Education Adoptions – Spring 2017
Source: Edutechnia, Citi Research
LMS platforms and e-learning products are designed to seamlessly integrate with each other. Pearson’s MyLab and Mastering offer single sign-on with a variety of LMS platforms including Moodle and Blackboard. Pearson also allows for grades to be transferred from its own products to the LMS. Similarly Knewton, an adaptive learning platform, allows for its assignments and quizzes to be launched from an LMS. Knewton also supports grade transfers.
Figure 97. Key Features - Major Tech ‘Classroom’ Platforms
Apple Google Microsoft Create & distribute assignments No Yes Yes Built-in gradebook No No No Post updates & announcements Yes Yes Yes Content and data integration with third-party apps No Yes Yes Monitor student devices Yes No No Save & store documents within Classroom No Yes Yes Parent/ guardian notification No Yes No
Source: EdSurge
Google, Apple, and Microsoft all have their own “Classroom” products aimed at the K-12 market. However, as noted in the above table, these products are somewhere between a full-fledged LMS (Apple and Microsoft), and a device manager (Apple).
The global LMS market is estimated to register a CAGR of 24% over six years to reach $19 billion by 2022.123
123 Zion Market Research (2017 January 17). Global Learning Management System Market will reach USD 19.05 Billion by 2022: Zion Market Research. Zion Market Research. Retrieved from: https://globenewswire.com/news-release/2017/01/17/906276/0/en/Global-Learning-Management-System-Market-will-reach-USD-19-05-Billion-by-2022-Zion-Market-Research.html
0
200
400
600
800
1000
1200

Citi GPS: Global Perspectives & Solutions July 2017
© 2017 Citigroup
94
Gamification
Gamification is the application of video game rules, mechanics, and conventions to a non-gaming situation. The idea is to shift the learning process away from the use of books and lectures and towards experiential and inquiry-based learning. It makes extensive use of digital badges which act as motivational tools and also as proof of proficiency. The gamification market is estimated to register a 68% CAGR over the next five years to reach $1.25 billion by 2020.124 This is not to be confused with game-based learning systems which are literally video games with an educational theme. Several game engines have come into existence which supply core functionalities such as sound, animation, AI, networking, and scripting. Using such tools gamification is being used in a variety of ways. CodeFights is a website that offers free gamified challenges to users as a way of helping them learn coding. Once the users demonstrate competency they stand a chance of being picked up by employers and the website itself gets paid 15% of a successful candidate’s starting salary. Knack, a start-up, offers gamified psychological tests which scores the user on traits such as empathy and integrity based on how they choose to serve customers at a restaurant within the game. DuoLingo uses games to help teach languages and uses the data it has captured to automatically adapt the learning experience.
Figure 98. DuoLingo Uses Gaming Attributes Such as Streak Count and Hearts
Source: DuoLingo
124 Business Wire (2016 December 5). Global Education Gamification Market to Grow at an Impressive CAGR of Over 68% through 2020, Reports Technavio. Business Wire. Retrieved from: http://www.businesswire.com/news/home/20161205005450/en/Global-Education-Gamification-Market-Grow-Impressive-CAGR
Experiential learning and inquiry-based learning through gamification is gaining traction

July 2017 Citi GPS: Global Perspectives & Solutions
© 2017 Citigroup
95
Massive Open Online Courses (MOOCs)
Massive open online courses (MOOCs) are courses characterized by large scale student participation via the Internet. The courses have periodic assessments and a specific end-point. These courses operate at scale, and thus spread fixed costs over a large base by automating assessments and limiting instructor contact with individual students. A simple way to think about MOOCs is that they are a modern-day version of correspondence courses. An important pedagogical attribute lacking in correspondence studies was that students had very little interaction with the faculty or other students. In MOOCs, students typically rely on self-organized study and discussion groups. GSV Advisors estimates that the MOOC market will grow at a 50% CAGR until the end of this decade to reach about $400 million by 2020.125 The main value propositions are:
– Access to faculty and instruction material of premier institutions on a massive scale at a fraction of the tuition cost of the flagship programs and with none of the associated onerous admission criteria;
– The ability to complete courses at one’s own convenience;
– Massive quantities of data generated enable adaptive learning platforms to personalize the learning experience; and
– Successful institutions and faculty can gain a global following.
Figure 99. MOOCs – New Courses Added and Participating Universities Figure 100. MOOCs by Registered Users (million)
Source: Class Central, Citi Research Source: Class Central, Citi Research
In 2016, over 700 universities offered over 2,600 new MOOC courses. While incremental new courses offered have averaged around 2,000 in the last three years, participating universities have increased over 3x from almost 200 universities in 2013. Courses in business and technology are the most popular offerings accounting for over 35% of all courses. Coursera with 23 million users is the largest MOOC provider by registered users followed by edX. Interestingly a quarter of the new users added in 2016 have come from regional MOOC providers such as XuetangX (China) and MiriadaX (Latam).
125 Global Silicon Valley (2016). 2020 Vision: A History of the Future, GSV Media, California.
0
100
200
300
400
500
600
700
800
0
500
1000
1500
2000
2500
3000
2013 2014 2015 2016New courses announced Universities (RHS)
0
5
10
15
20
25
Coursera edX XuetangX FutureLearn Udacity
The MOOC market is expected to grow at a 50% CAGR through 2020 to about $400 million
An increasing number of universities are offering MOOC courses

Citi GPS: Global Perspectives & Solutions July 2017
© 2017 Citigroup
96
Most major MOOC providers are for-profit in nature with both Coursera and Udacity backed by venture capital and FutureLearn wholly-owned by the UK’s Open University. edX is the only major not-for-profit MOOC developed through a partnership between MIT and Harvard.
Virtual/Augmented Reality (VR/AR)
VR/AR is starting to be incorporated into educational settings. It is said that people can remember things more accurately through experience than they can by reading text or listening to speech. VR/AR is a means of experiencing virtual reality in a natural and direct way, and is unlike looking at things on a page or projected on a flat screen. We think it will take hold as a next-generation learning method.126
The use of VR/AR makes possible experiences such as visiting ruins or other famous sites, looking around museums, and being under the sea or in outer space, all possible while sitting in a classroom. Because VR/AR imparts a greater feeling of reality than photos or two-dimensional video, it enables, for example, the user to look up at Dubai’s Burj Khalifa from directly below and get a true sense of its size. Using VR/AR to experience things from the past and the future, as well as being transported to outer space or under the sea, is likely to become an entirely new learning method. Another example of VR/AR at its best is the way it can be used to impart a three-dimensional understanding of structures such as the human body and buildings. VR/AR unlocks deep meaning unimagined for many years as well as complex physical structures.
Examples of VR/AR being introduced in the education field are growing steadily, and there are now many related companies with clear concepts. Among the standouts in the STEM (science, technology, engineering, and math) field is zSpace, a company founded in 2007 and based in Silicon Valley. zSpace specializes in STEM. It is said that in the fields of science and math, it is difficult to deepen one’s understanding through the printed page, whereas VR/AR makes breakthroughs highly likely.
Figure 101. Experience and Understand Objects in Three Dimensions Figure 102. Enabling Breakthroughs in STEM Areas
Source: zSpace Source: zSpace
126 Citi GPS & Ezawa, K. et al (2016). Virtual & Augmented Reality. New York, NY: Citi.
VR/AR looks likely to take hold as a next-generation learning method

July 2017 Citi GPS: Global Perspectives & Solutions
© 2017 Citigroup
97
zSpace offers a service in which virtual classrooms — designed specifically for students ranging from elementary school to high school — are installed in schools. In these virtual classrooms, students wear 3D glasses and use specialized pens to operated dedicated computers and dedicated displays that project images of 3D objects seemingly into empty space. Students see physical objects appear to float up from the screen into three dimensions, allowing them to examine the objects in their entirety by rotating them up/down and left/right. This makes possible the kinds of educational experiences in the STEM field that are difficult to have in the real world. To date, around 100 school districts in the U.S. have installed zSpace’s virtual classrooms, and the company’s products are scheduled for introduction in additional countries in the future.
A number of companies in addition to zSpace are also starting to make progress in their education-related VR/AR efforts.
Nearpod provides content that enables students to go on field trips in virtual space. The company’s product also allows teachers to easily create their own VR teaching materials, enabling them to incorporate their classroom objectives and their students’ requests.
Immersive VR Education also provides content, but specializes in enabling students with experience in VR to learn about objects through role-play. For example, the company’s service allows students studying history to experience being part of the Apollo 11 crew and being the first person to land on the moon.
Universiv, another company providing VR-based education, believes that the platform is as critical to education and study as it is to entertainment, and highlights statistics showing that students remember 20% of the information they hear and 30% of the information they see, but 90% of the information they receive through activity or simulation. It believes that VR is thus optimal for various types of study.
There are also problems in education-related VR/AR. It is said that small children are at risk of becoming cross-eyed if they look at video on a twin-lens VR viewer. This problem will be difficult to solve quickly, since it is closely related to the mechanics of VR/AR. In the near term, we think VR/AR may have to be viewed as an education tool for students above a certain age.
SuperData estimates the virtual reality software market in education will amount to just under $50 million in 2018.127
127 Virtual Reality Reporter (2016). SuperData Expands Market Research Scope & Forecast of $40 Billion VR Market. Virtual Reality Reporter. Retrieved from: https://virtualrealityreporter.com/superdata-expands-research-scope-of-40-billion-virtual-reality-market/

Citi GPS: Global Perspectives & Solutions July 2017
© 2017 Citigroup
98
Privacy
Traditionally, access to student data such as attendance, grades, and health records were restricted to the administrator, guidance counselor, or other school official. With technology becoming increasingly ubiquitous in schools, all this data could be accessible to third parties such as vendors of learning management systems. This has caused some distress among parents and educators. InBloom, a data analytics company, funded by the Gates Foundation, with access to large batches of student data for the purpose of personalization of the education process, had to shut shop in 2014 due to protests from parents. While there were no instances of data breaches, critics were concerned about the potential for a breach, and also the fact that InBloom did not provide parents with an option to “opt-out”. Learning from the experience of InBloom, other EdTech companies have chosen a softer approach. Google, for example, has stopped automatically scanning student e-mails to collect data for ad purposes.
There are also concerns about broad-based legislation hampering EdTech’s ability to use student data to improve education effectiveness. In our ePrivacy and Data Protection GPS report, we said that, in the context of Europe, the proposed changes in privacy and data protection regulations as embodied in the General Data Protection Regulation (GDPR) and the proposed ePrivacy regulation could have significant implications for the broader online ecosystem. The upside from concepts like artificial intelligence, machine learning, and the Internet of Things could all be somewhat undermined if companies are restrained from fully exploiting the potential of big data and data analytics. Education companies, or indeed companies collecting large amounts of data on children, are also potentially affected because of a tightening of consent rules which now apply to all minors under the age of 16 (vs. 13 under the previous directives).
Returning to the “2 Sigma Problem” articulated by Benjamin Bloom, perhaps the most obvious application of EdTech is the personalization of education.
Privacy concerns in education are high as student information is sensitive

July 2017 Citi GPS: Global Perspectives & Solutions
© 2017 Citigroup
99
Bespoke Learning “Mass education was the ingenious machine constructed by industrialism to produce the kind of adults it needed”…”the whole idea of assembling masses of students (raw material) to be processed by teachers (workers) in a centrally located school (factory) was a stroke of industrial genius. The whole administrative hierarchy of education, as it grew up, followed the model of industrial bureaucracy. The very organization of knowledge into permanent disciplines was grounded on industrial assumptions. Children marched from place to place and sat in assigned stations. Bells rang to announce changes of time”…” The inner life of the school thus became an anticipatory mirror, a perfect introduction to industrial society. The most criticized features of education today – the regimentation, lack of individualization, the rigid systems of seating, grouping, grading and marking, the authoritarian role of the teacher – are precisely those that made mass public education so effective an instrument of adaptation for its place and time”
– Alvin Toffler, Future Shock, 1970
One wonders, in a post-industrial society and in the age of mass customization, must education still be mass produced?
Bespoke learning is an instructional method that seeks to shift away from the one-size-fits-all education model and instead tailors the learning experience around an individual’s unique abilities. We use bespoke learning as an umbrella term to cover nuances such as adaptive learning, personalised learning, flipped classroom, and blended learning.
1. Adaptive Learning
EdSurge defines digital adaptive learning as education technologies that can respond to a student’s interactions in real time by automatically providing the student with individual support. Adaptive tools “adapt” at three places:
Content: When a student makes a mistake, adaptive features within content can respond to the students’ academic needs by providing corrective feedback and hints that are based on the students’ misunderstandings, as well as additional learning resources and support for immediate remediation. This is different to simply telling students whether their answers are correct or incorrect after an activity or practice question. Adaptive content is also able to respond to a student with scaffolded support – i.e., mastering a particular skill by breaking it down into its components.
Assessment: Here the items change based on how individual students answer each question. This change is often a result of the difficulty level of the item. For example, if a student answers an easy question correctly, the next item they receive will be a little harder, and so on.
Sequence: This involves collecting real-time data and using the data to change the sequence of what a student learns next. For example, DreamBox assigns individual students a group of math content to work on. As the student interacts with the content, either by answering questions, clicking on hints, or using virtual manipulatives, DreamBox saves the information about the student’s actions. When they complete the assignment, the tool analyzes the student’s academic performance and learning behaviours, before matching them to a new set of skills based on his or her performance. Then, DreamBox automatically assigns the student a new group of content.
Shifting way from one-size-fits-all-learning, bespoke learning tailors the learning experience

Citi GPS: Global Perspectives & Solutions July 2017
© 2017 Citigroup
100
Figure 103. Knewton – Adaptive Learning Outcome Figure 104. DreamBox – Adaptive Learning Outcome
Source: Knewton, Citi Research Source: Dreambox, Citi Research
Outcome studies appear encouraging. After using Knewton Math Readiness for one semester with nearly 2,000 remedial math students at Arizona State University, pass rates improved nearly 10 percentage points while withdrawal rates more than halved to 5.6%. A study by Harvard University suggests students using DreamBox Learning Math for 14 hours increased achievement on Northwest Evaluation Association Measure of Academic Progress (MAP) assessments by nearly 4 percentage points. The study further suggests a linear relationship between achievement gains and hours spent on the adaptive learning platform.
2. Personalized Learning
Personalized learning does offer different learning pathways to individual students however it is rule-based and does not adapt to the individuals progress in real time. Students might be asked to take a diagnostic test on the first day of class the results of which will be fed into a rules-based engine which would then chart out the student’s learning pathway for that semester or year. However there is no effort made towards course correcting the pathway on a real time basis.
67%
13%
66%
14%
75%
6%
0%
10%
20%
30%
40%
50%
60%
70%
80%
Pass rates Withdrawals2009 2010 2011 (Knewton)
0
2
4
6
8
10
12
0
5
10
15
20
25
30
35
40
45
Grades 3-5(Harvard)
Grades K-1 (SRI) Grades 3-5(Harvard)
Perc
enta
ge p
oint
Hou
rs
Study hours Improvement in elementary math achievement (RHS)

July 2017 Citi GPS: Global Perspectives & Solutions
© 2017 Citigroup
101
Figure 105. Education Elements – Personalized Learning Outcome
Source: Education Elements, Citi Research
Education Elements, a personalized learning consultancy and service provider has registered consistent improvement in student outcomes. A sample of three schools that deployed Education Elements’ personalized learning system witnessed an eight percentage point rise in students meeting or exceeding growth targets in reading and a 12 percentage point rise in math over three years.
3. Flipped Classroom
In this instructional method students do their assigned reading and listen/view online lectures at home, while concept engagement takes place in the class room with the help of the instructor. The rationale behind this move is the belief that passive learning like gaining knowledge and comprehension is low-level cognitive work, while more engaged learning, like evaluation, application, and synthesis, requires high-level cognitive work. The flipped classroom model provides students with a supportive classroom environment for them to tackle harder, higher level cognitive work, while letting them do the “easier” lower level cognitive work at home. The model also helps students to follow lectures at their own pace by pausing and rewinding the video lectures whenever they need to.
When Villanova University's College of Engineering128 ran a pilot program for flipping engineering courses, the bottom third of students' grades were improved by more than 10% higher than in a traditional classroom (the difference between a D+ and a C) and by more than 3% higher for the entire class as a whole (moving from a C+ to a B-).
128 Bidwell, A. (2014 August 5). Clipped Classroom May Help Weaker STEM Students. U. S. News & World Report. Retrieved from: https://www.usnews.com/news/stem-solutions/articles/2014/08/05/taking-a-page-from-humanities-college-engineering-gets-flipped
52% 51%
58% 58%60%63%
0%
10%
20%
30%
40%
50%
60%
70%
Reading Math
Year 1 Year 2
Changing the way that students interact in a classroom through dividing low-level cognitive and high-level cognitive work is showing results
Citi GPS: Global Perspectives & Solutions July 2017
© 2017 Citigroup
102
4. Peer-to-Peer Learning
Simply put, in peer-to-peer learning students interact with other students to attain educational goals. An extreme form of this method is 42, a computer-programming training school, championed by Xavier Niel, founder of the telecommunications company Free. 42 provides its curriculum completely free-of-charge to its students and the program does not involve the supervision of a teacher but instead relies upon peer-to-peer and project-based learning. Students are given a choice of projects with real-world relevance which they are expected to complete using resources freely available on the Internet and by seeking help from their fellow students. Another student will then be randomly assigned to mark their work. The students go up a level by completing a project. They graduate when they reach level 21, which usually takes three to five years. At the end they receive a certificate, but no formal degree. The proponents of this education method claim that it makes up for shortcomings in the traditional education system, which they say encourages students to be passive recipients of knowledge.
5. Blended Learning
Blended learning refers to any instructional method that combines online tools with traditional classroom methods.
Even if personalization were to improve learning outcomes, this still begs the question, is this learning relevant in the job market? Is the acquisition of knowledge aligned with its application?

July 2017 Citi GPS: Global Perspectives & Solutions
© 2017 Citigroup
103
Education to Employment A 2015 survey of U.S. employers and college students by the Association of American Colleges & Universities revealed that there exists a wide divergence in how employers and students view the effectiveness of colleges and universities in preparing graduates for entry-level jobs. While 74% of graduates felt that the educational institutions were doing a good job, only 42% of employers shared the same opinion. In fact, 51% of employers believed that the institutions needed to undertake moderate to major improvement, while only 20% of students felt the same way.
In several markets there is a skills gap with high unemployment and underemployment rates co-existing with unfilled positions. In this section we consider pathways for a smooth transition from education to employment.
1. Vocational Education and Training
A survey, commissioned by Citi Foundation of over 7,000 young people in 45 cities, across 32 countries around the world, revealed that 78% of respondents viewed apprenticeship and internship programs as vital to their professional success. In fact, the perception of such programs was higher in developing markets with 85% of respondents from these markets agreeing that the programs were vital. However, a large number of respondents also felt that there weren’t enough apprenticeship programs in their cities. While this was again skewed towards developing markets, a large number of developed market respondents too felt the same way.
According to the study, Mumbai, Nairobi, Manila, Panama City, New Delhi, and Lima are at the intersection where respondents value apprenticeship programs the most, but also believe that there are too few programs available.
Figure 106. Perceptions of Apprenticeships/Internships Figure 107. Importance of Apprenticeships/Internships vs. Perceived Availability (% Strongly/Somewhat Agreed)
Source: Citi Foundation – Pathways to Progress – Global Youth Survey 2017 Source: Citi Foundation – Pathways to Progress – Global Youth Survey 2017 The OECD defines vocational education as education/training that prepares the participants for direct entry into specific occupations. Countries spent an average of just 0.2% of GDP on Vocational Education and Training (VET) vs. 4.3% of GDP on early-childhood, primary, and secondary education. A further 1.3% of GDP was spent on tertiary education. The OECD has made several recommendations aimed at improving VET programs:
78%
60%
73%
56%
85%
65%
0%
10%
20%
30%
40%
50%
60%
70%
80%
90%
Apprenticeships/ Interships arecritical to my career success
There are not enoughapprenticeships/ internships in
my city
Total Developed markets Developing markets
Apprenticeships and internships are viewed by young people as vital to professional success
Spending on VET is low but the OECD has made several recommendations aimed at improving VET programs and increasing spend

Citi GPS: Global Perspectives & Solutions July 2017
© 2017 Citigroup
104
It calls for sharing of costs among the stakeholders who are likely to benefit from VET programs. Governments should look to subsidize the provision of VET through instruments such as income contingent loans and grants for lower income students. For their part, employers could make in kind contributions, for example via the facilities provided for workplace training. This is particularly true if employers seek to influence the VET curriculum to suite their specific requirements and as a consequence increase the value that they derive. Similarly, if governments don’t actively nudge students towards specific VET programs – say to plug demand-supply gaps – and the students have a free hand in deciding what program to pursue, it is argued that they should be required to foot a higher portion of the bill.
Rather than design VET programs unilaterally, governments should actively engage with employers and employee unions. The OECD recommends consultations with the industry at national, regional or sector level either through interactions with trade bodies or via surveys. It specifically cites the example of Hungary where the industry has the authority to decide on the number of students admitted to programs and also the qualifications to be delivered. Involving unions in the process might plug the risk of over-supply of specific skills given it’s in their interest to ensure wages aren’t driven downwards. Employers and unions can also play a critical role in ensuring that the curriculum remains up to date, i.e., the skills taught are relevant to the market. This could also involve accommodating VET trainers in workplaces for brief periods periodically in order to ensure that they are exposed to the latest work environments.
The OECD very aptly states that ‘learning is the point of teaching’. A standardized national assessment can be useful in determining learning outcomes for VET students. The test may be developed at the local level, but as long as they confirm to national standards they can help in determining whether VET programs are adhering to national standards. Apart from evaluating students, assessment could also involve inspection of the VET institutions themselves. Beyond ensuring minimum quality standards, assessments could also improve the perception about VETs. Employers may use performance in national assessments as a signal of competence, given that they are unable to evaluate individual capabilities.
If VET programs offer a pathway to tertiary education, this too could help in improving the acceptance/ perception of such programs. OECD notes that 25% of upper secondary VET students in the Netherlands continue into tertiary education. In fact in South Korea 75% of VET students transition into tertiary
2. Bootcamps
Coding bootcamps have emerged in response to the demand for manpower from Information, Communication & technology (ICT)-intensive occupations. The World Bank describes bootcamps as effective skill accelerators that teach specific technical skills through intense fast-track courses with a strong career focus. The World Bank has identified three aspects of the skills gap problem — urgency, proficiency in technology, and job market readiness and views the bootcamp approach as an effective tool to address all three facets of the problem. Firstly, it focuses on rapid training — 9-12 weeks — after which graduates are prepared to undertake the job in the industry, typically entry-level programming. Secondly, it focuses on applied skills — from digital marketing to programming.

July 2017 Citi GPS: Global Perspectives & Solutions
© 2017 Citigroup
105
Thirdly, it places a strong emphasis on career readiness, as bootcamps typically emerge in response to job market needs. Some also provide guidance on soft-skills, such as preparing participants for job interviews through career coaching.129
General Assembly, a coding bootcamp, has campuses in 20 cities with an alumni body of 35,000 graduates. It offers courses ranging from 10 to 12 weeks covering specific competencies including coding, design, data science, marketing, and business with each course costing around $10,000 – $15,000. While most students who arrive at the bootcamp do not have a deep background in computer science and engineering, General Assembly claims that across 2014-15, of those students using the in-house career-advisory services, 99% were hired within 180 days of beginning their job search.
In 2016, as part of Educational Quality through Innovation Partnerships (EQUIP), a pilot program by the U.S. Department of Education, students attending coding bootcamps were allowed to access federal student loans. The department will make $5 million in Pell grants available for the first year of EQUIP, and expects roughly 1,500 students will participate in these programs. Another $12 million in the form of subsidized and unsubsidized loans will also be made available.
Similarly, LearnUp offers bootcamps for positions across industries. A prospective job applicant can look at an employer’s open jobs, each of which has a set of recommended trainings. As the applicant completes the trainings, she builds a “skills resume” on LearnUp which can be used to apply for open positions. Unlike coding bootcamps, this system also caters to entry-level positions that do not require a secondary or college degree. Employers pay LearnUp a fixed fee to improve the candidate pool.
While all this might serve the purpose of equipping candidates with narrow albeit market relevant skills, the skills will still need to be updated periodically. As Andreas Schleicher, head of the education directorate of the OECD observed, “Vocational training has a role, but training someone early to do one thing all their lives is not the answer to lifelong learning”.
Lifelong Learning “Half-life of knowledge” is an expression coined by Fritz Machlup in 1962 to describe the time it takes for half the knowledge in a particular domain to be superseded. In 1966, the Institute of Electrical & Electronics Engineers (IEEE) postulated that the half-life of an engineering degree in the late 1920’s was about 35 years; for a degree from 1960, it was thought to be about a decade. According to some estimates software engineers need to redevelop skills every 12–18 months. More broadly, Deloitte now estimates the half-life of a learned skill at just five years.
Employees appear to be well aware of the need for lifelong learning. According to Deloitte’s 2017 Global Human Capital Trends report, Glassdoor data reveal that among millennials, the “ability to learn and progress” is now the principal driver of a company’s employment brand. Yet only one-third of millennials believe their organizations are using their skills well, and 42% say they are likely to leave because they are not learning fast enough.
129 Paradi-Guilford, C. & Khomyn, M. (2016 April 20). How coding bootcamps are helping to tackle youth unemployment. The World Bank. Retrieved from: http://blogs.worldbank.org/ic4d/how-coding-bootcamps-are-helping-tackle-youth-unemployment
Acknowledgement of the importance of retraining and lifelong learnings is positive

Citi GPS: Global Perspectives & Solutions July 2017
© 2017 Citigroup
106
Encouragingly though, the same report suggests that 83% of employers surveyed ranked “Careers and learning” as an important trend, only behind “Organization of the future”. A recent survey of human resource (HR) professionals revealed that learning and development roles were most likely to be expanded across all HR functions in 2017.
While acknowledgement of the importance of retraining and lifelong learning is certainly positive, we believe potential solutions will depend on the skill level of the employees, and will involve a mix of online and traditional methods, and also require the participation of other stakeholders such as governments and trade unions.
Figure 108. Careers and Learning Ranked as “Important” or “Very Important”
Figure 109. What HR Roles Do Organizations Plan to Increase or Decrease This Year?
Source: 2017 Deloitte Global Human Capital Trends, Citi Research Source: Sierra Cedar, Citi Research
1. Corporate Training for High-Skilled Employees
Historically corporate training relied on a push model where training departments identified required courses to be completed by employees based on their roles. This meant the learning management system was essentially a large internal catalogue of courses aimed at developing competencies. However such a model might be obsolete for two reasons, First, careers are no longer linear, in fact there is a focus on cross-functional convergence – bringing together disciplines to build products and solutions faster – and second, the availability of on-demand external learning platforms including MOOCs, self-directed learning powered by social media, and external certifications. An employer should no longer aim to create learning programs and instead should focus on curating the learning experience. Thus the push-based learning system should transform into a pull-based learning system where employees navigate and access content both internal and external to the company. Rather than teach specifics, companies should define high-level frameworks that outline broad capabilities. The learning management system would resemble a consumer website that provides content and access to experts, as well as recommendations that help people find precisely what they need.
MasterCard’s Operations & Technology group partnered with Degreed to offer employees self-serve career development wherein they can curate their own learning playlists using a variety of source materials including articles, videos, MOOCs, and webinars.
0%
10%
20%
30%
40%
50%
60%
70%
80%
90%
100% Percentage of respondents rating 'Careers and learning' important or veryimportant
10%7%
10%7% 6% 5%
7% 8%4% 3%
5%
14% 15%12%
16% 16%
21%23% 23%
29%33%
37%
0%5%
10%15%20%25%30%35%40%
Payr
oll
HR
Man
agem
ent
HR
Gen
eral
ist
HR
Bus
ines
s Pa
rtner
Bene
fits
Wor
kfor
ceM
anag
emen
t
HR
IT In
frast
ruct
ure
HR
Sys
tem
Sup
port
Tale
nt M
anag
emen
t
HR
Dat
a An
alyt
ics
Lear
ning
&D
evel
opm
ent
Decrease Increase

July 2017 Citi GPS: Global Perspectives & Solutions
© 2017 Citigroup
107
AT&T’s130 Workforce 2020 (WF2020) seeks to identify reskilling requirements and develop a blueprint for internal sourcing of the required skill sets. With an aim to simplify and standardize role structures to drive mobility and skill interchangeability, the program resulted in the consolidation of almost 250 roles across the group into 80. To facilitate the transition, HR launched an online self-service platform, which provided a host of tools and processes for performance management, career development, and talent planning.
The platform also offers a career profile tool (for assessing competencies, business experience, and credentials) and a career intelligence tool (for making informed career decisions by analysing hiring trends within the company and profiles of different jobs — with target salary range and number of incumbents). Once skill gaps are identified, employees proactively plug the gaps through online courses, certifications, and degree programs developed through a partnership between AT&T, Udacity, and Georgia Tech. Most employees spend five to 10 hours a week on retraining. To encourage union members to update their skills, union contracts outline training and development program specifics. Since 2013, when the initiative began, AT&T has spent $250 million on employee education and professional development programs and more than $30 million on tuition assistance annually.
The worldwide corporate training market is estimated at $130 billion. Of this the U.S. market is about $70 billion in size with an average annual growth of around 12% over the last four years. Future growth in training spend is likely to be driven by tools focused on external content curation, adaptive learning, micro-learning content, and intelligent tools to help recommend content, assess learning, practice and identify skills gaps.
2. Coordinated Effort for Lower-skilled Employees
On average, 35% of adults across 19 OECD countries are reported to have either had no computer experience, or their proficiency was limited to the most basic of tasks. In all, 65% of adults’ computer skills are limited to Level 1, i.e. tasks involving locating an item in a spreadsheet and communicating the result by e-mail, using e-mail to send information to several people, and categorizing e-mail messages into existing folders. Further, on average, an adult with tertiary education is 33 percentage points more likely than an adult with less than secondary education to perform at Level 2 or 3 in these assessments. Thus lower-skilled workers, as defined by educational attainment, are less likely to be able to benefit from computer-based learning platforms such as MOOCs and competency based learning platforms. It has been observed131 that people who receive lots of formal training are also the people who learn a lot during their work. Formal and informal learning are thus not complementary, and a lack of formal training is not compensated by informal learning. Training is often linked to changes in the work. High-skilled workers receive training much more often (57%) than low-skilled workers (24%). For low-skilled workers, in the absence of adequate training from employers, two other stakeholders might have a role to play – trade unions and governments.
130 Donovan, J. & Benko, C. (2016). AT&T’s Talent Overhaul. Harvard Business Review. Retrieved from: https://hbr.org/2016/10/atts-talent-overhaul 131 Netherlands Institute for Social Research (2016). Supply of Labor Report. The Netherlands Institute for Social Research, Netherlands.

Citi GPS: Global Perspectives & Solutions July 2017
© 2017 Citigroup
108
Figure 110. Percentage of Adults Scoring at Each Proficiency Level in Problem Solving in Technology-Rich Environments
Source: OECD
Trade unions132 have an industry-wide view of trends and are also associated
with employees throughout their working lives. In Denmark corporates consult unions in order to identify emergent skill needs and collective bargaining agreements cover paid leave for training. In Britain, UnionLearn, the learning and skills organisation of the Trade Union Congress (TUC) uses union members to educate employees about training options and also coordinates with employers on employees’ training needs. According to a study, between 2001 and 2013 union members in Britain were a third more likely to have received training than non-unionized members.
Singapore’s SkillsFuture offers an interesting model for governments to participate in lifelong learning. Employers, industry associations, unions, and professional bodies are required to detail changes that they expect will happen in their industries in the coming years and identify the skills that will be needed. This is used to create “industry transformation maps” which individuals can use to make informed choices on career development and skills. Further, Singaporeans aged 25 and above receive an initial credit of S$500 (~$365) from the Government to help pay for an approved skills-related course. On top of this, individuals can also apply for subsidies up to 90% of course fees.
132 The Economist (2017 January 12). Learning and earning: The elephant in the truck. The Economist. Retrieved from: http://www.economist.com/news/special-report/21714175-systems-continuous-reskilling-threaten-buttress-inequality-retraining-low-skilled
0%
10%
20%
30%
40%
50%
60%
70%
80%
90%
100%
Below level 1 Level 1 Level 2 Level 3 Other

July 2017 Citi GPS: Global Perspectives & Solutions
© 2017 Citigroup
109
3. Front-ending Education
Lifelong learning could also mean accelerating the introduction of certain concepts in primary and secondary schools which traditionally have been reserved for tertiary education. For example, IT skills are no longer an option for learning as they have become basic skills which are needed in most work opportunities no matter what level. The good news is that a number of experimental high school models have begun to surface in the U.S. These include inclusive STEM focused high schools which do not restrict admissions based on a student’s prior performance. Some early and middle college high schools are also allowing high school students to take some college classes alongside their high school curriculum. Pathways in Technology Early College High School (P-TECH) is a model program that allows students to graduate with a high school diploma and an associate’s degree in computing or engineering.
In the U.K., technical schools such as the Bristol Technology and Engineering Academy focus on STEM skill development for students between the ages of 14 and 19. The academy teaches the full range of General Certificate of Secondary Education (GCSE) subjects up to age 16, but combines this with a range of additional opportunities designed to foster the development of STEM skills. At a post age 16-level, the Academy also sponsors a range of different qualifications, designed to help students into further academic or vocational opportunities. The Academy is sponsored by several academic and corporate bodies, including Airbus and Rolls Royce. In 2016, several students went on to take apprenticeships at the corporate sponsors (as well as at other firms) while many others went on to study STEM degrees at partner universities. The U.K. government has acknowledged the importance of technical qualifications. In fact, in a recent budget it has not only allocated £500 million a year to improve technical courses in institutions like Bristol Technology and Engineering Academy but also aims to create a new ‘T- Level’ system which will put technical courses on an equal footing with traditional academic qualifications.
4. Professional Certifications
Professional certifications are used as a mechanism to assess the knowledge, skills and experience needed to perform a specific role. Many industries confer certifications covering a multitude of disciplines across health care, finance, education, and IT among others. A survey133 of 1,300 respondents who had trained and received an IT certification found 75% did so to improve their reputation among peers, improve confidence, and to work on more complex tasks
Next we consider two entire education models that lend themselves particularly well to lifelong learning – competency-based education and MOOCs.
133 Pearson (2016). The Pearson VUE 2016 Value of IT Certification Survey. Pearson Education, New Jersey.

Citi GPS: Global Perspectives & Solutions July 2017
© 2017 Citigroup
110
Competency-Based Education The Carnegie Unit Credit hour134 is a time-based reference used to measure educational attainment. At high school this translates to one hour of instruction on a particular subject per day, five days a week, for 24 weeks annually. A typical high school student earns six to seven credits per year over a four-year program of high school.
In higher education, students receive “credit hours” based on the number of “contact hours” students spend in class per week in a given semester. A typical three-credit course, for example, meets for three hours per week over a fifteen-week semester. A student, then, might earn fifteen credit hours per semester en route to a four-year bachelor’s degree requiring a total of 120 credits.
Higher Education = 1 four-year bachelor’s degree = 120 credits = eight semesters X 15 credit hours per semester = 15 weeks per semester X five courses X three contact hours per week per course
Traditional education delivery, modeled around the Carnegie hour, tends to hold time as a constant and lets learning outcomes vary. This method has been criticized for (1) holding students of varied learning abilities to the same standard, (2) stymieing innovation around online education, (3) failing to recognize prior-learning competence related to learning outside of college, like training on the job or in the military, (4) delivering the skills and knowledge but not their application, (5) unsuitability for students who work and have families, and (6) failing to achieve efficiency and productivity gains due to structural constraints on the infrastructure. In her critique of the existing system “Cracking The Credit Hour”, Amy Laitinen suggested three alternatives independent of time to learning:
Innovate within the existing framework by mapping non-time based measures to the credit hour. For example, the Western Governors University awards competency units when students master learning independent of time, but the final outcome is articulated as credit hours with one competency unit corresponding to one credit hour. This qualifies the institution for federal aid;
Experimental methods including (1) using financial aid to assess and credit prior learnings, (2) releasing financial aid only after learning outcomes are mastered, and (3) releasing financial aid for learning toward a degree acquired outside of traditional faculty and institutional boundaries – including self-paced online courses and MOOCs; and
Direct assessment.
Competency-based education (CBE) or direct assessment, as the U.S. Department of Education refers to it, has gained popularity as one of the approaches aimed at (1) empowering students to progress at their own pace through an online platform and with personalized faculty input, (2) acknowledging prior-learning knowledge, and (3) focusing on competencies or application of knowledge as the outcome rather than acquisition of knowledge being an end in itself. The self-paced nature of study lends itself well to just-in-time academic assistance and other support provided to keep students motivated and on track. Students demonstrate achievement of competencies without regard to courses or credit hours and they show proof of mastery of the individual competencies through summative
134 Silva, E., White, T., & Toch, T. (2015). The Carnegie Unit: A Century-Old Standard in a Changing Education Landscape. Carnegie Foundation for the Advancement of Teaching, Stanford.
The traditional education model of Carnegie hours is criticized for being too rigid and stymieing innovation
CBE allows students to progress at their own pace, acknowledges prior learning and focuses on the application of knowledge as the outcome

July 2017 Citi GPS: Global Perspectives & Solutions
© 2017 Citigroup
111
assessments such as exams, simulations, and /demonstrations, and portfolios. In simple terms, and in stark contrast to traditional education, CBE seeks to hold learning as the constant and sees time as a variable.
The question to ask is can CBE positively affect student outcomes at a lower cost to students and institutions than in traditional degree programs.
For answers, we refer to a study by rpk Group135 of four diverse U.S. institutions where each launched a CBE program in addition to their traditional degree programs. We note that the set-up costs varied depending on the scale of the program and how differently the CBE program was structured when compared against the traditional credit hour program.
1. Efficiency and Scale Benefits
Educational institutions are targeting higher efficiencies in their CBE business models through greater student-to-staff ratios without adversely impacting the quality of education. To this effect faculty roles are being unbundled to focus on niche tasks and eliminate duplication. Thus each faculty member was assigned to specific roles such as faculty instructional designers, assessment experts, enrollment coaches, academic success coaches, mentoring faculty, and learning outcome assessors. Unbundling coupled with greater adoption of technology is likely to permit higher student-to-faculty ratios than in traditional programs without compromising educational quality. The ratio of students to mentoring faculty across the four programs range from 100 to 400:1 depending on the maturity of the program but were significantly higher than 9 to 18 students per faculty member in traditional formats. Interestingly the CBE programs were not necessarily compromising on the quality of the faculty. The average salary of $77,700 per full-time employee (FTE) was similar to the national average. Academic success coaches were hired at lower salary levels, but again, this is comparable with salaries of full-time instructional support staff in traditional programs. Coaches have high rates of contact with the students, and using software to monitor student performance and persistence, they can average a student load of over 200.
Figure 111. CBE Delivery Structure Ratios and Compensation Figure 112. CBE Student Recruitment, and Enrollment and Retention Range
Student/Staff Ratios Student/ Course mentor 100:1 - 400:1 Student/ Academic success coach
120:1 - 450:1
Salary (FTE) Course mentor $75,000 - $83,200 Academic success coach $38,000 - $62,000 Benefit Rates Full time 20% - 50% Part time 9% - 11% Cost to Score an Assessment $15 - $35
Range Marketing Cost per New Student (Year Two) $1,300 - $3,150 Annual Enrollment Year One (Actual) 44 - 258 Year Three (Projected) 929 - 3,362 Year Five (Projected) 1,982 - 18,068
Source: rpk Group Source: rpk Group
135 Desrochers, D. & Staisloff, R. (2016). Competency-Based Education: A Study of Four New Models and Their Implications for Bending the Higher Education Cost Curve. rpk Group, Maryland.
Can CBE positive affect student outcomes at lower costs?

Citi GPS: Global Perspectives & Solutions July 2017
© 2017 Citigroup
112
In terms of student recruitment, online marketing was the most common tool; however one institution also partnered with local employers. Marketing cost per new student ranged from $1,300 - $3,150 depending on the different marketing plans for the new degree programs. While there was no specific trend when compared against traditional programs, enrollment costs per student are likely to decline as the CBE programs achieve greater scale.
These benefits are predicated on rapid enrollment growth – while some programs expect that CBE students will remain a small proportion of total enrollments (5%), other institutions expect CBE to make up one-third of their overall enrollments five years after launch. In fact some institutions are projecting up to 70% growth in enrollments even in the sixth year of operation.
2. Cost to the Institution and Student
The institutions spent or expect to spend around $3,200 per student on their CBE programs in the sixth year, not surprisingly; this is about 50% lower when compared to spending on educational related activities in their own institution’s traditional programs. Savings are even higher, at about 70%, when compared against institutions in the affiliated Carnegie-sector categories. Even when compared against Western Governors University (WGU), a mature CBE institution, cost per student was about a fifth lower on an average across the four institutes’ CBE programs. This is likely explained by their ability to share costs across their traditional credit hour and CBE programs for management, IT, and services. Since WGU is not part of a larger institution it fully incurs all costs.
Figure 113. CBE Spend per Student Compared to… Figure 114. CBE Revenue per Student in Context
Note: WGU refers Western Governors University Source: rpk Group, Citi Research
Source: rpk Group, NCES, Citi Research
On average the four institutes expect to break even around year 5 with tuition of $4,400 per student which is in fact expected to fall to $4,000 by year 6 as the programs ramp-up further. To put this in perspective, the maximum Federal Pell Grant award was $5,815 for 2016-17, i.e., there is the potential for students to pay close to nothing out-of-pocket for tuition. The annual tuition cost in the U.S. across all 4-year and 2-year institutions averaged $6,350 and $5,076, respectively, in 2014-15.
-80% -70% -60% -50% -40% -30% -20% -10% 0%
Own Institution
Affiliated Carnegie Sector
WGU
$-
$1,000
$2,000
$3,000
$4,000
$5,000
$6,000
$7,000
Average CBEGross Revenueper Student in
Year 6
Average AnnualTuition for 2-year
US Institution
Maximum PellGrant for 2016-17
Average AnnualTuition for 4-year
US Institution

July 2017 Citi GPS: Global Perspectives & Solutions
© 2017 Citigroup
113
3. Outcomes
Given most CBE programs are still in their infancy, there is limited information around actual outcomes. However, from the available data for the above four institutions, multi-year retention rates have averaged 62%-71%. Part-time retention at their own traditional programs ranged from 24%-43%. While it’s too early to infer a definitive trend in CBE retention rates, the academic success coaches and student-centred technology investment could support outcomes. For example, learning assessments can be embedded in the curricula so that the student’s progress is monitored, allowing for predictive modelling which targets students for real-time remediation and other interventions.
In conclusion, looking beyond the upfront investments and the time to breakeven, CBE programs offer institutions the ability to scale-up enrollment with limited expansion of physical infrastructure. While we expect there to be limited upside from pricing, a successful ramp-up in enrollment would lead to massive efficiency and scale benefits. Further, in a labor market that is increasingly viewing lifelong learning as a hygiene factor, i.e. something connected to a job that will make you unhappy if it was not provided, CBE appears well suited for working professionals due to its flexible, self-directed nature coupled with the focus on prior-learning and developing competencies.
MOOCs Massive open online courses (MOOC) were all the craze in the early part of this decade. Udacity founder Sebastian Thurn’s first MOOC class at Stanford University in 2011, on Artificial Intelligence saw 160,000 registrations. He went on to prophesize that in 50 years the number of universities would reduce to ten worldwide. The New York Times declared 2012 ‘the year of the MOOC’. The initial MOOCs while being free, for all practical purposes, were regular college courses but in an online environment which sought to replace university education. They followed a semester pattern and were offered only once or twice a year, they lasted for a duration of about ten weeks and had weekly or bi-weekly assignment deadlines culminating with a final exam. However it was quickly observed that while course sign-ups were high, completion rates were low. According to a study by the University of Pennsylvania, MOOC completion rates averaged just 4% across all courses and were as low as 2% in some courses. Further, specific characteristics such as course length, availability of live chat etc. had no statistically significant impact on completion rates. Some stakeholders were also skeptical about the veracity of the credentials offered by MOOCs.
Since then MOOCs have lost a lot of their initial hype and their place in public imagination. But as we note below the main players have reworked their aspirations and their business models, and in their new avatars these courses might yet have an important role to play in reducing the cost of education, propagating lifelong learning, and improving employability.
While MOOCs were initially viewed as a way of disrupting the traditional high cost university model by offering open-access free/ low-cost education, high drop-out rates and the challenge of convincing employers that the skills granted by MOOC credentials are for real have meant they have not really threatened traditional universities.
Figure 115. MOOCs – Self-Paced vs. Session Based
Source: Class Central, Citi Research
0
500
1000
1500
2000
2500
Sep 2013 Sep 2014 Sep 2015 Sep 2016
Self-paced Session Based

Citi GPS: Global Perspectives & Solutions July 2017
© 2017 Citigroup
114
There have been a few studies on the type of students attracted to MOOCs. The median age of participants at HarvardX and MITx is 24, and 71% of all participants already have at least a bachelor’s degree. At Coursera 85% of students are over the age of 22 and half the students took courses to advance their careers. Georgia Tech’s online version of its Masters in Computer Science primarily attracted people with a median age of 34, while the campus degree continued to recruit students in their early 20s. i.e., the profile of a typical MOOC student is that of a working professional who seeks to improve her employability but doesn’t have the time to attend college full time.
As Coursera CEO Rick Levin noted “We’re doing a better job of improving job skills than of transforming the university sector”. This has been achieved through several initiatives:
Firstly MOOCs have focussed on flexibility. Self-paced courses are on the rise and even in many session-based classes, new sessions start automatically on a bi-weekly or monthly basis. This enables students to start courses almost immediately. MOOCs also offer shorter courses with soft deadlines – the ability to submit assignments any time before the end of the course, rather than having a weekly hard deadline. To help instructors cope with the increased workload MOOCs are automating the assessment process. For complex projects peer grading may be used with the oversight of software that can flag inaccurate grades. Some MOOCs such as Udacity also outsource grading of student work to third-party contractors who are paid around $50 per hour to assess almost 15,000 student submissions per month.
MOOC providers have innovated around course packaging by combining individual courses to form credentials — certificate programs that require students to complete a sequence of courses in a particular subject area. Coursera (Specializations), Udacity (Nanodegrees), and edX (XSeries) all have launched variants of this model. These credentials can vary widely in terms of cost, time commitment, and prerequisites. For example, Udacity’s Android basics Nanodegree requires prior knowledge of just basic computer skills, typically takes up to six months to complete, and costs $199 per month. In contrast the program on Robotics has an extensive list of prerequisites (Calculus, Probability, Programming, etc.) all of which can be completed at Udacity, costs $2,400, and is comprised of two terms with fixed start and end dates. In all, the number of MOOCs that result in a certification in a specific topic area grew by 150% to over 250 in 2016. The basic aim is to signal a level of competence around high-demand skills.

July 2017 Citi GPS: Global Perspectives & Solutions
© 2017 Citigroup
115
Figure 116. Udacity’s Nanodegree on Introduction to Programming
Source: Udacity website
Despite all this, employers and other stakeholders still need to be convinced about the veracity of these credentials. This perhaps comes easier to edX, than any other MOOC, given its MIT and Harvard pedigree. Coursera uses a similar strategy and relies on universities and business schools for most of its content. It also associates with these universities for branding – “Data Science, a non-credit series offered by Johns Hopkins University through Coursera”. Further, it has chosen to directly partner with employers to offer corporate training and new hire on-boarding and has also teamed up with governments to offer training materials to the unemployed. Udacity has chosen to partner with corporates to authenticate its credentials such as Google’s involvement in its Android Nanodegree. Another way of adding value to credentials is by acknowledging the knowledge acquired towards an official academic credit. Most major MOOCs, with the exception of Udacity, offer this to a certain extent. In fact edX’s MicroMasters (which are offered by fourteen universities), can be used to earn a semester’s worth of academic credits towards an on-campus master’s degree. Some start-up’s such as Degreed are also working on ways to issue a standardised assessment of skills notwithstanding how people achieved them while other options being considered include granting digital badges to recognise less formal skills not tested in exams but still valued by firms.
Reducing the time to market in terms of updating course content is another important area of innovation. Pluralsight employs a network of 1,000 experts to produce and refresh its library of videos. The experts get royalties based on how often the content is viewed.

Citi GPS: Global Perspectives & Solutions July 2017
© 2017 Citigroup
116
Figure 117. MOOCs – Global Market Size ($ Mn)
Source: GSV, Citi Research
Overall, we believe MOOCs could be the solution to many of the education sector’s challenges:
– They can offer skill and knowledge upgrade opportunities to those desiring flexible course schedules including working professionals and stay-at-home parents, particularly women;
– MOOCs can partner with companies to offer employees a curated corporate training library;
– They can also act as a blended learning tool to supplement the instructor’s course materials across primary, secondary, and higher education; and
– They can leverage the educational institutions fixed cost base to cater to a significantly wider audience.
And all this appears to be supported by a viable business model. While course content continues to be available for free, learners are required to pay up for assessment and accreditation of individual courses. Credentials also offer an important revenue stream. According to Coursera, when there is a monetary value attached to courses, completion rates rise by 10% to 60%. Udacity has managed to improve completion rates by offering a 50% tuition refund to students who complete Nanodegrees within 12 months. GSV Advisors estimates that the MOOC market will grow at a 50% CAGR until the end of this decade to reach $400 million by 2020.
0
50
100
150
200
250
300
350
400
2015 2020
50% CAGR 2015-2020

July 2017 Citi GPS: Global Perspectives & Solutions
© 2017 Citigroup
117
Implications: Distinguishing Between First- and Second-Order Solutions Given the variegated nature of the challenge by segment and by market, we believe that solutions will largely have to be tailor-made. That said, we can make generalisations, in particular distinguishing between what we see as ‘first-order’ solutions to the challenges relating to access to education and ‘second-order’ solutions that address challenges relating to productivity.
Looking at the first-order solutions we further sub-divide these into solutions that address supply constraints – how to get access to new schools/better materials, etc. – and those that address imbalances in demand – in particular increasing demand for/reducing opportunity cost of getting an education for under-penetrated parts of society, e.g. primary/secondary education for young girls in emerging markets, and tertiary education for minority ethnic groups in developed markets.
A common thread on both the demand and supply side is broadening the sources of financing for education – encouraging private spend where possible but also facilitating infrastructure investment with more innovative modes of financing. This would not only provide benefits for individuals and society, but provide opportunities for investors as whole new asset classes are created.
Looking at the second-order solutions relating to the problem of productivity and skills, we note that education technology (EdTech) will likely play a pivotal role. Just 2% of the almost $5 trillion education market has been digitized. Embracing the role of technology will be a key factor in driving productivity improvements medium-term.
Finally, we also identify the importance of vocational education and training (VET) and lifelong learning as something which will also require nurturing and nourishing not only by governments and corporates, but also by individuals themselves who will have to change their approach to education, thinking of it less as a stage of life and more as a lifelong process.

Citi GPS: Global Perspectives & Solutions July 2017
© 2017 Citigroup
118
5. Conclusions & Implications for Stakeholders Putting this altogether, we reach four broad conclusions on education:
First, it is important to reiterate again that education has had – and continues to have – a very positive impact on society both economically and in terms of social well-being.
Second, while educational progress has been immense over the last few decades, it is evident that the current system – or rather systems – face a number of challenges. The largest is that with the benefits still greater than costs, demand will almost certainly exceed supply and meeting this demand will require more funding and improved efficiency.
Third, disruption of workforces in particular at the hands of automation, will not only potentially create even more demand in particular for adult re-training but have an impact on what skills will need to be learnt in the first place.
Fourth, the answer to these problems lies in: (1) broadening the sources of financing for education, in particular encouraging private expenditure on education as well as encouraging new modes of financing via financial markets; (2) embracing the role of technology and the impact it can have on increasing productivity in an educational environment; and (3) trying to change attitudes to learning and education, by encouraging individuals to think about it as a lifelong process.
And what does this mean for the various stakeholders. Going through them in turn:
For Policy Makers As we have shown, governments across the world still get a good deal from education typically getting more back from funding education than they pay in the first place but pressures are building.
Not only are financial resources increasingly tight, but there is growing Vox Populi risk associated with segments of the population disrupted by technology but without the requisite skills to get back into the workforce.
Although the pressure points are at different levels across the world (typically primary/secondary education in developed markets and tertiary education in developing markets), the basic challenge is simple: governments need to support greater student numbers who need more skills but at a lower cost per outcome.
The big picture solution is also relatively straightforward even though implementation is a more significant challenge: governments need to encourage new sources of capital both in the form of private spending by consumers and more innovative modes of financing/lending (e.g., educational bonds).
We also think policy makers will need to play an active role in encouraging vocational training and lifelong learning.

July 2017 Citi GPS: Global Perspectives & Solutions
© 2017 Citigroup
119
For Investors One of the most exciting aspects of this work, in our view, is that it highlights a number of areas where private capital can potentially make a significant difference to education. What is also striking is that these investment opportunities span a range of risk/reward profiles.
For investors with lower risk tolerances, some of the new financial instruments picking up the mantle of educational investment from Government (again e.g., education bonds) potentially provide compelling opportunities to generate income with comparatively low capital risk.
On the equity side, too, there are segments of the traditional education space – in particular around infrastructure/materials – that should have relatively predictable returns with low volatility across the cycle.
There will undoubtedly also be opportunities at the riskier end of the spectrum. Increases in demand for education in emerging markets – in particular in the tertiary space but also private schooling/tutoring at a primary/secondary level – will likely be a significant driver of growth for those companies with the right exposure.
Meanwhile, the emerging educational technology (EdTech) space is a volatile but yet significant potential opportunity. We argue that in EdTech lies the potential answer to the challenge of increasing productivity, but at present just 2% of the $5 trillion education market is digitised.
EdTechXGlobal estimates that the global EdTech market will grow at 17% CAGR to $252bn by 2020 and this could/should be a significant opportunity for investors with a greater risk appetite.
For Corporates We think corporates have a significant role to play in terms of encouraging learning and development as a lifelong process. This will, in our view, have benefits for employer and employee alike.
For employers, this will allow them to make sure that employees gain the requisite training on the job as the need for new skills evolve. This will not only drive better business outcomes but also a halo effect in terms of the ability to attract and retain the very best talent.
For employees, professional certifications will become an increasingly important compliment to traditional educational qualifications.
For Us as Individuals To say that individuals take education for granted is obviously too strong, but as the quotation from Malia Yousafzai at the beginning of this report highlights, there is not only a pronounced asymmetry across the world in terms of access but this asymmetry can distort our views (especially in developed markets) of the value of education to us as individuals as well as society more broadly.
Obviously governments and corporates have a role to play in encouraging us to get the right skills, but we argue that we, as individuals, also have to change our attitude to education – to think of it less as a stage or a destination and more as a process or journey.

Citi GPS: Global Perspectives & Solutions July 2017
© 2017 Citigroup
120
By doing this, we will make sure that not only will we have the appropriate skills to face the challenges of the modern world but the ability to adapt when disruption inevitably occurs.

July 2017 Citi GPS: Global Perspectives & Solutions
© 2017 Citigroup
121
Appendix

Citi GPS: Global Perspectives & Solutions July 2017
© 2017 Citigroup
122
Education System in the United States The education system in the U.S. is split into four main tiers: elementary (age 5-11), middle school (aged 11-14), high school (age14-18) and tertiary education (18+). The precise years of compulsory education vary by state, although all U.S. students have to complete at least nine years of education. The school system is based, generally speaking, on the ‘K-12’ (Kindergarten-12th grade) system. The precise content and institutional arrangement, however, depends on the state and county.
The U.S., on average, spends 6.1% of its GDP, or $1.02 trillion, on education, making it the top spender in absolute terms but average in terms of spending as a percentage of GDP. Spending, overall, is roughly 20% private and 80% public.136 Similar to the U.K., core school education remains dominated by the state, with 92% of schools being public. Between 2005 and 2013, total U.S. spending on education increased by 32.4%,137 although spending growth as a proportion of GDP has been more subdued at only 0.2% over the same period. Since the mid-1990s, enrollment at all levels of education has increased. Growth in educational achievement has mainly been focused at the tertiary level. Enrollment rates in tertiary education increased by 37% between 1995 and 2010, while the proportion of the U.S. adult population with a tertiary education increased from 22% to 30%.
Figure 118. U.S. Adjusted Gross Enrollment Rate Figure 119. Highest Educational Attainment of U.S. Adults
Source: Lee, J and Lee, H (2016), Human Capital in the Long Run Source: Barro, R and Lee, J (2013): A New Data Set of Educational Attainment in the
World, 1950-2010
The U.S. Education Market
The U.S. education market is the largest in the world. Global Silicon Valley (GSV) estimates that in 2016, the U.S. education market totaled $1.63 trillion. Additionally, it is anticipated to grow 4% year-on-year through 2020, meaning the U.S. will comprise 11% of all global spending growth in education through the same period.138
136 Combination of UNESCO and OECD DATA 137 OECD (2016). Education at a Glance 2016: OECD Indicators, OECD Publishing, Paris. http://dx.doi.org/10.1787/eag-2016-en 138 Global Silicon Valley (2016). 2020 Vision: A History of the Future, GSV Media, California.
0
20
40
60
80
100
120
1820
1830
1840
1850
1860
1870
1880
1890
1900
1910
1920
1930
1940
1950
1960
1970
1980
1990
2000
2010
Adju
sted
Gro
ss E
nrol
lmen
t
Primary Secondary Tertiary
0102030405060708090
10019
50
1955
1960
1965
1970
1975
1980
1985
1990
1995
2000
2005
2010%
of O
ver 2
5 Po
pula
tion
By
Com
plet
ed E
duca
tion
Leve
l
Tertiary
Secondary
Primary
IncompletePrimary

July 2017 Citi GPS: Global Perspectives & Solutions
© 2017 Citigroup
123
Figure 120. U.S. Total Spending and CAGR for Different Elements of the Education Market, 2015-2020
Source: Global Silicon Valley (2016): 2020 Vision: A History of the Future, Citi Research
According to OECD and UNESCO estimates, private spending on education in the United States, in 2013, totaled $194 billion.139 The Bureau of Labor Statistics national consumer survey estimated total consumer spending, alone, totaled $168 billion in 2015.140 Notably, the ratio of total consumer spending to private spending is higher in the United States than in other developed private market. Consumer spending in the U.K is roughly 70% of the total private spend versus 86% in the U.S. This suggests a stronger market for consumer education services.
In the U.S., 8% of all schools are private, compared to 4-5% in the U.K. Equally important, public spending on privately provided secondary educational services, such as IT, looks set to increase. Spending by charter schools (a form of independently managed public school, similar to an academy in the U.K., for example) is anticipated to grow more rapidly than spending by other public schools, at 12.27% year-on-year, compared to just 3.66%.141 Charter schools are typically larger consumers of privately provided secondary education services. Additionally, as schools update and transform their own infrastructure in the face of new digital developments, demand for devices and digital infrastructure will also increase. For example, annual spending on ‘School as a Service’ products (products focused on creating digital school infrastructure) is expected to grow by 15% between now and 2020.142
139 OECD (2016). Education at a Glance 2016: OECD Indicators, OECD Publishing, Paris. http://dx.doi.org/10.1787/eag-2016-en 140 Bureau of Labor Statistics (2015). Consumer Expenditure Survey. Washington, D.C.: U.S. Department of Labor. 141 Global Silicon Valley (2016). 2020 Vision: A History of the Future, GSV Media, California. 142 Global Silicon Valley (2016). 2020 Vision: A History of the Future, GSV Media, California.
0%
5%
10%
15%
20%
25%
30%
35%
0
100
200
300
400
500
600
700
800
900
Childcare andpre-K
K-12 PostSecondary LifelongLearning
Corporate
Spen
ding
(USD
, Bill
ions
)
2015 2020 CAGR
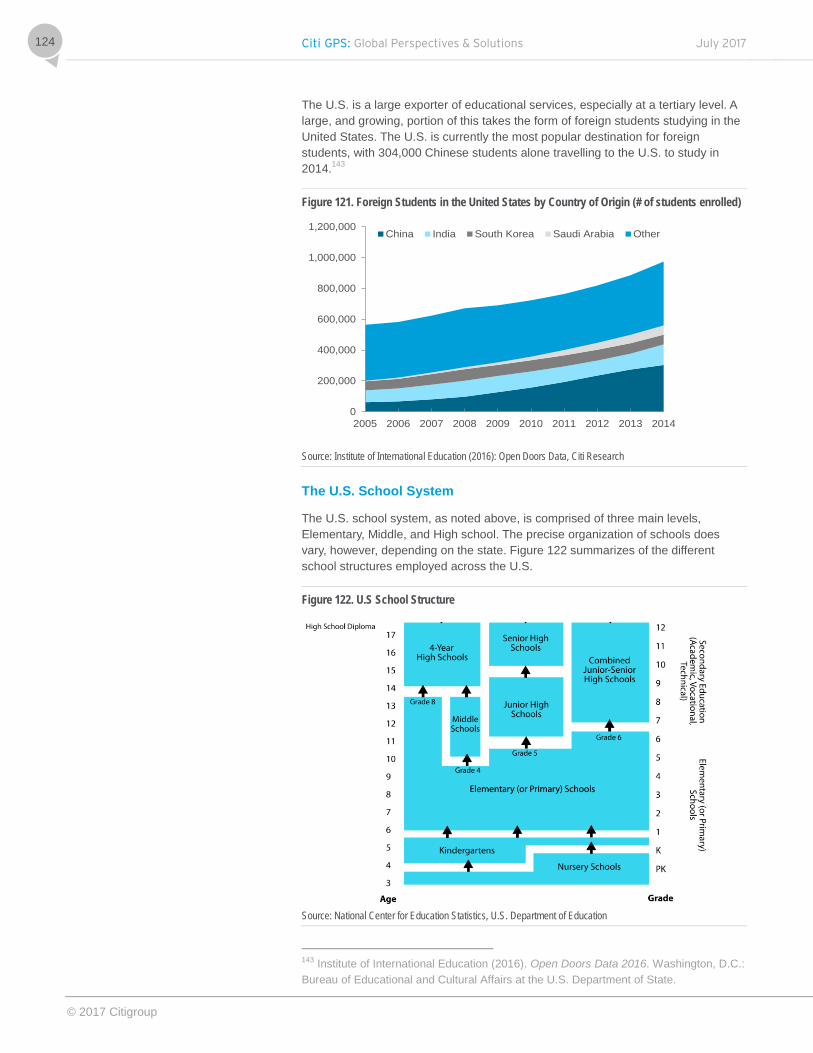
Citi GPS: Global Perspectives & Solutions July 2017
© 2017 Citigroup
124
The U.S. is a large exporter of educational services, especially at a tertiary level. A large, and growing, portion of this takes the form of foreign students studying in the United States. The U.S. is currently the most popular destination for foreign students, with 304,000 Chinese students alone travelling to the U.S. to study in 2014.143
Figure 121. Foreign Students in the United States by Country of Origin (# of students enrolled)
Source: Institute of International Education (2016): Open Doors Data, Citi Research
The U.S. School System
The U.S. school system, as noted above, is comprised of three main levels, Elementary, Middle, and High school. The precise organization of schools does vary, however, depending on the state. Figure 122 summarizes of the different school structures employed across the U.S.
Figure 122. U.S School Structure
Source: National Center for Education Statistics, U.S. Department of Education
143 Institute of International Education (2016). Open Doors Data 2016. Washington, D.C.: Bureau of Educational and Cultural Affairs at the U.S. Department of State.
0
200,000
400,000
600,000
800,000
1,000,000
1,200,000
2005 2006 2007 2008 2009 2010 2011 2012 2013 2014
China India South Korea Saudi Arabia Other

July 2017 Citi GPS: Global Perspectives & Solutions
© 2017 Citigroup
125
The U.S. school system is heavily decentralized. This manifests itself in four ways. The first, noted above, is institutional variety. The second is curriculum variety. States generally have control over school curriculums, and in some states the responsibility for the curriculum can even be as local as the county school board. The implication of this is that while there is a large degree of overlap in what children are taught across the United States, few schools share exactly the same content.
The implication of this is that there are very few standardized, public examinations in the U.S. school system. While many students sit exams given by teachers and schools, federal and state exams are few and far between. The Federal government does assess students in order to get a sense of how education systems are performing in respective states, and uses the National Assessment of Education Progress to do so. However, rather than all students, this assesses just a sample. Equally, this and other public U.S. exams do not assess student’s ability over the specific content, rather their more general aptitude. In this way, the U.S. system differs fundamentally from the U.K. or Chinese system, especially at the secondary level.
Lastly, the decentralized funding model employed by large portions of the education system in the United States also has important implications. Public schools, especially, are funded through local taxes, meaning that school funding is directly linked to local prosperity. The implication of this has been that student funding depends, extensively, on not only in which state you are located but also, often, the specific county. Looking at the city of Chicago alone, depending on the area of the city per student spend in public school varied between $28,000 per year in wealthy areas to $9,000 per year in poorer ones.144
Figure 123. Spending Per Student, by School District
Note: Figures adjusted for regional price differences. Image © Mapbox ©OpenStreetMap Source: Education Week145, U.S. Census Bureau; Katie Park, Alyson Hurt, Tyler Fisher and Lisa Charlotte Rost/NPR
144 Turner, C., Khrais, R., Lloyd, T., et al. (2016 April 18). Why America’s Schools Have A Money Problem. NPR. Retrieved from: http://www.npr.org/2016/04/18/474256366/why-americas-schools-have-a-money-problem 145 Education Week (2018 April 16). Map: How Per-Pupil Spending Compares Across U.S. School Districts. Education Week. Retrieved from: http://www.edweek.org/ew/section/multimedia/map-how-per-pupil-spending-compares-across-us.html

Citi GPS: Global Perspectives & Solutions July 2017
© 2017 Citigroup
126
Tertiary Education
As a result of the heterogeneity in content and educational quality, U.S. college admissions are largely based on teacher assessments of students and standardized test scores. The United States, in comparison to the U.K., has many more tertiary education institutions that are publicly-owned and operated. In the U.K., 100% of tertiary education institutions are technically private while in the U.S. 66.2% of all undergraduate education institutions are public. Noticeably, however, the proportion of enrollment in private institutions increases as the intensity of tertiary education increases. Hence, for short-cycle tertiary qualifications, over 90% of enrollment is in public institutions, such as community colleges, while for master’s degrees the majority of enrollment is in private institutions.146 It is also worth noting that, of the 34% of tertiary education institutions that are private,147 these are typically more independent than in the U.K. in the sense that they rely less on government subsidies and are generally less rigorously regulated. Bachelor’s degrees remain the most common type of tertiary qualification (see graph below), however the numbers doing short-cycle tertiary and bachelor’s degrees are relatively similar.
Figure 124. Enrollment Size and Distribution between Institution Type, U.S. Tertiary Education-
Source: OECD (2016): Education at a Glance, Citi Research
Fees for tertiary education vary significantly depending on the course and institution. Some tertiary education fees are among the highest in the world, especially at a college level, as noted in chapter 3 of the report. However, fees at public institutions are generally much lower. Additionally, even at institutions with high tuition fees, such figures may not be a reflection of the ultimate costs for many students, given the wealth of scholarship funding that is sometimes available.148
146 OECD (2016). Education at a Glance 2016: OECD Indicators, OECD Publishing, Paris. http://dx.doi.org/10.1787/eag-2016-en 147 OECD (2016). Education at a Glance 2016: OECD Indicators, OECD Publishing, Paris. http://dx.doi.org/10.1787/eag-2016-en 148 At Stanford University, for example, students with a household income of under $60,000 do not have to pay either tuition or board charges, while those with a household income of less than $100,000 do not have to pay any tuition costs.
0
2000000
4000000
6000000
8000000
10000000
12000000
0102030405060708090
100
Short-cycletertiary
education(ISCED2011
level 5)
Bachelor’s or equivalent level
(ISCED2011 level 6)
Master’s or equivalent level
(ISCED2011 level 7)
Doctoral orequivalent level
(ISCED2011level 8)
Public Private Number of Students

July 2017 Citi GPS: Global Perspectives & Solutions
© 2017 Citigroup
127
Challenges for the U.S. Education System
The U.S. education system faces two main challenges. The first is educational access. The U.S. has experienced a dramatic decline in social mobility in the last 40 years;149 a major driver behind this has been a decline in educational access for those from low-income backgrounds. As we discussed in chapter 3, a major element of social mobility is the inequality of school access, as education is often he predominant means by which parental socio-economic outcomes are transmitted to their children. The U.S. has a special problem in this regard. The manner in which U.S. schools are funded amplifies the link between parental background and schooling quality. This is especially significant as income inequality has increased and household wealth is increasingly localized and concentrated as individuals have come to live, to a greater degree, near people in similar socio-economic circumstances.150 The net result has been that the local funding structure used for public schools has become increasingly regressive.
Secondly, the U.S. has an extensive system of short-cycle tertiary training, with large numbers of foundation and associates degrees. More needs to be done, however, to ensure the skills produced by this predominantly public system remain relevant. Increased corporate involvement in such training could be an important element to ensuring the skills are as relevant as possible. This would also help corporates meet their own skills shortages.
149 The Equality of Opportunity Project: http://www.equality-of-opportunity.org/ 150 Putnam, R. D. (2015). Our kids: The American Dream in crisis. New York: Simon & Schuster.

Citi GPS: Global Perspectives & Solutions July 2017
© 2017 Citigroup
128
Education System in the United Kingdom The education system in the U.K. is split into three tiers: primary (age 5-11) secondary (aged 11-18) and tertiary (18-22) and education is compulsory during all years of primary and secondary education. The U.K., on average, spends roughly 6.5% of its GDP, or $180 billion, on education making it one of the top spenders in the OECD. This spending is split roughly 25% private and 75% public. About 95% of all schooling is either provided by state institutions, or by private institutions directly supported by state funding.
U.K. investment in education has increased at rapidly in recent years. This has driven an increase in enrollment numbers and educational attainment. Public investment alone has increased 49%151 since 1990. During the same period, enrollment at all levels of education has increased. The proportion of people with a completed secondary education or more has increased from under 20% of all adults in the early 1990s to over 60% today.152
Figure 125. U.K. Adjusted Gross Enrollment Rate Figure 126. Highest Educational Attainment of U.K. Adults
Source: Lee, J and Lee, H (2016), Human Capital in the Long Run Source: Barro, R and Lee, J (2013): A New Data Set of Educational Attainment in the
World, 1950-2010
The U.K. Education Market
The education market in the U.K. is vast; the primary education market alone in the UK has an estimated value of £33 billion ($42 billion).153 The Office of National Statistics estimated, in 2011, consumer spending on education totaled £14 billion ($18 billion). In addition, there are large quantities of non-consumer private education spending such as spending by private corporations and charities. When added, this suggests that total private spending on education may be over £20 billion ($25 billion).154 This is generally concentrated outside areas of school provision, such as extracurricular activities and supplementary tuition.
151 Sibieta, L. (15 April 2015). Education spending: what are the parties planning to protect? Institute for Fiscal Studies. Retrieved from: https://www.ifs.org.uk/publications/7717 152 Barro, R. J. & Lee, J. W. (2013). A new data set of educational attainment in the world, 1950-2010. Journal of Development Economics, Elsevier vol. 104(C), pages 184-198. 153 IBISWorld (2016). Primary Education in the UK: Market Research Report. IBISWorld. Retrieved from: https://www.ibisworld.co.uk/market-research/primary-education.html 154 CitiResearch Estimate. Based on OECD (2016): Education at a Glance and Eurostat (2016) Data
0
20
40
60
80
100
120
1820
1830
1840
1850
1860
1870
1880
1890
1900
1910
1920
1930
1940
1950
1960
1970
1980
1990
2000
2010
Adju
sted
Gro
ss E
nrol
lmen
t
Primary Secondary Tertiary
0102030405060708090
100
1950
1955
1960
1965
1970
1975
1980
1985
1990
1995
2000
2005
2010
% o
f Ove
r 25
Popu
latio
n B
y C
ompl
eted
Edu
catio
n Le
vel Tertiary
Secondary
Primary
IncompletePrimary
July 2017 Citi GPS: Global Perspectives & Solutions
© 2017 Citigroup
129
The U.K. also exports a large quantity of educational services. In 2013, the U.K. government estimated educational services, in total, constituted a £17.5 billion ($22.5 billion) export industry to the U.K.155 Digital education services are also a rapidly expanding market in the U.K. Roughly £900 million ($1.2 billion) is spent by U.K. schools annually on such services156 and ongoing technological improvement will continue to drive this spending up.
The U.K. School System
The U.K. school system is predominantly comprised of two institutional tiers: primary and secondary school. This is in contrast to many other countries that typically operate a third category of ‘middle’ schools. School attendance is compulsory for all years of primary school and five years of secondary school, while enrollment in some form of education is compulsory for all school years (up to age 18). Typically, primary school is attended from age 5 and secondary school from age 11. Schools may be public or private at either level. Public schools can be further subdivided between ‘academy’ schools and state managed schools. Academy schools are independently managed and exempt from the requirement to follow the national curriculum, affording them a greater degree of autonomy. Additionally, at a secondary level, the U.K. also has public schools that are academically selective, commonly known as ‘grammar schools.’ These schools select students based on their performance in a test taken at age 11.
Most countries publicly examine students for the first time at age 15-16. The U.K., by contrast, usually examines children at age 6-7, 10-11 and sometimes 13-14. Hence British children have usually been publicly examined three times before students, in most other systems sit their first exams. The government regulates the content of education from ages 3-16 via the National Curriculum. The private system is structured differently from public schools. Students move from their primary to secondary educational institution at age 13, rather than 11. This process is governed by separate examinations, common across private schools.157 They are exempt from many of the content requirements placed on public schools. As a result, they have far greater flexibility in the content they teach and often using wholly different exams and qualifications. The combination of different institutional and curriculum structures results in significant divergences between these and public schools.
155 United Kingdom Government Department for Business, Innovation, & Skills et al. (2013). New push to grow UK’s £17.5 billion education exports industry. U.K. 156 Moules, J. (2017 May 14). How edtech start-ups are shaking up executive education. Financial Times. Retrieved from: https://www.ft.com/content/8c8cf4b6-2c3a-11e7-bc4b-5528796fe35c?mhq5j=e3 157 The most common of these exams is the ‘Common Entrance Examination.’ This is taken by private school students when they are 13 and aiming to progress to a private Secondary School
Citi GPS: Global Perspectives & Solutions July 2017
© 2017 Citigroup
130
Tertiary Education in the U.K.
Enrollment in U.K. tertiary education increased dramatically, roughly 37%, between 2000 and 2010.158 The system is entirely private, though heavily regulated but the government provides financial support to both students and institutions directly. Public support to individual students, in particular, is extensive. Roughly 92% of current undergraduates have a subsidized government student loan.159 Payments on these loans are income contingent and any unpaid debt is written off after 30 years; according to the Institute for Fiscal Studies (IFS), for every pound lent, there will be an ultimate grant to students of 43.3p.160
Tertiary education, in the U.K., is dominated by universities. According to the Times Higher Education rankings,161 6 out of the top 25 universities in the world were in the U.K. in 2016, leaving the U.K. second only to the United States. The U.K. university system is highly specialized, exceptionally so at an undergraduate level. Admission is usually based A-Level exams (public exams taken at the end of secondary school) which test students in three to four subjects. Results in these exams are central to university admission. The implication is that, from age 17, U.K. students typically specialize earlier, choosing a narrower set of subjects at A-level and studying a narrower scope of content as part of their undergraduate studies.
U.K. undergraduate degrees are typically shorter in duration (three rather than four years) as a result. Most remain rigidly academic; however there are several subjects, such as law and nursing, which increasingly merge academic study with elements of professional training. Graduates of most undergraduate law courses, for example, have to complete less subsequent training to become qualified legal professionals. This is in contrast to the United States where those that complete an undergraduate degree in law are still required to complete the same graduate study before qualifying. Generally, however, most professional training in the U.K. is completed subsequent to an undergraduate degree.
The U.K. has a low proportion of its total tertiary enrollment in short-cycle tertiary training. This is training in occupationally specific skills, such as the Chartered Financial Analyst certification, and, importantly, includes training in many of the technical skills relevant to rapidly growing industries. Roughly 11% of all tertiary enrollment is in such training, compared to more than 35% in both the United States and China.
158 Enrollment here refers to Adjusted Gross Enrollment, the same measure used in Lee, J. & Lee, H. (2016). Human capital in the long run. Journal of Development Economics, vol. 122, issue C, 1247-169. 159 Crawford, C., Crawford R. & Jin, W. (2014). Estimating the public cost of student loans. Institute for Fiscal Studies, IFS Report R94. 160 Crawford, C., Crawford R. & Jin, W. (2014). Estimating the public cost of student loans. Institute for Fiscal Studies, IFS Report R94. 161 The Times Higher Education (2016). World University Rankings 2016-2017. The Times Higher Education. Retrieved from: https://www.timeshighereducation.com/world-university-rankings/2017/world-ranking#!/page/0/length/25/sort_by/rank/sort_order/asc/cols/stats

July 2017 Citi GPS: Global Perspectives & Solutions
© 2017 Citigroup
131
Figure 127. Enrollment Across Different forms of Tertiary Education
Source: OECD (2016): Education at a Glance, Citi Research
Challenges and Opportunities
The U.K. faces two critical issues. There is a growing consensus in the U.K. that the extent of tertiary occupational specific training needs to increase, meaning these skills need much more investment.162 There are two elements to this problem. The first is the perception among many that the U.K. has underinvested in these skills in recent years. The second is the observation that demand for many skills provided by such training is increasing as new highly-productive processes are driving demand for occupationally specific skills.
Increasingly, this is being pursued through school reform that aims to diversify the range of opportunities open to students, and subsequently feed more students into non-academic forms of tertiary education. In his recent spring budget, the Chancellor announced a new qualification known as T-levels. The new qualification aims to simplify the non-academic qualification system, increasing recognition, while simultaneously increasing standards in such training. Government loan programs, long available for university students, are also now being extended to those enrolled in these qualifications. This is all aimed at trying to improve the take-up, standard, and return to vocational and occupational forms of training.
There are opportunities for corporates to mobilize their own expertise, in partnership with educational institutions, to develop qualifications and courses that meet their own skills demand. Corporates are increasingly partnering with schools to realize this potential, fostering relevant skills development at younger ages and directing people into appropriate post-secondary training (see the example of Bristol Technical Academy, chapter 4). Reforms introduced since 2010 offer additional formal opportunities for well-intentioned corporates to sponsor schools, fostering closer community and long term employment links; 13% of U.K. secondary schools now have some form of private sponsor.
162 Wolf, A, Rominguez-Reig, G and Sellen, P (2016): Remaking Tertiary Education: Can We Create a System that is Fair and Fire For Purpose
0
0.1
0.2
0.3
0.4
0.5
0.6
0.7
Short-cycle tertiaryeducation
(ISCED2011 level5)
Bachelor’s or equivalent level
(ISCED2011 level 6)
Master’s or equivalent level
(ISCED2011 level 7)
Doctoral orequivalent level
(ISCED2011 level8)
% United States United Kingdom China

Citi GPS: Global Perspectives & Solutions July 2017
© 2017 Citigroup
132
The second related issue in U.K. education is educational mobility and access. The U.K. has relatively poor rates of educational access compared to the rest of the OECD (see chapter 3). This is partially the result of the narrow nature of tertiary education opportunities that has made it easy to monopolize. High tuition costs have also proven problematic. Despite extensive financing provision, the implications for personal debt levels have heavily disincentivized those from low- income backgrounds. However the U.K. also needs to invest further in school provision to break existing, strong, links between educational achievements of parents and children.
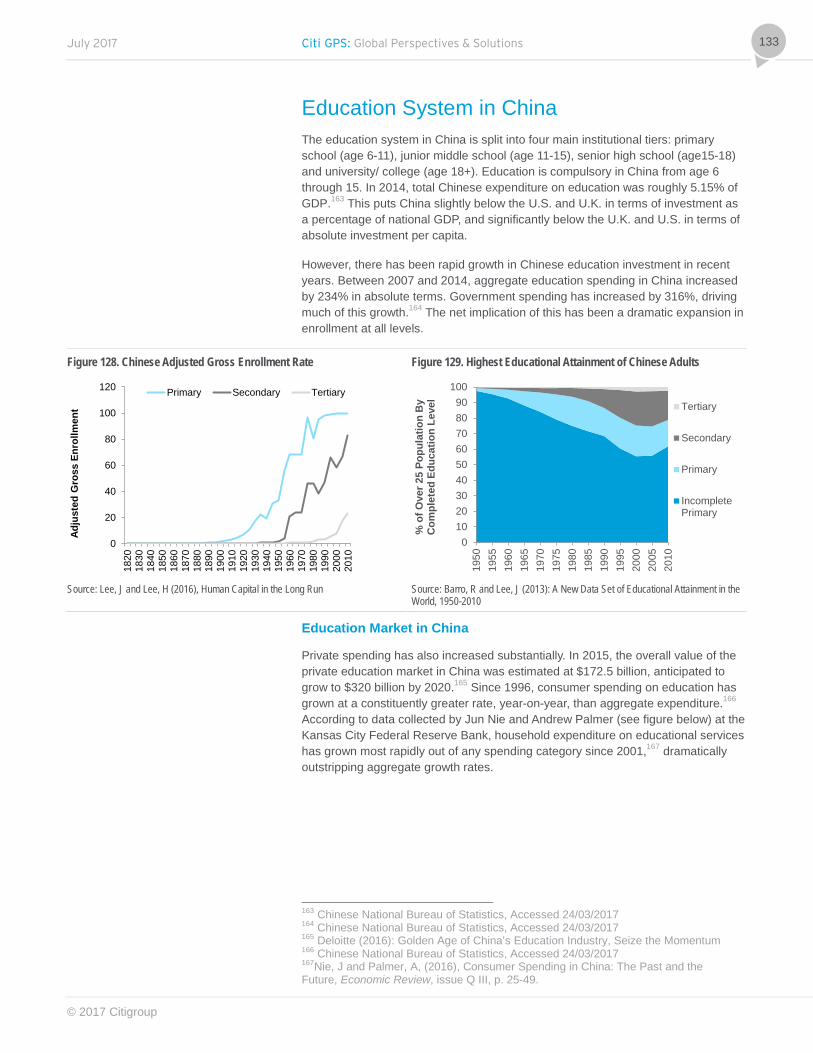
July 2017 Citi GPS: Global Perspectives & Solutions
© 2017 Citigroup
133
Education System in China The education system in China is split into four main institutional tiers: primary school (age 6-11), junior middle school (age 11-15), senior high school (age15-18) and university/ college (age 18+). Education is compulsory in China from age 6 through 15. In 2014, total Chinese expenditure on education was roughly 5.15% of GDP.163 This puts China slightly below the U.S. and U.K. in terms of investment as a percentage of national GDP, and significantly below the U.K. and U.S. in terms of absolute investment per capita.
However, there has been rapid growth in Chinese education investment in recent years. Between 2007 and 2014, aggregate education spending in China increased by 234% in absolute terms. Government spending has increased by 316%, driving much of this growth.164 The net implication of this has been a dramatic expansion in enrollment at all levels.
Figure 128. Chinese Adjusted Gross Enrollment Rate Figure 129. Highest Educational Attainment of Chinese Adults
Source: Lee, J and Lee, H (2016), Human Capital in the Long Run Source: Barro, R and Lee, J (2013): A New Data Set of Educational Attainment in the
World, 1950-2010
Education Market in China
Private spending has also increased substantially. In 2015, the overall value of the private education market in China was estimated at $172.5 billion, anticipated to grow to $320 billion by 2020.165 Since 1996, consumer spending on education has grown at a constituently greater rate, year-on-year, than aggregate expenditure.166 According to data collected by Jun Nie and Andrew Palmer (see figure below) at the Kansas City Federal Reserve Bank, household expenditure on educational services has grown most rapidly out of any spending category since 2001,167 dramatically outstripping aggregate growth rates.
163 Chinese National Bureau of Statistics, Accessed 24/03/2017 164 Chinese National Bureau of Statistics, Accessed 24/03/2017 165 Deloitte (2016): Golden Age of China’s Education Industry, Seize the Momentum 166 Chinese National Bureau of Statistics, Accessed 24/03/2017 167Nie, J and Palmer, A, (2016), Consumer Spending in China: The Past and the Future, Economic Review, issue Q III, p. 25-49.
0
20
40
60
80
100
120
1820
1830
1840
1850
1860
1870
1880
1890
1900
1910
1920
1930
1940
1950
1960
1970
1980
1990
2000
2010
Adju
sted
Gro
ss E
nrol
lmen
t
Primary Secondary Tertiary
0102030405060708090
100
1950
1955
1960
1965
1970
1975
1980
1985
1990
1995
2000
2005
2010
% o
f Ove
r 25
Popu
latio
n B
y C
ompl
eted
Edu
catio
n Le
vel
Tertiary
Secondary
Primary
IncompletePrimary

Citi GPS: Global Perspectives & Solutions July 2017
© 2017 Citigroup
134
Figure 130. Consumer Spending in China
Note: All series are deflated by Chinese CPI Source: Nie, J and Palmer, A, (2016), Consumer Spending in China: The Past and the Future, China National Bureau of Statistics and Haver Analytics
Roughly 10.2% of all Chinese household income is spent on education, compared to 2% in the United States.168 Additionally, this proportion is anticipated to increase as the income of China’s growing urban middle class continues to expand.169 Despite such high levels of private spending, private schools are a relatively small proportion of all educational institutions. Only 6% of primary school, and 10% of secondary school enrollment, is private.170 Instead, it seems that a large portion of this private expenditure goes on non-core educational services. Especially important, according to data from the Chinese National Bureau of Statistics, is supplementary tuition. This accounts for 81% of national private spending.
Figure 131. Proportion of Educational Institutions that are Public and Private, China
Figure 132. Break Down of Private Spending on Education in China
Source: OECD (2016): Education at a Glance, Citi Research Source: Chinese National Bureau of Statistics [Accessed 17/03/2017], Citi Research
168 Chinese National Bureau of Statistics, Accessed 24/03/2017 169 Dobbs et al (2016): Urban World: The Global Consumers to Watch, McKinsey Global Institue 170 OECD (2016): Education at a Glance
0102030405060708090
100
Primary Secondary Tertiary
% Public Private
15% 1%
81%
3%
Other Donation Supplementary Tuition Private School

July 2017 Citi GPS: Global Perspectives & Solutions
© 2017 Citigroup
135
Private expenditure on tuition can be subdivided into three main categories of spending: private kindergarten, K-12 (supplementary) training and other forms of personal training.171 These are already the largest areas of spending, but they are also expected to be the most rapidly growing component of education spending going forward, at least over the next 5 years. All three are anticipated to grow as a percentage of total private spending on education through to 2020, while spending on private school and higher education are anticipated to fall as a percentage of total private spending.172 Additionally, while not displayed in the individual consumer data, corporate training is also expected to grow as a proportion of overall private spending.
Figure 133. Private Spending on Education by Category in 2015 and 2020E
Source: Deloitte (2016): Golden Age of China’s Education Industry, Seize the Momentum, Citi Research
Particularly notable is the rapid growth in the supplementary tuition for school children. This can be partially explained by the structure of the Chinese school and education system that encourages parents to supplement school provision in order to ‘get ahead’.
171 Deloitte (2016). Golden Age of China’s Education Industry: Seize the Momentum. China: Deloitte. 172 Deloitte (2016). Golden Age of China’s Education Industry: Seize the Momentum. China: Deloitte.
-3%
-2%
-1%
0%
1%
2%
3%
4%
5%
6%
-$40
-$20
$0
$20
$40
$60
$80
PrivateKindergarten
Private School Private HigherEducation
CorporateTraining
PersonalTraining
K12 Training
Cha
nge
in S
pend
ing
as a
pro
port
ion
of to
tal
educ
atio
n ex
pend
iture
201
5-20
20
Tota
l Spe
ndin
g (U
SD B
illio
ns)
Aggregate Spending 2015
Aggregate Spending 2020
% Change 2015-2020 as a Proportion of Total Education Spending

Citi GPS: Global Perspectives & Solutions July 2017
© 2017 Citigroup
136
The Chinese School System
China operates a 12 grade school system in which children are compelled to attend primary school from age 6. In most cases, this is preceded by some form of pre-primary education; this being relatively well-developed in China. Currently, there are 36,857,624 children enrolled in pre-primary education, a net enrollment rate of roughly 80%.173 The primary school curriculum consists, predominantly, of Chinese and mathematics. Combined, these account for 60% of class time. Additionally, from age eight, students learn a second language — typically English. At middle school, the curriculum is broadened slightly to prepare students for the ‘Zhongkao’ examination. This is the first public examination taken by Chinese students, typically at age 15. The second is the ‘Gaokao’ examination. This is the entrance exam for higher education, usually taken at age 18.
While relatively large numbers ultimately progress into higher education, success in each examination is crucial to attaining places at top, competitive schools and universities. At each stage, students are usually ranked based on their results in these, relatively marked tests, with top institutions, such as Peking University, taking the top-scoring students. The implication is that both of these tests are of enormous significance to students and are extremely competitive. Acceptance rates for the top 150 universities in China stand at 9%,174 while admission to the most competitive universities, such as Peking or Tsinghua are, at best, 0.84% of all those taking the Gaokao examination.175 Parents invest heavily in trying to supplement their children’s education with additional tuition, explaining the high and growing private spending on supplementary K-12 tuition (see above). Many parents are increasingly turning to private schooling, even if the total number remains relatively small. There are several drivers behind this. Many parents increasingly want to access a broader range of subjects. The Chinese curriculum, especially at a primary school level, is quite narrow, with large quantities of class time dedicated to Chinese and mathematics alone. This has pushed many parents towards private schools that teach curriculums such as the International Baccalaureate. Second is the ongoing presence of the Hukou system. Despite reforms in 2014, the Hukou internal passporting and residency system still leaves many ineligible for public education as it restricts access to public services to many not formally from a given region. This often makes private education a necessity for more wealthy Chinese individuals who have moved away from their home region. Lastly, many use private schools as a means to prepare students for foreign study. More recently, many public schools have adopted schemes in high school to help Chinese students study abroad. However, since 2015, many of the public programs have been shut down.176
Beyond academic schooling, China has also developed a substantial technical education system, a large portion of which operates at a school level. In 2011, enrollment in vocational and technical secondary schools was 29% of that for all senior high schools.177 These schools typically come in three varieties:
173 Chinese National Bureau of Statistics, Accessed 24/03/2017 Retrieved from: http://www.stats.gov.cn/english/statisticaldata/AnnualData/ 174 Chinese National Bureau of Statistics, Accessed 24/03/2017 Retrieved from: http://www.stats.gov.cn/english/statisticaldata/AnnualData/ 175 Fu, Y. (2013 June 19). China’s Unfair College Admissions System. The Atlantic. Retrieved from: https://www.theatlantic.com/china/archive/2013/06/chinas-unfair-college-admissions-system/276995/ 176 Huang, E. (2016 November 3). A crackdown on international-style education in China could make it harder for students to study abroad. Quartz. Retrieved from: https://qz.com/821667/a-crackdown-on-international-style-education-in-china-could-make-it-harder-for-students-to-study-abroad/ 177 Chinese National Bureau of Statistics, Accessed 24/03/2017

July 2017 Citi GPS: Global Perspectives & Solutions
© 2017 Citigroup
137
Technical Schools offering high school age students with four years training in areas such as commerce and legal administration. These institutions also provide tertiary vocational skills.
Vocational Schools offering middle school and high school age students with three years training in subjects such as cooking and photography.
Agricultural Middle Schools offering courses in agricultural science at a middle school level.
The Chinese government has introduced several interesting initiatives to improve the quality of occupational training, including requiring teachers at vocational and technical schools to spend at least one month of the year in industry, to keep them up to date with industry requirements. While technical schools do charge fees, these are now typically free for years that would otherwise be spent in high school.
Tertiary Education
Roughly six million students are currently enrolled in higher education in China, split between 2,850 higher education institutions.178 The numbers studying at a tertiary level has grown dramatically in recent years as the Chinese government has placed a special emphasis on higher education as part of recent economic reform efforts.179 China also now has 377,000 foreign students studying in the country, making it the sixth largest destination for foreign students.180 China remains the largest exporter of students however, with 32% of all foreign students globally coming from China.181
Just as in the U.K. and the U.S., the most common form of higher education in China is an undergraduate degree. However, tuition fees are also much lower at Chinese universities, averaging between $2,000 and $4,500. Additionally, short-cycle tertiary training is nearly as common as a bachelor’s degree (see Figure 127), meaning China has a tertiary training profile similar to the United States. This can be explained, in part, by the success of Technical Schools (see previous section), which push more students onto tertiary technical qualifications from a secondary level. There are more private providers of higher education in China in comparison to the rest of the education system, though these still only include 13% of total enrollment.182
178 Ministry of Education of The People’s Republic of China (2015). National College List. Ministry of Education of The People’s Republic of China. Retrieved from: http://en.moe.gov.cn/Resources/Statistics/edu_stat_2015/2015_en01/index_7.html 179 KPMG (2016). The 13th Five-Year Plan – China’s transformation and integration with the world economy. China: KPMG Global China Practice. 180 Ministry of Education of The People’s Republic of China (2015). Statistics of Foreign Students in China. Ministry of Education of The People’s Republic of China. Retrieved from http://en.moe.gov.cn/Resources/Statistics/edu_stat_2014/2014_en02/ 181 Institute of International Education (2016). Open Doors Data 2016. Washington, D.C.: Bureau of Educational and Cultural Affairs at the U.S. Department of State. 182 OECD (2016). Education at a Glance 2016: OECD Indicators, OECD Publishing, Paris. http://dx.doi.org/10.1787/eag-2016-en

Citi GPS: Global Perspectives & Solutions July 2017
© 2017 Citigroup
138
Challenges
There remains a significant rural-urban gap in educational quality. Many urban schools operate full-time, six-days-a-week schedules while rural schools are typically more flexible and adjust to take account of seasonal factors. Working harder to improve the quality of rural education will be crucial to driving national standards up on an ongoing basis. The Chinese exam system is also in need of reform. The current system not only puts young people under extreme stress, but also encourages parents to spend vast amounts on training that, in social terms, is fundamentally unproductive. Recent moves by the Chinese government to expand the criteria used in high school and tertiary education admissions are welcome, and should be extended. This might also help develop a greater range of tertiary qualifications that will meet the increasingly various needs of a more advanced economy.
There are two additional problems in tertiary education. The first is a deficiency in the number of advanced degrees. The economic impact of this has been partially offset by China’s willingness to send students overseas to study. Many of these students return and subsequently the economic impact has been understated as there are actually a reasonable number of advanced graduates. However, if China is going to achieve its aim of increasing the degree of domestic technological innovation, the development of more extensive domestic post-graduate facilities will be crucial. Secondly, in short-cycle tertiary training, there remain ongoing problems with corporate involvement. The OECD highlights that many technical and vocational schools struggle to place students in appropriate jobs upon graduation.183 Increasing corporate involvement could alleviate this problem and increase the ease with which corporates can fill skill shortages.
Lastly, a notable feature of the Chinese school system is the relatively small number of students that are above the age expected for a given level of education. So called ‘over- age enrollment’ is a lower proportion total enrollment than in either the U.S. or U.K. at both primary and secondary levels. It is also roughly a quarter the proportion in Brazil and a third of that in India.184 As technological innovation and ongoing development continue in China, structures that help older people acquire basic numeracy and literacy skills will likely prove productive.
183 OECD (2010). Vocational Education and Training in China: Strengths, Challenges, and Policy Options. OECD. Retrieved from: http://www.oecd.org/education/skills-beyond-school/45494135.pdf 184 OECD (2016). Education at a Glance 2016: OECD Indicators, OECD Publishing, Paris. http://dx.doi.org/10.1787/eag-2016-en
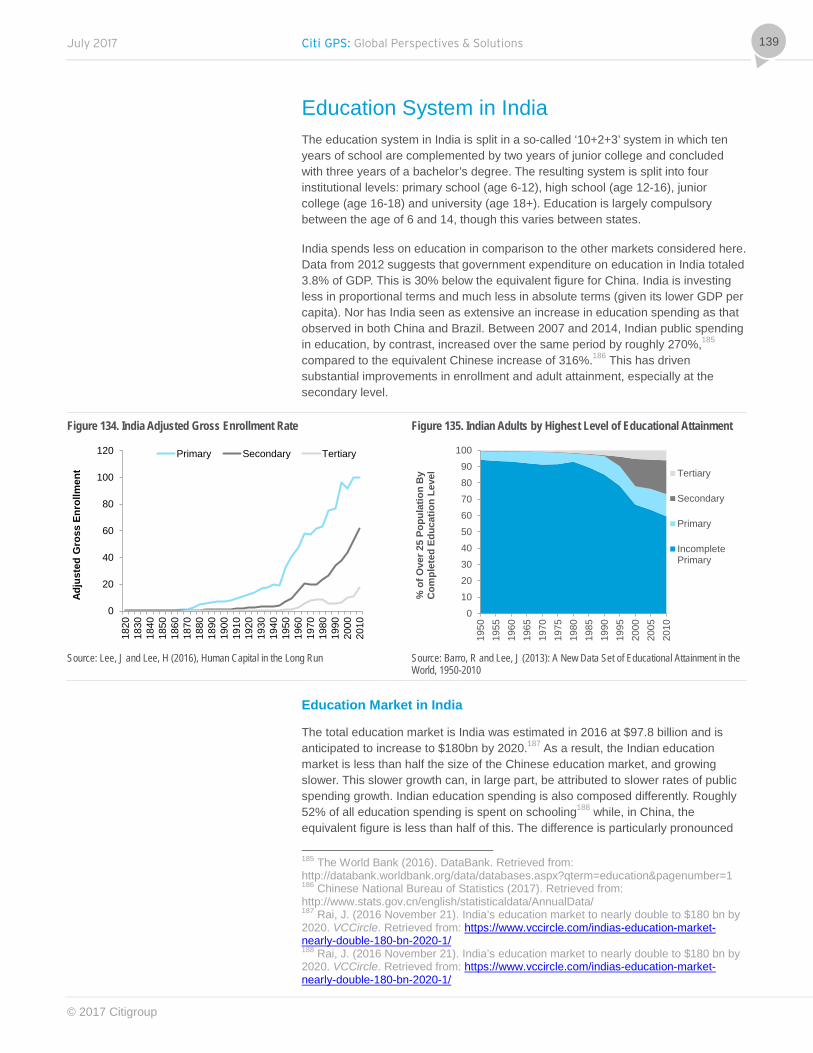
July 2017 Citi GPS: Global Perspectives & Solutions
© 2017 Citigroup
139
Education System in India The education system in India is split in a so-called ‘10+2+3’ system in which ten years of school are complemented by two years of junior college and concluded with three years of a bachelor’s degree. The resulting system is split into four institutional levels: primary school (age 6-12), high school (age 12-16), junior college (age 16-18) and university (age 18+). Education is largely compulsory between the age of 6 and 14, though this varies between states.
India spends less on education in comparison to the other markets considered here. Data from 2012 suggests that government expenditure on education in India totaled 3.8% of GDP. This is 30% below the equivalent figure for China. India is investing less in proportional terms and much less in absolute terms (given its lower GDP per capita). Nor has India seen as extensive an increase in education spending as that observed in both China and Brazil. Between 2007 and 2014, Indian public spending in education, by contrast, increased over the same period by roughly 270%,185 compared to the equivalent Chinese increase of 316%.186 This has driven substantial improvements in enrollment and adult attainment, especially at the secondary level.
Figure 134. India Adjusted Gross Enrollment Rate Figure 135. Indian Adults by Highest Level of Educational Attainment
Source: Lee, J and Lee, H (2016), Human Capital in the Long Run Source: Barro, R and Lee, J (2013): A New Data Set of Educational Attainment in the
World, 1950-2010
Education Market in India
The total education market is India was estimated in 2016 at $97.8 billion and is anticipated to increase to $180bn by 2020.187 As a result, the Indian education market is less than half the size of the Chinese education market, and growing slower. This slower growth can, in large part, be attributed to slower rates of public spending growth. Indian education spending is also composed differently. Roughly 52% of all education spending is spent on schooling188 while, in China, the equivalent figure is less than half of this. The difference is particularly pronounced
185 The World Bank (2016). DataBank. Retrieved from: http://databank.worldbank.org/data/databases.aspx?qterm=education&pagenumber=1 186 Chinese National Bureau of Statistics (2017). Retrieved from: http://www.stats.gov.cn/english/statisticaldata/AnnualData/ 187 Rai, J. (2016 November 21). India’s education market to nearly double to $180 bn by 2020. VCCircle. Retrieved from: https://www.vccircle.com/indias-education-market-nearly-double-180-bn-2020-1/ 188 Rai, J. (2016 November 21). India’s education market to nearly double to $180 bn by 2020. VCCircle. Retrieved from: https://www.vccircle.com/indias-education-market-nearly-double-180-bn-2020-1/
0
20
40
60
80
100
120
1820
1830
1840
1850
1860
1870
1880
1890
1900
1910
1920
1930
1940
1950
1960
1970
1980
1990
2000
2010
Adju
sted
Gro
ss E
nrol
lmen
t
Primary Secondary Tertiary
0102030405060708090
100
1950
1955
1960
1965
1970
1975
1980
1985
1990
1995
2000
2005
2010
% o
f Ove
r 25
Popu
latio
n B
y C
ompl
eted
Edu
catio
n Le
vel Tertiary
Secondary
Primary
IncompletePrimary

Citi GPS: Global Perspectives & Solutions July 2017
© 2017 Citigroup
140
with private spending. Whereas Chinese private spending, as we have seen, is predominantly focused on supplementary services such as additional tuition, in India a far greater portion of private money is spent on school provision.
The higher school spend, overall, is partially the result of a greater proportion of private schools. These are often more resource intensive. In China only 6% of primary and 10% of secondary schools are private; private funding tends to go into supplementary services complementing public schools, rather than paying for private schools. In India, the proportion of private school places at a secondary level is 3 times that of China.189 Additionally, India also has other forms of private schools and non-government schools that are usually more resource intensive, raising money directly from students. This combined with lower Indian education spending explains greater spending on schools as a proportion of total spending.
Figure 136. Primary School Type by Enrollment Figure 137. Secondary School Type by Enrollment
Source: OECD (2016): Education at a Glance Source: OECD (2016): Education at a Glance
However, private consumer expenditure on education is growing rapidly in India. Between 2005 and 2011, household expenditure on education grew by roughly 260%.190 We expect Indian household expenditure on education to follow a similar pattern to China, growing in share as incomes increase.
The Indian School System
There are four different types of institutions at both the primary and secondary level: government managed, local body managed, private supported, and private unsupported. The first two are owned and operated by national/ state governments and local bodies (such as municipal committees), respectively. The third type of institution is independently managed, but is heavily supported by the government. The last is independently run and financed.
In comparison to China, the pre-primary education system in India is relatively under developed. Currently, only 2.5% of all students are enrolled at a pre-school level, compared to 14% in China. This is a level well below what would be expected given the number of people of pre-primary age. From age 5-6, Indian children are 189 OECD (2016). Education at a Glance 2016: OECD Indicators, OECD Publishing, Paris. http://dx.doi.org/10.1787/eag-2016-en 190 Government of India, Ministry of Statistics and Programme Implementation (2015). National Sample Survey 2015. The Journal of Industrial Statistics, Volume 1, Number 1. Retrieved from: http://mospi.nic.in/download-reports?main_cat=NzIy&cat=All&sub_category=All
66%Government
18%Local body
4%Private-aided 12%
Private unaided
36%Government
10%Localbody
23%Private aided
31%Private unaided

July 2017 Citi GPS: Global Perspectives & Solutions
© 2017 Citigroup
141
compelled to attend primary school. Here, education is provided free by the state, though the deficiencies of India’s public education system can often hamper access, especially in rural areas.
From age 14, educational choice increases as the compulsory portion of education ends. For those wishing to pursue further academic study, there are two sets of exams that are taken at upper secondary level. The first set is taken at age 15-16 and is necessary to then take the second set, at age 17-18. The second set is taken at the ‘junior college’ level and govern admission into higher education. Roughly 85-90% of students currently continue with secondary education upon completing the compulsory portion of their study. However, not all those who continue with education continue along the same academic trajectory. India has increasingly invested in its secondary vocational training. Since 2009, the National Mission for Secondary Education has focused on vocational courses that provide occupation- specific qualifications.
There remain stark disparities at all levels of Indian education between rural and urban areas. Hnatkovska and Lahiri show that, even in modern India, the illiteracy rate in rural areas is roughly double that in urban areas.191 Conversely, the proportion of the workforce with secondary or above credentials was roughly 20% in rural areas in 2005, compared to over 40% in urban areas. Figure 136 above masks considerable heterogeneity, with a fundamental difference in the aggregate education level between rural and urban areas. This, they argue, has had important implications in holding back development in India. Realizing continued improvements in standards will require improvement in rural educational provision.
Tertiary Education
India’s tertiary education system is the third largest in the world. While the National Mission for Secondary Education has expanded the number of vocational courses at both a secondary and post-secondary non-tertiary level, there has been less development of tertiary vocational skills. The implication is that tertiary education in India is heavily dominated by universities and, in particular, bachelor’s degrees. As of 2016, India has 799 universities, 68% of which are state run. Roughly 86% of all those enrolled in tertiary education are enrolled in bachelor’s degree programs, compared to 52% in China and 48% in the United States. India has several world leading institutions, such as the Indian Institute of Science, which are focused in the teaching and the development of professional skills.
India has a similar problem to China in that its universities remain too dominated by undergraduate students. Over 85% of all students in both countries are enrolled as undergraduates. This is in comparison to both the U.K. and U.S. that typically have roughly 75% undergraduate students and a greater number of advanced degree students.192 The failure to develop more advanced degree places has stunted the supply of the most advanced, competitive skills in the economy. It also stunts the degree to which institutions such as the Indian Institute of Technology can directly foster innovation.
191 Hnatkovska, V. & Lahiri, A. (2013). The Rural-Urban Divide in India. International Growth Centre Working Paper, ICG, London School of Economics and Political Science, London. 192 OECD (2016). Education at a Glance 2016: OECD Indicators, OECD Publishing, Paris. http://dx.doi.org/10.1787/eag-2016-en

Citi GPS: Global Perspectives & Solutions July 2017
© 2017 Citigroup
142
Challenges
India’s universities need to be further developed and the number of postgraduate places expanded. Already, India has 93 universities that are signaled out for their teaching excellence — so-called ‘Institutes of National Importance’.193 Crucially, however, these are noted for their teaching, rather than their research capabilities. Building more research-focused universities with more advanced degrees could help foster high-tech, innovative industrial clusters — driving Indian industry forward. These, alongside the development of short cycle tertiary qualifications, are the main opportunities that have yet to be realized in Indian tertiary education.
193 Department of Higher Education, Ministry of Human Resource Development (2016 April 19). Institutions of National Importance. Government of India. Retrieved from: http://mhrd.gov.in/institutions-national-importance

July 2017 Citi GPS: Global Perspectives & Solutions
© 2017 Citigroup
143
Education System in Brazil There are five main institutional tiers to education in Brazil: pre-school (Age 3-6), basic education 1 (age 6-11), basic education 2 (age 12-15), high school (age 16-18) and higher education institutions (age 18+). This realizes a three-tiered approach to education: pre-school education, basic education and higher education.
Brazil spends a comparatively large amount of national income on education, especially in public schools. Data from 2013 suggests Brazilian public spending on education totaled 5.5% of GDP, significantly above the equivalent figures for both China and India. This is also, as a percentage of GDP, above the level spent by the U.K. and the U.S. In Brazil, the responsibility for education is divided between three levels of government: municipal, state and federal. Despite such exuberant spending, these bodies, collectively, have not managed to generate significant improvements in educational outcomes. As noted in Chapter 3, Brazil has struggled to improve its PISA score as a result of factors such as poor school organization and governance. Despite this, improvements in public and private spending have generated recent improvements in adult educational attainment and enrollment, especially at the secondary level.
Figure 138. Brazil Adjusted Gross Enrollment Rate Figure 139. Brazilian Adults by Highest Level of Educational Attainment
Source: Lee, J and Lee, H (2016), Human Capital in the Long Run Source: Barro, R and Lee, J (2013): A New Data Set of Educational Attainment in the World, 1950-2010
Education Market in Brazil
The education market is growing rapidly in Brazil as both government and private expenditure have increased significantly in recent years. Spending is predominantly focused at the school level in Brazil, constituting roughly two-thirds of the total education spend.194 Despite the dramatic increase in public spending, the number of private education institutions at the basic education level (aged 6-17) in Brazil increased by 21.4%195 between 2007 and 2014. During the same period, total enrollments in private education have increased by 42%, even as total enrollment fell by 6%.196 Today, the total number of students in private Brazilian schools is now over 9 million.
194 Danish Agency for Science, Technology, and Innovation (2016). The Brazilian Education System: An overview. IDCK Analysis No. 5. Danish Agency for Science, Technology, and Innovation, Copenhagen. 195 Ibid 196 Ibid
0
20
40
60
80
100
120
1820
1835
1850
1865
1880
1895
1910
1925
1940
1955
1970
1985
2000
Adju
sted
Gro
ss E
nrol
lmen
t
Primary Secondary Tertiary
0102030405060708090
100
1950
1955
1960
1965
1970
1975
1980
1985
1990
1995
2000
2005
2010
% o
f Ove
r 25
Popu
latio
n B
y C
ompl
eted
Edu
catio
n Le
vel Tertiary
Secondary
Primary
Incomplete Prim

Citi GPS: Global Perspectives & Solutions July 2017
© 2017 Citigroup
144
Figure 140. School Enrollment by Type of Institution
Source: Citi Research; Danish Ministry of Higher Education (2016): The Brazilian Education System
Supplementary education services have also been growing rapidly. Rather than replacing or providing core education services such as school, these are services such as additional courses, or supplementary tuition. In Brazil, the two most common forms of such services are language courses, provided by companies such as Wise Up, and exam preparation help, provided by companies such as Geekie. BCG has anticipated that such services will enjoy a compound annual growth rate of 4% in real terms through to 2020.197
There is also significant spending growth at the both the pre-school and tertiary level. Pre-school enrollment rates in Brazil are high, nationally around 80% for those aged 4-5.198 Municipalities are required to provide such pre-care services to those willing to attend free of charge.199 However, quality concerns and funding shortages have resulted in the rapid growth of private institutions. In 2011, roughly 28% of all early education institutions were private, up from 5.5% in 2000.200
The Brazilian tertiary education system is also a center for private educational investment. Three-quarters of all enrollments in Brazilian universities are now in private institutions. Several foreign universities have invested in the country to exploit some of the surplus demand beyond that provided by free public universities. US universities have been particularly active. The University of Southern California, for example, has established a campus in Brazil in an attempt to recruit students while Ohio State University has also stepped up its links with Brazilian universities, as well as expanding its own Gateway presence in Sao Paulo.201
197 Cunha, O., Cheng, S. Abida, R. (2013 July 4). Redefining Brazil’s Emerging Middle Class. BCG Perspectives. Retrieved from: https://www.bcgperspectives.com/content/articles/center_consumer_customer_insight_globalization_redefining_brazils_emerging_middle_class/#chapter1 198 Yamaguchi, A. M. (2013 July 26). Early Childhood Education in Brazil. Child Research Net. Retrieved from: http://www.childresearch.net/projects/ecec/2013_10.html 199 Ibid 200 Ibid 201 For information on The Ohio State’s Brazil Gateway, visit https://oia.osu.edu/brazil/about.html
0%10%20%30%40%50%60%70%80%90%
100%
2007 2008 2009 2010 2011 2012 2013 2014
Private Municipal State Federal
Figure 141. Brazilian University Places by Type
Source: OCED (2016) Stat, Citi Research
25%Public
75%Private

July 2017 Citi GPS: Global Perspectives & Solutions
© 2017 Citigroup
145
The Brazilian School System
Education between ages of 6 and 17, the period of so-called basic education is compulsory for all students in Brazil. The initial focus of the curriculum is basic literacy and mathematics, complemented with additional study of other common subjects. Foreign language skills have been a long term focus of the Brazilian education system and students are required, from their sixth year of basic education, to learn two foreign languages: English and another of the school’s choice. During the last two years of compulsory education, the standard academic program is complemented by the option of professional training courses for example, in agriculture.
At the end of high school, students wishing to pursue university education typically take two sets of exams. The first is the vestibular exam. This is specific to the university the student is applying to, though these exams generally test student abilities in a variety of subject areas. Second is the ENEM Exam. This is a national exam administered by the federal government. The exam consists of two stages. The first is comprised of a series of multiple choice questions covering most of the subjects studied at high school. The best-scoring candidates go on to take part in a second, more specific, written examination. Often university admissions are based on these exams alone. They not only determine the quality of the institution a student attends but also whether they have to pay. Competition for the 25% of all university places (those at public universities) that are free is intense, especially as these institutions are widely thought to offer the best quality education.202
The Brazilian public school system is run by a range of different governmental bodies. Generally, the higher the level of education, the less local the governmental body responsible for it. While municipal and federal authorities have a lot of responsibilities, state authorities have relatively few (see figure below).
Figure 142. Brazilian Education System Level Brazilian Definition/ English Definition Duration Age Responsibility of:
Ensino Infantil Educação Infantil/ Pre-Primary
Creche 2 years 1-3 years Municipal Authority
Pré-escola/Pre-school 2 years 4-5 years
Ensino Basico/ Basic Education
Ensino Fundamental 1/ Primary School 5 years 6-11 years Municipal Authority
Ensino Fundamental 2/ Lower Secondary School 4 Years 11-14 years
Municipal, State & Federal authorities Ensino Medio/ Upper Secondary School 3 years 15-17 years
Ensino Tecnico/ Technical School (2 years) (16-17 years)
Ensino Superior/ Higher Education Ensino Superior/Higher Education Dependent 17+ Federal Authorities
Source: Danish Ministry of Higher Education (2016): The Brazilian Education System, Citi Research;
202 Danish Agency for Science, Technology, and Innovation (2016). The Brazilian Education System: An overview. IDCK Analysis No. 5. Danish Agency for Science, Technology, and Innovation, Copenhagen.

Citi GPS: Global Perspectives & Solutions July 2017
© 2017 Citigroup
146
Tertiary Education
Tertiary education in Brazil is predominantly comprised of university degrees. Roughly 41,000 Brazilian students are enrolled in short-cycle tertiary education according to the OECD, while 7 million are enrolled in Brazilian universities203. University education in Brazil can be split between public and private qualifications. Public universities are free but highly competitive, as noted above. Private universities are far more numerous but are generally of lower quality. The Brazilian government runs a public student loan program in conjunction with providing free university places at public university, to help as many students as possible attend.
Tertiary enrollment rates for Brazil are roughly 46%, however it appears that between one-third and one-half of this enrollment is outside of the age usually associated with university students (over the age of 25). Additionally, while roughly 25% of all university places are public, this proportion is shrinking. Recent growth has been more rapid in private than public universities. This could further intensify competition for the public places that remain, driving increased spending on services such as Geekie that aim to help students perform better in the ENEM entrance examination.
Figure 143. Brazil University Places by Type of Institution
Source: Danish Ministry of Higher Education (2016): The Brazilian Education System, Citi Research
Challenges
The central challenge to the Brazilian education system is efficiency. As chapter 3 discussed, Brazil spends large quantities of money on school education. Despite this, it underperforms when it comes to educational outcomes, measured using PISA scores. This, however, is not just a school-based phenomenon. The Brazilian university dropout rate is also remarkably high, with 50% of all students enrolling in tertiary education failing to complete the course.204
203 OECD (2016). Education at a Glance 2016: OECD Indicators, OECD Publishing, Paris. http://dx.doi.org/10.1787/eag-2016-en 204 Danish Agency for Science, Technology, and Innovation (2016). The Brazilian Education System: An overview. IDCK Analysis No. 5. Danish Agency for Science, Technology, and Innovation, Copenhagen.
0
1000000
2000000
3000000
4000000
5000000
6000000
7000000
8000000
1990 2000 2013
Private Public

July 2017 Citi GPS: Global Perspectives & Solutions
© 2017 Citigroup
147
Additionally, Brazil also needs to work harder to develop its short cycle tertiary educational system. Currently less than 1% of all tertiary students are enrolled in such schemes, compared to 41% in China. Improving the supply of such skills would generate good economic returns, but also would likely improve the efficiency of the overall tertiary education system by reducing the number of unsuitable applicants enrolling in university courses.

Citi GPS: Global Perspectives & Solutions July 2017
© 2017 Citigroup
148
References
Abadzi, H. (2007). Absenteeism and Beyond: Instructional Time Loss and Consequences. Policy research working paper series no: WPS4376. Washington, D.C.: World Bank.
Acemoglu, D. & Autor, D. (2012). What Does Human Capital Do? A Review of Goldin and Katz’s The Race between Education and Technology. Journal of Economic Literature 2012, 50:2, 426-263. DOI10.1257/jel.50.2.426
Adkins, S. S. (2015). The 2014-2019 Worldwide Mobile Learning Market. Ambient Insight.
Altonji, J., Blom, E. & Meghir, C. (2012). Heterogeneity in Human Capital Investments: High School Curriculum, College Major, and Careers. Annual Review of Economics, vol. 4(1): 185- 223, 07.
Amromin, G. & Eberly, J. (2016). Education Financing and Student Lending. Annual Review of Financial Economy, 8: 289-315.
Arntz, M., Goregory, T. & Zierahn, U. (2016). The Risk of Automation for Jobs in OECD Countries: A Comparative Analysis. OECD Social, Employment and Migration Working Papers, No. 189. http://dx.doi.org/10.1787/5jlz9h56dvq7-en
Associated Press (2012, April 23). ‘Half of recent college grads underemployed or jobless, analysis says’. Cleveland.com. Retrieved from: http://www.cleveland.com/business/index.ssf/2012/04/half_of_recent_college_grads_u.html
Avery, C., Hoxby, C., Jackson, C. K., Burek, K., Poppe, G. & Raman, M. (2008). Cost should be no barrier: An evaluation of the first year of Harvard's Financial Aid Initiative. National Bureau of Economic Research Working Paper 12029.
Bainbridge, D. (2016, August 13). Edtech is the next fintech. Tech Crunch. Retrieved from https://techcrunch.com/2016/08/13/edtech-is-the-next-fintech/
Barro, R. J. & Lee, J. W. (2013). A new data set of educational attainment in the world, 1950-2010. Journal of Development Economics, Elsevier vol. 104(C), pages 184-198.
BBC News (2016, April 28). England degree debt 'highest in English-speaking world'. BBC. Retrieved from: http://www.bbc.com/news/education-36150276
Beaudry, P, Green, D., & Sand, B. (2016). The Great Reversal in the Demand for Skill and Cognitive Tasks. Journal of Labor Economics, vol 34(S1), pages S199-S247. DOI: 10.3386/w18901
Behle, H. (2016). Graduates in non-graduate occupations. Report to HEFCE and SRHE by Warwick Institute for Employment Research.
Benson-Armer, R., Sarakatsannis, J., & Wee, K. (2014 August). The future of textbooks. McKinsey. Retrieved from: http://www.mckinsey.com/industries/social-sector/our-insights/the-future-of-textbooks
Bhattacharyya, G., Ison, L. & Blair, M. (2003). Minority Ethnic Attainment and Participation in Education and Training: The Evidence. Department for Education and Skills London, Research Topic Paper No. RTP01-03.

July 2017 Citi GPS: Global Perspectives & Solutions
© 2017 Citigroup
149
Bidwell, A. (2014 August 5). Clipped Classroom May Help Weaker STEM Students. U. S. News & World Report. Retrieved from: https://www.usnews.com/news/stem-solutions/articles/2014/08/05/taking-a-page-from-humanities-college-engineering-gets-flipped
Bloom, B. S. (1984). The Search for Methods of Group Instruction as Effective as One-to-One Tutoring. Educational Researcher, Vol 13, Issue 6, pp. 4-16.
Blundell, R., Green, D., & Jin, W. (2016). The UK wage premium puzzle: how did a large increase in university graduates leave the education premium unchanged? IFS Working Paper (W16/01). DOI: 10.1920/wp.ifs.2016.1601
Bolton, P. (2016). Briefing Paper, 1079: Tuition Fee Statistics, House of Commons Library, London.
Bombardieri, Marcella. (2005). Elite Colleges Go After Low-Income Recruits, Schools Expand Aid, Outreach. The Boston Globe (A1, July 16).
Bosworth, B. (2004). Productivity in Education and the Growing Gap with Service Industries. Paper delivered to the The Internet and the University Forum, Aspen.
Brookings (2014). The Hamilton Project at the Brookings Institution: Career Earnings by College Major. Retrieved from: http://www.hamiltonproject.org/charts/career_earnings_by_college_major/
Bureau of Labour Statistics (2015). Consumer Expenditure Survey. Washington, D.C.: U.S. Department of Labor.
Bushweller, K. & Glass, D. (2016). Spanning the Globe: Doing K-12 Business in the U.S. and Abroad [PowerPoint slides]. Retrieved from http://www.edweek.org/media/160519presentation.pdf
Business Wire (2016 April 20). Technavio Expects the Classroom Wearables Technology Market in the US to Reach USD 3.7 Billion by 2020. Business Wire. Retrieved from: http://www.businesswire.com/news/home/20160420005037/en/Technavio-Expects-Classroom-Wearables-Technology-Market-Reach
Business Wire (2016 December 5). Global Education Gamification Market to Grow at an Impressive CAGR of Over 68% Through 2020, Reports Technavio. Business Wire. Retrieved from: http://www.businesswire.com/news/home/20161205005450/en/Global-Education-Gamification-Market-Grow-Impressive-CAGR
Business Wire (2017 February 20). Top 3 Trends Impacting the Artificial Intelligence Market in the US Education Sector Through 2021: Technavio. Business Wire. Retrieved from: http://www.businesswire.com/news/home/20170220005208/en/Top-3-Trends-Impacting-Artificial-Intelligence-Market pg. 89 footnote 124
Business Wire (2017 April 21). Private Tutoring Marketing in China – Drivers and Forecast From Technavio. Business Wire. Retrieved from: http://www.businesswire.com/news/home/20170421005379/en/Private-Tutoring-Market-China---Drivers-Forecast]
Chang, F. et al. (2016). China’s looming human capital crisis: Upper secondary educational attainment rates and the middle income trap. Stanford Center for International Development, Working Paper No. 546.

Citi GPS: Global Perspectives & Solutions July 2017
© 2017 Citigroup
150
Chinese National Bureau of Statistics, Accessed 24/03/2017 Retrieved from: http://www.stats.gov.cn/english/statisticaldata/AnnualData/
Citi GPS & Channell, J. et al (2016). Infrastructure for Growth. New York, NY: Citi.
Citi GPS & Ezawa, K. et al (2016). Virtual & Augmented Reality. New York, NY: Citi.
Citi GPS & Oxford Martin School (2015). Technology at Work. New York, NY: Citi.
Crawford, C. (2014). Socio-economics differences in university outcomes in the UK: drop-out, degree completion and degree class. Institute of Fiscal Studies Working Paper 14/31. http://dx.doi.org/10.1920/wp.ifs.2014.1431
Crawford, C., Crawford R. & Jin, W. (2014). Estimating the public cost of student loans. Institute for Fiscal Studies, IFS Report R94.
Cunha, O., Cheng, S. Abida, R. (2013 July 4). Redefining Brazil’s Emerging Middle Class. BCG Perspectives. Retrieved from: https://www.bcgperspectives.com/content/articles/center_consumer_customer_insight_globalization_redefining_brazils_emerging_middle_class/#chapter1
Deming, D., Yuchtman, N., Abulafi, A. et al (2015). The Value of Postsecondary Credentials in the Labor Market: An Experimental Study. Harvard University, Cambridge.
Danish Agency for Science, Technology, and Innovation (2016). The Brazilian Education System: An overview. IDCK Analysis No. 5. Danish Agency for Science, Technology, and Innovation, Copenhagen.
de Vries, R. (2014). Earning by Degrees: Differences in the career outcomes of UK graduates, The Sutton Trust, London.
Desrochers, D. & Staisloff, R. (2016). Competency-Based Education: A Study of Four New Models and Their Implications for Bending the Higher Education Cost Curve. rpk Group, Maryland.
Deloitte (2016). Golden Age of China’s Education Industry: Seize the Momentum. China: Deloitte.
Department of Higher Education, Ministry of Human Resource Development (2016 April 19). Institutions of National Importance. Government of India. Retrieved from: http://mhrd.gov.in/institutions-national-importance
Donovan, J. & Benko, C. (2016). AT&T’s Talent Overhaul. Harvard Business Review. Retrieved from: https://hbr.org/2016/10/atts-talent-overhaul
Eisenhammer, S. (2016 January 17). Dreams of Brazil’s youth fade as student loans cut. Reuters. Retrieved from: http://www.reuters.com/article/brazil-education-idUSL2N14V295
Elias, P. & Purcell, K (2013). Classifying graduate occupations for the knowledge society. SOC(HE) Futuretrack Working paper No. 5, Institute for Employment Research.
Equality Challenge Unit. ‘Degree attainment gaps’. Retrieved from: http://www.ecu.ac.uk/guidance-resources/student-recruitment-retention-attainment/student-attainment/degree-attainment-gaps/

July 2017 Citi GPS: Global Perspectives & Solutions
© 2017 Citigroup
151
Eyring H.C., (2011). Unexploited efficiencies in higher education. Contemporary Issues in Education Research, 4(7), 1-18.
Faggella, D. (2017 March 7). Examples of Artifical Intelligence in Education. Techemergence. Retrieved from: https://www.techemergence.com/examples-of-artificial-intelligence-in-education/
Frey C. B. & Osborne, M. A. (2013). THE FUTURE OF EMPLOYMENT: HOW SUSCEPTIBLE ARE JOBS TO COMPUTERISATION? Oxford Martin School, University of Oxford, Oxford.
Fu, Y. (2013 June 19). China’s Unfair College Admissions System. The Atlantic. Retrieved from: https://www.theatlantic.com/china/archive/2013/06/chinas-unfair-college-admissions-system/276995/
Gitlen, J. (2016, July 1). Student Loan Debt Statistics 2017. Lendedu. Retrieved from: https://lendedu.com/blog/student-loan-debt-statistics
Global Industry Analysts, Inc. (2016). Intense Competition among Students and the growing Need to Achieve Academic Excellence Drive the Global Private Tutoring Market. Global Industry Analysts, Inc. Retrieved from: http://www.strategyr.com/MarketResearch/Private_Home_Tutor_Services_Market_Trends.asp
Global Silicon Valley (2016). 2020 Vision: A History of the Future, GSV Media, California.
Goldthorpe, J. (2013). Understanding – and Misunderstanding – Social Mobility in Britain: The Entry of the Economists, the Confusion of Politicians and the Limits of Educational Policy. Journal of Social Policy, 42(3), 431-450. https://doi.org/10.1017/S004727941300024X
Government of India, Ministry of Statistics and Programme Implementation (2015). National Sample Survey 2015. The Journal of Industrial Statistics, Volume 1, Number 1. Retrieved from: http://mospi.nic.in/download-reports?main_cat=NzIy&cat=All&sub_category=All
Hanushek, E.A & Wobmann, L (2010). Education and Economic Growth, International Encyclopedia of Education, vol.2 pp 245-252. http://dx.doi.org/10.1787/eag-2016-en
Harding, A. H. (2015 March 6). Back to School: The Importance of Adult Learning. HuffPost UK. Retrieved from: http://www.huffingtonpost.co.uk/andrew-h-harding/back-to-school-the-import_b_7468792.html
Harvard University: Office for Admissions and Financial Aid
Hemelt, S. & Marcotte, D. (2008) Rising Tuition and Enrollment in Public Higher Education. Institute for the Study of Labor (IZA), Discussion Paper 3827.
Hemelt, S. & Marcotte, D. (2011). The Impact of Tuition Increases on Enrollment at Public Colleges and Universities. Educational Evaluation and Policy Analysis, Vol 33, Issue 4, pp. 435 – 457. https://doi.org/10.3102/0162373711415261
Higher Education Price Index (HEPI) (2016). Commonfund. N.p.. Web. 4 Feb. 2017

Citi GPS: Global Perspectives & Solutions July 2017
© 2017 Citigroup
152
Hillman, N. & Robinson, N. Boys to Men: The underachievement of young men in highr education – and how to start tackling it. Higher Education Policy Institute, HEPI Report 84.
Hnatkovska, V. & Lahiri, A. (2013). The Rural-Urban Divide in India. International Growth Centre Working Paper, ICG, London School of Economics and Political Science, London.
Holmes, C & Mayhew, K. (2016). The economics of higher education. Oxford Review of Economic Policy 2016; 32 (4): 475-496. https://doi.org/10.1093/oxrep/grw031
Holmes, C. Has the Expansion of Higher Education Led to Greater Economic Growth? National Institute Economic Review, vol 224 (1), pages R29-R47. DOI: 10.1177/002795011322400103
Huang, E. (2016 November 3). A crackdown on international-style education in China could make it harder for students to study abroad. Quartz. Retrieved from: https://qz.com/821667/a-crackdown-on-international-style-education-in-china-could-make-it-harder-for-students-to-study-abroad/
Hungerford, T., & Solon, G. (1987). Sheepskin Effects in the Returns to Education. Review of Economics and Statistics, 69 (1): 175–177.
IBISWorld (2016). Primary Education in the UK: Market Research Report. IBISWorld. Retrieved from: https://www.ibisworld.co.uk/market-research/primary-education.html
Ikeda, M. & Garcia, E. (2014). Grade repetition: A comparative study of academic and non-academic consequences. OECD Journal: Economic Studies, Vol. 2013/1. http://dx.doi.org/10.1787/19952856
Institute for Research on Higher Education, (2016). College Affordability Diagnosis: National Report. Institute for Research on Higher Education, Graduate School of Education, University of Pennsylvania.
Institute of International Education (2016). Open Doors Data 2016. Washington, D.C.: Bureau of Educational and Cultural Affairs at the U.S. Department of State.
International Labour Organization (ILO) 2016. ILOSTAT Labour Database, ILOSTAT, Switzerland.
Jerrim, J., Chmielewski, A., & Parker, P. (2015). Socioeconomic Inequality in Access to High-Status Colleges: A Cross-Country Comparison. Research in Social Stratification and Mobility, 42: 20-32.
Kemp, N. (2016). The International Education Market: Some Emerging Trends. Center for International Higher Education, Number 85, pages 13-15. DOI: 10.6017/ihe.2016.85.9238
Kovalskys, G. (2016, June 24). Here’s why the Big Four’s investment in education are great for ed-tech entrepreneurs. Recode. Retrieved from https://www.recode.net/2016/6/24/12014994/ed-tech-entrepreneurs-educational-technology-investment-big-four
KPMG (2016). The 13th Five-Year Plan – China’s transformation and integration with the world economy. China: KPMG Global China Practice.

July 2017 Citi GPS: Global Perspectives & Solutions
© 2017 Citigroup
153
Lee, J. & Lee, H. (2016). Human capital in the long run. Journal of Development Economics, vol. 122, issue C, 1247-169.
Leventhal, M. & Tang, I. (2013 October 14). A Sector of Interest: Institutions & Schools, Private Equity for Education. Equity for Education. Retrieved from: https://equityforeducation.wordpress.com/2013/10/14/a-sector-of-interest-institutions-schools/
London Economics (2013). What’s the value of a UK degree? million+ and London Economics, London.
Long, B.T. (2010). The New Financial Aid Policies: Their Impact on Access and Equity For Low-Income Students? Harvard Graduate School of Education, Cambridge.
Looney, W. & Yannelis, C. (2015). A Crisis in Student Loans? How Changes in the Characteristics of Borrowers and in the Institutions They Attended Contributed to Rising Loan Defaults. Brookings Papers on Economic Activity, 2015, vol. 46, issue 2 (Fall), pages 1-89.
McKinsey & Auguste, B. (2010). Winning by Degrees: The Strategies of Highly Productive Higher-education Institutions. McKinsey , Social Sector.
McKinsey & Barton, D., Farrell, D., & Mourshed, M. (2013). Education to employment: Designing a system that works. McKinsey, Social Sector.
McKinsey & Dobbs, R., Madgavkar, A., Barton, D. et al. (2012). The world at work: Jobs, pay, and skills for 3.5 billion people. McKinsey, Global Institute.
McKinsey & Dobbs, R., Manyika, J., Woetzel, J et al. (2016). Urban world: The global consumers to watch. McKinsey, Global Institute.
Moules, J. (2017 May 14). How edtech start-ups are shaking up executive education. Financial Times. Retrieved from: https://www.ft.com/content/8c8cf4b6-2c3a-11e7-bc4b-5528796fe35c?mhq5j=e3
Ministry of Education of The People’s Republic of China (2015). National College List. Ministry of Education of The People’s Republic of China. Retrieved from: http://en.moe.gov.cn/Resources/Statistics/edu_stat_2015/2015_en01/index_7.html
Mounmé, R. & Saudemont, C. (2015). Overview of the role of private providers in education in light of the existing international legal framework. Investments in private education: undermining or contributing to the full development of the human right to education? UNESCO Working Papers on Education Policy N°. UNESCO, Paris.
NAFSA (2016). NAFSA International Student Economic Value Tool. Indiana University Office of International Services, Indiana.
National Research Council (2012). Improving Measurement of Productivity in Higher Education. Panel on measuring higher education productivity: Conceptual Framework and Data Needs.
Netherlands Institute for Social Research (2016). Supply of Labor Report. The Netherlands Institute for Social Research, Netherlands.
Nie, J. & Palmer, A. (2016). Consumer Spending in China: The Past and the Future. Federal Reserve Bank of Kansas City, Economic Review, vol.101, no. 3, pp. 25–49.

Citi GPS: Global Perspectives & Solutions July 2017
© 2017 Citigroup
154
OECD (2010). Economic Policy Reforms: Going for Growth, pages 181-197. http://dx.doi.org/10.1787/growth-2010-en
OECD (2010). Vocational Education and Training in China: Strengths, Challenges, and Policy Options. OECD. Retrieved from: http://www.oecd.org/education/skills-beyond-school/45494135.pdf
OECD (2012). ‘Does Money Buy Strong Performance in PISA?’, PISA in Focus, No. 13. OECD Publishing, Paris. http://dx.doi.org/10.1787/5k9fhmfzc4xx-en
OECD (2016). Education at a Glance 2016: OECD Indicators, OECD Publishing, Paris. http://dx.doi.org/10.1787/eag-2016-en
OECD (2017). ‘ISCED 5: Short-cycle tertiary education’. Retrieved from: http://uis.unesco.org/en/glossary-term/isced-5-short-cycle-tertiary-education
OECD (2017). Public spending on education. OECD Data.
Paradi-Guilford, C. & Khomyn, M. (2016 April 20). How coding bootcamps are helping to tackle youth unemployment. The World Bank. Retrieved from: http://blogs.worldbank.org/ic4d/how-coding-bootcamps-are-helping-tackle-youth-unemployment pg. 100, new footnote after “Interviews through career coaching”.
Payscale (2016). ‘College Salary Report: Best Graduate Schools by Salary Potential’. Retrieved from: https://www.payscale.com/college-salary-report/grad?page=43
Pearson (2016). The Pearson VUE 2016 Value of IT Certification Survey. New Jersey: Pearson Education.
Pembroke College, Access and Outreach: http://www.pmb.ox.ac.uk/content/access-outreach
Puckett, J., Davidson, J., & Lee, E. (2012 October 1). Vocational Education: The Missing Link in Economic Development. BCG Perspectives. Retrieved from: https://www.bcgperspectives.com/content/articles/education_public_sector_vocational_education/
Putnam, R. D. (2015). Our Kids: The American Dream in Crisis. New York: Simon & Schuster.
PwC (2016). Global Entertainment and Media Outlook 2016-2020. PwC.
Rai, J. (2016 November 21). India’s education market to nearly double to $180 bn by 2020. VCCircle. Retrieved from: https://www.vccircle.com/indias-education-market-nearly-double-180-bn-2020-1/
Rani, G. (2014). Disparities in earnings and education in India. Cogent Economics & Finance, 2: 941510. https://doi.org/10.1080/23322039.2014.941510
Roser, M. & Nagdy, M. (2016). ‘Projections of Future Education’. Our World in Data. Retrieved from: https://ourworldindata.org/projections-of-future-education/
Roser, M. & Ortiz-Ospina, E. (2016). ‘Global Rise of Education’. Published online at OurWorldInData.org. Retrieved from: https://ourworldindata.org/global-rise-of-education
July 2017 Citi GPS: Global Perspectives & Solutions
© 2017 Citigroup
155
RTE (2016 May 13). Experts call for investment in digital skills in schools. RTE. Retrieved from: https://www.rte.ie/news/2016/0513/788107-digital-education-skilss/
Sibieta, L. (15 April 2015). Education spending: what are the parties planning to protect? Institute for Fiscal Studies. Retrieved from: https://www.ifs.org.uk/publications/7717
Silva, E., White, T., & Toch, T. (2015). The Carnegie Unit: A Century-Old Standard in a Changing Education Landscape. Carnegie Foundation for the Advancement of Teaching, Stanford
Sutton Trust (2010). Responding to the New Landscape for University Access. The Sutton Trust, London.
Tetlow, G. (2016, April 27). Two-thirds Of UK ‘students will never pay off debt’. The Financial Times. Retrieved from: https://www.ft.com/content/55f4a6f6-3eab-11e6-9f2c-36b487ebd80a?mhq5j=e3
The Complete University Guide (2017). Peking University, China: Fees. Retrieved from: https://www.thecompleteuniversityguide.co.uk/international/asia/china/peking-university/fees
The Economist (2015). Driving the skills agenda: Preparing students for the future. An Economist Intelligence Unit Report, sponsored by Google. The Economist Intelligence Unit, London.
The Economist (2017 January 12). Learning and earning: The elephant in the truck. The Economist. Retrieved from: http://www.economist.com/news/special-report/21714175-systems-continuous-reskilling-threaten-buttress-inequality-retraining-low-skilled
The Equality of Opportunity Project: http://www.equality-of-opportunity.org/
The Times Higher Education (2016). World University Rankings 2016-2017. The Times Higher Education. Retrieved from: https://www.timeshighereducation.com/world-university-rankings/2017/world-ranking#!/page/0/length/25/sort_by/rank/sort_order/asc/cols/stats
Tilak, J. B. G. (2015). How Inclusive is Higher Education in India? Social Change, Vol. 45, pages 185-223. DOI: 10.1177/0049085715574178
The World Bank (2016). DataBank. Retrieved from: http://databank.worldbank.org/data/databases.aspx?qterm=education&pagenumber=1
Turner, C., Khrais, R., Lloyd, T., et al. (2016 April 18). Why America’s Schools Have A Money Problem. NPR. Retrieved from: http://www.npr.org/2016/04/18/474256366/why-americas-schools-have-a-money-problem
U. S. Department of Education. ‘Increasing Educational Productivity: Innovations Approaches & Best Practices.’ Retrieved from: https://www.ed.gov/oii-news/increasing-educational-productivity
U.S. Department of Education, National Center for Education Statistics, (2016). Digest of Education Statistics, 2015 (NCES 2016-014), Chapter 3.

Citi GPS: Global Perspectives & Solutions July 2017
© 2017 Citigroup
156
U.S. Department of Education. Tuition costs of colleges and universities, National Center for Education Statistics.
U.K. Council for International Student Affairs (2016). ‘International student statistics: UK higher education’. Retrieved from: https://institutions.ukcisa.org.uk/Info-for-universities-colleges--schools/Policy-research--statistics/Research--statistics/International-students-in-UK-HE/#
United Kingdom Government Department for Business, Innovation, & Skills et al. (2013). New push to grow UK’s £17.5 billion education exports industry. U.K.
United Nations Economic Commission for Latin American and the Caribbean (ECLAC) (2004). Progress Report on the Activities of the Programme of International Statistical Work for Latin American and the Caribbean, July 2003-June 2005. Chile: United Nations.
UN Population Department Estimates (2016). Retrieved from: https://esa.un.org/unpd/wpp/Download/Standard/Population/
UNESCO Institute for Statistics (2017). Retrieved from: http://uis.unesco.org/
Universities UK Modernisation and Efficiency Task Group & Diamond, I. et al (2011). Efficiency and effectiveness in higher education: A report by the Universities UK Efficiency and Modernisation Task Group. Universities UK, London.
University of Oxford (2015). International Trends in Higher Education 2015. University of Oxford, Oxford.
Vincent-Lancrin, S. (2008). The Reversal of Gender Inequalities in Higher Education: an Ongoing Trend. In Higher Education to 2030: Demography (Vol. 1, pp. 265–298). OECD, Paris.
Virtual Reality Reporter (2016). SuperData Expands Market Research Scope & Forecast of $40 Billion VR Market. Virtual Reality Reporter. Retrieved from: https://virtualrealityreporter.com/superdata-expands-research-scope-of-40-billion-virtual-reality-market/
Weale, S. (2016, May 11). UK’s university gender gap is a national scandal, says thinktank. The Guardian. Retrieved from: https://www.theguardian.com/education/2016/may/12/university-gender-gap-scandal-thinktank-men
Winthrop, R., Bulloch, G., Bhatt, P., & Wood, A. (2013). Investment in Global Eduation: A Strategic Imperative for Business. The Center for Universal Education at the Brookings Institution, Washington, D.C.
Woessmann, L. (2014). The Economic Case for Education. EENEE Analytical Report No. 20, Prepared for the European Commission. European Expert Network on Economics of Education (EENEE).
Wolf, A., Dominguez-Reig, G, & Sellen, P. (2016). Remaking Tertiary Education: can we create a system that is fair and fit for purpose? Education Policy Institute, King’s College London, London.
Yamaguchi, A. M. (2013 July 26). Early Childhood Education in Brazil. Child Research Net. Retrieved from: http://www.childresearch.net/projects/ecec/2013_10.html

July 2017 Citi GPS: Global Perspectives & Solutions
© 2017 Citigroup
157
Yousafzai, Malala. ‘Death Did Not Want to Kill Me’. Interview with Diane Sawyer. ABC News. 7 October 2013. http://abcnews.go.com/WNT/video/diane-sawyer-sits-inspirational-malala-yousafzai-20499735
Zion Market Research (2017 January 17). Global Learning Management System Market will reach USD 19.05 Billion by 2022: Zion Market Research. Zion Market Research. Retrieved from: https://globenewswire.com/news-release/2017/01/17/906276/0/en/Global-Learning-Management-System-Market-will-reach-USD-19-05-Billion-by-2022-Zion-Market-Research.html

Citi Global Perspectives & Solutions (Citi GPS) is designed to help our clients navigate the global economy’s most demanding challenges, identify future themes and trends, and help our clients profit in a fast-changing and interconnected world. Citi GPS accesses the best elements of our global conversation and harvests the thought leadership of a wide range of senior professionals across the firm. All Citi GPS reports are available on our website www.citi.com/citigps
Solutions for a Global Water Crisis The End of ‘Free and Cheap’ Water April 2017
ePrivacy & Data Protection Who Watches the Watchers? – How Regulation Could Alter the Path of Innovation March 2017
Digital Disruption - Revisited What FinTech VC Investments Tells Us About a Changing Industry January 2017
2017 Investment Themes A Wind of Change January 2017
2017 Corporate Finance Priorities January 2017
Car of the Future v3.0 Mobility 2030 November 2016
Infrastructure for Growth The dawn of a new multi-trillion dollar asset class October 2016
Virtual & Augmented Reality Are you sure it isn’t real? October 2016
Re-Birth of Telecoms into a New Digital Industry Time to Dump the Dumb Pipe October 2016
Disruptive Innovations IV Ten More Things to Stop and Think About July 2016
Digital Disruption How FinTech is Forcing Banking to a Tipping Point March 2016
The Coming Pensions Crisis Recommendations for Keeping the Global Pensions System Afloat March 2016
Technology at Work v2.0 The Future is Not What It Used To be January 2016
Global Political Risk The New Convergence between Geopolitical and Vox Populi Risks January 2016
Investment Themes in 2016 New Normal or No Normal January 2016
2016 Corporate Finance Priorities January 2016

Energy 2030 Financing A Greener Future November 2015
The Global Art Market Perspectives on Current Drivers & Future trends November 2015
The Curtain Falls How Silicon Valley is Challenging Hollywood October 2015
Energy Darwinism II Why a Low Carbon Future Doesn’t Have to Cost the Earth August 2015
Disruptive Innovations III Ten More Things to Stop and Think About July 2015
Car of the Future v2.0 Mobility Transformation: Full Steam Ahead May 2015
Beyond China The Future of the Global Natural Resources Economy March 2015
Technology at Work The Future of Innovation and Employment February 2015
Investment Highlights in 2015 Dealing with Divergence January 2015
Corporate Finance Priorities 2015 Driving Corporate Growth in Divergent Markets January 2015
The Re-Birth of Telecom Monopoly Is the Industry Broken & Heading Back to its Monopolistic Roots November 2014
Energy 2020: Out of America The Rapid Rise of the US as a Global Energy Superpower November 2014
Asset Allocation for a New Era Diversification, Not Rotation, is the New Watchword October 2014
Future Opportunities, Future Shocks Key Trends Shaping the Global Economy and Society October 2014
Taking It To The Streets The New Vox Populi Risk May 2014
The Car of the Future Transforming Mobility As We Know It May 2014
Disruptive Innovations II Ten More Things to Stop and Think About May 2014
Upwardly Mobile III Mobility Unchained: From Mobile Commerce to IoT January 2014

July 2017 Citi GPS: Global Perspectives & Solutions
© 2017 Citigroup
161
IMPORTANT DISCLOSURES This communication has been prepared by Citigroup Global Markets Inc. and is distributed by or through its locally authorised affiliates (collectively, the "Firm") [E6GYB6412478]. This communication is not intended to constitute "research" as that term is defined by applicable regulations. Unless otherwise indicated, any reference to a research report or research recommendation is not intended to represent the whole report and is not in itself considered a recommendation or research report. The views expressed by each author herein are his/ her personal views and do not necessarily reflect the views of his/ her employer or any affiliated entity or the other authors, may differ from the views of other personnel at such entities, and may change without notice. You should assume the following: The Firm may be the issuer of, or may trade as principal in, the financial instruments referred to in this communication or other related financial instruments. The author of this communication may have discussed the information contained herein with others within the Firm and the author and such other Firm personnel may have already acted on the basis of this information (including by trading for the Firm's proprietary accounts or communicating the information contained herein to other customers of the Firm). The Firm performs or seeks to perform investment banking and other services for the issuer of any such financial instruments. The Firm, the Firm's personnel (including those with whom the author may have consulted in the preparation of this communication), and other customers of the Firm may be long or short the financial instruments referred to herein, may have acquired such positions at prices and market conditions that are no longer available, and may have interests different or adverse to your interests. This communication is provided for information and discussion purposes only. It does not constitute an offer or solicitation to purchase or sell any financial instruments. The information contained in this communication is based on generally available information and, although obtained from sources believed by the Firm to be reliable, its accuracy and completeness is not guaranteed. Certain personnel or business areas of the Firm may have access to or have acquired material non-public information that may have an impact (positive or negative) on the information contained herein, but that is not available to or known by the author of this communication. The Firm shall have no liability to the user or to third parties, for the quality, accuracy, timeliness, continued availability or completeness of the data nor for any special, direct, indirect, incidental or consequential loss or damage which may be sustained because of the use of the information in this communication or otherwise arising in connection with this communication, provided that this exclusion of liability shall not exclude or limit any liability under any law or regulation applicable to the Firm that may not be excluded or restricted. The provision of information is not based on your individual circumstances and should not be relied upon as an assessment of suitability for you of a particular product or transaction. Even if we possess information as to your objectives in relation to any transaction, series of transactions or trading strategy, this will not be deemed sufficient for any assessment of suitability for you of any transaction, series of transactions or trading strategy. The Firm is not acting as your advisor, fiduciary or agent and is not managing your account. The information herein does not constitute investment advice and the Firm makes no recommendation as to the suitability of any of the products or transactions mentioned. Any trading or investment decisions you take are in reliance on your own analysis and judgment and/or that of your advisors and not in reliance on us. Therefore, prior to entering into any transaction, you should determine, without reliance on the Firm, the economic risks or merits, as well as the legal, tax and accounting characteristics and consequences of the transaction and that you are able to assume these risks. Financial instruments denominated in a foreign currency are subject to exchange rate fluctuations, which may have an adverse effect on the price or value of an investment in such products. Investments in financial instruments carry significant risk, including the possible loss of the principal amount invested. Investors should obtain advice from their own tax, financial, legal and other advisors, and only make investment decisions on the basis of the investor's own objectives, experience and resources. This communication is not intended to forecast or predict future events. Past performance is not a guarantee or indication of future results. Any prices provided herein (other than those that are identified as being historical) are indicative only and do not represent firm quotes as to either price or size. You should contact your local representative directly if you are interested in buying or selling any financial instrument, or pursuing any trading strategy, mentioned herein. No liability is accepted by the Firm for any loss (whether direct, indirect or consequential) that may arise from any use of the information contained herein or derived herefrom. Although the Firm is affiliated with Citibank, N.A. (together with its subsidiaries and branches worldwide, "Citibank"), you should be aware that none of the other financial instruments mentioned in this communication (unless expressly stated otherwise) are (i) insured by the Federal Deposit Insurance Corporation or any other governmental authority, or (ii) deposits or other obligations of, or guaranteed by, Citibank or any other insured depository institution. This communication contains data compilations, writings and information that are proprietary to the Firm and protected under copyright and other intellectual property laws, and may not be redistributed or otherwise transmitted by you to any other person for any purpose. IRS Circular 230 Disclosure: Citi and its employees are not in the business of providing, and do not provide, tax or legal advice to any taxpayer outside of Citi. Any statements in this Communication to tax matters were not intended or written to be used, and cannot be used or relied upon, by any taxpayer for the purpose of avoiding tax penalties. Any such taxpayer should seek advice based on the taxpayer’s particular circumstances from an independent tax advisor. © 2017 Citigroup Global Markets Inc. Member SIPC. All rights reserved. Citi and Citi and Arc Design are trademarks and service marks of Citigroup Inc. or its affiliates and are

Citi GPS: Global Perspectives & Solutions July 2017
© 2017 Citigroup
162

July 2017 Citi GPS: Global Perspectives & Solutions
© 2017 Citigroup
163

Citi GPS: Global Perspectives & Solutions July 2017
© 2017 Citigroup
164

July 2017 Citi GPS: Global Perspectives & Solutions
© 2017 Citigroup
165
NOW / NEXT Key Insights regarding the future of Education
EDUCATION Education has had and is still having a very positive impact on society, both
economically and in terms of social well-being. / However, supply/demand imbalances as well as disruption from automation represent a significant challenge for governments and society more broadly and the uneven distribution of education across market and between people of different socioeconomic backgrounds, ethnicities, and genders needs urgent attention.
SOCIAL CONSTRUCTS The rise of technology and automation means that large portions of the population
do not have the adequate skills to prosper in the digital age. / As individuals, we will have to change our attitude to education ------ to think of it less as a stage or a destination and more as a process of journey ------ and think about it as a lifelong process.
TECHNOLOGY Education has experienced limited disruption from technology and to a large extent the teaching model, wherein the instructor imparts knowledge by lecturing to an audience, has essentially been unchanged for generations. / With only 2% of the $5 trillion global education market digitized, embracing the role of technology will be a key factor in driving productivity improvements in the medium-term.

Citi GPS: Global Perspectives & Solutions © 2017 Citigroup www.citi.com/citigps