education capital handbook - jdintl.econ.queensu.ca
TRANSCRIPT

CAPITAL PROJECT SELECTION
HANDBOOK FOR
DEPARTMENT OF EDUCATION
Prepared for:
Department of Education Limpopo Provincial Government
Polokwane South Africa
Prepared by:
A. Klevchuk and G. P. Jenkins Cambridge Resources International
Cambridge, MA USA
September 2004

1
CONTENTS Chapter 1. Introduction..............................................................................................4
1.1 Overview of Handbook....................................................................5 Chapter 2. Project Selection for Construction of New Class-Blocks ......................7
2.1 Status Quo ........................................................................................7 2.1.1 Background ...................................................................7 2.1.2 Challenges ...................................................................8
2.2 Cost-Utility Approach in Capital Project Selection.......................10 2.2.1 Priority Index ...............................................................10 2.2.2 Definition of Index.......................................................11 2.2.3 Estimation of Priority Index.........................................13
2.3 Priority Index in Allocation of Budget for New Buildings............17 2.3.1 Role of Management Information System ...................17 2.3.2 Example of Priority Index Estimation..........................20 2.3.3 Budget Allocation ........................................................22
Chapter 3. Rehabilitation of Existing Class-Blocks...............................................27
3.1 Current Approach...........................................................................27 3.2 Priority Index in Rehabilitation of Existing Buildings ..................28
3.2.1 Nature of Decision-Making Problem...........................28 3.2.2 Building Condition.......................................................28 3.2.3 Relative Rehabilitation Cost ........................................30 3.2.4 Discounted School Priority Index ................................32 3.2.5 Rehabilitation Priority Index and Ranking ..................34
3.3 Budget Allocation using Rehabilitation Priority Index..................36 Chapter 4. Conclusion ..............................................................................................38 Annex A. Analytical Framework..............................................................................40
A.1 The Approach.................................................................................40 A.2 Cost-Effectiveness Analysis vs. Cost-Utility Analysis..................40
A.2.1 Estimation of Effectiveness-to-Cost Ratio...................41 Effectiveness-to-Cost Ratio .........................................41 Costs Assessment.........................................................42 Discounting ..................................................................42

2
A.3 Cost-Utility Analysis......................................................................43 A.3.1 CUA in Improvement of School Learning...................44 A.3.2 Alternatives with Subjective Outcomes.......................45
A.4 Applicability of the Method...........................................................46 Annex B. Application of Priority Index to Prioritarization of Selected
Schools in Limpopo Province...............................................................48 B.1 Introduction....................................................................................48 B.2 Parameters and Data.......................................................................48
B.2.1 Available Information ..................................................48 B.2.2 Sample Characteristics .................................................51 B.2.3 Parameters .................................................................51 B.2.4 Priorities and Weights ..................................................53
B.3 Estimation of School Priority Index and Ranking .........................55 B.3.1 Infrastructure Adequacy...............................................55 B.3.2 Augmenting Factors .....................................................58 B.3.3 Augmenting Score and Adjustment factor...................61 B.3.4 School Priority Index and Ranking..............................62
B.4 Allocation of Budget for New Class-rooms...................................64 B.4.1 The Mechanism............................................................64 B.4.2 Distribution of Funds ...................................................70
B.5 Rehabilitation Priority Index..........................................................73 B.5.1 Data Requirements .......................................................73 B.5.2 Relative Rehabilitation Costs.......................................75 B.5.3 Impact of Loss of a Damaged Building on
School Priority .................................................................76 B.5.4 Rehabilitation Priority Index........................................79
B.6 Allocation of Funds for Rehabilitation ..........................................81 B.7 Concluding Remarks......................................................................82

3
LIST OF ABBREVIATIONS
CRI - Cambridge Resources International, Inc.
DFED - Department of Finance and Economic Development
DTI - Department of Trade and Industry
EOCK - Economic opportunity cost of capital
EMIS - Education management information system
GIS - Geographic Information System
MEC - Member of the Executive Council
MTEF - Medium term expenditure framework
NPV - Net present value
PI - Priority index
PV - Present value
RDP - Reconstruction and Development Program

4
Chapter 1. Introduction
The rising pace of economic and social development in South Africa over the past
decade has facilitated the expansion of the basic social programs, especially in health
and education. At the same time, the national and provincial authorities have worked to
eradicate illiteracy and to step up the scope and standard of education in public schools.
The provision of the basic infrastructure facilities such as roads, water, electricity, and
basic social programs in health and education, are the key to the development of the
region. The education sector has been given a high priority by the National and
Provincial authorities. As the department has been allocated substantial resources to
eradicate infrastructure backlogs in the province, capital appraisal of the potential
projects carried out by the department is now the focus of increasing attention. The
capital project selection phase of an infrastructure management and delivery system is
nothing else but an assessment of capital projects to ensure maximum economic output
from budget allocation.
This handbook is a part of the continuous effort by the Limpopo Provincial
Government to improve the quality of public infrastructure delivery by its departments.
The focus of this handbook is on the process of capital project selection by the
Department of Education (DOE). The existing project selection process is examined
and a proposal is made for enhancement of its efficiency. The handbook should help
the Department in prioritarization of areas for the construction of new and for the
rehabilitation of the existing schools. The prioritarization is based on a ranking system
being developed as an extension of cost-effectiveness and cost-utility analysis,
described in Annex A to the handbook.
The appraisal methodology employed in this handbook is based on the comprehensive
appraisal manual developed by Cambridge Resources International (CRI) for the
Limpopo Provincial Government.1
1 “Integrated Investment Appraisal: Concepts and Practice”, Prepared for Department of Financial and
Economic Development, Limpopo Provincial Government, South Africa, Cambridge Resources International, Cambridge, USA, March 2004.

5
The methodology outlined in the manual and adopted to South African realities
represents a state-of-the-art tool for conducting an integrated financial, economic,
stakeholder and risk analysis of new projects, as well as maintenance, and expansion
decisions.
1.1 Overview of Handbook The mission of Limpopo Department of Education is to open the doors of learning to
all citizens of the Province. A number of strategic goals have been set for the
Department in terms of both quantitative and qualitative achievement of it mission. The
main focus of the Department is on the primary and secondary systems, which
comprise the majority of provincial learners. Before the 90’s, the previous political
leadership had largely neglected rural educational needs as the Department is now
facing the challenge of delivering the basic level of educational standards to the
communities in six provincial districts. The objective of this handbook is to assist the
decision-makers at the DOE in the selection of capital projects for construction and for
rehabilitation. An integration of project appraisal methodology into the standardized
management system is viewed as a natural extension of the Government’s capacity for
infrastructure delivery.
The analysis of project selection at the Department of Education will cover two main
processes: selection of schools for construction of new classrooms; and allocation of
funds between the construction of new class-blocks and rehabilitation of the existing
facilities. Thus, Chapter 2 is focused on the development of a priority index for
prioritarization of schools in the capital project selection for new class-block
construction. The existing decision-making process is analyzed and suggestions are
derived in terms enhancement of its efficiency.
Chapter 3 looks at the allocation of funds between the constructions of new school
buildings and the rehabilitation of the existing facilities. Since all physical structures
deteriorates over time, a formal appraisal procedure must be in place to measure if it is
worthwhile to invest into the rehabilitation of the particular buildings during this budget
6
period or to channel the available funds into the construction of new class-blocks
elsewhere.
The conclusions and comments will be presented in Chapter 4. Following that chapter,
Annex A lays out the analytical framework of cost-effectiveness and cost-utility
analysis employed to derive the priority index. Annex B presents an illustrative case-
study on budget allocation of funds for construction of new class-blocks for a sample of
selected provincial schools.

7
Chapter 2. Project Selection for Construction of
New Class-Blocks
2.1 Status Quo
2.1.1 Background Over past years, the achievements in education in Limpopo Province have been very
encouraging: both the coverage and quality of education at all levels have been
improved. There is still a lot of room for further progress. One of the major obstacles is
the lack of adequate infrastructure facilities such as schoolrooms, especially in rural
communities. The government is committed to eradication of this problem through
continuous identification of classroom backlogs and providing funding for these
schools. A certain amount of budget is allocated to construction of new schools in the
province.
The process of identification is facilitated through an annual school survey, as
mandated by the National Department of Education, and also through direct appeals by
schools to the six regional education boards in Limpopo. Thus, if a community school
has 2 standard class-blocks, each with 4 classrooms that are designed for 40 seats, then
the capacity of the school is 320 pupils. Assume that the same school has a roster of
600 pupils and the classes are becoming more and more crowded from year to year.
Right now, the seat shortage is 280 for this school and, expressed in terms of the
number of standard classrooms, this is a backlog of 7 rooms, or 1.75 class-blocks.
At present, the calculation of backlogs is being done from the Education Management
Information System (EMIS) that are conducted annually. Each school reports this
information to the regional education board, which, in turn, summarizes all the reports
and submits to the Department of Education. Having collected all reports from the six
regional boards, the Capital Selection Committee ranks all the backlogs identified, and
then allocates the available budget funds to individual schools. The prioritization of the
school building projects is being done based on the EMIS data collected and on the
reports from the circuit and district officers. The selected construction projects for the
8
schools marked for the current year are then consolidated to produce the annual
business plans.2
The construction of class-blocks has been standardized by the national government
regulations, according to strictly specified parameters of building materials and
construction process. In 2002, the cost of construction of one standard class-block was
set at R 420,000. The Department places a request to the Department of Public Works
to carry out the construction of new class-blocks. The selection of constructor,
management and quality control is all facilitated by the Department of Public Works.
The Department of Public Works has its own construction teams and if they are
available, the construction is done by internal teams. But if not, then the Department of
Public Works will put the class-blocks on tender for a private contractor.
Given that the funds available are unlikely to meet all the needs for new school-block
construction, in the absence of any formal project evaluation of the economic and social
impacts, there has to be an element of subjectivity in the present process selection.
2.1.2 Challenges The Limpopo Department of Education is characterized by shortages of class-rooms
and related infrastructure. At present, the class-room backlog stands at around 13,000.
Many schools, especially in rural areas, lack the basic utilities such as electricity,
telecommunications, water and sanitation. This situation prevails, despite the great
effort undertaken since 1997. Some 7,000 class-rooms were built during the period
between 1995 and 2001, and an additional 800 class-rooms were commissioned in year
2002.3
At the current rates, it will take about 10-15 years to overcome the backlogs. To
remedy the situation, the Department has increased the infrastructure spending by more
than 100% over 2002 and 2003. Although this assists in providing a greater number of
class-rooms, the fact that not enough funds are available for preventive maintenance is
still of major concern. Projections made by the Department of Public Works indicate
2 “Strategic Plan for 2003 – 2006”, Department of Education, Limpopo Provincial Government,
Polokwane, South Africa (2002), p. 64.

9
that the Department will require over one billion Rand for maintenance only. For
comparison, this figure is 4 times what was the total amount spent on infrastructure in
2003-2004.4
In the past, the lack of a reliable management information system has meant that the
management of immovable assets in the Department has been hampered. The fact that
the buildings of the same school campus were built at different times by different
agencies, i.e. the government, community and donors, makes the evaluation and
maintenance planning more complicated.5 At present, the survey data system does not
seem to provide the decision-makers with consistent data about actual condition of
school infrastructure. As a result, schools have been built in locations where demand
was overstated.6
The Department has realized the existence of gaps in the infrastructure delivery process
as well as in the maintenance planning, and an initiative has been launched to evaluate
different approaches to facilities management. A dialogue was successfully established
with the Government of United Kingdom, which has produced a 5-year program
funded by the UK Government. Cambridge Education Consultants of Cambridge, UK,
has been contracted to lead this program. The scope of this program is to analyze the
existing management practices at the provincial and district levels, to propose a new
management information system, and to provide further technical assistance to its
South African counterparts in Limpopo.
An integral part of the new management information system will be a database on all
4,900 provincial schools. This database will provide the decision-makers with regularly
updated information on many educational variables, as well as on the physical
condition of the school facilities. A preliminary date for implementation of such a
system is mid 2005.
3 Ibid., p. 64. 4 Ibid., p. 64. 5 Ibid., p. 64. 6 Ibid., p. 65.

10
2.2 Cost-Utility Approach in Capital Project Selection 2.2.1 Priority Index A weighted cost-effectiveness approach, also called cost-utility analysis, can be
employed for the capital project selection at the Department of Education. The task is
to maximize the overall effectiveness of public expenditure on school infrastructure
within a given amount of budget. The efficiency is to be measured a weighted “priority
index” (PI) which can be setup to include all the important factors affecting the project
selection.
Such an index will take account of the physical condition of the assets of a school, the
need for additional class-rooms, the community factors, the development priorities, and
other factors. For prioritorizing the needs for new school-blocks, the number of
backlogs and the learners-to-classroom ratio are the two indicators chosen to reflect the
infrastructure adequacy for a particular school area. By weighting these two variables
0.7 and 0.3, respectively, a composite index is compiled. A number of additional
factors are incorporated to augment this composite index. This efficiency criterion is a
simple and plausible measure of improvement.
A cost-utility evaluation that can be built using the information from the newly
designed EMIS for the Department will provide an effective and low-cost solution for
the problem. The following advantages of employment of a priority index for the
capital selection at the Department of Education are expected:
1. Simplicity. The index does not require more additional information than the
standard management information system would possess on terms of data on
schools and their support infrastructure.
2. Transparency. Since the composition of factors making up the PI and the
assignment of the weights to each factor are both to be formally defined by
the Department of Education, this index is a transparent way of conducting
the capital project selection.
3. Accountability. This system will also comply with the requirements of the
prudent capital project evaluation as stipulated by the new Infrastructure
Delivery Toolkit, currently being rolled out by the National Treasury.
11
4. Low Administrative Cost. Once the database of provincial schools is
compiled, the management information system can be programmed to
compute the priority index for each school as a routine operation. The
decision-makers will only have to monitor the content of the factor
comprising the index and their relative weights. A periodic adjustment of
these two aspects will be needed.
2.2.2 Definition of Index The index itself can include as many factors as the decision-makers need to cover in the
allocation of funds across provincial schools in the six districts. The discussion here
will focus on the major factors identified during the initial investigation at the
Department. It is more convenient to group similar factors into groups that make it
easier to understand and to compute an index for a particular school.
Infrastructure Adequacy. This is the most crucial set of factors indicating the need for
additional school infrastructure. There are two aspects of infrastructure adequacy:
class-block backlog and the learner-to-classroom ratio. Both indicators are currently
computed for all schools applying for additional buildings.
(A) Estimated Class-block Backlog. The class-room backlog is estimated as a number
of additional buildings, measured by a standard 4-class block, required at a
particular school in order to maintain the maximum acceptable class size. For
primary schools, the target class size is 40 learners, and for secondary the size is
set at 35 learners per class-room. Thus, if a primary school has 600 learners and
only 8 class-rooms are currently available, the backlog is equal to 7 class-rooms
(= [600 learners – (8 class-rooms * 40 learners)] / 40 learners-per-classroom), or
1.8 class-blocks.
(B) Learner-to-Classroom / Target Class Size Ratio. The overcrowding of classes is
measured by the excess of actual class attendance to the maximum target class
size, i.e. by the learner-to-classroom / target class size ratio. This ratio is
nothing else than the average learner-to-classroom indicator at a particular
12
school, divide by the target size of class audience. For instance, the same
primary school with 600 learners and 8 class-rooms currently available, should
have a learner-to-classroom of 75 learners per class-room (= 600 learners / 8
class-rooms). Then, the overcrowding is 1.9 times above the target size of a
primary school class (= 75 learners per class-room / 40 learners per class-room).
Augmenting Factors. In addition to looking after the infrastructure adequacy, the
decision-making process currently considers a host of factors that aid project selection.
These factors could be grouped into three categories: type of school, presence of
support facilities, location of the school, and development priority factors.
(1) Type of School. The primary schools have been given more priority over secondary
and other types of schools. Thus, the index should give somewhat more
attention to primary schools as compared to other schools.
(2) Support Facilities. The availability of the basic support facilities such as toilets,
water supply, fences, electricity, library, and laboratories has played a certain
role in the allocation of funds for construction of new buildings among the
schools in need. It has been stated that schools without any of such basic
facilities should be given more priority, keeping all other factors constant.
(3) School Location. The vast majority of the provincial schools are located in the rural
areas where little private contributions are made to support their budgets, as
compared to urban schools. As a result, the prioritarization of schools for
additional infrastructure funding must reflect this historical disproportion.
(4) Development Priority Factors. The population of certain geographical areas may
decline over time due to shifting patterns of economic activity or migration. For
instance, the duration of mining at a particular site is determined by the
availability of natural resources and once the stock is depleted and if no
alternative economic activity exists at the site, it is likely that some migration
will take place in the future, thus reducing the burden on the local school(s).
Another example is the widespread transformation of agriculture farms in the
province into game reserves catering for tourists. Game farming requires
substantially less labor input and as a result some population outflow could be
reasonably expected from such areas. The development priority factors must
account for such expectations by reducing the priority of the schools affected by

13
population outflows. The development priority could potentially incorporate all
other factors that may contribute to the demand for schooling in a particular
area.
2.2.3 Estimation of Priority Index The list of the factors outlined above is by no way an exhaustive record of all important
considerations. The index could include other relevant factors if needed. Once all
factors that should be included in the index are identified and are prioritarized relative
to each other, then a composite index can be developed. The prioritarization can be
facilitated by the use of weights to balance the different factors comprising the index.
Relative Weights of Infrastructure Adequacy Factors
The most important indicator of the need for additional capital funding is the
infrastructure adequacy of schools as measured by the number of class-block backlogs
and the excess of the learner-to-classroom over the target class size. If both of these two
indicators are assumed to add up to unity, then the question is, what is more important:
to have enough class-blocks to accommodate learners or to have smaller sizes of the
audiences? At present time, the existence of backlogs may suggest that the first aspect
of the infrastructure adequacy is somewhat more important than the second. Then, a
tentative distribution of weights among the two could be such that the class-block
backlogs have a weight of 0.7 and the excess of the learner-to-classroom over the target
class size has a weight of 0.3.
Suppose there are two primary school-areas A and B, with a respective population of
600 and 400 learners. If area A currently has 8 class-rooms and area B has 3 class-
rooms, then their learner-to-classroom ratios are 75 and 133 learners per class-room.
The estimated class-block backlog is, therefore, 1.8 standard blocks for area A and also
1.8 blocks for area B.7 In other words, if schools A and B both have the same number
of additional buildings required, but area A has a higher learner-to-classroom ratio, then
7 For school A, the backlog is estimated as 7 class-rooms (= [600 learners – (8 class-rooms * 40
learners)] / 40 learners-per-classroom), or 1.8 class-blocks. For school B, the same procedure yields 7 class-rooms (= [400 learners – (3 class-rooms * 40 learners)] / 40 learners-per-classroom), or 1.8 class-blocks.

14
this area should be given more priority. The excess ratio of learner-to-classroom over
the target class size is 1.9 for area A and 3.3 for area B.8
A composite index can be then estimated from these two indicators and relative weights
assigned to them. The score of school-area A would be equal to 1.83 (= 1.8 backlogs *
0.7 + 1.9 excess ratio * 0.3). Similarly, the score of school-area B would be estimated
as 2.25 (= 1.8 backlogs * 0.7 + 3.3 excess ratio * 0.3). As a result, the priority of
school-area B is higher than the priority of school-area A, based on the two
infrastructure adequacy factors. Such infrastructure adequacy composite score can be
computed for all provincial schools once the database is compiled. A ranking of all
schools based on purely infrastructure adequacy would then list the school-areas from
the highest to the lowest need for additional infrastructure.
Relative Weights of Augmenting Factors
In addition to purely infrastructure adequacy factors, a number of additional aspects
have been traditionally taken into consideration. As mentioned above, these factors
could be grouped into the following categories: type of school, presence of support
facilities, location of the school, and development priority factors. The idea is to
construct an augmenting adjustment index that would range from unity to additional
1.75, expanding the score of the infrastructure adequacy computed earlier.
In other words, all other augmenting factors could introduce an upward shift in the
index up to a limit of 0.75 taking the infrastructure adequacy score as the base. Because
all schools have different combinations of features, the resulting augmenting
adjustment will give more priority to rural primary schools in dire need of new
facilities.
The allocation of the augmenting points among the four identified groups of factors
could be done a number of ways. The one presented here is a tentative prioritarization
of these factors, based on the initial investigation. The actual weights could be further
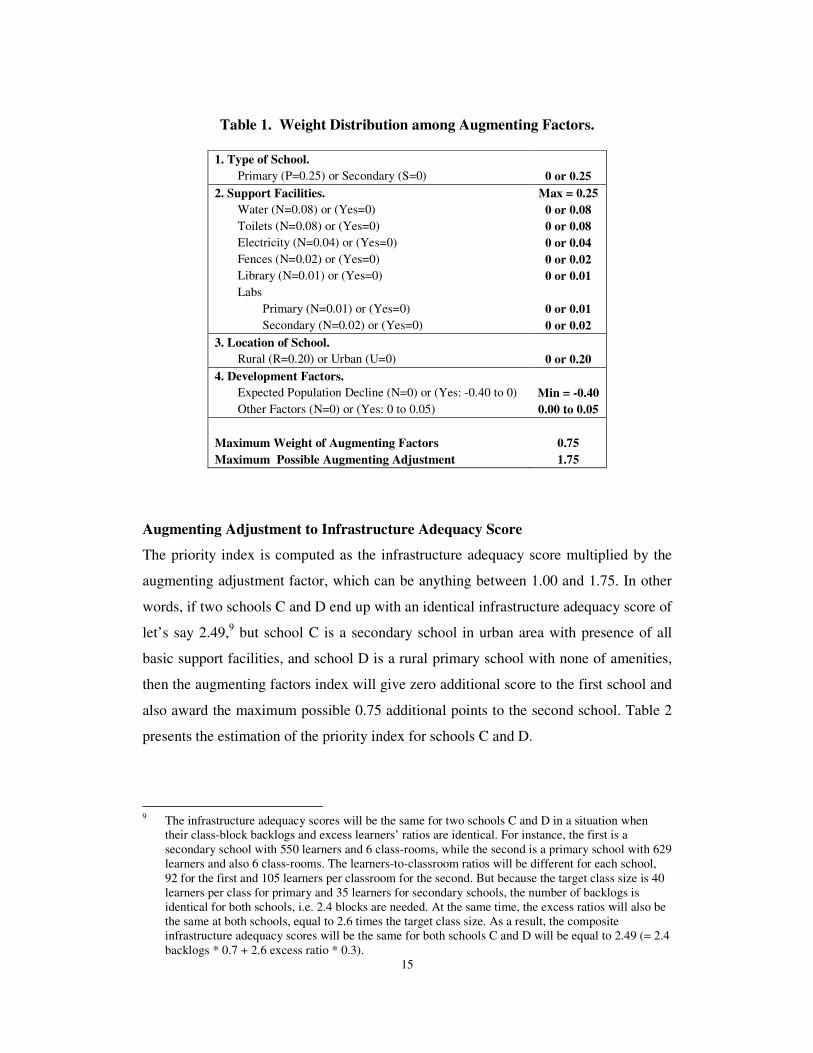
re-defined as needed. Table 1 presents a summary of the distribution of points among
the four identified groups of factors.
8 For school A, the excess of class attendance over the norm is 1.9 times (= 75 learners-per-classroom
/ 40 learners-per-classroom), while for school B this is 3.3 times (= 133 learners-per-classroom / 40 learners-per-classroom).
15
Table 1. Weight Distribution among Augmenting Factors.
1. Type of School. Primary (P=0.25) or Secondary (S=0) 0 or 0.25
2. Support Facilities. Max = 0.25 Water (N=0.08) or (Yes=0) 0 or 0.08 Toilets (N=0.08) or (Yes=0) 0 or 0.08 Electricity (N=0.04) or (Yes=0) 0 or 0.04 Fences (N=0.02) or (Yes=0) 0 or 0.02 Library (N=0.01) or (Yes=0) 0 or 0.01 Labs
Primary (N=0.01) or (Yes=0) 0 or 0.01 Secondary (N=0.02) or (Yes=0) 0 or 0.02
3. Location of School. Rural (R=0.20) or Urban (U=0) 0 or 0.20
4. Development Factors. Expected Population Decline (N=0) or (Yes: -0.40 to 0) Min = -0.40 Other Factors (N=0) or (Yes: 0 to 0.05) 0.00 to 0.05
Maximum Weight of Augmenting Factors 0.75 Maximum Possible Augmenting Adjustment 1.75
Augmenting Adjustment to Infrastructure Adequacy Score
The priority index is computed as the infrastructure adequacy score multiplied by the
augmenting adjustment factor, which can be anything between 1.00 and 1.75. In other
words, if two schools C and D end up with an identical infrastructure adequacy score of
let’s say 2.49,9 but school C is a secondary school in urban area with presence of all
basic support facilities, and school D is a rural primary school with none of amenities,
then the augmenting factors index will give zero additional score to the first school and
also award the maximum possible 0.75 additional points to the second school. Table 2
presents the estimation of the priority index for schools C and D.
9 The infrastructure adequacy scores will be the same for two schools C and D in a situation when
their class-block backlogs and excess learners’ ratios are identical. For instance, the first is a secondary school with 550 learners and 6 class-rooms, while the second is a primary school with 629 learners and also 6 class-rooms. The learners-to-classroom ratios will be different for each school, 92 for the first and 105 learners per classroom for the second. But because the target class size is 40 learners per class for primary and 35 learners for secondary schools, the number of backlogs is identical for both schools, i.e. 2.4 blocks are needed. At the same time, the excess ratios will also be the same at both schools, equal to 2.6 times the target class size. As a result, the composite infrastructure adequacy scores will be the same for both schools C and D will be equal to 2.49 (= 2.4 backlogs * 0.7 + 2.6 excess ratio * 0.3).

16
Table 2. Estimation of Priority Index.
INFRASTRUCTURE ADEQUACY Weight School C School D School C School D
Total Number of Learners 550 629 Available Classrooms 6 6 Learner-to-Classroom Ratio 92 105
Class-blocks Backlog 0.70 2.4 2.4 1.70 1.70 Learner-to-Classroom Ratio/Target Size 0.30 2.6 2.6 0.79 0.79 Total Weight of Section 1.00 Total Section Score: 2.49 2.49
AUGMENTING FACTORS 1. Type of School. 0.25
Primary (P) or Secondary (S) S P 0.00 0.25 2. Support Facilities. Max = 0.25
Water 0.08 Y N 0.00 0.08 Toilets 0.08 Y N 0.00 0.08 Electricity 0.04 Y N 0.00 0.04 Fences 0.02 Y N 0.00 0.02 Library 0.01 Y N 0.00 0.01 Labs Y N 0.00 0.01
Primary 0.01 Secondary 0.02
Total Section Score: 0.00 0.24 3. Location of School. 0.20
Rural (R) or Urban (U) U R 0.00 0.20 4. Development Factors
Expected Population Decline -0.40 N N 0.00 0.00 Other Factors 0.05 N N 0.00 0.00
Total Section Score: 0.00 0.00 Maximum Weight of Augmenting Factors 0.75 Total Augmenting Factors: 0.00 0.69 Maximum Possible Augmenting 1.75 Augmenting Adjustment: 1.00 1.69
PRIORITY INDEX AND RANKING Priority Index: 2.49 4.20 Ranking: 2 1
The priority index for secondary urban school C will be still equal to it infrastructure
adequacy score of 2.49 (= 2.49 infrastructure adequacy score * [1 + zero additional
points]). Where zero signifies that this school does not earn any additional priority
points because it is a secondary school in an urban area with all the basic support
facilities such as toilets, water supply, fences, electricity, library, and laboratories.
However, the index for school D will be adjusted upward up by additional 0.69 points,
so that its priority index becomes 4.20 (= 2.49 infrastructure adequacy score * [1 + 0.69
additional points]).

17
2.3 Priority Index in Allocation of Budget for New Buildings 2.3.1 Role of Management Information System The whole procedure of calculation of priority index and ranking of the schools
according to multiple criteria can be well transferred to the management information
system (MIS). The MIS will have a common database with reliable statistics on all
provincial schools and the computation of the priority index would be a routine task of
the system. While the database can potentially store multiple types of data on every
school, only several essential characteristics will be needed for estimation of the
priority index. An example of priority index estimation, school ranking and budget
allocation for 8 schools can be used to illustrate the process that will be built-in to the
new MIS.
General Parameters. These should include the target size for primary and secondary
class, and it is currently 40 and 35 learners per classroom, respectively. The cost of
construction of a standard 4-classroom block is R 420,000. Another parameter that
needs to be supplied is the total amount of capital budget available for building new
class-blocks. Once the total budget and cost of the standard block are given, the system
will be able to calculate how many additional blocks can be erected with the available
funding. For instance, if the capital budget is set at R 2.1 million, this implies that only
five new class-blocks can be financed during this budget period. Thus, only 20
additional class-rooms will be added. Note that the standard school-blocks have four
class-rooms and the blocks are not divisible into separate class-rooms.
School Database. Suppose that the entire database consists of 8 provincial schools. The
following data are kept for each school: number of learners, available classrooms, type
of school (primary, secondary or other), location of school, availability of support
facilities such as toilets, water, fences, electricity, library, laboratories and other. Table
3 shows the details for each school.

18
Table 3. Schools Database.
School: S.1 S.2 S.3 S.4 S.5 S.6 S.7 S.8 INFRASTRUCTURE
Total Number of Learners 280 1,000 550 1,400 800 450 600 950 Available Classrooms 3 17 6 21 11 6 8 9 Learner-to-Classroom Ratio 93 59 92 67 73 75 75 106
A. Class-blocks Backlog 1.0 2.0 2.4 4.8 2.3 1.7 1.8 3.7 B. Learner-to-Classroom Ratio/Target Size 2.3 1.5 2.6 1.9 1.8 2.1 1.9 2.6
1. Type of School. Primary (P) or Secondary (S) P P S S P S P P
2. Support Facilities. Water N N N Y N Y N Y Toilets N Y N Y N N N N Electricity N Y N Y N N Y N Fences N Y N Y Y N N N Library N N N Y N Y N N Labs N Y N N N N N N
3. Location of School. Rural (R) or Urban (U) R U R R U R U R
4. Development Factors Expected Population Decline N N N N N Y N N Other Factors N N N N N N N N
The learners-to-classroom ratio is found as the total number of learners divided by the
number of class-rooms available. The backlog, measured in terms of standardized 4-
classrom blocks, is then found as described in Section 2.2.2. The excess ratio, defined
as the average number of learners per class-room divided by the target class size, can
also be estimated. If we assume that the weights assigned to the different decision
factors are the same as in Table 1, then a priority index for each school can be
computed. Table 4 presents the procedure and resulting index.

19
Table 4. Estimation of Priority Index and Ranking of Schools.
INFRASTRUCTURE ADEQUACY Weight S.1 S.2 S.3 S.4 S.5 S.6 S.7 S.8 S.1 S.2 S.3 S.4 S.5 S.6 S.7 S.8
Total Number of Learners 280 1,000 550 1,400 800 450 600 950
Available Classrooms 3 17 6 21 11 6 8 9 81
Learner-to-Classroom Ratio 93 59 92 67 73 75 75 106 A. Class-blocks Backlog 0.70 1.0 2.0 2.4 4.8 2.3 1.7 1.8 3.7 Score A: 0.70 1.40 1.70 3.33 1.58 1.20 1.23 2.58 B. Learner-to-Classroom Ratio/Target Size 0.30 2.3 1.5 2.6 1.9 1.8 2.1 1.9 2.6 Score B: 0.70 0.44 0.79 0.57 0.55 0.64 0.56 0.79 Total Weight of Section 1.00 Total Section Score: 1.40 1.84 2.49 3.90 2.12 1.84 1.79 3.37
Section Ranking: 8 6 3 1 4 5 7 2 AUGMENTING FACTORS
1. Type of School. 0.25 Primary (P) or Secondary (S) P P S S P S P P 0.25 0.25 0.00 0.00 0.25 0.00 0.25 0.25
2. Support Facilities. 0.25 Water 0.08 N N N Y N Y N Y 0.08 0.08 0.08 0.00 0.08 0.00 0.08 0.00 Toilets 0.08 N Y N Y N N N N 0.08 0.00 0.08 0.00 0.08 0.08 0.08 0.08 Electricity 0.04 N Y N Y N N Y N 0.04 0.00 0.04 0.00 0.04 0.04 0.00 0.04 Fences 0.02 N Y N Y Y N N N 0.02 0.00 0.02 0.00 0.00 0.02 0.02 0.02 Library 0.01 N N N Y N Y N N 0.01 0.01 0.01 0.00 0.01 0.00 0.01 0.01 Labs N Y N N N N N N 0.01 0.00 0.02 0.02 0.01 0.02 0.01 0.01
Primary 0.01 Secondary 0.02
Total Section Score: 0.24 0.09 0.25 0.02 0.22 0.16 0.20 0.16 3. Location of School. 0.20
Rural (R) or Urban (U) R U R R U R U R 0.20 0.00 0.20 0.20 0.00 0.20 0.00 0.20 4. Development Factors
Expected Population Decline -0.40 N N N N N Y N N 0.00 0.00 0.00 0.00 0.00 -0.20 0.00 0.00 Other Factors 0.05 N N N N N N N N 0.00 0.00 0.00 0.00 0.00 0.00 0.00 0.00
Total Section Score: 0.00 0.00 0.00 0.00 0.00 -0.20 0.00 0.00 Maximum Weight of Augmenting Factors 0.75 Total Augmenting Factors: 0.69 0.34 0.45 0.22 0.47 0.16 0.45 0.61 Maximum Possible Augmenting Adjustment 1.75 Augmenting Adjustment: 1.69 1.34 1.45 1.22 1.47 1.16 1.45 1.61
PRIORITY INDEX AND RANKING Priority Index: 2.37 2.47 3.60 4.75 3.12 2.14 2.59 5.43
ALLOCATION OF BLOCK #1 Ranking: 7 6 3 2 4 8 5 1
20
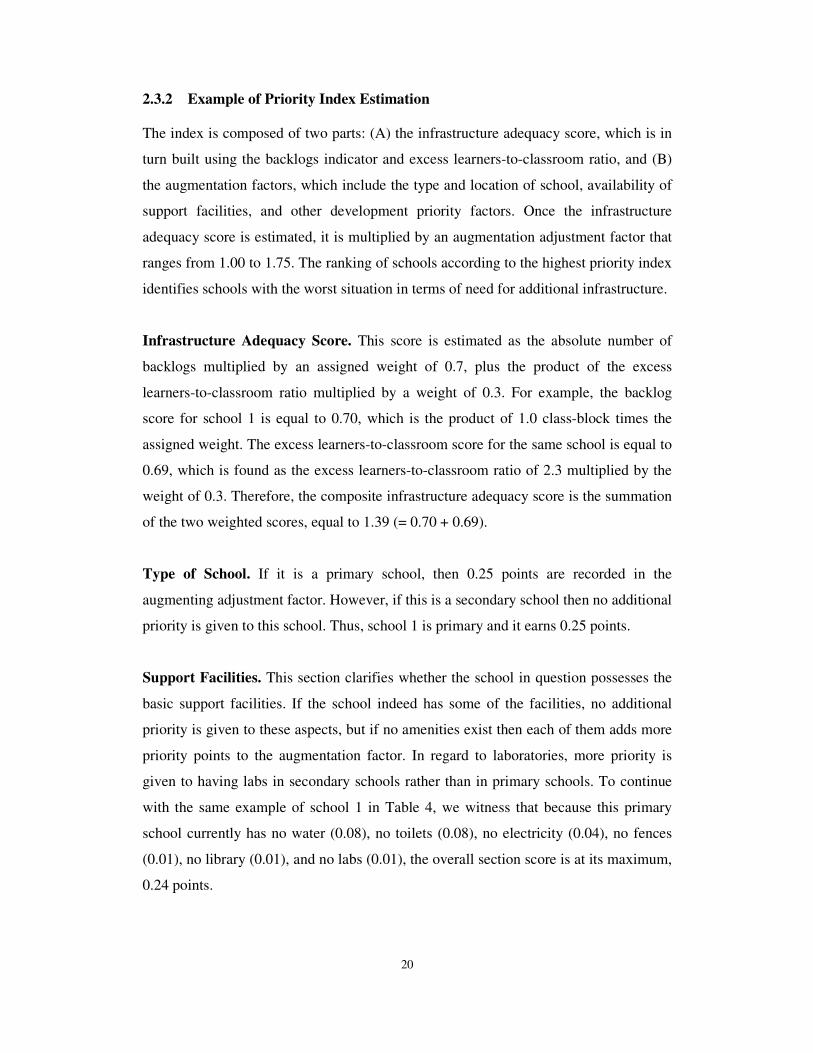
2.3.2 Example of Priority Index Estimation The index is composed of two parts: (A) the infrastructure adequacy score, which is in
turn built using the backlogs indicator and excess learners-to-classroom ratio, and (B)
the augmentation factors, which include the type and location of school, availability of
support facilities, and other development priority factors. Once the infrastructure
adequacy score is estimated, it is multiplied by an augmentation adjustment factor that
ranges from 1.00 to 1.75. The ranking of schools according to the highest priority index
identifies schools with the worst situation in terms of need for additional infrastructure.
Infrastructure Adequacy Score. This score is estimated as the absolute number of
backlogs multiplied by an assigned weight of 0.7, plus the product of the excess
learners-to-classroom ratio multiplied by a weight of 0.3. For example, the backlog
score for school 1 is equal to 0.70, which is the product of 1.0 class-block times the
assigned weight. The excess learners-to-classroom score for the same school is equal to
0.69, which is found as the excess learners-to-classroom ratio of 2.3 multiplied by the
weight of 0.3. Therefore, the composite infrastructure adequacy score is the summation
of the two weighted scores, equal to 1.39 (= 0.70 + 0.69).
Type of School. If it is a primary school, then 0.25 points are recorded in the
augmenting adjustment factor. However, if this is a secondary school then no additional
priority is given to this school. Thus, school 1 is primary and it earns 0.25 points.
Support Facilities. This section clarifies whether the school in question possesses the
basic support facilities. If the school indeed has some of the facilities, no additional
priority is given to these aspects, but if no amenities exist then each of them adds more
priority points to the augmentation factor. In regard to laboratories, more priority is
given to having labs in secondary schools rather than in primary schools. To continue
with the same example of school 1 in Table 4, we witness that because this primary
school currently has no water (0.08), no toilets (0.08), no electricity (0.04), no fences
(0.01), no library (0.01), and no labs (0.01), the overall section score is at its maximum,
0.24 points.

21
Location of School. It is assumed that a rural school obtains an additional priority
augmentation score of 0.20 points.
Development Priority Factors. Currently two factors are assigned to this section. If
the particular school is located in an area that, by any reason, is likely to be affected by
long-term outflow of population then a negative weight of -0.40 will reduce the priority
given to this school by other factors. School 1, for example, is not expected to
experience any outgoing population migration and no reduction of priority is recorded.
As opposite to this, school 6 is located in an area that will suffer some outflow, and the
severity of this migration is assigned a score of 0.20 points out of maximum 0.40
possible for this factor. All other development factors are assumed to be identical for all
schools and no special priority is given to any of the schools.
Augmenting Adjustment. This adjustment is a summation of all augmentation priority
points into a factor that ranges from 1.00 to 1.75 in most cases. An unlikely
combination of an urban secondary school with all support facilities and located in an
area that will face a population outflow, will be assigned an adjustment factor of 0.60
when the population migration score of -0.40 is taken into consideration. An average
urban secondary school with all basic support facilities will obtain an augmentation
factor close to unity, while a rural primary school with none of the support facilities
should score the maximum points. For instance, school 1 earns an augmentation
adjustment factor of 1.69, while school 6, which was identified as located in an area to
be affected by future population outflow, has only scored an augmentation factor of
1.16. At the same time, a rural secondary school 4 that has all support facilities except
laboratories has been given an augmentation factor of 1.22.
Priority Index. Finally, the index is computed as a multiplication product of the
infrastructure adequacy score and the augmentation adjustment factor. For example,
school 1 has an infrastructure adequacy score of 1.40 and the augmentation adjustment
factor of 1.69. The priority index is, therefore, estimated as 2.37 (= 1.40 * 1.69). At the
same time, school 6 had an even higher infrastructure adequacy score of 1.84 initially,
but because it failed to gain as many augmenting points as other schools, its final
priority index is only 2.14, which is lower than the PI of school 1.

22
School Ranking. Once the PI index is estimated for all schools in the database, the
schools will be automatically ranked from the highest value of PI to the lowest. The
number one ranking would signify the highest need for additional infrastructure.
2.3.3 Budget Allocation The Rule. The question now is how the school priority index and ranking can assist the
decision-making for the allocation of funds among the schools. In a situation when the
construction costs of a standard 4-classrom block are the same for all schools, the
application of cost-utility analysis suggests using Rule 1 discussed in Section 3.2.2,
which simply attempts to maximize the effectiveness of budget spending where the
overall effectiveness is measured by the alleviation of the priority index. Because the
priority index reflects a number of objectives, the overall effectiveness of budget
spending is maximized when the funds are forwarded to schools with the highest
ranking.
Illustration of Budget Allocation. To illustrate the practical application of the
allocation rule, let’s continue with the same example of 8 schools from the previous
section. Since the priority index has been estimated and ranking of schools was done
accordingly, we should focus on how a limited budget should be allocated among the
schools in the most efficient manner.
In the present situation, the total backlog for all 8 schools is 19.6 standard blocks, or
78.3 class-rooms, as could be computed from the schools’ backlog data in Table 4.
Suppose that the capital budget for the current period is only R 2.1 million, which
translates into 5 new class-blocks, since each costs R 420,000 to construct. The issue is
now to decide which school should be given the funding and for how many school-
blocks.
The right approach is to the allocation is to award each additional class-block to the
school ranking first in terms of the priority index. Because each additional building
will alter the current priority index and ranking of schools, the ranking is recalculated
after each new addition of class-rooms or support facilities, or changes in the type of

23
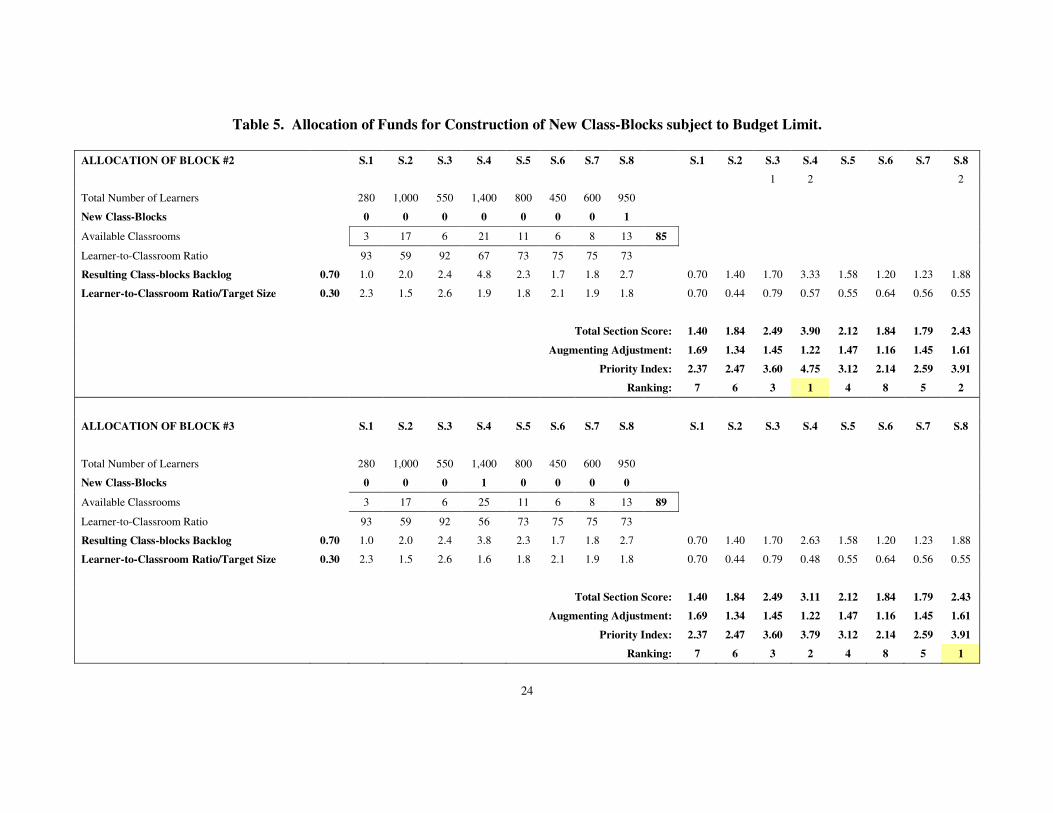
school or in the development priority factors. Table 5 illustrates the iterative allocation
process that finds an optimal spending pattern for a budget of 5 class-blocks. Because
each additional block alters the priority index and ranking, the allocation is done in five
steps, each reflecting the increment of one school-block. It is assumed that the
augmentation factors remain constant, while in reality this assumption need not to be
upheld as it is often the case that new construction may improve some of the backlogs
in the support facilities.
What is shown in Table 5 is a multi-stage selection process. Note that during each
round only one additional class-block is being awarded to the school that has the
highest ranking. For example, the very first class-block is given to school 8 because it
has the highest ranking in Table 4, i.e. before the allocation. Then, once this additional
block is given to school 8, as shown in Table 5, it means that the priority index of
school 8 declines to a level such that now another school takes the lead in ranking.
Indeed, after the first class-block is awarded to school 8, it automatically reduces its
ranking to the second position, and the second school-block must now be given to
school 4, which just came up on the top of the list.
In turn, the second class-block given to school 4 causes its priority index to decline and
the top ranking shifts again to school 8. Thus, the third class-block goes to school 8.
Once this third block is allocated, the new ranking shows that school 3 has just become
the prime favorite of the priority index, and the next block must be given to this school.
Therefore, the fourth block goes to school 3, and new readjustment of the priority index
entails. This readjustment puts school 4 on the top of the priority list, which implies
that the fifth lock should be awarded to school 4.
Thus, the allocation of five new class-blocks among 8 schools results in awarding two
blocks to each school 8 and to school 4, and one block to school 3. This pattern is
consistent with the initial priority ranking in Table 4, which put school 8 on the first
place, school 4 on the second, and school 3 on the third. Hence, the allocation rule has
allocated the limited budget funds in the most efficient manner.
24
Table 5. Allocation of Funds for Construction of New Class-Blocks subject to Budget Limit. ALLOCATION OF BLOCK #2 S.1 S.2 S.3 S.4 S.5 S.6 S.7 S.8 S.1 S.2 S.3 S.4 S.5 S.6 S.7 S.8
1 2 2
Total Number of Learners 280 1,000 550 1,400 800 450 600 950
New Class-Blocks 0 0 0 0 0 0 0 1
Available Classrooms 3 17 6 21 11 6 8 13 85
Learner-to-Classroom Ratio 93 59 92 67 73 75 75 73
Resulting Class-blocks Backlog 0.70 1.0 2.0 2.4 4.8 2.3 1.7 1.8 2.7 0.70 1.40 1.70 3.33 1.58 1.20 1.23 1.88
Learner-to-Classroom Ratio/Target Size 0.30 2.3 1.5 2.6 1.9 1.8 2.1 1.9 1.8 0.70 0.44 0.79 0.57 0.55 0.64 0.56 0.55
Total Section Score: 1.40 1.84 2.49 3.90 2.12 1.84 1.79 2.43
Augmenting Adjustment: 1.69 1.34 1.45 1.22 1.47 1.16 1.45 1.61
Priority Index: 2.37 2.47 3.60 4.75 3.12 2.14 2.59 3.91
Ranking: 7 6 3 1 4 8 5 2
ALLOCATION OF BLOCK #3 S.1 S.2 S.3 S.4 S.5 S.6 S.7 S.8 S.1 S.2 S.3 S.4 S.5 S.6 S.7 S.8
Total Number of Learners 280 1,000 550 1,400 800 450 600 950
New Class-Blocks 0 0 0 1 0 0 0 0
Available Classrooms 3 17 6 25 11 6 8 13 89
Learner-to-Classroom Ratio 93 59 92 56 73 75 75 73
Resulting Class-blocks Backlog 0.70 1.0 2.0 2.4 3.8 2.3 1.7 1.8 2.7 0.70 1.40 1.70 2.63 1.58 1.20 1.23 1.88
Learner-to-Classroom Ratio/Target Size 0.30 2.3 1.5 2.6 1.6 1.8 2.1 1.9 1.8 0.70 0.44 0.79 0.48 0.55 0.64 0.56 0.55
Total Section Score: 1.40 1.84 2.49 3.11 2.12 1.84 1.79 2.43
Augmenting Adjustment: 1.69 1.34 1.45 1.22 1.47 1.16 1.45 1.61
Priority Index: 2.37 2.47 3.60 3.79 3.12 2.14 2.59 3.91
Ranking: 7 6 3 2 4 8 5 1

25
Table 5. Allocation of Funds for Construction of New Class-Blocks subject to Budget Limit (continued). ALLOCATION OF BLOCK #4 S.1 S.2 S.3 S.4 S.5 S.6 S.7 S.8 S.1 S.2 S.3 S.4 S.5 S.6 S.7 S.8
1 2 2
Total Number of Learners 280 1,000 550 1,400 800 450 600 950
New Class-Blocks 0 0 0 0 0 0 0 1
Available Classrooms 3 17 6 25 11 6 8 17 93
Learner-to-Classroom Ratio 93 59 92 56 73 75 75 56
Resulting Class-blocks Backlog 0.70 1.0 2.0 2.4 3.8 2.3 1.7 1.8 1.7 0.70 1.40 1.70 2.63 1.58 1.20 1.23 1.18
Learner-to-Classroom Ratio/Target Size 0.30 2.3 1.5 2.6 1.6 1.8 2.1 1.9 1.4 0.70 0.44 0.79 0.48 0.55 0.64 0.56 0.42
Total Section Score: 1.40 1.84 2.49 3.11 2.12 1.84 1.79 1.60
Augmenting Adjustment: 1.69 1.34 1.45 1.22 1.47 1.16 1.45 1.61
Priority Index: 2.37 2.47 3.60 3.79 3.12 2.14 2.59 2.58
Ranking: 7 6 2 1 3 8 4 5
ALLOCATION OF BLOCK #5 S.1 S.2 S.3 S.4 S.5 S.6 S.7 S.8 S.1 S.2 S.3 S.4 S.5 S.6 S.7 S.8
Total Number of Learners 280 1,000 550 1,400 800 450 600 950
New Class-Blocks 0 0 0 1 0 0 0 0
Available Classrooms 3 17 6 29 11 6 8 17 97
Learner-to-Classroom Ratio 93 59 92 48 73 75 75 56
Resulting Class-blocks Backlog 0.70 1.0 2.0 2.4 2.8 2.3 1.7 1.8 1.7 0.70 1.40 1.70 1.93 1.58 1.20 1.23 1.18
Learner-to-Classroom Ratio/Target Size 0.30 2.3 1.5 2.6 1.4 1.8 2.1 1.9 1.4 0.70 0.44 0.79 0.41 0.55 0.64 0.56 0.42
Total Section Score: 1.40 1.84 2.49 2.34 2.12 1.84 1.79 1.60
Augmenting Adjustment: 1.69 1.34 1.45 1.22 1.47 1.16 1.45 1.61
Priority Index: 2.37 2.47 3.60 2.85 3.12 2.14 2.59 2.58
Ranking: 7 6 1 3 2 8 4 5

26
An important feature of this priority index is that it serves to reduce the overall
disparity between the different areas. In the example at the beginning of the planning
period, the range of the priority index was 5.43 for school 8, which is identified as the
school in the most need, to an index of 2.14 for school 6, area with the least need. After
the allocation of school-blocks, the range of the priority index is narrowed. After the
first school-block is allotted to school 8, the PI range is only from 4.75 (school 4) to
2.14 (school 6). This system of prioritarization is such that will ensure that the benefits
are maximized from the allocation of capital budget for the construction of new class-
blocks. Table 6 summarizes the cumulative allocation of the budget for five class-
blocks.
Table 6. Summary of Funds Allocation for 5 Standard Class-Blocks.
Allocated To: Max PI Observed S.1 S.2 S.3 S.4 S.5 S.6 S.7 S.8
1st Block School 8 * 5.43 1 2nd Block School 4 ** 4.75 1 3rd Block School 8 3.91 1 4th Block School 4 3.79 1 5th Block School 3 *** 3.60 1 Total New Blocks Allocated: 0 0 1 2 0 0 0 2
Notes: * Ranked first before allocation. ** Ranked second before allocation. *** Ranked third before allocation.
Automation of Project Selection.
It should be noted that the seemingly lengthy procedure presented here should be levied
on a computer-based system, such as the forthcoming MIS for the Department. Once
programmed, the computer will be able to calculate the priority index and generate
ranking as a part of routine process. The allocation of limited budget funds could also
be assisted by the same system.
The user intervention will be necessary in terms of regular updates of the school
database records, and for periodic reassessment of the weights assigned to the various
factors affecting the capital project selection.

27
Chapter 3. Rehabilitation of Existing Class-Blocks
In addition to building new school-blocks, the second crucial function of capital project
selection in the Department of Education is the rehabilitation of the existing school
facilitates in desperate need of repair due to damage due to natural causes or to age of
structures. No standard school-blocks were used in the past, and currently schools have
buildings erected by different donors with different designs. Some school buildings
were built as early as in the 1940s and are still in use. In a situation of severe shortage
of budget funds and huge need for rehabilitation, a system of prioritarization should be
in place to ensure the most efficient allocation of the public funds.
3.1 Current Approach
In contrast to school selection for new school-blocks, where the construction costs for
the standard 4-classroom block are fixed, the selection of schools for rehabilitation
involves assessment of different costs as the damage is different from site to site. The
current approach to allocation of the limited rehabilitation funds is relied on the
information supplied from the district offices in regard to the schools identified as
having buildings in desperate need of repair. Once the lest of schools with badly
damaged infrastructure is submitted to the Department, an initial assessment is done to
prioritorize the listing so that the most critical ones are selected for funding during this
period. The schools not selected for rehabilitation will be included in the same process
in next budget period.
Once the initial selection is made, the shortened list is referred to the Department of
Public Works in order to carry out visual and technical assessment of the rehabilitation
works to be done. The Department of Public Works sends an assessment team to
prepare a report for each site and a preliminary costing of the works. Once the
assessment is done for all schools on the list, the cost estimate reports are forwarded
back to the Department of Education. Then, the Department decides which schools are
actually selected for rehabilitation.

28
As the outcomes of rehabilitation activities in each school are known, i.e. number of
class-rooms repaired, and the cost of rehabilitation is also reasonably known too, the
current selection process tries to maximize the efficiency of spending. The selection
procedure seems also to utilize the same set of factors described in Section 2.2.2, in
order to prioritorize among the schools applying for rehabilitation.
3.2 Priority Index in Rehabilitation of Existing Buildings 3.2.1 Nature of Decision-Making Problem In the situation of huge backlog for school infrastructure and a limited amount of
capital budget available the management has to make hard choices in terms of
allocation of funds for rehabilitation. It is well understood that if no repair is given to
school buildings in critical condition, these structures will be totally useless in some
time. The question is really how to rank all alternative rehabilitation sites so that the
budget is spent in the most efficient manner.
The efficiency in the case of rehabilitation is measured in terms of technical cost-
effectiveness, i.e. if the repair cost is indeed lower than construction of a new building,
and in terms of achievement of the multiple objectives described by the school priority
index. In contrast to the ranking of schools for new class-blocks, that each costs the
same, the ranking of rehabilitation sites must account for different costs associated with
the alternative schools.
The problem is also aggravated by the fact that rehabilitation ranking involves inter-
temporal comparison of schools’ condition now and in some future year. If no
rehabilitation is arranged for a building now, it will depreciate faster and become
useless after a few years. The analysis should be able to consistently compare the cost
of construction of a new class-room in the future with the current cost of rehabilitation.
3.2.2 Building Condition The first step in assessment of alternative rehabilitation sites is to compare the current
cost of rehabilitation with the future cost of building a new class-room to replace the

29
existing damage structure. To illustrate the discussion of this process, let’s use an
illustration with eight provincial schools. Table 7 lists the number and condition of
damaged class-rooms in these schools.
Table 7. Class-rooms in Desperate Need for Rehabilitation.
School: S.1 S.2 S.3 S.4 S.5 S.6 S.7 S.8 Total INFRASTRUCTURE
Total Number of Learners 280 1,000 550 1,400 800 450 600 950 Available Classrooms 3 17 6 21 11 6 8 9 81 Learner-to-Classroom Ratio 93 59 92 67 73 75 75 106
A. Class-blocks Backlog 1.0 2.0 2.4 4.8 2.3 1.7 1.8 3.7 B. Learner-to-Classroom Ratio/Target Size 2.3 1.5 2.6 1.9 1.8 2.1 1.9 2.6 Classrooms in Urgent Need of Rehabilitation:
Condition of Classroom A 1 2 1 2 2 1 Cost of Rehabilitation Classroom A 100 35 100 40 50 120
Condition of Classroom B 1 2 1 2 Cost of Rehabilitation Classroom B 80 45 90 45
Condition of Classroom C 2 2 Cost of Rehabilitation Classroom C 40 60
Condition of Classroom D 2 1 Cost of Rehabilitation Classroom D 50 95
Condition of Classroom E 1 1 Cost of Rehabilitation Classroom E 95 85
Condition of Classroom F 1 Cost of Rehabilitation Classroom F 90
Condition of Classroom G 1 Cost of Rehabilitation Classroom G 110
Condition of Classroom H Cost of Rehabilitation Classroom H
Condition of Classroom I Cost of Rehabilitation Classroom I
Condition of Classroom J Cost of Rehabilitation Classroom J
Total # Classrooms in Urgent Need of Rehabilitation 0 5 1 7 2 0 1 2 18 Total Rehabilitation Cost (R, ‘000s) 0 365 35 585 130 0 50 165 1,330
Table 7 shows that among the existing class-rooms there are some that need urgent
repair in order to stay in service and be useful for educational services. For example,
school 5 has a total of 11 class-rooms and two need certain rehabilitation works. One of
these class-rooms (5.B) is in a very critical condition as indicated by “1” in the
condition field, and the other class-room (5.A) is in a weak condition as indicated by
“2” in its condition field.10 Likewise, school 4 currently has 21 class-rooms and 7 of
10 The use of condition indicator corresponds to the classification system used in the “Annual Survey
for Ordinary Schools (2004)”, Department of Education, Limpopo Provincial Government, Polokwane, South Africa. Thus, “1” refers as very weak condition, not suitable for education; “2” is weak and structure needs attention; “3” needs paint and minor repair; “4” is in good condition; “5” is a new structure; and “6” currently being upgraded.

30
need rehabilitation. Five of the seven (4.A, 4.D, 4.E, 4.F and 4.G) are in a very critical
condition, and two (4.B and 4.C) need repair works.
Note that the listing only contains conditions “1” and “2”, which are characterized as
serious according to the school survey. It is assumed that a building in category “1”
will stand, on the average, 1 more year before it becomes completely useless. A
building belonging to category “2” is assumed to remain in service, on the average,
for 4 more years.11 In the future, as the infrastructure backlogs become gradually
eliminated, the Department may have more funds available for rehabilitation and can
consider including condition “3” into the scope of analysis.
3.2.3 Relative Rehabilitation Cost The estimated costs of rehabilitation for each class-room are stated in Table 7. It is
assumed that the initial assessment of repair works has been done and the results are
summarized. Thus, class-room 5.A requires an investment of R 40,000 while class-
room 5.B needs R 90,000 to keep it in service. Both repair cost estimates are less than
the R 105,000 cost of a new class-room (= R 420,000 / 4 rooms), but the question is
really whether it is worth spending funds on maintenance or wait until the class-rooms
become unusable and then replace these with new buildings.
To calculate the relative cost of rehabilitation to construction of a new class-room, we
need to divide the estimated repair cost by the present value (PV) of the construction
cost of a new class-room in the future when the existing structure becomes worthless:
Rehabilitation CostRelative Rehabilitation Cost =
PV of New Class-room Construction
The current cost of a standard 4-classroom block is R 420,000, which implies a
proportional cost of R 105,000 per class-room in 2004 prices. If we assume the current
2004 year as the base year of analysis and also presume that no real changes to the
construction cost of the standard school-block take place over next few years, then we
can estimate the present value of one class-room construction in 1 year, as
11 These two assumptions were derived from consultation with the Section of the Department of Public
Works responsible for the schools infrastructure. A further research might be needed to refine these expectations of building life duration.

31
corresponding to condition “1”, and in 4 years, as corresponding to condition “2”.12
Thus, the PV of the construction cost of a new class-room in 1 year is estimated as
R2004 94,600; and in 6 years as R2004 69,200, both expressed in 2004 prices.13 The
discount rate is the economic opportunity cost of capital (EOCK), estimated as 11.0%
for South Africa.
Thus, the rehabilitation cost of a particular class-room must be compared with the PV
of the construction cost of a new class-room in the future period when it would replace
this damaged class-room if no repair is undertaken until that. Table 8 shows the results
of estimation of the relative rehabilitation cost for all 18 class-rooms in the sample.
Table 8. Relative Rehabilitation Cost.
School Condition Years Remaining
PV of New Class Cost (R2004 '000s)
Rehab Cost (R2004 '000s)
Rehab Cost / PV of New Class Cost
School 2 Class 2.A 1 1 year 94.6 100 1.06 Class 2.B 1 1 year 94.6 80 0.85 Class 2.C 2 4 years 69.2 40 0.58 Class 2.D 2 4 years 69.2 50 0.72 Class 2.E 1 1 year 94.6 95 1.00 School 3 Class 3.A 2 4 years 69.2 35 0.51 School 4 Class 4.A 1 1 year 94.6 100 1.06 Class 4.B 2 4 years 69.2 45 0.65 Class 4.C 2 4 years 69.2 60 0.87 Class 4.D 1 1 year 94.6 95 1.00 Class 4.E 1 1 year 94.6 85 0.90 Class 4.F 1 1 year 94.6 90 0.95 Class 4.G 1 1 year 94.6 110 1.16 School 5 Class 5.A 2 4 years 69.2 40 0.58 Class 5.B 1 1 year 94.6 90 0.95 School 7 Class 7.A 2 4 years 69.2 50 0.72 School 8 Class 8.A 1 1 year 94.6 120 1.27 Class 8.B 2 4 years 69.2 45 0.65
Hence, the relevant benchmark for the rehabilitation costs of class-room 5.A is the PV
of new class-room construction in 4-year time, or R2004 69,200. Since the rehabilitation
costs of this class-room are only R2004 40,000, the relative rehabilitation cost is 0.58
(=R2004 40,000 / R2004 69,200).
12 “Real” changes in the price of a good or service exclude inflationary effects, which are the general
rise in all prices across economy. Thus, “real” price adjustments are resulting from forces of supply and demand for construction services, rather than from the inflation.
13 PV in 1 year estimated as R2004 94,600 = R2004 105,000 / [(1 + 11.0%)^1]; and in 4 years as R2004 69.2 = R2004 105,000 / [(1 + 11.0%)^4].

32
For class-room 8.A, the relevant benchmark is the PV of new class-room construction
in a year time, or R2004 94,400, and its relative rehabilitation cost is 1.27 (=R2004
120,000 / R2004 94,600). In other words, the rehabilitation of class-room 5.A is 0.58
times cheaper now than building a replacement in 6 years; while the rehabilitation of
class-room 8.A is 1.27 times more expensive now than building a replacement in 1
year.
3.2.4 Discounted School Priority Index The second step of rehabilitation prioritarization is to look at the priority of the schools
in terms of the current infrastructure adequacy and other important factors, described in
Section 2.2.2. The need for analysis of the priority of the schools arises due to the fact
that provincial schools have uneven distribution of physical assets, and some of the
schools are in higher need for additional infrastructure. Thus, in a situation when two
schools have the same rehabilitation costs, the one with a higher priority index (PI)
should be selected first because it is in more need than the other. Since, the priority
index for all schools has been estimated; we can use this index for rehabilitation
decisions.
However, the priority index computed for ranking the construction of new class-blocks
does not include the condition of the class-rooms, on the presumption that having a
damaged class-room is better than having no class-room at all. Now, the rehabilitation
priority system should fulfill this role as looking at the condition of the school facilities
across the districts. Because the rehabilitation decisions involve comparing inter-
temporal situations now and in a distant period, the relevant priority index should be
first computed for all schools without one class-room, and then should be discounted
back to the base year, in this case year 2004. Table 9 illustrates the estimation of a
discounted PI index for all 8 schools in the selected sample.
Table 9 is based on school information and parameters of Table 4 in Section 2.3. In that
table, the total number of class-rooms that are currently available is 81. Now, let’s
remove one class-room from each school in order to see what its priority index would
be if one class-room becomes completely unsuitable, i.e. a class-room collapses of
natural causes such as damage, flood, soil settlement, or its own age. If each school is
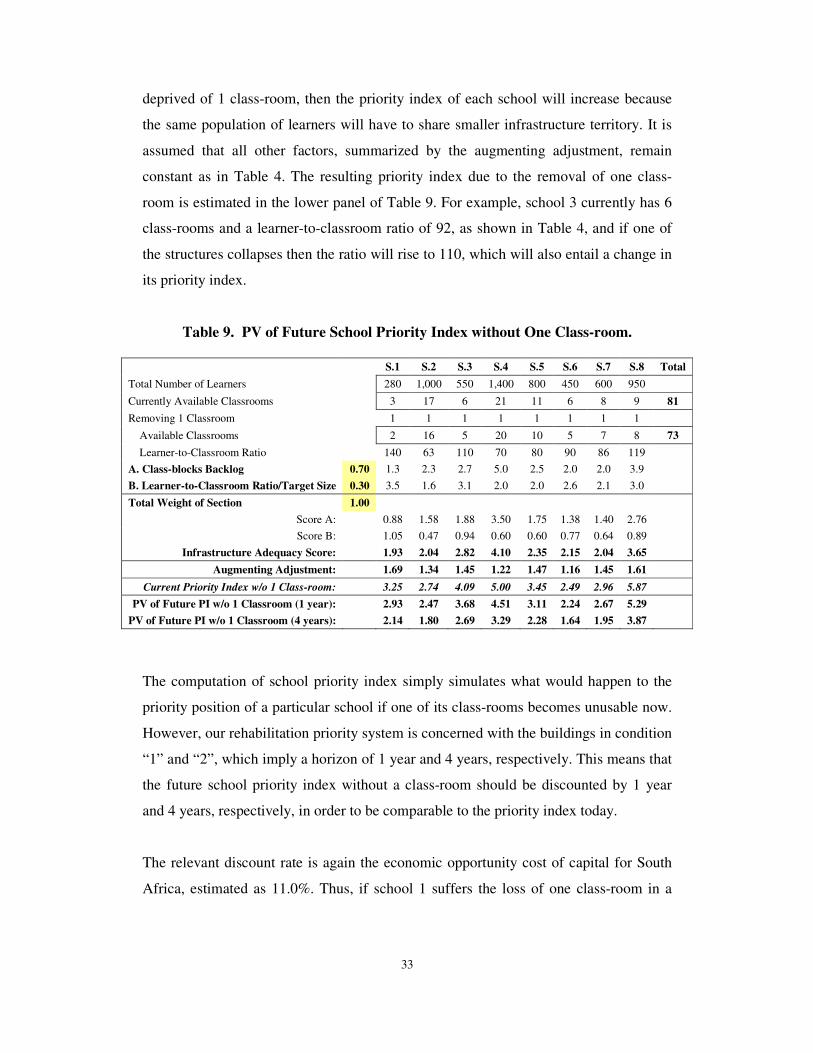
33
deprived of 1 class-room, then the priority index of each school will increase because
the same population of learners will have to share smaller infrastructure territory. It is
assumed that all other factors, summarized by the augmenting adjustment, remain
constant as in Table 4. The resulting priority index due to the removal of one class-
room is estimated in the lower panel of Table 9. For example, school 3 currently has 6
class-rooms and a learner-to-classroom ratio of 92, as shown in Table 4, and if one of
the structures collapses then the ratio will rise to 110, which will also entail a change in
its priority index.
Table 9. PV of Future School Priority Index without One Class-room.
S.1 S.2 S.3 S.4 S.5 S.6 S.7 S.8 Total Total Number of Learners 280 1,000 550 1,400 800 450 600 950 Currently Available Classrooms 3 17 6 21 11 6 8 9 81 Removing 1 Classroom 1 1 1 1 1 1 1 1
Available Classrooms 2 16 5 20 10 5 7 8 73 Learner-to-Classroom Ratio 140 63 110 70 80 90 86 119
A. Class-blocks Backlog 0.70 1.3 2.3 2.7 5.0 2.5 2.0 2.0 3.9 B. Learner-to-Classroom Ratio/Target Size 0.30 3.5 1.6 3.1 2.0 2.0 2.6 2.1 3.0
Total Weight of Section 1.00 Score A: 0.88 1.58 1.88 3.50 1.75 1.38 1.40 2.76 Score B: 1.05 0.47 0.94 0.60 0.60 0.77 0.64 0.89
Infrastructure Adequacy Score: 1.93 2.04 2.82 4.10 2.35 2.15 2.04 3.65
Augmenting Adjustment: 1.69 1.34 1.45 1.22 1.47 1.16 1.45 1.61
Current Priority Index w/o 1 Class-room: 3.25 2.74 4.09 5.00 3.45 2.49 2.96 5.87
PV of Future PI w/o 1 Classroom (1 year): 2.93 2.47 3.68 4.51 3.11 2.24 2.67 5.29 PV of Future PI w/o 1 Classroom (4 years): 2.14 1.80 2.69 3.29 2.28 1.64 1.95 3.87
The computation of school priority index simply simulates what would happen to the
priority position of a particular school if one of its class-rooms becomes unusable now.
However, our rehabilitation priority system is concerned with the buildings in condition
“1” and “2”, which imply a horizon of 1 year and 4 years, respectively. This means that
the future school priority index without a class-room should be discounted by 1 year
and 4 years, respectively, in order to be comparable to the priority index today.
The relevant discount rate is again the economic opportunity cost of capital for South
Africa, estimated as 11.0%. Thus, if school 1 suffers the loss of one class-room in a
34
year time, the present time equivalent of a 3.25 priority index would be only 2.93.14
The present-day equivalent of the school priority index in a situation when one
classroom becomes unusable after 4 years is, therefore, 2.14.15 In other words, we place
lower importance on the value of index in remote periods.
3.2.5 Rehabilitation Priority Index and Ranking Once the school priority indices without a class-room are discounted to the present
year, the analyst can match the costs of rehabilitation with the corresponding
discounted school priority index to produce a “rehabilitation priority index”. This index
is computed for each class-room and is defined as the PV of the school priority index
without a class-room divided by the relative cost of rehabilitation of that particular
class-room: School Z
School ZClassroom X School Z
Classroom X
PV of School PI w/o 1 ClassroomRehabilitation Priority Index =
Relative Rehabilitation Cost
This rehabilitation priority index is based on the original school priority index in a
situation when a school suffers a marginal loss of one class-room. Then the cost of
rehabilitation relative to building a new class-room in a future period enters the picture
as the denominator of the formula above, indicating that a higher repair cost will lower
the rehabilitation index of a class-room. If the necessary repair works cost more than
the construction of a new class-room in the future, then the relative rehabilitation cost is
more than unity, and as a result, the rehabilitation priority index become lower.
However, if the repairs are cheaper than the replacement of this structure in the future,
then the relative rehabilitation cost is below unity, and the class-room’s rehabilitation
priority index is enlarged. The index effectively matches the cost aspect of
rehabilitation and the need of the school for additional infrastructure.
Table 10 presents the estimation of the rehabilitation priority index and ranking for
each of the 18 identified damaged class-rooms across 8 schools. This table is built on
the basis of the preceding Table 8 and Table 9. The “costs” panel shows the relative
14 The discounted PI without 1 class-room for school 1, over 1 year, is estimated as 3.25 / ([1 +
11.0%]^1) = 2.93. 15 The discounted PI without 1 class-room for school 1, over 6 years, is estimated as 3.25 / ([1 +
11.0%]^4) = 2.14.

35
cost of rehabilitation to the present value of future cost of class-room replacement, as
computed in Table 8. The “priority” section is taken directly from Table 9, and shows
the resulting PV of the school’s priority index without a damaged class-room
discounted to the base year 2004. The last “ranking” panel consists of two items: the
rehabilitation priority index and class-room ranking. The rehabilitation priority index is
obtained as the PV of the school’s priority index without a class-room divided by the
relative rehabilitation cost.
Table 10. Rehabilitation Priority Index and Ranking. LOCATION COSTS PRIORITY RANKING
School Condition Rehab Cost (R2004 '000s)
Rehab Cost / PV
of New Class Cost
Current PI w/o 1
Classroom
PV of Future PI
w/o 1 Classroom
Rehab Priority Index
Rehab Ranking
School 2 Class 2.A 1 100 1.06 2.74 2.47 2.33 18 Class 2.B 1 80 0.85 2.74 2.47 2.92 14 Class 2.C 2 40 0.58 2.74 1.80 3.12 13 Class 2.D 2 50 0.72 2.74 1.80 2.50 16 Class 2.E 1 95 1.00 2.74 2.47 2.46 17 School 3 Class 3.A 2 35 0.51 4.09 2.69 5.32 2 School 4 Class 4.A 1 100 1.06 5.00 4.51 4.26 7 Class 4.B 2 45 0.65 5.00 3.29 5.06 3 Class 4.C 2 60 0.87 5.00 3.29 3.80 11 Class 4.D 1 95 1.00 5.00 4.51 4.49 6 Class 4.E 1 85 0.90 5.00 4.51 5.01 4 Class 4.F 1 90 0.95 5.00 4.51 4.74 5 Class 4.G 1 110 1.16 5.00 4.51 3.88 10 School 5 Class 5.A 2 40 0.58 3.45 2.28 3.93 9 Class 5.B 1 90 0.95 3.45 3.11 3.27 12 School 7 Class 7.A 2 50 0.72 2.96 1.95 2.70 15 School 8 Class 8.A 1 120 1.27 5.87 5.29 4.17 8 Class 8.B 2 45 0.65 5.87 3.87 5.94 1
For example, class-room 2.A is in a critical condition “1” and to remain functional, it
requires an immediate expense of R 100,000 otherwise this class-room will become
totally useless in 1 year. Thus, because the PV of the replacement in 1 year is only R
94,600, Table 8 suggests that the relative rehabilitation cost of this class-room now is
1.06 times of the PV of its replacement cost in the future. At the same time, if school 2
(to which this class-room belongs) suffers a loss of this or any other class-room then its
current priority index would rise to 2.74. However, because this particular class-room
without any repair is expected, on the average, to serve additional 1 year, this school PI

36
should be discounted back to reflect its lower importance in the future. Thus, Table 9
shows that the 2.74 school priority index in a year time will be equivalent to only 2.47
in its present-day value. Then, the rehabilitation priority index for class-room 2.A is
now estimated as the PV of the future school PI without a class-room divided by the
relative rehabilitation cost:
School 2Classroom A
2.47Rehabilitation Priority Index = = 2.33
1.06
The resulting index is then ranked from the highest to the lowest value. The class-
rooms ranking at the top indicate the highest need relative to cost of repair. Hence,
class-block 2.A is ranked 18th due to its relatively high cost of rehabilitation and
relatively modest school priority, as described by its school’s PI value. Class-rooms
with low rehabilitation costs and located in high priority schools are ranked at the top
of the listing. Particularly, class-room 8.B is ranked first due to its location in a school
lacking infrastructure.
3.3 Budget Allocation using Rehabilitation Priority Index The rehabilitation index and ranking of sites gives the decision-makers ability to
allocate the rehabilitation budget in the most efficient manner. The top positions of the
rehabilitation ranking are occupied by class-rooms that are both relatively cheaper to
repair and being located in schools with the highest need for additional infrastructure.
The allocation rule is to start funding the schools at the top of the rehabilitation
ranking ladder and then to continue spending as long as the budget size allows.
Assume that the total rehabilitation budget available for the current year is R 350,000
and the schools having damaged class-rooms are limited to the eight schools in our
example. Then, the allocation rule would spend the funds in the order of the
rehabilitation ranking up to a point when the budget is exhausted. Table 11 illustrates
this process. With a fixed budget of R 300,000, school 8 should be financed to have its
class-room 8.B to be rehabilitated at cost of R 45,000. Then, School 4 will have three of
its class-rooms (4.B, 4.E and 4.F) repaired at a total cost of R 220,000. Finally school 3
should be given funding for repair of class-room 3.A with a cost of R 35,000. This
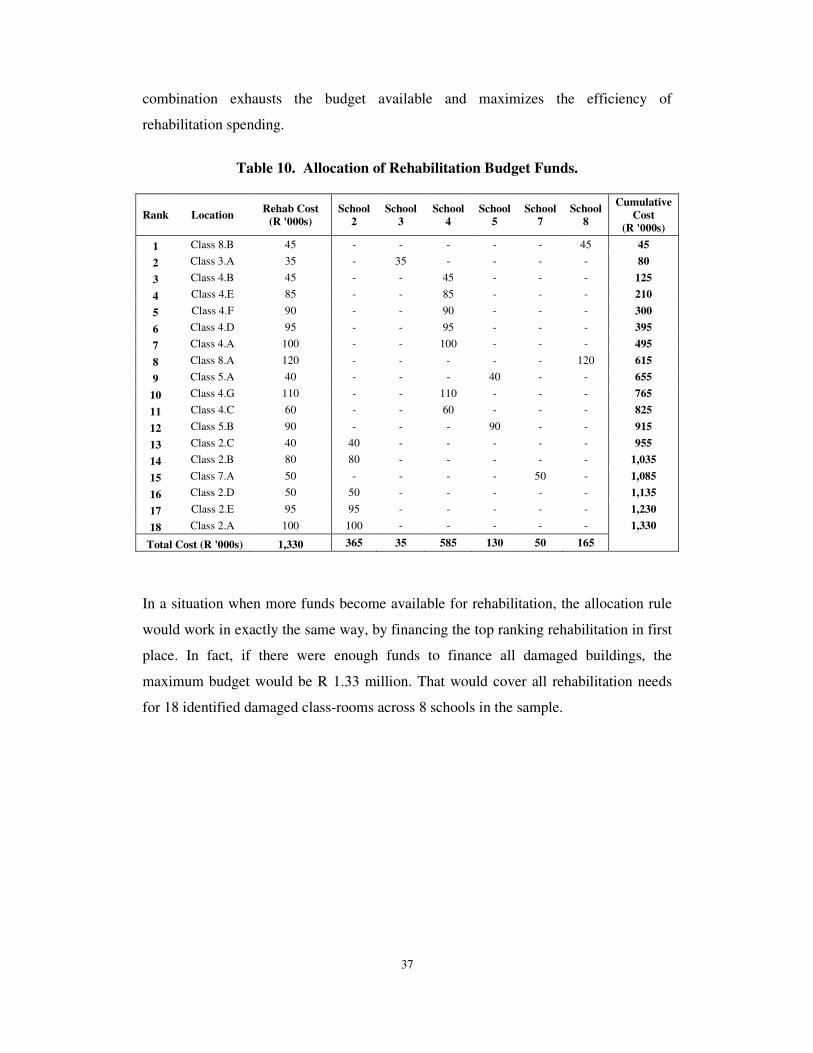
37
combination exhausts the budget available and maximizes the efficiency of
rehabilitation spending.
Table 10. Allocation of Rehabilitation Budget Funds.
Rank Location Rehab Cost (R '000s)
School 2
School 3
School 4
School 5
School 7
School 8
Cumulative Cost
(R '000s)
1 Class 8.B 45 - - - - - 45 45 2 Class 3.A 35 - 35 - - - - 80
3 Class 4.B 45 - - 45 - - - 125
4 Class 4.E 85 - - 85 - - - 210
5 Class 4.F 90 - - 90 - - - 300
6 Class 4.D 95 - - 95 - - - 395
7 Class 4.A 100 - - 100 - - - 495
8 Class 8.A 120 - - - - - 120 615
9 Class 5.A 40 - - - 40 - - 655
10 Class 4.G 110 - - 110 - - - 765
11 Class 4.C 60 - - 60 - - - 825
12 Class 5.B 90 - - - 90 - - 915
13 Class 2.C 40 40 - - - - - 955 14 Class 2.B 80 80 - - - - - 1,035
15 Class 7.A 50 - - - - 50 - 1,085
16 Class 2.D 50 50 - - - - - 1,135
17 Class 2.E 95 95 - - - - - 1,230
18 Class 2.A 100 100 - - - - - 1,330
Total Cost (R '000s) 1,330 365 35 585 130 50 165
In a situation when more funds become available for rehabilitation, the allocation rule
would work in exactly the same way, by financing the top ranking rehabilitation in first
place. In fact, if there were enough funds to finance all damaged buildings, the
maximum budget would be R 1.33 million. That would cover all rehabilitation needs
for 18 identified damaged class-rooms across 8 schools in the sample.

38
Chapter 4. Conclusion
The existing system for identification of the demand for additional school infrastructure
and renovation is not functioning properly. It is important to re-assess the existing
management practices at the provincial and district levels, in order to device a new
management information system.
An integral part of the new management information system should be a
computerized database on all 4,900 provincial schools. This database should provide
the decision-makers with regularly updated information on many educational aspects,
as well as on the physical condition of the school facilities.
A weighted cost-effectiveness approach, also called cost-utility analysis, can be
employed for the capital project selection at the Department of Education. The task is
to maximize the overall effectiveness of public expenditure on school infrastructure
within a given amount of budget. The efficiency is to be measured a weighted “priority
index” (PI) which can be setup to include all the important factors affecting the project
selection.
The index can include as many factors as the decision-makers need to cover in the
allocation of funds across provincial schools in the six districts. Infrastructure
adequacy is the most crucial set of factors indicating the need for additional school
infrastructure. There are two aspects of infrastructure adequacy: class-block backlog
and the learner-to-classroom ratio. In addition to looking after the infrastructure
adequacy, the decision-making process currently considers a host of factors that aid the
project selection. These factors could be grouped into three categories: type of school,
presence of support facilities, location of the school, and development priority factors.
The right approach is to the allocation is to award each additional class-block to the
school ranking first in terms of the priority index. Then the overall effectiveness of
budget spending is maximized when the funds are forwarded to schools with the
highest ranking. Because each additional building will alter the current priority index
and ranking of schools, the ranking must be recalculated after each new addition of

39
class-rooms or support facilities, or changes in the type of school or in the development
priority factors.
In a situation of severe shortage of budget funds and huge need for rehabilitation, a
system of prioritarization should be in place to ensure the most efficient allocation of
the public funds. The rehabilitation index and ranking of sites gives the decision-
makers ability to allocate the rehabilitation budget in the most efficient manner. The top
positions of the rehabilitation ranking are occupied by class-rooms that are both
relatively cheaper to repair and being located in schools with the highest need for
additional infrastructure. The allocation rule is to start funding the schools at the top
of the rehabilitation ranking ladder and then to continue spending as long as the
budget size allows.
The methodology outlined in this Handbook together with a reliable information
system, which the Department is currently developing, can be used to ensure that the
funds are allocated to the provincial schools, new and old, in an economically and
socially efficient manner.

40
Annex A. Analytical Framework
A.1 The Approach
Capital expenditure evaluation is often presented only in the framework of cost-benefit
analysis where all benefits and costs are expressed in terms of monetary values.
However, many projects undertaking by the government’s departments have a common
feature: the monetary value of the benefits are unknown to the project analyst. This
happens mainly because the benefits are difficult to quantify and monetize, for
example, the enhancement of school education, or improvement in healthcare.
At the same time, for many budget expenditures in such as national defense, healthcare,
education, security and justice administration, road and infrastructure maintenance, it
may not be feasible to carry out a full cost-benefit analysis for each individual project.
A quicker and more efficient method is often employed to avoid the quantification and
monetizing of all economic benefits. Cost-effectiveness analysis (CEA) is frequently
employed in such situations. CEA is much simple but still capable of capturing the
most important benefits and is reasonable basis for making effective decisions.
The task of allocation of a department’s budget among various activities is another use
of the CEA. Once the spending priorities are defined, the scarce budget funds can be
allocated among projects based on the CEA technique. Projects with a lower priority
and smaller positive outcome are effectively shifted to the next budget period, where
another comparative evaluation will take place.
A.2 Cost-Effectiveness Analysis vs. Cost-Utility Analysis A pure cost-effectiveness analysis looks at a single quantified, but not monetized,
effectiveness measure of the cost per unit. For example, the cost in Rand of building a
standard class-block that will alleviate some of the backlog for a particular rural school.
An investment into a school with a higher level of need, as measured by the number of
learners per class-room, is more preferable to building the same class-block where the

41
school can still manage with the existing infrastructure. In this example, the CEA only
cares about the reduction of the learner-to-classroom ratio, excluding all other factors.
Cost-utility analysis (CUA) also measures costs per benefit effectiveness but the benefit
measure is a composite index made up of two or more categories, including quantity
and quality. For example, the cost-utility analysis in the case of capital project selection
for education would not only consider the learner-to-classroom ratio but also the
physical condition of the existing facilities, community factors, priorities and so on.
While it would be impractical to employ a full-scale cost-benefit analysis for
construction of additional class-rooms in a rural school, the CUA could still incorporate
the important factors. Hence, cost-utility analysis is a step closer to the cost-benefit
analysis than is cost-effectiveness analysis. CUA, in fact, attempts to include several of
the benefits excluded from cost effectiveness analysis.
A.2.1 Estimation of Effectiveness-to-Cost Ratio
The cost-effectiveness analysis first computes cost-effectiveness ratios of different
alternatives, and then compares the resulting ratios so that the most efficient option is
chosen. In a sense, CEA ensures technical efficiency when achieving the desired
outcome. The ratios measure only one aspect of benefit(s) resulting from a project, and
the whole host of social impacts is not included in the evaluation.
Effectiveness-to-Cost Ratio
The approach most suitable for prioritarization of the allocation of school-blocks
among alternative areas is to measure the effectiveness (Ei) in terms of its cost (Ci).
This EC ratio could be thought of as the average effectiveness per unit of cost:
i
ii C
EEC =
Once the benefits and costs are defined, the procedure of ranking alternative projects
would simply choose the alternatives with the highest ratios. For example, the
allocation of additional class-blocks to the schools, as the class-block is standardized
with a fixed construction cost (Ci). Hence, the capital budget effectiveness would be
increased if the spending is channeled to schools with the highest value of (Ei). In the
context of this handbook, (Ei) is the priority index calculated for every school. The
42
index itself is a composite measure of effectiveness in terms of achieving multiple
objectives in provision of school infrastructure. This index is, in fact, a utility indicator
discussed in Section A.3.
Costs Assessment
The preceding sections have focused on the computation of ratios. While computing
cost-effectiveness ratio for a particular project, an attention should be paid to the
treatment of costs, which may include not only financial but also social costs.16 In the
education sector, the enhancement of primary schooling is sometimes viewed in terms
of the additional number of class-blocks and improvement of their physical condition.
But any large-scale program aiming at the development of school systems must take
into account not only the infrastructure costs but also the cost of additional teaching
personnel to staff the schools, teaching materials, as well as regular maintenance costs.
Generally, different types of projects often have some of the costs in non-monetary
terms, such as waiting time, coping costs, enforcement costs, regulatory costs,
compliance costs, etc. The economic cost-effectiveness analysis carried out for such
projects must account for all costs, and should also be based on the economic instead of
financial prices of goods and services.
Discounting
Many capital projects have large investment costs at the beginning and then their
benefits are spread over many years. Hence, the benefits in distant years have to be
discounted back to the present time in order to make an evaluation of alternatives.
Because cost-effectiveness analysis does not place a monetary value on the benefits, the
project analyst has to discount the quantity of the effectiveness measure itself. In other
words, both the costs and units of effectiveness should be discounted by the same
rate.17 The only addition to what has been discussed in previous sections is that the
costs and effectiveness are now being discounted:
i
ii essEffectivenofPV
CostsofPVCE =
16 Boardman, A.E., Greenberg, D.H, Vining, A.R., and Weimer, D.L., Cost-Benefit Analysis: Concepts
and Practice, 2nd Ed., Prentice Hall, (2001), p. 439. 17 Ibid., p. 404.
43
The question of what is the appropriate discount rate to use is often raised. For
example, proponents of health and education projects have argued for low rate of
discount to be used when comparing alternative projects.18 However, there is no sound
economic reason to use any discount rate other than the economic opportunity cost of
funds, which in the case of South Africa is a real rate of 11.0 percent.19
A.3 Cost-Utility Analysis The estimation of benefit in CEA, as has been illustrated, is limited to a single measure
of effectiveness. Often, this simplification is not acceptable and, instead, a cost utility
analysis is employed. In principle, CUA could be used with multiple outcomes but as
the number of dimensions grows, the complexity of analysis also increases. This
approach is practically employed in the allocation of new school-blocks as there are a
number of different factors that are taken into consideration during the selection
process.
Cost-utility analysis forces the analyst to compile a composite index of outcomes, i.e.,
utility level as a measure of benefits. Each type of benefit (Bj) would be assigned its
relative importance, or weight (wj), in the utility:
( )i
n
1jjj
ii
w*B
CCU
���
����
�=
�=
In the construction of a weighted effectiveness index, the most delicate task is the
assignment of relative weights, indicating the importance of a particular outcome
compared to all other benefits in the utility. If a particular case that analyst is dealing
with seems to have controversial interpretations, then the analyst should refer to
opinions of experts, policymakers’ preferences, and community views. These
18 The theoretical arguments have been developed by Harberger, A.C., “On Measuring the Social
Opportunity Cost of Public Funds”, in Project Evaluation – Collected Papers, (Chicago: the University of Chicago, 1972); Sandmo, H. and Dreze, J.H, “Discount Rates for Public Investment in Closed and Open Economies”, Economica, (November 1971); and Sjaastad, L.A. and Wisecarver, D.L., “The Social Cost of Public Fund”, Journal of Political Economy, (June 1977).
19 “Integrated Investment Appraisal: Concepts and Practice”, Appendix A: The Economic Cost of Capital for South Africa, pp. 457-470.

44
subjective opinions are still a better indicator of what is the relative importance is for
each of the outcomes from a project.
Note that the significance of weights is to rank the different outcomes relative to each
other, using the same scale of measurement. It is not even necessary that the sum of all
weights is equal to one ���
����
��
=
n
1jjw , as long as the scale used across the different types of
benefits is identical. Once the metric is chosen and outcomes are ranked relative to each
other, then the cost utility analysis becomes very similar to cost effectiveness analysis.
Likewise, the analyst can use both cost-utility ratios, utility-to-cost ratios as well as
marginal ratios.
Cost utility analysis is a frequently employed by policymakers in health, education,
defense, security, and many other sectors. A typical case when CUA is a necessity is
when a set of alternative policy actions must be evaluated, each resulting in multiple
outcomes.
A.3.1 CUA in Improvement of School Learning An application of cost utility analysis in education could be presented with the help of
following example.20 Suppose, there are two alternative methods of improving students
learning: better-qualified teachers (A) and smaller class sizes (B). Both methods lead to
improvement in mathematical skills, reading and world knowledge, as measured by
percentile score achievements in each field. But the effectiveness of the two alternative
methods is not the same across the three fields, and there is a consensus that for the
target group of pupils, improvement of reading skills is more important than
mathematics, and world knowledge. At the same time, mathematical skills are more
important than world knowledge. If ranked on the same scale of maximum 10 points,
these preferences could be expressed by weights of 9, 7, and 6 for reading, mathematics
and world knowledge, respectively.
20 The following example is adopted from Belli, P., Anderson, J.R., Barnum, H.N., Dixon, J.A., and
Tan, J.P., “Economic Analysis of Investment Operations: Analytical Tools and Practical Applications”, The World Bank, Washington D.C., (2001), p. 79.

45
Table A-1 shows the expected test scores by subject under each alternative method of
improvement. The weighted score represents the utility index, and it is computed as a
sum of scores by subject times their respective weights.21 If the per pupil costs of
method A and method B are R 95 and R 105 per year, then it is possible to find utility-
cost ratios and cost-to-utility ratios.
Obviously, method B is a better policy to improve student learning, because it results in
lower cost per unit of utility, or higher test scores per Rand. Note that the choice of
project may change if the ranking of outcomes is altered, which will immediately entail
a corresponding adjustment in the utility indices.
Table A-1. CUA in Improvement of School Learning.
Test Scores by Subject
Mathematics Reading World Knowledge
Weighted Score
Cost (Rand per
Pupil)
UC Ratio
CU Ratio Ranking
Weights 7 9 6
Method A 75 40 55 1,215 (a) 95 12.8 (c) 0.078 2
Method B 60 65 65 1,395 (b) 105 13.3 (d) 0.075 1
Notes: (a) Computed as: 7*75 + 9*40 + 6*55 = 1,215 (b) 7*60 + 9*65 + 6*65 = 1,395 (c) 1,215 / 95 = 12.8 (d) 1,395 / 105 = 13.3
A.3.2 Alternatives with Subjective Outcomes Sometimes the analyst may come across a case when no quantitative estimates of the
relationship between the policy intervention and resulting benefits exist. It is obvious
that alternative policies will do some good but no quantitative data is available. Using
the previous example focused on improvement of student learning in mathematics,
reading and world knowledge, let’s now presume that no test score data is available to
the policy makers. What is available now is subjective opinion(s) of the education
experts in regard to probability of raising the test score in each subject by a grade point.
Table A-2 states the summary of the experts’ opinions expressed in probability terms.
21 For instance, the weighted score of method A is calculated as (�scorei*weighti) = 75*7+40*9+55*6
= 1,215.

46
For instance, the probability the better-qualified teachers (A) will result in one-point
increase in test scores in mathematics is 45%, in reading is 50%, and in world
knowledge is 55%. The fixed cost of method A is expected to be R 95 per pupil. At the
same time, the probability that smaller class sizes (B) will raise test scores by a point is
30% in mathematics, is 65% in reading, and 45% in world knowledge. Both methods
contribute to the learning process, but which is more effective?
Table A-2. CUA in Improvement of School Learning with Subjective Outcomes.
Test Scores by Subject
Mathematics Reading World Knowledge
Weighted Score
Cost (Rand per
Pupil)
UC Ratio
CU Ratio Ranking
Weights 7 9 6
Method A 45% 50% 55% 10.95 (a) 95 0.12 (c) 8.676 1
Method B 30% 65% 45% 10.65 (b) 105 0.10 (d) 9.859 2
Notes: (a) Computed as: 7*45% + 9*50% + 6*55% = 10.95 (b) 7*30% + 9*65% + 6*45% = 10.65 (c) 10.95 / 95 = 0.12 (d) 10.65 / 105 = 0.10
If the policy preferences have not changed, then the weights will be the same as in the
previous example: reading skills are ranked 9 out of 10, mathematical skills are graded
7 out of 10, and world knowledge is assigned a weight of 6 out of 10. Using the
weights, method A appears to generate more units of utility, as measured by weighted
score of 10.95 versus 10.65 resulting from method B.22 Given the costs of each
intervention, utility-cost and cost-utility ratios are computed. Method A is more cost-
effective because it contributes more to the overall scores per Rand of spending.
A.4 Applicability of the Method In a situation when only quantitative data on project outcomes is available and it is
neither possible nor feasible to translate the quantitative data into monetary values,
cost-effectiveness and cost-utility analysis represent a practical way of carrying out the
assessment. When, in addition to that, only one aspect of project benefits matters, cost-

47
effectiveness analysis offers a handy tool for selection of alternatives. CEA does not
include any subjective judgments and it measures technical efficiency.
Cost-utility analysis is used when multiple benefits have to be included into
assessment. The main advantage of CUA is that it can deal with evaluation of a whole
host of benefits without requiring actual data. Both cost-effectiveness and cost-utility
analysis offer very practical methods of selection among alternatives.
22 The weighted score of method A is computed as 45%*7+50%*9+55%*6 = 10.95.

48
Annex B. Application of Priority Index to Prioritarization of
Selected Schools in Limpopo Province
B.1 Introduction This annex contains a practical application of the prioritarization model developed for
the allocation of new class-blocks and rehabilitation decisions for the existing stock of
class-rooms. Sections from B.2 through B.5 are devoted to estimation of the school
priority index for some 40 selected provincial schools in order to rank them in terms of
their needs for additional infrastructure. Section B.6 continues with the same sample of
40 schools and estimates the rehabilitation index and ranking of damaged class-rooms
located in some schools.
The text of this annex is accompanied by a CD-ROM containing the spreadsheet actual
computations. The spreadsheet is built on the dataset of the education management
information system currently used by the Department of Education.23 The purpose of
this annex and the spreadsheet is not to develop an additional stand-alone system for
the Department but to illustrate the concept of the priority index and show in detail
how it can be estimated and used for budget allocation. It is believed that the
Department should have a single MIS system in the future that would combine both the
existing database functionality and a built-in module to estimate a priority index and
school ranking for infrastructure allocation decisions.
B.2 Parameters and Data
B.2.1 Available Information
Table B-1 presents an extract from the current EMIS database used by the Department
and compiled from the School Annual Survey 2004 filed by the schools’ principals.
The survey goes into substantial degree of detail of many educational aspects using a
23 Chapter 15 of the EMIS database contains all relevant infrastructure information.

49
set of quantitative and qualitative norms and standards defined by the National
Department of Education. A specific section is devoted to the school infrastructure.
Schools are identified by a unique EMIS number, and their names (field 11) and
location in terms of district (field 111) and regional (field 110) placement are stated in
general information section of the EMIS. The total enrollment at school is summarized
in field 123. Section 15 contains all infrastructure-related information.
Number of Class-rooms (field 15231). The survey differentiates between three types
of class-rooms: permanent; prefabs (which also include mobile classes); and all other
(located outside of school premises).
Condition of Infrastructure Facilities. The condition of the following facilities are
reported: fences (field 154); class-rooms (field 15121); staff rooms (field 15122);
offices (field 15123); laboratory (field 15124); library (field 15125); and toilets (field
156). The scale of condition is such that “1” corresponds to critical “unsuitable for
education” condition; “2” refers to “weak, requiring attention” state; “3” means that
“painting and minor repair” is needed; “4” is good condition; “5” is a new structure;
and “6” is currently being renovated. It should be noted that the condition reporting is
not done for each building/structure but rather as a general characteristics of the
facilities in question. Thus, it would be wrong to assume that a school reporting the
condition of its classrooms as “1” would necessarily have all class-rooms being in that
critical condition. For instance, Malegale Primary School (#925660495) has 26 class-
rooms and reports in field 15121 a condition of “1”. This, most probably, means that
the most severely damaged building(s) in this school has/have the rating of “1”, while
other damaged buildings might be in a better condition.
Electricity Supply. Field 1513 tells about the status of power supply at a school. Value
of “1” means that the school is “wired and supplied by ESKOM”; “2” implies that
power is “self-generated using generators”; “3” refers to “solar panels”; and “4”
corresponds to no power supply.
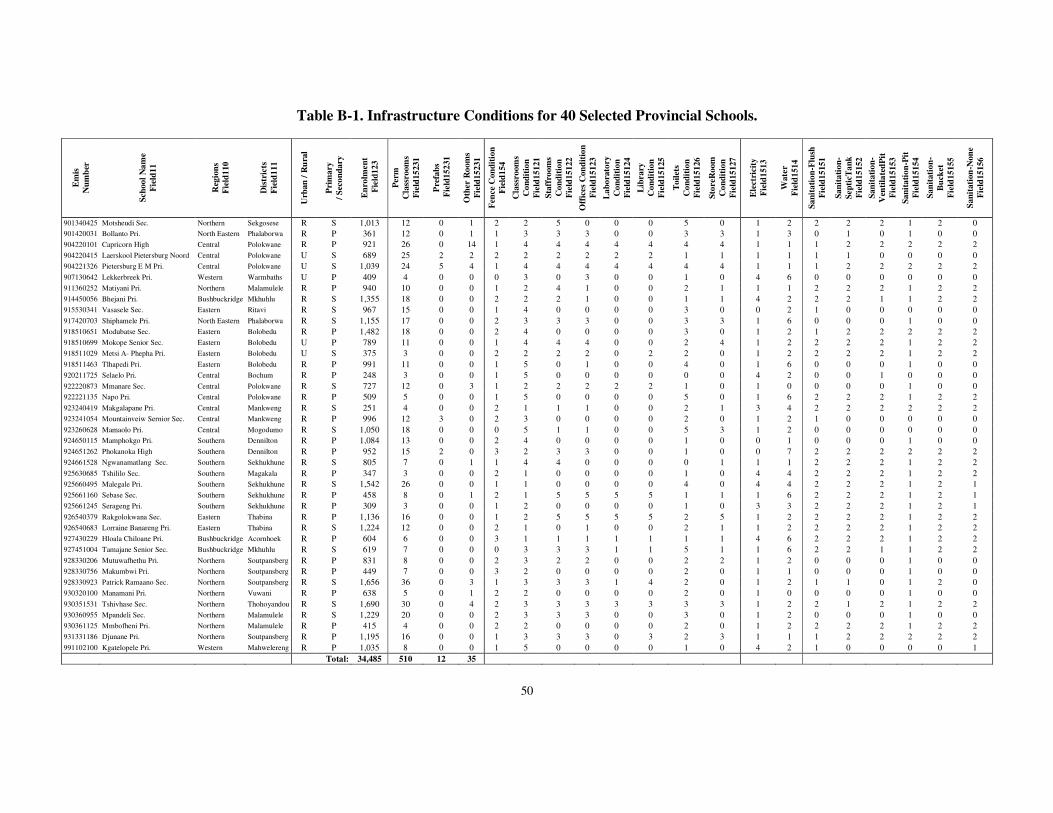
50
Table B-1. Infrastructure Conditions for 40 Selected Provincial Schools.
Em
is
Num
ber
Scho
ol N
ame
Fiel
d11
Reg
ions
Fi
eld1
10
Dis
tric
ts
Fiel
d111
Urb
an /
Rur
al
Prim
ary
/ Sec
onda
ry
Enr
olm
ent
Fie
ld12
3
Perm
C
lass
room
s Fi
eld1
5231
Pref
abs
Fie
ld15
231
Oth
er R
oom
s Fi
eld1
5231
Fenc
e C
ondi
tion
Fiel
d154
C
lass
room
s C
ondi
tion
Fiel
d151
21
Staf
froo
ms
Con
ditio
n Fi
eld1
5122
O
ffic
es C
ondi
tion
Fiel
d151
23
Lab
orat
ory
Con
ditio
n Fi
eld1
5124
L
ibra
ry
Con
ditio
n Fi
eld1
5125
Toile
ts
Con
ditio
n Fi
eld1
5126
Stor
eRoo
m
Con
ditio
n Fi
eld1
5127
Ele
ctri
city
Fi
eld1
513
Wat
er
Fiel
d151
4
Sani
tatio
n-Fl
ush
Fiel
d151
51
Sani
tatio
n-Se
ptic
Tan
k Fi
eld1
5152
Sa
nita
tion-
Ven
tilat
edPi
t Fi
eld1
5153
Sa
nita
tion-
Pit
Fiel
d151
54
Sani
tatio
n-
Buc
ket
Fiel
d151
55
Sani
tatio
n-N
one
Fiel
d151
56
901340425 Motsheudi Sec. Northern Sekgosese R S 1,013 12 0 1 2 2 5 0 0 0 5 0 1 2 2 2 2 1 2 0 901420031 Bollanto Pri. North Eastern Phalaborwa R P 361 12 0 1 1 3 3 3 0 0 3 3 1 3 0 1 0 1 0 0 904220101 Capricorn High Central Polokwane R P 921 26 0 14 1 4 4 4 4 4 4 4 1 1 1 2 2 2 2 2 904220415 Laerskool Pietersburg Noord Central Polokwane U S 689 25 2 2 2 2 2 2 2 2 1 1 1 1 1 1 0 0 0 0 904221326 Pietersburg E M Pri. Central Polokwane U S 1,039 24 5 4 1 4 4 4 4 4 4 4 1 1 1 2 2 2 2 2 907130642 Lekkerbreek Pri. Western Warmbaths U P 409 4 0 0 0 3 0 3 0 0 1 0 4 6 0 0 0 0 0 0 911360252 Matiyani Pri. Northern Malamulele R P 940 10 0 0 1 2 4 1 0 0 2 1 1 1 2 2 2 1 2 2 914450056 Bhejani Pri. Bushbuckridge Mkhuhlu R S 1,355 18 0 0 2 2 2 1 0 0 1 1 4 2 2 2 1 1 2 2 915530341 Vasasele Sec. Eastern Ritavi R S 967 15 0 0 1 4 0 0 0 0 3 0 0 2 1 0 0 0 0 0 917420703 Shiphamele Pri. North Eastern Phalaborwa R S 1,155 17 0 0 2 3 3 3 0 0 3 3 1 6 0 0 0 1 0 0 918510651 Modubatse Sec. Eastern Bolobedu R P 1,482 18 0 0 2 4 0 0 0 0 3 0 1 2 1 2 2 2 2 2 918510699 Mokope Senior Sec. Eastern Bolobedu U P 789 11 0 0 1 4 4 4 0 0 2 4 1 2 2 2 2 1 2 2 918511029 Metsi A- Phepha Pri. Eastern Bolobedu U S 375 3 0 0 2 2 2 2 0 2 2 0 1 2 2 2 2 1 2 2 918511463 Tlhapedi Pri. Eastern Bolobedu R P 991 11 0 0 1 5 0 1 0 0 4 0 1 6 0 0 0 1 0 0 920211725 Selaelo Pri. Central Bochum R P 248 3 0 0 1 5 0 0 0 0 0 0 4 2 0 0 1 0 0 0 922220873 Mmanare Sec. Central Polokwane R S 727 12 0 3 1 2 2 2 2 2 1 0 1 0 0 0 0 1 0 0 922221135 Napo Pri. Central Polokwane R P 509 5 0 0 1 5 0 0 0 0 5 0 1 6 2 2 2 1 2 2 923240419 Makgalapane Pri. Central Mankweng R S 251 4 0 0 2 1 1 1 0 0 2 1 3 4 2 2 2 2 2 2 923241054 Mountainveiw Sernior Sec. Central Mankweng R P 996 12 3 0 2 3 0 0 0 0 2 0 1 2 1 0 0 0 0 0 923260628 Mamaolo Pri. Central Mogodumo R S 1,050 18 0 0 0 5 1 1 0 0 5 3 1 2 0 0 0 0 0 0 924650115 Mamphokgo Pri. Southern Dennilton R P 1,084 13 0 0 2 4 0 0 0 0 1 0 0 1 0 0 0 1 0 0 924651262 Phokanoka High Southern Dennilton R P 952 15 2 0 3 2 3 3 0 0 1 0 0 7 2 2 2 2 2 2 924661528 Ngwanamatlang Sec. Southern Sekhukhune R S 805 7 0 1 1 4 4 0 0 0 0 1 1 1 2 2 2 1 2 2 925630685 Tshililo Sec. Southern Magakala R P 347 3 0 0 2 1 0 0 0 0 1 0 4 4 2 2 2 1 2 2 925660495 Malegale Pri. Southern Sekhukhune R S 1,542 26 0 0 1 1 0 0 0 0 4 0 4 4 2 2 2 1 2 1 925661160 Sebase Sec. Southern Sekhukhune R P 458 8 0 1 2 1 5 5 5 5 1 1 1 6 2 2 2 1 2 1 925661245 Serageng Pri. Southern Sekhukhune R P 309 3 0 0 1 2 0 0 0 0 1 0 3 3 2 2 2 1 2 1 926540379 Rakgolokwana Sec. Eastern Thabina R P 1,136 16 0 0 1 2 5 5 5 5 2 5 1 2 2 2 2 1 2 2 926540683 Lorraine Banareng Pri. Eastern Thabina R S 1,224 12 0 0 2 1 0 1 0 0 2 1 1 2 2 2 2 1 2 2 927430229 Hloala Chiloane Pri. Bushbuckridge Acornhoek R P 604 6 0 0 3 1 1 1 1 1 1 1 4 6 2 2 2 1 2 2 927451004 Tamajane Senior Sec. Bushbuckridge Mkhuhlu R S 619 7 0 0 0 3 3 3 1 1 5 1 1 6 2 2 1 1 2 2 928330206 Mutuwafhethu Pri. Northern Soutpansberg R P 831 8 0 0 2 3 2 2 0 0 2 2 1 2 0 0 0 1 0 0 928330756 Makumbwi Pri. Northern Soutpansberg R P 449 7 0 0 3 2 0 0 0 0 2 0 1 1 0 0 0 1 0 0 928330923 Patrick Ramaano Sec. Northern Soutpansberg R S 1,656 36 0 3 1 3 3 3 1 4 2 0 1 2 1 1 0 1 2 0 930320100 Manamani Pri. Northern Vuwani R P 638 5 0 1 2 2 0 0 0 0 2 0 1 0 0 0 0 1 0 0 930351531 Tshivhase Sec. Northern Thohoyandou R S 1,690 30 0 4 2 3 3 3 3 3 3 3 1 2 2 1 2 1 2 2 930360955 Mpandeli Sec. Northern Malamulele R S 1,229 20 0 0 2 3 3 3 0 0 3 0 1 2 0 0 0 1 0 0 930361125 Mmbofheni Pri. Northern Malamulele R P 415 4 0 0 2 2 0 0 0 0 2 0 1 2 2 2 2 1 2 2 931331186 Djunane Pri. Northern Soutpansberg R P 1,195 16 0 0 1 3 3 3 0 3 2 3 1 1 1 2 2 2 2 2 991102100 Kgatelopele Pri. Western Mahwelereng R P 1,035 8 0 0 1 5 0 0 0 0 1 0 4 2 1 0 0 0 0 1
Total: 34,485 510 12 35

51
Drinking Water Supply. Field 1514 records the availability of drinking water in
school. Thus, value of “1” means that water is “indoors (piped)”; “2” implies that water
is “onsite (piped not indoors)”; “3” refers to “onsite (delivered)”; and “4” corresponds
to “communal tap”; “5” means that a water source is within a “walking distance” from
school; “6” means no water supply, and “7” is reserved for “other” supply options.
Sanitation Situation. The availability of the following sanitation facilities are reported:
flush system to main sewer (field 15151); flush system to septic tank (field 15152);
ventilated improved pit (field 15153); pit latrine (field 15154); bucket system (field
15155); and no sanitation facilities (field 15153). For each of these fields, “1” means
“yes” and “2” stands for “no” answer.
B.2.2 Sample Characteristics Table B-1 contains two data fields that are not directly specified in the EMIS database.
The first is the location of school within an urban or rural area. If a school is placed in
an urban area then “U” is assigned while for a rural school “R” is stated. Secondly, the
type of a school as being defined either primary or secondary. A primary school is
marked as “P” while a secondary is recorded as “S”. Table A-1 showed that there are 6
urban and 34 rural schools in the sample. In terms of type, there are 23 primary schools
and the remaining 17 are secondary. Table A-2 summarizes the sample content both by
location and type of school.
Table B-2. Sample Crachteristics.
Urban Rural
Primary 3 (8%) 20 (50%) 58% Secondary 3 (8%) 14 (35%) 43%
15% 85% 100%
B.2.3 Parameters The spreadsheet accompanying this annex has a “parameter panel” where all model
parameters are grouped together for the convenience of adjusting any of the variables,
if needed. This section describes these parameters.

52
Class Size. The national norm for a primary class is 40 learners per class, while
secondary level classes should target an audience of 35 learners. A substantial excess of
learners over a prolonged period often results in reduction of the quality of lectures.
Construction Costs. The construction of school buildings has been standardized and
its smallest block is a 4-classroom structure that currently costs R 420,000. Due to the
tendering mechanism of construction, the actual cost may be slightly lower than the
budgeted amount, and the local practice has been to spend any reminder of the R
420,000 on the improvement of other infrastructure facilities, typically toilets and
fences of the school where a new class-block is being erected. It is expected that the
cost of the standardized class-block will be adjusted upward by the end of year 2004
but it should not exceed R 420,000. For the purposes of analysis, we can take year 2004
as the base year and assume that the real construction costs will not change over the
time of analysis and will remain at the same level of R 420,000. If the total cost of a
standard block is evenly spread over its 4 rooms, then the construction costs of a single
class-room should be R 105,000. This figure will serve as a benchmark for
rehabilitation decisions.
Condition of Class-Rooms. The condition of the class-rooms follows the same system
as used in the Annual School Survey, and only the first two conditions are considered
for rehabilitation decisions.24 It is expected that a building in condition “1” will serve,
on the average, 1 additional year, while a building in condition “2” will be useful, on
the average, for 4 additional years.25
24 The use of condition indicator corresponds to the classification system used in the “Annual Survey
for Ordinary Schools (2004)”, Department of Education, Limpopo Provincial Government, Polokwane, South Africa. Thus, “1” refers as very weak condition, not suitable for education; “2” is weak and structure needs attention; “3” needs paint and minor repair; “4” is in good condition; “5” is a new structure; and “6” currently being upgraded.
25 These two assumptions were derived from consultation with the Section of the Department of Public Works responsible for the schools infrastructure. A further research might be needed to refine these expectations of building life duration.

53
Discount Rate. The relevant discount rate is the economic opportunity cost of capital
(EOCK) for South Africa, estimated as 11.0%.26
PV of Future Construction Costs. The present value (PV) of construction costs in the
future is obviously lower than the construction costs today.27 Therefore, an effort
should be made to discount the future construction costs to their current equivalent. The
relevant timeframe for discounting is the time when a replacement for the existing
damaged building will be needed. Since we assumed that the real construction costs
remain constant, a damaged building in condition “1” will stand one more year after
which a replacement will be needed at a cost of R 420,000, measured in real terms. An
equivalent of the future cost is its present value discounted by the EOCK, which will be
R 378,400 (=R 420,000 / [(1+11.0%)^ 1 year]). The equivalent of the replacement cost in
4 years, corresponding to condition “2”, is the value of R 276,700 (=R 420,000 /
[(1+11.0%)^ 4 years]).
Often, the damaged areas of schools buildings comprise not the whole buildings but
rather separate class-rooms. To facilitate the rehabilitation selection taking into account
class-rooms, rather than whole class-blocks, a benchmark value is needed to compare
the current rehabilitation costs of a single class-room with its future replacement cost.
Since, there are 4 rooms in each standard class-block, the present value of a class-room
replacement cost in 1 year is R 94,600 (=R 378,400 / 4 rooms), and in 4 years is equal
to R 69,200 (=R 276,700 / 4 rooms).
B.2.4 Priorities and Weights A number of factors have been identified in Section 2.2.2 of this handbook as being
important for infrastructure decisions. Following the same method explained in Chapter
26 The theoretical arguments have been developed by Harberger, A.C., “On Measuring the Social
Opportunity Cost of Public Funds”, in Project Evaluation – Collected Papers, (Chicago: the University of Chicago, 1972); Sandmo, H. and Dreze, J.H, “Discount Rates for Public Investment in Closed and Open Economies”, Economica, (November 1971); and Sjaastad, L.A. and Wisecarver, D.L., “The Social Cost of Public Fund”, Journal of Political Economy, (June 1977).
27 Since an amount of 1 rand now will, if invested, grow to (1+r) a year hence, it follows that an amount B next year will have a present value of B/(1+r). Similarly, since an investment of 1 rand now will grow to (1+r)n in n years, it follows that an amount B to be received in n years in the future will have a present value of B/(1+r)n. The greater the rate of discount, r, used and the further in the future the date when an amount is to be realized, the smaller is its present value. Thus, R100 received 50 years from now has a value of only R0.85 today at a discount rate of 10%.

54
2, a system of weights has been devised to compare the different characteristics of
schools applying for additional infrastructure funding. The most important indicators
for additional infrastructure are the class-blocks backlog and the excess of learners in
class-room over the national normative size. Following the discussion of these
indicators in Section 2.2.3, a weight of 0.70 is assigned to the identified class-blocks
backlog, and weight of 0.3 is given to the reported excess of learners in class-room over
the national normative size.
Table B-3 summarizes the weights assigned to the other important factors according to
their discussion in Section 2.2.3. A secondary school located in an urban area with all
basic facilities present and with no infrastructure backlog will be ranked as having the
lowest need. An “augmenting score” of such school will be close to zero, and the
resulting “augmenting adjustment” factor will approach the value of 1.00. An unlikely
combination of an urban secondary school with all support facilities and located in an
area that will face a population outflow, will be assigned an “adjustment factor” of 0.60
when the population migration score of -0.40 is taken into consideration.
Table B-3. Priority Weights.
1. Type of School. Primary (P=0.25) or Secondary (S=0) 0.25
2. Support Facilities. Max: 0.25 Water (N=0.08) or (Yes=0) 0.08 Toilets (N=0.08) or (Yes=0) 0.08 Electricity (N=0.04) or (Yes=0) 0.04 Fences (N=0.02) or (Yes=0) 0.02 Library (N=0.01) or (Yes=0) 0.01 Labs
Primary (N=0.01) or (Yes=0) 0.01 Secondary (N=0.02) or (Yes=0) 0.02
3. Location of School. Rural (R=0.20) or Urban (U=0) 0.20
4. Development Factors. Expected Population Decline (N=0) or (Yes: -0.40 to 0) Min: -0.40 Other Factors (N=0) or (Yes: 0 to 0.05) Max: 0.05
Maximum Weight of Augmenting Factors 0.75 Maximum Possible Augmenting Adjustment 1.75
A rural primary school with currently overcrowded classes, large class-room backlog
and without any basic facilities, will score the maximum points both in terms of its
55
“infrastructure adequacy” and “augmenting factors”. The “augmenting score” will be
close to its maximum of 0.75, and the resulting “augmenting adjustment” factor will
approach the value of 1.75.
B.3 Estimation of School Priority Index and Ranking B.3.1 Infrastructure Adequacy
Table B-4 presents the estimation of the infrastructure adequacy score for the selected
40 provincial schools. As discussed in Section 2.2.2, the score is based on two
verifiable factors: the class-blocks backlog and the excess of learners in class-room
over the national normative size.
Learner-to-Classroom Ratio. This ratio is computed as a ratio of the school
enrollment (field 123) divided by a sum of all available class-rooms (field 15231):
permanent; prefabs (which also include mobile classes); and all other (located outside
of school premises). For example, Motsheudi Secondary School (#901340425) has, on
the average, a ratio of 77.9 learners per class-room (= 1,013 learners / [12 Perm
Classrooms + 0 Prefabs + 1 Other Rooms]).
Class-blocks Backlog. The backlog is estimated as a number of additional buildings,
measured by a standard 4-class block, required at a particular school in order to
maintain the maximum acceptable class size. For primary schools, the target class size
is 40 learners, and for secondary the size is set at 35 learners per class-room. Thus, if
Motsheudi Secondary School has 1,013 learners and only 13 class-rooms are currently
available, the backlog is equal to 16 class-rooms (= [1,013 learners – (13 class-rooms *
40 learners)] / 40 learners-per-classroom), or 4.0 class-blocks. Schools with the average
occupancy below the national norms appear as having zero backlogs, indicating that no
additional infrastructure is currently required. The management of the Department may
alternatively consider removing such schools from the priority list at this stage because
such sites will get lowest ranking consequently.

56
Table B-4. Estimation of Infrastructure Adequacy Scores.
EMIS# School Learner-to-Classroom Ratio
A. Class-blocks Backlog (weight=0.7)
B. Learner-to-Classroom Ratio/Target Size (weight=0.3) Score A: Score B: Total Infrastructure
Adequacy Score (A + B): Infrastructure Adequacy
Ranking:
901340425 Motsheudi Sec. 77.9 4.0 2.2 2.79 0.67 3.46 7 901420031 Bollanto Pri. 27.8 0.0 0.7 0.00 0.21 0.21 38 904220101 Capricorn High 23.0 0.0 0.6 0.00 0.17 0.17 40 904220415 Laerskool Pietersburg Noord 23.8 0.0 0.7 0.00 0.20 0.20 39 904221326 Pietersburg E M Pri. 31.5 0.0 0.9 0.00 0.27 0.27 37 907130642 Lekkerbreek Pri. 102.3 1.6 2.6 1.09 0.77 1.86 28 911360252 Matiyani Pri. 94.0 3.4 2.4 2.36 0.71 3.07 12 914450056 Bhejani Pri. 75.3 5.2 2.2 3.63 0.65 4.27 2 915530341 Vasasele Sec. 64.5 3.2 1.8 2.21 0.55 2.76 16 917420703 Shiphamele Pri. 67.9 4.0 1.9 2.80 0.58 3.38 8 918510651 Modubatse Sec. 82.3 4.8 2.1 3.33 0.62 3.95 4 918510699 Mokope Senior Sec. 71.7 2.2 1.8 1.53 0.54 2.06 25 918511029 Metsi A- Phepha Pri. 125.0 1.9 3.6 1.35 1.07 2.42 21 918511463 Tlhapedi Pri. 90.1 3.4 2.3 2.41 0.68 3.09 11 920211725 Selaelo Pri. 82.7 0.8 2.1 0.56 0.62 1.18 34 922220873 Mmanare Sec. 48.5 1.4 1.4 1.01 0.42 1.43 32 922221135 Napo Pri. 101.8 1.9 2.5 1.35 0.76 2.12 24 923240419 Makgalapane Pri. 62.8 0.8 1.8 0.56 0.54 1.09 35 923241054 Mountainveiw Sernior Sec. 66.4 2.5 1.7 1.73 0.50 2.23 23 923260628 Mamaolo Pri. 58.3 3.0 1.7 2.10 0.50 2.60 19 924650115 Mamphokgo Pri. 83.4 3.5 2.1 2.47 0.63 3.09 10 924651262 Phokanoka High 56.0 1.7 1.4 1.19 0.42 1.61 30 924661528 Ngwanamatlang Sec. 100.6 3.8 2.9 2.63 0.86 3.49 6 925630685 Tshililo Sec. 115.7 1.4 2.9 0.99 0.87 1.86 27 925660495 Malegale Pri. 59.3 4.5 1.7 3.16 0.51 3.67 5 925661160 Sebase Sec. 50.9 0.6 1.3 0.43 0.38 0.81 36 925661245 Serageng Pri. 103.0 1.2 2.6 0.83 0.77 1.60 31 926540379 Rakgolokwana Sec. 71.0 3.1 1.8 2.17 0.53 2.70 17 926540683 Lorraine Banareng Pri. 102.0 5.7 2.9 4.02 0.87 4.89 1 927430229 Hloala Chiloane Pri. 100.7 2.3 2.5 1.59 0.76 2.35 22 927451004 Tamajane Senior Sec. 88.4 2.7 2.5 1.87 0.76 2.63 18 928330206 Mutuwafhethu Pri. 103.9 3.2 2.6 2.24 0.78 3.01 13 928330756 Makumbwi Pri. 64.1 1.1 1.6 0.74 0.48 1.22 33 928330923 Patrick Ramaano Sec. 42.5 2.1 1.2 1.46 0.36 1.82 29 930320100 Manamani Pri. 106.3 2.5 2.7 1.74 0.80 2.54 20 930351531 Tshivhase Sec. 49.7 3.6 1.4 2.50 0.43 2.93 15 930360955 Mpandeli Sec. 61.5 3.8 1.8 2.65 0.53 3.17 9 930361125 Mmbofheni Pri. 103.8 1.6 2.6 1.12 0.78 1.89 26 931331186 Djunane Pri. 74.7 3.5 1.9 2.43 0.56 2.99 14 991102100 Kgatelopele Pri. 129.4 4.5 3.2 3.13 0.97 4.10 3 Total: 100.2 Average: 2.00

57
Learner-to-Classroom / Target Class Size Ratio. This ratio is computed as the
average learner-to-classroom indicator at a particular school being divided by the target
size of the class audience for this type of school. For instance, the same Motsheudi
Secondary School with 1,013 learners and 13 class-rooms currently available is 2.2
times above the target size of for secondary schools (= 77.9 learners per class-room / 40
learners per class-room).
Infrastructure Adequacy Score. This score is estimated as the absolute number of
backlogs multiplied by an assigned weight of 0.7 (Score A), plus the product of the
excess learners-to-classroom ratio multiplied by a weight of 0.3 (Score B). For
example, the backlog score for Motsheudi Secondary School is equal to 2.79, which is
the product of 4.0 class-block times the assigned weight. The excess learners-to-
classroom score for the same school is equal to 0.67, which is found as the excess
learners-to-classroom ratio of 2.2 multiplied by the weight of 0.3. Therefore, the
composite infrastructure adequacy score is the summation of the two weighted scores,
equal to 3.46 (= 2.79 + 0.67).
Infrastructure Adequacy Ranking. The highest infrastructure adequacy score of 4.89
is recorded for Lorraine Banareng Primary School (#926540683). This school has the
largest backlog of additional class-blocks of 5.7. While the excess ratio of Lorraine
Banareng Primary School (2.9) is not as high as in Metsi A-Phepha Primary School
(#918511029) having an excess ratio of 3.6, the highest in the sample, the Lorraine
Banareng Primary School has much larger enrollment and higher backlog. Table B-1
confirms these observations. Hence, Lorraine Banareng Primary School ranks first,
Bhejani Primary School (#914450056) ranks second, and Kgatelopele Primary School
(#991102100) ranks third.
The lowest infrastructure adequacy score of 0.17 is recorded for Capricorn High School
(#904220101), which does not have any backlog and has the lowest learner-to-
classroom ratio in the sample. This school is ranked at the very bottom of the list. There
are three more schools that have no backlogs and their learner-to-classroom ratios are
lower than the national requirement. Thus, Laerskool Pietersburg Noord School
(#904220415) ranks 39th, Bollanto Primary School (#901420031) ranks 38th, and
58
Pietersburg E M Primary School (#904221326) ranks 37th. While their score A is equal
to zero, the difference between actual learner-to-classroom ratios places them on
different steps of rank listing.
B.3.2 Augmenting Factors
Section 2.2.2 described that in addition to looking after the infrastructure adequacy, the
decision-making process also takes into consideration a set of factors deemed to be
important. These factors have been grouped into three categories: type of school,
presence of support facilities, location of the school, and development priority factors.
Each of the factors has been assigned an augmenting weight that will enhance the
infrastructure adequacy score if a certain condition is satisfied. Table B-5 presents the
estimation of the augmenting score and augmenting adjustment factors for the selected
40 provincial schools.
Type of School. According to school information in Table B-1 and to the statement of
priority weights in Table B-3, any primary school gets a score of 0.25 while all
secondary schools receive zero additional points.
Basic Facilities. The availability of the basic support facilities such as toilets, water
supply, fences, electricity, library, and laboratories at each school has been stated in
Table B-1 and the weights assigned to these factors are presented in Table B-3. In cases
when basic facilities are currently unavailable, the school receives additional for each
facility missing. In cases when some or all basic facilities are already in place, the
school does not score additional points.
Water. In terms of water supply, the augmenting score is linked to field 1514 of
the EMIS database. As already mentioned, this field may contain an integer
value from 1 to 7. Only first three are considered as acceptable level of water
supply in school: “1” means that water is “indoors (piped)”; “2” implies that
water is “onsite (piped not indoors)”; “3” refers to “onsite (delivered)”.

59
Table B-5. Estimation of Augmenting Adjustment Factors.
EMIS# School Type of School Basic Facilities Location Development Factors
Primary (P) / Secondary (S) Water Toilets Electricity Fences Library Labs Rural (R) /
Urban (U) Expected Population
Decline Other
Factors
Augmenting Score:
Augmenting Adjustment:
901340425 Motsheudi Sec. 0.00 0.00 0.08 0.00 0.02 0.01 0.02 0.20 0.00 0.00 0.33 1.33 901420031 Bollanto Pri. 0.25 0.00 0.00 0.00 0.00 0.01 0.01 0.20 0.00 0.00 0.47 1.47 904220101 Capricorn High 0.25 0.00 0.00 0.00 0.00 0.00 0.00 0.00 0.00 0.00 0.25 1.25 904220415 Laerskool Pietersburg Noord 0.00 0.00 0.00 0.00 0.02 0.00 0.00 0.00 0.00 0.00 0.02 1.02 904221326 Pietersburg E M Pri. 0.00 0.00 0.00 0.00 0.00 0.00 0.00 0.00 0.00 0.00 0.00 1.00 907130642 Lekkerbreek Pri. 0.25 0.08 0.08 0.04 0.02 0.01 0.01 0.00 0.00 0.00 0.49 1.49 911360252 Matiyani Pri. 0.25 0.00 0.08 0.00 0.00 0.01 0.01 0.20 0.00 0.00 0.55 1.55 914450056 Bhejani Pri. 0.00 0.00 0.00 0.04 0.02 0.01 0.02 0.20 0.00 0.00 0.29 1.29 915530341 Vasasele Sec. 0.00 0.00 0.00 0.04 0.00 0.01 0.02 0.20 0.00 0.00 0.27 1.27 917420703 Shiphamele Pri. 0.00 0.08 0.08 0.00 0.02 0.01 0.02 0.20 0.00 0.00 0.41 1.41 918510651 Modubatse Sec. 0.25 0.00 0.00 0.00 0.02 0.01 0.01 0.20 0.00 0.00 0.49 1.49 918510699 Mokope Senior Sec. 0.25 0.00 0.08 0.00 0.00 0.01 0.01 0.00 0.00 0.00 0.35 1.35 918511029 Metsi A- Phepha Pri. 0.00 0.00 0.08 0.00 0.02 0.00 0.02 0.00 0.00 0.00 0.12 1.12 918511463 Tlhapedi Pri. 0.25 0.08 0.08 0.00 0.00 0.01 0.01 0.20 0.00 0.00 0.63 1.63 920211725 Selaelo Pri. 0.25 0.00 0.00 0.04 0.00 0.01 0.01 0.20 0.00 0.00 0.51 1.51 922220873 Mmanare Sec. 0.00 0.08 0.08 0.00 0.00 0.00 0.00 0.20 0.00 0.00 0.36 1.36 922221135 Napo Pri. 0.25 0.08 0.08 0.00 0.00 0.01 0.01 0.20 0.00 0.00 0.63 1.63 923240419 Makgalapane Pri. 0.00 0.08 0.08 0.00 0.02 0.01 0.02 0.20 0.00 0.00 0.41 1.41 923241054 Mountainveiw Sernior Sec. 0.25 0.00 0.00 0.00 0.02 0.01 0.01 0.20 0.00 0.00 0.49 1.49 923260628 Mamaolo Pri. 0.00 0.00 0.08 0.00 0.02 0.01 0.02 0.20 0.00 0.00 0.33 1.33 924650115 Mamphokgo Pri. 0.25 0.00 0.08 0.04 0.02 0.01 0.01 0.20 0.00 0.00 0.61 1.61 924651262 Phokanoka High 0.25 0.08 0.08 0.04 0.02 0.01 0.01 0.20 0.00 0.00 0.69 1.69 924661528 Ngwanamatlang Sec. 0.00 0.00 0.08 0.00 0.00 0.01 0.02 0.20 0.00 0.00 0.31 1.31 925630685 Tshililo Sec. 0.25 0.08 0.08 0.04 0.02 0.01 0.01 0.20 0.00 0.00 0.69 1.69 925660495 Malegale Pri. 0.00 0.08 0.08 0.04 0.00 0.01 0.02 0.20 0.00 0.00 0.43 1.43 925661160 Sebase Sec. 0.25 0.08 0.08 0.00 0.02 0.00 0.00 0.20 0.00 0.00 0.63 1.63 925661245 Serageng Pri. 0.25 0.00 0.08 0.00 0.00 0.01 0.01 0.20 0.00 0.00 0.55 1.55 926540379 Rakgolokwana Sec. 0.25 0.00 0.08 0.00 0.00 0.00 0.00 0.20 0.00 0.00 0.53 1.53 926540683 Lorraine Banareng Pri. 0.00 0.00 0.08 0.00 0.02 0.01 0.02 0.20 0.00 0.00 0.33 1.33 927430229 Hloala Chiloane Pri. 0.25 0.08 0.08 0.04 0.02 0.00 0.00 0.20 0.00 0.00 0.67 1.67 927451004 Tamajane Senior Sec. 0.00 0.08 0.00 0.00 0.02 0.00 0.00 0.20 0.00 0.00 0.30 1.30 928330206 Mutuwafhethu Pri. 0.25 0.00 0.08 0.00 0.02 0.01 0.01 0.20 0.00 0.00 0.57 1.57 928330756 Makumbwi Pri. 0.25 0.00 0.08 0.00 0.02 0.01 0.01 0.20 0.00 0.00 0.57 1.57 928330923 Patrick Ramaano Sec. 0.00 0.00 0.00 0.00 0.00 0.00 0.00 0.20 0.00 0.00 0.20 1.20 930320100 Manamani Pri. 0.25 0.08 0.08 0.00 0.02 0.01 0.01 0.20 0.00 0.00 0.65 1.65 930351531 Tshivhase Sec. 0.00 0.00 0.00 0.00 0.02 0.00 0.00 0.20 0.00 0.00 0.22 1.22 930360955 Mpandeli Sec. 0.00 0.00 0.08 0.00 0.02 0.01 0.02 0.20 0.00 0.00 0.33 1.33 930361125 Mmbofheni Pri. 0.25 0.00 0.08 0.00 0.02 0.01 0.01 0.20 0.00 0.00 0.57 1.57 931331186 Djunane Pri. 0.25 0.00 0.00 0.00 0.00 0.00 0.01 0.20 0.00 0.00 0.46 1.46 991102100 Kgatelopele Pri. 0.25 0.00 0.00 0.04 0.00 0.01 0.01 0.20 0.00 0.00 0.51 1.51
60
Hence, if school has one of these three supply systems, the school does not
receive additional augmenting points. A school receives additional 0.08 points
in case that it has either: “4” corresponds to “communal tap”; or “5” means that
a water source is within a “walking distance” from school; or “6” means no
water supply, or “7” meaning “other” supply options.
Toilets. Augmenting score for toilets is liked to fields 15151-15156 of the EMIS
database. These fields may contain either “1” or “2” corresponding to “yes” or
“no” answer to the presence of a particular type of sanitation system. Only first
three are sanitation systems are considered as acceptable level of sanitation:
sanitation-flush (field 15151), sanitation-septic tank (field 15152), sanitation-
improved ventilated pit (field 15153). Hence, if school has one of these three
sanitation systems, the school does not receive additional augmenting points. A
school receives additional 0.08 points in case that it has either: pit latrine (field
15154); or bucket system (field 15155); or no sanitation facilities (field 15153)..
Electricity. In terms of water supply, the augmenting score is linked to field
1513 of the EMIS database. This field may contain an integer value from 1 to 4.
Only first three are considered as acceptable level of electricity supply in
school: “1” means that the school is “wired and supplied by ESKOM”; “2”
implies that power is “self-generated using generators”; and “3” refers to “solar
panels”. Hence, if school has one of these three supply systems, the school does
not receive additional augmenting points. A school receives additional 0.04
points in case that it has no power supply as indicated by value “4” in the
database.
Fences. The augmenting score is linked to field 154 of the EMIS database. This
field may contain an integer value from 1 to 3. Only first one is considered as
acceptable fence for a school: “1” means is in a “good condition”, and if school
has such a fence, this school does not receive additional augmenting points. A
school receives additional 0.02 points in case that it has: “2” bad condition of
the fence; or “3” no fence.
61
Library. Library’s augmenting score is linked to field 15125 of the EMIS
database. This field may contain an integer value from 1 to 6. If school has a
library in any condition this school does not receive additional augmenting
points. A school receives additional 0.01 points only in case it does not have a
library, i.e. the data value is “0” or missing.
Laboratory. It is more important for secondary schools to have a functional
laboratory than for primary schools. The augmenting score is linked to field
15124 of the EMIS database. This field may contain an integer value from 1 to
6. If school has a laboratory in any condition this school does not receive
additional augmenting points. In case that a school does not have a laboratory,
i.e. the data value is “0” or missing, the school receives additional either 0.01
points if it is primary type, or 0.02 points if it is secondary school.
School Location. A rural school receives an additional 0.20 points while an urban
school does not receive any extra points. Since the Department has opted to focus its
infrastructure delivery on rural regions, and past two budgets were almost entirely spent
on rural schools, an alternative way could be to temporarily exclude all urban schools
from priority list. Once funds become available, urban schools can be included in the
common pool of new infrastructure applications.
Development Factors. There are two factors placed in this category: expected
population decline and other factors. Obviously, both require some intelligent
interference in order to assign any value. For the expected population decline, the score
could take any value between -0.40 to 0, depending on the magnitude of expected
migration. Other unforeseen now factors can be also brought into the infrastructure
selection process and a provision is made for an additional score of 0.05. If the
importance of new factors deems to be very high, this weight could be raised to a
reasonable degree.
B.3.3 Augmenting Score and Adjustment factor Once all factors for a school are accounted for, the resulting total score can be derived
as a summation of scores obtained. For example, Motsheudi Secondary School
(#901340425), located in a rural area, currently has fences, water and electricity supply

62
but does not have toilets, library and labs. No development factors are identified.
Therefore, its augmenting score will be calculated as:
1. Type of School: Secondary = 0 2. Support Facilities:
Water = 0 Toilets = 0.08 Electricity = 0 Fences = 0.02 Library = 0.01 Labs, Secondary = 0.02
3. Location of School: Rural = 0.20 4. Development Factors.
Expected Population Decline = 0 Other Factors = 0
Total Augmenting Score: = 0.33 Augmenting Adjustment Factor: = 1.33
The augmenting adjustment factor is equal to one plus the computed augmenting score.
This factor will be multiplied by the infrastructure adequacy score, estimated in Section
B.3.2, to derive the school priority index.
B.3.4 School Priority Index and Ranking Finally, the PI index can be estimated for every school using the infrastructure
adequacy scores in Table B-4 and corresponding augmenting adjustment factors from
Table B-5. The priority index is computed as a product of the two, and the resulting PI
values for the selected 40 schools is shown in Table B-6.
As anticipated, the existence of augmenting factors has shifted some of the schools in
terms of priority ranking. The top ranking still remains unchallenged as Lorraine
Banareng Primary School (#926540683) has the highest PI of 6.51, largely explained
by its high infrastructure adequacy score. The second top ranking has changed hands
from Bhejani Primary School (#914450056) to Kgatelopele Primary School
(#991102100), which was initially ranked third. Consequently, other rural primary
schools with low level of basic facilities have also advanced in terms of their priority
for new infrastructure.

63
Table B-6. Estimation of Priority Index and School Ranking.
EMIS# School Total
Infrastructure Adequacy Score:
Infrastructure Adequacy Ranking:
Augmenting Adjustment:
Priority Index: Ranking:
901340425 Motsheudi Sec. 3.46 7 1.33 4.60 11 901420031 Bollanto Pri. 0.21 38 1.47 0.31 37 904220101 Capricorn High 0.17 40 1.25 0.22 39 904220415 Laerskool Pietersburg Noord 0.20 39 1.02 0.21 40 904221326 Pietersburg E M Pri. 0.27 37 1.00 0.27 38 907130642 Lekkerbreek Pri. 1.86 28 1.49 2.77 27 911360252 Matiyani Pri. 3.07 12 1.55 4.75 9 914450056 Bhejani Pri. 4.27 2 1.29 5.51 4 915530341 Vasasele Sec. 2.76 16 1.27 3.51 19 917420703 Shiphamele Pri. 3.38 8 1.41 4.77 8 918510651 Modubatse Sec. 3.95 4 1.49 5.89 3 918510699 Mokope Senior Sec. 2.06 25 1.35 2.79 26 918511029 Metsi A- Phepha Pri. 2.42 21 1.12 2.71 29 918511463 Tlhapedi Pri. 3.09 11 1.63 5.03 6 920211725 Selaelo Pri. 1.18 34 1.51 1.78 34 922220873 Mmanare Sec. 1.43 32 1.36 1.94 32 922221135 Napo Pri. 2.12 24 1.63 3.45 21 923240419 Makgalapane Pri. 1.09 35 1.41 1.54 35 923241054 Mountainveiw Sernior Sec. 2.23 23 1.49 3.32 23 923260628 Mamaolo Pri. 2.60 19 1.33 3.46 20 924650115 Mamphokgo Pri. 3.09 10 1.61 4.98 7 924651262 Phokanoka High 1.61 30 1.69 2.72 28 924661528 Ngwanamatlang Sec. 3.49 6 1.31 4.57 12 925630685 Tshililo Sec. 1.86 27 1.69 3.14 24 925660495 Malegale Pri. 3.67 5 1.43 5.25 5 925661160 Sebase Sec. 0.81 36 1.63 1.32 36 925661245 Serageng Pri. 1.60 31 1.55 2.48 30 926540379 Rakgolokwana Sec. 2.70 17 1.53 4.13 16 926540683 Lorraine Banareng Pri. 4.89 1 1.33 6.51 1 927430229 Hloala Chiloane Pri. 2.35 22 1.67 3.92 17 927451004 Tamajane Senior Sec. 2.63 18 1.30 3.42 22 928330206 Mutuwafhethu Pri. 3.01 13 1.57 4.73 10 928330756 Makumbwi Pri. 1.22 33 1.57 1.92 33 928330923 Patrick Ramaano Sec. 1.82 29 1.20 2.18 31 930320100 Manamani Pri. 2.54 20 1.65 4.19 15 930351531 Tshivhase Sec. 2.93 15 1.22 3.57 18 930360955 Mpandeli Sec. 3.17 9 1.33 4.22 14 930361125 Mmbofheni Pri. 1.89 26 1.57 2.97 25 931331186 Djunane Pri. 2.99 14 1.46 4.36 13 991102100 Kgatelopele Pri. 4.10 3 1.51 6.19 2
The lowest PI index of 0.21 is recorded for Laerskool Pietersburg Noord School
(#904220415), which was initially at the 39th place. Note that Capricorn High School
(#904220101) now occupies that rank. Also, Pietersburg E M Primary School
(#904221326) now ranks 38th, and Bollanto Primary School (#901420031) ranks 37th.

64
B.4 Allocation of Budget for New Class-rooms
B.4.1 The Mechanism
As discussed in Section 2.3, the overall effectiveness of budget spending is maximized
when the funds are forwarded to schools with the highest ranking. Let’s continue with
the sample of 40 provincial schools and illustrate how a limited budget in a particular
year should be allocated among the schools in the most efficient manner. In the present
situation, the total backlog for all 40 schools is 100.2 standard blocks, or 401 additional
class-rooms, as could be seen from the schools’ backlog data in Table B-4. Suppose
that the capital budget for the current period is only R 8.4 million, which translates into
20 new class-blocks, since each costs R 420,000 to construct. The issue is now to
decide which school should be given the funding and for how many new blocks at each
selected location.
The right approach is to the allocation is to award each additional class-block to the
school ranking first in terms of the priority index. Because each additional building will
alter the current priority index and ranking of schools, the ranking must be recalculated
after each new addition of class-rooms or support facilities, or changes in the type of
school or in the development priority factors. Table B-7 illustrates this iterative
allocation process for 10 blocks.
Recently, there has been a lot of priority placed on upholding the minimum sanitation
norms in provincial schools, and it is assumed that each newly constructed building has
the appropriate toilets. Thus, if a school initially didn’t have any sanitation facilities,
the first constructed class-block brings about an improvement in respect to sanitation
too. All other augmentation factors are assumed to remain constant, while in reality this
need not to be true as new construction may improve some of the backlogs in the other
support facilities.
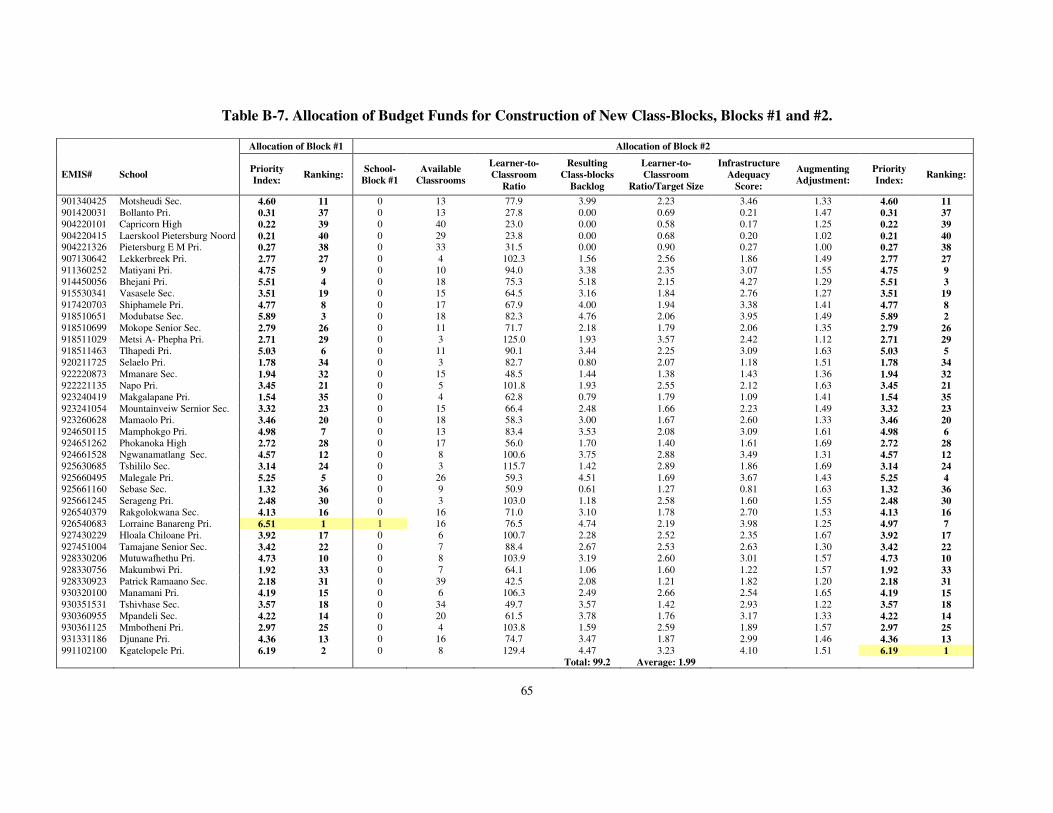
65
Table B-7. Allocation of Budget Funds for Construction of New Class-Blocks, Blocks #1 and #2.
Allocation of Block #1 Allocation of Block #2
EMIS# School Priority Index: Ranking: School-
Block #1 Available
Classrooms
Learner-to-Classroom
Ratio
Resulting Class-blocks
Backlog
Learner-to-Classroom
Ratio/Target Size
Infrastructure Adequacy
Score:
Augmenting Adjustment:
Priority Index: Ranking:
901340425 Motsheudi Sec. 4.60 11 0 13 77.9 3.99 2.23 3.46 1.33 4.60 11 901420031 Bollanto Pri. 0.31 37 0 13 27.8 0.00 0.69 0.21 1.47 0.31 37 904220101 Capricorn High 0.22 39 0 40 23.0 0.00 0.58 0.17 1.25 0.22 39 904220415 Laerskool Pietersburg Noord 0.21 40 0 29 23.8 0.00 0.68 0.20 1.02 0.21 40 904221326 Pietersburg E M Pri. 0.27 38 0 33 31.5 0.00 0.90 0.27 1.00 0.27 38 907130642 Lekkerbreek Pri. 2.77 27 0 4 102.3 1.56 2.56 1.86 1.49 2.77 27 911360252 Matiyani Pri. 4.75 9 0 10 94.0 3.38 2.35 3.07 1.55 4.75 9 914450056 Bhejani Pri. 5.51 4 0 18 75.3 5.18 2.15 4.27 1.29 5.51 3 915530341 Vasasele Sec. 3.51 19 0 15 64.5 3.16 1.84 2.76 1.27 3.51 19 917420703 Shiphamele Pri. 4.77 8 0 17 67.9 4.00 1.94 3.38 1.41 4.77 8 918510651 Modubatse Sec. 5.89 3 0 18 82.3 4.76 2.06 3.95 1.49 5.89 2 918510699 Mokope Senior Sec. 2.79 26 0 11 71.7 2.18 1.79 2.06 1.35 2.79 26 918511029 Metsi A- Phepha Pri. 2.71 29 0 3 125.0 1.93 3.57 2.42 1.12 2.71 29 918511463 Tlhapedi Pri. 5.03 6 0 11 90.1 3.44 2.25 3.09 1.63 5.03 5 920211725 Selaelo Pri. 1.78 34 0 3 82.7 0.80 2.07 1.18 1.51 1.78 34 922220873 Mmanare Sec. 1.94 32 0 15 48.5 1.44 1.38 1.43 1.36 1.94 32 922221135 Napo Pri. 3.45 21 0 5 101.8 1.93 2.55 2.12 1.63 3.45 21 923240419 Makgalapane Pri. 1.54 35 0 4 62.8 0.79 1.79 1.09 1.41 1.54 35 923241054 Mountainveiw Sernior Sec. 3.32 23 0 15 66.4 2.48 1.66 2.23 1.49 3.32 23 923260628 Mamaolo Pri. 3.46 20 0 18 58.3 3.00 1.67 2.60 1.33 3.46 20 924650115 Mamphokgo Pri. 4.98 7 0 13 83.4 3.53 2.08 3.09 1.61 4.98 6 924651262 Phokanoka High 2.72 28 0 17 56.0 1.70 1.40 1.61 1.69 2.72 28 924661528 Ngwanamatlang Sec. 4.57 12 0 8 100.6 3.75 2.88 3.49 1.31 4.57 12 925630685 Tshililo Sec. 3.14 24 0 3 115.7 1.42 2.89 1.86 1.69 3.14 24 925660495 Malegale Pri. 5.25 5 0 26 59.3 4.51 1.69 3.67 1.43 5.25 4 925661160 Sebase Sec. 1.32 36 0 9 50.9 0.61 1.27 0.81 1.63 1.32 36 925661245 Serageng Pri. 2.48 30 0 3 103.0 1.18 2.58 1.60 1.55 2.48 30 926540379 Rakgolokwana Sec. 4.13 16 0 16 71.0 3.10 1.78 2.70 1.53 4.13 16 926540683 Lorraine Banareng Pri. 6.51 1 1 16 76.5 4.74 2.19 3.98 1.25 4.97 7 927430229 Hloala Chiloane Pri. 3.92 17 0 6 100.7 2.28 2.52 2.35 1.67 3.92 17 927451004 Tamajane Senior Sec. 3.42 22 0 7 88.4 2.67 2.53 2.63 1.30 3.42 22 928330206 Mutuwafhethu Pri. 4.73 10 0 8 103.9 3.19 2.60 3.01 1.57 4.73 10 928330756 Makumbwi Pri. 1.92 33 0 7 64.1 1.06 1.60 1.22 1.57 1.92 33 928330923 Patrick Ramaano Sec. 2.18 31 0 39 42.5 2.08 1.21 1.82 1.20 2.18 31 930320100 Manamani Pri. 4.19 15 0 6 106.3 2.49 2.66 2.54 1.65 4.19 15 930351531 Tshivhase Sec. 3.57 18 0 34 49.7 3.57 1.42 2.93 1.22 3.57 18 930360955 Mpandeli Sec. 4.22 14 0 20 61.5 3.78 1.76 3.17 1.33 4.22 14 930361125 Mmbofheni Pri. 2.97 25 0 4 103.8 1.59 2.59 1.89 1.57 2.97 25 931331186 Djunane Pri. 4.36 13 0 16 74.7 3.47 1.87 2.99 1.46 4.36 13 991102100 Kgatelopele Pri. 6.19 2 0 8 129.4 4.47 3.23 4.10 1.51 6.19 1 Total: 99.2 Average: 1.99

66
Table B-7. Allocation of Budget Funds for Construction of New Class-Blocks (Blocks #3 and #4).
Allocation of Block #3 Allocation of Block #4
EMIS# School-Block
#2
Available Classrooms
Learner-to-Classroom
Ratio
Resulting Class-blocks
Backlog
Learner-to-Classroom
Ratio/Target Size
Infrastructure Adequacy
Score:
Augmenting Adjustment:
Priority Index: Ranking:
School-Block
#3
Available Classrooms
Learner-to-Classroom
Ratio
Resulting Class-blocks
Backlog
Learner-to-Classroom
Ratio/Target Size
Infrastructure Adequacy
Score:
Augmenting Adjustment:
Priority Index: Ranking:
901340425 0 13 77.9 3.99 2.23 3.46 1.33 4.60 11 0 13 77.9 3.99 2.23 3.46 1.33 4.60 11 901420031 0 13 27.8 0.00 0.69 0.21 1.47 0.31 37 0 13 27.8 0.00 0.69 0.21 1.47 0.31 37 904220101 0 40 23.0 0.00 0.58 0.17 1.25 0.22 39 0 40 23.0 0.00 0.58 0.17 1.25 0.22 39 904220415 0 29 23.8 0.00 0.68 0.20 1.02 0.21 40 0 29 23.8 0.00 0.68 0.20 1.02 0.21 40 904221326 0 33 31.5 0.00 0.90 0.27 1.00 0.27 38 0 33 31.5 0.00 0.90 0.27 1.00 0.27 38 907130642 0 4 102.3 1.56 2.56 1.86 1.49 2.77 27 0 4 102.3 1.56 2.56 1.86 1.49 2.77 27 911360252 0 10 94.0 3.38 2.35 3.07 1.55 4.75 8 0 10 94.0 3.38 2.35 3.07 1.55 4.75 7 914450056 0 18 75.3 5.18 2.15 4.27 1.29 5.51 2 0 18 75.3 5.18 2.15 4.27 1.29 5.51 1 915530341 0 15 64.5 3.16 1.84 2.76 1.27 3.51 19 0 15 64.5 3.16 1.84 2.76 1.27 3.51 19 917420703 0 17 67.9 4.00 1.94 3.38 1.41 4.77 7 0 17 67.9 4.00 1.94 3.38 1.41 4.77 6 918510651 0 18 82.3 4.76 2.06 3.95 1.49 5.89 1 1 22 67.4 3.76 1.68 3.14 1.49 4.68 9 918510699 0 11 71.7 2.18 1.79 2.06 1.35 2.79 26 0 11 71.7 2.18 1.79 2.06 1.35 2.79 26 918511029 0 3 125.0 1.93 3.57 2.42 1.12 2.71 29 0 3 125.0 1.93 3.57 2.42 1.12 2.71 29 918511463 0 11 90.1 3.44 2.25 3.09 1.63 5.03 4 0 11 90.1 3.44 2.25 3.09 1.63 5.03 3 920211725 0 3 82.7 0.80 2.07 1.18 1.51 1.78 34 0 3 82.7 0.80 2.07 1.18 1.51 1.78 34 922220873 0 15 48.5 1.44 1.38 1.43 1.36 1.94 32 0 15 48.5 1.44 1.38 1.43 1.36 1.94 32 922221135 0 5 101.8 1.93 2.55 2.12 1.63 3.45 21 0 5 101.8 1.93 2.55 2.12 1.63 3.45 21 923240419 0 4 62.8 0.79 1.79 1.09 1.41 1.54 35 0 4 62.8 0.79 1.79 1.09 1.41 1.54 35 923241054 0 15 66.4 2.48 1.66 2.23 1.49 3.32 23 0 15 66.4 2.48 1.66 2.23 1.49 3.32 23 923260628 0 18 58.3 3.00 1.67 2.60 1.33 3.46 20 0 18 58.3 3.00 1.67 2.60 1.33 3.46 20 924650115 0 13 83.4 3.53 2.08 3.09 1.61 4.98 5 0 13 83.4 3.53 2.08 3.09 1.61 4.98 4 924651262 0 17 56.0 1.70 1.40 1.61 1.69 2.72 28 0 17 56.0 1.70 1.40 1.61 1.69 2.72 28 924661528 0 8 100.6 3.75 2.88 3.49 1.31 4.57 12 0 8 100.6 3.75 2.88 3.49 1.31 4.57 12 925630685 0 3 115.7 1.42 2.89 1.86 1.69 3.14 24 0 3 115.7 1.42 2.89 1.86 1.69 3.14 24 925660495 0 26 59.3 4.51 1.69 3.67 1.43 5.25 3 0 26 59.3 4.51 1.69 3.67 1.43 5.25 2 925661160 0 9 50.9 0.61 1.27 0.81 1.63 1.32 36 0 9 50.9 0.61 1.27 0.81 1.63 1.32 36 925661245 0 3 103.0 1.18 2.58 1.60 1.55 2.48 30 0 3 103.0 1.18 2.58 1.60 1.55 2.48 30 926540379 0 16 71.0 3.10 1.78 2.70 1.53 4.13 16 0 16 71.0 3.10 1.78 2.70 1.53 4.13 16 926540683 0 16 76.5 4.74 2.19 3.98 1.25 4.97 6 0 16 76.5 4.74 2.19 3.98 1.25 4.97 5 927430229 0 6 100.7 2.28 2.52 2.35 1.67 3.92 17 0 6 100.7 2.28 2.52 2.35 1.67 3.92 17 927451004 0 7 88.4 2.67 2.53 2.63 1.3 3.42 22 0 7 88.4 2.67 2.53 2.63 1.3 3.42 22 928330206 0 8 103.9 3.19 2.60 3.01 1.57 4.73 9 0 8 103.9 3.19 2.60 3.01 1.57 4.73 8 928330756 0 7 64.1 1.06 1.60 1.22 1.57 1.92 33 0 7 64.1 1.06 1.60 1.22 1.57 1.92 33 928330923 0 39 42.5 2.08 1.21 1.82 1.2 2.18 31 0 39 42.5 2.08 1.21 1.82 1.2 2.18 31 930320100 0 6 106.3 2.49 2.66 2.54 1.65 4.19 15 0 6 106.3 2.49 2.66 2.54 1.65 4.19 15 930351531 0 34 49.7 3.57 1.42 2.93 1.22 3.57 18 0 34 49.7 3.57 1.42 2.93 1.22 3.57 18 930360955 0 20 61.5 3.78 1.76 3.17 1.33 4.22 14 0 20 61.5 3.78 1.76 3.17 1.33 4.22 14 930361125 0 4 103.8 1.59 2.59 1.89 1.57 2.97 25 0 4 103.8 1.59 2.59 1.89 1.57 2.97 25 931331186 0 16 74.7 3.47 1.87 2.99 1.46 4.36 13 0 16 74.7 3.47 1.87 2.99 1.46 4.36 13 991102100 1 12 86.3 3.47 2.16 3.08 1.51 4.64 10 0 12 86.3 3.47 2.16 3.08 1.51 4.64 10
Total: 98.2 Average: 1.96 Total: 97.2 Average: 1.95

67
Table B-7. Allocation of Budget Funds for Construction of New Class-Blocks (Blocks #5 and #6).
Allocation of Block #5 Allocation of Block #6
EMIS# School-Block
#4
Available Classrooms
Learner-to-Classroom
Ratio
Resulting Class-blocks
Backlog
Learner-to-Classroom
Ratio/Target Size
Infrastructure Adequacy
Score:
Augmenting Adjustment:
Priority Index: Ranking:
School-Block
#5
Available Classrooms
Learner-to-Classroom
Ratio
Resulting Class-blocks
Backlog
Learner-to-Classroom
Ratio/Target Size
Infrastructure Adequacy
Score:
Augmenting Adjustment:
Priority Index: Ranking:
901340425 0 13 77.9 3.99 2.23 3.46 1.33 4.60 10 0 13 77.9 3.99 2.23 3.46 1.33 4.60 9 901420031 0 13 27.8 0.00 0.69 0.21 1.47 0.31 37 0 13 27.8 0.00 0.69 0.21 1.47 0.31 37 904220101 0 40 23.0 0.00 0.58 0.17 1.25 0.22 39 0 40 23.0 0.00 0.58 0.17 1.25 0.22 39 904220415 0 29 23.8 0.00 0.68 0.20 1.02 0.21 40 0 29 23.8 0.00 0.68 0.20 1.02 0.21 40 904221326 0 33 31.5 0.00 0.90 0.27 1.00 0.27 38 0 33 31.5 0.00 0.90 0.27 1.00 0.27 38 907130642 0 4 102.3 1.56 2.56 1.86 1.49 2.77 27 0 4 102.3 1.56 2.56 1.86 1.49 2.77 27 911360252 0 10 94.0 3.38 2.35 3.07 1.55 4.75 6 0 10 94.0 3.38 2.35 3.07 1.55 4.75 5 914450056 1 22 61.6 4.18 1.76 3.45 1.29 4.45 12 0 22 61.6 4.18 1.76 3.45 1.29 4.45 11 915530341 0 15 64.5 3.16 1.84 2.76 1.27 3.51 19 0 15 64.5 3.16 1.84 2.76 1.27 3.51 19 917420703 0 17 67.9 4.00 1.94 3.38 1.41 4.77 5 0 17 67.9 4.00 1.94 3.38 1.41 4.77 4 918510651 0 22 67.4 3.76 1.68 3.14 1.49 4.68 8 0 22 67.4 3.76 1.68 3.14 1.49 4.68 7 918510699 0 11 71.7 2.18 1.79 2.06 1.35 2.79 26 0 11 71.7 2.18 1.79 2.06 1.35 2.79 26 918511029 0 3 125.0 1.93 3.57 2.42 1.12 2.71 29 0 3 125.0 1.93 3.57 2.42 1.12 2.71 29 918511463 0 11 90.1 3.44 2.25 3.09 1.63 5.03 2 0 11 90.1 3.44 2.25 3.09 1.63 5.03 1 920211725 0 3 82.7 0.80 2.07 1.18 1.51 1.78 34 0 3 82.7 0.80 2.07 1.18 1.51 1.78 34 922220873 0 15 48.5 1.44 1.38 1.43 1.36 1.94 32 0 15 48.5 1.44 1.38 1.43 1.36 1.94 32 922221135 0 5 101.8 1.93 2.55 2.12 1.63 3.45 21 0 5 101.8 1.93 2.55 2.12 1.63 3.45 21 923240419 0 4 62.8 0.79 1.79 1.09 1.41 1.54 35 0 4 62.8 0.79 1.79 1.09 1.41 1.54 35 923241054 0 15 66.4 2.48 1.66 2.23 1.49 3.32 23 0 15 66.4 2.48 1.66 2.23 1.49 3.32 23 923260628 0 18 58.3 3.00 1.67 2.60 1.33 3.46 20 0 18 58.3 3.00 1.67 2.60 1.33 3.46 20 924650115 0 13 83.4 3.53 2.08 3.09 1.61 4.98 3 0 13 83.4 3.53 2.08 3.09 1.61 4.98 2 924651262 0 17 56.0 1.70 1.40 1.61 1.69 2.72 28 0 17 56.0 1.70 1.40 1.61 1.69 2.72 28 924661528 0 8 100.6 3.75 2.88 3.49 1.31 4.57 11 0 8 100.6 3.75 2.88 3.49 1.31 4.57 10 925630685 0 3 115.7 1.42 2.89 1.86 1.69 3.14 24 0 3 115.7 1.42 2.89 1.86 1.69 3.14 24 925660495 0 26 59.3 4.51 1.69 3.67 1.43 5.25 1 1 30 51.4 3.51 1.47 2.90 1.35 3.92 17 925661160 0 9 50.9 0.61 1.27 0.81 1.63 1.32 36 0 9 50.9 0.61 1.27 0.81 1.63 1.32 36 925661245 0 3 103.0 1.18 2.58 1.60 1.55 2.48 30 0 3 103.0 1.18 2.58 1.60 1.55 2.48 30 926540379 0 16 71.0 3.10 1.78 2.70 1.53 4.13 16 0 16 71.0 3.10 1.78 2.70 1.53 4.13 15 926540683 0 16 76.5 4.74 2.19 3.98 1.25 4.97 4 0 16 76.5 4.74 2.19 3.98 1.25 4.97 3 927430229 0 6 100.7 2.28 2.52 2.35 1.67 3.92 17 0 6 100.7 2.28 2.52 2.35 1.67 3.92 16 927451004 0 7 88.4 2.67 2.53 2.63 1.3 3.42 22 0 7 88.4 2.67 2.53 2.63 1.3 3.42 22 928330206 0 8 103.9 3.19 2.60 3.01 1.57 4.73 7 0 8 103.9 3.19 2.60 3.01 1.57 4.73 6 928330756 0 7 64.1 1.06 1.60 1.22 1.57 1.92 33 0 7 64.1 1.06 1.60 1.22 1.57 1.92 33 928330923 0 39 42.5 2.08 1.21 1.82 1.2 2.18 31 0 39 42.5 2.08 1.21 1.82 1.2 2.18 31 930320100 0 6 106.3 2.49 2.66 2.54 1.65 4.19 15 0 6 106.3 2.49 2.66 2.54 1.65 4.19 14 930351531 0 34 49.7 3.57 1.42 2.93 1.22 3.57 18 0 34 49.7 3.57 1.42 2.93 1.22 3.57 18 930360955 0 20 61.5 3.78 1.76 3.17 1.33 4.22 14 0 20 61.5 3.78 1.76 3.17 1.33 4.22 13 930361125 0 4 103.8 1.59 2.59 1.89 1.57 2.97 25 0 4 103.8 1.59 2.59 1.89 1.57 2.97 25 931331186 0 16 74.7 3.47 1.87 2.99 1.46 4.36 13 0 16 74.7 3.47 1.87 2.99 1.46 4.36 12 991102100 0 12 86.3 3.47 2.16 3.08 1.51 4.64 9 0 12 86.3 3.47 2.16 3.08 1.51 4.64 8
Total: 96.2 Average: 1.94 Total: 95.2 Average: 1.93

68
Table B-7. Allocation of Budget Funds for Construction of New Class-Blocks (Blocks #7 and #8).
Allocation of Block #7 Allocation of Block #8
EMIS# School-Block
#6
Available Classrooms
Learner-to-Classroom
Ratio
Resulting Class-blocks
Backlog
Learner-to-Classroom
Ratio/Target Size
Infrastructure Adequacy
Score:
Augmenting Adjustment:
Priority Index: Ranking:
School-Block
#7
Available Classrooms
Learner-to-Classroom
Ratio
Resulting Class-blocks
Backlog
Learner-to-Classroom
Ratio/Target Size
Infrastructure Adequacy
Score:
Augmenting Adjustment:
Priority Index: Ranking:
901340425 0 13 77.9 3.99 2.23 3.46 1.33 4.60 8 0 13 77.9 3.99 2.23 3.46 1.33 4.60 7 901420031 0 13 27.8 0.00 0.69 0.21 1.47 0.31 37 0 13 27.8 0.00 0.69 0.21 1.47 0.31 37 904220101 0 40 23.0 0.00 0.58 0.17 1.25 0.22 39 0 40 23.0 0.00 0.58 0.17 1.25 0.22 39 904220415 0 29 23.8 0.00 0.68 0.20 1.02 0.21 40 0 29 23.8 0.00 0.68 0.20 1.02 0.21 40 904221326 0 33 31.5 0.00 0.90 0.27 1.00 0.27 38 0 33 31.5 0.00 0.90 0.27 1.00 0.27 38 907130642 0 4 102.3 1.56 2.56 1.86 1.49 2.77 27 0 4 102.3 1.56 2.56 1.86 1.49 2.77 27 911360252 0 10 94.0 3.38 2.35 3.07 1.55 4.75 4 0 10 94.0 3.38 2.35 3.07 1.55 4.75 3 914450056 0 22 61.6 4.18 1.76 3.45 1.29 4.45 10 0 22 61.6 4.18 1.76 3.45 1.29 4.45 9 915530341 0 15 64.5 3.16 1.84 2.76 1.27 3.51 18 0 15 64.5 3.16 1.84 2.76 1.27 3.51 17 917420703 0 17 67.9 4.00 1.94 3.38 1.41 4.77 3 0 17 67.9 4.00 1.94 3.38 1.41 4.77 2 918510651 0 22 67.4 3.76 1.68 3.14 1.49 4.68 6 0 22 67.4 3.76 1.68 3.14 1.49 4.68 5 918510699 0 11 71.7 2.18 1.79 2.06 1.35 2.79 26 0 11 71.7 2.18 1.79 2.06 1.35 2.79 26 918511029 0 3 125.0 1.93 3.57 2.42 1.12 2.71 29 0 3 125.0 1.93 3.57 2.42 1.12 2.71 29 918511463 1 15 66.1 2.44 1.65 2.21 1.55 3.42 21 0 15 66.1 2.44 1.65 2.21 1.55 3.42 21 920211725 0 3 82.7 0.80 2.07 1.18 1.51 1.78 34 0 3 82.7 0.80 2.07 1.18 1.51 1.78 34 922220873 0 15 48.5 1.44 1.38 1.43 1.36 1.94 32 0 15 48.5 1.44 1.38 1.43 1.36 1.94 32 922221135 0 5 101.8 1.93 2.55 2.12 1.63 3.45 20 0 5 101.8 1.93 2.55 2.12 1.63 3.45 19 923240419 0 4 62.8 0.79 1.79 1.09 1.41 1.54 35 0 4 62.8 0.79 1.79 1.09 1.41 1.54 35 923241054 0 15 66.4 2.48 1.66 2.23 1.49 3.32 23 0 15 66.4 2.48 1.66 2.23 1.49 3.32 23 923260628 0 18 58.3 3.00 1.67 2.60 1.33 3.46 19 0 18 58.3 3.00 1.67 2.60 1.33 3.46 18 924650115 0 13 83.4 3.53 2.08 3.09 1.61 4.98 1 1 17 63.8 2.53 1.59 2.25 1.53 3.44 20 924651262 0 17 56.0 1.70 1.40 1.61 1.69 2.72 28 0 17 56.0 1.70 1.40 1.61 1.69 2.72 28 924661528 0 8 100.6 3.75 2.88 3.49 1.31 4.57 9 0 8 100.6 3.75 2.88 3.49 1.31 4.57 8 925630685 0 3 115.7 1.42 2.89 1.86 1.69 3.14 24 0 3 115.7 1.42 2.89 1.86 1.69 3.14 24 925660495 0 30 51.4 3.51 1.47 2.90 1.35 3.92 16 0 30 51.4 3.51 1.47 2.90 1.35 3.92 15 925661160 0 9 50.9 0.61 1.27 0.81 1.63 1.32 36 0 9 50.9 0.61 1.27 0.81 1.63 1.32 36 925661245 0 3 103.0 1.18 2.58 1.60 1.55 2.48 30 0 3 103.0 1.18 2.58 1.60 1.55 2.48 30 926540379 0 16 71.0 3.10 1.78 2.70 1.53 4.13 14 0 16 71.0 3.10 1.78 2.70 1.53 4.13 13 926540683 0 16 76.5 4.74 2.19 3.98 1.25 4.97 2 0 16 76.5 4.74 2.19 3.98 1.25 4.97 1 927430229 0 6 100.7 2.28 2.52 2.35 1.67 3.92 15 0 6 100.7 2.28 2.52 2.35 1.67 3.92 14 927451004 0 7 88.4 2.67 2.53 2.63 1.3 3.42 22 0 7 88.4 2.67 2.53 2.63 1.3 3.42 22 928330206 0 8 103.9 3.19 2.60 3.01 1.57 4.73 5 0 8 103.9 3.19 2.60 3.01 1.57 4.73 4 928330756 0 7 64.1 1.06 1.60 1.22 1.57 1.92 33 0 7 64.1 1.06 1.60 1.22 1.57 1.92 33 928330923 0 39 42.5 2.08 1.21 1.82 1.2 2.18 31 0 39 42.5 2.08 1.21 1.82 1.2 2.18 31 930320100 0 6 106.3 2.49 2.66 2.54 1.65 4.19 13 0 6 106.3 2.49 2.66 2.54 1.65 4.19 12 930351531 0 34 49.7 3.57 1.42 2.93 1.22 3.57 17 0 34 49.7 3.57 1.42 2.93 1.22 3.57 16 930360955 0 20 61.5 3.78 1.76 3.17 1.33 4.22 12 0 20 61.5 3.78 1.76 3.17 1.33 4.22 11 930361125 0 4 103.8 1.59 2.59 1.89 1.57 2.97 25 0 4 103.8 1.59 2.59 1.89 1.57 2.97 25 931331186 0 16 74.7 3.47 1.87 2.99 1.46 4.36 11 0 16 74.7 3.47 1.87 2.99 1.46 4.36 10 991102100 0 12 86.3 3.47 2.16 3.08 1.51 4.64 7 0 12 86.3 3.47 2.16 3.08 1.51 4.64 6
Total: 94.2 Average: 1.92 Total: 93.2 Average: 1.91

69
Table B-7. Allocation of Budget Funds for Construction of New Class-Blocks (Blocks #9 and #10).
Allocation of Block #9 Allocation of Block #10
EMIS# School-Block
#8
Available Classrooms
Learner-to-Classroom
Ratio
Resulting Class-blocks
Backlog
Learner-to-Classroom
Ratio/Target Size
Infrastructure Adequacy
Score:
Augmenting Adjustment:
Priority Index: Ranking:
School-Block
#9
Available Classrooms
Learner-to-Classroom
Ratio
Resulting Class-blocks
Backlog
Learner-to-Classroom
Ratio/Target Size
Infrastructure Adequacy
Score:
Augmenting Adjustment:
Priority Index: Ranking:
901340425 0 13 77.9 3.99 2.23 3.46 1.33 4.60 6 0 13 77.9 3.99 2.23 3.46 1.33 4.60 5 901420031 0 13 27.8 0.00 0.69 0.21 1.47 0.31 37 0 13 27.8 0.00 0.69 0.21 1.47 0.31 37 904220101 0 40 23.0 0.00 0.58 0.17 1.25 0.22 39 0 40 23.0 0.00 0.58 0.17 1.25 0.22 39 904220415 0 29 23.8 0.00 0.68 0.20 1.02 0.21 40 0 29 23.8 0.00 0.68 0.20 1.02 0.21 40 904221326 0 33 31.5 0.00 0.90 0.27 1.00 0.27 38 0 33 31.5 0.00 0.90 0.27 1.00 0.27 38 907130642 0 4 102.3 1.56 2.56 1.86 1.49 2.77 27 0 4 102.3 1.56 2.56 1.86 1.49 2.77 27 911360252 0 10 94.0 3.38 2.35 3.07 1.55 4.75 2 0 10 94.0 3.38 2.35 3.07 1.55 4.75 1 914450056 0 22 61.6 4.18 1.76 3.45 1.29 4.45 8 0 22 61.6 4.18 1.76 3.45 1.29 4.45 7 915530341 0 15 64.5 3.16 1.84 2.76 1.27 3.51 17 0 15 64.5 3.16 1.84 2.76 1.27 3.51 16 917420703 0 17 67.9 4.00 1.94 3.38 1.41 4.77 1 1 21 55.0 3.00 1.57 2.57 1.33 3.42 20 918510651 0 22 67.4 3.76 1.68 3.14 1.49 4.68 4 0 22 67.4 3.76 1.68 3.14 1.49 4.68 3 918510699 0 11 71.7 2.18 1.79 2.06 1.35 2.79 26 0 11 71.7 2.18 1.79 2.06 1.35 2.79 26 918511029 0 3 125.0 1.93 3.57 2.42 1.12 2.71 29 0 3 125.0 1.93 3.57 2.42 1.12 2.71 29 918511463 0 15 66.1 2.44 1.65 2.21 1.55 3.42 21 0 15 66.1 2.44 1.65 2.21 1.55 3.42 21 920211725 0 3 82.7 0.80 2.07 1.18 1.51 1.78 34 0 3 82.7 0.80 2.07 1.18 1.51 1.78 34 922220873 0 15 48.5 1.44 1.38 1.43 1.36 1.94 32 0 15 48.5 1.44 1.38 1.43 1.36 1.94 32 922221135 0 5 101.8 1.93 2.55 2.12 1.63 3.45 19 0 5 101.8 1.93 2.55 2.12 1.63 3.45 18 923240419 0 4 62.8 0.79 1.79 1.09 1.41 1.54 35 0 4 62.8 0.79 1.79 1.09 1.41 1.54 35 923241054 0 15 66.4 2.48 1.66 2.23 1.49 3.32 23 0 15 66.4 2.48 1.66 2.23 1.49 3.32 23 923260628 0 18 58.3 3.00 1.67 2.60 1.33 3.46 18 0 18 58.3 3.00 1.67 2.60 1.33 3.46 17 924650115 0 17 63.8 2.53 1.59 2.25 1.53 3.44 20 0 17 63.8 2.53 1.59 2.25 1.53 3.44 19 924651262 0 17 56.0 1.70 1.40 1.61 1.69 2.72 28 0 17 56.0 1.70 1.40 1.61 1.69 2.72 28 924661528 0 8 100.6 3.75 2.88 3.49 1.31 4.57 7 0 8 100.6 3.75 2.88 3.49 1.31 4.57 6 925630685 0 3 115.7 1.42 2.89 1.86 1.69 3.14 24 0 3 115.7 1.42 2.89 1.86 1.69 3.14 24 925660495 0 30 51.4 3.51 1.47 2.90 1.35 3.92 15 0 30 51.4 3.51 1.47 2.90 1.35 3.92 14 925661160 0 9 50.9 0.61 1.27 0.81 1.63 1.32 36 0 9 50.9 0.61 1.27 0.81 1.63 1.32 36 925661245 0 3 103.0 1.18 2.58 1.60 1.55 2.48 30 0 3 103.0 1.18 2.58 1.60 1.55 2.48 30 926540379 0 16 71.0 3.10 1.78 2.70 1.53 4.13 12 0 16 71.0 3.10 1.78 2.70 1.53 4.13 11 926540683 1 20 61.2 3.74 1.75 3.14 1.25 3.93 13 0 20 61.2 3.74 1.75 3.14 1.25 3.93 12 927430229 0 6 100.7 2.28 2.52 2.35 1.67 3.92 14 0 6 100.7 2.28 2.52 2.35 1.67 3.92 13 927451004 0 7 88.4 2.67 2.53 2.63 1.3 3.42 22 0 7 88.4 2.67 2.53 2.63 1.3 3.42 22 928330206 0 8 103.9 3.19 2.60 3.01 1.57 4.73 3 0 8 103.9 3.19 2.60 3.01 1.57 4.73 2 928330756 0 7 64.1 1.06 1.60 1.22 1.57 1.92 33 0 7 64.1 1.06 1.60 1.22 1.57 1.92 33 928330923 0 39 42.5 2.08 1.21 1.82 1.2 2.18 31 0 39 42.5 2.08 1.21 1.82 1.2 2.18 31 930320100 0 6 106.3 2.49 2.66 2.54 1.65 4.19 11 0 6 106.3 2.49 2.66 2.54 1.65 4.19 10 930351531 0 34 49.7 3.57 1.42 2.93 1.22 3.57 16 0 34 49.7 3.57 1.42 2.93 1.22 3.57 15 930360955 0 20 61.5 3.78 1.76 3.17 1.33 4.22 10 0 20 61.5 3.78 1.76 3.17 1.33 4.22 9 930361125 0 4 103.8 1.59 2.59 1.89 1.57 2.97 25 0 4 103.8 1.59 2.59 1.89 1.57 2.97 25 931331186 0 16 74.7 3.47 1.87 2.99 1.46 4.36 9 0 16 74.7 3.47 1.87 2.99 1.46 4.36 8 991102100 0 12 86.3 3.47 2.16 3.08 1.51 4.64 5 0 12 86.3 3.47 2.16 3.08 1.51 4.64 4 Total: 92.2 Average: 1.90 Total: 91.2 Average: 1.89
70
What is shown in Table B-7 is a multi-stage selection process. Each round only one
additional class-block is being awarded to the school that has the highest ranking. For
example, the very first class-block is given to Lorraine Banareng Primary School
(#926540683) because it has the highest ranking of 6.51 in Table B-6, i.e. before the
allocation. Then, once the first block is given to Lorraine Banareng Primary School, as
shown in Table B-7, it means that the priority index of Lorraine Banareng Primary
School declines to a level such that now another school takes the lead in ranking.
Indeed, the second school-block must now be given to Kgatelopele Primary School
(#991102100), which now has the highest PI of 6.19 and is on the top of the ranking
list.
In turn, the second class-block given to Kgatelopele Primary School causes its priority
index to decline and the top ranking shifts to Modubatse Secondary School
(#918510651), which has the highest ranking with an index of 5.89. Thus, the third
class-block goes to Modubatse Secondary School. The process is iteratively repeated
until the whole available budget is allocated and all 20 class-blocks are assigned.
B.4.2 Distribution of Funds The iterative allocation mechanism places each available class-block in a location that
has the highest need for additional infrastructure. Table B-8 summarizes the allocation
of 20 blocks that can be built with the current budget funds available. The distribution
process follows the procedure in Table B-7.

71
Table B-8. Distribution of 20 New Class-Blocks among Schools.
EMIS# Block being Allocated: #1 #2 #3 #4 #5 #6 #7 #8 #9 #10 #11 #12 #13 #14 #15 #16 #17 #18 #19 #20 Total Initial PI Max PI Observed: 6.51 6.19 5.89 5.51 5.25 5.03 4.98 4.97 4.77 4.75 4.73 4.68 4.64 4.60 4.57 4.45 4.36 4.22 4.19 4.13 Ranking 901340425 Motsheudi Sec. 1 1 11 901420031 Bollanto Pri. 0 37 904220101 Capricorn High 0 39 904220415 Laerskool Pietersburg Noord 0 40 904221326 Pietersburg E M Pri. 0 38 907130642 Lekkerbreek Pri. 0 27 911360252 Matiyani Pri. 1 1 9 914450056 Bhejani Pri. 1 1 2 4 915530341 Vasasele Sec. 0 19 917420703 Shiphamele Pri. 1 1 8 918510651 Modubatse Sec. 1 1 2 3 918510699 Mokope Senior Sec. 0 26 918511029 Metsi A- Phepha Pri. 0 29 918511463 Tlhapedi Pri. 1 1 6 920211725 Selaelo Pri. 0 34 922220873 Mmanare Sec. 0 32 922221135 Napo Pri. 0 21 923240419 Makgalapane Pri. 0 35 923241054 Mountainveiw Sernior Sec. 0 23 923260628 Mamaolo Pri. 0 20 924650115 Mamphokgo Pri. 1 1 7 924651262 Phokanoka High 0 28 924661528 Ngwanamatlang Sec. 1 1 12 925630685 Tshililo Sec. 0 24 925660495 Malegale Pri. 1 1 5 925661160 Sebase Sec. 0 36 925661245 Serageng Pri. 0 30 926540379 Rakgolokwana Sec. 1 1 16 926540683 Lorraine Banareng Pri. 1 1 2 1 927430229 Hloala Chiloane Pri. 0 17 927451004 Tamajane Senior Sec. 0 22 928330206 Mutuwafhethu Pri. 1 1 10 928330756 Makumbwi Pri. 0 33 928330923 Patrick Ramaano Sec. 0 31 930320100 Manamani Pri. 1 1 15 930351531 Tshivhase Sec. 0 18 930360955 Mpandeli Sec. 1 1 14 930361125 Mmbofheni Pri. 0 25 931331186 Djunane Pri. 1 1 13 991102100 Kgatelopele Pri. 1 1 2 2 20

72
In order to see the achievements clearly, Table B-8 should be sorted out in accordance
with the initial ranking before the allocation. Thus, Table B-9 is derived, which shows
the distribution of 20 new class-blocks according to the initial priority ranking.
Table B-9. Allocation of 20 New Class-Blocks According to Priority Index.
EMIS# School Total Initial PI Ranking 926540683 Lorraine Banareng Primary 2 1 991102100 Kgatelopele Primary 2 2 918510651 Modubatse Secondary 2 3 914450056 Bhejani Primary 2 4 925660495 Malegale Primary 1 5 918511463 Tlhapedi Primary 1 6 924650115 Mamphokgo Primary 1 7 917420703 Shiphamele Primary 1 8 911360252 Matiyani Primary 1 9 928330206 Mutuwafhethu Primary 1 10 901340425 Motsheudi Secondary 1 11 924661528 Ngwanamatlang Secondary 1 12 931331186 Djunane Primary 1 13 930360955 Mpandeli Secondary 1 14 930320100 Manamani Primary 1 15 926540379 Rakgolokwana Secondary 1 16 927430229 Hloala Chiloane Primary 0 17 930351531 Tshivhase Secondary 0 18 915530341 Vasasele Secondary 0 19 923260628 Mamaolo Primary 0 20 922221135 Napo Primary 0 21 927451004 Tamajane Senior Secondary 0 22 923241054 Mountainveiw Sernior Secondary 0 23 925630685 Tshililo Secondary 0 24 930361125 Mmbofheni Primary 0 25 918510699 Mokope Senior Secondary 0 26 907130642 Lekkerbreek Primary 0 27 924651262 Phokanoka High 0 28 918511029 Metsi A- Phepha Primary 0 29 925661245 Serageng Primary 0 30 928330923 Patrick Ramaano Secondary 0 31 922220873 Mmanare Secondary 0 32 928330756 Makumbwi Primary 0 33 920211725 Selaelo Primary 0 34 923240419 Makgalapane Primary 0 35 925661160 Sebase Secondary 0 36 901420031 Bollanto Primary 0 37 904221326 Pietersburg E M Primary 0 38 904220101 Capricorn High 0 39 904220415 Laerskool Pietersburg Noord 0 40 Total New Blocks: 20
73
Hence, the optimal allocation of 20 class-blocks that maximizes the impact on the
identified infrastructure needs is such that the first four schools on the initial priority
ranking list should receive two new blocks each. The remaining 12 blocks should be
given to schools ranking from place five to place sixteen on the initial priority list. This
allocation exhausts the funds available for this budget period. For the next period, the
computation of school priority index must be repeated based on regularly updated
information on schools’ infrastructure and enrollment.
B.5 Rehabilitation Priority Index
B.5.1 Data Requirements
To facilitate the selection process of identified rehabilitation sites, the Department
management should have a clear idea about the condition of identified damaged
buildings and their estimated rehabilitation costs. In fact, such information is routinely
received from the Department of Public Works on the request of the Department of
Education. The existing system is such that the Department of Education collects data
from schools and district offices and every year a list of damaged buildings is compiled
for each provincial district. The list is then forwarded to the Department of Public
Works in order to carry out physical assessment and to establish a cost estimate for
each identified site. Once the assessment teams send their reports back to the
Department of Education, the management selects the sites for rehabilitation subject to
the amount of available budget funds.
The information received from assessment teams could be presented in a form that
shown in Table B-10. This table shows the condition and estimated repair costs for
each identified damaged class-room in a school. In fact, some school may have several
damaged buildings and these should be treated separately because their rehabilitation
costs are likely to be different. The building condition of class-rooms in Table B-10 is
linked to the condition of class-rooms (field 15121) of the EMIS database. Due to data
constraint, the number of damaged class-rooms in schools and their repair costs
estimates are assumed.

74
Table B-10. Damaged Class-rooms and Estimated Rehabilitation Costs.
Class A Class B Class C Class D Class E Class F Class G Total Emis
Number SchoolName Rehab Cost Class A
Condition Class A
Rehab Cost Class B
Condition Class B
Rehab Cost Class C
Condition Class C
Rehab Cost Class D
Condition Class D
Rehab Cost Class E
Condition Class E
Rehab Cost Class F
Condition Class F
Rehab Cost Class G
Condition Class G
# of Classrooms
Total Rehab Cost
901340425 Motsheudi Sec. 60 2 70 2 2 130 901420031 Bollanto Pri. 0 0 904220101 Capricorn High 0 0 904220415 Laerskool Pietersburg Noord 50 2 75 2 65 2 70 2 55 2 5 315 904221326 Pietersburg E M Pri. 0 0 907130642 Lekkerbreek Pri. 0 0 911360252 Matiyani Pri. 70 2 65 2 2 135 914450056 Bhejani Pri. 60 2 55 2 70 2 50 2 4 235 915530341 Vasasele Sec. 0 0 917420703 Shiphamele Pri. 0 0 918510651 Modubatse Sec. 0 0 918510699 Mokope Senior Sec. 0 0 918511029 Metsi A- Phepha Pri. 70 2 1 70 918511463 Tlhapedi Pri. 0 0 920211725 Selaelo Pri. 0 0 922220873 Mmanare Sec. 45 2 55 2 70 2 60 2 4 230 922221135 Napo Pri. 0 0 923240419 Makgalapane Pri. 95 1 1 95 923241054 Mountainveiw Sernior Sec. 0 0 923260628 Mamaolo Pri. 0 0 924650115 Mamphokgo Pri. 0 0 924651262 Phokanoka High 60 2 50 2 45 2 75 2 4 230 924661528 Ngwanamatlang Sec. 0 0 925630685 Tshililo Sec. 90 1 1 90 925660495 Malegale Pri. 80 1 90 1 100 1 95 1 85 1 105 1 6 555 925661160 Sebase Sec. 85 1 100 1 2 185 925661245 Serageng Pri. 75 2 1 75 926540379 Rakgolokwana Sec. 40 2 55 2 60 2 50 2 4 205 926540683 Lorraine Banareng Pri. 80 1 75 1 90 1 3 245 927430229 Hloala Chiloane Pri. 85 1 1 85 927451004 Tamajane Senior Sec. 0 0 928330206 Mutuwafhethu Pri. 0 0 928330756 Makumbwi Pri. 50 2 1 50 928330923 Patrick Ramaano Sec. 0 0 930320100 Manamani Pri. 45 2 1 45 930351531 Tshivhase Sec. 0 0 930360955 Mpandeli Sec. 0 0 930361125 Mmbofheni Pri. 55 2 1 55 931331186 Djunane Pri. 0 0 991102100 Kgatelopele Pri. 0 0
Total: 44 3,030

75
Thus, this table suggests that Motsheudi Secondary School (#901340425) has two
damaged class-rooms, both are in condition “2”, but one costs R 60,000 to rehabilitate,
and the second is R 70,000. Obviously, some schools may have a large number of
damaged buildings while others will not have any in condition “1” or “2”. The total
number of damaged of class-rooms is 44, or 11 class-blocks. The total budget required
to finance all repair works is R 3.03 million.
B.5.2 Relative Rehabilitation Costs Following the classification of damaged class-rooms in Table B-10, the class-room
information is presented in Table B-11 where their relative rehabilitation costs are
estimated. The present value of future replacement cost depends on the current
condition of the class-room. As discussed in Section 3.2.3, if a class-room is in
condition “1” then its present-day equivalent of replacement cost in 1 year is R 69,200,
while condition “2” will require a replacement in 4 years which worth today R 94,600.
These two benchmarks are used to estimate the relative cost of rehabilitation, which is
simply a ratio of the estimated repair cost over the relevant PV of future replacement
cost. If the resulting ratio is above one then it means that the rehabilitation is more
expensive than building a new class-room in the future, while a ratio lower than one
means that the required repair works cost less than building a new room.
For example, class A of Motsheudi Secondary School (#901340425) is currently in
condition “2” and its estimated rehabilitation costs are R 60,000. The PV of its future
replacement cost is R 69,200, and therefore the relative rehabilitation cost is 0.87. Class
B at the same school has a relative cost of 1.01 because its estimated rehabilitation cost
is R 70,000. The most expensive relative cost of 1.11 is associated with class F in
Malegale Primary School (#925660495). The cheapest relative cost of 0.58 is observed
for class A of Rakgolokwana Secondary School (#926540379).
However, the relative cost alone does not really allow us to prioritorize among schools.
The limited size of rehabilitation budget forces the management to make hard choices
in selection of rehabilitation sites. Obviously, the rehabilitation selection procedure
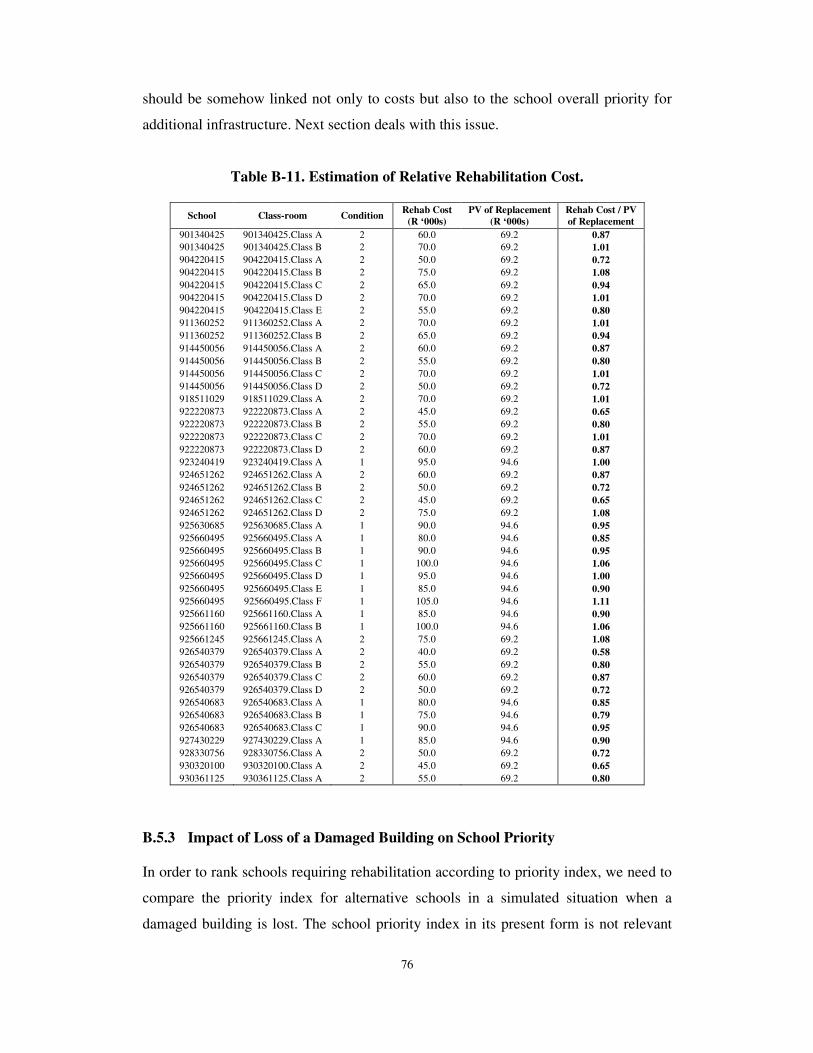
76
should be somehow linked not only to costs but also to the school overall priority for
additional infrastructure. Next section deals with this issue.
Table B-11. Estimation of Relative Rehabilitation Cost.
School Class-room Condition Rehab Cost (R ‘000s)
PV of Replacement (R ‘000s)
Rehab Cost / PV of Replacement
901340425 901340425.Class A 2 60.0 69.2 0.87 901340425 901340425.Class B 2 70.0 69.2 1.01 904220415 904220415.Class A 2 50.0 69.2 0.72 904220415 904220415.Class B 2 75.0 69.2 1.08 904220415 904220415.Class C 2 65.0 69.2 0.94 904220415 904220415.Class D 2 70.0 69.2 1.01 904220415 904220415.Class E 2 55.0 69.2 0.80 911360252 911360252.Class A 2 70.0 69.2 1.01 911360252 911360252.Class B 2 65.0 69.2 0.94 914450056 914450056.Class A 2 60.0 69.2 0.87 914450056 914450056.Class B 2 55.0 69.2 0.80 914450056 914450056.Class C 2 70.0 69.2 1.01 914450056 914450056.Class D 2 50.0 69.2 0.72 918511029 918511029.Class A 2 70.0 69.2 1.01 922220873 922220873.Class A 2 45.0 69.2 0.65 922220873 922220873.Class B 2 55.0 69.2 0.80 922220873 922220873.Class C 2 70.0 69.2 1.01 922220873 922220873.Class D 2 60.0 69.2 0.87 923240419 923240419.Class A 1 95.0 94.6 1.00 924651262 924651262.Class A 2 60.0 69.2 0.87 924651262 924651262.Class B 2 50.0 69.2 0.72 924651262 924651262.Class C 2 45.0 69.2 0.65 924651262 924651262.Class D 2 75.0 69.2 1.08 925630685 925630685.Class A 1 90.0 94.6 0.95 925660495 925660495.Class A 1 80.0 94.6 0.85 925660495 925660495.Class B 1 90.0 94.6 0.95 925660495 925660495.Class C 1 100.0 94.6 1.06 925660495 925660495.Class D 1 95.0 94.6 1.00 925660495 925660495.Class E 1 85.0 94.6 0.90 925660495 925660495.Class F 1 105.0 94.6 1.11 925661160 925661160.Class A 1 85.0 94.6 0.90 925661160 925661160.Class B 1 100.0 94.6 1.06 925661245 925661245.Class A 2 75.0 69.2 1.08 926540379 926540379.Class A 2 40.0 69.2 0.58 926540379 926540379.Class B 2 55.0 69.2 0.80 926540379 926540379.Class C 2 60.0 69.2 0.87 926540379 926540379.Class D 2 50.0 69.2 0.72 926540683 926540683.Class A 1 80.0 94.6 0.85 926540683 926540683.Class B 1 75.0 94.6 0.79 926540683 926540683.Class C 1 90.0 94.6 0.95 927430229 927430229.Class A 1 85.0 94.6 0.90 928330756 928330756.Class A 2 50.0 69.2 0.72 930320100 930320100.Class A 2 45.0 69.2 0.65 930361125 930361125.Class A 2 55.0 69.2 0.80
B.5.3 Impact of Loss of a Damaged Building on School Priority In order to rank schools requiring rehabilitation according to priority index, we need to
compare the priority index for alternative schools in a simulated situation when a
damaged building is lost. The school priority index in its present form is not relevant

77
for such comparison, because it does not account for a loss of damaged building. Table
B-12 shows a simulation in which one class-room is deducted from each school and
resulting school priority index is estimated. Clearly, schools with high enrollment and
small number of buildings are affected the worst.
Table B-12. Impact of Loss of a Damaged Class-room on School Priority Index.
Emis Number SchoolName
Currently Available
Classrooms
Removing One
Classroom
Remaining Classrooms
Learner-to-Classroom
Ratio
Resulting Class-blocks
Backlog
Learner-to-Classroom
Ratio/Target Size
Infrastructure Adequacy
Score:
Augmenting Adjustment:
School Priority Index:
901340425 Motsheudi Sec. 13 1 12 84.4 4.2 2.41 3.69 1.33 4.91 901420031 Bollanto Pri. 13 1 12 30.1 0.0 0.75 0.23 1.47 0.33 904220101 Capricorn High 40 1 39 23.6 0.0 0.59 0.18 1.25 0.22 904220415 Laerskool Pietersburg Noord 29 1 28 24.6 0.0 0.70 0.21 1.02 0.22 904221326 Pietersburg E M Pri. 33 1 32 32.5 0.0 0.93 0.28 1.00 0.28 907130642 Lekkerbreek Pri. 4 1 3 136.3 1.8 3.41 2.29 1.49 3.41 911360252 Matiyani Pri. 10 1 9 104.4 3.6 2.61 3.32 1.55 5.15 914450056 Bhejani Pri. 18 1 17 79.7 5.4 2.28 4.48 1.29 5.78 915530341 Vasasele Sec. 15 1 14 69.1 3.4 1.97 2.98 1.27 3.78 917420703 Shiphamele Pri. 17 1 16 72.2 4.3 2.06 3.59 1.41 5.07 918510651 Modubatse Sec. 18 1 17 87.2 5.0 2.18 4.16 1.49 6.20 918510699 Mokope Senior Sec. 11 1 10 78.9 2.4 1.97 2.29 1.35 3.10 918511029 Metsi A- Phepha Pri. 3 1 2 187.5 2.2 5.36 3.13 1.12 3.51 918511463 Tlhapedi Pri. 11 1 10 99.1 3.7 2.48 3.33 1.63 5.43 920211725 Selaelo Pri. 3 1 2 124.0 1.1 3.10 1.67 1.51 2.51 922220873 Mmanare Sec. 15 1 14 51.9 1.7 1.48 1.63 1.36 2.22 922221135 Napo Pri. 5 1 4 127.3 2.2 3.18 2.48 1.63 4.04 923240419 Makgalapane Pri. 4 1 3 83.7 1.0 2.39 1.45 1.41 2.04 923241054 Mountainveiw Sernior Sec. 15 1 14 71.1 2.7 1.78 2.44 1.49 3.64 923260628 Mamaolo Pri. 18 1 17 61.8 3.3 1.76 2.80 1.33 3.73 924650115 Mamphokgo Pri. 13 1 12 90.3 3.8 2.26 3.32 1.61 5.35 924651262 Phokanoka High 17 1 16 59.5 2.0 1.49 1.81 1.69 3.06 924661528 Ngwanamatlang Sec. 8 1 7 115.0 4.0 3.29 3.79 1.31 4.96 925630685 Tshililo Sec. 3 1 2 173.5 1.7 4.34 2.47 1.69 4.17 925660495 Malegale Pri. 26 1 25 61.7 4.8 1.76 3.86 1.43 5.53 925661160 Sebase Sec. 9 1 8 57.3 0.9 1.43 1.03 1.63 1.68 925661245 Serageng Pri. 3 1 2 154.5 1.4 3.86 2.16 1.55 3.35 926540379 Rakgolokwana Sec. 16 1 15 75.7 3.4 1.89 2.91 1.53 4.46 926540683 Lorraine Banareng Pri. 12 1 11 111.3 6.0 3.18 5.15 1.33 6.85 927430229 Hloala Chiloane Pri. 6 1 5 120.8 2.5 3.02 2.67 1.67 4.46 927451004 Tamajane Senior Sec. 7 1 6 103.2 2.9 2.95 2.93 1.30 3.81 928330206 Mutuwafhethu Pri. 8 1 7 118.7 3.4 2.97 3.30 1.57 5.18 928330756 Makumbwi Pri. 7 1 6 74.8 1.3 1.87 1.48 1.57 2.32 928330923 Patrick Ramaano Sec. 39 1 38 43.6 2.3 1.25 2.00 1.20 2.40 930320100 Manamani Pri. 6 1 5 127.6 2.7 3.19 2.87 1.65 4.74 930351531 Tshivhase Sec. 34 1 33 51.2 3.8 1.46 3.11 1.22 3.80 930360955 Mpandeli Sec. 20 1 19 64.7 4.0 1.85 3.37 1.33 4.49 930361125 Mmbofheni Pri. 4 1 3 138.3 1.8 3.46 2.33 1.57 3.66 931331186 Djunane Pri. 16 1 15 79.7 3.7 1.99 3.20 1.46 4.67 991102100 Kgatelopele Pri. 8 1 7 147.9 4.7 3.70 4.41 1.51 6.66
The mechanism that is used in this simulation is basically the same as described in
Section 3.2.3 above. The number of currently available class-rooms at each school is
reduced by one class-room in order to see what the resulting school priority index
would be. The augmenting factors are assumed to remain the same as initially estimated
in Table B-3. The resulting school priority index shows the impact of loss of a damaged

78
class-room in present situation. However, the loss of a particular class-room is a future
possibility, which is expected to happen in 1 year for buildings in condition “1” and in
4 years for buildings in condition “2”. Therefore, to reflect the future priority index in
present-day terms, this school priority index must be discounted back by 1 and 4
periods for buildings in condition “1” and “2”, respectively. Table B-13 shows how the
index discounting takes place for all identified damaged class-rooms.
Table B-13. Estimation of PV of Future School Priority Index.
School Class-room Condition Future PI without a Classroom PV of Future PI 901340425 901340425.Class A 2 4.91 3.23 901340425 901340425.Class B 2 4.91 3.23 904220415 904220415.Class A 2 0.22 0.14 904220415 904220415.Class B 2 0.22 0.14 904220415 904220415.Class C 2 0.22 0.14 904220415 904220415.Class D 2 0.22 0.14 904220415 904220415.Class E 2 0.22 0.14 911360252 911360252.Class A 2 5.15 3.39 911360252 911360252.Class B 2 5.15 3.39 914450056 914450056.Class A 2 5.78 3.81 914450056 914450056.Class B 2 5.78 3.81 914450056 914450056.Class C 2 5.78 3.81 914450056 914450056.Class D 2 5.78 3.81 918511029 918511029.Class A 2 3.51 2.31 922220873 922220873.Class A 2 2.22 1.46 922220873 922220873.Class B 2 2.22 1.46 922220873 922220873.Class C 2 2.22 1.46 922220873 922220873.Class D 2 2.22 1.46 923240419 923240419.Class A 1 2.04 1.84 924651262 924651262.Class A 2 3.06 2.02 924651262 924651262.Class B 2 3.06 2.02 924651262 924651262.Class C 2 3.06 2.02 924651262 924651262.Class D 2 3.06 2.02 925630685 925630685.Class A 1 4.17 3.76 925660495 925660495.Class A 1 5.53 4.98 925660495 925660495.Class B 1 5.53 4.98 925660495 925660495.Class C 1 5.53 4.98 925660495 925660495.Class D 1 5.53 4.98 925660495 925660495.Class E 1 5.53 4.98 925660495 925660495.Class F 1 5.53 4.98 925661160 925661160.Class A 1 1.68 1.52 925661160 925661160.Class B 1 1.68 1.52 925661245 925661245.Class A 2 3.35 2.21 926540379 926540379.Class A 2 4.46 2.94 926540379 926540379.Class B 2 4.46 2.94 926540379 926540379.Class C 2 4.46 2.94 926540379 926540379.Class D 2 4.46 2.94 926540683 926540683.Class A 1 6.85 6.17 926540683 926540683.Class B 1 6.85 6.17 926540683 926540683.Class C 1 6.85 6.17 927430229 927430229.Class A 1 4.46 4.02 928330756 928330756.Class A 2 2.32 1.53 930320100 930320100.Class A 2 4.74 3.12 930361125 930361125.Class A 2 3.66 2.41

79
The column with the future school priority index is taken directly from Table B-12,
which already estimated PI without a class-room for every school in the sample. Then,
that PI is discounted by the economic opportunity cost of capital back into 1 period for
buildings in condition “1” and into 4 periods for buildings in condition “2”. For
example, class A of Motsheudi Secondary School (#901340425) is currently in
condition “2” and its current PI without one class-room is 4.91. The present value of
this index in 4 years is estimated as 3.23 (= 4.91 / [(1 + 11.0%)^4]).
B.5.4 Rehabilitation Priority Index Section 3.2.5 already introduced the concept of “rehabilitation priority index”, which
should be computed for each identified damaged class-room. It is defined as the PV of
the school priority index without a class-room divided by the relative cost of
rehabilitation of that particular class-room. The index effectively matches the cost
aspect of rehabilitation and the need of the school for additional infrastructure. Table B-
14 shows the estimation of estimation of rehabilitation priority index for each damaged
class-room.
This table is built using the results of the preceding Table B-11 and Table B-13. The
“costs” panel shows the relative cost of rehabilitation to the present value of future cost
of class-room replacement, as computed in Table B-11. The “priority” section is taken
directly from Table B-13, and shows the resulting PV of the school’s priority index
without a damaged class-room discounted to the base year 2004. The last “ranking”
panel consists of two items: the rehabilitation priority index and class-room ranking.
The rehabilitation priority index is obtained as the PV of the school’s priority index
without a class-room divided by the relative rehabilitation cost.
For example, class A of Motsheudi Secondary School (#901340425) is currently in
condition “2” and to remain functional, it requires an immediate expense of R 60,000
otherwise this class-room will become totally useless in 4 years. Because the PV of the
replacement in 4 years is estimated as R 69,200, Table B-11 suggests that the relative
rehabilitation cost of this class-room now is only 0.87 times of its replacement cost in
the future. At the same time, if Motsheudi Secondary School (to which this class-room
belongs) suffers a loss of this or any other class-room then its current priority index
would rise from its current level of 4.60 (Table B-6) to 4.91 (Table B-12). However,

80
because this particular class-room without any repair is expected, on the average, to
serve additional 4 years, this school PI should be discounted back to reflect its lower
importance in the future. Thus, Table 12 shows that the 4.91 school priority index in a
4-year time will be equivalent to only 3.23 in its present-day value. Then, the
rehabilitation priority index for class A of Motsheudi Secondary School is now
estimated as 3.73.28
Table B-14. Estimation of Rehabilitation Priority Index and Ranking.
School Class-room Condition Rehab Cost / PV of Replacement
PV of Future PI
Rehabilitation Priority Index
Rehabilitation Ranking
901340425 901340425.Class A 2 0.87 3.23 3.73 19 901340425 901340425.Class B 2 1.01 3.23 3.19 24 904220415 904220415.Class A 2 0.72 0.14 0.20 40 904220415 904220415.Class B 2 1.08 0.14 0.13 44 904220415 904220415.Class C 2 0.94 0.14 0.15 42 904220415 904220415.Class D 2 1.01 0.14 0.14 43 904220415 904220415.Class E 2 0.80 0.14 0.18 41 911360252 911360252.Class A 2 1.01 3.39 3.35 23 911360252 911360252.Class B 2 0.94 3.39 3.61 21 914450056 914450056.Class A 2 0.87 3.81 4.39 15 914450056 914450056.Class B 2 0.80 3.81 4.79 11 914450056 914450056.Class C 2 1.01 3.81 3.76 18 914450056 914450056.Class D 2 0.72 3.81 5.27 6 918511029 918511029.Class A 2 1.01 2.31 2.28 29 922220873 922220873.Class A 2 0.65 1.46 2.24 30 922220873 922220873.Class B 2 0.80 1.46 1.84 34 922220873 922220873.Class C 2 1.01 1.46 1.44 38 922220873 922220873.Class D 2 0.87 1.46 1.68 37 923240419 923240419.Class A 1 1.00 1.84 1.83 35 924651262 924651262.Class A 2 0.87 2.02 2.32 28 924651262 924651262.Class B 2 0.72 2.02 2.79 27 924651262 924651262.Class C 2 0.65 2.02 3.10 25 924651262 924651262.Class D 2 1.08 2.02 1.86 33 925630685 925630685.Class A 1 0.95 3.76 3.95 17 925660495 925660495.Class A 1 0.85 4.98 5.89 4 925660495 925660495.Class B 1 0.95 4.98 5.23 7 925660495 925660495.Class C 1 1.06 4.98 4.71 12 925660495 925660495.Class D 1 1.00 4.98 4.96 9 925660495 925660495.Class E 1 0.90 4.98 5.54 5 925660495 925660495.Class F 1 1.11 4.98 4.48 13 925661160 925661160.Class A 1 0.90 1.52 1.69 36 925661160 925661160.Class B 1 1.06 1.52 1.44 39 925661245 925661245.Class A 2 1.08 2.21 2.03 32 926540379 926540379.Class A 2 0.58 2.94 5.08 8 926540379 926540379.Class B 2 0.80 2.94 3.69 20 926540379 926540379.Class C 2 0.87 2.94 3.38 22 926540379 926540379.Class D 2 0.72 2.94 4.06 16 926540683 926540683.Class A 1 0.85 6.17 7.29 2 926540683 926540683.Class B 1 0.79 6.17 7.78 1 926540683 926540683.Class C 1 0.95 6.17 6.48 3 927430229 927430229.Class A 1 0.90 4.02 4.48 14 928330756 928330756.Class A 2 0.72 1.53 2.11 31 930320100 930320100.Class A 2 0.65 3.12 4.80 10 930361125 930361125.Class A 2 0.80 2.41 3.03 26
28 Found as the PV of the future school PI without a class-room divided by the relative rehabilitation
cost: 3.23 / 0.87 = 3.73.

81
At the same time, B of the same Motsheudi Secondary School, while also is in
condition “2”, requires a repair expense of R 70,000 to remain operational. Since the
PV of the replacement in 4 years is estimated as R 69,200, its relative rehabilitation
cost is 1.01 times of its replacement cost in the future. Since the priority index of this
school in a 4-year time will be equivalent to only 3.23 in its present-day value, the
rehabilitation priority index for class B of Motsheudi Secondary School is 3.19.29 Thus,
the rehabilitation priority of class-room A is higher than of class-room B because of the
repair cost difference. The least expensive repair option is being preferred.
The resulting rehabilitation index is then ranked from the highest to the lowest value.
The class-rooms ranking at the top indicate the highest need relative to cost of repair.
Class-rooms B, A and C of Lorraine Banareng Primary School (#926540683) are
ranked as first, second and third, respectively. This result is not surprising. This school
has been identified as a location lacking infrastructure. The sequence of ranking among
these three reflects their relative costs. Class-rooms B, A and C have relative costs of
0.79, 0.85 and 0.95, respectively.
The lowest ratings are associated with classrooms assumed to be located in Laerskool
Pietersburg Noord School (#904220415). This school currently has an adequate
infrastructure facilities and that is why its school priority index and rehabilitation index
are both lower in comparison to other schools.
B.6 Allocation of Funds for Rehabilitation
The top positions of the rehabilitation ranking in Table B-14 are occupied by class-
rooms that are both relatively cheaper to repair and being located in schools with the
highest need for additional infrastructure. Following the discussion in Section 3.3, the
allocation mechanism should give funding to schools at the top of the rehabilitation
ranking list and until the available budget funds for the current period are exhausted.
29 Computed as the PV of the future school PI without a class-room divided by the relative
rehabilitation cost: 3.23 / 1.01 = 3.19.

82
Assume that the total rehabilitation budget available for the current year is R 1.0
million. Then, the allocation rule would spend the funds starting at the top of the
rehabilitation ranking up to a point when the funds are used up. Table B-15 illustrates
this process.
With this fixed budget, a total of R 990,000 will be spent on rehabilitation of 13 class-
rooms. Lorraine Banareng Primary School (#926540683) will have three of its class-
rooms (B, A and C) repaired at a total cost of R 245,000. Then, Malegale Primary
School (#925660495) should be financed to have 6 class-rooms to be rehabilitated at
cost of R 555,000. Bhejani Primary School (#914450056) should be given funding for
repair of 2 class-rooms worth R 105,000. In addition, class-room A in Rakgolokwana
Secondary School (#926540379) will be repaired at a cost of R 40,000. Finally, class-
room A of Manamani Primary School (#930320100) should be rehabilitated at a cost of
R 45,000. This combination exhausts the budget available and maximizes the efficiency
of rehabilitation spending.
In a situation when more funds become available for rehabilitation, the allocation rule
would work in exactly the same way, by financing the top ranking rehabilitation in first
place. In fact, if there were enough funds to finance all damaged buildings, the
maximum budget would be R 3.03 million. That would cover all rehabilitation needs
for 44 identified damaged class-rooms across 40 schools in the sample.
B.7 Concluding Remarks
This annex has been prepared to show a practical application of the proposed “school
priority index” and “rehabilitation priority index” for Limpopo Department of
Education. The method ensures an efficient allocation of the scarce budget funds for the
construction of new class-blocks and rehabilitation of the existing buildings. The data
requirements for the estimation of the indices are very modest and the existing
education management information system of the Department with a minimum
additional effort can be employed to supply the data for estimation of the priority
indices.

83
Table B-15. Allocation of Rehabilitation Budget Funds.
Rehab Ranking Class-room Rehab Cost
(R ‘000s) 9013404
25 9042204
15 9113602
52 9144500
56 9185110
29 9222208
73 9232404
19 9246512
62 9256306
85 9256604
95 9256611
60 9256612
45 9265403
79 9265406
83 9274302
29 9283307
56 9303201
00 9303611
25 Rehab Cumulative
Cost (R ‘000s) 1 926540683.Clas
s B 75 - - - - - - - - - - - - - 75 - - - - 75
2 926540683.Class A
80 - - - - - - - - - - - - - 80 - - - - 155 3 926540683.Clas
s C 90 - - - - - - - - - - - - - 90 - - - - 245
4 925660495.Class A
80 - - - - - - - - - 80 - - - - - - - - 325 5 925660495.Clas
s E 85 - - - - - - - - - 85 - - - - - - - - 410
6 914450056.Class D
50 - - - 50 - - - - - - - - - - - - - - 460 7 925660495.Clas
s B 90 - - - - - - - - - 90 - - - - - - - - 550
8 926540379.Class A
40 - - - - - - - - - - - - 40 - - - - - 590 9 925660495.Clas
s D 95 - - - - - - - - - 95 - - - - - - - - 685
10 930320100.Class A
45 - - - - - - - - - - - - - - - - 45 - 730 11 914450056.Clas
s B 55 - - - 55 - - - - - - - - - - - - - - 785
12 925660495.Class C
100 - - - - - - - - - 100 - - - - - - - - 885 13 925660495.Clas
s F 105 - - - - - - - - - 105 - - - - - - - - 990
14 927430229.Class A
85 - - - - - - - - - - - - - - 85 - - - 1,075 15 914450056.Clas
s A 60 - - - 60 - - - - - - - - - - - - - - 1,135
16 926540379.Class D
50 - - - - - - - - - - - - 50 - - - - - 1,185 17 925630685.Clas
s A 90 - - - - - - - - 90 - - - - - - - - - 1,275
18 914450056.Class C
70 - - - 70 - - - - - - - - - - - - - - 1,345 19 901340425.Clas
s A 60 60 - - - - - - - - - - - - - - - - - 1,405
20 926540379.Class B
55 - - - - - - - - - - - - 55 - - - - - 1,460 21 911360252.Clas
s B 65 - - 65 - - - - - - - - - - - - - - - 1,525
22 926540379.Class C
60 - - - - - - - - - - - - 60 - - - - - 1,585 23 911360252.Clas
s A 70 - - 70 - - - - - - - - - - - - - - - 1,655
24 901340425.Class B
70 70 - - - - - - - - - - - - - - - - - 1,725 25 924651262.Clas
s C 45 - - - - - - - 45 - - - - - - - - - - 1,770
26 930361125.Class A
55 - - - - - - - - - - - - - - - - - 55 1,825 27 924651262.Clas
s B 50 - - - - - - - 50 - - - - - - - - - - 1,875
28 924651262.Class A
60 - - - - - - - 60 - - - - - - - - - - 1,935 29 918511029.Clas
s A 70 - - - - 70 - - - - - - - - - - - - - 2,005
30 922220873.Class A
45 - - - - - 45 - - - - - - - - - - - - 2,050 31 928330756.Clas
s A 50 - - - - - - - - - - - - - - - 50 - - 2,100
32 925661245.Class A
75 - - - - - - - - - - - 75 - - - - - - 2,175 33 924651262.Clas
s D 75 - - - - - - - 75 - - - - - - - - - - 2,250
34 922220873.Class B
55 - - - - - 55 - - - - - - - - - - - - 2,305 35 923240419.Clas
s A 95 - - - - - - 95 - - - - - - - - - - - 2,400
36 925661160.Class A
85 - - - - - - - - - - 85 - - - - - - - 2,485 37 922220873.Clas
s D 60 - - - - - 60 - - - - - - - - - - - - 2,545
38 922220873.Class C
70 - - - - - 70 - - - - - - - - - - - - 2,615 39 925661160.Clas
s B 100 - - - - - - - - - - 100 - - - - - - - 2,715
40 904220415.Class A
50 - 50 - - - - - - - - - - - - - - - - 2,765 41 904220415.Clas
s E 55 - 55 - - - - - - - - - - - - - - - - 2,820
42 904220415.Class C
65 - 65 - - - - - - - - - - - - - - - - 2,885 43 904220415.Clas
s D 70 - 70 - - - - - - - - - - - - - - - - 2,955
44 904220415.Class B
75 - 75 - - - - - - - - - - - - - - - - 3,030 130 315 135 235 70 230 95 230 90 555 185 75 205 245 85 50 45 55

84
It is important to ensure that schools’ data in the current education management
information system is reliable and updated regularly. The process of estimation of both
the “school priority index” and “rehabilitation priority index” can be automated so that
the indices are computed for all schools in six provincial districts. This will enhance the
efficiency of the allocation procedure.