education experiment 5 row nov 2011 - adam equipment usa
TRANSCRIPT
EXPERIMENT 5
ACKNOWLEDGEMENTS
The creation of this experiment and its support materials would not have been possible without the scientific and pedagogical expertise of dedicated educators active in the field. Adam Equipment extends both acknowledgement and appreciation to the following teachers for their assistance in making this classroom activity available to the education community:
Penney Sconzo (Westminster High School, Atlanta, GA) – project leader and experiment author
Skip Trimpe (Athens Academy, Athens, GA) - peer reviewer and adviser
PERMISSIONS AND ACCEPTABLE USAGE
The content of this experiment is owned and copyrighted by Adam Equipment. Adam Experiment student worksheets may be copied and distributed for educational purposes only. No copying or distribution of either the student worksheets or the teacher support materials is allowed for commercial or any other purposes without prior written permission of Penney Sconzo and Adam Equipment.
SOIL CHEMISTRYDealing With Data Can Get Rough!
Contents:Pages 2-6: Teachers’ GuidePages 7-8: Student HandoutPage 9: Sample Data
Adam [email protected]
www.adamequipment.com© Adam Equipment 2011

SOIL CHEMISTRYDealing With Data Can Get Rough!
AGE LEVEL This experiment is designed for ages 12-14. It can be adapted for physical science or introductory chemistry classes.
SUBJECTS Rocks and Minerals; Weathering, Soil and Erosion; Science as Inquiry; and Data Analysis.
PURPOSES1. To gain experience in collecting mass readings and averaging a set of data.
2. To graph data and find the slope of the graph.
3. To understand the relationship between mass and volume. (density = mass/volume)
4. To compare the density of different sand samples.
TIME NEEDEDOne laboratory period. Additional time may be required for analysis of data and additional discussions.
ACTIVITY OVERVIEW Sand samples are placed in a volume of 1.0 cubic centimeter and massed. Class data is collected to find the average mass of one cubic centimeter of sand. Density, an intensive property of a substance, is determined.
This lesson is designed to be easily and quickly integrated into existing curriculum. It comes complete with a two-page student hand-out, standards correlations, vocabulary lists, plus extensions and assessment tools with answer keys. This Adam Experiment is appropriate for remedial, review, reinforcement, or extension purposes.
HELPFUL ADVICE TO MAXIMIZE SAFETY AND STUDENT SUCCESS1. As always, students should be encouraged to wear safety goggles during any laboratory experiment.
2. Scissors are sharp! Report any accident or injury, no matter how small.
3. Discuss the accuracy of centigram balances.
SCIENCE SKILLS AND ABILITIESSCIENCE AS INQUIRYAbilities necessary to do scientific inquiry:
1. Develop descriptions, explanations, predictions, and models using evidence and explanations. (ages 10-13)
2. Formulate scientific explanations and models using logic and evidence. (ages 14-18)
3. Using mathematics in scientific inquiry. (ages 10-18)
DATA ANALYSIS, PROBABILITY AND DISCRETE MATHEMATICSUnderstand and apply data collection, organization and representation to analyze and sort data. (ages 10-18)
GEOMETRY AND MEASUREMENTUnderstand and apply appropriate units of measure, measurement techniques, and formulas to determine measurements. (ages 10-18)
© Adam Equipment 2011Page 2
1Teacher Guide
© Adam Equipment 2011 Page 3
BACKGROUND INFORMATIONSoil, which covers most land surfaces, is composed of many different sized particles. Earth scientists define soil as a collection of weathered rocks with some decayed organic matter added. It can take as many as a thousand years to form one inch of soil. Soil is made up of varying amounts of sand, silt and clay. The soil components affect the ability of the soil to hold water and air.
A soil profile is a vertical section of all the layers or horizons that make up the soil. To familiarize yourself with the materials in this experiment, you can go into a field and collect a sample of soil using a narrow hand trowel. Mix about a cup of soil with three cups of water, place in a quart size glass container and let the mixture settle. You will observe different layers as they settle out. The larger the particle size, the faster the particles will settle. Careful observations will give you an indication of the amount of each component in the soil. After about 30-40 seconds you will observe the first layer of gravel and thick sand. Fine sand and silt will be settling out after about 30 minutes.
The top layer, called the topsoil or the A horizon, is gray to black in color. It is a mixture of organic material called humus and coarse sediment. Next is the beginning of the subsoil called the B horizon, which is a lighter color. Clay washes down to the B horizon, which leaves the A horizon rather sandy. Iron oxides and soluble minerals containing calcium and magnesium ions also wash into the B horizon. The C horizon that follows is composed of slightly weathered rocks that rest on top of bedrock, the parent material for all the soil.
Sand, gravel, clay and silt are sediments produced by the physical and chemical breakdown of rocks. 1) Sand particles range in diameter from 1/16 mm to 2 mm. Sand feels gritty. 2) Just smaller in size at less than 1/16 mm is silt, which feels smooth like flour when rubbed. 3) Clay is the finest and silkiest of these three. Usually, clay has been moved around more by wind, rivers, or perhaps glaciers. When moistened and rubbed between your fingers, clay makes a smooth continuous smear. Separate particles can be seen only under a microscope.
Particles larger than 2 mm in size are called gravel. Large rocks, pebbles and granules are different sizes of gravel. All these forms of sediments can then be eroded and perhaps transported by either wind or water. This material could end up as deposits in lakes, rivers, or oceans. Over time, the material could be buried within the earth to harden and form sedimentary rock.
Let’s look closer at one of the soil components, sand. Sandy soil has excellent draining properties. Sand is defined as a naturally occurring material composed of finely divided rock and mineral particles. One of the most basic forms of minerals on earth, sand is found almost everywhere. The most common type of sand is called silica and usually takes the form of quartz. Silicon dioxide, SiO2, is the chemical name for very hard grains of sand. The exact composition of sand can vary depending on the mineral sources and the weathering conditions.
© Adam Equipment 2011Page 4
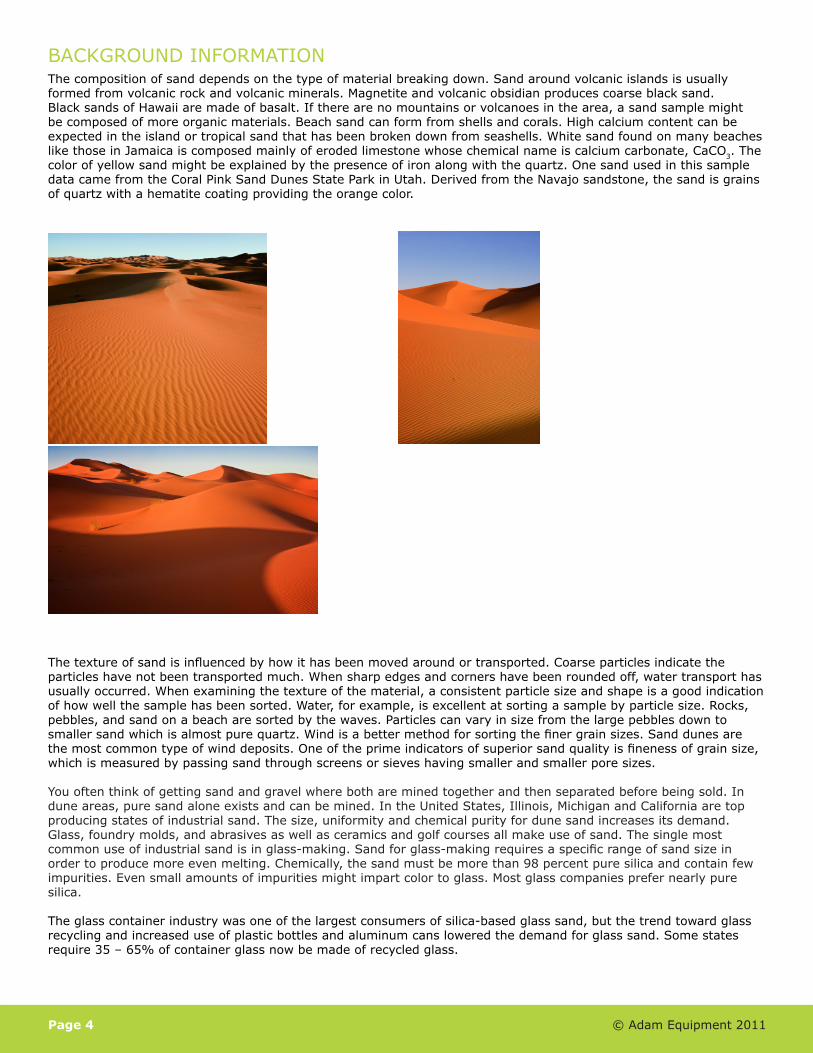
BACKGROUND INFORMATIONThe composition of sand depends on the type of material breaking down. Sand around volcanic islands is usually formed from volcanic rock and volcanic minerals. Magnetite and volcanic obsidian produces coarse black sand. Black sands of Hawaii are made of basalt. If there are no mountains or volcanoes in the area, a sand sample might be composed of more organic materials. Beach sand can form from shells and corals. High calcium content can be expected in the island or tropical sand that has been broken down from seashells. White sand found on many beaches like those in Jamaica is composed mainly of eroded limestone whose chemical name is calcium carbonate, CaCO3. The color of yellow sand might be explained by the presence of iron along with the quartz. One sand used in this sample data came from the Coral Pink Sand Dunes State Park in Utah. Derived from the Navajo sandstone, the sand is grains of quartz with a hematite coating providing the orange color.
The texture of sand is influenced by how it has been moved around or transported. Coarse particles indicate the particles have not been transported much. When sharp edges and corners have been rounded off, water transport has usually occurred. When examining the texture of the material, a consistent particle size and shape is a good indication of how well the sample has been sorted. Water, for example, is excellent at sorting a sample by particle size. Rocks, pebbles, and sand on a beach are sorted by the waves. Particles can vary in size from the large pebbles down to smaller sand which is almost pure quartz. Wind is a better method for sorting the finer grain sizes. Sand dunes are the most common type of wind deposits. One of the prime indicators of superior sand quality is fineness of grain size, which is measured by passing sand through screens or sieves having smaller and smaller pore sizes.
You often think of getting sand and gravel where both are mined together and then separated before being sold. In dune areas, pure sand alone exists and can be mined. In the United States, Illinois, Michigan and California are top producing states of industrial sand. The size, uniformity and chemical purity for dune sand increases its demand. Glass, foundry molds, and abrasives as well as ceramics and golf courses all make use of sand. The single most common use of industrial sand is in glass-making. Sand for glass-making requires a specific range of sand size in order to produce more even melting. Chemically, the sand must be more than 98 percent pure silica and contain few impurities. Even small amounts of impurities might impart color to glass. Most glass companies prefer nearly pure silica.
The glass container industry was one of the largest consumers of silica-based glass sand, but the trend toward glass recycling and increased use of plastic bottles and aluminum cans lowered the demand for glass sand. Some states require 35 – 65% of container glass now be made of recycled glass.
KEY VOCABULARYBASALT: A dark-colored, extrusive, igneous rock.
BEDROCK: The solid rock that underlies loose material, such as soil, sand, clay or gravel.
ERODE: The process by which Earth materials are carried away and redeposited by natural agents such as wind, water, gravity or ice.
GRAM: A fundamental unit of mass used in the metric system (equal to the weight of one cubic centimeter of distilled water at 4°C).
HUMUS: Material formed from decayed organic matter, found in topsoil.
INTENSIvE PROPERTY: A property that does not vary with the size of the sample.
MASS: A measurement that reflects the amount of matter (more precisely, the sample’s weight divided by acceleration due to gravity).
SILICA: A glassy, very hard mineral, silicon dioxide, SiO2, found in a variety of forms, as in quartz, opal, chalcedony or chert.
QUARTz: A mineral composed of oxygen and silicon.
MAGNETITE: A magnetic mineral, Fe3O4, is one of the primary ores on iron. It is sometimes called lodestone.
OBSIDIAN: A type of black glass produced by volcanoes.
FOUNDRY: A place where metal is melted and molded.
© Adam Equipment 2011 Page 5

© Adam Equipment 2011Page 6
ADDITIONAL RESOURCESVisit adamequipment.com/education regularly for new classroom resources.
ABOUT ADAM EQUIPMENTAdam Equipment’s world headquarters is located in Milton Keynes, United Kingdom, with facilities in the United States, Australia, South Africa and China. The company’s balances have been trusted by professionals worldwide for 40 years. Contact Adam Equipment at [email protected] or online at www.adamequipment.com/education.
ADAM EQUIPMENT BALANCES RECOMMENDED FOR THIS EXPERIMENTHighland Portable Precision BalanceModels recommended for this experiment:HCB302 (300g capacity x 0.01g readability)or HCB123 (120g capacity x 1mg readability)
Complete with more features and accessories than any other in its class, Adam Equipment’s Highland Portable Precision Balances have what it takes for school and college applications. The reliable Highland provides the latest in weighing technology, 15 weighing units with four weighing modes and it is easy enough for novice students. It features Adam’s unique patented ShockProtect™ overload protection to withstand up to 200kg, and HandiCal™ internal calibration with built-in mass. Calibrate whenever you want without external masses or use your own masses. USB and RS-232 interfaces are both included with cables. The rechargeable battery (adapter/charger included), removable draft shield and brilliant backlit display with capacity tracking make Highland the most complete portable precision balance available. Available in seven models from 150g x 0.001g to 3000g x 0.1g. For complete product details, visit www.adamequipment.com/education.
Core Portable Compact BalanceModel recommended for this experiment:CQT202 (200g capacity x 0.01g readability)
Compact and durable, no other balance can beat the Core for basic weighing value. The tough, durable ABS housing is designed to withstand classroom environments, while being easy to clean and protected from accidental spills. With built-in ShockProtect™ overload protection, Core balances can handle excessive overloads without a problem. The simple keypad with dual tare keys and a brilliant backlit display make Core balances easy to use. Complete with a removable draft shield, AC adapter, and integral security slot, Core balances are ready to work right out of the box.
GETTING INVOLVED IN ADAM EQUIPMENT’S EXPERIMENTSFeedback On This Adam Experiment
If you have feedback on this Adam Experiment that would be valuable to other teachers, we encourage you to share your thoughts. Please email your comments to Adam’s education division at [email protected].
Submitting Your Own ExperimentIf you have an idea for a useful educational resource that you would like to share with other teachers, Adam Equipment is interested in hearing from you. Initial submissions need to include only a simple description of the activity with the activity’s purpose, subject, and grade level. Please contact Adam’s education division by e-mail at [email protected] to determine if your particular activity will fit into our experiment library. Adam Equipment will respond promptly to all inquiries.

In this laboratory, a property of sand will be investigated.
PURPOSE1. To gain experience in collecting mass readings and averaging a set of data.
2. To graph data and find the slope of the graph.
3. To understand the relationship between mass and volume.
4. To compare properties of different sand samples.
MATERIALS• 3 x 5 notecards, cut in half • Graph paper or graphing calculator
• Tape • Sand samples from different locations
• Metric ruler • Balance (reading to .01 or .001g)
PROCEDURE1. From a piece of a notecard, construct a cubic centimeter box with a lid that remains open. The edges must be
sealed with tape so dry material will not spill out. (Put your initials on the box). This box will be used to measure samples.
2. Record the following data. Fill the box with a sample of sand.
Type of Sand
Mass of box
Mass of box and sand
Mass of sand
Density of sand
3. Collect the density measurements from each student and calculate the average density for the class data.
SOIL CHEMISTRYDealing With Data Can Get Rough!
INTRODUCTIONUses for a Cubic Centimeter when Examining Sand
Earth scientists define soil as a collection of weathered rocks with some decayed organic matter added. It can take as many as a thousand years to form one inch of soil. The soil is made up of varying amounts of sand, silt and clay.
Sand particles in the soil can range in diameter from 1/16 mm to 2 mm. These sand particles feel gritty. Sand is defined as a naturally occurring material composed of finely divided rock and mineral particles. One of the most basic forms of minerals on earth, sand is found almost everywhere. The most common type of sand is called silica and usually takes the form of quartz. Silicon dioxide, SiO2, is the chemical name for the very hard grains of sand. The exact composition of sand can vary depending on the mineral sources and the weathering conditions.
The single most common use of industrial sand is in glass-making. Glass-making requires a specific range of sand size in order to produce more even melting. Chemically, the sand must be more than 98 percent pure silica and contain few impurities. The glass container industry was one of the largest consumers of silica-based glass sand, but the trend toward glass recycling and increased use of plastic bottles and aluminum cans has lowered the demand for glass sand. Some states require 35-65 percent of container glass now be made of recycled glass.
© Adam Equipment 2011 Page 7
2Student Section

4. Mass a weighing pan or weighing cup. Use the box to measure 1cm3 of sand and dump the sand into the weighing pan. Record the mass of the pan and sand. Alternatively, the mass of the pan can be tared out and just the sand measurement recorded.
5. Add an additional cm3 of sand to the weighing pan and record the total mass of the sand. Continue adding one cm3 of sand and recording total mass until you have 10 mass measurements.
6. Graph volume (cm3) vs. mass (grams). Select two data points and determine the slope by Δy/Δx.
7. Using a graphing calculator, calculate the slope using all 10 data points.
QUESTIONS1. Students will get different values for the mass of sand contained in the cubic centimeter and the density of the
sand. What possible errors could explain these variations?
2. How is sand created?
3. What is the difference in mechanical weathering and chemical weathering? How can plants contribute to each?
4. Why are streets and highways damaged so much more in winter than in summer months?
5. What is sand made up of?
6. What are some of the economic uses for sand?
EXTENSIONS/SUGGESTED HOMEWORK ASSIGNMENTS1. Give the students a piece of granite and have them try to use different weathering techniques (mechanical and
chemical) to break down the rock.
2. Give the students sand from different beaches (black, pink, yellow, and white) and have them try to figure out what basic rocks or substances make up the sand.
3. Some sand dunes in the United States are protected as natural parks (Great Lakes, Southern California, and Utah). Why is it necessary to protect these parks?
© Adam Equipment 2011Page 8
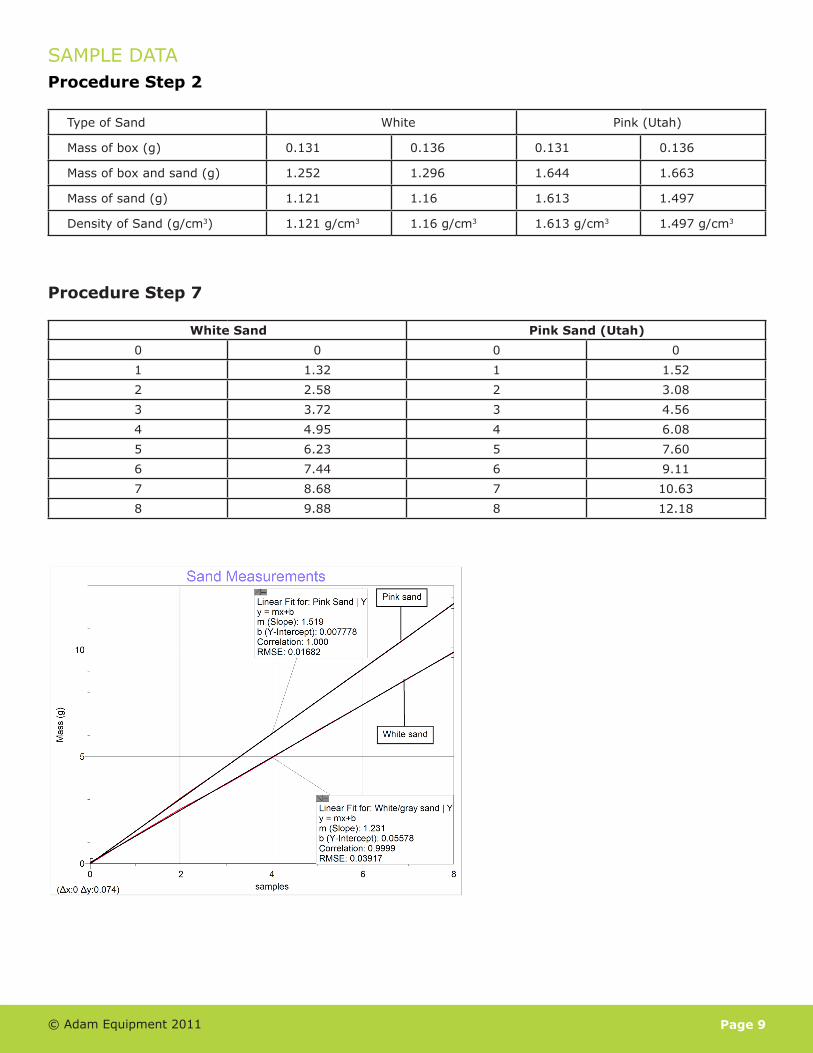
SAMPLE DATAProcedure Step 2
Type of Sand White Pink (Utah)
Mass of box (g) 0.131 0.136 0.131 0.136
Mass of box and sand (g) 1.252 1.296 1.644 1.663
Mass of sand (g) 1.121 1.16 1.613 1.497
Density of Sand (g/cm3) 1.121 g/cm3 1.16 g/cm3 1.613 g/cm3 1.497 g/cm3
Procedure Step 7
White Sand Pink Sand (Utah)
0 0 0 01 1.32 1 1.522 2.58 2 3.083 3.72 3 4.564 4.95 4 6.085 6.23 5 7.606 7.44 6 9.117 8.68 7 10.638 9.88 8 12.18
© Adam Equipment 2011 Page 9