education in a declining economy
TRANSCRIPT

ED 337 411
AUTHORTITLE
INSTITUTION
REPORT h0PUB DATENOTE
AVAILABLE FROM
PUB TYPE
EDRS PRICEDESCRIPTORS
IDENTIFIERS
ABSTRACT
DOCUMENT RESUME
SO 021 653
Kelly, Michael J.Education in a Declining Economy: The Case of Zambia:1975-1985. EDI Development Policy Case Series.Analytical Case Studies Number 8.World Bank, Washington, DC. Economic DevelopmentInst.
ISBN-0-8213-1776-8; ISSN-1013-333XMar 91231p.
Publications Sales Unit, World Bank, 1818 H Street.NW, Washington, DC 20433.Reports - Research/Technical (143)
MF01 Plus Postage. PC Not Available from EDRS.Demography; *Developing Nations; Economic Factors;Educational Administration; Educational Demand;*Educational Development; *Educational Economics;*Educational Finance; Educational Policy; ElementarySecondary Education; Foreign Countries; HigherEducation; *International Education; *ResourceAllocation; Tables (Data)*Zambia
In recent years Zambia has experienced increasinglygrave financial problems. The decline in the economy has affected allsectors, including education. The deterioration occurred at a timewhen the population was growing at a rapid rate. Hence the educationsector has been subject to two opposing pressures: a fiscal pressureto curtail financial commitments and a demographic pressure toincrease the provision of education. The outcome has been a virtualstagnation in resource allocation, a substantial increase inenrollments, and, in consequence, a reduction in unit expenditure.Nevertheless, public confidence in education as an instrument ofdevelopment remained high. Even the most indigent people did notquestion the need to make substantial sacrifices so that the childrencould have a school educatior.. Although not every problem was solved,the years 1980-1985 showed more determination, confidence, andmaturity than the previous 5 years on the part of teachers,administrators, and the general public, who cooperated in what was ineffect a massive rescue operation to expand and improve the provisionof education. This report presents a portrait of Zambian educationduring the years 1975-85. There are 19 chapters: (1) The impact ofeconomic decline of education; (2) The development of education inZambia before 1975; (3) The decline of Zambia's economy; (4)Demography; (5) The financing of educatioa, 1975 to 1985; (6)Financing education: some critical issues; (7) Official developmentassistance for education; (8) Nongovernmental resources for financingeducation; (9) Educational provision at the primary and secondarylevels; (10) The quality of education; (11) Curriculum issues; (12)Evaluating educational performance; (13) The teache:: during the yearsof economic difficulty; (14) rie pupil in school and afterwards; (15)Educational supervision, planning, and decisionmaking; (16)Continuing education prngrams; (17) The University of Zambia duringthe years of economic difficulty; (18) The general level ofeducation; and (19) The robustness of the education system. There arenumerous tables of data throughout the report and an eight-page listreferences is Included. (Author/DB)

to
il
0 -
EST COPY AVAILABLE2
II,
U II DEPARTMENT OF EDUCATIONOffice of Educational Research and improvement
EDUCATIONAL RESOURCES INFORMATIONCENTER (ERIC)
)1(11:rfie document haS been reproduced asecewed from the person or organization
originating it0 Minor changes have been made to 'mom. N
reproduction quality
Points of view Of Opinions Staled in this document do not neceSSardy represent officialOE RI poSif on Or poliey
"PERMISSION TO REPRODUCE THISMATERIAL IN MICROFICHE ONLYHAS BEEN GRANTED BY
T.
TO THE EDUCATIONAL RESOURCESINFORMATION CENTER (ERIC)"

EDI DEVELOPMENT POLICY CASE SERIESANALYTICAL CASE STUDIES No. 8
Educationin a Declining Economy
The Case of Zambia1975-1985
Michael J. Kelly
The World BankWashington, D.C.

Copyright 0 1991The International Bank for Reconstruction and Development / THE WORLD BANK
1818 H Street, N.W.Washington, D.C. 20433, U.S.A.
All rights reservedManufactured in the United States of AmericaFirst printing March 1991
The Economic Development Institute (EDI) was established by the World Bank in 1955 to train officials
concerned with development planning,policymaking, investment analysis, and project implementation in
member developing countries. At present the substance of the EDI's work emphasizes macroeconomic and
sectoral economic policy analysis. Through a variety of courses, seminars, and workshops, most of which
are given overseas in cooperation with local institutions, the EDI seeks to sharpen analytical skills used
in policy analysis and to broaden understanding of the experience of individual countries with economic
development. in addition to furthering the EDI's pedagogical objectives, Policy Seminars provide forums
for policymakers, academics, and Bank staff to exchange views on currentdevelopment issues, proposals,
tInd practices. Although the EDI's publications are designed to support its training activities, many are
of inierest to a much broader audience. EDI materials, including any findings, interpretations, andconclusions, are entirely those of the authors and should not be attributed in any manner to the World
Bank, to its affiliated organizations, or tomembers of its Board of Executive Directors or thecountries they
represent. The map that accompanies the text has been prepared solely for the convenience of the reader;
the designations and presentation of material in it do not imply the expression of any opinion whatsoever
on the part of the World Bank, its affiliates, or its Board of member countries concerning the legal status
of any country, territory, city, or area, or of the authorities thereof, or concerning the delimitation of its
boundaries or its national affiliation.Because of the informality of this series and to make the publication available with the least possible
delay, the manuscript has not been edited as fully as would be the case with a mote formal document, and
the World Bank accepts no responsibility for errors.The material in this publication is copyrighted. Requests for permission to reproduce portions of it
should be sent to Director, Publications Department, at the address shown in the copyright notice above.
The World Bank encourages dissemination of its work and will normally give permission promptly and,
when the reproduction is for noncommercial purposes, without asking a fee. Permission to photocopy
portions for classroom use is not required, though notification of such use having been made will be
appreciated.The backlist of publications by the World Bank is shown in the annual /ndex ofPublkations, which is
available from Publications Sales Unit, The World Bank, 1818 H Street, N.W., Washington, D.C. 20433,
U.S.A., or from Publications, Banque mondiale, 66, avenue d'Iéna, 75116 Paris, France.
Michael J. Kelly is a professor at the School of Education, University of Zambia.
Library of Congress Cataloging-in-Publication Data
Kelly, Michael J.Education in a dechning economy : the case of Zambia, 1975-1985 /
Michael J. Kelly.p. cm. -- (EDI development polic casa series. Analytical
case studies ; no. 8)Includes bibliographical references.ISBN 0-8213-1776-81. Education--Economic aspectsZambia. 2. EducationZambia--
History-20th century. 3. EducationZamlnaPinance. 4. Zambia--
Economic conditions-1964- I. Title. II. SeriesLC67.Z33K45 1991370 .96894dc20 91-2217
CIP
EDI Catalog No. 120/022 ISSN 1013-333X

Contents
Abbreviations vii
Acknowledgments ix
Preface xi
Summary xiii
1. The Impact of Economic Decline on Education /
2. The Development of Education in Zambia before 1975 6
The Precolonial Era 6The Period of British South Africa Company Administration 7The Colonial Era, 1924 to 1952 8The Federal Era, 1953 to 1963 IIEducation at Independence 13The Decade of Comparative Prosperity, 1964 to 1974 14
3. The Decline of Zambia's Economy 16The Dependence on Minerals 16Oil Prices 19Trade Routes 19Terms of Trade 19External Debt 20Underutilization of Capacity 2 IDecline in Investment and Growth in Consumption 21Employment 21Agriculture "?Rural-Urban and Income Disparities 23Inflation 24

iv Contents
Gross Domestic Product 24Deficit Financing 24Conclusion 25
4. Demography 26Characteristics of the Population 26Population and Education 28The Data Base 29
5. The Financing of Education, 1975 to 1985 30
The Financing of the Social :services Sector 30The Financing of Education 33Expenditure by Level of Education 36Unit Costs 36Expenditure by Function 40Capital Expenditure 43Education's Investment Needs 45
6. Financing Education: Some Critical Issues 47
Teachers' Salaries 47Transfer Payment, 52The Availability of Textbooks and Teaching Materials 54School Maintenance 60Imbalances in the Financing of Education 6 1
7. Official Development Assistance for Education 64
Aid to Education 64Aid and the Establishment of Priorities 66The Management of Aid to Education 66'The Impact of Aid to Education 69Criticisms of Aid to Education 70Future Priorities for Aid to Education 73
8. Nongovernment Resources for Financing Education 78
Parental Payments 78Self-Help Activities 79Production Activities 80Private Schools 80Grant-Aided Schools 83Increased Privatization and Policy Adjustments 84
9. Educational Provision at the Primary and Secondary Levels 86
The Expansion of Primary School Enrollments 86The Growth Rate of Primary School Enrollments 88The Expansion of Secondary Schools 89
Con'ents u
Secondary School Boarders 91Basic Education Schools 92Progression within the School System 93The Education of Girls 98Geographic Disparities 99Repetition and Efficiency 101
10. The Quality of Education 103
The Education Provided 103School Quality in Zambia 105
11. Curriculum Issues 110
Curriculum Development 110The Language of Instruction 111Political Education 113Population Education 114Mathematics and Science Education 114
12. Evaluating Educational Performance 116
Examination Reforms, 1975 to 1985 116The AdministraCm and Management of Examinations, 1975 to 1985 118Perfbrmance in EAaminations, 1975 to 1985 119'Ihe Examination Pyramid 129Overvie iv of Examination Performance 129
13. The Teacher During the Years of Economic Difficulty 130Primary School Teachers 130Secondary School Teachers 135Issues Affecting Both Primary and Secondary School Teachers 140
14. The Pupil in School and Afterwards 146Children's Nutritkmal Status 146The Family's Educational Background 147Children Not in School 149School-Leavers 149Unemployment 151The Informal Sector 153The Informal Sector and the School Curriculum 153
15. Educational Supervision, Planning, and Decisionmaking 155The Inspectorate 155Educational Planning 157The Educational Reform Movement 159The Educational Reform Movement and the Decline of the Economy 161Content of the Educational Reforms 162

vi Contents
Status of the Educational Reforms, 1978-84 163The Education Reform Implementation Project 164
Forms of Educational Decisionmaking 165The Personnel Needed for Decisionmaking 165
16. Continuing Education Programs 167
The Departmcnt of Continuing Education 167The National Correspondence College 168Supervised &tidy Groups 168Evening Classes 169Schools for Continuing Education 169Conclut,icn 169
17. The University of Zambia During the Years of EcoaomicDifficulty 171
Admissions and Enrollments 172The University end Development Needs 172Staffing 179The Staff' Development Program 179StaffAttrition 181Financing the University 182The Use of Funds 184The Cnst of a University Graduate 185The Cost of University Closures 186The Salaries of Teaching Staff 187Postgraduate Studies and Research :89Conclusion 190
18. The General Level of Education 192
The Educational Level of the Population 192Literacy 194Literacy Programs 195
19. The Robustness of the Education System 196
References 199

Abbreviations
A-levelBSAC
CDC
CIDACSO
ECAEEC
EIUFAOFINNIDAGRZILOJSSLENGONORADNRGOECD0-levelSHAPESIDAUNUNDPUNESCOUNFSSTD
UNICEFUNIP
advanced levelBritish South Africa CompanyCurriculum Development CentreCanadian International Development AgencyCentral Statistical OfficeEconomic Commission for AfricaEuropean Economic CommunityEconomist Intelligence UnitFood and Agriculture 0,ganization of the United NationsFinnish International Developmeat AgencyGovernment of the Republic of ZambiaInternational Labour OrganisationJunior Secondary School Leaving Examinationnongovernmental organizationRoyal Norwegian Development AgencyNorthern Rhodesia GovernmentOrganisation for Economic Co-operation and Developmentordinary levelSelf-Help Action Plan for EducationSwedish International Development AuthorityUnited NationsUnited Nations Development ProgrammeUnited Nations Educational, Scientific, and Cultural OrganizationUnited Nations Financing System for Science and Technology forDevelopmentUnited Nations Children's FundUnited National Independence Party
vii
Acknowledgments
I carried out this study, which was jointly sponsored by the Government of theRepublic of Ireland, through the Higher Education for Development CooperationOffice (HEDCO), and the Economic Development !nstitute (EDI) of the WorldBank, while on sabbatical leave in 1987 from the University of Zambia. I wish tothank the sponsors for asking me to undertake this work and the university forextending my sabbatical leave to enable me to complete it.
I wish to express my gratitude to the many people who responded to my requestsfor information. Special thanks are due to Mr. C. Siamotowe of the ExaminationsCouncil; Fr. T. McGivern S.J. of the Inspectorate; Mr. E. Ngoma of the PlanningUnit; Ms. J. Calder, Professor G. Lurogu, Mr. G. Mufuzi, and Dr. D. M. Sibalwa,all of th University of Zambia; Mr. C. Chirwa of the Kenneth Kaunda Foundation;and to the teachers, college lecturers, and school inspectors whc answered myquestionnaires. Note, however, that the organization of the material and the viewsexpressed in the report are my own and should nt be attributed to any of the personswho provided me with information.
I wish also to extend special thanks to my research assistants, Stelia Nkwanga,Crispin Chikwasha, M:chael Botha, and Fred Chanda for the painstaking way inwhich they compiled information from various documents. I must also thank mycompanions in Luwisha House, Lusaka, and my sister, Maureen, in Newbridge,Ireland, for their patient understanding and generous support during the periodwhen I was so preoccupied with this report. Finally, I acknowledge myindebtedness to Ms. Alice Dowsett of the Economic Development Institute whotransformed my study into a book and shepherded it through publication.
I trust that this study will contribute to an understanding of the way an educationsystem can survive when the financial climate is hostile, and how it can even bestrengthened once the system has come to grips with the adverse circumstances.Such knowledge might help policymakers provide better for the needs of children,even when resources are scarce.
M. J. KellySchool of EducationUniversity of ZambiaLusaka
9

Preface
During the past 12 years, Zambia has experienced increasingly grave financialproblems. The dech..e in the economy has affected all sectors, indingeducation. The deterioration occurred at a time when the population was growing ata rapid rate. Hence the education sector has been subject to two opposing pressures:a fiscal pressure to curtail financial commitments and a demographic pressure toincrease the provision of education. The outcome has been a virtual stagnation inresource allocation, a substantial increase in enrollments, and, in consequence, areduction in unit expenditure. The government has financed the growingeducation sector by reducing the real incomes of teachers, allowing a witheringaway of public funds for all but the most essential salary payments, relying moreheavily on contributions from the community and participation by the privatesector, and turning to foreign aid for general budgetary support.
The subsectors of education have not been equally affected, however. Thoseconsidered more prestigious have been maintained and have even increased theirshare of resources, while those less powerful have experienced the greatest losses.Thus, the overall allocati, n of resources shifted from the primary and secondarylevels to the university; more resources were provided for instructional materialsat the secondary Elan at the primary level; community efforts were directed towardthe expansion of secondary facilities; the bulk of foreign aid was used forsecondary schools and the university; continuing and nonformal education weresupported only erratically; and the proportion of female students declined at theuniversity level and improved little at the secondary level, although it did increaseat the primary level.
The education sector responded predictably. Despite the best efforts of teachers,supervisors, and administrators, the quality of the education provided declined.Teaching and learning materials and school furniture were in short supply andwere distributed unevenly. In consequence, students' performance remained at amediocre level; indeed, that it did not deteriorate even more is remarkable.
Nevertheless, public confidence in education as an instrument of devele ?mentremained high. Even the most indigent people did not question the need to makesubstantial sacrifices so that their children could have a school education. Theywillingly paid for school supplies, additional school facilities, and heavy school-related expenses (such as uniforms). As the economic situation worsened, people'sfaith in the ability of education to deliver ther, and their children from the
xi
11

xii Preface
oppression of poverty increased. As wage employment became scarcer, peopleattached greater store to educational credentials as the necessary, if not alwayssufficient, passport to such employment.
This public confidence in the power of education probably helped prevent theallocation of resources from slipping back too far. It may also have contributed tothe renewal of education after the first few years of hardship. What emergesclearly from an examination of events since 1976 is the variety of ways in whichafter some years of faltering, die education system set itself once again on course.Although not every problem was so77ed, the years 1980 to 1985 showed moredetermination, confidence, and maturity than the previous five years on the part ofteachers, administrators, and the general public, who cooperated in what was ineffect a massive rescue operation to expand and improve the provie _a of education.
The economic decline .:reated many difficulties for the education system andbrought many material hardships to all engaged in the enterprise of educatingyoimg people. But it appears also to have brought the benefits of greeter self-reliance, clearer self-definition, and improved self-confidence. These gains maywell prove to be more enduring and more significant than the setbacks experiencedluring the years of difficulty.

Summary
In 1975 falling copper prices plunged Zambia into deep and serious economicdifficulties. These difficulties continued during the ensuing years and quicklyassumed crisis proportions. Notwithstanding the various measures taken duringthe past 12 years to arrest the deterioration, Zambia's economy has experienced asustained, rapid, and substantial decline that has adversely affected all areas andsectors of life. This study examines the impact of this economic decline on theprovision of formal education during the decade 1975 to 1985.
'1G set educational provision in its historical context, the study provides anoverview of the development of education before 1975 and highlights the fact that,although the economic crisis may have imposed new constraints on providingadequate and relevant education, several of the problems currently beingexperienced have accompanied the development of the education system since itsinception in the mid-1920s. Several issues that have a modern ring actually have arelatively long history, such as concern about the system's coverage, about thequality of the education being provided, and its suitability in preparing youngpeople to face a world where the number of formal sector job opportunities isseverely limited; about the ability to continue financing the system: and aboutgenerating the managerial capacity needed by a rapidly expanding educationalnetwork. Both the economic decline that gathered momentum after 1975 and theaccelerating rate of population growth aggravated these and other problems.Drawing on the findings of the 1980 population census, the study brings togethersome findings on the interaction between level of education and such populationvariables as fertility, age at first marriAge, and child mortality.
The general picture of resource allocation to education during the period 1975 to1985 shows efforts to maintain and increase the level of educational spending.Relative to other sectors in the economy, the share allocated to education showedsome tendency to increase, but the gain was slight, and its impact was nullified bythe rapid population growth. Consequently, there was a substantial reduc'ion inexpenditure per studeat, resulting in steadily diminishing funds for educationalmaterials and supplies; a depreciation of the real incomes of teachers to about 40percent of their 1975 valne; a greater reliance on the community for building andequipping schools; and increased calls on the private sector to participate in theprovision of education. The decade also saw growing dependence on foreign aid forsupport to the education sector.
iü

xiv Summary
Within the education sector, resources tended to b.: diverted away from theprimary, secondary, teacher training, and technical education levels and towardthe university. Unit costs at the primary level fell by ove? 25 percent and by over 50percent at the secondary level, but at the university they rose by more than 40percent.
Such a large proportion of available resources was sp nt on teachers' salaries,especially at the primary level, that little remainea to purchase essentialeducational materials. The study investigated the current supply situation in asample of primrry and secondary schools throughout the country and found acritical shortage of textbooks and teaching materials. At both the primary andsecondary levels, a significant number of pupils appeared to lack essential writingmaterials. An examination of the actual production figures showed that the outputalways fell short of requirements. Technical production problems, marketing anddistribution difficulties, and the chronic shortage of finance appeared to underliethese shortfalls. At the same time, however, large sums were being devoted eachyear to transfer payments, with the amount increasing at an average annual rateof more than 10 percent in real terms.
In general, therefore, the study found evidence of serious structural imbalancesin the financing of education in Zambia that became more marked during theyears of economic difficulty. These imbalances occur at two principal levels: in theallocation of resources between educational levels, and within each level, betweenfunctions: too much was devoted to the refined needs of too few at the higher level,and too little to the general needs of too many at the lower level. Moreover, too muchwas being devoted to personnel and to student subsidies and too little to moredirectly educational purposes. Policymakers' awareness of these problemsappeared to be growing, hence the economic crisis is seen as having the positiveoutcome of promoting the establishment of a clear order of priorities and offostering their translation into practice.
Notwithstanding the severe financial problems, the decade saw a sustained andrapid expansion of the school system at both the primary and secondary levels.During the first few years of economic difficulties there was some faltering, butsince 1980 growth rates have picked up and have accelr:rated, in many instances tolevels higher than the comparable rates for tl-e population as a whole.Accompanying this increased numerical covuage by ;he system, the proportion ofgirls who completed the full primary cycle increased. Little improvement wasobserved, however, in the proportion of girls participating in secondary educon,while at the university level the proportion actually declined.
The growt4.1 in numbers was not matched, however, by any correspondingimprovement in the relevance or quality of the education prov:ded. Although adecade of efforts was put into the process of educational reform, current educationalprovision is no more ste...essful in responding to students' real needs than duringcolonial times. A mainly academic program, deriving almost exclusively from aknowledge-based curriculum, aims primarily at allowing students to progressfurther within the education system, and ultimately to gain wage employment. Thesystem gives no consideration to the special learning needs of the large majoritywho must seek employment in the informal sector.
Although the evaluation of educational quality is problematic, Zambia'sshowing is negative on a number of indicators that are found to relate consistentlyto improved academic achievement. These indicators include per capitaexpenditures, the availability of instructional materials, the availability of libraryfacilities, the number of hours actually spent in classroom teaching, the

Summary xu
availability of school furnishings, and the nutritional status of students. Concernhas also been expressed about the quality of many university graduates and abouttheir ability to respond competently and flexibly to the responsibilities that areplaced on their shoulders. This latter problem may reflect the imbalance in theallocation of resources by the university toward administrative needs and awayfrom those more directly concerned with teaching and research.
To the extent that performance in public examinations is indicative ofeducational achievement, the picture is mixed. That the examination systemremained in place was perhaps a significant achievement in its own right. As tostudent performance, an analysis of raw scores suggests that performancedeteriorated somewhat in the terminal primary school examination. Somedeterioration was also apparent at higher levels, particularly in mathematics andscience. A notable feature in all examinations was the consistency with whichboys' performance surpassed that of girls.
Teachers were the most affected by the economic problems. To a large extent theywere denied the resources needed for the professional discharge of theirresponsibilities. Moreover, although their educational background improvedsteadily, their salaries declined sharply in real terms. Yet despite dissatisfactionwith their salaries, the numbers entering and remaining in teaching increased.This was almost certainly due to the absence of employment opportunities in othersectors of the faltering economy. But although there was a substantial improvementin the rete,-,tion of graduate secondary teachers, teachers in key areas such asEnglish, mathematics, and science were still in short supply.
The study attempted to assess whether teachers endeavored to supplement theirincomes by undertaking commercial activities concurrently with theireducational commitments. Although the evidence is not conclusive, many teachersdo apparently undertake such activities, devoting some of their official school timeto such undertakings. This practice is on the increase, and some teachers use thelabors of school pupils for these activities during school hours. However, a numberof indications showed that the teaching force, at both primary and secondary levels,was becoming more professior al, more highly motivated, and more confident of itsability to master the adverse circumstances that beset it. In an almost perversemanner, the financial crisis appears to have boosted teachers' morale and provideda climate in which teachers as a group have advanced to a new stage of professionalmaturity.
The study also examined a number of other areas. These include theeducational reform movement that occupied so central a place in educationalthinking during the decade; continuing education, which was seen as thecinderella of education, with its programs being perceived principally asproviding a parallel, second best route to educational qualifications; the Universityof Zambia, where it appeared that available resources could be used more effectivelyfor the institution's teaching and research responsibilities and for the developmentof good quality postgraduate and research work; and the population's low generaleducational and literacy level.
In conclusion, the study reflected on how the more vulnerable areasprimaryschools, teacher education, out-of-school youth, literacyexperienced the economicconstraints more severely, whereas such improvements as occurred were enjoyedby the more prestigious and powerful areas: the university and some aspects ofsecondary provision. It also noted the tendency to show more concern with gettingchildren into educational institutions than with providing the resources needed forthem to make solid progress after their admission. Nevertheless, despite the

xvi Summary
difficulties experienced the education system displayed considerable robt-stness.
Not only did it continue to operate and even to expand, but it became more aware of
the need to provide children with a better and more relevant form of education. In
particular, the strength of the social demand for education was noted. The study
suggests that to capitalize on these positive aspects
there should be closer integration between the school and community, so that
where financing is shared, responsibility could likewise be shared;
the importance of every child receiving seven years of good quality primaryeducation should be recognized and given top priority;
the education system should generate more information about itself and
process this information for the guidance of policymakers;
education should be financed in ways not practiced to date and be offered in
ways not hitherto conventional.

1
The Impact of Economic Declineon Education
During the 1960s and the early 1970s, almost every country in the world devotedan everincreasing share of its resources and annual budgets to education.However, the recession triggered by the rise in oil prices in 1973 caused a levelingoff and then a decline in the share of national resources going to education. Bothdeveloped and developing countries experienced this kind of downturn, but thelatter were more severely affected. This reduction in overall resources came at atime in their educational history when they were not yet providing basiceducational services for all their people, and when such services as they wereproviding were not of the quality that either aappliers or consumers wished them tobe.
The problems were compounded by the rampant inflation that accompanied therecession, which manifested itself in the rising cost of educational provision perstudent. This cost is largely due to the nature of educational delivery, whichdepends heavily on a face-to-face encounter in which one individual teache arestricted number of students. This labor-intensive feature of educational deliverymeans that a very large proportion of educational costs are attributable to teachers'salariesmore than 90 percent in some cases. The costs per student rose becauseteachers' salaries had to be raised in line with those in other sectors of the economy,and frequently at a rate that far outstripped inflationary growth.
Yet despite the tendency for resource levels to decline and for costs to rise,education systems were under pressure to maintain, expand, and improve upon theservices they provided. This pressure was applied very strongly in countries thatshared two educational/economic features: first, where a long history ofeducational neglect meant that a considerable proportion of the populace did nothave access to even the most elementary form of education, while access to levelsbeyond the elementary was severely limited; and second, where the possession ofsome education beyond the most elementary was considered a passport out ofpoverty and the uncertainties of a traditional subsistence economy into relativeaffluence ond modernity.
Zambia is one such country. This report focuses or. Zambia to document theextent of the financial squeeze on the formal education system, and to track theadjustments made in response to it. The Zambian case is of particular interestbecause the recession threw the entire economy into a state of almost total disarrayand collapse. (See figure 1.1 for a map of Zambia.) Before considering Zambia's

Figure 1.1
1 8
ZAMBIA
ADMINISTRATIVE DIVISIONSSOLNIZI
LUAPULA
NORTH-WESTERN
ZAMBEZI
District Boundaries
Region Boundaries
International Boundary
MWINILUNGA
1KABOMPO
CIIIZERA
SOLWEZ1
LUAPULA
COPPERBELT
KASEMPA
vrv+
JKAWAMBWA
MWENSE
NORTHERN
MANSASAMFYA
CH1LHABONSWE
MUITURA
NDOLACHINGOLA
HALULUSHI
UN
NDOLARURAL
LUNDAZI
SERENJELUANSHYA
CHIPATA EASTERN
KATETE CHAD
LUKULU
KALABO KAOMA
KVbENANGA
MONGU
WESTERNSESHEKE
SOUTHERN
LUSAKA

The Impact of Economic L. cline on Education 3
situation in detail, however, a discussion, in general terms, of the adjustmentslikely to characterize education's response to the economic recession in countriessimilarly affected is helpful.
During a period of economic hardship, an education system may be exposed totwo opposing pressures: fiscal and popular. The fiscal pressure is constrictive,seeking to constrain and sometimes to reduce the system so that its needs can bemet by a smaller proportion of national resources. The popular pressure isexpansionist, seeking at the very least to maintain the system, but almost Ftlwaysstriving to expand the number of students in the syste-n or to improve the quality ofservices provided. This expansionist pressure is greatly intensified when thepopulation is increasing rapidly. Popular pressure is always present, but duringtimes of hardship, it exacerbates fiscal pressure. The interaction of these pressuresresults in a compromise: fiscal provision from public resources responds to thedominant elements of popular demand, but is less responsive to weakercomponents. The price of this response is an increasing reliance on private andother nongovernmental resourcesaid from abroad, for exampleto finance andprovide education.
In most countries, education and health are the largest spenders of public funds,with education usually being the bigger of the two, as is the case in Zambia. Whenresources become tight, governments tend to look to these two areas for savings.One reason is that they are so large that the savings they can generate can besizeable, whereas corresponding savings in other areas might cripple activitiesentirely. A second reason is that governments see these areas as consumingresources that they might otherwise use to revitalize a sagging economy. At thesame time, hownver, these two sectors touch the public so intimately thatinterference with them is fraught with danger. In virtually every country, the"ability to satisfy popular demand for education (is) a necessary (though notalways sufficient) condition for political survival" (Weiler 1983, p. 40). Thuspolitical prudence requires that education and health budgets should be allowed tomaintain at least the principal services and those that the more articulate section ofthe public regards most highly.
The obvious requirements for education are to have in classrooms as large aproportion as possible of children of the relevant school-ing age; to enable asmany as possible to move to higher levels of education; and to give specialconsideration to these higher levels since they are the ones that lead to the bestemployment opportunities. Hence governments will use their limited resources tokeep classrooms full at the lowest levels, to get maximum returns from teachersand classrooms by allowing class sizes to grow almost unchecked, and whenpossible to provide more classrooms and extra teachers to cater to those as yet unableto gain admission; to increase opportunities for secondary education because of thehigh social value placed on it; and to provide unquestioning support to theuniverlity, partly because they believe it has a critical role to play in economicdevelopment, and partly because its considerable prestige, powerful lobby, andvirtual autonomy in managing its own affairs make it something of a sacred cow.These are the dominarkt components of the education system that the governmentwill maintain and expand.
The government will provide proportionately fewer resources for componentsthat are less visible. These include the actual content of courses taught and theirrelevance or use Ilness to life outside; the organization of the entire school systemwith its heavy Aphasis on examinations and selection; the nature of thecurriculum and the teaching methods used; and the effectiveness with which

4 Education in a Declining Economy: The Case of Zambia, 1975-85
schools can conduct their business. In other words, fewer resources will beavailable for the qualitative needs of the education system. The public would like tosee improvements here, of course, but is more concerned with receiving moreeducation rather than better education.
Other aspects of educational provision also suffer from a weak lobby and maytherefore prove vulnerable in a time of economic difficulty. These encompass anygroup that is less-advantaged with respect to another. Thus, within education as awhole, formal provision is likely to be less vulnerable than nonformal (Lewin1986; Lourie 1986); provision at the primary level is likely to suffer relative to thesecondary level, which in turn will suffer in relation to tertiary provision;provision for girls may suffer more than that foe boys; provision for thoserequiring special education because of mental or physical handicaps will not be asreadily forthcoming as for those who are not disabled; and urban areas will havemore facilities and better quality provision than rural areas.
Reorientations of this nature in the use of educational resources are unlikely totake place because of calculated decisions and explicitly formulated policy choices.Instead they will occur by way of ad hoc reaction to circumstances where the dailypressures will be such that the government's principal concern will be withsurvival and not with dynamic developments, Neither will the government makesuch adjustments in a radical fashion. Instead, a slow process of transformationwill arise from two complementary developments. Inescapable commitments,above all for salaries ar.d wages, will absorb most of the available reseurees.leaving very little for other equally important operating expenses. Thecommitment to wages and salaries will also leave little room for maneuverabilityin the disposition of resources, thus reducing the possiLility of introducingmeaningful reforms. Simultaneously, resources will be shifted away from thelower levels and toward the higher. This will be partly due to the greater impact onresources of high salaries and salary increases at the tertiary level, and partly tothe determination to maintain university level provision.
Accompanying these adjustments in the distribution of resources will be anincreased tendency to fall back on sources outside the government for the inputsneeded to maintain and develop the education system. Domestically, there will begreater .tiliance on the private sector. At the institutional level, this will manifestitself in the growth of private schools and in greater involvement ofnongovernmental bodies in the provision and management of education. At thelevel of the individual, it will manifest itself in various moves toward costsharing. The responsibility for costs not directly related to professionaleducational purposes are likely to be transferred to the parents or the communities.
Development assistance for education will tend to become more important. Thegovernment will seek aia for education from more diverse sources than in the pastand will use it for a wider variety of purposes, No longer will it be confined tostrictly capital developments, or to the dominant technical assistance componentsof personnel and training, but will encompass virtually every form of operatingcost (with the possible exception of salaries for local personnel). Although the totalvolume of foreign aidmay not be large in relation to the entire education budget, itwill have a disproportionately large effe ct. This is because in practice (though notin principle), it will be a form of gene, at budgetary support. Hence, it will providethe flexibility for innovation and for addressing critical points that the educationbudget lost through its commitment to inescapable expenditures.
As aid is becoming available from a wide variety of donors, is being directed toa multiplicity of projects and activities, and is virtually the only source of funds for
21

The Impact of Economic Decline on Education 5
meeting the less tangible needs of quality improvement, dealing with aid matterswill consume much tinie in the education ministries. Moreover, the ministrieswill take care to make educational plans as all-embracing as possible, without toosharp a delineation of priorities, so es nat to jeopardize potential aid. The difficultythe recipient country experiences in meeting all its educational needs, and ofteneven in formulating its wants, may lead to the donor having a powerful voice in theformulation (if educational pricrities; an influence that may find expression inconditionalities attached to the aid. The donor may wish to confine the resourcesprovided to consolidating, maintaining, or rehabilitating the existing system andits infrastructure rather than to developing new capacity. Developments may alsooccur in response to the external stimuli of donors rather than as locally conceivedinitiatives.
Finally, a word on possible attitudinal adjustments to the problems that havebeset education in many developing countries since the mid-1970s. At first, thecrisis might be expected to engender cmsiderable demeralization. Attention wouldbe riveted on the negative aspects: the shortages, the problems, the failures. At thesame time, government would retain a shred of hope that the general economicsituation might improve, both internationak and nationally, and that educationmight again experience more plentiful days. When governms.nts recognized thatno such improvements would come quickly or effortlessly, they would see that ifthere were to be changes for th., better, they would have to be self-initiated and on thebasis of a low level of material inputs. ErArience and confidence gained fromcoping with problems in the almost total absence of the necessary resources,together with te self-Lrsured recognition of' what an achievement it was not to havesuccumbed entirely to economic hardships, would combine to make them moreresolute and purposeful in pursuing objectives. They would have a more realisticappreciation of the resources needed to achieve these objectives and of the problemsin generating or improvising such resources. But they would also be morecommitted to do what they could to maintain and support the system, and totranslate that commitment into practice.
The pages that follow will examine the working out of these predictions in thecase cf Zambia, and will note in several different spheres the phenomenon of thefall and rise of education in an economy under decline.

2The Development of Education in Zambia
before 1975
"An education system is a result of decisions made and designs laid down bypast and present Governments" (UNESCO 1964, p. 1). This statement remains astrue today as when Radford and his colleagues first wrote it in their report on thefixture development of the education system of what was then known as NorthernRhodesia. Several of the concerns that beset the educational planner today havetheir origin in events that occurred years and even decades before; thus, anoverview of the education sector prior to 1975 follows as a backdrop to thedevelopments during the subsequent years of financial crisis. As this section willshow, several of the problems that are central to the education system today haveaccompanied its growth and development. Indeed, a sense of deja vu accompaniesa study of the problems that beset educational provision in the 1930s:
the economic constraints that limited the extension of education to everychild;the inability to formulate clear policies because of the government'scrippling "sense of poverty" (Coombe 1968, p. 372);the developments that occurred more in response to external stimuli than tolocal initiatives;the pervasive concern about the production of an educated cadre that could notbe absorbed into productive employment;the relevance of the education provided to the lives a most recipients;the danger of relapse into illiteracy by the large numbers of students obligedto leave school after too short a period of participation;the difficulty of ensuring that girls would be educated in the same numbersand to the same standards as boys;the apparent conflict between the provision of primary and secondaryeducation;the unsatisfactory quality of educational provision in the primary schools.
The Precolonial EraThe precolonial era in Zambia lasted until 1890 when the Lozi in the west of the
country and the British South Africa Company (BSAC) signed a treaty of protection
6

The Development of Education in Zambia Before 1975 7
and subsidy that gave the -ompany administrative control and mineral rights overa large area. During this era, education in the sense of "the transmission ofwisdom, knowledge, experience and skills" (Lane 1976, p. 1) flourished, since itwas a prerequisite for survival. This traditional education had five maincomponents:
instruction in the history and traditions of the people;training in practical skills through a loose form of apprenticeship;teaching about social obligations and the inculcation of good manners;development of awareness of and respect for the religious dimension of daily1 ife ;
concentrated preparation for the transition from childhood to adulthood insecluded initiations schools (Snelson 1974).
The initiation schools' activities tended to be systematic and rather formalized,but the other components of traditional education f01 under what today would betermed "nonformal" education. Two essential and related features of traditionaleducation deserve mention in the context of concerns about the education providedtoday and the resources required: first, traditional education was the responsibilityof the community, drawing on its own resources, and second, it was ideally suitedto the society in which it was given. Whatever other limitations traditionaleducation may have suffered from, it did not "alienate" the recipients from life inthe local community. Indeed, "its most obvious characteristic was its capacity toprepare children for liOng in the community" (Castle 1966, p. 44). The success thattraditional education so effortlessly achieved in this respect has eluded moderneducational endeavors, notwithstanding the investment of much thought and manyresources.
Toward the end of the precolonial era, Zambia was penetrated first bymissionary explurers, of whom David Livingstone was the most notable,subsequently by missionary evangelists (Arnot, Coillard, and Depelchin, forexample), and later by prospectors and treaty seekers, all of the latter in some wayrepresentatives of Cecil Rhodes' British South Africa Company. The establishmentof primary schools quickly followed the setting up of mission stations. The firstschool opened in 1883 at Limulunga, in Zambia's Western Province, with anenrollment of three boys (Snelson 1974). Today's formal school system developedfrom this simple beginning.
The Period of British South Africa Company AdministrationFollowing its agreement with the paramount chief of the Lozi in 1890, the BSAC
gradually extended its sphere of influence to other parts of the country. At first theregion was administered as North-Western and North-Eastern Rhodesia, butfollowing the amalgamation of the two sections in 1911, the BSAC administered thewhole territory as the Protectorate of Northern Rhodesia. Company rule continueduntil 1924, when the Colonial Office in London assumed responsibility for theterritory.
During the BSAC's administration, with but one exception the provision ofeducation remained the responsibility of the missionary agencies. The exceptionwas the Barotse National School, established in March 1907 following anagreement between the BSAC and the paramount chief of the Lozi that a proportion of

8 Education in a Declining Economy: The Case of Zambia, 1975-85
the tax collected in Barotseland (now the Western Province) wo ild be used toprovide education for the Lozi people. All other educational developments up toApril 1924 depended almost entirely on the "initiative, energy, perseverance, andfinancial resources of the missionary societies" (Snelson 1974, p. 269). By the timeBSAC rule ended, about 1,500 schools were scattered throughout the territory, allpoorly equipped. The enrollment was approximately 50,000. The schools werefinanced by whatever the impoverished missionary societies could afford. Thefailure of the BSAC to invest in education during the 34 "somnolent years" (Snelson1974 , p. 121) of its rule meant that a generation and more of Northern Rhodesianslost their chance of receiving an education. This loss had its repercussions 40 yearslater when Zambia entered independence with a lariply illiterate adult populationand a pitifully small supply of educated manpower.
The Colonial Era, 1924 to 1952The Phelps-Stokes Commission was visiting countries in eastern Africa at the
time that responsibility for the administration of Northern Rhodesia wastransferred from the BSAC to the Colonial Office. The commission visitedNorthern Rhodesia in June 1924, and held extensive meetings with the missionarybodies and with government officials.
The commission's tasks were to investigate the people's educational needs, toascertain the extent to which these were being met, and to assist in the formulationof plans to meet these needs. The commission urged that the education to beprovided should meet the people's real needs and should prepare students for life inthe village community. This point is reflected in the Colonial Office's AdvisoryCommittee report, Education Policy in British Tropical Africa, which states that"education should be adapted to the mentality, aptitudes, occupations and traditionsof the various peoples, conserving as far as possible all sound and healthy elementsin the fabric of their social life" (quoted in Snelson 1974, p. 142). Thus, educationshould aim at advancing agriculture, developing industries, improving health,training people in the management of their own affairs, and inculcating ideals ofcitizenship and service. Specifically, the Phelps-Stokes Commission advocatedappointing a "director of native education," establishing an education advisoryboard that would represent all interested parties, subsidizing the educational workof the missions, and giving immediate priority to teacher training. Thecommission also advised that thought be given to setting up an institution thatwould provide some form of higher education.
The outcome was the replacement of what had been little more than a haphazardcollectin of schools by a more formal education system administered in anincreasingly professional manner. This administration rested almost entirely inthe hands of the government through its Department of Native Education, althoughthe actual provision and management of schools and institutes remained largelywith the missionary societies. The administration's task was to foster a sound andefficient system of education in keeping with the policy described above.
In time, the stated educational policy came to favor spreading the availableresources over as many children as possible. The advance of a great multituderather than the higher education of a select minority became almost a catch-call ineducational policy circles in Northern Rhodesia. This policy was partlyresponsible for the hesitancy with which the colonial government in Lusakaaddressed the provision of secondary and higher education. In contrast to viewsemanating from the Colonial Office, the local administration sensed a conflict

The Development of Education in Zambia Before 1975 9
between the provision of mass elementary education and some form of secondaryor higher education. They cculd not see that these forms might be "complementarybut not antagonistic" (Coombe 1967a, p. 192).
Several other considerations also delayed the commencement of secondaryeducation. Dominant among these were considerations of finance, of theeconomy's absorptive capacity, and of the hostility of a large section of the settlerand miner population to the advancement of the local people. First, NorthernRhodesia, as was the case with other colonial territories, was expected to befinancially self-supporting, hence it had to finance educational development fromits own resources. These resources vanished in 1931 when the worldwide economicdepression caused the country's young mining industry to collapse. Even at thisearly date, a strong link had been forged between the country's progress and themarket for copper:
The development of major new mining properties and a rapid rise in thecopper price had brought sudden wealth to the territory, but from thenonwards the country's fortunes were tied irrevocably to the fluctuatingconditions of the world copper market: the volume of governmentexpenditure was accordingly determined as much by the results ofnegotiations among the world's major mining houses in New York, Ottawa,and London, as by discussion in the secretariat in Livingstone or Lusaka(Coombe 1967a, pp. 182-3).
The slump of the early 1930s and the tight ecntrol on government expenditure towhich it led appear to have imbued the Northern Rhodesian government with analmost paranoiac fear that something similar might happen again. Even whengovernment revenues and reserves increased enormously in the early 1940sbecause of the high, war-time demand for copper, the government was reluctant toinvest in development projects.
Second, the government feared it might produce an unemployed educated class.This fear even dictated some misgivings about the provision of higher levels ofprimary education:
With a regular supply of Standard IV candidates available for vocationaltrainhig the problem will be to make sure, as far as is possib3e, that no morepupils are trained in each line than can be readily absorbed in the country(NRG 1930, p. 17).
A later report spoke about the danger of the emergence of a "discontentedunemployed class" (NRG 1937, p. 11), and even as late as 1946, the EducationDepartment responded defensively to a mission request to open a new secondaryschool by speaking of the danger of creating "an intellectual unemployedproletariat." As Mwanakatwe shrewdly observes: "Educational plannersapparently gave no thought to the possibility of creating a discontented uneducatedclass of Africans' (Mwanakatwe 1968, p. 26).
A third factor was the settlers' antipathy toward providing the local populationwith secondary education, their bitter opposition to any provisions for the Africanpopulation that might reduce employment prospects for white settlers andimmigrants, and their increasing success in having disproportionately largeamounts of public funds devoted to developing a parallel, but independent andracially exclusive, system of European education. Recurrent expenditure onproviding education for about 1,000 European children in 1937 considerablyexceeded expenditures on over 30,000 African children the same year (withoutcounting a further 74,000 African children in "unaided" schools). Imbalances in
e 04,

10 Education in a Declining Economy: The Case of Zambia, 1975.85
the structure of educational financing, reflected today in the enormous differencebetween unit costs at the primary level and at the university, have dearly had along history in Zambia.
The expansion of primary Oucation, however, required the development of
teacher training, which in turn made identification of some trainers withpostprimary education imperative. Persons trained beyond the primary level were
also needed as clerical officers and technicians in government service and insome positions of trust in the native authorities and chiefs' courts through which thepolicy of indirect rule found expression. Some of the missionary bodies also wished
to see some form of secondary education provided for Africans. Hence, in theabsence of government action, one of these bodies established a secondary class atKafue in 1935. However, the scheme did not last long. The first secondary classestablished with government support was opened at Lubwa Mission in Chinsali(Eastern Province) in 1938 with an enrollment of nine pupils. The following year,Munali Training Centre, which had opened in 1938 as a center for primaryeducation, teacher training, and clerical courses, also began secondary provision,with an enrollment of 11 pupils. The Lubwa course ended in 1940, and a furtherattempt to begin a secondary program at Kafue ended with the four pupils concernedbeing transferred to Munali. The school expanded slowly at first and until 1946
was the only secondary school for Africans in the territoiy. Until Chipembi Girls'School started that year in th, Central Province, no provision was made for thesecondary education of girls.
The slow and uneasy introduction of secondary education was followed by anequally slow and short-sighted a7inroach to its expansion. By 1952, the country hadonly four junior secondary schools (offering the first two secondary classes) andone full senior school, with an entire enrollment of 384 boys and 21 girls. Zambia'scritical manpower problems at the time of independence and many of its currentdifficulties in obtaining good quality, experienced, mid-level management may belaid at the door of this tardy development.
In 1949, the Central Afr:^an Councila body set up to advise the governments ofNorthern and Southern Rhodesia and of Nyasaland on matters of commonconcernappointed the Cartmel-Robinson Committee to report on the need forhigher education for Africans. Upon the committee's advice, the Carr-SaundersCommission was established in 1952 to look into the question more thoroughly.Aware that moves were afoot in Salisbury (now Harare) to establish a universitywith separate facilities for blacks and whites, thereby perpetuating the separation ofraces that prevailed at lower levels of the system, the commission unanimouslyurged that a university college catering equally for all races be started withoutdelay. It further recommended that if the proposals under discussion in Salisburycould not be modified along strictly nonracial lines, then such a university shouldnot be established in Salisbury: "Our choice falls on Lusaka, whose importance isincreasing and whose future is assured.... There, we believe, could arise auniversity worthy of central Africa" (Central African Council 1953, p. 46).
This was not to be, however. The establishment a few years later of theUniversity College of Rhodesia and Nyasaland ended any consideration of theestablishment of a university institution in Northern Rhodesia. The dislike thatAfricans in Northern Rhodesia and Nyasaland had ff.: all federal establishmentsmade the Salisbury college unpopular from the outset. It was not extensivelypatronized by students from either territory, and by the end of 1962 the Nyasalandgovernment had withdrawn all its students. Eligible students from NorthernRhodesia continued to be sent to Salisbury for studies, but preferences were for

The Development of Education in Zambia Before 1975 11
programs elsewhere, while students already enrolled in Salisbury tended to seekawards that would take them to other universities.
Two features of the education system during the colonial era continue to havepernicious effects today. One is the way it developed as a highly centralized andhighly selective system. The curriculum was the same for all schools and wascentrally designed and imposed. Clearly this left schools with few opportunities toprovide an education that was adapted to their pupils' specific needs. The system'sselective nature was such that progression from each grade to the next was bycompetitive examination. This also restricted schools' opportunities andwillingness to be innovative and imaginative in responding to their pupils'particular needs. The requirements of the examinations dominated all theteaching and learning:
More emphasis was given to a child's acquisition of a limited store of ill-assorted and often irrelevant facts than to his ability to think logically or to thedevelopment of his natural curiosity. For the ambitious child, education was arat race. For the rest it was often a drudgery (Snelson 1974, p. 275).
As will be seen later, these words still apply to much that goes on in classroomstoday.
The second feature was the failure to make adequate provision for the educationof urban children. Most missionary societies had established themselves in therural areas and set up their schools there. The colonial authorities, meanwhile,concerned themselves with the issue of whether schools should be set up in themining centers. They stressed the dangers of attracting children to live in urbanareas if schools were established for them, and for a time, they even considered thatall children over the age of ten should be required to leave the industrial areas.Although the mining companies made some provision for the education of theiremployees' children, an organized primary school education program was startedon the Copperbelt only in 1937, and even this could be operated only by the extensiveuse of double session teaching. Nevertheless, by 1943 the authorities thought thatthey had made such progress that they could introduce compulsory education insome of the towns. But they had seriously underestimated two things: the size of thepotential school-age population, and the way in which the prospect of six full yearsof education would attract children from the rural areas to the towns. Subsequenteducational development on the Copperbelt rested largely with a missionary society(the United Missions on the Copperbelt) and the mining companies, but the inabilityof these two agencies to meet the needs of the rapidly growing population,contributed to the current situation where the Copperbelt primary schools have roomfor fewer than 80 percent of the population.
The Federal Era, 1953 to 1963In 1953, against the wishes of the majority of the African people in Northern
Rhodesia and Nyasaland, the British government brought the Federation ofRhodesia and Nyasaland into being. During the decade of the federation, theresponsibility for education in Northern Rhodesia was divided. The territorialgovernment r,tained responsibility for African education, while the federalgovernment assumed responsibility for the education of other races. Thegovernment established high quality educational facilities in the major towns, butaccess was restricted to European children. The grim picture of the federationpainted by most people was that it was an odious imposition designed to bolster

12 Education in a Declining Economy: The Case of Zambia, 1975-85
Southern Rhodesia's economic development using the wealth from the NorthernRhodesian mines and cheap labor from Nyasaland in preparation for the day whenSouthern Rhodesia would go it &lone or would seek some form of integration withSouth Africa. Subsequent events confirmed the accuracy of this assessment
The aim for African education during the first years of the federation was toconsolidate and improve the primary school system, to develop secondaryeducation and trade training schemes, and to increase the supply of trainedteachers. By 1955, almost 200,000 children were in primary schools (35 percent of
them girls), and just over 900 in secondary schools (but only 8 percent of these weregirls).
In 1957, the government shifted the direction of educational expansion to-ancentrate on two target areas: the development of sec3ndary education and the
ivision of more primary school education in the main urban areas. By this timee 'er half the children in urban areas could not find places in schools. Althoughadministrative and organizational measures, such as double session teaching anda year round calendar, helped improve enrollment ratios, facilities in urbanschools remained inadequate.
The emphasis on thd rapid expansion of secondary school facilities wasstimulated by political events, since the federation was obviou:4 oot going to last,and its place would soon be taken by an independent territory. ilowever, thepriority given to secondary education and to increasing the provision lf primaryschool facilities in urban areas involved curtailing the development of primaryeducation in rural areas. This in turn led to an increase in the migration of ruralchildren to the towns in search of education. The underdevelopment of their schoolsand the loss of many of their children have contributed to the underdeveloped stateof the rural areas, both prior to independence and since.
When the federation ended in December 1963, about 342,000 children wereenrolled in primary school and 7,050 in secondary. Almost four-fifths of theprimary school children were in the lower four classes, with boys making up 58percent of the total enrollment. At the secondary level, 80 percent of the totalenrollment were boys. The 1963 census, which was the first of its kind in thecountry, enabled the enrollment ratios for primary schools to be estimated as 62percent for boys and 45 percent for girls, with places available in the first primarygrade for 77 percent of the eligible population (eight-year-old boys and seven-year-old girls) (UNESCO 1964).
A significant development toward the end of the federal era was the request bythe Northern Rhodesia (territorial) government to the United Nations and to theBritish government to help it plan the future development of its education system, toadvise on the establishment of a university, and to develop a framework for anintegrated economic and social development plan. The report of the educationmission, which was undertaken by UNESCO, provided a blueprint for futureeducational development, and showed in detail how the country could meet thetarget of universal primary education by 1980. It gave the highest priority to thedevelopment of a university, but left the details to another mission headed by SirJohn Lockwood. It gave second priority to two objectives of equal importance: theexpansion of secondary schooling and the rapid improvement of the quality ofp: imary education.
Three of the mission's recommendations are especially important because oftheir influence on educational provision today.
Despite the obvious difficulties, both administrative and pedagogic, Englishshould be adopted as the sole medium of instruction from the commencement

The Development of Education in Zambia Before 1975 13
of primary school (UNESCO 1964, p. 25).The number of well-qualified and well-trained teachers should be increasedso that double session teaching would be eliminated at all primary schoollevels (UNESCO 1964, P. 19).Education for farming was discussed at length. The report recognized thatschools should play some part in helping to raise the subsistence level, butthought it foolish to expect the schools to do too much. Caustically, it observedthat the agricultural work being done in primary schools appeared to do noharm, but "we are not sure that, as we saw it being done, it has anyeducational or social value or would lead to any better farming at home"(UNESCO 1964, p. 91). It stated that any worthwhile attempt to improveagricultural practice would depend on the quality of farming done byparents in their own community. Improvement would be reflected inincreased income, and children would see that an agricultural way of lifewas a viable option.
A few weeks before the UNESCO mission submitted its report, Lockwood and hiscolleagues submitted their recommendations on the establishment of a university(NRG 1964). Against the background of the Tannanarive Conference on theDevelopment of Higher Education in Africa (UNESCO 1962) and of a growinginfluence of American ideas on higher educational provision, the guidingprinciple of the Lockwood Report was that Northern Rhodc:,ia should establish auniversity without delay. The university should be responsive to the country's realneeds, be autonomous from the outset, and be an institution that would win therecognition and respect of the academic world on merit. One of the LockwoodReport's most novel recommendations was that admission to the university shoulddepend on satisfactory performance in the 0-level examinations (or equivalent),after 12 years of schooling, and not on A-level performance as was customary in allother university institutions in the former E - world. The nationalistgovernment that was established in January 1164 quickl,/ accepted therecommendations and took steps to implement them.
Education at IndependenceZambia became an independent nation on October 24, 1964, rich in material and
financial resources, but almost destitute in developed human resources. In thelaconic words of a subsequent government report: "The educational system whichZambia inherited at Independence was by no means adequate to serve hermanpower interests" (GRZ 1969, p. 30).
The education statistics are stark. Estimates reveal that at independence, only110,200 Africans had completed six years in primary schools, and only 32,000 hadcompleted the full primary course of eight years. At the secondary level, althoughover 8,000 Africans were enrolled in schools, only 4,420 had passed the JuniorSecondary (Form II) Examination, and a mere 961 had passed the SchoolCertificate Examinatipn (UN/ECA/FAO 1964). Only 107 had graduated fromuniversity, of whom only 4 were female (GRZ 1966a). These figures underscoredthe urgent need to expand education at all levels. They also serve to explain why"the basic objective of all oducational programmes after Independence was to laythe foundation for the pi ovision after 1970 of some of the much needed trained
npower in all fields of technical and economic activity" (Mwanakatwe 1968,p. 59).

14 Education in a Declining Economy: The Case of Zambia, 1975-85
The Decade of Comparative Prosperity, 1964 to 1974
During the first half of this decade, the government focused on the development
of secondary schools and the university. During the second half, it turned itsattention to technical education. Two considerations dictated the expansion of the
secondary schools: popular demand for secondary education, and the need foreducated manpower. Under the pressure of these two forces and with the support of a
booming economythe real GDP increased by 11 percent in 1964 and by a further 15
percent in 1965the government began to expand the secondary school system at arate hiAer than ever before attempted in a developing country(GRZ 19G6a).
The intake to secondary schools jumped from 4,700 in 1964 to 15,700 in 1969, an
annual average growth rate of over 27 percent. Several problems plagued this rapid
expansion:the increasing capital and recurrent costs;the construction industry's inability to build on the scale required, especiallyin remote areas;the difficulty of maintaining a supply of well-qualified teachers;
the problems in providing the administrative and supervisory support thatthe greatly expanded system required.
At the demand level, when expansion slowed down to some 6.4 percent per yearbetween 1969 and 1974, pressure from the public for the provision of more secondaryedveation remained as strong as ever.
Although the expansion of primary schooling was not one of the government'stop priorities immediately after independence, it did not overlook the needs at thislevel. The ambitious target set by the First National Development Plan (1966-70)was to provide sufficient places at the primary level so that by 1970 every childwould be able to have at least four years of primary education; to expand the systemso that all urban and 75 percent of the rural children could complete the full seven-
year primary program from 1970 onward; and to improve quality by expandingteacher training and upgrading the standards of teachers (GRZ 1966b).
The government did not meet these targets, largely because it underestimatedthe population of school-age children. Moreover, its accomplishments were notwithout problems:
almost all the schools developed during this period were provided on a self-help basis, but many of them were no more than temporary shelters that soonhad to be replaced;teachers were allocated the most unsuitable living accommodation, if any;
all surplus capacity was used up in urban areas by an extension of doublesession teaching to upper primary classes and the selective introduction oftriple sessions at the lower primary level;the teacher training program was reduced to one residential year so as toaccelerate output (but was reextended to two years in phased stages in 1968and 1969).
The objective of the Second National Development Plan (1972-76) was to providesufficient new places at the lower primary level to keep pace with population growth,and at the upper primary so as to achieve an 80 percent transition rate from grade 4to grade 5 by 1976. Reflecting the need for secondary school expansion to relateclearly to manpower needs, the Second Plan faced up to the fact that; "For manyyears to come most children will receive no more than seven years of full-time

The Development of Education in Zambia Before 1975 15
schooling" (GRZ 1971, p. 128). Hence, it stressed the need for primary education tobe truly terminal and for the community itself to become a major instrument ofeducation.
A number of problems that beset education today manifested themselves duringthe first decade of independence, 1964 to 1974. While some were merely acontinuation of problems already experienced during the preindependence era,others added a new dimension. First, the recognition that for many years to comeprimary education would be terminal for most children brought into focus theissues of the relevance of the education received, and the allegations that it tended toalienate primary school-leavers from their communities and from rural life.Second, the rapid expansion of provision at all levels, but especially at thesecondary, led to concern that the government was neglecting quality. Third,concern was also expressed about the whole nature of the education system.Awareness was growing about the disparities within the education system: betweengeographical areas, between sexes, and at an emergent level, between socialclasses. Fourth, the government had assumed almost the entire responsibility forthe financing of education, without any contribution from the rr eats. As aresult, people expected the government to provide all the other ir ...ats, namely,personnel, curricula, materials, maintenance, and even boarding provisions. Bygiving the widest possible meaning to the concept of free education, the governmentassumed an increasing burden in meeting many of the students' personal costs atall levels of education. These "transfer payments" were a new factor within thegovernment budget for education from 1966 onward; one that proved increasinglyburdensome and that limited the funds that might have been available for othermore directly educational purposes. Fifth, with the stress on the development of theuniversity and of technical education to provide the skilled manpower needed for'Zambia's highly industrialized economy, the government realized in the late 1960sthat science and mathematics were posing special problems: "The inadequacy ofstudents' preparation in science and mathematics will handicap Zambia'smanpower programme for many years" (GRZ 1969, p. 34).
Intermingled with these various difficulties were the problems ofadministration: the managerial capacity required by a greatly expanded system;the ability to sustain developments; the capacity to formulate and execute policy; theability to generate, collect, analyze, and use information; the system'sovercentralization; the protracted bureaucracy that was emerging; and the lengthyand involved channels of communication. The administrative and managerialdifficulties were exacerbated by the fairly rapid turnover of staff This turnoverwas due in part to the desire of education managers to move to other fields, and inpart to political decisions to move people around to expose them to administrativeresponsibilities in a number of ministries.
Accompanying all these problems of a practical nature was the fact thateducation had not yet been brought to every eligible child, together with a growinguneasiness that, instead of promoting development education might be playingsome role in obstructing it, or at best in slowing it down. People were increasinglyaware of the imbalances developing in society and concerned lest education mightbe playing some role in giving rise to or perpetuating these imbalances.
The education ministry was grappling with these problems when the economiccrisis began to loom in 1975.

3
The Decline of Zambia's Economy
Although a net deficit of K94.4 million was estimated for, an overall surplus of
K165 million was realised which was mainly due to peak copper prices (GRZ
Financial Report 1974, p. 1).
The dramatic fall in copper prices due to the world economic recession,together with the closure of our traditional export and import routes and the
rampant world inflation, largely contributed to the gross deficit of K379.1
million in 1975 (GRZ Financial Report 1975, p. i).
These two statements from successive government financial reports underscore
the abrupt change that occurred in Zambia's economic situation in 1975. Thedeterioration has continued since, with the economy showing a steady decline from
one year to the next. Recently, in announcing a new economic recovery program,President Kaunda spoke of the "deep and prolonged crisis in our economycharacterised by serious dislocations in both our internal and external sectors"
(Kaunda 1987, p. 1). Zambia has felt the effects of the decline all the more sharply
because of the contrast to the buoyant economy it enjoyed in the decade after;1dependence, from 1964 to 1974, when the GDP maintained rapid growth, realoutput expanded, and the terms of trade improved. By contrast, since 1975 the growth
of the GDP has been uncertain, sluggish, and at times stagnant or even negative in
real terms; output has decreased; and the terms of trade have deterioratedseriously. The decline was rapid, sustained, and devastating and was of amagnitude described as "unparalleled by the experience of any other country in
peacetime" (Simson 1985, p. 31).
The Dependence on MineralsWhile a combination of several factors caused the massive economic decline,
Zambia's major problem is that as a producer and exporter of primary commoditiesit has, over the years, developed production structures heavily dependent onimports. The primary commodities are minerals: lead, zinc, cobalt, but above all
copper. Today, as in the past, the whole economy hinges on the mining industry andits ability to produce minerals that the industrialized countries will purchase. The
quantity of minerals sold and the price obtained determine the volume of goods that
163 ( I

The Decline of Zombies Economy 17
Zambia can import. Zambia's manufacturing and industrial sectors, including themining industry itself and to some extent the agricultural sector, are heavilydependent on the importation of capital goods and raw materials. In the absence ofthe necessary imports, their operations run down and their productivity declines.The ability to purchase imports depends on receipts from mineral sales, which inturn depend on the level of demand in the industrialized countries. For its part, thisdepends on two factors, technological advawles and the econ mies of theindustrialized countries. Technological developments may reduce the need forcopper and other metals, while the economic vigor of the industrialized countriesgreatly affects the demand for minerals. Zambia does not determine either of thesefactors. Hence, Zambit 's dependence on the copper industry has resulted in itspotential for self-development being determined largely by external forces overwhich it has no control.
The following figures demonstrate the extent of Zambia's dependence onmineral production: from 1966 to 1970, receipts from taxation on mineralproduction and sales constituted more than 55 percent of annual governmentrevenues, 60 percent of annual government expenditure, 44 percent of the GDP, and95 percent of export earnings (table 3.1). In 1975, however, the contribution ofmineral receipts to the economy fell rapidly, dwindling from some 7 percent in1975 to virtually zero in 1977 and 1978. By 1979 the situation had deteriorated sobadly that funds began flowing in the opposite direction, with more than 1 percent ofthe government annual expenditure being used to support the mining industry.
Table 3.1 The Mining Industry's Contribution to Zambia's Economy, 1968-85
Year
(a) (b)Mineral Total govern-revenues ment rnmnues(K millions) (K
(c)Total government
expenditure(K millions)
(a) as apercentage
of (b)
(a) as apercentageof (c)
1968 176.18 306.11 305.69 57.6 57.61970 251.08 432.43 380.99 58.1 65.91971 114.07 36C 71 430.31 31.6 26.51972 55.69 315.22 363.18 .1,7 15.31973 101.62 482.03 782.26 21.1 13.01974 314.73 713.28 634.70 44.1 49.61975 59.40 475.98 855.04 12.5 7.01976 11.60 635.47 936.40 1.8 1.21977 -1.19 539.78 821.00 -0.2 -0.11978 0.06 584.31 815.42 0.0 0.01979 -9.80 634.70 956.41 -1.5 -1.01980 41.71 808.46 1,657.57 5.2 2.51981 1.05 852.09 1,388.61 0.1 0.11982 0.00 878.71 1,643.24 0.0 0.01983 53.40 1,099.71 1,475.92 4.9 3.61984 94.50 1,119.86 1,484.63 8.4 6.41985 129.50 1,602.44 2,184.33 8.1 5.9
Source: GRZ Financial Reports (annual issues, 1968, 1970-85).411

18 Education in a Declining Economy: The Case of Zambia, 1975.85
Some recovery has occurred since then, with mineral revenues accounting for
about 8 percent of government receipts in 1985, but this improvement has been due
more to changes in the taxation system and to depreciatioqs in the local currencythan to improved real receipts. The mining sector's contribution to the GDPfluctuates in current terms around 14 percent, but in real terms it declined from11.6 percent in 1977 to 9.0 percent in 1985.
In 1982 the real price of copper was at its lowest for nearly 40 vire (Krumm1985). During the yearl immediately after independence, the avertve real pricewas UE:0175 per pound; between 1975 and 1983 it fell to US085 (Simson 1985); and by1986 its price was round US060 per pound (EIU 1987). At the same time, productioncosts increased about 15 percent from 1985 to 1986, widening even further the gapbetween production costs and selling price.
A steady drop in the amount produced accompanied the fall in the price of copperand the increased production casts. Co!. per production reached its peak in 1969 withan output of approximately 750,000 torwes; by 1982 this was down to 576,000 tonnes,and each year since has seen a decline, with the 1986 output of 459,172 tonnesmarking a new postindependenre low (GRZ 1987). This decline was partly due to adecline in the grade of copper ore (from 2.5 percent in 1974 to just 2 percent in 1986),but the major cause for the drop in production was the industry's inability to securethe foreign exchange it needed for essential spare parts, machinery, and fuel.
On the financial side, the industry's profitability has been severely affected bythe huge devaluation in the local currency (table 3.2). This has raised the salescosts (in local currency terms) and, even more serioasly, has vastly increased theamount of local currency needed to purchase the foreign exchange required forervicing the industry's debts.
Table 3.2 Foreign Exchange Rates and Deflators, 1975-86
YearExchange rate,
(Zambian kwacha per U.S. dollar)
Deflators foreducation sector
(1977 = 100)
1975 0.651976 0.901977 0.85 100.0
1978 0.7q 110.7
1979 0.82 123.3
1980 0.80 137.2
1981 0.74 152.1
1982 0.93 172.0
1983 1.25 203.1
1984 1.79 223.7
1985 el f 1I 1 245.5
1986 8.90 332.6
Note: Unless otherwise noted, these exchangethroughout t, report.
Source: For exchange rate: EIU (various issues).communication.
18
rates and delators are used
For deflators: CSO, personal
3 )

The Decline of Zambia's Economy 19
A further concern about the Zambian copper industry is that at currentproduction rates reserves will be exhausted in less than 20 years (Daniel 1985).Although other large reserves exist, obtaining the capital for their developmentseems unlikely, especially since the availability of substitutes, such as opticalfibers, makes the futare need for large suppliiss of copper uncertain.
Zambia also markets cobalt, lead, and zii c on international markets. Cobalt isproduced in association with copper, and rices have remained generally high.However, two factors have afficted the prodw tion of cobalt. First, as a by-product ofcopper production, a decline in copper pi oduction means a decline in cob,altproduction. Second, in an effort to sustair the price, the mining industry hasrestrained production. Prices for both zinc .ind lead fell sharply in 1986, despiteconsiderable demand for lead. Since the ore reserves for both these minerals havebeen almost depleted at the only mine (in Fabwe), production is expected to falldrastically (GRZ 1986). However, copper dwarfs the contributions of cobalt, lead,and zinc to the economy. During 1973 to 1984 copper accounted for 92.2 percent of allmineral sales, whereas cobalt accounted for only 4.1 percent, zinc for 3.0 percent,and lead for 0.7 percent (CSO 1983).
Oil PricesThe rise in oil prices that precipitated the world economic crisis in 1973 also
affected Zambia. At a time when the country's income from its exports was falling,it wes required to pay an everincreasing amount for its oil in.:ports. In 1970,Zambia used about 8 percent of its foreign exchange earnings to purchase 852,000tons of oil; in 1985, it used 33 percent of its foreign exchange earn Is to buy a muchsmaller quantity (EIU 1987). "This rise in the share of the oil bill in the, total importbill had to be at the expense of other equally vital imports" (Kaunda 1P,87, p. 2).
Trade RoutesA third external factor that caused serious dislocation in Zambia's economy in
the 1970s was Rhodesia's Unilateral Declaration of Independence, in 1965 and theliberation wars that led to Zimbabwe's independence in 1981. Estimates suggest thatthese events cost the Zambian economy over a billion U.S. dollars (ILO/JASPA1981). The closure of the trade routes through Zimbabwe forced Zambia to develupother routes, which were far more costly. For a tim3, Zambia used the westernrailway line through Zaire and Angola to Lobito Bay, but the war in Angola closedthis route in 1975. With the ieopening of the southern border in 1978, an increasingvolume of trade passed through zArnbabwe, but this was the longest and mostexpensive of the available routes. mhe commissioning in 1975 of the Tazararailway to Dar-es-Salaam opened a third route out of the country. Initially this lineexperienced considerable operational difficulties, but many of these appear to havebeen "vercome. Since the beginning of 1987, 80 percent of mineral exports and allferf.4iizer imports are being carried on the Tazara line (EIU 1987); the remaining2c 1,ercent of mineral exports are carried on the line through Zimbabwe to the port ofBe;ra in Mozambique. The southern line continues to carry the largest percentageof imports, many of them originating in Zimbabwe:, but some in South Africa,which in 1982 supplied 14.5 percent of Zambia's total imports.
Terms of TradeZambia's reduced ability to import capital goods, raw materials, and
consumption goi.4- was brought about in large measure by the fall in the price of

20 Education in a declining Economy: The Case ofZambia, 1975-85
copper. However, another factor was the way in which the terms of tradedeteriorated, with the index for import prices rising much more rapidly than thatfor exports. During 1979 to 1984, the import price index grew at an average annualrate of 23.3 percent, whereas the index for exports grew at an average annual rate of
7.4 percent. Simson (1985, p. 32) has pointed out that this kind of developmentcannot be attributed solely to inflation in the industrialized countries or to theincrease in oil prices, but appears to be a reflection of the mark-up by exporters toZambia to cover the cost of anticipated delays in payments. In other words, theeconomic problems themselves proved a further liability on the country's ability toimport. This ability is being eroded even further by the unstable performance ofinternational currencies. Zambia's sales of copper are paid for in sterling andU.S. dollars so that the purchasing power of foreign exchange earnings is affectedby any change in the value of these currencies.
External DebtWhen the price of copper collapsed in 1975, Zambia's foreign assets exceeded its
external public debts. At the time the government did not expect that the sharpdownturn in the price of copper would continue for long and confidently expected asubstantial recovery in the demand for and price of copper. Hence, to tide thecountry over what appeared to be a period of temporary difficulty and to maintainthe level of much-needed imports, the country drew down on its external reservesand turned to short-, medium-, and long-term borrowing. However, the expectedrecovery in the copper market did not materialize. Instead, the country had to resortto further borrowing from multilateral and bilateral agencies for major publicprojects and for general budgetary support.
As the balance of payments deficit grew, the government turned to theInternational Monetary Fund (IMF) for balance of payments support, but thefacilities offered by the IMF were accompanied by conditions that the governmentdid not always meet. It attempted to restructure the economy along the linesproposed by the IMF, hut its efforts were not always wholehearted. For severalyears, Zambia was caught in the worst of dilemmas, unable to go it alone withoutmassive foreign assistance, but unwilling, and to some extent unable, to adopt themeasures that would assure the availability of such assistance. Some of theunwillingness stemmed from fear of the social and political consequences thatmight follow from adopting such measures as the elimination of subsidies for basicfoodstuffs and fertilizers; some also stemmed from the ideological perspective of acentrally controlled economy. The inability to implement a restructuring programthat was designed to refloat the economy was duo, in no small measure, to theunwieldy bureaucratic system, which was further handicapped by low levels ofmanagerial confidence and expertise.
The debt crisis came to a head in May 1987 when the government announced thatit would forego IMF help but would take its own steps to revitalize the economy. Oneof the main measures adopted was to limit debt repayments to 10 percent of netexport earnings (after meeting the foreign exchange requirements for the miningindustry, oil, the national airline, and fertilizers). The balance was to be used forproductive ventures that would help reactivate the ec.o..:Imy (Kaunda 1987).
The sharp criticism Viat these moves drew in some quarters (see, for example,The Economist, May 9, 1.987) took little account of the extent to which Zambia's debthad grown, the huge annual cost of debt servicing and the cost of debt rescheduling.The national debt has grown three-fold since 1980 and now constitutes considerably
20

The Decline of Zanzbia'8 Economy 21
more than twice the GDP. The cost of debt servicing increased dramaticallybetween 1984 and 1986, rising from some 13 percent of foreign exchange earningsin 1984, through 43.3 percent in 1985, to almost 100 percent in 1986 (GRZ 1986). Thestrategy of rescheduling debts, which initially looked so promising, appears to havebeen counterproductive, since it has led to the capitalization of arrears of interestand hence to an increased economic burden.
Underutilization of CapacityWith the large commitment to debt-related payments, resources did not exist to
maintain the supply of imports in the volume needed for the industrial and othersectors. The effect was to starve industry of the essential raw materials, equipment,and inputs it needed to sustain operations. In consequence, output has declined, notonly in the mining industry, but in almost every manufacturing and industrialenterprise. This has led to underutilization of industrial capacity, with severalenterprises operating at less than 50 percent of capacity, and some at even less than25 percent. This manifests itself in shortened working weeks, days and evenweeks of closures, temporary lay-offs, and periodic shortages of consumer goods.Despite these adversities, the manufacturing sector's contribution to the GDP rosein real terms from 17.6 percent in 1977 to 20.2 percent in 1985. Much of thisimprovement was offset, however, by a corresponding decline in the share of theconstruction industry.
Decline in Investment and Growth in ConsumptionThe deteriorating terms of trade, payments for imports, external debt payments,
and the transfer of investment incomes and other invisibles abroad have allcontributed to a net outflow of resources from Zambia. As in many other countries,this has contributed to a further chronic structural defect in the Zambian economy:the tendency for investment to decrease, and in consequence for consumption'sshare to increase. Gross investment stood at 33 percent of GDP during 1970 to 1974.For 1980 to 1984 it was 15 percent. It fell to 8.1 percent in 1985, and in 1986 reached anall time low of 7.1 percent. Most of the current investment is confined to therehabilitation of existing capital stock in the mining, transport, andmanufacturing sectors; almost none of the investment is used for newdevelopment. Meanwhile, consumption has increased. During 1970 to 1974 itconstituted 58 percent of the GDP, while in 1981 to 1985 it rose to 81 percent.Government spending accounts for approximately 30 percent of the consumption,but the government's share has been declining since 1980, whereas privateconsumption has been increasing at an annual rate of 3.5 percent. However, theoverall growth rate of consumption, 0.9 percent in 1985, is considerably below thepopulation growth rate of 3.5 percent, indicating a decline in the standard of living.
Reflecting the decline in gross capital formation, government capitalexpenditure has declined sharply since 1976. In 1975 and again in 1976, capitalexpenditure exceeded 15 percent of the GDP, but by 1985 it had fallen to just 4.4percent. Throughout the entire period 1975 to 1985, capital expenditure constituted onaverage no more than 7.8 percent of the GDP.
EmploymentThe declinr, of gross fixed capital furmation meant that few capital
developments were taking place that could help generate employment. Since 1975,

22 Education in a Declining Economy: The Case of Zambia, 1975-85
the number of people employed in the formal sector has been declining, with only ashort-lived improvement from 1979 to 1981. In June 1986, 360,540 people wereemployed in the formal sector, 10 percent fewer than in 1975. However, during thesame period, 1975 to 1986, the labor force was growing approximately 3.8 percenteach year. In 1986, of a total labor force of 2.06 million, some 17.5 percent wereemployed in the formal sector.
Approximately one quarter of those in wage employment are in the primarysector, with 40 percent of these working in agriculture and 60 percent in mining.Recent years have seen an increase in the numbers employed in agriculture and adecrease in the numbers employed in mining. A further quarter of those in wageemployment are in the secondary sector, but here the number has declined by morethan 16 percent since 1975, due mainly to a greatly reduced level of activity in theconstruction industry. The tertiary sector employs the largest proportion of wageearnersapproximately 50 percentand the proportion is growing. This is dueprincipally to a steady increase in the number of government employees.
The proportion of non-.?,p.nbian employees has fallen steadily in the years sinceindependence, from 32,100 in 1964 to 11,850 in 1985. Most of the remaining non-Zambians are in key positions in specialized technological, accounting,educational, and medical fields.
AgricultureEstimates suggest that some 1.1 million people are employed in the informal
sector. Many of them are engaged in agriculture, mostly at the subsistence level.Of the estimated 460,000 households, about 63 percent are traditional subsistencefarmers; they purchase few inputs and are characterized by a low level ofproductivity. The remainder of the farming households are subdivided into
some 146,000 small-scale commercial or emergent farmers who typicallycultivate between two and ten hectares, use mainly hoe cultivation, andmake some use of improved seeds and fertilizers;about 23,500 medium-scale farmers who cultivate between 10 and 40 hectares,use oxen and possibly tractors, and may employ hired labor;about 800 large-scale farmers who use advanced technology on farms thatinvariably exceed 40 hectares (Norrby 1986).
The government has formulated three main aims for Zambia's agriculturalpolicy: to achieve self-sufficiency in basic foodstuffs and agricultural rawmaterials; to diversify tne economy and the export base by processing agriculturalsurpluses; and to reduce the rural-urban income gap. However, these objectiveshave proved elusive. Zambia's degree of self-sufficiency in food crops declinedfrom 97 percent during 1964-66 to 79 percent during 1970-80 (Simson 1985, p. 47). Theshortfall had to be covered by imports.
Inadequate producer incentives, poor marketing arrangements,nonavailability of inputs, and uncertain climatic conditions all contributed to thedecline in production of maize and other field crops in the late 1970s and early1980s. More realistic pricing policies and more determined efforts to establish asatisfactory marketing system led to considerable improvements during the lastfive years. Marketed maize production reached an all-time high of 918,000 tons in1986, thus bringing self-sufficiency in this commodity, the staple food of about half
22 3
The Decline of Zambia's Economy 23
the population. However, 1987 'id not repeat the successes of 1986 because of poorrainfall in some of the major maize growing areas, and because fertilizer was notalways available when needed. The area cultivated for major crops has increasedsomewhat, but at less than 1.5 million hectares, th.1 area under cultivation is stillonly a small fraction of the arable land available (estimated at some 40 millionhectares).
The contribution of agriculture to the GDP has varied. In real terms, itscontribution declined between 1977 and 1982, with 1981 being an exception becauseof the bumper maize harvest. Since 1982, however, there has been an increase ofalmost 25 percent. Despite the increase in the contribution of agriculture to the GDP,the sector's overall growth has lagged behind population growth. While the latterhas been growing at an average annual rate of 3.5 percent, agricultural growthaveraged only 1.4 percent annually between 1977 and 1985. Green and Singer(1984) estimate that per capita food production declined by 8 percent during 1969/71to 1979/81, but this figure seems high. World Bank estimates of a decline of 1.9percent from 1971 to 1979 and 2.4 percent from 1980 to 1984 appear more realistic, butwhatever the actual figure, the fact remains that food production has fallen behindthe population increase and shows signs of falling still further. Clearly Zambia'sgovernment will have to make an extraordinary effort to reverse this trend, whichhas such serious implications for the nutritional status of the population.
Rural-Urban and Income DisparitiesAnalysts have frequently pointed out that much of Zambia's development has
been biased against the rural population. This is manifested in such ways as themovement of the rural-t..1)an terms of trade against the rural inhabitants. TheInternational Labour Organisation (ILO) has estimated that between 1973 and 1980,the prices of agricultural goods that generated incomes for the rural populationdeteriorated by 23 percent relative to the prices that rural people had to pay for urbanproduced goods. Moreover, while the average wage earner (usually a city dweller)was 43 percent better off in 1977 than in 1965, agricultural incomes per head werenearly 40 percent below the 1965 level (ILOMASPA 1981).
The heavy subsidization of basic foodstuffs implies a use of resources in favor ofthose who do not grow their own food, that is, city dwellers. Food subsidizationpolicies can also keep agricultural prices down so that producers do not receivereturns in line with the benefits that purchasers obtain.
In the health sector, although some 55 percent of the population live in ruralareas, only some 30 percent of total health care expenditure is aimed at these areas.Per capita expenditure in areas erved by rural health clinics was only KO.60 in1982, compared with K12.27 in the Lusaka urban area and K2.35 in areas with adistrict or provincial hospital (which could be classified as urban) (UNICEF 1986).Successive development plans have expressed the intention of bringing about, amore equitable distribution of national resources, but the government has not yetachieved this objective.
Allied to the rural-urban dichotomy is a sharp distinction on the basis ofincome. In 1976, the richest 5 percent of all households earned roughly 35 percent ofthe entire national household income, while the poorest 40 percent received only 8percent (ILO/JASPA 1981). The ILO also estimated that about 80 percent of ruralfamilies and 26 percent of urban families had incomes below basic needs levels.To narrow the gap between incomes, the government started giving junior officialssalary increases that are proportionately higher than those awarded to more senior
24 Education in a Declining Economy: The Case of Zambia, 1975-85
'officials. Because of this policy, in 1985, a university graduate entered the publicsector at a salary that in real terms was less than a quarter of that prevailing in1967, whereas the salary of the unskilled worker maintained about three-quartersof its 1967 value (UNDP 1986, table 1.10).
InflationThe gap in incomes persists and is reinforced by the diffc:rent levels of inflation
for the low-income and the high-income groups. Each year since 1975 priceincreases have affected those on low incomes more severely than those on highincomes. By 1986 the rate of inflation stood at 51.6 percent for the high-incomegroup, whereas it was considerably higher, 58.4 percent, for the low-income group.The survival strategy adopted by many poor households in the face of inflationaryprice increases has be, a to reduce the number of daily meals or to purchase fewer ofthe more expensive foodstuffs, particularly protein food items (Munachonga 1987).The effects on the nutritional status of the poor people, and especially on theirchildren, are severe. The overall inflation rate has increased dramatically since1981, reflecting the rapid rise in prices in response to the removal of price controlsand the uncontrollable way in which the local currency depreciated following theintroduction in 1985 of the system of foreign exchange auctioning. With theabandonment in May 1987 of the auction system, the government has reintroducedprice controls and stemmed the upward rise of interest rates. It is not known yetwhether these measures can do anything to bring down the very high rate ofinflation.
A further factor leading to galloping inflation has been the growth in the moneysupply. Since 1975, this has been growing at an annual average rate of almost 13percent. The large and steady increase in the money supply was not accompaniedby a corresponding increase in the production of goods and services. The pressuresthereby created fueled those arising from other causes to bring about theinflationary spiral.
Gross Domestic ProductThe uneven but generally deteriorating condition of the Zahibian economy is
underscored by examination of the GDP. In real terms, the GDP grew fromK1,986.4 million in 1977 to K2,052.2 million in 1986, a growth of less than 0.4percent per annum. Since the population was growing at the same time and at themuch faster rate of 3.3 percent, real per capita GDP suffered a serious decline, fromK382.0 in 1977 to K280.8 in 1986, a fall of almost 36 percent, or an annualdeterioration of 3.5 percent. In U.S. dollar terms, the per capita GDP fell fromUS$588 in 1977, through US$365 in 1982, to US$109 in 1985 (on the basis of averageprevailing exchange rates). Some of this massive decline can be accounted for byearlier overvaluations of local currency and the adjustments that have since takenplace.
Deficit FinancingDeficit financing has become an almost normal part of the public finance
system. Until the economic crisis of 1975, government revenues normaliyexceeded expenditures, although provision was made for occasional deficitfinancing. However, since 1975, public finances have been in deficit every year.
24

The Decline of Zambia's Economy 25
Although revenues increased substantially due to alterations in the tax base, theirgrowth was outstripped by the growth of expenditures. Since 1975, the deficit hasexceeded 10 percent of the GDP in all but three years.
A considerable part of the annual deficit can be attributed to the heavy burden ofsubsidies, principally for foodstuffs and fertilizers, and to the large amounts spenteach year in debt-related payments. Since the government has decided to restrictdebt repayments to 10 percent of net foreign exchange earnings, the annual deficitis likely to decline. The government has also made considerable progress inreducing the level of subsidies, but removing them entirely has not proved possible.An attempt to remove food subsidies at the end of 1986, with a resultant substantialincrease in the price of basic foodstuffs and other essential commodities, met withintense and violent public resistance and resulted in several deaths in food riots.
ConclusionThe economic problems outlined in the preceding paragraphs have been
aggravated by the following:
demographic issues (see chaptel 4);fluctuating weather conditions that have adversely affected attempts todevelop the agricultural sector;the legacy from colonial times of underdeveloped human resources,especially those with high-level managerial and technological skills;the influx of refugees from neighboring countries;the many political and security problems that arise from armed conflicts inNamibia, Angola, and Mozambique, and from the role played by SouthAfrica throughout the region.
Strictly economic factors, arising primarily from Zambia's unbalancedeconomy and its dependence on a single primary product, may have brought aboutthe economic decline, but these other social and human factors have hastened itsprogress.

Demography
The first attempt to conduct a census in Zambia was in 1963, toward the end of thecolonial period, but thP first really comprehensive census was not taken until 1969.This was followed 11 years later (August 1980) by the most recent census, andanother census is planned for 1990. At the time of the 1980 census, the population ofZambia was 5.66 million, of whom 2.77 million (48.9 percent) were male and 2.89million (51.1 percent) were female.
Characteristics of the PopulationThe population's most striking characteristics are its youth, its growth rate, and
its spatial distribution. In 1980 those aged 14 and under constituted 49.8 percent ofthe population, compared with 46.4 percent in 1969. The primary school age group, 7to 13 year-olds, constituted more than 21 percent of the total.
The population's youthfulness has several important implications.
The populatic of school-going age will increase enormously: from 1.5million at the primary level in 1985, to an estimated 2.6 million by the year2000.An increasingly large number of young people will enter the labor force eachyear: in 1980 the labor force was estimated at '1.65 million (omitting the 12 to14 year-olds), but it is projected to reach 2.4 million by 1990 and 3.5 millionby the year 2000 (CSO 1985a).The population's growth rate will remain high even if each woman has fewerchildren, since each woman of childbearing age will be replaced in the nextgeneration by several women who are already born.The economically active sector of the population will have to bear theincreased burden of supporting the many children under 15 and adults aged65 and above. The increase in the under-15 population was the principalreason why the number of dependents increased from 95 for every 100productive adults in 1969 to 111 in 1980. The financial burden that this highlevel of dependency implies for the adult population is increased by the largeproportion of those in the 15 to 17 age group that are in schools and hence noteconomically active.
264

Demography 27
The population is growing fast, and the rate of growth is itself becoming faster.Between 1963 and 1969 the annual average rate of growth was 2.8 percent; between1969 and 1980 it was 3.1 percent; today it is estimated to be 3.5 percent; and estimatessuggest that it will rise to 3.7 percent by the end of the decade (CSO 1985a). This isdue to a constant high fertility rate (the average fertility rate in 1980 was 7.2), and toa declining death rate. When the effects of mortality are taken into account, eachmother is being replaced by two or three daughters who will survive to beromemothers themselves. This high level of fertility is maintained by the practice ofearly marriage: the reported mean age for marriage for all women is 18.3 years.
The death rate was estimated as 18.9 per thousand population in 1974, but hadfallen to 16.7 in 1980. This has been largely due to improved and more widelyavailable medical services. As these extend further, the death rate, which is still onthe high side compared with other African countries, will fall further. The overalldeath rate includes the infant mot tality rateestimated at 97 deaths per 1,000 livebirths in 1980but this too is declining. Associated with the decline in the death rateis an increase in life expectancy, from 47.8 years for females in 1969 to 52.2 in 1980,and from 44.6 to 50.4 years for males. Life expectancies in the rural areas are aboutfive years lower than those in the towns.
The population's spatial distribution has two aspects: the relative populationdensities of different areas and urbanization. Because of the concentration ofeconomic development in four provinces along the north-south railway (Copperbelt,Central, Lusaka, and Southern), and because much of the best agricultural land isfound in these provinces, a disproportionately large part of the population isconcentrated along a corridor some 60 kilometers wide that cuts through the countryfrom the Copperbelt in the north to Livingstone in the south. These four provincesaccounted for 55.2 percent of the 1980 population, although they constitute only 30.8percent of the country's total area. The country's average population density is 7.5persons per square kilometer.
Apart from Algeria and South Africa, Zambia is the most highly urbanizedcountry in Africa. The proportion of the population living in urban centers of 5,000or more inhabitants almost doubled between 1965 and 1980, rising from 20.5 to 39.9percent. During 1969 to 1980, the urban population grew at an average annual rate of6.7 percent, whereas the rural population grew only 1.1 percent during the sameperiod. Just over half the present growth of the urban population is due to naturalincrease, with the remainder attributable to in-migration from rural areas. Achange has occurred, however, in the pattern of urban growth. In the 1960s theprincipal growth centers were Lusaka, Livingstone, Kabwe, and the Copperbelttowns, but in the 1970s the small provincial and district administrative and servicecenters grew more rapidly. Urbanization has also been very rapid along the newTazara rail line from Kapiri Mposhi to Dar-es-Salaam.
The unbalanced distribution of population and the continued high rate of rural-urban migration pose serious social and economic problems. The largeconcent. ation of people in the urban areas depends on the agricultural production ofthe rural areas for its supplies of foodstuffs, but the thinly scattered rural populationcreates problems for agricultural development, among them the establishment of agood communications infrastructure and an efficient marketing and distributionsystem.
Another problem is the number of female-headed households in the rural areas.In 1980 approximately ae-third of the rural households fell into this category,compared with less than one-fifth in the towns. The rapid increase in the number ofsuch households has serious implications for the well-being of children, whose

28 Education in a Declining Economy: The Case of Zambia, 1975-85
mothers cannot provide for an their nutritional and educational needs. The growth
of this phenomenon can be traced partly to rural-urban migration, especially ofsingle men seeking employment in the mines and other urban-dominated sectors,
and partly to instabilities in macriage caused by the absence and movement ofmen .
Population and EducationPopulation variables have implications for educational provision, while
educational provision affects certain population variables. The most importantfactors for education are the size of the population and its g :)wth rate. Withoutknowledge of these figures, there can be no accurate estimate of shortfalls in
provision or targets to be attained. In Zambia, the rapid growth of the population hasthe most serious implications for educational provision. In 1980 there were 1.33million children of primary school age (7 to 14 year-olds), and the primary schoolenrollment was 1.04 million. By 1985, there were some 1.50 million primary schoolaged children and 1.35 million school places. By the year 2000, the number ofchildren is projected at 2.64 million, and an additional 1.3 million school placeswill need to be created if they are all to be provided with seven full years of primaryeducation. If the Zambian policy of extending nine years of basic education to everychild were to be implemented, a total of 3.1 million school places in grades 1 to 9would be needed by the year 2000.
The 1980 census provides information on three areas where education mayaffect population characteristics. These are fertility, age at first marriage, andinfant and child mortality. The total fertility rate for those with secondaryeducation is 6.4, compared to 7.4 for those with primary education or no schooling atall. For those with university education the fertility rate drops to 3.5. Part of thereason for the differences is that females in the more highly educated categoriesbegin childbearing much later in life than those in the less educated categories. Ingeneral these findings are consistent with those of Cochrane (1979), that educationis associated with first a rise and then a fall in fertility.
The level of education was also found to have a bearing on the reported mean ageat first marriage, though not always in the expected way. The reported mean age atfirst marriage for all women was 18.3 years, but was higher (18.7 years) for womenwith no education and lower (17.5 to 17.9 years) for women with primary or juniorsecondary. However, the influence of level of education beyond the juniorsecondary is very pronounced, with the mean age at first marriage rising to 20.6years for those with senior secondary education and to 23.7 for those with tertiaryeducation.
A third important finding, which confirms what has been observed in other partsof the world (Cochrane, O'Hare, and Leslie 1980), is that infant and child mortalityis inversely related to the level of formal schooling of tile mother. An infant whosemother had no education experiences a 16.8 percent chance of dying before the ageof five, whereas the probability for an infant whose mother has had primaryeducation falls to 13.9 percent, and the probability falls further, to 6.6 percent, if themother has had secondary or higher education. Likewise, the life expectancy ofthose whose mothers had secondary or higher education is very much higherby asmuch as 15 yearsthan of those whose mothers had no schooling. At alleducational levels of mothers, the life expectancy is higher and the impliedmortality levels are lower in urban than in rural areas, presumably because of the

Demography 29
greater availability of health facilities, clean water supplies, and retail shoppingoutlets in tho urban areas. Nevertheless, even in the rural areas the influence of theeducational level of the mother on her offspring's chances of survival areconsiderable.
The Data BaseZambia's projected need for school places and the gross enrollment ratios haie
traditionally been based on a considerable underestimation of the real size of thepopulation. Thus, in the 1961 edition of Educational Statistics (published by theMinistry of General Education and Culture in 1986), the size of the primary schoolage group is given as 1.264 million, whereas the 1980 census had already recorded1.332 million as the size of this group, a figure that at the prevailing growth ratewould have risen to 1.377 million by 1981. If this had been taken into account, thegross primary enrollment ratio for 1981 would have been recorded as 77.9 percentand not 84.9, as appeared in the publication. In other words, the officially publishedfigures, and those supplied by Zambia to UNESCO and the World Bank, may bebased on unreliable data bases. All such figures should be treated with somecaution and with the realization that percentages given for enrollment andparticipation rates are likely to be on the optimistic side. This report strives topresent a more realistic picture by making extensive use of data from the 1980census. Because of this, some of its indicators may not agree with those in otherdocuments.
The Financing of Education,1975 to 1985
The funds and resources required for Zambia's education system come from avariety of sources (figure 5.1). Some of these sources have played a role since thebeg'nnings of formal educational provision; some have come to play a role only inrecent years; while the role of some is still on the drawing board. Essentially, theprincipal sources on which the education system depends for its direct or indirectfinancing are central government revenues, official development assistance fromabroad, and private and institutional resources. Each of these is examined todetermine the adjustments that were made in the years of financial stress.
The Financing of the Social Services SectorSome authors (for example, Lewin 1986; Lourie 1986) state that in a period offinancial difficulty the social services sector will suffer from relatively greatercutbacks than other sectors of the economy. This is because, as noted in chapter 1,the services provided in this sector are not seen to contribute directly andimmediately to economic production, whereas the sector itself is acknowledged tobe probably the largest spender of public funds and hence the most obvious target forcuts and reductions. This expectation is not borne out, however, in the Zambian:ase. As table 5.1 reveals, although the share of the GDP usd by the social servicesministries (Education, Health, Information and Broadcasting, Labour and SocialServices, and Youth and Sport) fell between 1975 and 1985, the somewhat erraticdecline was much less severe than that experienced by the "productive" ministries(all agriculture-related ministries, Commerce and Industry, Mines, andTourism). The share of the social services ministries fell from 9.2 to 7.3 percent, adecline of almost 21 percent, the share of the productive ministries fluctuatedconsiderably, with a notable rise in 1980 due to capitalization in the mining andenergy sectors, but overall their share of the GDP fell from 4.0 percent in 1975 to 2.5percent in 1985, a decline of' 38 percent. In terms of total government expenditures,the social services ministries actually increased their share from 17.0 percent in1975 to 21.1 percent in 1985, whereas the productive ministries' share fell over thesame period from 7.3 to 7.1 percent. The importance attached to the provision ofsocial services can be gauged from the fact that on average, throughout a decade ofvery grave financial problems, the social services sector received just twice the
30

The Financing of Education, 1975 to 1985 31
Figure 5.1 The Origins of Educational Resources in Zambia
Total Resources for Formal Education
Domestic ForeignResources Resources
Government Nongovertiment
1
Bilateral M ultilatoralA greemen ts Agreements
G overnment Nongovernment
CentralGovernment
Funds
1Individuals Philan hroPical Institutional
Local(level nment
Fun ds
Grants,Donations
Parents, CommunityUsers
Activities
Production ir estments
Philanthropical
LDonatiGrRnts,ons
OwnershipStitictures
Instit utional
NG0s,Missions
Private Companysie`gled
CommunitySchools Schools . Schools
amount that was devoted to the productive sector, notwithstanding the exceptionallylarge commitment to the latter in 1980. Since the data on which these ratios arebased include not only capital provisions, but also subventions in the form of loansand investments (but with the exclusion of subsidies), severe economic problemsclearly did not prevent Zambia from making a strong effort to support the socialservices sector.
Within the social services sector, approximately 63 percent of the annualexpenditure has consistently been devoted to education. At the level of recurrentexpenditure, education received twice as much on average as was devoted to health,and four times what was devoted to agriculture (table 5.2). During 1975-85, the realper capita GDP declined by 23.9 percent, from K382 to K291. Per capita spending fellwithin all three areas, agriculture, health, and education, but in none to the sameextent as the per capita GDP. The decline was most severe in agriculture, at 19.1percent, whereas in education the drop was 10.1 percent, and in health it was 3.4percent. Figures of this nature inevitably bring into stark relief the difficultinvestment choice that is implicit in every allocation of resources to education.They also suggest that the formal education system, which absorbs virtually all theresources for education, is given a mach higher priority than any system of
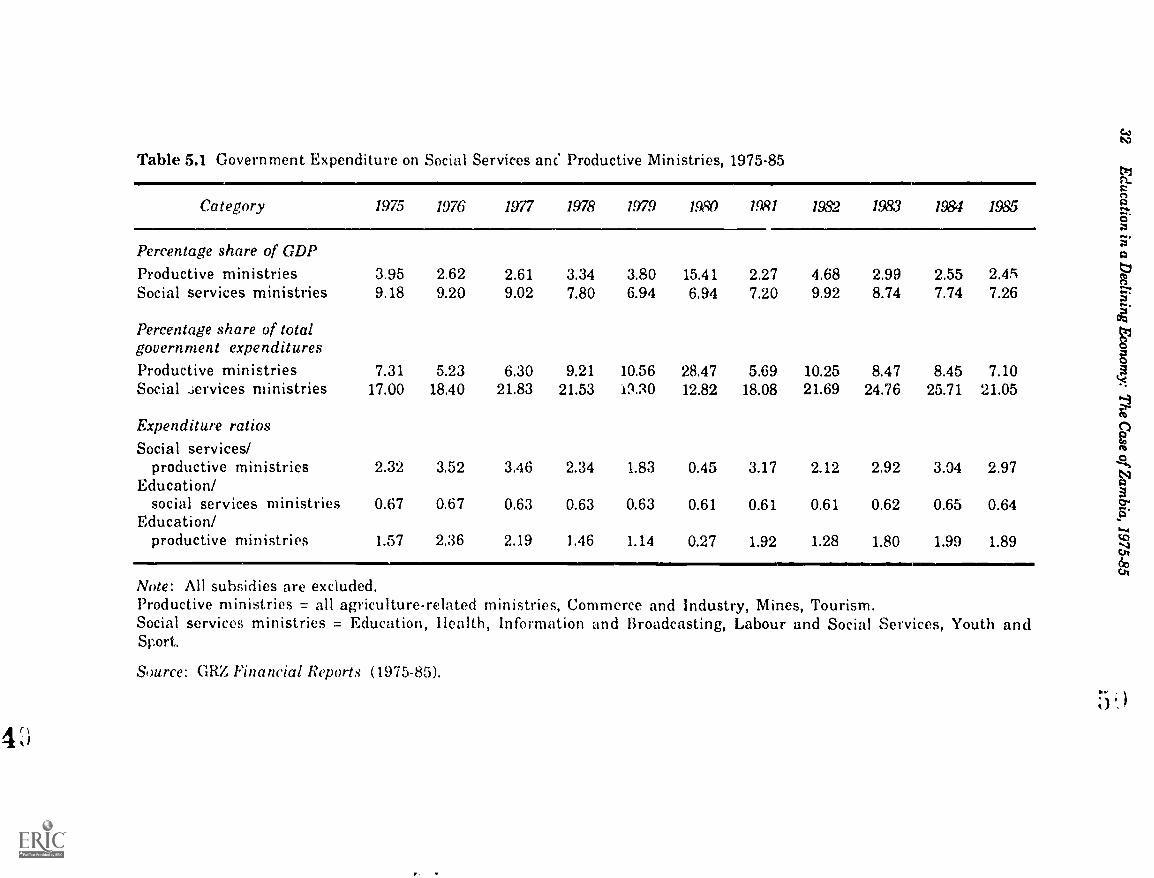
Table 5.1 Government Expenditure on Social Services ane Productive IVIinistries, 1975-85
Category 1975 1976 1977 1978 1979 1980 1981 1982 1983 1984 1985
Percentage share of GDPProductive ministries 3.95 2.62 2.61 3.34 3.80 15.41 2.27 4.68 2.99 2.55 2.45Social services ministries 9.18 9.20 9.02 7.80 6.94 6.94 7.20 9.92 8.74 7.74 7.26
Percentage share of totalgovernment expendituresProductive ministries 7.31 5.23 6.30 9.21 10.56 28.47 5.69 10.25 8.47 8.45 7.10Social services ministries 17.00 18.40 21.83 21.53 19.30 12.82 18.08 21.69 24.76 25.71 21.05
Expenditure ratiosSocial services/
productive ministries 2.32 3,52 3.46 2.34 1.83 0.45 3.17 2.12 2.92 3.94 2.97Education/
social services ministries 0.67 0.67 0.63 0.63 0.63 0.61 0.61 0.61 0.62 0.65 0.64Education/
productive ministries 1.57 2.36 2.19 1.46 1.14 0.27 1.92 1.28 1.80 1.99 1.89
Note: All subsidies are excluded.Productive ministries = all agriculture-related ministries, Commerce and Industry, Mines, Tourism.Social services ministries = Education, Health, Information and Broadcasting, Labour and Social Services, Youth andSport.
Source: GRZ Financial Reports (1975-85).

The Financing of Education, 1975 to 1985 33
Table 5.2 Recurrent Expenditure per Capita by the Ministries of Ageculture,Health, and Education, 1977-85(in constant 1977 kwacha)
+4=1111111Year Agriculture Health Education
.41=111Mlilv
1977 4.51 9.97 18.361978 3.96 8.29 16.801979 3.66 8.06 16.031980 3.58 8.39 15.391981 3.28 8.13 16.291982 4.80 ::: 19 18.881983 4.62 7.94 16.511984 3.78 7.22 15.971985 3.65 9.63 16.51
Note: Agriculture includes all agriculture-related ministries: Agriculture andWater Development, Lands and Natural Resources, Cooperatives, and theirpredecessors. All subsidies are excluded.
Sources: GRZ Financial Reports (1977-85); CSO (1986).
agriculture extension or education However, it may be that "investment choice" isnot an appropriate description in this context, though "operational priority" is, sincemuch that occurs in decisionmaking about the allocation of resources, especially intimes of financial difficulty, consists of merely responding to inescapablecommitments, especially those for teacher salaries for an evergrowingenrollment.
The Financing of EducationFor education itself, the picture of overall resource allocation is somewhat
mixed. The percentage of constant GDP devoted to educaLion declined between 1977and 1979; then it rose, peaking in 1982; it declined again in 1983 and 1984, butimproved slightly in 1985 (table 5.3). The sharp rise in 1982 is mirrored in othersectors of the economy and reflects a substantial public sector pay increase effectedduring that year. The figures show that there was a decline in the national effort inthe early years of the economic collapse, but substantial recovery in the 1980s. Aswill be seen, this U-shaped pattern, decline followed by recovery, tends to becharacteristic of other aspects of educational provision during this decade. Acrossthe entire period to 1985, education's share of GDP averaged 5.5 percent. Thiscompares very favorably with other countries in Africa, for example, it is higherthan the average of 4.6 percent for the countries of East Africa (Wolff 19,34, p. 38),and is exceeded by only 8 out of 29 countries for which data are available (WorldBank 1986, appendix table 2).
The actual proportion of its spending that the government devotes to educationeach year likewise presents a somewhat mixed picture (table 5.3). In the yearsimmediately after the rJcession set in this proportion rose, but then in 1977 it began

Table 5.3 Educational Expenditures in Relation to GDP and Government Expenditure, 1975-85(at current prices)
Category 1975 1976 1977 1978 1979 /980 1981 1982 1983 1984 1985
GDPGDP (kwacha millions) 1,583.40 1,872.20 1,986.40 2,250.70 2,660.40 3,063.60 3,485,40 3,595.30 4,181.20 4,931.00 6,332.10GDP per capita (kwacha) 323.80 371.50 382.00 419.90 482.00 539.40 596.80 504.30 672.20 768.10 942.30
Government expenditures(kwacha millions)Total expenditure 856.0k 936.40 821.00 815.42 966.41 1,657.57 1,388.67 1,643.24 1,475.93 1,484.63 2,184.33Recurrent expenditure 609.47 608.89 660.70 647.07 791.04 1,081.97 1,230.63 1,323.02 1,250.01 1,302.55 1,906.47Capital expenditure 246.57 327.52 160.30 168.35 165.37 575.60 158.68 320.22 225.92 182.08 277.86Routine running costaa 259.28 298.10 309.32 309.93 371.22 449.63 567.26 721.19 710.68 715 994.36
Education expenditures(kwachaTotal expenditure 98.01 116.88 113.08 109.80 116.64 128.26 151.52 212.20 224.96 249.18 293.19Recurrent expenditure 76.41 94.14 95.46 99.67 109.11 119.91 146.47 196.51 208.57 229.34 272.40Capital expenditure 22.60 21.74 17.62 10.13 6.44 8.34 6.06 15.69 16.40 19.85 20.79
Mean1975-85
Percentage relationshipsTotal govenir .ent. exp..: diture/GDP 54.00 50.04 41.33 36.23 35.94 64.10 39.84 47.71 35.30 30.11 34.50 39.68Total educs.-.... expenditure/GDP 6.19 6.19 5.69 4.88 4.34 4.19 4.36 5.90 5.38 5.06 4.63 5.04Total education expenditure/total
government expenditure 11.46 12.38 13.77 13.47 12.08 7.74 10.91 12.91 16.24 16.78 13.42 12.74Recurrent education/recurrent government 12.37 15.46 14.45 16.40 13.79 11.09 11.82 14.85 16.69 17.61 14.29 14.42Recurrent education/routine runniug cost..... 29.08 38.87 30.86 32.16 29.39 26.67 26.64 27.25 29.35 29.58 27.39 31.42Capital education/capital government 9.20 6.64 5.03 8.02 3.89 1.45 3.83 4.90 726 10.90 9.86 5.90
At censtant 1977 pricesGDP (kwacha millions) 1,986.40 1,963.40 2,068.80 2,010.70 1,982.00 1,773.10 1,821.00 1,902.00 1,963.70Per capita GDP (kwacha) - - 382.00 370.00 374.80 364.00 339.40 292.90 292.80 296.30 290.70Total education expenditure 113.08 99.19 93.71 93.48 99.62 123.37 110.76 111.39 119.43Total education expenditure/GDP 6.69 8.00 4.63 4.66 6.03 6.96 6.08 5.86 8.11 5.51
not applicablea. Routine running coGts = personal emoluments, recurrent departmental charges, grants and other payments.Sources: GRZ Financial Reports (1975-85); CSO (1986).
a5'atir:
1
:41

The Financing of Education, 197. 1985 35
to decline until in 1980 it reached an all-time low of 7.7 percent. It rose steadily andsubstantially after that, to reach 16.8 percent in 1984, but fell to 13.4 percent in 1985.The average percentage for the decade was 12.7. Unlike the relationship to the GDP,these figures appear low by comparison with other African countries. Wolff (1984,p. 38) records 15.6 percent as the average for 17 countries of eastern Africa. At notime in its history did educational spending in Zambia ever come near theproportions of 20 percent or more that are recorded for Kenya, Rwanda, Zaire, or theCôte d'Ivoire.
In terms of routine running costs, that is, what the government spends for allministries on personal emoluments, departmental operating coats, and grants toinstitutions (such as the univei aity), education's share has been consistently high,about 30 percent or more. However, its share of these costs fell somewhat over thedecade, from about one-third in 1975 to 1980 to just over 30 percent in 1980 to 1985.
The annual recurrent and capital expenditure on education per member of thepopulation averaged approximately K18 (at 1977 prices) during 1975 to 1985, orUS$21 at the 1977 exchange rate. Two things stand out from table 5.4, which showsthe yearly spending per inhabitant. One is the way that per capita expenditure hasfallen in dollar terms since 1982, this being largely due to the revaluation of thelocal currency. The second is the way Zambia's per capita expenditure did notfollow the pattern for the rest of Africa in the second half of the 1970s. Instead ofincreasing, as it had done throughout the continent, it first fell and then stagnated.At the onset of the economic crisis in 1975, Zambia was spending on education halfas much again per capita as the rest of Africa, but by 1979, Zambia's spending wasone-sixth less. This was due, at least in part, to the impact of the economic setbacks.
Table 5.4 Expenditure on Education per Capita in Zambia and DevelopingCountries, 1975-85
YearZambia_
Kwacha US$
1975 20.0 30.81976 22.9 25.51977 21.7 25.61978 20.5 25.91979 20.9 25.51980 22.6 28.21981 25.8 34.91982 35.1 37.71983 36.2 28.91984 38.8 21.71985 43.6 16.1
All developing Developing countriescountries in Africa
(US$) (US$)
19 1822 212/1 2427 2731 30
n . a. n . a.n . a. n .a .n . a . n . a.n . a . n . a .n . a . n . a .n . a . n . a .
n.a. = not availableNote: Capital expenditure included.Sou rce: GRZ Financial Reports (1975-85); Coombs (1985, appendix table 5.2).

36 Education in a Declining Economy: The Case of Zambia, 1975-65
The improvement that began to show in the early 1980s was reversed after 1982 witl.the continuing deterioration of the economy and efforts to correct the distortedforeign exchange rate that had prevailed earlier.
The general picture that emerges is of efforts to maintain and increase the levelof educational spending during a decade of financial hardship, efforts that metwith mixed success. The competing claims of other budgetary areas for limitedresources did not result in any significant or maintained diversion of resourcesaway from education. Instead, the government took steps to ensure that education'sshare was not allowed to decline too dramatically. These efforts succeeded to theextent that real spending on education increased 5 percent between 1977 and 1985,but the impact of :his was counteracted by a 44 percent increase in enrollmentduring the same period.
Expenditure by Level of EducationWithin the education sector, approximately two-thirds of the expenditure goes to
primary and secondary schools, one-sixth to the university and bursary payments,and the remaining one-sixth to teacher and technical education, sundry supportdepartments, and the costs of administering the education system. Since 1975,shifts have occurred in the subsectors that account for the greater part of educationalspending (table b.5). This is most noticeable at the level of the university andbursaries for students studying at the university or abroad. These two areas takentogether doubled their share of the recurrent educational expenditure from slightlyover 9 percent in 1975 to over 18 percent in 1985. This increase has taken place at theexpense of almost all other subsectors. The proportions spent on primary,secondary, teacher, and technical education in 1980-85 were all lower than those inthe period 1975-80. Primary education suffered a 3.5 percent drop in its share ofeducational resources; 9.3 percent was cut from secondary education; teachereducation lost 8.5 percent; while the greatest proportional loss, 19.5 percent, wassustained by technical education. The university, however, increased its share ofeducational expenditure by 28 percent, and the share devoted to bursaries almosttrebled. A similar pattern emerges when considering the recurrent expenditure ateach level as a function of the GDP.
We have already noted that real expenditure on education increased 5 percentbetween 1977 and 1985. This enabled real expenditure at the primary level toincrease from K44.93 million in 1977 to K48.69 million in 1985, but in thesecondary, teacher training and technical education subsectors, some decline wasevident. There was an almost steady rise in real terms in the amount spent eachyear on the university and on bursaries. Real expenditure on the sundry servicedepartments (curriculum development, psychological services, examinations,educational broadcasting, and so on) and on ministry central and regionalheadquarters increased substantially (over 39 percent) between 1977 and 1985. Mostof this increase was necessitated by expansions in the activities and range ofsupport services provided by the various departments. Although a second educationministry was established in 1982, it did not occasion any increase in expenditure atthe central level.
Unit CostsThe various changes in expenditure proportions and amounts must be viewed
against the background of increasing enrollment. These increased at all levels
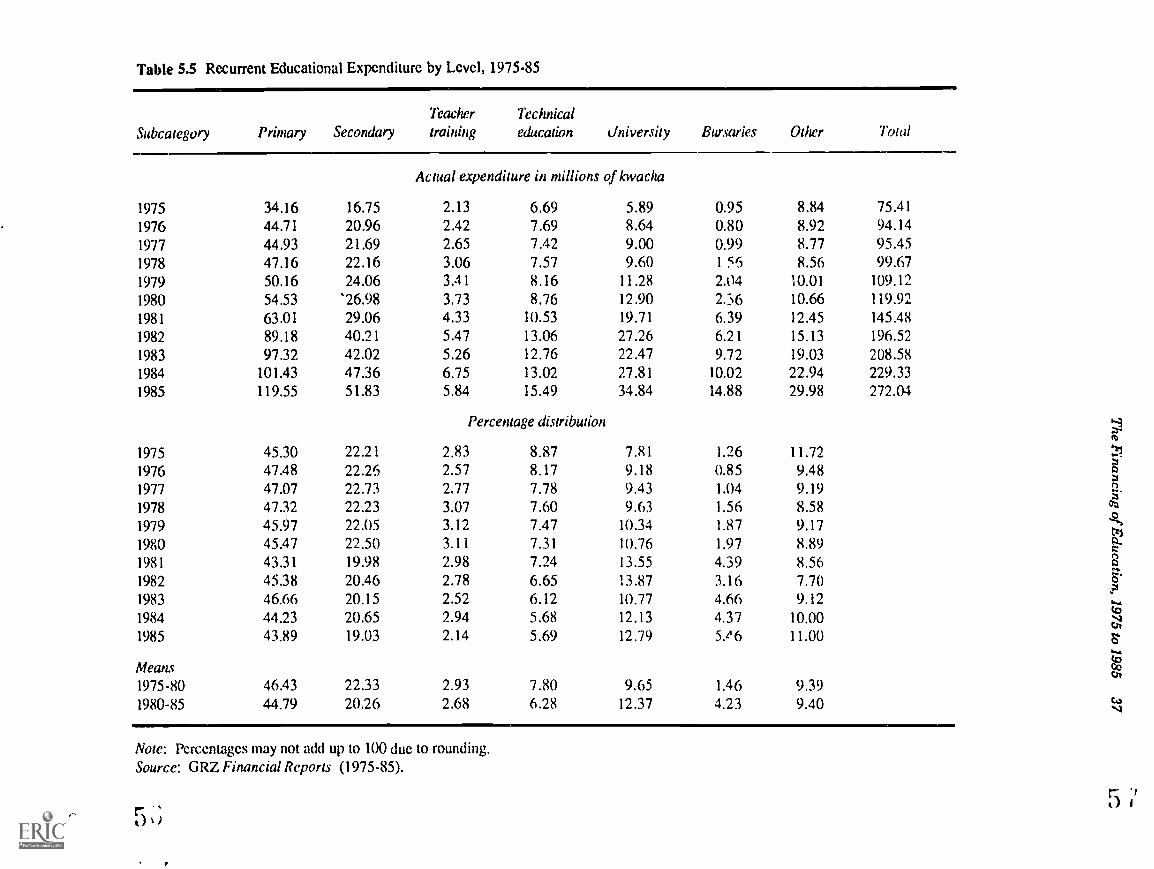
Table 5.5 Recurrent Educational Expenditure by Level, 1975-85
Subcategory Primary Secondary
Teacher
trainingTechnicaleducation University Bursaries Other Total
Actual expenditure in millions of kwacha
1975 34.16 16.75 2.13 6.69 5.89 0.95 8.84 75.411976 44.71 20.96 2.42 7.69 8.64 0.80 8.92 94.141977 44.93 21.69 2.65 7.42 9.00 0.99 8.77 95.451978 47.16 22.16 3.06 7.57 9.60 1 56 8.56 99.671979 50.16 24.06 3.41 8.16 11.28 2.04 10.01 109.121980 54.53 '26.98 3.73 8.76 12.90 2.-6 10.66 119.92
1981 63.01 29.06 4.33 10.53 19.71 6.39 12.45 145.48
1982 89.18 40.21 5.47 13.06 27.26 6.21 15.13 196.521983 97.32 42.02 5.26 12.76 22.47 9.72 19.03 208.581984 101.43 47.36 6.75 13.02 27.81 10.02 22.94 229.331985 119.55 51.83 5.84 15.49 34.84 14.88 29.98 272.04
Percentage distribution
1975 45.30 22.21 2.83 8.87 7.81 1.26 11.721976 47.48 22.26 2.57 8.17 9.18 0.85 9.481977 47.07 22.73 2.77 7.78 9.43 1.04 9.191978 47.32 22.23 3.07 7.60 9.63 1.56 8.581979 45.97 22.05 3.12 7.47 10.34 1.87 9.171980 45.47 22.50 3.11 7.31 10.76 1.97 8.891981 43.31 19.98 2.98 7.24 13.55 4.39 8.561982 45.38 20.46 2.78 6.65 13.87 3.16 7.701983 46.66 20.15 2.52 6.12 10.77 4.66 9.121984 44.23 20.65 2.94 5.68 12.13 4.37 10.001985 43.89 19.03 2.14 5.69 12.79 5.e6 11.00
Means1975-80 46.43 22.33 2.93 7.80 9.65 1.46 9.391980-85 44.79 20.26 2.68 6.28 12.37 4.23 9.40
Note: Percentages may not add up to 100 due to rounding.Source: GRZ Financial Reports (1975-85).

38 Education in a Declining Economy: The Case of Zambia, 1975-85
except in technical education, where they fell somewhat. The increase in primaryschool enrollment far outstripped the slight increase in funds expended, with theresult that unit costs at the primary level have fallen sharply in real terms. In 1977,the government spent K44.93 million on meeting the educational needs of 936,817children; in 1985, it spent K48.69 million (at 1977 prices) on 1,348,639 chiklren. The8.4 percent increase in real expenditure was overwhelmed by the 44.0 percentincrease in enrollment. In consequence, unit costs at the primary level fell in realterms from K47.96 in 1977 to K36.11 in 1985, a drop of 24.7 percent (table 5.6).
The decrease at the secondary level was even more severe. In 1977, thegovernment spent 1{21.69 million on secondary education for 83,887 pupils. In 1985,it spent K21.11 million (at 1977 prices) for 131,502 pupils. Thus, unit costs fell fromK258.61 in 1977 to 1{160.53 in 1985, a decline of 37.9 percent. These figures includetransfer payments made on behalf of boarders who constituted more than half of thesecondary school enrollment throughout most of the period. On removing the costsof boarding, unit costs for strictly academic activities fell by over 50 percent, fromK209.41 in 1977 to K104.20 in 1985.
This halving of real unit costs at the secondary level must. be interpretedcarefully, bearing in mind the changing composition of the secondary schoolteaching staff. Two significant changes, with implications for unit costs, haveoccurred in the staffing of secondary schools since the mid-1970s. First, theproportion of expatriate staff has declined steadily, from 2,228 (70 percent) in 1975 to888 (18 percent) in 1984. In 1975, at least two-thirds of the expatriate teachers were onregular contract appointments, fully supported by local funds (the remainder weresupported by various donor agencies). By 1984 this proportion had fallen to about 50percent. The need to pay end-of-contract gratuities, as well as travel and educationexpenses, made the expatriate teacher much more costly than a comparablyqualified and experienced local pewri. Second, the proportion of graduate teachersdecreased while the proportion holding a diploma increased. As salaries are basedon qualifications, diploma holders are cheaper to hire than graduates. In addition,most of the teachers are relatively young, and therefore at relatively low points ontheir salary scales.
Since salaries constitute approximately 60 percent of the governmentexpenditure at the secondary level, the use of less costly teachers allows theauthorities to accomplish more with the same or even fewer resources. Some expertsadvocate adopting a deliberate policy to this end, especially at the primary levelwhere the proportion of resources devoted to salaries is so high, but this is not alwayspossible and at times it is not pedagogically desirable (Eicher 1984). Zambia'sexperience at the secondary level illustrates the impact the adoption of such ameasure could have, although what occurred in Zambia was not the outcome of adeliberate policy decision, but an unforeseen outcome of the process ofZambianization.
The most dramatic shift in the size of the unit cost has been at the university,where it has increased substantially in real terms (table 5.6). In 1977, theuniversity had a full-time student population of 3,351 and an allocation of K9.0million for its operating costs, giving an operational unit cost of K2,686. To this wemust add the student bursary awards of K0.99 million paid by the government.Thus, the total unit cost in 1977 was K2,982, or 7.4 times the per capita GNP. By 1985this figure had grown to K4,211 (at 1977 prices) or 15.9 times the per capita GNP, andwas made up of an operating grant of K14.19 million and bursary awards of K4.14million for 4,352 students. This was an increase of over 41 percent during a period

Table 5.6 Costs per Student by Education Level, 1977-85(in constant 1977 kwacha)
Education level 1977 1978 1979 1980 1981 1982 1983 1984 1985
Primary schools 47.95 44.17 40.82 38.14 38.59 46.22 40.09 35.97 36.11
Secondary schoolsincluding boarding 258.61 224.98 212.57 207.86 193.24 222.94 179.87 168.30 160.53
Secondary schoolsexcluding boarding 209.41 181.62 164.72 161.16 150.36 170.82 138.62 129.00 104.20
Teacher training 700.23 705.07 627.49 611.61 634.57 826.97 601.23 648.22 463.74
Ter hnical educationthiversity
including bursaries
1,303.91
2,981.62
1,184.20
2,855.66
1,252.78
2,863.62
1,196.14
2,905.90
1,258.22
4,315.43
1,339.83
4,916.24
1,187.67
3,943.29
1,185.40
3,681.18
1,198.71
4,210.68
Universityexcluding bursaries 2,685.77 2,457.38 2,432.44 2,465.87 3,324.77 4,140.00 2,782.76 2,978.75 3,260.49
Source: GRZ Financial Reports (1977-1985), enrollment data.

40 Education in a Declining Economy: The Case ofZambia, 1975-85
when the unit costs for primary education fell by 25 percent and for secondaryeducation (including boarding costs) by almost 38 percent.
Part of the large increase in unit costs for the university may be attributed to thecommencement of university operations in the Copperbelt in 1978 and to theestablishment of new programs (such as land surveying, veterinary medicine,and architecture) that, because of the small number of students involved, tend to beexpensive. But note also that the figures shown are actually underestimates becausethey do not take account of the extensive development assistance programs thatcontribute heavily to the support of staff, the purchase of equipment, the provision oftransport, and the other running costs of the university.
In 1977, the annual cost per university student was about 62 times that of aprimary pupil, but by 1985 unit costs at the university were more than 116 times whatthey were in primary schools. At the secondary level, the average unit cost at theuniversity was about 13 times that for secondary schools in 1977-80, but rose to 23times for 1982-85. Clearly, the government allocated relatively more resources,and in growing proportions, to the university than to other levels of education and atthe expense of the other levels. If the primary and secondary schools had receivedin 1985 the proportion of resources that they had received on average in 1977-80, theywould have had an additional K6.5 million (at 1977 prices) at their disposal.Because of enrollment increases this would still not have been enough to preventtheir unit costs slipping back, but the slippage would not have been quite so great.One of the challenges that now faces education economists in Zambia is how torectify this imbalance.
Unit costs relative to GDP for Zambia and other countries and regions are shownin table 5.7. This table reveals that the ratio of unit costs to per capita GDP inZambia is low at the primary level, much the same as the average for anglophoneAfrica at the secondary level, and high for university education. In other words,Zambia does not spend as much per student on primary education as many of itsneighbors, but spends proportionately more than several of them on audents inhigher education.
Expenditure by FunctionAn analysis of educational spending reveals that at the primary level salaries
absorb an everincreasing proportion, and an ever-diminishing proportionremains available for all other costs, especially for purchasing teaching materialsand classroom supplies. The proportion spent on salaries rose from 84.4 percent in1975 to 95.6 percent in 1985. At the same time, the proportion spent on teachingrequisites fell from 9.8 percent of expenditures in 1975 to 1.7 percent in 1985. Actualexpenditure on salaries and wages rose from 1(40.91 million in 1977 to K46.56million in 1985, while expenditures on teaching materials fell from K2.21 millionin 1977 to K0.63 million in 1985 (when enrollments were more than 40 percenthigher).
The opposite situation prevailed at the secondary level. The proportion spent onsalaries fell from 64.3 percent in 1975 to 61.1 percent in 1984. The drop in the salarycomponent when the number of teachers was rising rapidlyfrom 3,202 in 1975 to5,043 in 1984was largely due to the changing composition of the teaching force asexplained earlier. The increase in the expenditure on teaching materials was suchthat the real per capita expenditure for these items rose from K13.84 in 1977 to K14.20in 1985. The protection of the allocation for teaching items at the secondary level ina time of financial adversity is a notable achievement, but when contrasted with the

The Finan,:ing of Education, 1975 to 1985 4!
Table 5.7 Ratio of Unit Costs of Education to per Capita GNP in Selected Countriesand Regions
Country /Region Primary schools Secondary schools Higher education
Zambia (1983) 0.14 0.50 14.0Zambia (1984) 0.13 0.48 13.6
Botswana (1979) 0.20 1.03 6.5Kenya (1980) 0.14 0.52 9.9Malawi (1981) 0.06 1.08 15.9Tanzania (1981) 0.12 2.94 30.9
East Africa 0.16 0.85 10.4
Sub-Saharan AfricaAnglophone 0.18 0.50 9.20Francophone 0.29 1.43 8.04
All developing countries 0.14 0.41 3.70
OECD countries 0.22 0.24 0.49
Sources: Table 5.5; WoHT (1984, annex I, tables 5 and 18); CSO )86); Mingat andTan (1986, table 3).
disastrous decline at the primary level, it bears out the vulnerability of the weakersectors in a period of financial hardship. There may be a second aspect to this. InZambia, responsibility for preparing the budget for primary education rests withregional offices that answer to the office of the prime minister. However,responsibility for the budget at the secondary level rests with the Ministry ofEducation's central headquarters. We can hypothesize that centrally preparedbudgets, with advocates on the spot to plead for their causes, will suffer less in timesof economic difficulty than those that are prepared at the local level.
The considerable variation in locally determined budgets for primaryeducation is revealed in table 5.8, which shows expenditures by region. This doesnot follow the expected pattern of larger allocations to urban as opposed to ruralregions, but instances occur where regions with fewer pupils have receivedallocations several times larger than regions with many pupils.
The regional expenditures per pupil demonstrate the uneveness of resourceallocations between regions and from year to year. The line-of-rail regions-Copperbelt, Central, Lusaka, and Southern-do not come out as the most favoreddespite their generally higher proportion of trained teachers. In some years thehighest per capita allocation of resources was in rural regions, such as Luapula,although for each of the years shown the lowest allocation was always in anotherheavily rural region, the Northern. This region also had the smallest allocationfor the purchase of teaching materials in four of the five years for which data areavailable.

42 Education in a Declining Economy: The Case of Zambia, 1975.85
Table 5.8 Primary School per Capita L..penditures by Region, 1981-85(constant 1977 kwacha)
Region 1981 1982 1983 1984 1985
All educational costs
Lusaka 38.13 48.47 43.85 37.12 33.63
Copperbelt 39.22 46.75 41.20 36.62 40.15
Central 36.95 46.59 39.59 36.54 35.26
Northern 33.88 41.17 36.00 32.34 28.93
Western 40.94 50.09 42.11 37.71 37,63
Eastern 35.36 41.99 36.31 32.42 33.71
Luapula 50.28 49.29 41.17 40.68 38.15
North-Western 39.57 47.75 41.10 35.09 33.00
Southern 37.90 46.74 40.18 36.40 40.28
Zambia 38.59 46.22 40.09 35.97 36.11
Student requisites
Lusaka 1.00 0.94 0.77 0.47 0.19
Copperbelt 0.63 1.52 0.65 0.75 0.76
Central 1.11 1.25 0.86 0.56 0.32
Northern 0.79 0.89 0.47 0.35 0.16
Western 1.33 2.37 0.99 0.93 0.79
Eastern 1.01 1.35 0.77 0.59 0.58
Luapula 1.47 2.53 0.92 1.06 0.75
North-Western 0.45 3.01 1.89 1.38 0.95
Southern 0.97 1.34 0.70 1.38 1.22
Zambia 0.93 1.53 0.79 0.79 0.63
Sources: GRZ Financial Reports (1981-85); Ministry of General Education andCulture enrollment data.
No pattern is apparent in table 5.8 except the particularly severe drop in funds forteaching materials experienced in Lusaka, Northern, and Central regions.Clearly, when budgetary submismons are prepared they do not adhere to any normsor standards. In their absence, much is left to the resourcefulness of local educationrepresentatives and the vigor with which they can present their submissions.
The analysis of unit costs provides valuable information when policymakerstry to determine whether they can pass any part of the costs of education on toparents or communities. For example, parents may be unwilling to shoulder thecosts of teachers' salaries, while being quite willing to assume other education-related costs. In a survey conducted for the Educational Reform ImplementationProject, only 20 percent of parents stated that they would be willing to assume

The Financing of Education, 1975 to 1985 43
responsibility for teachers' salaries, but more than 50 percent were willing to takeon other educational costs (Kelly and others 1986, table 33). However, as alreadydiscussed, the bulk of government expenditure on education is on salaries; thus, ifcommunities were to assume responsibility only for the nonsalary components ofcurrent education expenses, the government would save little. The Lndency forsalaries to rise rapidly in current terms while the costs of other items are likely torise more slowly or even decline, might also deter parents from participating inbearing salary costs. Parents might also feel that they were being called upon tosubsidize teachers, who are relatively well off, when they would prefer to use theirresuurces to benefit their children more directly and tangibly.
Capital ExpenditureThe level of capital investment in education has shown a sharp decline, with
real spending in 1985 being only about one-tenth of that in 1975 (table 5.4). Therewas a general downward slide in the level of spending until an all-time low wasreached in 1981; after that some recovery orcurred, but this has not been maintainedin real terms. Education's share in the government's overall investment progiamfell from 7.4 percent during 1975-79 to 6.8 percent during 1981-85. This occurred at atime when total public investment was falling steadily in relation to the GDP;hence capital investment in education declined substantially as a proportion of theGDP: in 1975-79 it was 0.76 percent, but in 1981-85 it was only 0.35 percent.
In general, investment in education since 1475 was lower than planned.Initially this was due not to a shortage of funds, as `he government's Annual Reportfor 1975 frankly acknowledges, but to the lack of cal. ..ity to use the funds available.However, once the recession took hold, the funds to meet planned investmenttargets were not available. During the period of the Third National DevelopmentPlan (1979-83) actual expenditure was only some 40 percent of the planned total.
This sharp drop in educational investment occurred at a time when enrollmentswere increasing rapidly. During the perior: 1975-77 an increase of 78,626 inprimary school enrollment was made possible by an investment of K7.8 million (at1975 prices). During the subsequent five years, 1978-82, the enrollment grew by afurther 184,952, but the investment fell to K4.6 million, while more recently in1983-85 an enrollment increase of 226,920 was sustained by capital expenditure ofno more than K0.3 million. In other words, the investment at the primary level fellfrom K99 per additional place in 1975-77 to K1.3 in 1983-85; a drop of more than 98percent. Because of the time lag between the commitment of capital trends and fullenrollments in the classrooms to which they give rise, some of the additional pupilsmay have had adequate classroom space and furnishings; some may also havebeen housed by community and self-help projects. Large numbers were alsoaccommodated by making maximum use of classroom space. Where warranted byenrollments, classrooms were used to house three shifts of grade 1 to 4 pupilsin themorning, across the middle of the day, and in the afternoonand two shifts ofgrade 5 to 7 pupils. But these strategies have not prevented severe overcrowdingfrom occurring in many urban schools where class enrollments of 60 to 80 are oftenfound.
Capital expenditure at the secondary level also fell, though not to the same extentas at the primary level: the unit capital cost of providing for the additionalenrollments was approximately K850 in 1975-77 and K190 in 1983-85. But at thislevel also enrollments were made to grow without any corresponding growth in

44 Education in a Declining Ei:onorny: The Case of Zambia, 1975.85
Table 5,9 Capital Expenditure on Education, 1975-85(kwacha millions)
Year Current prices 1975 prices
1975 22.60 22,60
1976 21.74 16.37
1977 17.62 10.50
1978 10.13 4,66
1979 6.44 2.51
1980 8,34 2.92
1981 6.05 1.93
1982 13.69 4.35
1983 16,40 3.67
1984 19.85 3.09
1985 ?.0.79 2.26
Note: Deflated by wholesale price index of goods for fixed capital formation (CSO
1986, table 46).
Source: GRZ Financial Reports (1975-85).
classroom space, a fact reflected in the increase in size of the average secondaryclass, which grew from 37 in 1975 to 44 in 1985.
The picture of declining investment in education is gloomier when we note thatwhat is termed capital expenditure includes not only development activities, but allforeign aid that is directed toward education. Some of this is clearly investment-related and intended for the provision of school buildings and plant, furniture,equipment, and capital goods. But much of the foreign aid has a large component oftechnical assistance that covers personnel, training, and sometimes projectoperating costs. Available records do not permit disaggregating actual expenditureinto amounts spent on capital works, technical Assistance, and operating costs. Thebest we can do is to identify (from 1980 onward) the local and foreign components of'the capital estimates at the level of budgetary approval, that is, before expenses areincurred. The picture this gives is of development aid accounting forapproximate:y 50 percent of the capital budget. The importance of foreign aid isfurther increased because actual funds made available are always less than theapproved estimates. The expenditure incurred between 1980 and 1985 averaged 85percent of the approved amounts, with most of the shortfall due to constraints onlocal resources. Resources from abroad always remained available as committed.
The secona:rv sector accounted for the largest share, more than 35 percent oftotal capital expenditure from 1975 to 1985 (table 5.10), while teacher trairingaccounted for the least expenditure. The "other" category refers to expenditures onsupport departments, the needs of the education ministry's headquarters, andteaching materials. The increasing proportion accounted for by this "other"category is due to the increasing amount of foreign aid that the ministryheadquarters administ rs directly, mostly for the supply of teaching materials.

The Financing of Education, 1975 to 1985 45
Table 5.10 Distribution of Capital Expenditure over Educational Subsectors, 1975-85(percent)
Subsector 1975-77 1978-82 1983.85 1975.85
Primary schools 15.8 28.0 3.7 15.1Secondary schools 30.7 17.2 55.4 35.4Teacher training 6.3 6.4 1.6 4.7Technical education 21.4 10.6 2.6 11.9University 16.6 16.7 6.5 13.1.Other 9.2 21.1 30.2 19.8
Source: GRZ Financial Reports (1975-85).
The major capital developments during 1975-85 included constructing 13 newprimary schools in Lusaka and additional primary classrooms and some newschools in the regions; introducing a national teachers' housing program;providing water, electricity, and sewage systems for schools in rural and urbanareas; repairing rural primary schools; replacing schools in rural areas that hadbeen provided on a self-help basis and that were no longer usable; constructing 20secondary schools in rural areas and additions to 56 existing schools;rehabilitating 69 government schools; and supplying desks and equipment toprimary schools. The rapid rise in the cost of building materials meant thatseveral projects were underfinanced and hence could not be completed, forexample, the Lusaka Primary Schools Project, where only 13 of the 20 plannedschools were built. Progress was slow on other projects and several w3re completedmuch behind schedule. These delays led to increased project costs and henceadversely affected work on other projects.
Education's Investment NeedsNVe have already noted the low level of fixed capital formation in Zambia. The
entire economy is consumption-oriented, with about 80 percent of resources in 1980-84 being devoted to consumption and only 15 percent to investment. The picture foreducation is similar. Education is heavily consumption-oriented, with only asmall fraction of the total resources left for investment purposes. In 1975-80, capitalexpenditure within the education sector accounted for 12.8 percent of all publicspending on education. This expenditure fell to 6.4 percent in 1981-85.
Clearly, Zambia requires a more substantial level of investment to enable theeducation system to function efficiently. Many schools have been allowed todeteriorate to the extent that major capital expenditure is now required torehabilitate them. Schools that have been maintained satisfactorily requireregular investments lest they too deteriorate, while those that have already beenrehabilitated require investments that will protect them from lapsing into theirformer state of decrepitude. The extension of primary education to all eligiblechildren will require considerable investment to build new schools, expand teachertraining facilities, and provide school furniture and teaching equipment.
It is difficult to see how all that needs doing can be accomplished if the presentlow level of investment continues, and if an order of priorities is not established for

46 Education in a Declining Economy: The Case of Zambia, 1975-85
the various programs and projects. However, the Third National DevelopmentPlan (TNDP) rejected the need to set priorities:
Programmes and projects to be undertaken during the TNDP assume that allpriority areas indicated in the 'Educational Reforms" are of equal value and
that any reductions or curtailments should be on the basis of certain itemswhich might be deleted or slowed down from particular categories ratherthan on the basis of eliminating whole categories (GRZ 1979, p. 355).
When investment funds are so very limited, the above approach is unlikely to besuitable. The establishment of priorities clearly requires much thought and wideconsultation, but the following are good candidates for high priority consideration:
the development of low-cost, functional classrooms and other schoolbuildings asigned to meet the needs of a given district or set of districtsusing the human and material resources available within these districts.
the establishment of a maintenance capacity with sufficient funds andexpertise to attend both to the rehabilitation and the ongoing maintenanceneeds of educational institutions at all levels;
the development of productive capacity for all necessary school materials(desks, books, writing materials, equipment, science apparatus);
the physical expansion and development of the primary sector and theexpansion and improvement of teacher training colleges.
New secondary schools, technical education institutions, and major universitydevelopments are not included since, given the present state of educationalprovision and of the economy, they do not warrant priority consideration. However,the list of priorities above would not preclude them from receiving some capitalassistance to enable them to use their existing resources more effectively and tomeet their needs for equipment and teaching materials. Institutions at all levelswould, of course, be included in the provisions for institutional rehabilitation andmaintenance. Likewise, institutions at all levels would profit from thc:development of local capacity to produce teaching materials and supplies.

Financing Education: Some Critical Issues
Apart from the general difricuiy of providing enough resources for theeducational system, the following are some of the most critical issues related to thefinancing of educatioe.
the burden of everincreasing salaries for the growing numbers of teachers;the increasing amount absorbed :)y transfer payments;the decreasing amount available for teaching requisites;the virtual disappearance of funds to maintain educational institutions;the structural imbalance in the financing of the system.
The issues above interact closely. Policy measures can be adopted that willcontrol some of them or lessen their impact, while others are less amenable to policyinterventions. More farsighted and disciplined management of resources whenthese were more abundant might have controlled the development of some of theproblems, but given Zambia's political and social climate, containing all of themwould have been impossible. This chapter will review these problems to determinewhere the declining resource base had its most severe impact and where steps can betaken, even at this advanced stage, to lessen that impact.
Teachers' SalariesAs already pointed out, teachers' salaries constitute the largest single component
of expenditure at all levels of education. The government could adopt threestrategies, singly or in combination, to reduce, or at least control, this item ofexpenditure. It could decide to
pay teachers less,employ fewer teachers,employ less costly teachers.
Pay Teachers Less
Although teachers' salaries have grown at a very high rate in current terms, andin general consume an increasingly large part of the available resources, theyhave not been able to keep pace with inflation. Ilence teachers, like their colleagues
47

48 Education in a Declining Economy: The Case of Zambia, 1975-85
in virtually every part of the economy, have experienced a decline in salaries in
real terms because of the lack of funds. The increases awarded were made possible
only by withdrawing resources from other activities and creating money through
deficit financing.As teachers are public servants, any body established to examine the pay
structure of the teaching service must do this in the context of a generalexamination of pay awards for all government employees. The dominant factor indetermining the appropriate salary scale for any government employee has been,in almost all cases, the formal educational qualification possessed. "lwever, thispolicy has constrained the development of teachers' salaries. Even though these
have tended to be marginally higher than those paid to comparably qualifiedindividuals in other areas of government service, commissions established toreview public salaries have always endeavored to retain certain relativitiesbetween the various cadres and to tailor increases in one sector to those awarded inanother. Hence, even though teachers constitute a distinct and quite powerful
subgroup of public employees, the government's policy ensured that their salariesincreased or were restrained along a common front established for all itsemployees.
Thus, even if it had so wished, the government could not have enforced a strategyaimed at paying teachers less unless it was part of a wider strategy to pay all publicservants less and to impose much stricter controls on the growth of salaries in theparastatal sector, especially in the mining industry. However, the economy had gottoo much out of hand for any such control to be possible. President Kaunda admittedas much in May 1987 when, referring to the imposition of temporary wage freezes in
the context of measures introduced to resuscitate the economy, he stated that 'theslIK:gish growth of wages and real incomes as a result of the policy of wagerestraint only led to mounting social and political tensions and a drastic fall in theliving standards of our people" (Kaunda 1987, p. 7).
By 1985, teachers' real salaries had fallen to about half their 1975 value. Thepolitical and social tensions President Kaunda spoke about would not have allowedthem tn fall much lower. Pedagogic considerationsthe need to motivate teachersand to prevent them having to supplement their incomes by undertaking economicactivities outside the classroomalso speak in favor of not allowing teachers'salaries to decline too much. Hence any strategy that proposed containing thegrowing impact of teachers' salaries on the education budget by paying them lesswould have been doomed to failure.
Employ Fewer Teachet:A second strategy that would lessen the burden of teachers' salaries would be to
employ fewer teachers. This can be accomplished by (a) adjusting the system tomake more efficient use of teachers; (b) modifying the system so that fewerteachers are needed; and (c) controlling the development of the system and theemployment of teachers more purposefully.
Adjustments within the system have proved the most popular approach inZambia. These adjustments have consisted essentially of making the maximumuse of double Jession teaching where a teacher has complete responsibility forteaching one lower primary class (grade 1 to 4) early in the day and a second classlater. More informally, they have consisted of enlarging classes. Without thecombination of multiple session teaching and large classes, Zambia could not haveachieved the current high levels of enrollment.

Financing Education: Some Critical Issues 49
Although these practices have enabled enrollment of a nominal 90 percent ofprimary school-age children, they are giving rise to grave dissatisfaction. Grossovercrowding occurs in urban classrooms, with more than 100 children reported insome classes. In 1986, the national average class size was 41, but it was 54 inLusaka and 51 in Kitwe.
In principle, the length of the teaching day is not affected by the number ofsessions a teacher teaches or the number of shifts a classroom is made toaccommodate. All children at the grade 1 to 4 level are supposed to receive three anda half hours of instruction for five days each week, and those at the grade 5 to 7 levelfive and one-third hours. But the logistics of using classrooms for two or three shiftsduring daylight hours require some reduction in the number of hours of instructionthat children actually receive, while teachers who teach double sessions are leftwith no time to organize extracurricular activities. In general, multiple sessionteaching is an unsatisfactory expedient that has led to considerable tardiness andabsenteeism on the part of both pupils and teachers. More than two decades havepassed since the Radford report called for its abolition (UNESCO 1964), but insteadof being abolished, it is being extended to bring more children into the schools.Studies are required on how it can be organized more effectively. Possiblyalternate day teaching could replace the present practice of morning sessions forone group and aft moon sessions for another. The research evidence on the impactof double session teaching on student performance is inconclusive (Fuller 1985);nevertheless, the poorest performance in the grade 7 examinations is foundconsistently in the region that has the longest history and widest use of doublesession teaching.
The cost-effectiveness considerations that lead to the widespread use of multiplesession teaching have not governed the deployment of teachers or salaryarrangements. Teachers are appointed unevenly, with higher teacher to studentratios in some regions and in certain schools. This arises partly from political andsocial pressures, and partly from the absence of clearcut guitFlines on staffingnorms and from a policy that guarantees employment to all members of theTeaching Service, even if they choose to live in a place where all teaching posts arealready filled. This policy leads to considerable overstaffing in many schools,while others remain inadequately staffed. Urban areas are the most overstaffed,and female teachers are most frequently appointed in excess of need. Allied to thisproblem is the absence of norms for the use of teachers. Some teach for only a fewhours per day or week, while others teach for as many as 34 hours per week.
More sharply defined policies are needed that will determine whether or notteachers should be guaranteed employment in areas where schools are alreadyfully staffed and will set down the minimum number of hours of teaching required.However, such policies must be backed up by the will to implement them and themanagement capacity to do so. Rumors abound that illustrate the current lack ofmanagement capacity. People say that salaries are being drawn on behalf ofteachers who have quit teaching or even died. The extent of such malpractices is notknown, but management controls are insufficient to ensure that salaries are paidonly to those who actually teach in schools.
A final adjustment that has been made in Zambia to make more efficient use ofthe stock of teachers is the introduction of multigrade teaching, where one or twoteachers provide all the instruction in a primary school, from grades 1 through 7.This system, introduced in 1985, has enabled some incomplete schools to beextended to the upper primary level. This system is suitable for areas where thepopulation is small and scattered and where the school enrollment is low. It has

50 Education in a Declining Economy: The Case of Zambia, 1975.85
proved sataactory and will be extended to some 150 primary schools. However, as
only 5 percent of primary schools will qualify to become multigrade schools, the cost
savings are small.The government has considered approaches that would involve modifying the
education system so that it could reach more students but still use almost the same
level of resources, but these have not all found favor. One such modification(Ministry of Education 1976a) was that schools should operate on a rotating system.
One group of students would attend school for three months while another groupundertook guided study at home. They would then switch, and keep switching yearround. However, the proposal drew so much public opposition that it never got to the
stage of serious planning.A second modification would be to place greater reliance on methods of distance
teaching. A variation of this approach is used at the grade 8 level through theestablishment of supervised study groups, that is, class size groups of students who
have failed to secure entry to secondary schools and who study specially prepared
materials under the supervision of a qualified adult (frequently a teacher's wife),
but who receive no formal teaching. About 5 percent of grade 7 school-leavers find
their way into such groups. Although the system was established in 1972, itseffectiveness has not yet been evaluated. But no form of distance education existsfor primary level children, and in any case, distance teaching may be less suitablefor children in the lower primary grades. In the upper primary grades distanceteaching might well turn out to be no cheaper than conventional teaching methods,
and given the public's reaction to the rotating system, any syste-y. of primaryeducation that does not assure conventional face-to-face teaching is likely to be
rejected.More purposeful control of the development of the education system and of the
employment of teachers does, however, remain a possibility. For decades thegovernment has permitted, even encouraged, capital development withoutconsidering the implications for recurrent expenditure. Oxenham (1984) recountshow as a junior government administrator in Zambia before independence, he wasable to assure villagers that if they put up a classroom and a house for the teacher,the District Education Authority would provide the teacher. This practice continuestoday. Communities are encouraged to participate in self-help activities and areassured that once the capital provisions have been made, the government will take
on the running costs, including teachers' salaries. But the government does notkeep trr k of the growth of these recurrent costs, evaluate their impact on otherneeds, r )1. assess the level of resources that will be required and whether these will
be forthcoming. The outcome is uneven development.
This problem is currently most severe at the grade 8 level, where the social andpolitical pressure to expand educational provision is very great. In rural areaswhere primary facilities are already adequate, the demand is for pressing aheadwith more grade 8 openings. These are sanctioned if the community provides thenecessary structures. Once established they are staffed by taking the best teachersout of the primary schools, but they are provided with a minimum of furniture,equipment, and supplies. Apprehension is growing that by comparison withregularly established secondary schools, these "basic education schools" may be
second-rate establishments in which adolescent children do little more thanmature physically before being exposed to the world of adult life and work. Yet theproliferation of these schools siphons off the best teachers from the primary schools
and resources from the secondary schools.

Financing Education: Some Critical Issues 51
This type of development is not new: 60 years ago bush schools of very lowquality and with virtually no resources proliferated alongside the maintainedschool system (Snelson 1974). Ironically, these bush schools also developed at atime of severe economic difficulty when the collapse of copper prices threw thecountry into disarray. But the draconian measures applied then to lessen theimpact on recurrent expenditure are not being applied now. Instead, growth isallowed to go ahead in an unconteolled and unplanned way. If unchecked, thepolicy of uncontrolled development of basic schools may result in commitmentsoutstripping available resources.
Some realignment is also needed in the hiring practices for teachers. Currently,all students who successfully complete a teacher education program are assured ofemployment as teachers. This policy was in order when the system was expandingrapidly. It remains a suitable policy for trainees from primary teacher trainingcolleges, since there is still a shortfall in the number of trained teachers and thegrowth of the child population will require continued expansion at the primarylevel. But the slower development of secondary school facilities and the reducednumbers of teachers leaving the profession combine to make this policyinappropriate at the secondary level. It has already led to overstaffing and wastedresources.
Employ Less Costly Teachers
A final strategy that would reduce the impact of teachers' salaries would be toemploy less costly teachers. This has already happened, more by default than by&sign, at the secondary level. The employment of untrained teachers in primaryschools has also reduced the salary bill. However, Zambia's policy is to replacethese teachers with better educated and better qualified individuals.
The evidence about the relationship between pupil achievement and the length ofthe teacher's own schooling is conflicting (Fuller 1985), but there is reasonablystrong evidence, from both industrialized and developing countries, that theteacher's level of verbal competence promotes the level of pupil performance. If suchcompetence were developed by a longer period of secondary education, requiringall candidates for teacher training to complete the full secondary cycle would bereasonable. This is the decision that has been made in Zambia, partly in theinstinctive belief that better educated candidates will make better teachers (andreports from the training colleges bear out that this is likely to be so), and partly inan effort to absorb some of the potentially unemployed secondary school-leavers.However, the government does not seem to have considered .e impact of thisdecision on long-term financial commitments when the raf;ie highly educatedteachers are paid up to 17 percent more than their less educated but equally well-qualified colleagues. So far as qualifications are concerned, the evidence showsthat teacher training contributes to an improvement in pupil performance (Fuller1985). Hence, the financial implications aside, the Zambian effort to ensure that allits teachers are trained appears to be justified.
Conclusion
What has emerged in the preceding pages is that pressures in Zambia were sostrong that they worked against paying teachers less, employing fewer teachers, oremploying less costly teachers. Educational developments cannot be divorced fromthe society in which they occur, and Zarnbian society was not prepared to tolerate

52 Education in a Declining Economy: The Case ofZambia, 1975.85
more than superficial adjustments to its education system. These adjustmentswere too slight to make any real impact on the proportion of resources devoted tosalaries. Society appears to have accepted this without reflecting on theconsequences. In addition, decisions were taken and situations tolerated withoutadequate information on their likely impact. One example of this was the failure toevaluate the recurrent cost implications of capital developments. Another was thedetermination to raise teachers' educational and professional skills without firstdetermining whether this would improve pupils' achievements, and if so, whether itwould be cost-effective. Finally, Zambia lacks a good information and researchnetwork that would inform, guide, and support rational policy formulation anddecisionmaking. In particular, there is no system for ongoing review of staffingneeds, thus there is no basis on which to assess likely staff needs in the future.
Transfer PaymentsThe totdl expenditure on student subsidies of all forms, or transfer payments,
has r'sen rapidly since 1977 and has more than doubled in real terms, bothabsolutely and in relation to the GDP (table 6.1). Transfers account for asubstantial share of the total education budget: they amount to approximately aquarter of what, is spent on primary schools and a half of what is spent on secondaryschools. In the past, the greatest share of the transfers has been for the secondaryschools and the university. Clearly, the government was prepared to increase theamount devoted to transfer payments, even if this meant withdrawing resourcesfrom other areas. But the government's willingness to subsidize the personal needsof stadents was not accompanied by a clear recognition of the equity and efficiencyimplications of this transfer of resources.
Table 6.1 Transfer Payments, 1977-85
Ca I e g o ry 1977 1978 1979 1980 1981 1982 1983 1984 1985
Total transfer payments(kwacha million) 7.31 7.32 8.20 8.24 11.11 11.91 11.78 11.65 16.14
Transfers-as percentage of (l1)1' 0.37 0.37 0.40 0.41 0.56 0.67 0.65 0.61 0.83
-as percentage orrecurrent educationa:expenditure 7.66 8.13 9.26 9.43 11.61 10.43 11.47 11.36 14.64
--as percentage or recurrentprimary expenditure 16.27 17.18 20.14 20.56 26.81 22.98 24.69 25.68 33.13
-as percentage of ri:curren tsecondary expenditure 33.70 36.56 41.98 41.92 68.12 60.96 56.95 65.00 76.4:-
-at primary level as percentageuf expenditure at primary level 0.40 0.20 0.20 0.20 0.20 0.20 0.20 0.20 0.20
-at secondary level as percentageof expenditure at secondaty level 18.50 19.30 22.50 22.50 22.20 23.40 22.60 23 40 35.10
--11t university as perventage ofexpenditure at univemity level 9.90 13.90 15.10 15.10 23.00 15.80 29.40 19.10 25.50
IMIM1111MM
Note: AU figures are based on constant 1977 prices,
Source: GRZ Financial Reports (1977-85), other tables in this paper.
The expenditure per secondary school boarder in 1984 was much the same, inconstant terms, as it had been in 1977, bat the 1P84 expenditure per university

Financing Education: Some Critical Issues 53
student was more than two and a half times that in 1977. In other words, most of theincrease in transfers occurred at the university level, where a very powerful groupexerted strong pressure. This group consisted of students whose disruptive behaviorled to closures of the university for lengthy periods in 1976, 1982, 1984, and 1986. Inaddition to actual closures, work at the university was frequently disrupted bystudent agitation.
In 1982 the government appointed a commission to examine affairs at theuniversity. The commission found that the root "ause of much of the unrest lay inpolitical and ideological differences between vocal elements of the students andgovernment, but admitted that personal allowances, catering services, and hostelfacilities were also involved (Nyirenda 1986).
The government appears to have given little consideration to the equityimplications of using public resources to pay for student welfare needs. Bursarieshad initially been introduced in the name of equity: nobody was to be denied accessto education because he or s'ie could not pay for it. The government assumed that ifequalit of opportunity was available at the level of entry to the education system, itshou!d be a feature throughout the system. It did not recognize that homebackground had a significant effect on scholastic performance and hence onwhether students went on to higher education (Kapambwe 1980). Evidence presPritcdin chapter 14 points to the emergence in Zambia of a self-perpetuating edu .edclass. Since education is strongly correlated with socioeconomic status, the better-off segments of society are proportionately better represented in secondary andhigher education than those less well off. Zambia is not &one in this. Mingat andTan (1986) have shown that in anglophone Africa, individuals from white-collarhomes may receive five times as much of the educational resources as their farmercolleagues. No figures are available for Zambia, but the evidence supports theauthors statement that "the white-collar group is the most successful inappropriating public education resources for themselves" (Mingat and Tan 1986,p. 269). This inequity increases when educational subsidies are made possible byreducing the amounts available for primary education, the level at which the poorparticipate on a more equal footing with the rich.
None of this appears to have been appreciated during the period under review,until in 1985, the government suddenly announced that boarding fees would bereintroduced in secondary schools the following year. The ministerial statementabout the decision drew attention not only to the worsening financial situation, but&so to the inequity in using public resources to pay for all boarding costs. Thegovernment took longer to take up the issue of bursaries for university students, butits consideration of this matter was publicized through what appear to have beencalculated leaks to the press during 1986. At the end of 1985, the governmentofficially recognized the problem in the annual plan for 1987 (GRZ 1986). There, forthe first time, official recognition of the imbalance in the financing of primaryand tertiary education was noted, and the government stated that fees would beintroduced at the university.
The volume of subsidy appropriated by university students relative to othercategories is very striking. The students receive free tuition and boarding fees,book allowance, subsistence and transport allowance. These are a minority ofstudents within the education system and should not therefore be grosslyprivileged at the expense of primary school pupils. This is both inequitable andi nefficient
...the 1987 Annual Plan and budget will entail the following measures:

.54 Education in a Declining Economy: The Case of Zambia, 1975.85
(a) a study to be initiated by the University Council to establish ways andmeans of transferring university costs for boarding and other non-academicexpenses to the beneficiaries;(b) an introduction of fees for university students during the second half of the1987 annual plan and budget (GRZ 1986, para. 35, 71).
This reordering of expenditure priorities could restore some of the resourcestaken from primary education. Mingat and Tan (1985) have shown that a 10percent reduction in student subsides could increase the budgets for primaryeducation in a number of African countries, including Zambia, by an average of 2percent. In 1985 terms this would have more than doubled the meager provision forteaching materials. Of course, primary education would not benefit unless therewas a firm determination to direct toward the primary schools the funds saved atthe higher l9vels. In a time of general financial hardship the danger is thatsavings will be absorbed by general budgetary requirements, even outsideeducation, and will not be passed on to other areas within the sector.
The Availability of Textbooks and Teaching Materials
We have already noted the disastrous decline in the official allocation forteaching materials at the primary school level. Moreover, the 1985 allocation ofK0.63 per pupil was virtually worthless when compared to the cost of educationalsupplies: enough to buy a pencil and one or two exercise books, but not enough to buya textbook. In the absence of resources, schools must rely on parents, but apart fromthe cost, which may be prohibitive for many parents, the necessary items cannotalways be found. In remote rural areas, no retail outlets exist from which parentscan purchase stationery or other school supplies, and even in urban centers, booksand stationery are available only sporadically.
In the absence of data on annual provisions of textbooks and writing materials,which would permit examining the effect of reduced funds and the impact ofvarious aid programs that have sought to supplement local resources, a study intothe current situation at some levels in primary and secondary schools wasconducted for this report. At the primary level, information was gathered from arandom sample of primary schools throughout the country on the following:
enrollments;the number of prescribed textbooks in English and mathemaacs available atthree critical points, grades 1, 4, and 7;the availability of teachers' handbooks in English and mathematics;the availability of writing implements and exercise books;the schools' opinion on the current supply situation compared with thesituation five years ago.
Most schools had the prescribed teachers' handbook or guide for the primaryschool course (table 6.2). The teachers' answer book in mathematics for grade 7 wasin short supply, but this book is considered more of a useful supplement than anessential aid.
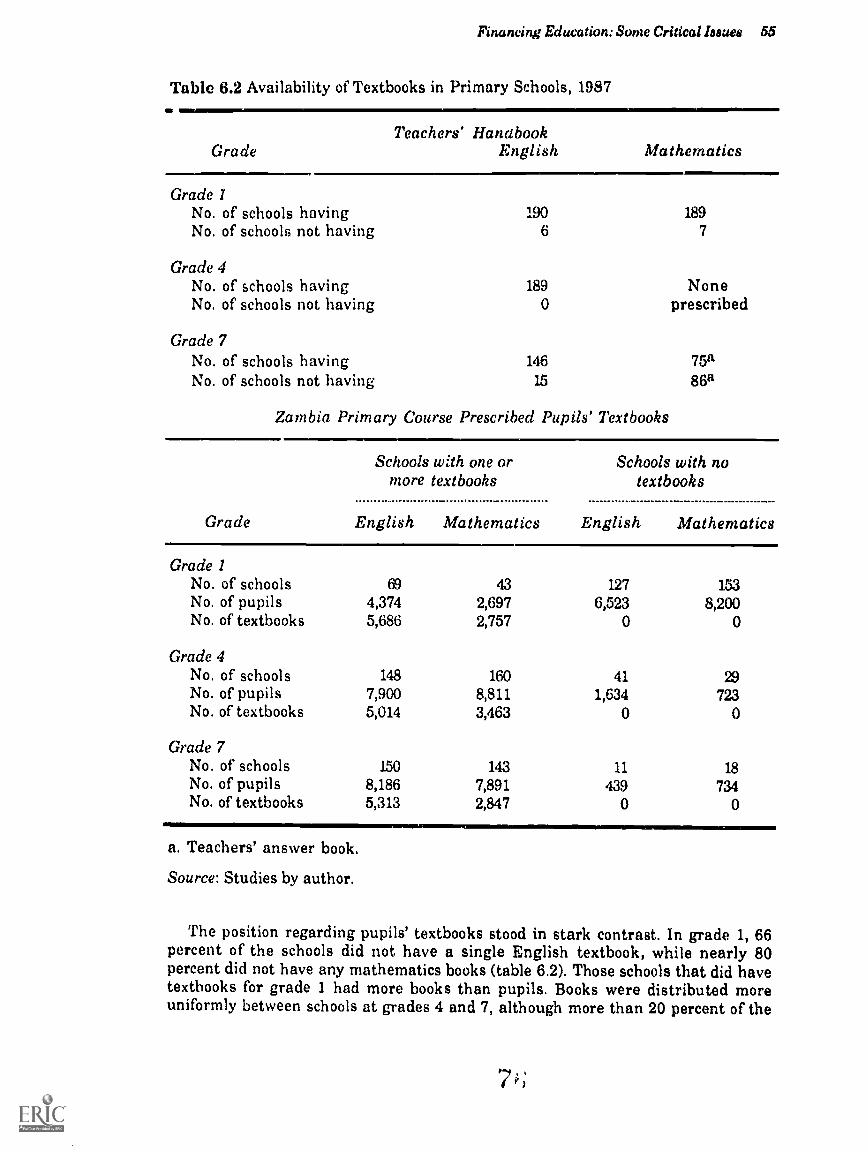
Financing Education: Some Critical &sues 55
Table 6.2 Availability of Textbooks in Primary Schools, 1987
GradeTeachers' Hanabook
English Mathematics
Grade 1No. of schools having 190 189No. of schools not having 6 7
Grade 4No. of schools having 189 NoneNo. of schools not having prescribed
Grade 7No. of schools having 146 75aNo. of schools not having 15 868
Zambia Primary Course Prescribed Pupils' Textbooks
Grade
Schools with one ormore textbooks
English Mathematics
Schools with notextbooks
English Mathematics
Grade INo. of schools 69 43 127 153
No. of pupils 4,374 2,697 6,523 8,200No. of textbooks 5,686 2,757 0
Grade 4No. of schools 148 160 41 29No. of pupils 7,900 8,811 1,634 723No. of textbooks 5,014 3,463 0
Grade 7No. of schools 150 143 11 18No. of pupils 8,186 7,891 439 734No. of textbooks 5,313 2,847
a. Teachers' answer book.
Source: Studies by author.
AMMMIIMINE=
The position regarding pupils' textbooks stood in stark contrast. In grade 1, 66percent of the schools did not have a single English textbook, while nearly 80percent did not have any mathematics books (table 6.2). Those schools that did havetextbooks for grade 1 had more books than pupils. Books were distributed moreuniformly between schools at grades 4 and 7, although more than 20 percent of the

56 Education in a Declining Economy: The Case of Zambia, 1975-85
schools did not have an English reader for grade 4. In the schools that did have
books, there were on average three pupils for every two English books, and five for
every two mathematics books, though in several schools the situation was far worse
than the average.As far as writing materials are concerned, a significant number of the schools
surveyed reported a shortage of pencils and exercise books (table 6.3). Equally
serious, only 61 percent of the schools reported that teachers usually had enough
chalk for classroom use.
Table 6.3 Availability of Writing Materials in Primary Schools, 1987
Nearly every pupil has a pencil or other writing instrument:
Grade 1 Y es 122 schoolsNo 65 schools
Grade 4 Yes 132 schoolsN o 55 schools
Grade 7 .fes 127 schoolsNo 31 schools
Every pupil has an exercise book:
English
Grade 1 Yes 123 schools (65.8%) 132
No 64 schools (34.2%) 55
Grade 4 Yes 139 schools (74.3%) 146
No 48 schools (25.7%) 41
Grade 7 Yes 135 schools (85.4%) 137
No 23 schools (15.6%) 21
Teachers usually have enough chalk for classroom use:
YesNo
111 schools (60.7%)72 schools (39.3%)
Source: Studies by author.
(65.2%)(34.8%)
(70.6%)(29.4%)
(80.4%)(19.6%)
Mathematics
schools (70.6%)schools (29.4%)
schools (78.1%)schools (21.9%)
schools (86.7%)schools (13.3%)
USMNINLIIMINI,
Finally, when asked to compare the supply situation today with what it had beenfive years ago, most heads of both primary and secondary schools agreed that theposition was worse today (table 6.4). Heads' views varied more when it came to thechalk situation: almost a quarter of them thought that the supply had improved.

Financing Education: Some Critical Issues 57
Table 6.4 Changes Perceived by School Heads in the Availability of InstructionalMaterials Over Time
Number of primary school heads interviewed: 187Number of secondary school heads interviewed: 72
Compared with the situation five years ago the current situation is:
hem Better Worse The sana
Textbooks
Primary heads 19 (10.2%) 159 (85.0%) 9 (4.8%)Secondary heads 3 (4.2%) 63 (87.5%) 6 (8.3%)
Pupils' writing materials
Primary heads 22 (11.8%) 157 (84.0%) 8 (4.3%)Secondary heads 4 (5.6%) 59 (81.9%) 9 (12.5%)
Chalk
Primary heads 41 (21.9%) 100 (53.5%) 46 (24.6%)Secondary heads 9 (12.5%) 24 (33.3%) 39 (54.2%)
Source: Studies by author.
At the secondary level, information was solicited from all government andaided schools, but of the 190 schools contacted, only 72 submitted complete replies.The information on textbooks and writing materials was requested for grade 8.Textbooks were in most abundant supply for mathematicsapproximately onebook for every pupilbut the position appeared grave for English, where three pupilshad to share a book (table 6.5). There were even fewer science booksjust 12 foreach class of 42 pupils.
Almost 85 percent of the schools affirmed that their pupils had the necessarynumber of exercise books for English, mathematics, science, and geography, while83 percent of the pupils had pencils, 58 percent had rulers, and 28 percent hadmathematical instruments (table 6.6). The chalk situation was better than in theprimary schools, though 19 percent of the schools stated that teachers usually did nothave enough chalk for classroom use.
The study clearly reveals that the supply of teaching materials in schools is in acritical state. Some schools have none of the necessary textbooks, and many of theschools that do have textbooks do not have enough to go around. Writing materialsare available, but a significant number of pupils at both the primary and secondarylevel lack them. Most heads think that the situation today is worse than it was fiveyears ago. Note that the heads gave this opinion in May 1987, when a significant
7 .7,
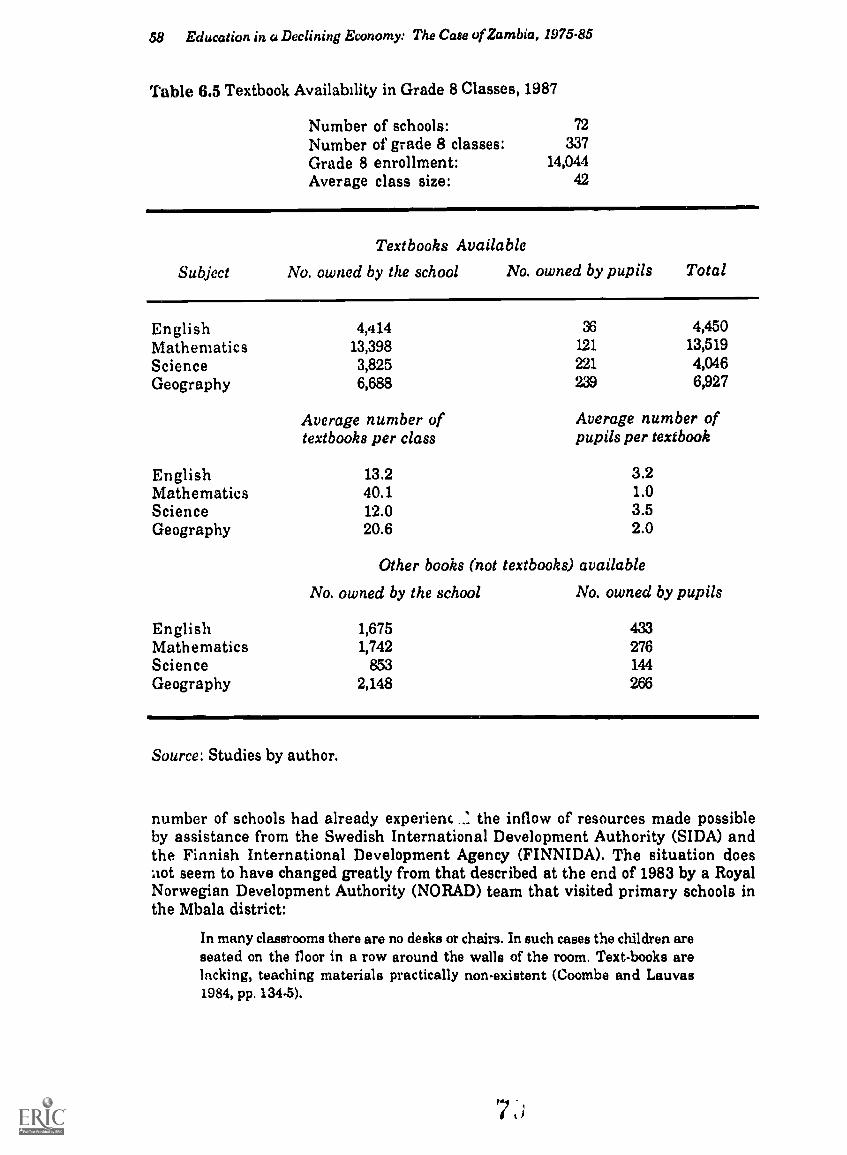
58 Education in a Declining Economy: The Case of Zambia, 1975-85
Table 6.5 Textbook Availability in Grade 8 Classes, 1987
Number of schools: 72
Number of grade 8 classes: 337Grade 8 enrollment: 14,044Average class size: 42
Textbooks Available
Subject No. owned by the school No. owned by pupils Total
English 4,414 36 4,450Mathematics 13,398 121 13,519
Science 3,825 221 4,046Geography 6,688 239 6,927
Average number of Average number oftextbooks per class pupils per textbook
English 13.2 3.2Mathematics 40.1 1.0Science 12.0 3.5Geography 20.6 2.0
Other books (not textbooks) available
No. owned by the school No. owned by pupils
English 1,675 433Mathematics 1,742 276Science 853 144Geography 2,148 266
Source: Studies by author.
number of schools had already experienc..: the inflow of resources made possibleby assistance from the Swedish International Development Authority (SIDA) andthe Finnish International Development Agency (FINNIDA). The situation doesliot seem to have changed greatly from that described at the end of 1983 by a RoyalNorwegian Development Authority (NORAD) team that visited primary schools inthe Mbala district:
In many classrooms there are no desks or chairs. In such cases the children areseated on the floor in a row around the walls of the room. Text-books arelacking, teaching materials practically non-existent (Coombe and Lauvas1984, pp. 134-5).

Financing Education: Some Critical Issues 59
Table 6.6 Availability of Writing Materials in Grade 8, 1987
Number of schools: 72Number of grade 8 classes: 337Grade 8 enrollment 14,044
Rem No. having this item Percentage having this item
Pencil 11,684 83.2Ruler 8,151 58.0Mathematical instruments 3,895 27.7
Every pupil has an exercise book:
For EnglishFor mathematicsFor scienceFor geography
Yes
60 schools62 schools61 schools62 schools
Teachers usually have enough chalk for classroom use:Yes: 58 schools (80.6%)Nc: 14 schools (19.4%)
No
12 schools10 schools11 schools10 schools
Source: Studies by author.
The Kenneth Kaunda Foundation produces most of the instructional materialsfor the primary schools. In the past, the foundation operated through twosubsidiaries, the National Educational Company of Zambia, which manufacturedthe materials, and the National Educational Distribution Company of Zambia,which distributed and sold them. But since January 1986 these companies have beenreplaced by manufacturing and marketing divisions within the foundation.
During 1975, the National Educational Company of Zambia produced onlyenough books for a book to pupil ratio of 0.6. However, this is a good figure comparedto those in the years that followed: in 1976, no books were produced, and figuresremained extremely low until 1982, when the situation improved slightly. Theextent of the improvement can be judged from the average annual productionfigures: the average gross annual production was 197,000 books in 1975-78, 148,000in 1979-81, and 468,000 in 1982-84. This is another example of the U-shaped patternalready noted in other areas of educational provision: a deterioration in the yearsimmediately after the economic decline set in, followed in the early 1980s by animprovement that was steadily maintained.
The improvement in production figures occurred prior to the intervention byFINNIDA, which did not get underway until 1985. But the improvement did notmeet the needs, as underscored by the scale of the FINNIDA rescue program, whichoriginally set as its target the reprinting of 4.69 million primary school textbooks,later reduced to 2.0 million (FINNIDA 1984). The shortfall in textbooks affectedevery primary grade and all teaching subjects, especially English.

60 Education in a Declining Economy: The Case of Zambia, 1975.85
One of the reasons why the production of school materials fell far behind theneeds was the small allocation of funds for this purpose. During 1980-85, the bills
for primary school materials, chalk, exercise books, needlework items, and somesecondary school supplies purchased from the Kenneth Kaunda Foundation
amounted to K22.46 million, however, the Ministry of Education only paid K16.90
million to the founaation. The total certified expenditure on student requisitesduring this period was 1(12.23 million at the primary level, K12.98 million at thesecondary level, and K3.38 million at the teacher training college level. If all ofthis had been used to pay for items from the foundation, there would have been morethan enough to meet p'l the bills that were presented. However, some of the money
was used to purchase materials from other suppliers, for example, those providingscience equipment, chemicals, and stationery. But even if the total expenditure hadbeen channeled to the foundation, it would have enabled production to be raised by
no more than 20 percent. The schools would have fared somewhat better, but because
of the rapidly increasing enrollments they would still have remained very short of
textbooks and other instructional materials.The current response to the lack of school materials and to the difficulty in
obtaining them even when funds are available is to resort to aid agencies forassistance. Noticing that educational materials constituted the scarcest resourcethroughout the education and training system, the report of the National TechnicalCooperation Assessment and Programming Mission to Zambia advocated someconcent?qtion of aid in this direction (UNDP 1986, pp. xxxiii, 144-5). Thegovernment has also made known its intention of attaching a high priority to the
development ' teaching materials and improving their supply:
In accordance with the educational reform and the Fourth NationalDevelopment Plan the overall objective of the (education) sector is to improvethe quality of education and to increase access to it through:
(1) an increased production, supply and distribution of educational materialthe development of a iew curriculum to meet the needs of th.: nation and 1conducting inservice education directed towards the new curriculum (GIL1986, para. 45).
The pof;itive contribution that an adequate supply of teaching materials canmake to student performance, especially in rural schools and among students fromlow-income families, has been well documented. The author's study of resources inZambian schools found a positive correlation between failure in English and lackof textbooks. Thus, any effort to improve the supply of textbooks and writingmaterials will bring positive benefits in terms of pupil performance. Zambia'sneglect of these items in the f"..(!e of more vocal and powerful demands for salaryincreases or for student bursarieL has had a negative effect on the schools and onthe morale of teachers. It is hoped that the new awareness of the importance of theseitems will lead to an overall improvement in the quality of education.
School MaintenanceThe proportion of funds allocated for school maintenance has been declining
steadily at all levels and is unevenly distributed across regions. This is one of thereasons why so many schools have fallen into a bad state of repair, although thereare a few notable exceptions, especially among the aided secondary schools.
Another reasan is that neither school authorities nor the Ministry of Educationwere directly responsible for maintenance. This task was entrusted to the

Financing Educatior.: Some Critical Issues 61
Department of Public Works, which was some steps removed from the scene ^foperations. One of the positive reactions to increased awareness of the way schoolshave been deteriorating was the transfer of overall responsibility for schoolmaintenance to the Ministry of General Education and Culture, whileresponsibility at the institutional level was entrusted to school administrators.Another reaction to the crisis in school maintenance has been to focus capital andtechnical assistance aid, largely from the World Bank and NORAD, on therehabilitation of secondary schools.
Another reaction is one that is not unexpected in times of financial difficulty: tolook elsewhere for the inputs needed to maintain schools. In this instance, this isthe immediate community the school serves, and in particular the parent teacherassociation. The good state of repair that characterizes some of the schools is due inlarge measure to the funds generated by parent teacher associations and to the laborand services they have provided. An interesting point in this context is the way theweaknesses of overcentralized control are exposed by financial problems, and howthe remedy for these weaknesses lies in decentralization.
Notwithstanding the state of physical decay into which many schools havefallen in recent years, educational services continue tu be provided. Lessons andevening studies continue in classrooms exposed to the elements, and often withinadequate lighting. Laboratories are in a terrible state of disrepair, with the gas,water, and electric systems needing complete replacement and overhaul in mostcases (Imenda and Chibesakunda 1986), but an increasing number of students takescience subjects, and performance in some of these subjects has begun to improve atthe senior secondary level.
The poor facilities do not deter prospective students. All told, attendance ratesare high. Notwithstanding the poverty of the schools and their bad state of repair,parents continue to make great sacrifices to ensure that their children receive aschool education. This speaks of a certain robustness in education, whichmaintains its appeal and performs its functions, however inflexibly andunsatisfactorily, no matter how adverse the physical conditions.
Imbalances in the Financing of Education
Enough has been said to show that there are serious structural imbalances in thefinancing of education, and that these became more pronounced during the years ofeconomic difficulty. These imbalances are at two principal levels: in theallocation of funds between educational subsectors and in the allocation of fundsbetween functions. Briefly, too much is devoted to the refined needs of too few at thehigher level and too little to the general needs of too many at the lower level. Inaddition, too much goes to personnel and tri student subsidies and too little topurposes that are central to education and that cannot be pursued without theinjection of resources.
Educational funds are not used according to the best economic considerations,because sr, large a proportion goes to the subsector that promises a large return to theindividual, but only a relatively small proportion goes to the subsector thatpi.omises the larg-:st return to society. Neither are they used in an equitable waybecause too large a share goes to areas where the rich are overrepresented and thepoor are underrepresented. Finally, they are not used in an efficient way becauseonly a small fraction used for inputs that lead to higher levels of student
62 Education in a Declining Economy: The Case of Zambia, 1975-85
achievement, while a large fraction is used for such noneducational functions asthe subsidy of personal needs.
These educational distortions have not come about by design, but by default.There was no deliberate decision to cut back allocations at the primary level infavor of the university or bursaries; no policy that stated that teachers' salarieswere to be allowed to consume so much of the budget; no conscious determinationthat so little was to be devoted to teaeaing materials. All of these undesirableconsequences occurred by way of unconscious drift, a drift that was virtuallyuncontrollable in a period of economic crisis.
Moreover, regardless of their concern about the imbalances, the education andfinance ministries did not begin with a blank slate, but had to face existingcommitments. Salary payments and bursary or boarding costs were regardea asinescapable; there could be no withdrawing from such commitments in
midstream. Hence, the ministries were left with very little scope in the form of
.ancommitted funds to initiate change or improvements in essential financialarrangements. Moreover, the commitments were so exigent that even when funds
were insufficient, salaries and boarding could muster resources, either byexceeding authorized budgetary limits or by having supplementary estimatespresented in Parliament on their behalf. Classic examples of this occurred in 1.982and 1985, when sums in excess of 10 percent of the authorized budget were spent inmeeting the salary costs of teachers. There is no record of anything comparablebeing allowed in order to provide the materials without which these teachers cannotoperate effectively.
Regrettably, the position is that at the time of budgetary submissions, rlinistriesmay make a case for retaining a serving oitik er in the reasonable certainty that thenecessary funds will be forthcoming. But when it becomes a question of seeking thefunds that will keep that officer effectively and properly employed, there is everylikelihood that they will not be made available. A Zambian secondary schoolheadmaster summed up the situation thus: "Trying to teach nowadays is liketrying to plough a field without a hoe." His words echoed those of Coombs: "A greatmany teachers (have been) forced to teach with one arm tied behind them, like afarmer wiLhout a hoe cr plow" (Coombs 1985, p. 123).
Another aspect of the same matter is that. within the public sector as a whole, thereis a constant preoccupation with keeping the system going, with no time left toreflect on the implications of keeping everything moving at so unsatisfactory alevel. Instead, the sector must rely on external sources for sporadic, ad 4oc reviewsof the system, and for an analysis of what the problems are and where the remediesmight lie. One of the major negative impacts of the economic decline has been theway its daily effects so preoccupied decisionmakers that they had little time left forcritical analysis of the purpose and operations of the system. This being so, themotivation and the capacity to generate the information and conduct the analysesand synthesis of information needed for policy formulation were lacking. Thus,the educational reform process that had begun late in 1974, and that had beencarried along on the crest of earlier economic prosperity and 1ri the expectation thatthe economic setbacks (A 1975 and 1976 would be shortlived, lost much of its vitalityafter 1977. This was not because of a shortage of educational experts but was due tothe fact that these experts were kept so busy in reacting to the day-to-day pressuresand shortages that they did not have the time to conduct a continuous ongoingevaluation of the structure, content, management, and financing of the educationsystem. It is one of the signs of educational recovery that such thinking is nowgoing on. If the economic crisis boxed education into a corner from which it could

Financing Education: Some Critical Issues 6.
be freed only by careful self-examination, hard thinking, and courageousdecisions, then it has had at least one positive outcome: it is forcing policymakers toestablish a clear order of priorities, to appreciate the implications of these priorities,and to see to their translatinn into practice.

Official Development Assistancefor Education
Zambia relies heavily on the flow of external aid in the form of loans, grants,
technical assistance (or technical cooperation), and commodity support. The aid
dependency ratio (volume of aid as a percentage of the GDP) has risensubstantially from 10.2 percent in 1977 to 24.9 percent in 1985. This dramaticincrease arose from an increase in the total amount of aid during a period when the
GDP was virtually stagnant. In relation to the population, the flow of aid has beenthe equivalent of some US$70 per capita for the years i980 to 1985, or 12 percent of the
average per capita GDP. Over 23 percent of the aid received by Zambia was in the
Corm of technical cooperation during 1980-85. The amount of technical cooperation
almost trebled between 1976 and 1979, but apart from an isolated peak in 1982, itsvalue has fallen off, even in current terms, since 1980. This drop represents areturn to the real levels of support received by Zambia in the mid-1970s (UNDP
1986).
Aid to Education
Almost all aid to the education sector is in the form of technical assistance,although the World Bank has also provided capital assistance of US$83 million
through five loans to education, beginning in 1969. The amount of technical
assistance for education has increased since 1976-78, although as a percentage of
the donors' total technical assistance to Zambia, it has decreased (table 7.1).
Table 7.1 shows the principal sources of tecl. ical assistance for education.Other bilateral donors of importance in the education field include Belgium,
Canada, Denmark, France, Ireland, Japan, and the USSR. Multilateral donors
include the EEC, the World Bank, the UNDP, and various other members of the
United Nations system. The multilateral donors have increased aid to education,
while the bilaterals have generally reduced the level of aid.As might be expected with technical assistance, most of the ..'d flow for education
tends to be used on personnel, principally for the university, secondary schools,
technical institutions, and teachers colleges (table 7.2). In some years, however,
grants received under certain bilateral arrangements, notably from Sweden and
Japan, for specific building projects raised the proportion for construction and
building.
64)

Official Development Assistance for Education 65
Table 7.1 Technical Assistance for Education, 1976-84
In US$ '000sAs percentage of Omar's totaltechnical assistance to Zambia
Znor 1976.78 1979.81 1982-84 1976-78 1979.81 1982-84
Finland 1,530 2,654 2,144 22 15 14Federal Republic of
Germany 141 0 nit. 4 0 ri.a.Netherlands 1,493 o 46 18 0 1Norway 6,489 1,182 14,784 59 6 31Sweden 4,083 4,092 10,281 15 9 18United Kingdom 5,167 27,698 15,179 37 44 64United States 1,000 o o 100 0 oOther bilateral donors 4,129 12,557 4,999 23 27 8
Total 23,482 48,194 47,403 26 10 21
UNDP 96 94 0 1 1 oOther U.N. organizations 25 1,138 567 7 5Other multilateral donors 502 1,305 2,125 5 6 26
Total 623 2,537 2,692 2 5 9
Total technical assiatance 24,105 50,721 50,095
n.a. = not availableless than 1 percent
Some: UNDP (1986, table A.10).
In recent years, technical assistance has shifted toward the provision ofmaterials and equipment. la 1977, such items were included only under the rubricof support for technical cooperation staff, but merited no independent mention oftheir own. By 1979, some donors were making specific provision for educationalmaterials without relation to staff provision. The number of donors doing so andthe amounts involved increased substantially up to 1984, but declined in 1985, whenequipment was vice again associated much more strongly with the provision ofstaff. Neverthei .2.g, since 1982, well over a quarter of technical cooperationdisbursements inc.uded a component for the supply of gxlucational equipment andmaterials.
Although there are annual fluctuations in the educational subsectors that receivetechnical assistance, the major recipients are the university and the secondaryPchools (table 7.2). The position of the secondewv s&ools would be clearer if thesources had provided figures for United ICngdom aid in 1977 and 1983, 3ince a verylarge proportion of this aid is in the form of secondary school teachers (for instance,in 1979 three-quarters of the disbursement of US$6.5 million wap for this purpose).The support for technical education shows a marked declin% while aid for primaryeducation has increased, although this latter is somewhat masked because of thelack of data for 1982 and 1985. The university has always had the largest number ofdonors, with almost all the bilateral agencies contributing in some way to itssupport.

66 Education in a Declining Economy: The Case of Zambia, 1975.85
Table 7.2 Technical Assistance to Education in Zambia by Function and Subsector,Selected Years(percent)
Function 1977 1979 1980 1982 19,93 1984 1985
Staffing 41.9 75.6 73.8 65.9 11.4 28.5 59.6Staffing & Equipment 18.3 14.1 22.9 22.1 17.6 14.9 23.5Equipment 0 0.7 0.6 7.6 11.7 14.2 2.5Training 0.3 6.0 2.4 2.6 3.1 4.8 4.8Research 0 0 0.3 0.4 0.2 0.1 0
Construction andbuilding 38.7 2.8 0.1 1.4 56.0 37.5 9.7
Other 0.8 0.7 0 0 0 0 0
Subsector 1977 1979 1980 1982 1983 1984 1985
University 27.1 14.2 22.1 22.0 67.9 56.7 23.5Technical education 31.1 10.7 12.7 22.8 3.1 2.7 8.7Teacher training 9.1 5.2 3.9 19.9 4.8 5.2 9.9Secondary schools 7.5 48.6 45.8 19.3 2.3 8.4 30.9
Primary schools 0 0 8.3 0 11.0 18.4 0.3Special education 0.1 0.4 0.4 3.7 2.6 2.6 1.9
Project Unit 20.3 2.8 0 0 4.2 0 9.3Headquarters 4.8 18.1 6.8 12.3 4.1 6.0 15.5
Notes: In the top panel, the source material did not always split staffing andequipment into separate items, hence the three rows covering these items. Datawere not available for 1978 and 1981. The Project Unit in the second panel is theZambia Educational Projects Implementation Unit discussed later in the chapter.
Source: UNDP Annual Report on Development Cooperation with Zambia (annualissues, 1977, 1979, 1980, 1982-85).
Airl and the Establishment of Prioritiesne evolution of the aid program for education in Zambia reflects both the
historical circumstances attending the development of education in general andthe country's economic circumstances. At the time of independence, trainedmanpower was in ver. short supply, and the formal education system wasseriously deficient, especially at the secondary and tertiary levels (chapter 2). Atthe same time, however, financial resources were relatively abundant.
Hence, the first need for assistance from abroad was for personnel to staff theeducational institutions and for training opportunities for Zambians in fieldswhera local facilities were inadequate or nonexistent. This need was met in largemeasure by technical assistance, which helped to staff the secondary schools andthe university and provided fellowships for study abroad. In the late 1960s, thestress shifted subtly to technical education, and this sector was developed during theearly 1970s with the help of capital and technical assistance from abroad. At the

Official Development Assistance for Education 67
same time, the development of secondary schools and the growth of the universityreceived attention, principally with the help of World Batik credits. The staffing ofthe university, of the secondary schools, and the teacher training colleges, as wellas back-up services in various professional sectors of the Ministry of Education,continued to absorb a considerable amount of the aid available, but for a periodmuch of it was also devoted to technical education.
With the drying up of local resources in the mid-1970s, the government had torely more on external donors to finance capital projects in ecLcation. While someaid was forthc.ming for this purpose, the major donors were more interested in themaintenance and rehabilitation of existing facilities than in the provision of newones that the economy would be hard pressed to run and maintain. The tightfinancial position of recent years has led to increased requests to donor agencies toundevvr'te what are essentially the recurrent costs of the education system: partlyt.hi%)uali the provision of funded staff; partly through the provision of equipment,furnisLings, materials, transport, and (most recently) security services to supportthe avtivities of such staff; and partly through the provision of similar items tosupport the activities of local personnel. As a result, the aid program to educationtoday is more diverse than in the past, and at the same time it is more complex toadminister bec ause of the increasing number of donors and an increase in thenumber an': type of components involved.
This diversification of aid creates two major problems: how to establishpriorities for technical cooperation undertakings, and how to coordinate andmanage the total aid program for education. One of the Ministry of Education'smost important and difficult tasks is establishing priorities and then taking theappropriate action. Two influences, both a result of the financial crisis, havecontributed to the difficulty of this task. First, the ministry has not been able tomaintain a strong planning and research unit that can analyze the situation inZambia and produce imaginative proposals. The problem is not a lack of localmanpower capable of undertaking such tasks, bat a lack of finances that has notallowed the ministry to preserve and develop its own research and investigativecapacities. In this, education contrasts unfavorably with agriculture, which has awell-developed research wing. Thus, the minU,ry is often able to do little morethan react to donors' proposals. It does not have the capacity to scrutinize theseproposals adequately or to come up with well-researched projects of its own.According to King:
So long as the local evaluation of education and education aid is reactive toother people's analyses of the problems, the dialogue will continue to be aboutsomeone else's priorities for the country.. . . there are few donors who wouldnot welcome the strengthening of the recipient capacity to set priorities, or toargue powerfully for counterprklities to those proposed by donors `.1.ing1986, p. 133).
Second is the tendency, when virtually all available resources are tied toinescapable salary payments, to accord a higher priority than they deserve toproposals that seem likely to attract additional funds, particularly if these willsupport ongoing activities. This leads to the aberrant situation where a ministryespouses a donor's priorities as its priorities. In Zambia, as in other hard-pressedcountries, items are entered in national development plans because thegovernment believes that donors will consider them favorably and not because oftheir intrinsic merit. Also, offers of aid are rarely declined on the grounds thatthey do not accord with national priorities.

68 Education in a Declining Economy: The Case of Zambia, 1975.85
The Management of Aid to Education
The number of donors and aided projects has become so large that managingthem strains the Ministry of Education's already limited resources. Differentdonors have their own information needs. Some may collect it themselves, others
may seek it directly from the ministry, but in eac case, the ministry, usually its
planning section, will be pressured to provide data. The poor information base
makes this a difficult and time consuming task.Managing actual projects has its own problems. The number of projects has
increased, but because of problems of communication, transport, supplies, and the
general dearth of local resources, they have become more difficult to manage. The
growth of economic and budgetary problems in the donor countries has,understandably, meant a greater emphasis on accountability for resources used,
and hence on detailed project preparation, evaluation, and reporting. Inconsequence, managing aid activities requires more time, personnel, expertise,
and back-up resources, and greater understanding of donor agencies'characteristics, educational philosophy, and requirements. All of this is difficult at
any time, but almost impossible in a period of economic stringency, when the
pressure is to reduce personnel and material resources, not to increase them.Some progress has been made ir that the Ministry of Higher Education and the
university have each established separate offices to deal with aid matters. Within
the Ministry of General Education and Culture, the Zambia Educational ProjectsImplementation Unit now manages and executes projects funded by the World
Bank and the African Development Bank. This unit, which depends heavily on
technical cooperatir . from Norway for its architectural, engineering, andprofessional staff, is also concerned with the rehabilitation and maintenance of the
secondary schools. But it is the hard-pressed planning section within the Ministry
of General Education ..ind Culture that must coordinate, manage, and provideinformation for all the other aid projects. This is such a burden that the section has
little capacity left to devote to educational planning.burden on the planning section would Ilave been eased had the Zambian
ernment established a single office to coordinate all forms of educational aid
P I to be responsible for dealing with all the donor agencies, meeting theirinformation requirements, and conducting evaluations. The agencies too could
have eased the burden by consolidating or coordinating their requirements,approaches, information needs, and reporting procedures. The WindsorConference of 1984, which major bilateral and multilateral donor agenciesattended, recognized the problem created for officials who are "called upon toproduce virtually the same voluminous sets of information for different agencies,
though in dii.erent formats and with different emphases," and believed that thecase for proposing more harmonization of data requirements and standardizationof documentation and reporting procedures was strong (ODA-ULIE 1986, p. 61).
The belief is emerging that external agencies could more usefully direct theiraid resources away from traditional projects and toward broader program supportthat would strengthen a country's capacity on a wide front through developing its
infrastructure and insautional capabilities (Coombs 1985, p. 308). However, the
development of aid programs in Zambia in response to the economic crisis may be
placing such burdens on the limitea number of staff available that it is obstructing
the emergence within the ministry of the capacity that is so desirable.

Official Development Assistance for Education 69
The Impact of Aid to Education
What has the input of aid resources accomplished for education in Zambia andfor the people of the country? What has it failed to accomplish? Where, if anywhere,has it hindered the achievement of desirable goals? These questions can only beansw,.,-,,d within a sufficiently long time fra;aework and bearing in mind thediff . .., of evaluating the impact of aid and other projects. In particular:
There is still no satisfactory methodology for assessing the impact of aid onthe economy of an entire country, or even an entire sector. ... (and) there is aneed for ways of assessing the impact of forms of aid which do not yield adiscrete, measurable return, especially technical cooperation (OECD 1985, p.259).
What follows, therefore, is largely an impressionistic evaluation of the impact ofdevelopment assistance on Zambia's education sector since independence.
Twenty years ago, Zambia had a tiny secondary school system, a handful ofcolleges that prepared low-level primary school teachers, a nascent university, notraining facilities for secondary school teachers, and a very rudimentarytechnical training subsector. All these areas have been considerably developed inthe years since, and Zambia has met its need for high-level manpower in manycritical areas. In addition, much development has taken place in the design ofcurricula and teaching materials, in the administration and processing ofexaminations, and in the production of educational books and literature.
During a period of phenomenally rapid expansion, the secondary schools, for alltheir deficiencies, were reasonably well staffed, espec.ally in the crucial areas ofEnglish, mathematics, and science. A'. the univ irsity, courses for trainingprofessionals were strongly supported even dwing the years of financialdifficulty. Moreover, a highly desirable continuity was established in certaincritically important areas where technical coopera.ion staff had been in pla 'e formany years. In addition, through the support of donors, many Zambians receivedtraining abroad in a variety of disciplines. Many of these Zambians have now, inthe best traditions of aid relationships, replaced their former mentors or have takenover the rosponsibilities of expatriates. They are working in physical structuresprovided in every educat:on sector by technical assistance and capital aid fromabroad, and for many of their activities use equipment and apparatus provided bydonor agencies. Personnel and students in schools and institutions throughout thecountry use supplies and materials that have come as part of technical cooperationarrangements. Education has reached out, more and more, to the rural poor, toshanty town dwellers, to girls, and to the handicapped.
It would not be true to say that none of this could have been accomplished in theabsence of aid, but it would be equally incorrect not to recognize the significantcontribution that aid has made to the realization of Zambia's aspirations to provideall its children with a good education. Zambia has not yet attained this ultimategoal, and the pressure of current financial problems makes it seem still veryremote, but with the help of intemational donor agencies, Zambia has madeprogress. Writing of the altered climate of educatiolal cooperation on a worldwidebasis, Coombs spoke of the decline of the "aniimting spirit of hope, enthusiasm,adventure and friendship that had marked the ee.rlier period" (1985, p. 287). It is notso in Zambia. The international cooperation in education has accomplished a greatdeal and appears set to accomplish even more.

70 Education in a Declining Evmomy: The Case of Zambia, 1975.85
Criticisms of Aid to Education
criticisms may also be leveled at various aspects of aid, whether of aparticular project or the very nature of the cooperative relationship. Criticisms ofthe latter variety (UNDP 1986, p. 40) fall into two categories: those that argue thattechnical assistance of itself promotes the dependency that it is meant to reduce,and those that argue that technical assistance is inherently in Ifective. Thecriticisms of aid proffered to Zambia can be considered in terms of the dependencythat it unintentionally fosters, the separation between aided projects and localstructures, and the economic efficiency of projects.
Aid and Dependency in EducationPerhaps the most serious criticism that can be leveled against the technical
assistance available to education in Zambia is that it has unwittingly reinforcedthe import mentality. Ironically the economy's import-dependent structure ismirrored in a strongly import-dominated approach to education. To be good, theimplied argument goes, an educational input should have an element importedfrom abroad, whether that input is a teacher, a book, an item of equipment, aqualification, a plan of the school day, or a curriculum. This attitude had led tohigher prestige for schools and d.dartments with expatriate members of staff; tohigher value being placed on foreign rather than local qualifications; to undueconcern with international standards (which mean in effect the standards of theformer colonial authorities); to heavy investment in education abroad whilesimilar financial inputs or foreign exchange are not available to meet pressingneeds at home; and to a continued hankering for the reintroduction of sixth formstudies.
Technical cooperation may have hindered progress toward educational self-reliance in two areas (UNDP 1986): the relatively easy availability of expatriateteachers of mathematics and science may have hindered the development ofprograms for the upgrading of lower level Zambian teachers of these subjects, andthe availability of overseas scholarships may have lessened the urgency to developupgrading programs for mid-level technical personnel.
Another area is the sluggish development of postgraduate programs at theuniversity. The university started operations at a very high level, with apostgraduate certificate in education that was originally awarded via arelationship with the University of London, but after a short time became theuniversity's own award. After this program closed in 1972 a decline occurred inpostgraduate work, to the extent that there were fewer postgraduate awards in thewhole period 1975-87 than in the first five years of the university's existence. Thisdecline was largely due to the easy access to postgraduate studies in universities inthe aid-providing countries and to the departure of the cream of potential candidatesto pursue these studies. Major efforts will be needed to remedy the effects of years ofreglect of postgraduate work at the university, among them a clear governmentpolicy to support such studies locally rather than abroad. The university will needto channel more of its limited resources in this direction, possibly by tightercontrols on the numbers of undergraduates in the humanities and social sciences.For their part, the donor agencies will need to recognize that their resources can beused better if they tie the training components to in-country programs in all but themost exceptional cases.

Official Development Assistance for Education 71
Equal determination will be needed for training at other levels. At theuniversity, pressure would likely have been exerted to diversify programs in theSchool of Education away from the single-minded concentration on trainingsecondary school teachers if access to a variety of pr,:zrams abroad had not been soeasy. Obviously everything could not have been provided in Lusaka, but a morediversified program aimed at catering to the varied needs of a multifacetedministry could have been set in place. Returning to the earlier observation on theeasy availability of expateiate mathematics and science teachers, this situationprobably diverted attention from the sad fact that the university actuallyretrainedand continues to do soa substantial number of science teachers in thehumanities because they did not meet the formal entry requirements for scienceprograms, including the B.Sc. with Education. It may be that such anomalies areonly perceived with hindsight, but once perceived they should be remedied.
Separation of Aided Projects from Local Structures
A further area where projects, educational and other, may work againstdevelopment is in their relative isolation from the harsh economic realities intowhich they are supposedly inserted.
To ensure a high quality project . . . there is a temptation to insulate the aidproject against failure by a series of coordinated inputs, including very closesupervision, project-related training and often some kind of special status,through interministerial committees, incentives for participating schools andSO on (King 1986, P. 124).
King's concern was that projects of this nature were doomed to collapse whenexternal support was withdrawn or when they were translated into the wider contextof educational endeavor. The concern here is that by becoming islands ofperfection in a sea of mediocrity, such isolated projects do not have thedevelopmental impact they are capable of, do not prove that they can address the realsituation in the institution or country, promote a continued need for the inflow ofaid, condition participants to believe that local structures and administration areirrelevant, and may generate resentment and hostility among colleagues notparticipating in the project.
The smooth integration of a project activity into the life of an institution is a slowand difficult process. This process may be made more difficult by the nature ofspecific projects, whose team managers' or leaders' loyalties may be dividedbetween the institution where they are based, the agency that is providing thefunding, and possibly their home institution. The special statuf of the project andits members; their privileged status and ease of access to scarce supplies, transport,accommodation, and services; and their direct access to high-leveldecisionmakers all combine to make the project a foreign body within the host. Itthea remains a matter of concern and uncertainty whether the host will reject thisforeign body or be strengthened by assimilating it.
More clear-cut local involvement in the choice, design, and management ofprojects would help to solve some of these difficulties, as would a decision to placethe project under local administrative control, with severely limited access eitherto senior local level administrators or to agency sources. In the final analysis,much depends on the quality of the staff themselves. If others perceive them to bewell motivated, suitably qualified, competent, and somewhat more productive thantheir nonproject colleagues, their involvement will bring lasting returns.

72 Education in a Declining Economy: The Case of Zambia, 1975.85
Problems of a different kind attend the counterpart arrangement that is often anintegral component of educational and other projects. (A counterpart arrangementis when a local person is designated to understudy a foreign technical cooperantwith a view to assuming eventual responsibility for the cooperant's functions.) Intheir survey of technical cooperation personnel and their Zambian counterparts,Hopkins and Siamwiza (1987) concluded that the current expert-counterpart systemis a viable method for the transfer of know-how and technology, but that it suffersfrom a lack of proper assessment of the training requirements of counterparts andthe training abilities of experts. The transfer of skills and knowledge fromvisiting expert to local counterpart has always been viewed as an importantcomponent of the technical cooperation arrangement (OECD 1985, p. 189). YetHopkins and Siamwiza juaged that this was actually the weakest element. Themajority of expatriate respondents in their sample spent less than 10 percent of theirtime on any form of counterpart training, and a significantly large number didnot attend to this at all.
There is probably less room in an actual classroom teaching situation than inother kinds of occupation for counterpart training. To a large extent technicalcooperants or supplemented individuals are filling vacancies until suitablyqualified and experienced local staff can replace them, and generally in theeducational world, these replacements will need academic and professionalqualifications through specialized preservice training. Hence, counterparttraining or transfer of technology may have less place in educational aid than inother areas. Nevertheless, if more were expected of the experts than that they shouldmerely fill vacant posts, then their local colleagues might be less aggrieved at theextreme differences in salaries. For this kind of institution building approach to beeffective, all concerned must have clear and attainable expectations and progresstoward meeting them must be monitored.
The Economic Efficiency of Aid
Only a very small percentage of the financial commitment in technicalcooperation projects actually reaches Zambia. This is particularly true of educationprojects. Though writing in a somewhat different context. Coombs put the problemwell: "The monetary value of educational assistance often looks substantiallylarger from the vantage point of the sending country and agency than from that ofthe recipient" (Coombs 1985, p. 291).
Foreign experts are extremely expensive. No firm figures are available for thecurrent costs, but the UNDP (1985) Report on Development Cooperation with Zambiasuggests that the cost of a fully-funded expert for an aid project at that time wasUS$40,000 to US$80,000 per year, while a supplemented post entailed a commitmentof some US$25,000. We can look at these costs in various ways. One is theiropportunity cost, the inputs these funds might have purchased if they had not beencommitted to this particular item of technical cooperation. The aid negotiationprocess may fail to examine sufficiently closely the possibility of putting funds toother uses. Some donors may not allow the possibility of tradeoffs, but even whenthey do not, the cost of experts should be clear to all parties.
From another perspective, aid may not give good value for money, since thelarge sums spent on technical cooperation could be used more cost-effectivelywithin Zambia. The current ceiling for a professor's salary at the University ofZambia is K34,500 per year, or rather less than US$4,500. This is low by standardselsewhere and is insufficient to retain the services of some of the best Zambian

Official Development Assistance for Edwxition 73
staff. It is also too low to attract good candidates from abroad, though some wouldcome if the university could top up its salaries with more attractive inducements. Acase could be made that aid resources would be used more effectively if some ofthem were pli.s.rAd directly into the government's hands to finance the recruitmentof staff from abroad or to enable the country to retain its own staff. Likewise,fellowships abroad cost in the region of US$20-25 a day in living and maintenancecosts, without counting academic fees and transportation costs. Since local costswould be about one-tenth of these, a strong case can be made for a greater proportionof aid funds to be used for in-country training.
Future Priorities for Aid to EducationThis review is concerned principally with the past performance of Zambia's
education sector. Nevertheless, concluding this chapter with some reflections onareas to which external aid could most usefully be targeted during the comingyears seems appropriate. Five are singled out for attention: primary education,girls' education, mathematics and science, higher education, and the research andinformation base within the education ministries.
Aid for Primary EducationMost experts agree that primary education, or more broadly speaking, basic
education in its widast sense, should have a very high priority in the educationsector. Although there has been no official government reaction to the EducationalReform Implementation Project's recommendation (Kelly and others 1986) that allother educational objectives must remain subordinate to the quantitative andqualitative development of the primary schools, this recommendation has appearedin official government publications and has been used as a guiding principle attraining seminars for senior education officials. The donor agencies generallyalso accept this priority, which has been given succinct expression by Sweden:
The Swedish contribution within the Education Sector Support Programmeshould continue to be used for improving educational standards, particularlyas regards primary education and the educational needs of the ruralpopulation (SIDA-GRZ 1983, p. 1).
Nevertheless, "most external agencies (have) steered clear of elementaryeducation (because) they regarded it as a bottomless pit, best left to the developingcountries to deal with on their own...and because these agencies and many leadersin developing countries believed that the greatest immediate need was to strengthenthe supply of high-level manpower" (Coombs 1985, p. 289). The result is thatexternal agencies are minimally involved in primary education, especially in therural areas (King 1986, p. 125). However, these agencies are beginning to recognizethat primary education should be given higher priority (Cole lough, Lewin, andOxenham 1985). This could be accelerated in Zambia if clear operational prioritiesexisted for the way aid could be directed to this sector. The following areas deservespecial attention:
The direct provision of educational materials and stimulation of localproduction, with particular emphasis on the primary school and primaryteacher training levels. The activities of FINNIDA, SIDA, the BritishCouncil, and the UNDP are steps in the right direction, but these moves need tobe supplemented by initiatives from other agencies; local industry should be

4 Education in a Declining Economy: The Case of Zambia, 1975-85
involved, and local communities must systematically generate funds tovcntribute toward the cost of such materials. Such effo.ts must be coordinatedaild the extent of existing resources and the nature of the shortfalls must bethuroughly assessed (see UNDP 1986, P. 144).
Support for the training of more and better primary school teachers. Theproduction of more primary teachers would require capital investment toexpand existing colleges and develop new ones. Improving the quality of thenewly-trained teacher would require supporting the development of teachingmaterials; promoting the professional development of college staff; andhelping the colleges to reorganize their teaching methodology and generalcurriculum so that they foster more flexible teaching methods designed tostimulate more self-reliant, investigative, and creative learning skills.Efforts to boog the, morale of teachers in thc field, principally by supportingtheir efforts at professional advancement, ensuring that they have what theyneed for the proper dis.-Ilarge of their teaching duties, and enabling ministrypersonnel to Live them the supervisory, administrative, and financialsupport they require.Strengthening he professional leadership and management abilities ofprimary school heads, through local and national training programs,various opportunities for professional development, stimulation ofprofessional interaction (for example, via a head teachers' newsletter),adequate supervision and support, and enhancement of career opportunitiesand of professional attitude to primary education as a career.The reform of examinations, and thus of the curriculum, so that teaching atthe primary level will foster the necessary skills ard knowledge that belongto this as a terminal level of formal education. External aid could help toredesign the contcnt and method of examinations so that they assess the skillsand knowledge that are likely to be useful to pupils who must terminate theireducation at the end of primary school; to establish a comprehensive feedbacksystem that wou'.1 provide schools with information on their strengths andweaknesses; and to develop attainment tests in various areas of the primaryschool curriculum (possibly through participation in the activities of theInternational Association for the Evaluation of Zducational Achievement).
The purpose of much of the foregoing would be to enable schools to do what theyare supposed to be doing better and to make what they are doing more worthwhile interms of the primary school-leaver's subsequent life and activities. Developmentsof the kind proposed would directly affect the formal school system, but thegovernment should also "consider the potential for developing new forms ofeducation. These may involve new types of formal schooling in terms of theirinstitutional structures, or other types better described as 'informal' for their lack ofattributes of the formal mode of schooling" (Clarke and Kaluba 1987, p. 134).
Informal education is probably more likely to be a bottomless pit than primaryschooling, but this is no reason for donor agencies to eschew it. Clarke and Kaluba(1987) speak about programs that emphasize meeting the felt educational needs ofdisadvantaged members of the community, such as primary school-leavers or i,heheads of female-headed households. Such programs might address areas such asfarm management, household bookkeeping, income-generating skills, obtainingcredit, cooperative organization, and so forth. Support to local efforts to devise orimplement such programs would be well wortl -hile and would fall within thepriority accorded to basic education in its widest sense. Since such efforts

Official Development Assistance for Education 75
frequently originate with voluntary bodies and religious organizations, donoragencies should be prepared to channel some of their aid through such bodies. TheJune 1986 meeting between the Development Assistance Committee of the OECDand the nongovernmental organizations has paved the way for closer collaborationand involvement of this sort (OECD 1987, p. 21).
Aid for the Education of GirlsA second broad area that should be a priority for donor response is the education
of girls and women. Girls are not participating in the education eystem,particularly at the higher levels, in the numbers they should; those who doparticipate are not performing as they should; and the general educational level ofwomen is considerably below that of men. Positive interventions are needed torectify this situation, but what form these interventions should take is not yet clear.External aid could help by supporting investigations to discover the real economic,social, and institutional factors that undei /ie the situation. The advancement ofgirls' education generally needs to be given more attention when designingeducational projects.
Aid for Mathematics and Science EducationThe aid community has responded to what is undoubtedly a crisis in
mathematics and science education by a number of initiatives:the United Nations Financing System for Science and Technology forDevelopment (UNFSSTD) by supporting the preuniversity science programand the upgrading program at the university for secondary school teachers;FINNIDA by helping to produce Zambian textbooks in mathematics andscience;the EEC by providing special consultants in the Curriculum DevelopmentCentre and by instituting an ambitious program for upgrading science antimathematics teachers;the United Kingdom by distributing mathematics ane science textbooks tosenior secondary schlols and by its policy of devoting an increasingproportion of its technical cooperation resources to providing secondaryschool teachers of mathematics and science;UNESCO by its project to establish a production center in Lusaka for scienceand mathematics equipment; the Canadian International DevelopmentAgency (CIDA) through its project to improve mathematics and scienceteaching in the primary schools.
All of these initietives are welcome. However, the danger is that a somewhatpiecemeal approach could result in a duplication of effort and in omitting someimportant areas. In addition, all the efforts except CIDA's are directed toward theaecondary level where, in one sense, they are remedial. The difficulties withmathematics and science education have long roots and strech back into primaryschools, Rnd thence into the tee.cher training colleges. Radical improvements ztreneeded in the staffing of these colleges and in the methodologies that they follow ifsignificant improvements are to be effected. External aid could well support. studieson the impact of the current teaching methodology on children's learning ofmathematics and science. Such studies could establish whether the language of

76 Education in a Declining Economy: The Case of Zambia, 1975 95
instruction is in any way related to the difficulty children have in assimilatingmathemat.ical concepts and following computational procedures. Aid could alsoprovide more extensively for the staff development needs of the mathematics andscience instructors in the teacher training colleges.
At the secondar, level, programs such as that of the United Kingdom, whichinvolve staff placement in secondary schools throughout the country, mightconsider adding a training function to such poets. This would require theincumbents to participate in workshops to improve the skills of lower levelsecondary school teachers of mathematics and science or of primary teachers fromlocal schools. External assistance could also support feasibility studies intodeveloping certain secondary schools in each region into specialized scienceeducation schools and might finance such a transformation. A study is alsorequired into the need for a special college offering a one-year intensive programin mathematics and science for school-leavers who fail marginally to qualify foradmission to science and technological programs at the tertiary level. Theobjective is to help Zambia raise its standards in science and mathematicseducation, and thereby achieve that bias toward science and technology educationthat the country has set out as one of the main aims of educational development forthe decade 1985-95 (United National Independence Party 1985).
Aid for Higher EducationIn higher education the needs are to rationalize the financing of the system, to
enable it to develop its research functions, ann to foster the development ofpostgraduate work. The aid community has considerable scope for promoting theseaims by making maximum use of in-country training for its fellowship awardsand by turning in ihe first instance to Zambian personnel for its research andconsultancy needs. However, such activities would have to be coordinated so thatthe research bodies could integrate the agencies' needs Lao their own programswithout generating a patchwork of ad hoc projects undertaken in response toexternal requests.
Rationalizing the financing of the higher education system impliestransferring some of the costs to the users. It also implies that the institutionsshould be able to generate revenues through their own activities, thereby redu Angtheir almost total dependence on the government. Such moves need careful st.itly.There are lessons to be learned from institutions abroad that raise a l irgeproportion of their own revenues, whether through fees or commercial activities.External assistance might help here by supporting study visits and facilitatingfeasibility studies.
Aid for the Development of a Research and Information BaseGood, comprehensive educational information is It a premium in Zambia.
Despite the existence of an Educational Research Bureau at the university and of aDevelopment and Planning Unit at the Ministry of General Education andCulture, information about the pedagogical, social, economic, and statisticalaspects of the education system is sparse. Much of it is out of date, little iscoordinated, and most is scattered among various "b -dies and agencies. Far-reaching decisions are taken on insufficient evidence, and sometimes researchinto a problem is undertaken after the decision has been made, partly to justify it.

Official Deuelopment Assistance for Education 77
Under these conditions, the groundwork cannot be laid for negotiating with the aidagencies or for developing constructive educational policies.
The problem is not the lack of pe,.bonnel, but that in a time of financialdifficulties, the education ministries' research, investigative, and informationneeds are considered somewhat of a luxury, or at best as needs that a number ofuncoordinated units can respond to. This dissipation of functions leads to faultydecisionmaking, communication breakdowns and bottlenecks, and consequentlyto inefficiency. This situation also holds true for the university and itsdepartments. External aid could help the planning units in the educationministries and at the university devise and maintain the data base required forday to day management and forward planning. The Swedish InternationalDevelopment Authority (SIDA) is already doing this to some extent at the Ministryof General Education and Culture, but assistance targeted more specifically towardthe development of the institution's own 'research and planning culture" (King1986, p. 133) is still needed. Coombs emphasized this point:
The prime candidate in the developing world of those things that promiseh;gh returns at little extra cost is improvement in statistical reporting andanalytical systems, so that ministries of education and political lenders and thegeneral public can actually know the nature and extent of existing inequalitiesand whether they are being ameliorated. This is also ... a feasible andproductive matter in which external agencies can be of practical help (Coombs1985, p. 223).

8Nongovernment Resources for
Financing Education
With the decline in resources available from the central government, recourseto other sources for the funds and personnel needed for all aspects of the educationsystem has proved increasingly necessary. This takes various forms (figure 5.1):
resorting to parents;asking communities to provide their own schools;introducing schemes whereby educational institutions can generate theirown funds;encouraging entrepreneurs and others to develop private schools, especially atthose levels that the government finds most expensive;appealing to voluntary agencies to participate more in the establishment andmanagement of schools;turning increasingly to official development assistance for technicalcooperation and general budgetary support (see chapter 7).
Zambia's recourse to these sources is not new. What is new is the extent of thereliance that is being placed on them and the way policy and administration haveadapted to promote such increased reliance.
Parental PaymentsParents have always been required to pay an annual school fund fee of K1 for
each child at the primary level and K2 at the secondary. This fund is intended tosupport some of the schools' extracurricular activities. Given the purchasing powerof money and the availability of goods in 1966, when the rate was established, thefund was of some benefit to schools. ToCay, its purchasing power is so low and itemsare in such short supply that the fund's contribution is minimal. To compensate forthe loss, parents are required to contribute to several other funds, for example, flindsdetermined by the parent teacher association to meet maintenance or developmentcosts, transport funds, and entertainment funds. Moreover, since the 1970s theyhave been required to pay examination fees for the school certificate exam...nation.
In principle, free education includes the provision of the necessary learningmaterials. Today, because of the government's lack of funds, parents mustthemselves provide their children with textbooks, exercise books, and writing
78

Nongovernment Resources for Financing Education 79
implements. The necessary items are not always available in retail outlets, buteven when they are available, the cost may be high compared to parents' incomes. Asurvey conducted in 1985 showed that the parents of primary school children werepaying an average of K20 a year for learning materials and K12 for school fundswhile at the secondary level they were paying K54 for learning materials and K41for school funds (Kelly and others 1986, table 32).
In 1985, per capita income was K737, but sir.le 60 percent of the poorest have only19 percent of the income (ILO/JASPA 1981), the per capita income of most householdswas considerably less than K250; their actual cash income may not have been morethan a few kwacha a year. Hence, paying for school items is a considerable burdenfor most families, especially when they have to pay for more than one child. Butschool education is valued so highly that most parents are prepared to make greatfinancial sacrifices by paying for essential learning materials. The governmenthas welcomed this positive attitude of parents (Ministry of Education 1977), but ithas not recognized that many families are so destitute that they cannot afford topurchase school items. Households in shanty townships and undeveloped ruralareas are the worst affected, but apart from help from Sweden and Finland towardexercise books and textbooks nothing has been done to relieve them of this financialburden. The government's desire to hand over some educational costs to theconsumer is legitimate, but the government must ensure that its decisions do notimpose such a burden on the poorer members of society that they would respond bynot sending their children to school.
The most substantial move toward transferring educational costs to the privatesector was taken in 1986 with the reintroduction of boarding fees. Theannouncement of this decision was received with much concerr and, in certainquarters, with open and at times violent hostility. At first the fee payable bysecondary school boarders was set at K504 a year, but in response to public pressure,the government reduced this to K100 a term. The Ministry of Education establishedthis fee as a flat rate for all schools in the ountry, irrespective of distance fromsource of supply or local availability of essential fooiatuffs. Even at the relativelyhigh level at which it was established, the fee was insufficient to cover all boardingcosts so the government had to continue subsidizing boarding costs in secondaryschools. In addition, the government established a bursary scheme for promisingstudents whose families could not afford to pay the fees. Despite the opposition at thetime of its announcement, the boarding fee decision has been implemented,apparently without inflicting hardship. The logical sequel to this move is thetransfer of university students' bursary costs through a 'Wan or similar scheme, aprocess that has already been put in motion.
Self-Help ActivitiesLocal communities have always been 1 tquired to make at least some
contribution to the infrastructure ft.: the mot basic level of education. Their effortssupplemented government resources. But. wi,h the worsening economic situation,the government's contribution to self-help schemes began to decline, and endedwith the adoption of the policy that: "Each self-help project should be theresponsibility of the community, through to cr,mpletion" (Ministry of Education1977, p. 83). The Third National Development Plan incorporated the same ideawhen it stated that: "Self-help educational projects by communities will beencouraged and once initiated such projects will be executed to completion" (GRZ1979, p. 343).

80 aucation in a Declining Economy: The Case of Zambia, 1978.85
At first self-help provision was limited to the primary level, but restrictions onthe development of additional facilities for secondary education, coupled with adesire to maximize the use of facilities and to provide nine years of basic educationfor all, changed this. At the beginning of the 1980s, self-help was used to convertunused boarding facilities at primary schools into classrooms for grades 8 and 9and to construct additional classrooms for the same purpose. The result was thatself-help basic education schools mushroomed, from a total of 7 in 1982 to 122 byearly 1987.
At the time the government announces secondary selection results, it informsthe public of the number of additional secondary places that have been created ineach region on a self-help basis. This intensifies the pret sure to uneertake evenmore of these ventures. Some capitr: provision continues to be made for theimprovement of prima..y schools, but the construction of additional facilities at theprimary level is now more the responsibility of the local community than it was adecade ago.
Production ActivitiesWhen productive work was introduced into the curricula of all educational
institutions 12 years ago, the government first proposed that the educational andeconomic objectives should be of equal importance. However, resounding publicopposition expressed during the national debate on the educational reforms causedthe government to reconsider and declare edvcational objectives to be paramount,but in the event, the economic objective of raising revenues has prevailed over theeducational.
Almost every public utterance on this matter and every account that a schoolgives of its activities judges the success of production work by the volume of goodsproduced or amount of money made. However, taking account of the amount ofteacher and pupil time that goes into production activities, the financial return isvery sMall. Thus, as presently organized, production activities are a veryinefficient way of raising revenue'. There appears to be a growing awareness ofthis. At the same time, interest is growing in the institutions where production hasbeen financially successful, while there is a groundswell of opinion that there is aneed to integrate production into the school curriculum more harmoniously, andpossibly even to organize the curriculum around production (Shanks 1983).
The first decade has clearly been one of trial and error, with too much relianceon participants' goodwill and not enough analysis of the pedagogic andorganizational implications of including production in the curriculum, as well asinsufficient definition of the inputs needed if production is to make a worthwhilefinancial contribution. Major changes will be needed to bring this about, but thesemay have to be so radical that they would require socially and educationallyunacceptable transformations of all that goes on in schools. In the absence of suchchanges, educational institutions will flounder along, generously but blindlytrying to implement directives. Faced with such a dilemma, the government shouldquestion the whole rationale for production as a curriculum activity and considerabandoning it entirely.
Private SchoolsAt the time of independence, private schools in Zambia fell into two categories:
institutions catering for the needs of expatriate children and religious institutions

Nongovernment Resources for Financing Education 81
that provided primary and secondary education for future priasts. But as findingplaces in public or aided schools became more difficult, and as concern began toincrease about the standards in such schools, parents who could afford to do sobegan to enroll their children in private schools, most of which were of very highquality at that time.
During the educational reform discussions in 1975-76, there was a strong moveon socialist grounds to control private schools more tightly, to restrict children'saccess, and to convert whatever remained of the private education system forZambians into a system of schools run as cooperatives. The public's negativereaction led to the much more tolerant position that private schools would bepermitted if they satisfied the requirements for registration and operated inaccordance with the provisions of the law (Ministry of Education 1977). Encouragedby this attitude, the establishment of private schools grew rapidly. They also beganto receive much attention in the media, which created the impression that theprivate school system was large and that it contained the potential for solvingmany of Zambia's educational ills.
In reality, private schools make only a small contribution to educationalprovision. The number of registered schools grew from 20 primary schools and 9secondary schools in 1975 to 33 primary schools and 39 secondary schools in 1985(table 8.1). In 1975, private schools accounted for just 0.6 percent of primary schoolenrollment and 2.0 percent of secondary enrollment. By 1984, their share was still0.6 percent at the primary level, but at the secondary level, had risen to 7.4percent. Note that these figures are only for registered private schools. Severalschools operate, especially at the secondary level, that for various reasons, oftenrelated to the inadequacy of facilities, have not been "registered."
We can make a number of observations about private education in Zambia.
The number of private schools has increased since 1980.Private schools vary widely in quality, from first class to deplorable.However, private secondary schools have a smaller average size, a sowerpupil to teacher ratio, and a larger proportion of graduate teachers than eithergovernment or aided schools.Private schools appear to be making their greatest contribution, in terms ofnumbers, at the secondary level. The government is under the greatestpressure to expand the transition from primary to secondary school. When itfails to do so acceptably, people turn to private schools. The entry to many ofthese schools, especially the smaller and more commercial establishments,does not depend on children's performance in the selection examination, butonly on parents' ability to pay the fees. Within the secondary private schools,the proportion of girls is higher (at 43 percent) than in other secondaryschools. Parents appear to be turning to private schools to obtain for theirdaughters the opportunities that are not available in the government or aidedschools.Because they do not provide boarding facilities and depend for their survivalon prompt cash payments, private schools are found only in thickly populated,economically healthy areas. Thus in urban areas, they draw off some pupilsfor which the government would otherwise have to provide an education, andin this way play a role in reducing t ae pressure for admission to governmentschools. Because of this reduced pre ;sure poorer students in urban areas havea marginally better chance of being admitted to secondary schools. Critics donot always recognize that private schools make this indirect contribution to

Table 8.1 Number of Private Schools, 1975-85 flP,Level 1975 1976 1977 1978 1979 1980 1981 1992 1983 1984
Primary SchoolsNum ber 20 24 18 18 16 18 23 23 27 29Enrollment
Boys 2,529 2,793 2,575 2,533 2,086 2,659 3,276 3,319 3,929 3,695Gi rl s 3,115 3,376 3,077 3,025 2,557 3,161 3,756 3,982 4,400 4,066Total 5,644 6,169 5,652 5,558 4,643 5,820 7,032 7,301 8,329 7,761(Percentage oftotal enrollment 0.65 0.68 0.60 0.58 0.47 0.56 0.66 0.65 0.70 0.62
Secondary SchoolsNumber 9 10 9 12 11 13 18 27 39 36Enrollment
Boys 654 611 656 1,286 1,493 1,280 2,434 3,883 4,722 5,166Girls 834 852 833 1,437 935 1,188 1,738 2,659 3,851 4,122Total 1,488 1,463 1,48u 2,723 2,452 2,968 4,172 6,542 8,573 9,288(Percentage oftotal enrollment 2.04 1.86 1.78 3.06 2.65 3.14 4.22 6.24 7.45 7.3P
Secondary School StaffGraduates 65 69 67 68 70 E3 122 145 216 231Nongraauates 36 33 39 68 67 Ea 118 176 180Total 101 102 106 136 111 150 185 263 392 411
Pupil-teacher ratio(secondary) 14.7 14.3 14.0 20.0 21.9 19.8 22.6 24.9 21.9 22.6
Average class size(secondary) 28.4 26.6 27.1 30.6 31.9 32.3 33.1 37.8 33.0 35.7
n.a = not available
Bid
SA
3,9454,2128,157
0.60)
aa
4,7673,5578,314
6.32)
n.a.n.a.n . a.
n.a.
n . a .
Sources: Education ministries (1975-81), Educational Statistics; Ministry of General Education and Cultureunpublished data. 1 I )

Nongovernment Resources for Financing Education 83
achieving a more equitable distribution of resources.In 1985, private schools were charging an average of K200 per term for tuitionalone. Only the more well-to-do parents could afford such a payment. Thiswill always be a limiting factor on the expansion of private schools. It is alsoa factor that is affected by the state of the economy. In 1985 enrollment inprivate secondary schools was lower than in 1984. Possibly the gallopinginflation that characterized the economy in 1985 meant that evencomparatively wealthy urban families could no longer afford to send theirchildren to private schools. If this is so, private schools may have reached thelimits to which the economy will let them grow.
Grant-Aided SchoolsThe development of education in Zambia owes a great deal to the churches, which
established most of the first primary Ltchools, several of the early secondary schools,and a number of the teacher training institutions. The churches still own andmanage schools, and in addition some church ministers are involved ineducational provision through the education ministries, the university, andgovernment schools and colleges. The churches do not continue to play their formerlarge role in the management of primary schools, but contribute at this levelthrough the four (of the ten nationwide) teacher training colleges they own hndoperate. At the secondary level, church schools account for approximately 16 percentof the enrollment, but because most of these schools serve the rural population theyhave an unusually high percentage of boarders: in 1984 more than 85 percent of theenrollment. The first girls' secondary schools in the country were church owned,and more than a quarter of the total enrollment of secondary school girls is still ingrant-aided schools.
The aided schools are less of a financial burden on the government than otherschools. They receive a grant-in-aid to cover certain operating costs, salarypayments for approved teachers, and wage payments for some employees.
Most of the aided institutions have a high reputation for efficiency, discipline,and academic performance. Many of them are also known as centers whereinnovative ideas and techniques originate. A number have been particularlysuccessful in the area of production work, especially in agriculture. They enjoy thebenefits of low staff turnover, while their executives ars experienced in managinginstitutions. All these factors combine to raise them to the status of prestigiousinstitutions that are frequently the preferred choice of parents and pupils, as well asof teachers. However, admission to these schools is controlled, not by the agencieswho own and operate them, but by the selection and allocation mechanisms that areoperative for publicly-owned schools.
As with gov3rnment schools, the aided schools do not charge any fees. They havebeen able, nevertheless, to preserve a high standard of maintenance, with buildingsin a good state of repair and plant in working condition. They have also succeededin maintaining reasonably good stocks of teaching materials and arecomparatively well off for textbooks, library books, and science apparatus. Some ofthis is due to their willingness and ability to make private inputs from theircollective resources, but much is due to better management practices, both inpreserving their facilities and in caring for books, equipment, and movable goods.
The 1980s have seen increasing calls from highly-placed political figures toextend the churches' ownership and management of schools, partly because of their

84 Education in a Declining Economy: The Case of Zambia, 1975.85
efficiency and partly because they cost the government less. Although they haveopened some additional institutions, manpower constraints have made embarkingon a vigorous program of educational expansion difficult for the churches. Theyare also inhibited by uncertainty about the best way to respond te the needs of theurban and rural poor. Their direct contact with tl's poorer segments of thepopulation and their awareness of the problems and needs of the poor have led manychurch bodies to support ventures in nonformal education, such as establishingquasi-institutions and training programs for primary school-leavers and others,running small cooperatives, and setting up sriall business enterprises. In theformal education sector, the churches' willingness to expand their involvementwould probably be fostered if they had a greater role in pupil and teacher selectionand in curriculum design.
Their own shortage of personnel and their uncertainty about the most appropriatefields for their endeavors mean that the churches are unlikely to take up much of theslack left by the government's inability to provide. Possibly they could establish afew new schools, but not many. However, the churches could make a significantcontribution in two respects. The church schools have maintained the quality ofeducational provision even when finances were declining. First, a study incooperation with the government to discover how they were able to do so when thesituation in government schools was quite the reverse would be useful. Second, iffreed from the tight government control of the curriculum, !ome of the churchschools might be able to use their knowledge of people's needs, especially the ruralpeople, and their experience in education to devise a curriculum that would be morerelevant to their pupils' real needs than the current inherited model.
Increased Privatization and Policy AdjustmentsThe need to turn increasingly to the private sector for financial support for the.
education system has necessitated some adjustments in policy andadministration. The scope for such adjustments is not large, but they exist. Thus,the Ministry of Education (1977, p. 86) categorically stated that tuition and boardingfees would not be introduced in primary and secondary schools, but this policy hadto be modified with the reintroduction of boarding fees. The Ministry of Education(1977, p. 85) also stated that parental contributions were not to replace governmentprovision as the aim was to supplement what government was providing, not toreduce government provision. However, Lhe complete absence of provision forteaching materials for prima..y schools from the 1986 estimates implies thatgovernment provision has now been replaced by parental contributions. Otheradjustments include the expansion of self-help activities into secondary education,and greater emphasis on the economic value of production work in schools, Inadditior the establishment of private schools is no longer just cautiously allowed,but warmly welcomed.
Apart from the reintroduction of boarding fees, each of these adjustments issmall in itself, but taken collectively, they are indicative of the way the educationsystem is responding to the rundown in government funds. Some of the steps can bewelcomed and justified on grounds other than the stringency that dictated them, butthey all illustrate an inability to maintain the level of' public funding required bythe education system. They also suggest mild desperation. The private sector,which in more plentiful times the government regarded with some suspicion orbare tolerance, is now viewed as an ally, and in many respects as the only hope forthe future. It is expected to stave off a fmancial catastrophe in education and to

Nongovernment Resources for Financing Education 85
absorb the vast output of partially educated young people and put them to profitablework. This readjustment to dependence on private inputs demonstrates the truth ofthe observation that: "Educational decison-making in any country is, in the finalanalysis and inescapably, a political process of give and take" (Coombs 1985,p. 177).
However, the possibilities the private sector offers are limited. As alreadyobserved, the drop in enrollment in private schools in 1985 may be indicative of theway the economic climate that year affected well-off parents who in bettercircumstances could afford to send their children to such schools. The real povertyin which most Zambians are living places tight limits or what parents may beexpected to contribute toward their children's education. Such contributions cannotcome close to the full economic cost. Without a substantial reorganization andpossibly a radical transformation of schools, production work will not make anysignificant contribution. Religious bodies, philanthropic organizations, and otherNGOs can all make worthwhile contributions, but they cannot assumeresponsibility for a very heavy additional share of educational costs. Aid sourcesfrom abroad can be tapped more syw,.matically, but they too are limited in theamount they can spend and on how they can spend it. A bebering thought, but onedeserving recognition, is that .he options for educational financing may berunning out.
Some options, however, have not been exhaustively explored, for example:
to involve local government in raising funds, at least for the primary level;to involve large commercial and industrial organizations in the provision ofeducation, as the copper industry is already doing;to reduce costs through better management of the existing system, forinstance, by seeing to it that poor communications and careless officeprocedures do not result in teachers remaining on the payroll long after theyhave left the system.
The government must recognize that there is a definite limit to what the privatesector can do to support the education system. Zambia may be approaching thatlimit. It is therefore all the more necessary to invQstigate other alternatives.

9Educational Provision at the Primary and
Secondary Levels
IMMIMMUIES AMEMMESEIVINOLLUXIiii
When evaluating the impact of economic fluctuations on the education that acountry provides for its citizens, one must take account of the entire range ofeducational provision. This includes the formal structures of schools, colleges, anduniversities; the variety of less highly stratified educational and trainingopportunities provided by the state, commercial enterprises, internationalorganizations, charitable bodies, communities, and individuals; and the allimportant, though virtually amorphous opportunities fbr education that occur in thehome, on the street, though the media, and so on. However, this book is concernedmostly with the highly formalized education system that comprim- prImary andsecondary schools and the university. No express consideration is given totechnicil education and vocational training, not because they are ot' littleimportance, but because they are of such importance that they deserve a separatestudy. The same is true for the whole area of nonformal education. Accordingly,this section will concern itself with some quantitative aspects of school provision inZambia during 1975-85. It will then consider some qualitative features of suchprovision and before turning to curriculum, examination, and staffing issues.
The Expansion of Primary School EnrollmentsThe period 1975-85 was characterized by substantial quantitative expansion at
the primary and secondary levels. The tt tal primary school enrollment, whichstood at 872,392 in 1975 had risen by 1985 to 1,348,689, an increase of more than 60percent (table 9.1). The gross enrollment ratio for the whole country, which hadbeen 90.0 percent in 1975, now stands at 95.5 percent. This latter increase hasoccurred despite an increase of more than 45 percent in the school-age population.The gross enrollment ratio fell off for a few years after 1976, but has beenincreasing steadily since 1981. This growth in enrollments was made possible byphysical developments, increasing class size, more systematic use of donblesession teaching, and the introduction where possible of triple sessions for the lowerprimary cycle.
The effect of triple session teaching can be seen most strikingly in th,)admission rates to grade 1: in 1984 there were sufficient places throughout thecountry for 92.4 percent of the estimated seven-year-old population, but in 1985 the
86
1 (

Educational Provision at the Primary and Secondary Levels 87
Table 9.1 Primary School Enrollments, 1970-86
Year Boys Girls Total
1970 385,676 308,994 694,670
1971 402,331 327,470 729,801
1972 428,693 349,180 777,873
1973 445,009 365,225 810,234
1974 470,191 388,000 858,191
1976 467,008 396,384 873,392
1976 492,899 414,968 907,8671977 504,669 432,148 936,8171978 516,358 448,117 964,4751979 531,354 465,243 996,597
1980 554,503 487,435 1,041,9381981 568,039 505,275 1,073,3141982 593,674 523,095 1,121,7691983 631,973 562,097 1,194,0701984 666,347 594,263 1,260,610
1985 713,032 635,657 1,348,6891986 761,171 680,962 1,442,133
Sources: Ministry of General Education and Culture (1986) and unpublished data.
number enrolled in grade 1 exceeded the number of seven-year-olds by over 16,000,giving an apparent admission rate of 107.1 percent. The application of this strategyin the Copperbelt alone raised the apparent admission rate from 77.0 percent in 1984to 97.2 percent in 1985.
The growth in the gross enrollment rate has not been accompanied by a similargrowth in the net rate, that is, in the proportion of children in school who areactually of the proper school-going age. Although great reliance cannot be placed onage-related data in statistical returns from primary schools, there is sufficientconsistency to give some indication of the trends. Thus, it appears that the netenrollment ratio has been stagnant since 1975 at thout 78 percent, that is, only some78 percent of the children in primary schools lie within the correct age limits forprimary school attendance. The stagnation appears to be due to the continuedpressure on the education system from the large backlog of children who could notfind places in the past. On their entry to school, such children occupy grade 1 placesand consequently deny them to seven-year-olds. This is seen clearly from the age-specific enrollment rates: only about one-third of the pupils admitted to grade 1 in1983, and for several years previously, were seven years old. Application of censusfigures to enrollment data shows, in fact, thAt out of a total grade 1 enrollment of169,038 in 1980, 9,613 pupils were below the age of seven and 91,029 (or 53.9 percent)were over the legal age of seven or eight. The ministry's data show that theproportion of age-appropriate children has been declining across the years. InLusaka and the Copperbelt only about 25 percent of the seven-year-olds have been

88 Educt.tion in a Declining Economy: The Case of Zambia, 1975-85
finding their way into school in recent years, compared with over 30 percent adecade earlier. However, in the rural areas, a much higher proportion of seven-year-olds are in school and the proportions are generally increasing, thoughslowly. Hence the overall decline in the age-specific enrollment rate is largely anurban phenomenon, confined for the most part to Lusaka and the Cnpperbelt. It isclearly related to the large population increase being experienced by ' iese two areasand to their lack of physical capacity to deal with all school-aged children.
However, not all seven-year-old pupils are in grade 1; some were adm4ted toschool below the age of seven, and may now be in grade 2 or even grade 3. Thenumber of such children is captured in the participation rate, which compares thetotal number of seven-year-old children in school, regardless of grade, with thenumber in the population. In 1975, according to data from the Ministry of GeneralEducation and Culture, 49.7 percent of all seven-year-olds were in school. Thisproportion fell quite steadily to 37.8 percent in 1981 and 1982, and then rose slightlyto 38.4 percent in 1983. More recent data are not yet available to indicate whetherthis recovery has been maintained.
In the 1970s there were more seven-year-old children in classes other than grade1 than in the 1980s. Across the period 1975-78 the average number of seven-year-oldsin grade 2 and above was 11,027, whereas it was 7,681 across 1980-83. This showsthat in the more recent years fewer very young children were being enrolled inschools. Probably the pressure of the increasing population of children of the correctschool-going age and the backlog of those already overage but not yet in schoolcombined to reduce the admission chances of underage children. Possiblyfinancial 'problems also deterred parents from sending children to school at tooearly an age.
The Growth Rate of Primary School EnrollmentsThe growth pattern of primary school enrollments deserves comment (table 9.2).
First, across the decade the growth rate at all levels was considerably larger thanthe population growth rate. This was true not only at the national level, but also atthe level of each educational region. The highest overall rate of. primary growthoccurred in Lusaka, with an annual average increase of 7.2 perce' it for grades 1 to 7and of 7.0 percent for grade 1. But the North-Western and Central regions alsoexperienced very high growth rates, as did the Copperbelt for grade 1. Clearly thesemassive enrollment growth rates cannot be maintained. Apart from the resourcesthey would consume, they would soon outstrip the prospective school population.However, they are needed currently because of the backlog that exists, especially inthe large urban centers of Lusaka and the Copperbelt.
Second, during 1975-80 the rate of growth was considerably slower than duringthe previous five years (table 9.2). Then the growth rates began to increase again sothat the period 1980-85 saw astonishingly high annual rates of growth in grades 1, 5,and 7 and across grades 1 to 7. Me average annual growth rate for grade 1enrollment was 3.5 percent for 1970-75, 2.9 percent in 1975-80, and 7.9 percent in1980-85. A similar pattern is displayed by the enrollments across grades 1 to 7;however, for grades 5 and 7 the 1980-85 rate, though higher than that during 1975-80,was lower than that for 1970-75. This was because the decline in the growth of thegrade 1 enrollment rate during 1975-80 was still working its way through thesystem in 1980-85. Note also that in most cases the growth of the enrollment rates forgirls outstripped those for boys. To some extent this reflects the smaller base forgirls, but this is not the entire explanation. Since places offered at the primary level

Educational Provision at the Primary and Secondary Levels 89
Table 9.2 Enrollment Growth Rates, Primary Schools, 1970-85(average annual rate)
Grade 1970-75 1975-80 1980-85
Grade IBoys 3.17 2.61 7.93Girls 3.74 3.12 7.82Both sexes 3.45 2.87 7.87
Grade 5Boys 6.57 3.91 6.10Girls 7.91 5.66 6.89Both sexes 7.14 4.69 6.47
Grade 7Boys 7.50 4.47 7.05Girls 10.90 6.72 8.53Both sexes 8.72 5.35 7.66
Grades 1-7Boys 4.86 3.10 6.54Girls 6.04 4.22 6.91Both sexes 5.39 3.62 6.71
Sources: Education ministries (1970, 1975, 1980), Educational Statistics; Ministry ofGeneral Education and Culture unpublished data.
do not discriminate between the sexes, the figures illustrate people's dc... to ensurethat a larger proporticl of girls receives an education.
When enrollment thata are analyzed by region, they follow the same U-shapedcurve for growth in enrollment rates during 1970-85 as described in the previousparagraph. This shows that in the years immediately after the financial decline setin the rate of expansion at the primary level slowed down perceptibly, but that thiswas followed by considerable acceleration. Thus, one of the immediate impacts ofthe financial difficulties appears to have been considerable uncertainty and evendisarray that manifested themselves in a more sluggish growth rate. This wasfollowed by greater optimism and a greater determination to make up for lost time.This reaction says something about the robustness and resilience of the educationsystem. Heyneman (1983) noted something similar in Uganda, where theeducation system survived in the face of the most adverse financial, social, andpolitical conditions.
The Expansion of Secondary SchoolsMuch the same pattern is found at the secondary as at the primary level, except
that because the initial base at the secondary level was small, when expressed inpercentage terms increases appear very large. Thus, the total enrollmentincreased by 80 percent, from 73,049 in 1975 to 131,502 in 1985 (table 9.3). The

90 Education in a Declining Economy: The Case of Zambia, 1975-85
Table 9.3 Secondary School Enrollments, 1970-86
Year Boys Girls Total
1970 35,205 17,267 52,472
1971 37,518 18,487 56,005
1972 39,943 20,108 60,051
1973 40,348 21,006 61,354
1974 43,564 22;200 65,764
1975 47,983 25,066 73,049
1976 51,871 26,934 78,805
1977 55,498 28,389 83,887
1978 58,737 30,243 88,980
1979 60,200 31,595 91,795
1980 61,351 33,244 94,595
1981 63,996 34,866 98,8621982 67,622 37,237 104,859
1983 73,586 41,502 115,088
1984 80,339 45,472 125,811
1985 83,407 48,095 131,502
1986 95,112 55,286 150,398
Sources: Ministry of General Education and Culture (1986) and unpublished data.
increase at junior and senior levels was much the same, but because of theirsmaller initial numbers, e proportionate increase for girls was larger.
The picture of growth ra...:e at the secondary level is in many respects similar tothat observed in the primary schools (table 9.4). In terms of total secondaryenrollment, the average annual rate of growth reached 6.8 percent in 1970-75,slowed down to 5.3 percent in 1975-80, and increased awn a 1980-85 to 6.8 percent.Growth at the point of admission to secondary followed the same U-shaped pattern ofhigh in 1970-75, low in 1975-80, and high in 1980-85. Since the grade 8 growth ratesfrom 1970 to 1980 were lower than those for grade 7, and the base for the latter wasinitially larger than for grade 8, it was inevitable that there should be a decline inthe transition rate from grade 7 to grade 8. However, the massive growth rate of 14.6percent observed for grade 8 in the period 1980-85 shows that determined efforts werebeing made to arrest the backward slide in transition rates that had set in duringthe previous five years.
Developments in grade 12 were quite contrary to those in all other educationallevels during the period under review. The growth rate continued to increaseduring 1975-80, but then began to decline. Two reasons explain this. First, theincreases effected at the junio: secondary level in 1970-75 were still having theireffect at the senior level some years later. Second, the stress on the development ofnew facilities and the increase of enrollments at the senior level declined in the1980s because of resource constraints and the growing realization that training

Educational Provision at the Primary and Swondary Levels 91
Table 9.4 Enrollment Growth Rates, Secondary Schools, 1970-85(average annual rate) =0010
Grade 1970-75 1975-80 198085Int
Grade 8Boys 7.56 2.54 14.26Girls 6.56 2.77 13.82Both sexes 7.18 2.63 14.09
Grade 12Boys 5.48 7.08 3.48Girls 7.25 10.21 7.91Both sexes 5.91 7.81 4.80
Grades 8-12 (average)Boys 6.39 5.04 6.33Girls 7.74 5.81 7.67Both sexes 6.84 5.31 6.81
1111MIMMINIftNIOMMIMI.
Sources: Education ministries (1970, 1975, 1980), Educational Statistics; Ministry ofGere.ral Education and Culture unpublished data.
opportunities f. r grade 12 school-leavers were stagnating while job opportunitieswere declining.
Secondary School BoardersDevelopments at the secondary level differed from those in primary schools,
especially with regard to boarders. The proportion of boarders has always beenhigh, until 1984 accounting for more than half of all secondary school pupils. Insome regions, most of the pupils were boarders. However, the recent emphasis onreducing costs by providing day facilities has reduced the proportion though not theactual number of boarders. Two strategies have made this possible: concentratingmost of the new developments on the provision of places for day pupils andonverting existing boarding schools into day schools, with the former boarding
facilities being used to provide additional places for day pupils. Anotherdevelopment was that from May 1986, parents became responsible for the costs ofboarding, although the fees only covered about one-third of the actual costs. Thebalance was subsidized from public funds.
Toward the end of the year, the Ministry of General Education and Cultureconducted a survey to assess the impact of the new measures. The survey found thata number of pupils had transferred from boarding to day schools nearer to theirhomes, but that of a total of approximately 26,000 boarders in the 44 schools surveyed,only about 600 had been obliged to discontinue their secondary education because ofan inability to pay the fees. However, whether pupils will continue to attendsecondary boarding schools as freely as they did in the past remains to be seen, andin particular, what is the effect on two groups, rural pupils who must depend heavilyon boarding accommodation, and pupils who already have a sibling attending

92 Education in a Declining Economy: The Case of Zambia, 1975-85
school as a boarder. The government has established a bursary scheme to assist theneediest 10 percent of boarders, but criticisms have already been leveled against itscumbersomeness and its inability to respond rapidly to cases of genuine need.There are also signs that the bursary scheme does not reach out to many who standin need of it because they do not know about the scheme. This lack of informationabaut benefits available within a social services sector tends to be characteristic ofr4ral poverty and remoteness. It brings out the need for the education ministry toshow special care in explaining these matters to the rural poor.
Basic Education SchoolsTo hasten the day when the goal of nine years of universal basic education will
be achieved, communities have been encouraged to add on to primary schools thephysical structures needed to enable pupils to continue into grades 8 and 9. Primaryschools that have been topped up in this way ant referred to as basic educationschools. Until 1982, only 7 such schools had been established, but during 1983-87; thenumber increased to 122. These schools now provide 292 grade 8 classes and 219grade 9 classes. They account for almost one-fifth of the total junior secondaryprovision in the country.
The rush to establish basic schools has been so headlong that a number of issuesconnected with these schools have not been explored. In the wider perspective, thereis a danger that both the government and communities will use the limitedresources at their disposal to add grades 8 and 9 to a primary school rather than fortwo more urgent tasks: adding grades 5 to 7 to the many schools that currently endat grade 4, and ensuring that all primary schools have enough teaching materialsto do their job properly. More narrowly, basic schools present a number of uniqueproblems. Although the general idea is that ultimately all primary schools would gofrom grade 1 to grade 9, the government has not. taken any steps to provide the newschools with the curricula or the materials required. The Curriculum DevelopmentCentre has developed curricula for the full nine years, but these have not beenissued to the schools. Instead teaching in the upper grades of basic schools is basedon the curriculum of the present junior secondary cycle.
In addition, the relationship to existing and new junior secondary schools hasnot been worked out. The lack of resources means that the government cannot, inthis century, make substantial progress along the road to universal basic educationlasting for nine years. This being so, it must decide where the new grade 8 and 9classes really belong: are they the top classes in primary schools, the bottom classesin secondary schools, or entities on their own?
Another problem is that the basic education school, really are quite basic. Noscience teaching facilities exist (Imenda and Chibesakunda 1986), and there isnone of the relatively rich variety of resources that pupils encounter in regularsecondary schools. By all accounts, furnishings, equipment, and teachingmaterials are in short supply and do not exist even in the limited quantities foundin secondary schools. Many of the basic schools are staffed by drawing the bestteachers out of the primary schools, but these teachers are not given any adequatetraining for teaching at the post-primary level. Most of the basic schools are smallestablishments. Of the 123 in existence at the beginning of 1987, 37 had only onegrade 8 class, 48 had two, and 38 had three or more. This means that many of theseschools will face difficulties in offering a broad curriculum and in being properlystaffed. They will therefore encounter grave difficulties in meeting the objectivelaid down for them (Ministry of Education 1977, p. 8): to provide general education,
Educational Prsavision at the Primary and Secondary Levels 93
including some practical skills, together with a sound foundation for further full-time or part-time education.
Progression within the School SystemOnee pupils have gained admission to primary school, they will complete
secondary school, provided they succeed in negotiating three transitional points:the transition from grade 4 to grade 5, the transition from primary school tosecondary school, and the transition within the secondary system from junior tosenior. The public tends to focus on the transition from primary to secondaryschool, but a more tragic termination of formal education that occurs for manypupils on completion of grade 4 scarcely attracts any attention, very likely becauseit tends to occur in rural rather than urban areas.
The Transition from Grade 4 to Grade 5
Few people realize that grade 4 pupils in many rural schools must take anexamination to determine who will proceed to grade 5. The district educationofficer sets and administers the examination and selects a panel of examiners tomark the papers. The education officer, in conjunction with the heads of admittingschools, makes the actual selection. The reason for this pruning is that many of therural schools are incomplete and do not go beyond grade 4, thus there are fewergrade 5 places than grade 4 places. In 1984-85, the shortfall was 511 classes, whichwas nevertheless an improvement over 1974-75, when the shortfall was 841 classes.But it still meant that nationwide, for every 100 grade 4 classes, only 88 grade 5classes existed. This shortfall occurred almost exclusively in rural areas.
At the national level, the progression rate from grade 4 to grade 5 rose from 77.7percent in 1974-75 to 92.9 percent in 1984-85 (table 9.5). Each year the proportion ofboys proceeding to grade 5 exceeds the proportion of girls at the national level,although there are isolated examples at the regional level where the proportion ofgirls is higher. The number of pupils who do not succeed in moving on grade 5has fallen from 27,358 in 1915-76 to 13,769 in 1985-86, equally divided by sex. Onaverage, about 14 percent of those who do not proceed to grade 5 will repeat a lowergrade, usually grade 4, in the hope that they will succeed next time. Some who do notsucceed in making the transition in the rural areas migrate to the towns whereprogression to grade 5 is automatic.
The plight of those who terminate school after only four years of primaryeducation is touched on elsewhere in this report, but in general we can expect thesepupils to relapse into illiteracy. Sufficient groundwork would not have been laidduring their schooldays to serve as the basis for permanent literacy. Moreover, thesociety in which they are immersed is not fully literate, and furthermore, does notmake extensive use of printed materials. Moreover, the incentives to use suchmaterials as may be available are low in rural areas.
Although the absolute number of pupils who are affected is small, and in relativeterms constitutes only about 1 percent of the total primary school enrollment in agiven year, their needs deserve special consideration. Because they come fromscattered populations, responding to these needs may be comparatively expensive.A current attempt to do so is by means of multigrade schools (where enrollment byage groups is so small that all the children are amalgamated into one or just a fewclasses), since this system allows the creation of a big enough audience to justify theallocation of teachers. But multigrade schools will not reach all grade 4 leavers. In

Table 9.5 Progression Rates from Grade 4 to Grade 5, 1974/75 to 1984/85(number in grade 6 as a percentage of the number in the preceding year's grade 4)
Area 1974175 1975175 1976177 1977178 1978179 1979180 1980181 1991182 191E184 1994185
Whole countryBoys 80.0 82.4 82.6 82.7 83.9 87.3 872 89.5 92.4 92.5 95.1Girls 74.9 78.4 79.5 79.9 79.9 83.6 84.9 87.3 89.1 89.6 91.6Both sexes 77.7 80.6 81.1 81.4 82.7 85.6 86.1 88.5 90.9 91.1 92.9
RegionsLusaka 98.0 104.2 98.6 100.9 102.6 102.3 100.6 103.6 103.8 105.0 107.0Copperbelt 98.0 97.5 99.6 98.0 100.4 103.4 100.5 101.7 103.9 103.2 101.5Central 83.0 81.8 84.4 85.3 85.2 90.0 89.3 90.4 96.8 92.1 97.2Northern 62.2 66.8 67.0 68.4 70.6 74.5 75.5 77.6 80.5 81.3 84.1Western 76.2 76.3 77.6 75.7 78.5 78.3 792 81.5 81.7 80.9 84.6Eastern 60.8 65.7 63.8 64.0 64.6 66.0 71.1 74.0 77.3 79.1 80.6Luapula 61.7 64.2 64.9 66.9 69.0 77.4 76.4 81.5 84.1 86.9 86.9North-Western 71.6 69.6 69.4 71.6 70.7 73.3 77.3 85.8 89.2 92.3 93.1Southern 79.6 82.7 85.6 85.7 84.0 85.5 87.1 87.6 88.6 92.0 91.4
Sources: Education ministries (1974-81), Educational Statistics; Ministry of General Education and Cultureunpublished data.

Table 9.6 Transition Rates from Primary to Secondary School, 1974175 to 1984185(number in grade 8 as a percentage of the number in the preceding year's grade 7)
Area 1974175 1975176 1976177 1977178 1978179 1979192 1980181 1981182 1992183 1993184 1984185
Whole countryBoys 22.9 22.8 22.5 22.7 21.4 21.1 21.1 22.0 23.6 25.1 31.5Girls 22.8 21.1 21.0 20.2 18.5 18.7 18.8 19.1 20.6 21.1 27.4Both sexes 22.9 22.2 21.9 21.7 20.2 20.1 20.2 20.8 22.3 23.4 29.7
RegionsLusaka 24.9 24.9 25.2 25.8 23.6 22.4 21.6 23.4 25.0 24.7 26.3Copperbelt 27.2 26.0 26.2 25.5 22.3 22.2 22.5 22.8 24.1 27.8 38.8Central 18.8 21.8 20.9 21.2 19.4 19.9 21.7 19.8 17.7 22.2 25.6Northern 22.2 21.6 20.6 19.2 19.4 19.3 17.6 20.2 20.5 20.3 31.0Western 17.8 16.8 16.2 16.1 16.3 17.3 16.9 17.2 18.9 20.8 23.5Eastern 22.2 18.8 17.9 17.5 15.6 15.7 16.6 18.6 22.3 20.8 24.0Luapula 19.2 22.0 23.7 23.4 23.8 26.1 24.1 24.2 22.8 25 4 27.4North-Western 22.4 17.9 18.2 19.9 19.8 16.6 19.8 25.2 26.8 23.3 32.5Southern 22.2 21.9 20.9 20.9 19.1 18.6 18.5 16.8 21.8 20.3 26.3
Sources: Education ministries (1974-81), Educational Statistics; Ministry of General Education and Cultureunpublished date.

96 Education in a Declining Economy: The Case of Zambia, 1975-85
1983, 641 schools terminated at grade 4 but the multigrade system will be introducedat only some 150 schools. The other incomplete schools have too large an enrollmentto i,istify this approach. It is unfortunate that social and political pressures, coupledwith the dynamism of communities, cannot be mobilized to meeting this verypressing need for additional grade 5 to 7 facilities in the way they are being ralliedto expand the number of grade 8 and 9 places.
Transition from Primary to Secondary SchoolAlthough the number of pupils taking the secondary selection examination has
risen steadily and rapidly with the growth in grade 7 enrollment, the proportion thatcan find a place in secondary school has managed to keep pace, or even improveslightly. In 1974-75, 22.9 percent of primary school students went on to secondaryschool, and by 1984-85 this figure reached 29.7 percent (table 9.6). However, somedecline in the proportion, though not in the absolute numbers, began in 1976-77 andcontinued until 1979-80 when the lowest transition rate since independence, 20.1percent, was recorded. After that the transition rate began to rise again when theimpact of the new basic education schools began to be felt. Tht.s the grade 7 to 8transition rate also follows the U-curve pattern of decline in the years immediatelyafter the recession set in, followed by upward growth. The size of the transition ratereceived a large, but temporary, boost in 1984-85, when the reorganization of thesecondary school pattern from three to two years of junior secondary and from twoto three years of senior made it possible, for one year only, to admit an exceptionallylarge number of students to grade 8. In absolute terms, 48,232 pupils were enrolledin grade 8 in 1985 compared with 19,254 in 1974.
At the national level, the transition rate for boys is higher than that for girls,though there are instances at the regional level where a higher proportion of girlsthan boys proceeds to grade 8. The higher rate for boys is partly attributable to thegreater availability of boarding places for boys, and partly because boys obtainconsistently higher scores than girls in the secondary selection examination. Thetendency of boys to outperform girls, not only in the secondary selectionexamination but in all public examinations in Zambia, is so well marked that thereis reason to suspect that examinations may be biased in favor of boys. Clearly thisis an important issue that deserves further investigation.
The proportion of grade 7 pupils who enter secondary school is higher in someregions than in others. Lusaka and the Copperbelt are particularly well favored inthis way, but the higher transition rates for these regions in recent years is due verylargely to the high proportions of boys who proceed to grade 8. Girls from theseregions tend to have low rates of progress.
Social and historical factors have affected the location and development ofsecondary schools, but urbanization appears to have been a prominent influence.The serious disadvantages that the Copperbelt and Lusaka suffer in regard toprovision at the primary level have not carried over to the secondary level. As withall regions in Zambia, these two centers do not have enough facilities for allchildren of secondary school age, but they have proportionately more than any of theothers, above all, more than the rural regions. The advantage of the Copperbelt islikely to increase as it is one of the areas where there has been the most extensivedevelopment of self-help basic schools (by contrast, these are least developed inLusaka; instead, the capital is served by a large number of new private schools).The imbalance being created by the rapid expansion of secondary facilities in theCopperbelt is likely to keep the public demand for the expansion of secondary
1 1 3

Educational Provision at the Primary and Secondary Levels 97
education at such a pitch that attention and resources will be diverted away from theneed for quantitative expansion at the primary level and qualitative improvementsat all levels.
Transition from Junior to Senior Secondary School
Secondary education in Zambia is made up of two cycles, junior and senior, withtransition being based on performance in the Junior Secondary School LeavingExamination (JSSLE). Up to 1971, the junior cycle lasted two years and the seniorthree years, with the transition occurring at the end of grade 9. In 1972, the juniorsecondary program was extended to three years and the senior reduced to two years.This arrangement, with the transition being made at the en-3 of grade 10, continueduntil 1984. Another change was made in 1985, with a return to the earlier pattern oftwo years for junior secondary and three for senior. This is the currentarrangement, with the JSSLE and transition from junior to senior secondary leveltaking place on completion of grade 9.
The government's policy was to establish enough senior secondary places toallow approximately 50 percent of those completing junior secondary to continueinto senior. It could not sustain this policy, however, because provision of places atthe junior level grew at a faster rate than at the senior: enrollments in the finalyear of the junior cycle were 107 percent larger in 1984 than they had been in 1974,but the increase in enrollment in the first year of the senior cycle during the sameperiod was only 78 percent. Because of this, the transition rate from junior to seniorsecondary school fell from 53.7 percent in 1975 to 46.8 percent in 1984 (table 9.7).
Table 9.7 Transition Rates from Junior Secondary to Senior Secondary School,1974/75 to 1983/84(number in grade 11 as a percentage of the number in the preceding year's grade 10)
Year Boys Girls Both sexes
1974/75 58.3 45.3 53.7197516 56.8 42.5 51.91976/77 55.3 37.8 49.21977/78 56.1 42.1 51.2197819 53.5 41.7 49.41979/80 50.6 46.2 49.11980/81 53.6 39.8 48.71981182 52.7 45.2 50.11982183 50.4 42.9 49.81983/84 49.8 41.9 46.8
Sources: Education ministries (1974-81), Educational Statistics; Ministry ofGeneral Education and Culture unpublished data.
The transition rate was maintained at approximately 50 percent for as long as itwas because new senior school places, many of them created with World Bankassistance, were coming on stream. However, very few new senior secondary
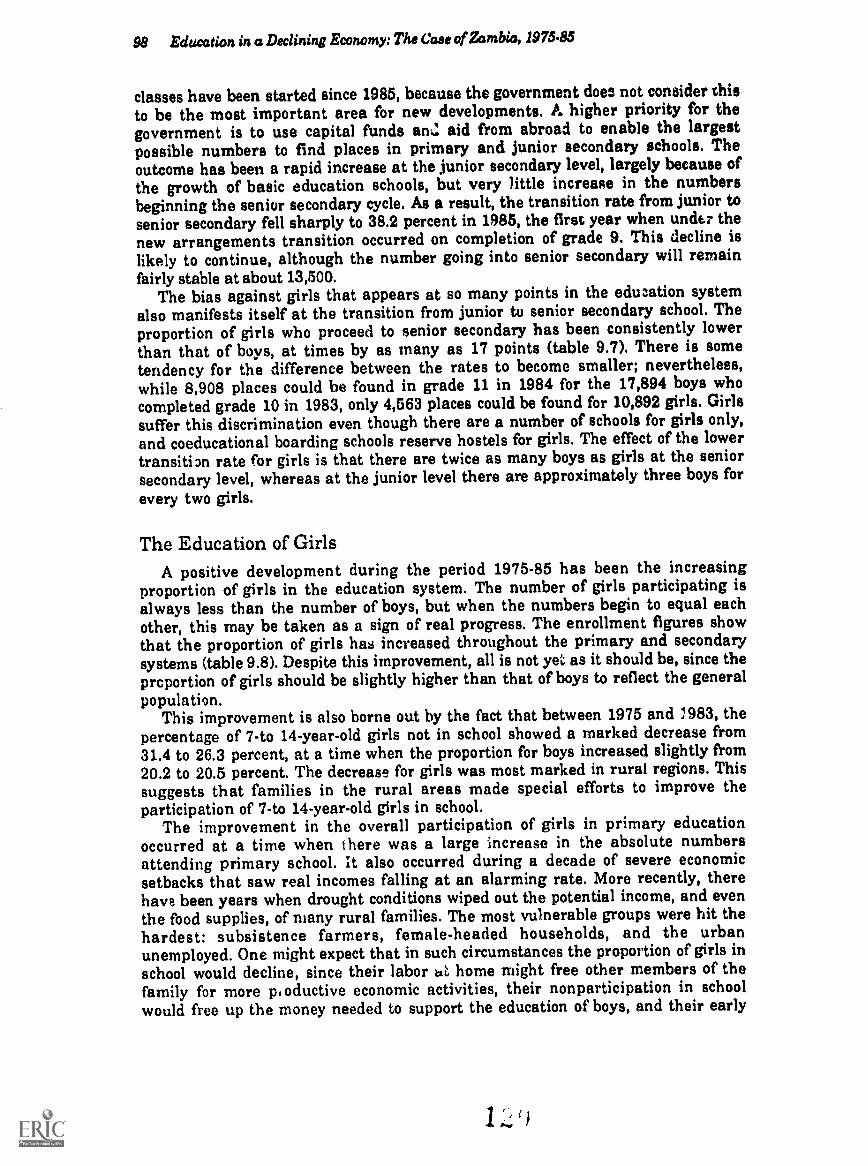
98 Education in a Declining Economy: The Case ofZsmbia, 1975.85
classes have been started since 1985, because the government does not consider thisto be the most important area for new developments. A higher priority for thegovernment is to use capital funds am.: aid from abroad to enable the largestpossible numbers to find places in primary and junior secondary schools. Theoutcome has been a rapid increase at the junior secondary level, largely because ofthe growth of basic education schools, but very little increase in the numbersbeginning the senior secondary cycle. As a result, the transition rate from junior tosenior secondary fell sharply to 38.2 percent in 1985, the first year when undtr thenew arrangements transition occurred on completion of grade 9. This decline islikely to continue, although the number going into senior secondary will remainfairly stable at about 13,500.
The bias against girls that appears at so many points in the education systemalso manifests itself at the transition from junior to senior secondary school. Theproportion of girls who proceed to senior secondary has been consistently lowerthan that of boys, at times by as many as 17 points (table 9.7). There is sometendency for the difference between the rates to become smaller; nevertheless,while 8,908 places could be found in grade 11 in 1984 for the 17,894 boys whocompleted grade 10 in 1983, only 4,563 places could be found for 10,892 girls. Girlssuffer this discrimination even though there are a number of schools for girls only,and coeducational boarding schools reserve hostels for girls. The effect of' the lowertransition rate for girls is that there are twice as many boys as girls at the seniorsecondary level, whereas at the junior level there are approximately three boys forevery two girls.
The Education of GirlsA positive development during the period 1975-85 has been the increasing
proportion of girls in the education system. The number of girls participating isalways less than the number of boys, but when the numbers begin to equal eachother, this may be taken as a sign of real progress. The enrollment figures showthat the proportion of girls has increased throughout the primary and secondarysystems (table 9.8). Despite this improvement, all is not yet as it should be, since theprcportion of girls should be slightly higher than that of boys to reflect the generalpopulation.
This improvement is also borne out by the fact that between 1975 and 7983, thepercentage of 7-to 14-year-old girls not in school showed a marked decrease from31.4 to 26.3 percent, at a time when the proportion for boys increased slightly from20.2 to 20.5 percent. The decrease for girls was most marked in rural regions. Thissuggests that families in the rural areas made special efforts to improve theparticipation of 7-to 14-year-old girls in school.
he improvement in the overall participation of girls in primary educationoccurred at a time when there was a large increase in the absolute numbersattending primary school. It also occurred during a decade of severe economicsetbacks that saw real incomes falling at an alarming rate. More recently, therehays been years when drought conditions wiped out the potential income, and eventhe food supplies, of many rural families. The most vulnerable groups were hit thehardest: subsistence farmers, female-headed households, and the urbanunemployed. One might expect that in such circumstances the proportion of girls inschool would decline, since their labor ut, home might free other members of thefamily for more pi oductive economic activities, their nonparticipation in schoolwould free up the money needed to support the education of boys, and their early

Educational Provision at the Primary and Secondary Level. 99
Table 9.8 Proportion of Girls in School Enrollment, 1975-85(number of girls as percentage of total enrollment)
Grade 1975 1976 1977 19'19 1979 1992 1991 19M 1983 1964 1965
Primary schoolsGrade 1 48.7 49.0 48.9 49.3 49.4 49.3 49.3 49.2 49.3 49.3 49.2Grade 5 44.0 44.8 45.6 46.5/ 45.9 46.1 46.6 47.0 46.6 47.0 47.1Grade 7 38.0 38.3 39.4 40.5 40.7 40.6 41.5 41.6 41.7 42.0 41.8Grades 1-7 45.4 45.7 46.1 46.6 46.7 46.8 47.1 47.1 47.1 46.6 47.1
Secondary schools
Grade 8 37.6 36.0 36.7 36.7 37.1 37.8 37.8 38.1 38.3 37.5 38.7
Grade 12 25.2 27.9 26.7 25.9 27.9 28.0 31.2 28.4 31.4 33.3 32.4
Grades 8-12 34.3 34.2 33.8 34.0 34.4 35.1 35.3 35.3 36.0 36.1 36.6
Sources: Education ministries (1975-81), Educational Statistics; Ministry ofGeneral Education and Culture unpublished data.
marriage would relieve the family of some financial responsibility. That thereverse happened is a manifestation of people's belief in the value of education andof their awareness of the importance of ed4tating girls to achieve progress.
Coombs (1985) points out that the lowest participation rates for girls are usuallyfound in countries in which the overall participation rates are low. This impliesthat as the overall enrollment rate increases, the proportion of girls will likewiseincrease. This is more or less what is happening in Zambia. Coombs also observesthat "wherever significant female disparities exist, they are always greatest inhigher education" (1985, p. 226). In .7ambia this is seen even at lower levels; theproportion of girls falls steadily between one grade and the next. It is even morepronounced at the secondary level, where girls comprise only slightly more thanone-third of the enrollment, and is worst of all at the university, where there arefour male students for each female.
The improvements in the proportion of girls attending school are occurringslowly and laboriously, but may be hastened indirectly by Zambia's financialproblems, which have brought a growing realization that women have an economicrole to play as producers of food, key members of the informal sector, and heads ofhouseholds. However, specific policies, backed up by implementable measures, arestill needed to accompany this developing awareness. No national plan has everpointed to the high priority that girls' education should receive. Yet the achievementof universal education is closely linked to the improvement of educationalopportunities for girls and women and to the widening of opportunities for girls tobreak into areas of study that have traditionally been male preserves. Whether theZambian government has really grasped this point, or given enough thought to thesteps needed to ensure more equal participation by girls, is not yet clear.
Geographic DisparitiesAs already pointed out, educational provision varies from region to region in a

100 Education in a Declining Economy: The Case of Zambia, 1975.85
number of aspects. Most of the disparities between regions are not extreme and aregradually disappearing, but they still exist in the following areas:
admissions, enrollments, promotion rates, and examination performance;
allocation of funds for teaching materials, maintenance, and otheressentials;number of trained teachers and the proportion of female teachers.
In two cases, however, the difference between regions is marked: at the level of
admission to grade 1, where the rural areas have a clear advantage over urbanareas, and of transition to grade 5, where the advantage lies with the urban areas.
Most of the differerces are slowly disappearing because of the increasedprovision of facilities in all areas and at all levels, and in some instance as aresult of deliberate policy measures, as with the increased provision of grade 5places in rural areas. However, much of the disparity is vanishing as theunplanned outcome of other measures, such as efforts to make the curriculum morerelevant and to foster more widespread parent participation in school development.Although with fewer financial constraints some of the disparities might havedisappeared more quickly, there is no evidence to suggest that they have beenworsened or unduly prolonged because of the economic recession.
Policy measures can control, reduce, and eventually eliminate some geographicdisparities, such as the lack of sufficient grade 1 places in urban areas or thedistribution of trained teachers. But other inequalities are due to society's attitudesand are less amenable to policy interventions. For example, parents largelycontrol the age at which children begin school, their actual attendance, and theirdecision to drop out of school.
A number of apparently geographic disparities are actually tied up with otherforms of inequality and linked to other inequalities in society. Thus, the inequalityof access to grade 1 is closely related to the inequality between rich and poor inurban areas and the inability of the urban poor to press for adequate educationalfacilities for their children. The inadequate provision of grade 5 places in the ruralareas is connected with Zambia's historical development and its partition into twoeconomic entities, the line-of-rail and the rest of the country.
There is some danger that new forms of geographic disparity are beginning toemerge. Two in particular are important. First, the development in the form of
basic education schools of what may be a substandard form of secondary school andtype of education in the areas where the poorer sectors of the population live. Second,secondary and tertiary education may become the province of pupils from better offhomes, mostly urban, whose parents have had some form of higher education.
To eliminate existing disparities and head off new ones, whether based on sex orgeographic or socioeconomic factors, the government should take more determinedaction based on better information. Policymakers in the education ministries needto show more dynamism in addressing issues that involve disparities, but to thisend they must be better informed about such issues. An extensive information baseand good analytic capacity are both needed for providing decisionmakers withtimely advice based on a constantly updated review of the state of the educationsystem. Unfortunately, Zambia's information generating and processingcapabilities have deteriorated during the last ten years, partly because of thecountry's economic difficulties. Thus, a strategy for the control and elimination ofdisparities will require the establishment of a good research and information basewithin the education ministries, at the university, or elsewhere.

Educational Provision at the Primary and Secondary Levels 101
Repetition and EfficiencyPupils are allowed to repeat a grade if they are young enough, if their repeating
will not prevent the access of a nonrepeater, and if the school head judges that theywill profit by repeating. Because of automatic promotion to the next class at the endof grades 1, 2, 3, 5, and 6, only a small proportion of pupils repeats these grades. Therepetition rate in grades 1, 2, 3, and 5 is approximately 0.3 percent and has notchanged substantially since the mid-1970s (table 9.9). The rate icz somewhat higherin grade 6, where most of the repeaters are pupils who have already completed theprimary cycle. They repeat grade 6 either because there is no room for them to repeatin grade 7, or because they are considered to have a better chance of eventual succssin the se mdary selection examination if they repeat grade 6.
Table L'.n Repetition Rates, 1975-83(number of repeaters as a percentage of the preceding year's enrollment)
Grade 1975 1976 1977 1978 1979 1980 1981 1982 1983
Grade 1 0.47 0.32 0.26 0.29 0.29 0.24 0.24 0.27 0.33Grade 4 3.43 2.70 2.40 2.40 2.39 2.41 2.14 1.87 1.73Grade 6 1.35 1.11 0.87 0.87 1.26 1.43 1.12 0.92 1.09Grade 7 8.89 8.24 5.80 3.93 7.13 9.49 6.44 5.31 7.91Grades 1-7 2.09 1.80 1.36 1.18 1.63 1.94 1.51 1.29 1.63
Grade 10a n.a. n.a. n.a. 4.64 4.74 4.01 3.68 4.53 5.79
n.a. = not availablea. In 1975-83 students took the junior secondary school leaving examination at theend of grade 10.Sources: Education ministries (1975-1981), Educational Statistics; Ministry ofGeneral Education and Culture unpublished data.
The highest rates of repetition occur in grades 4 and 7. In response to the socialdemand for more secondary education, the proportion of grade 7 repeaters has beenrising somewhat, from 6.6 percent in 1975-78 to 7.2 percent in 1979-83, although dueto underestimation by the schools, the current rate is probably closer to 10 percent.
The actual number who repeat a year, at all points of the primary system, is nowabout 20,000. This clearly represents a considerable waste of resources. It is alsoinequitable when significant numbers of children have no access to schooling orcannot remain in the system for more than four years. The number who repeatgrade 7 exceeds the number who cannot proceed from grade 4 to grade 5; hence, inpurely numerical terms, the problem of the grade 4 to 5 bottleneck could be solved bydevoting to it the resources that are used for grade 7 repeaters. Repeaters, especiallyat the grade 7 level, also increase the already large size of classes, even thoughschool heads are not supposed to allow repetition in classes that are already full.This is especially true of urban schools, where the repetition rates in grade 7 tend tobe higher than in rural areas.

102 Education in a Declining Economy: The Case ofZambia, 1975-85
No data are collected on the number of pupils who voluntarily leave the system orare withdrawn. Estimates cannot be obtained from enrollment data because of datainconsistencies between years. The greatest anomaly is that as it progressesthrough the system, a cohort often grows in a way that cannot be explained byrepetition data. One reason is the practice of allowing new pupils to enroll orvoluntary drop-outs from earlier years to reenter the system after enrollment datahave been returned to the ministry.
Given the high social value pla..:ed on education, the number of voluntary drop-outs is probably very small, but this matter deserves investigation, especially inschools that serve vulnerable population groups, in high density urban areas, andamong certain rural communities. Some years ago, a survey found thatparticipation in the shanty town areas of Lusaka was some 50 percent, while in thelow-density, prosperous areas of the city it was over 90 percent (ILO/JASPA 1977).Reports from the Eastern region also speak of low school participation rates, withchildren being withdrawn from school for social and cultural reasons.
The absence of information on drop-outs at points other than on completion ofgrades 4 and 7 and the discrepancies in the information available mean thatconstructing cohort analyses that would give a clear picture of the flow of pupilsthrough the system is impossible. However, applying Wolff's (1984, p. 15) formulato the data that are available, we can calculate the number of school years requiredto produce a grade 7 graduate. The 1975-78 cohort, wha began grade 1 in 1969-72, took8.1 school years to graduate from grade 7, while the 1980-83 cohort, who enteredprimary school in 1974-77, took 7.4 years. This latter figure is lower than any ofthose Wolff quotes for countries in East Africa. It shows that the internal efficiencyof Zambia's primary education system, as measured in this way, is quite high andis becoming higher.
The pressure to repeat grade 7 will remain, however, so long as the followingconditions endure:
the learning conditions and quality of provision in primary schools remainlow;the curriculum taught in primary schocis bears little relationship to lifeoutside school;the evaluation of what pupils have accomplished in primary school is based ona formal examination that emphasizes the ritual, mechanical learning ofirrelevant material;the principal objective of primary school is perceived as preparing pupils foradmission to secondary;the number of grade 8 places is too small to absorb all grade 7 leavers.
The first three conditions can be altered by imaginative policies directed towardcurriculum and examination reform and with the enlightened and determined useof limited resources. Changing the fourth requires an ongoing exercise aimed ateducating not only the general public, but also political and even education leaders,but this exercise will fail unless steps are taken to change the first three conditionsat the same time. Resources do not exist to alter substantially the shortfall in grade8 provision. Whether they will prove ctdequate i the long term, 20 or more yearshence, cannot ')e answered at this juncture.

10The Quality of Education
The previous chapters considered how the allocation of public funds foreducation changed with the onset of the economic recession in 1975, the adjustmentsmade in raising resources from nongovernmental and foreign sources, and theway expansions and quantitative developments took place at the primary andsecondary levels. But what about the kind of education that was being offered? Did itundergo any changes in objectives, structure, or content during the years followingthe recessioa? Did the activities of some of the main support areas for what goes onin the schools change? What issues occupied educators during this period? Whatwas the quality of educational provision like? This chapter will provide a broadoverview of the kind of education provided in the schools. It will then review thequality of the teaching and learning situation.
The Education ProvidedOn April 29, 1975, the Ministry of Education convened a group of educators,
mostly from within the ministry and from the university, to consider the need toreform Zambian education. They agreed on 22 points (Ministry of Education 1975),of which they considered the following to be the most important:
The system encourages young people to seek white collar employment to theexclusion of jobs requiring manual and technical skills.The system responds to society's reward system, thus encouraging socialstratification based on educational attainment and income. By concentratingon individual achievement, the education system is unable to inculcatecommitment to the development of the community and nation.The system is geared mainly to the passing of examinations withouttransmitting knowledge relevant to pupils' daily lives.The curriculum is too bookish and theoretical, with too little attention topractical skills.The system has relied too heavily on foreign cultural influences and hasdeprived itself to a great extent of Zambian culture and values.
Despite the great efforts that have gone into the educational reform exercise since1975, little real progress has been made in changing the nature and thrust of theeducation being provided in schools. Concerns similar to those expressed at the 1975
103

104 Education in a Declining Economy: The Cale of Zambia, 1975-85
meeting were reiterated a decade later:
In so far as there have been minimal curricular changes over the past 25
years, the education system is hardly any more relevant to the current needsof Zambia than it was in pre-independence days. It still prepares a fewindividuals through a mainly academic programme for a limited number ofexisting salaried employment opportunities, leaving a majority of school-leavers with none of the pre-requisite skills to participate in the local economyand no hope that their meagre qualifications will earn them a place in arapidly contracting labour market. The curriculum itself is knowledge-basedand provides few opportunities for independent thought or the developmentof adaptability. It is by default rather than design that the unemployed school-leaver is forced to use survival skills to consolidate his place in the socio-economic structure of the nation (Kelly and others 1986, pp. 82-3).
However, this severe critique must be tempered by the recognition thateducational reform is a slow, step by step process. The curriculum is developinggradually toward the incorporation of more practical and productive activitieAlthough these now form part of the curriculum at the primary and secondalevels, they have not yet been fully integrated into it, but have been tacked on asadditional subjects or extra activities. They still remain low priority areas, asillustrated by their omission from the process of selection for entry to both juniorand senior secondary school.
Although concern about the school-leaver problem is mounting, no seriousattempt has been made to orientate the curriculum toward developing the skills thatcould be relevant to entrepreneurship or to self-employment, but policymakers aregiving more thought to the need for such development, and this itself is a sign ofprogress. Moreover, the Self-Help Action Plan for Education (Ministry of HigherEducation and Ministry of General Education and Culture 1985; Ministry ofHigher Education 1987a) is helping to concentrate action so that curricula willrespond to the needs of the communities being served by the primary and, to asmaller extent, secondary schools. However, education in Zambia has a long wayto go before it becomes less bookish, before examinations cease to dominate thewhole teaching process, before schools foster pride in Zambia's cultural heritage,before education is brought into close contact with the world of work, and before themonopoly of formal education is broken in favor of a more liberal sharing ofresources with nonformal approaches to educational provision (see Ministry ofEducation 1977, p. v).
The relationship between the economic decline and the efforts to define andoperPtionalize the objectives of education is complex. At one level, the reduced levelof msot ... es may have suppressed the process of innovation. The shock caused bythe wit:t spread decline of resources appears to have induced a lager mentality, withreal curriculum development being replaced by a holding operation that aimed atthe redefinition and cautious development of existing structures, processes, andcontent, but which drew back from anything more ambitious. The demoralizationmany felt due to "the rise and fall of the (education) reform movements (Clarke1979) reinforced this retreat behind the barriers of familiar endeavors. At anotherlevel the financial reductions, which should have crippled educational activity andsuppressed quantitative expansion but did not do so, served to stimulate muchthought about the direction education should be taking. Educational analysts, inZambia and in the aid agencies, turned their attention with increasing frequency tothe effectiveness with which limited resources were being used, the justice ofallocating so large a proportion of them to meeting the educational needs of a

The Quality of Education 105
limited few, and the action needed to offer a more worthwhile and relevanteducation to participants within the limits of available funds.
In an ironic way, the economic decline served as the leaven that gave rise toconcern about the quality and rr'evance of education. That concern is still workingits way out in ideas, proposals, and plans and has not yet had time to have an impacton the education provided in the schools. Thus, despite all the hardships it entailed,the economic decline may have stimulated efforts to transform education inZambia into a more potent instrument of individual and national development.
School Quality in ZambiaEvaluating educational quality is very difficult because there is no agreed
measure of school quality. A considerable service has been done by Fuller (1985),who points to the need to consider school inputs, school and classroom managementpractices, and student performance as components of the quality of a school. Hiscomprehensive survey of findings from developing countries breaks down featuresof education systems into three categories: those found to be related to studentachievement in an impressively large number of investigations; those found to berelated to student achievement but with the evidence coming from relatively fewstudies; and those where the research evidence about a relationship to achievementis mixed. The following pages examine Fuller's findings where they are relevantto Zambia to determine whether, based on his findings, educational provision inrecent years has improved or deteriorated.
Category I: Factors Consistently and Frequently Related to StudentAchievementThe first category of factors are those found to be consistently and frequently
related to student achievement. Consistent is interpreted as meaning in more thanhalf the cases reported, and frequent as meaning in more than five analyses.
There is a positive relationship between school expenditures per pupil andachievement (effect found in 6 out of 11 analyses). Zambia's action during theyears of crisis has been to reduce per capita spending at both the primary andsecondary levels.The greater availability and use of instructional materials raises the qualityof learning activities and boosts student achievement (effect found in 14 out of22 analyses). In Zambia, the availability of textbooks has declined steadily,the availability of writing materials is not assured, and most schooladministrators agree that the situation is worse now than in the past.The presence and active use of a school library boosts reading achievement(effect found in 15 out of 18 analyses). Libraries are almost nonexistent inZambian primary schools. At the secondary level, almost 70 percent of theschools had libraries in 1979, three-quarters of these being purpose built withseating for 40 to 50 users. School libraries had an average of one to threethousand books, or approximately three times as many books as students, butmany of the books were outdated. Schools recognized their indebtedness forbooks to donors such as the British Council or the United States InformationService, but remained conscious of the inadequacy of their stock, especially ofgraded fiction, African fiction, and science, mathematics, and civics books(Rigg 1980). (Rigg used the term graded fiction for children's versions of

106 Education in a Declining Economy: The Caw of Zambia, 1975.85
standard boolo, where the narrative develops within a well-controlledvocabulary and simple grammatical constructions are used. They aregraded because different levels of difficulty are available.)The teachers' years of postsecondary instruction and teacher training willboost teaching skills and lead to higher student achievement (effect found in21 out of 30 analyses). Since 1975, the proportion of trained teachers irZambian primary schools has risen from 79.6 to 82.3 percent and insecondary schools from 86.6 to 97.3 percent.More hours or days of instrueion will increase achievement (effect found in11 out of 13 analyses). In 1963, the length of the weekly instructional programfor primary schools was 1,000 minutes for grades 1 and 2, 1,300 minutes forgrades 3 and 4, and 1,700 minutes for grades 5-8. Thus for the entire eight-year cycle, the average instructional time was 1,425 minutes per week, or1,386 per week if adjusted to a seven-year cycle (UNESCO 1964). In 1984,grades 1-4 had 1,050 minutes of classroom teaching each week, and grades 5-7had 1,600 minutes (Examinations Council 1984). Hence for the full primarycycle the average was 1,286 minutes of teaching per week. Thus, since 1963 thetime actually devoted to teaching has dropped almost 10 percent at the lowerprimary level and over 6 percent at the upper primary level (not taking intoaccount the reduction of the primary cycle from eight to seven years). Therehas also been a reduction at the secondary level: up to 1970, the weeklyinstructional program averaged 1,600 minutes (40 teaching periods of 40minutes each). In 1984, when physical education and production work wereexcluded, it ranged between 1,360 minutes (34 periods) and 1,440 (36 periods) ofactual classroom teaching.Teachers with more highly educated parents will possess greater languageproficiency and increase achievement (effect found in 7 out of 10 analyses).Candidates for admission to primary teacher training colleges in Zambiamust now have a full School Certifichte. Since the children of parents whothemselves had ',ad secondary or higher education are considerablyoverrepresented in secondary schools, an increase in the proportion ofteachers with more highly educated parents is likely.
Category II: Factors Consistently Related to Student Achieueme.%
The second category of factors are those found to have a consistent relationshipwith achievement, that is, the effect is observed in at least half the analyses, but thenumber of analyses is small, five or fewer.
The provision of desks will increase the opportunities to read and write,raising student achievement (effect found in 3 out of 3 analyses). Manyprimary schools in Zambia lack furniture and fittings. A SIDA-fundedprogram has been supplying desks to primary schools for several years, butmany more are needed.Radio and other instructional media efficiently rake student achievement(effect found in 3 out of 3 analyses). Zambia has an educational broadcastingservice that presents over 900 educational radio programs annually.However, the maintenance of radios and the supply of batteries continue topose problems.

The Quality of Education 107
Better physical facilities motivate students to learn (effect found in 2 out of 2analyses). "The information we have received from ohservation, discussionand reading leaves us in no doubt that most primary and seer .1dary schoolsin Zambia are in a state of physical decay" (Coombe and Lauvas 1984, p. 73).Malnutrition will lower school achievement (effect found in 5 out of 5analyses). "In a study of 3,699 primary school students and dropouts in r! lypt,health status was one of the strongest predictors of academic achievemaat"(Fuller 1985, p. 43). In Zambia "there has been a gene& deterioration of thenutrition situation with corresponding increases in morbidity and mortalityin both rural and urban areas" (UNICEF 1986, p. 58).In-servicl teacher training programs will raise the quality of instruction,lending to h!gher student achievement (effect found in 4 out of 5 analyses).One in-service college in Zambia train. s prmary school teachers, whileanother trains those that will work with handicapped children. In-servicetraining is provided for secondary teachers in several subject areas, andshort courses are available at the national, regional, and district levels tomeet special training needs. A more informal school-based system of in-service training is provided through resource centers and resource teachersand is now being extended.Teachers with greater verbal skills increase the quality of student andteacher interactions, thereby increasing achievement (effect found in 2 out of2 analyses). The only relevant action taken by Zambia has been to requirecandidates for teacher training to have an ordinary-level pass in Englishlanguage.The ass:gnment and evaluation of homeworh will boost learning (effec,found in 5 out of 7 analyses). No accurate information about the practice ofassigning homework in Zambia exists, but given the shortage of writingmaterials, the lack of suitable study facilities in most pupils' homes, and thelack of sclwol facilities for private study homework is probably notextensively assigned.Teachers who expect high achievement receive stronger commitment andbetty. performance from their pupils (effect found in 3 out of 3 analyses). Thisfactor has not been investigated in Zambia. However, most experts believethat girls' relatively low performance is partly due to the low levels ofexpectation of teachers and society.The more hours teachers spend in preparing for class, tI.e greater the qualityof instruction and the higher the achievement (effect found in 4 out of 5analyses). Again, concrete evidence is lacking for Zambia. However, theRadford report (UNESCO 1964) recommended that ter.chers should not teachtwo sessions a day sin(:e the eight-hour teaching day this entailed left no timefor private study or lesson preparation. Whilo precise figures are notavailable, available data suggest that more than half the primary teachersteach two sessions a day, that is, they spend a minimum of seven hours eachday actual teaching contact with pupils. Clearly this leaves them little timeto preparo their lessons and instructional materials.Student boarding will raise student motivation anq achievement (effect foundin 3 out of 4 analyses). The process of eliminating boarding is aireadyunderway in Zambia's urban areas. New rural secondary schools willcontinue to provide boarding facilities because of the low population density,

108 Education in a Declining Economy: The Cam of Zambia, 1975-85
but the basic education schools do riot accommodate boarders. The proportionof boarders in secondary schools has declined from 56.9 percent in 1979 to 48.3percent in 1985.
Category III: Factors that May or May Not Influen:e StudentAchievement
Fuller found mixed evidence about the relationship of other factors to studentachievement: some studies confirmed a relationship, but an almost equal numberfailed to do so. The principal factors of this nature, with relevant Zambiandevelopments, are briefly outlined here. These factors are important as some areregularly raised in considerations of educational quality, despite the lack of aconsistent relationship to achievement.
Higher overall expenditures (raised achievement in 2 analyses out of 5).Zambia has reduced its expenditures on education.School size beyond a critical threshold (reduced achievement in 4 analysesout of 9). Many Zambians have expressed dissatisfaction with the size ofschools. Several primary schools have enrollments well in excess of 1,500pupils, with those in grades 1 to 4 following a triple shift timetable and those ingrades 5 to 7 a double shift Rome secondary schools also enroll more than1,000 pupils, but here the teaching is always on a single shift basis. Almoqt tllsecondary schools in the rural areas are boarding schools, asubstantialnumber of which acconmodate 900 or more boarders. The Minis ofEducation has considerea the need to subdivide large schools into units of600or fewer pupils, but so far it has taken ro concrete steps to this end.More years of formal uchooling of teachers (raised achievement in 10analyses out of 28). Zambia has raised the formal admission requirement forprimary teacher training from completion of' junior secondary school tocompletion of senior secon3ary school.More experienced teachers (improved student performance in 10 analysas outof 23). Teachers reaching the pensionable age in Zambia are required toretire.Longer formal training of school heads (boosted achievemnt in 3 analysesout of 6). There are in-service programs of one term's duration for primaryschool heads, and Oa government is conRidering the establishment of longerprograms.Class size, with in normal range (had no effect on achievement in 16 out of 21analyses). The normal size in Fuller's analysis appears to lie in the range 15to 50. The official norm for Zambia is 40 in primary and junior secondaryclasses ar..t 35 in senior secondary. But primary school clac ses of 60 to 80pupils NI lg taught together in a classroom designed and furnished for 40 arequite common in urban areas, while junior secondary climes of 50 to 55pupils ere frequently encountered.The presence and use of science laboratories (had no efZect in 7 out of 11analyses). Kelly and others (1986, p. 345) recommended that science be taughtin multipurpose rooms using special portable science equipment.Higher teachers' salaries (had no effect in 9 out of 13 analyses).Teachers' greater punc:,.-..:ity (had no effect in 2 out of 2 analyses).
13'1

The Quality af Education 109
More active teaching and learning interactions in the classroom (had noeffect in 3 out of 3 analyses).More than one class shift per day (had no effect in 2 out of 3 analyses). Doublesession teaching has been a feature of school provision in Zambia since beforeindependence. Although the practice is regularly decried, if some form ofprimary education is to be made available to all children of eligible age, itmust be maintained and even extended.Repeating a grade (had no effect in 4 out of 5 analyses). If this were confirmedfor Zambia, it might help to reduce the pressure to allow repetitions in grade 7.
The foregoing analysis shows that Zambia's primary schools display very few ofthe characteristics that promote student achievement. The government is spendingvery much less per pupil than in the past. Schools do not have adequate stocks ofwriting materials or textbooks. There are no school libraries worth talking about.The amount of actual teaching time has been curtailed. Many of ail pupils sufferfrom malnutrition and hunger. They attend schools that are in a serious stets ofdisrepair and learn in classrooms that have not enough desks or furnishings.They are taught by teachers whose verbal proficiency may be superior to that of anearlier generation of teachers, but who are so heavily loaded with teaching dutiesthat they have no time left to prepare classes or to mark homework. Thus the qualityof education in the primary schools is low and, on the evidence, the situationcontinues to deteriorate. The Zambian government faces a daunting task in tryingto reverse this trend. It will succeed in doing so only if it recognizes the situation forwhat it really is, a major crisis that threatens to undermine all that the schools aretrying to achieve.
The evidence that has been presented shows that the position is not much better atthe secondary level, where there has been deterioration in a number of factors thatpromote student achievement. Notable among these have been a reduction in schoolexpenditures per pupil, a failure to provide adequate instructional materials andtextbooks, a decrease in the number of hours of instruction, and an inability tofurnish and maintain facilities properly. Thus, secondary school quality alsoappears to be low and to have deterirrated since 1975, though the effect may not be asserious as at the primary level.

11Curriculum Issues
This chapter examines some specific curriculum issues that have attractedattention since 1975, with the exception of production and practical subjects, whichhave already been discussed. The term curriculum refers to the body of knowledge,skills, attitudes, and values that a school's education system communicatesthrough its teaching, organization, and ethos. This body of knowledge is madeconcrete as specific disciplines. The syllabus refers to the content within thespecific disciplines, that is, the content taught witl.:.1 the bounds of single subjects.
Curriculum DevelopmentThe Examinations Council has the sole statutory authority to "formulate
syllabuses for examinations" (GRZ 1983). However, the Curriculum DevelopmentCentre (CDC) is responsible for developing curricula for all primary andsecondary schools, preschools, and preservice primary teacher training programs.The staff of the CDC rose from 30 professionals supported by eight administrativeand secretarial staff in 1975, to 46 professionals and 11 support staff in 1985.
In addition to developing curricula, the CDC staff are responsible for producing,evaluating, and revising course materials; and for providing orientation andInduction courses for teachers, school inspectors, college lecturers, and educationaladministrators. In the years immediately following the publication of the proposalsfoi sdacational reform (Ministry of Education 1977), the CDC devoted much of itstime to analyzing the report and reorganizing itself so as to conform more closely toits recommendations. One of these was that the CDC involve educators in the fieldmore closely in the process of developing curricula/syllabuses and teachingmaterials. In consequence, the CDC allocates much of its resources and time toworkshops and other training activities for teachers, inspectors, and educationofficers in such areas as resource material production, practical subjects, music,environmental science, and home economics.
All syllabuses developed by the CDC are passed to the Examinations Council forapproval. Once adopted by the council they are, in principle, passed to the Ministryof Education for use in the schools. However, the council has taken no at,ch actionon a large number of syllabuses that it approved. This was partly because severalyears passed between the formal establishment of' the Examinations Council as astatutory body in 1983 arid its full assumption of responsibilities. Only since the

Curriculum Issues 111
beginning of 1987 has the council been sufficiently organized to undertake these.The lack of action on approved syllabuses was also due to the inadequacy of
funds for the dissemination of the materials. The CDC has had long experience ofthis restriction on its work and noted that "some materials for ZambianLanguages, Social Studies and English which had been submitted (to theprinters)...as far back as 1976 had not yet been printed' (CDC 1982, p. 35). The CDCalso had regular exp rience of other financial problems: insufficient funds for thetravel expenses of staff and for running workshops and lack of suitable transport.As with other parts of the public sector, staff had been maintained in post and theirnumbers increased, but the government did not supply the necessary funds toenable these highly paid individuals to do their jobs. As a result, they were almostcompletely desk bound and were unable tc promote the frequent and steadyinteraction with field personnel that is essential for the effective production ofcurricular materials.
One outcome of this restriction of CDC staff to Lusaka is that the curriculumdevelopment process remains highly tentralized. This makes it difficult for theCDC to develop variations in curri:nlar materials so that they respond to thedifferent local needs, not only of the rural areas, but also of the deprivedcommunities in the urban shanty towns. Instead, in the mistaken belief thatequality implies uniformity, the same syllabuses and teacher materials, oftenbiased toward the middle and upper income urban sector, are used throughout thecountry. Zambia will require vision and courage to promote the development anduse of a more localized curriculum and syllabuses. The lack of finances does notin itself prevent this, but the form of operations that financial restrictions havehelped to entrench in the CDC render its occurrence somewhat =likely.
The Language of Instruction
In 1963, the Radford report recommended that despite difficulties, "a policydecision be made to introduce English as a universal medium of instruction fromthe beginning of schoding" (UNESCO 1964, p. 25). This was implemented in 1966.In 1976, the Ministry oi Education (1976a) proposed a return to the earlier practicewhereby a local language had been the medium of instruction during the first yearsof primary school. Few people opposed this proposal; nevertheless, it was rejected inthe final policy statement, which affirmed that "the present policy, whereby Englishis a medium of instruction from Grade 1, should continue" (Ministry of Education1977, p. 33). This same statement also acknowledged that "learning is best done inthe mother tongue" (p. 32), but for a variety of political and administrative reasonsthe government decided to retain English as the official medium of instruction,while allowing teachers some latitude to explain concepts in a local language.
The language issue is a difficult one in Zambia, which in colonial days even ledto bloodshed at times (Shana 1980). The large number of local languages is said bymany in society to preclude the adoption of any one of them as a national language,even though Bemba is the mother tongue of more than 36 percent of the population(CSO 1985b, p. 8) and more than half the people speak it. By ecntrast, only some 25percent of the population speak English, and then only under restrictedcircumstances (Ohanessian and Kashoki 1978). English is not the language mostpeople use for regular communication or social discourse. Formal businessdealings may be conducted in English, but it is nevertheless a second language formost people.

112 Education in a Declining Economy: The Case of Zambia, 197840
Those primary school pupils who do .'ot proceed to the secondary level havelimited use for their hard-won competenc) in English on leaving school. They maytreasure what they have learned in the hope of being able to use it eventually in theirwork, htxt they will have little occasion to use it in the course of everyday life.However, mastery of English is advantageous to those who continue their formaleducation or who find employment in the wage sector or as domestic servants. Inthis sense, the heavy insistence on the use of English in primary school means thatthe curriculum is heavily biased toward those who stay in school or find wageemployment. "The decision to use English has created social and economicinequalitie3, promoted elitism and made it convenient for political leaders topostpone questions about crucial language policies" (Chishimba 1980, p. 154).
At the same time the stress on learning English and on using it as a medium ofinstruction implies a denigration of local ianguages, which some of the educatedand political elites in Zambia consider to be insufficiently developed "in terms offunctionality, richness of vocabulary and social integration" (Ministry cfEducation 1977, p. 23) to serve as suitable vehicles for conveying educational andscientific concepts. The status of the local languages is flirther debased by thegeneral tendency to identify fluency in English with education. Even the primaryschool-leavers like to show that they are educated and hence "different" by usingEnglish (Hoppers 1980b, p. 733).
Studies have borne out that the policy of using English as the instructionalmedium has impaired learning in Zambia. Students' development ofcommunication, reading, and basic arithmetic skills have all been adverselyaffected (Sharma 1973; McAdam 1973; Africa 1980). Although the evidence fromsome other parts of the world on the scholastic effects of learning in a secondlanguage are somewhat ambiguPus (Dutcher 1982), that the educationaldevelo;iment of almost a generation of Zambia's children has been slowed down bythe English language policy seems clear.
English as a medium of instruction fails, therefore, on three counts:pedagogicallyit is unlikely to support good learning especially in thecritical early primary grades;sociallyit orientates the entire school process in a direction that only asmall percentage of pupils will follow;culturallyit undercuts the local languages and the values they embody.
Teachers in the field are, however, more realistic than some of the policies theyhave to implement, especially when their own language limitations compound theproblems posed by policy measures. Consequently, they have interpreted theauthorization to explain difficult concepts ` a one of the Zambian languages verybroadly. This is especially true in grades 1 through 4. A more enlightened view inthe Ministry of General Education and Culture tolerates the use in these grades ofany language, not necessarily one of the official seven, understood by the majorityof the enrollees. This attitude is further reinforced by a change in the policygoverning teachers' postings. Until recently, the policy was to post teachers to areasother than their home district. The intention was that this would promote nationalunity and deter the devllopment of a narrow tribalism or of local pressures thatmight interfere with teachers performing their duties. The policy was changed forthe following reasons:
unity concerns are less pressing now than they were earlier in Zambia'shistory;
13

Curriculum 113
teachers are likely to be better motivated if they can stay in their homedistrict;teachers are more likely to provide their own houses if they do not have torelocate. This change means that teachers will probably be familiar with thelocal language, which removes one of the reasons for using English as themain teaching language.
The steps now being taken both officially and unofficially suggest that the steamhas gone out of the movement supporting English as the medium of instruction.However, a formal repudiation of the policy may not materialize for some timebecause of the resources that have been invested in using English for instruction,particularly for the production of instructional materials. The resources to producecomparable materials in the official local languages do not exist. Thus, for severalyears tn come, the situation in the primary schools is likely to be that a locallanguage is used as the mee'um of verbal instruction, but with heavy reliance onEnglish language materials, when available.
Political EducationAn issue that attracted much attention during the decade under review was the
proposal to introduce political education into the curricula of all educationalinstitutions (Ministry of Education 1976a), The ideology to be embraced would beZambian humanism, but the strong socialist tone of the draft statement oneducational reform led to fears that the proposed reforms were designed to foster aleft-wing socialist mentality and state. At the same time, the public interpreted theproposal's failure to refer to religious values as meaning that religious educationwould be scrapped. In response to these concerns the final document was modified taeliminate the socialist tone, and political education was retained to promote "anunderstanding of Zambian humanism, Zambian political institutions and theirfunctions; social studies; cultural and economic development" (Ministry ofEducation 1977, p. 17). The document also referred to spiritual and moraleducation, which should "be concerned with the importance of appreciatingspiritual, religious and moral values" (Ministry of Education 1977, p. 17). Theseprovisions appeared to satisfy the public.
To translate the proposals on the introduction of political education into practice,the CDC prepared suitable syllabuses and submitted them to both the Ministry ofEducation and the ruling United National Independence Party (UNIP). Noreaction was received from either. Instead, UNIP took active steps of its own. Theparty sent several individuals to Eastern bloc countries for training in politicaleducation and on their return had them posted to primary and secondary teachertraining institutions. Here they taught a compulsory course using a syllabusprepared by party ideologues that was biased towari scientific socialism(dialectical Marxist-Leninism).
At the same time political leaders made increasingly frequent references toscientific socialism and stated that they intended to introduce its teaching in alleducational institutions. This drew a sharp reaction from the churches, whichcategorically rejected both the philosophy of scientific socialism and the proposal togive it prominence in the school curriculum (Christian Churches 1979). Theresulting controversy culminated in 1982, when President Kaunda invited churchleaders to a seminar on humanism and development. In his address, the presidentassured church leaders that scientific socialism would not replace religious
114 Education in a Declining Economy: The CaH of Zambia, 197545
education, and that no decision had been made to adopt a Marxist ideology for the
state (Kaunda 1982). The reaction of his audience was a spirited and unanimousendorsement of the Zambian form of humanism and an equally spirited andunanimous rejection of scientific socialism, both as an ideology and as a schoolsubject.
The church leaders informed their members of' the seminar's outcome andreiterated their opposition to the direction political thinking was taking (ChristianChurches 1982; United Church of Zambia 1982). The debate continued for some time,
but ended later in the year when President Kaunda, recognizing the divisiveness it
was arousing, banned all further discussion of the subject. However, since then thepolitical education course has continued in teacher training institutions, where it
appears to be accepted more in a spirit of patient tolerance than of alarm. Thepolitical education syllabus is not mentioned in CDC reports, but a syllabus onmoral and spiritual education has been approved and has been introducedthroughout the school system with a full range of specially prepared and availabletexts.
Population EducationDespite the way in which population growth has outstripped economic growth,
leading to a sharp decline in real incomes and in the standard of living, Zambiadoes not have a population policy. However, in recent years the government hasrealized that to achieve social and economic development, the population growthrate must be slowed down. One way of achieving this is by developing publicawareness of the relationship between the size of the population and (a) theavailability of resources, and (b) the quality of life. Tht. government did not focuson this issue until the 1980s, but by 1985, the authorities decreed that populationeducation should form part of the curriculum of schools and colleges.
The introduction of this area of learning is still getting underway. Theintention is to teach population not as a separate discipline, but within theframework of three conventional subjects: social studies, science, and homeeconomics. Instructional materials have been prepared for use on a pilot basis,resource staff have been identified, and professional staff have been trained. Theprogram's objective is primarily to heighten awareness about the dimensions of theproblem and acceptable methods to control it.
Mathematics and Science EducationPossibly the single greatest area of concern within the school curriculum is
mathematics and science. Later chapters will cover the dismal performance inthese areas in public examinations and the shortage of qualified teachers, while theresponse of the aid agencies has already been noted. While the evidence thatstudent performance was worse in 1985 than in 1975 is not clear, at least by 1985 theauthorities had acknowledged that this was a special problem requiring a specialsolution. As with population, Educational &form (Ministry of Education 1977)made no specific mention of this issue. The report dealt in depth with technicaleducation and vocational training, but without any indication that the authors wereaware of the fundamental problem of grave weaknesses in the learning (andteaching) of mathematics and science at the primary and secondary levels.
Any hopes of improving performance as the school system expanded weredashed by ',he rundown of material inputs, the growth of many classes to

Curriculum Issue.a 115
unmanageable size, the increasing lack of qualified personnel, and someuncertainty about the most appropriate syllabus. A recent decision requires allstudents to study mathematics, and two syllabuses are available: one for ordinarystudents and one for weak students. For science, the shortage of suppLes andmaterials has become so acute that a special written paper has been designed toreplace the practical examination at school certificate level. The result is thatstudents may pass their science examinations successfully, but without everhaving had the opportunity to handle, possibly even to see, normal pieces ofapparatus or to develop laboratory skills. This situation has deterioratedconsiderably during the years of economic difficulty.
However, as noted when considering the interventions supported by technicalassistance, the fundamental problem is not the deterioration that occurred duringthe period of economic difficulty. The iifficulties with mathematics and scienceexisted when the economy was booming. Hence the real question is not about anybacksliding since 1975. It is why the general level of performance in mathematicsand science has always been so low. Unless the fundamental problems areaddressed, any improvements will be merely cosmetic and transient.
It is not easy to know where to start, but one course of action and two lines ofinquiry suggest themselves. The action is to give high priority to mathematics andscience education. A beginning has been made along these lines with theestablishment in 1982 of the Ministry of Higher Education and its mandate todevelop mathematics and science education in the secondary schools. But this is notenough. The problem may originate long before secondary school, and thisapproach would not affect all those children that never go on to secondary school.Much more comprehensive action is needed to improve mathematics and scienceeducation across the board.
The lines of inquiry that the education authorities might profitably follow up areboth in the field of primary education and have been suggested already in thesection about foreign aid. First, how has learning mathematical and scientificconcepts in a foreign language affected children's grasp, development, and use ofthese subjects? Second, how effective is the training primary school teachers receiveto teach mathematical and scientific concepts, techniques, and procedures in alanguage that is not their own to a pupil who has difficulty in handling thelanguage of communication? Investigations of this kind might be addressed in thefirst instance to the teaching and learning of mathematics, which is the more basicclassroom subject. Every primary school teacher must be able to teach thefundamentals of mathematics, and every child must be helped to learn andunderstand these fundamentals. Progress in learning science lepends greatly onprior progress in acquiring some competence in simple mathematics, Hence thedesirability of recognizing how serious is the mathematics learning problem inZambian primary schools and of a determined commitment to apply skilledmanpower, domestic resources, and technical assistance from abroad to itssolution.

12Evaluating Educational Performance
The first public examinations in Zambia were held in 1928. since that yearminatilns have assumed increasing importance. Today they dominate the
whole field of education. This chapter will consider three aspects of examinationsin Zambia during the period 1975-85: the examination reforms considered orinitiated; changes in administering and managing examinations; andexamthation performance. The latter will be used as a proxy for educationalachievement and will provide some information on how the shortages of financesand materials have affected the academic performance of schools and pupils.
Examination Reforms, 1975 to 1985
As part of the educational reform exercise in the mid-1970s, the Ministry ofEducation issued a critique of examinations (Sharma 1975). The critique outlinedthe system's shortcomings and proposed improvements. Much of this document wassubsequently included in the draft statement on educational reform (Ministry ofEducation 1976a). Essentially the proposals were as follows:
that the certification and selection functions of examinations be separated,thereby enabling examinations to support rather than subvert educationalobjectives;that a measure of continuous assessment, which would count toward theoverall evaluation of a student, be introduced quickly in all educationalinstitutions;that selection for successive levels of education be based not only on academicperformance, but also on commitment to humanism;that a system of guidance be established whereby "educational institutionswould accept a collective responsibility for the welfare of each of theirmembers as students, members of families and members of the community"(Ministry of Education 1976a, p. 71);that performance in the education system be stimulated by the introduction of"emulation," an organized .nethod of group competition that spursparticipants on to greater effort and achievement for the collective good
116

Evaluating Educational Performance 117
During the subsequent national debate, the public expressed anxiety aboutcertain elements of these proposals, much of it based on misinterpretation of theoriginal document. But another factor was undoubtedly the way the documentproposed speedy implementation without careful analysis of the implications andcosts. The public rejected the proposal that selection for higher levels of educationshould depend in any way on political attitudes or known commitment tohumanism, and stressed that care was needed in the introrluction and practice ofany system of continuous assessment. The public also expressed doubt about theapplicability of emulation as an assessment device. However, aside from thesemisgivings, the public's reaction to the critique of examinations and the proposalsfor reform was generally favorable.
The final reform document (Ministry of Education 1977) did ntH however,preserve all the proposals in a clear-cut manner. It defended the need for a singleexamination that would be used to certify past achievement and to select for the nexteducational level. It also described at some length the problems associated withcontinuous assessment, and warned that this technique should not be introducedindiscriminately in the terminal certification and assessment examinations. Itdid not, however, completely rule out school-based assessment, and even called forit in practical subjects and in determining borderline cases. The documentdiscussed at some length the use of examinations for evaluation and for theeducational guidance of students. It clearly envisaged some system of feedbackthat would enahle the learning situation to benefit and change in response tofindings from examinations. But so much of the final document was devoted toclearing up misconceptions and allaying misgivings that it concerned itself withno more than the general principles of educational assessment and some blandexpressions of how these could be translated into practice.
Virtually no further reflection on the need for fundamental examination reformtook place until the Education Reform Implementation Project report was submittedin July 1986 (Kelly and others 1986, chapter 22). The report's proposals were based ontwo premises: that examinations would continue at the end of grades 7, 9, and 12;and that the administrative, allocative function of examinations would be clearlysubordinated to their educational functions. The latter were described in terms ofexaminations promoting skills and knowledge relevant to the real needs of thecandidates for whom that level of school would be terminal, testing whether theyhad attained agreed competency levels in certain basic areas, and providingfeedback to schools that would reveal those aspects of the teaching-learningsituation most in need of special attention.
The proposals were clearly influenced by Somerset's (1982) work in Kenya,although they went beyond Somerset's ideas in proposing a more extendedintroduction of continuous assessment in a system of total assessment that wouldhave three components: the results of external examinations; teachers'assessments of work in the classroom; and the results of special attainment tests,developed centrally, but administered, marked, and moderated locally.
The document provided no information on the likely cost of the proposedreforms, but it noted that in the absence of sufficient qualified persons in Zambia toundertake the necessary tasks, help from abroad might be necessary in such areasas developing an examination feedback system, suitable attainment tests, andappropriate examination materials; and training teachers and others incontinuous assessment techniques.

118 Education in a Declining Economy: The Case ofZambia, 1975-85
The Administration and Management of Examinations, 1975 to 1985
The two most significant developments in the management and administrationof examinations during the decade under review were the progressive transfer ofresponsibility for the school certificate examination to local control and theestablishment of the Zambia Examinations Council.
Zambia's first school certificate examination was held in 1946 under theauspices of the University of Cambridge Examinations Syndicate. From then on,except for 1964, the examinations that terminated the secondary school cyclecontinued to be set and marked in Cambridge. The examinations were based onsyllabuses issued by the examining authority, and took some account of the needs ofuser countries by including relevant topics and in particular, by adapting thehistory, geography, and biology syllabuses. But Zambia felt the need, as did othernewly independent countries, to take responsibility for this important examinationinto its own hands so that it might control what was taught during the last years ofsecondary education more effectively. The authorities at, the Cambridge Syndicateconcurred with these views.
In 1975, the cabinet decided that the school certificate examination should belocalized by 1980. Thereafter, the Ministry of Education developed a program ofaction (Ministry of Education 1976b) to implement this decision. The programrequired the preparation of a suitable curriculum, syllabuses, and regulations; andthe training of examination administrators, chief examiners, question writers,and markers.
Achieving all this within the space of four years was an ambitious undertaking,and one that did not prove possible. Many of the administrative aspects of theexamination were brought progressively under local control to the extent that from1981 on, the school certificate was issued wholly by Zambia. At the same time, thegovernment undertook an extended program for training examination setters andmarkers. By mid-1986 almost 800 such persons had been trained in varioussubjects. Zambia has borne most of the costs of these training sessions, but theBritish government and the Cambridge Examinations Syndicate have alsoprovided financial assistance.
The current position is that papers in the principal subjects are set locally, but aremonitored by chief examiners of the Cambridge Syndicate. The examinationscripts are marked locally, but a selection is also marked in Cambridge. somemoderating of results is also carried out in Cambridge, while the setting ofstandards and establishment of passing grades is coaducted in Cambridge incollaboration with Zambian officials. Much of the routine administrationgoverning entry procedures and the issue of results is conducted in Zambia, but allglAestion papers are dispatched from Cambridge.
The delay in localizing the school certificate examination was not caused byfinancial constraints. Although these were serious, they did not obstruct thetraining of Zambian personnel locally or abroad, or the takeover of examinationfunctions in Zambia. What the government had underestimated was thecomplexity of the entire examination process and the time and resources needed todevelop new syllabuses, to familiarize teachers with their content, and to producethe necessary teaching materials. So far the syllabus for religious education is theonly one with all the supporting teaching materials that has been fully developedlocally and approved for use in schools. The delay in producing syllabuses isindicative of the weakness in the support services for the education ministries, thedelays in getting the Examinations Council fully functional, and the scarcity offunds for printing and distributing the syllabuses that have been prepared.
Li

Evaluating Educational Performance 119
In 1983, the government created the Examinations Council of Zambia. Thisbody, which is only gradually becoming fully operational, is responsible for allmatters relating to examinations: approving syllabuses, conductingexaminations, and awarding certificates. It is also required to conduct researchinto examinations, but has not yet been able to undertake this task. Becauseexaminations influence so much that goes on in schools, the Examinations Councilmust be able to ensure that the various public examinations are technically sound,well administered, and educationally supportive. If it is to pursue these aims, thecouncil will need considerably more resources than it is currently getting.
Performance in Examinations, 1975 to 1985As might have been expected, the picture of examination performance during the
period of economic hardship is very mixed. Genera/1y, performance, asmanifested by overall success rates, was poor throughout the decade and there was aslight tendency for it to become poorer. But before substantiating this statement, letus note certain features of educational provision in the years since 1975:
The number of children taking examinations increased enormously. Evenunder optimal conditions, this increase would lower overall attainment,since larger numbers imply a spread over a wider range of ability. "In somesenses more means worse in the course of rapid educational expansion"(Williams 1986, p. 96).The increase in the number of pupils was not matched by any correspondingincrease in the number of classrooms or teachers. Hence, classrooms becameovercrowded and the amount of personal attention that teachers could give toeach child was reduced.The availability of teaching materials declined fairly steadily throughout thedecade, either because of a lack of funds or because of the unavailability ofneeded items.The composition of the teaching force changed at both the primary andsecondary levels. At the primary level, the proportion of better qualifiedteachers w;cs larger at the end of the decade than at the start. At the secondarylevel, the proportion of graduate teachers declined steadily, but the teachingforce and the school administration became more Zambian.
Apart from the improvement in the quality of teachers at the primary level andfrom the benefits arising from having a larger proportion of Zambian staff, thesefeatures probably contributed to deterioration in examination performance.
The Grade 7 Primary School ExaminationThe decisions about which pupils proceed to secondary school are based
exclusively on the results of the grade 7 examination in six papers: English, socialstudies, mathematics, science, Special Paper I (verbal and numerical reasoning),and Special Paper II (spatial reasoning). The examinations are all of the pencil-and-paper objective type. They are computer marked and for selection purposes thescores on the six papers are standardized, each to a mean of 100 and standarddeviation of 15. The unweighted combination of the standard scores from the sixpapers constitutes a candidate's selection examination score. The minimum scorethat pupils must obtain to secure admission to secondary school determines the

120 Education in a Declining Economy: The Case of Zambia, 1975.85
cutoff point. This is fixed by reference to the number of secondary school places in
grade 8, with account being taken of whether these are in boarding or day schools
and whether, in boarding schools, they are for boys or girls. Account is also taken ofthe number of secondary school places in each of the country's nine regions. Theresult is that there is a national cutoff point and separate cutoffs for the sexes and for
the regions.Note that although end of year examinations are also held in Zimbian
languages, and some form of' testing occurs in practical subjects, the results of theseexaminations are not taken into account in the selection procedure, but are used forcertification purposes only. Despite public affirmation of the importance ofpreserving Zambia's cultural heritage and of practical activities in schools, themessage that is communicated to pupils and their parents is that these areas are lessimportant than bookish, academic topics because it is only the latter that contributeto the vital decisions about who is to go on to secondary school.
Considerable care is exercised in designing and setting the grade 7 papers.Special panels consisting of school inspectors, personnel from the teacher trainingcolleges, and senior teachers prepare the questions. Another panel reviews thequestions. A selection of those deemed suitable is used in a pilot test, and the resultsare carefully analyzed. The questions for the national examination are thenselected. The format of the examination has remained unchanged since the early1970s. Despite the financial problems, the logistics of printing, administering, andmarking the examination have been attended to successfully each year. Althoughthe printing costs alone had risen to over K777,000 by 1985, funds to meet these costshave never been lacking. At times, allegations of malpractice in theadministration and supervision of the examinations have surfaced, andsometimes the results from certain schools haw, "1,9.d to be nullified (and on at leastone occasion, from an entire educational region). Basically, however, theexamination is administered carefully and conducted honestly.
The great weakmas of this examination is that it pays more attention to whatpupils can remember than to what they can do or how well they can reason.Moreover, the questions are not overly concerned with experiences or situations thatare directly relevant to rural life or to life in the high density areas where most ofthe urban children live. No real attempt is made to probe whether pupils havegrasped important concepts. In addition, no questions are set that require essays orconstructive writing, so that a whole broad area of literacy skills is not assessed.
An examination of this type clearly promotes very bookish and superficialknowledge. It stimulates a type of teaching that emphasizes drilling pupils infactual knowledge and that promotes passive acceptance and reproduction ofinformation as the ideal. It does not encourage teachers to set about developing intheir pupils the ability to think independently and flexibly and to "find theirbearings among problems as they arise' (United National Independence Party1985). The encouragement that this type of examination gives to rote learning ofwhat is frequently trivial, irrelevant, and sometimes worthless information, hasserious consequences in the later life of the pupil.
The 75 percent of children who leave school at this stage are not adequatelyequipped with literacy, numeracy, and practical skills, or with the knowledge tosupport their attempts to find a place in the adult world. The minority who proceed tosecondary school have a poor foundation on which to base their future learning.They are weak in the use of language; they are limited in their ability to deal withconcepts in science, social studies, and mathematics; they frequently find themechanical aspects of writing difficult; and they are slow and uncertain in

Evaluating Educational Performance 121
dealing with simple numerical computations. In addition, they enter secondaryschool armed with the conviction that teaching consists of the teacher talking andgiving notes and that learning is the student's ability to regurgitate what the teacherhas provided. Quite understandably such secondary school students tend to performat a mediocre level, both in school examinations and later at the tertiary level.
While laying the blame for everything at the door of the primary schoolexamination system is excessive, it would nonetheless be legitimate to ask whethersome of the lack of initiative, flexibility, organizational ability, and analyticcompetence widespread among Zambia's middle and lower-level managementmight not be due in part to the unimaginative methodology of primary schoolteaching that has developed in response to the demands of a wholly unsuitableexamination.
Performance in the Grade 7 ExaminationDespite the unsatisfactory nature of the grade 7 examination, it is worth
determining whether performance has varied as a function of the economicsituation, and in particular, whether performance has been affected by the reducedavailability of teaching materials. This is an important practical question, sinceat least one aid agency proposes to use grade 7 examination performance as anindex for measuring the success, in learning terms, of its support for the supply anddistribution of educational materials (FINNIDA 1984).
To examine performance we must review the raw scores in the variousexamination subjects over a period of time. Data are available for seven of theyears in the period 1977-86. Unfortunately, tapes containing the data for 1978, 1980,and 1983 are no longer available in usable form. Note that because we are dealingwith scores coming from more than 100,000 candidates, even small differences canemerge as statistically significant. In most of the cases that will be discussed, avariation of 0.1 in mean values will indicate a difference significant beyond the 5percent level. While such differences are interesting, it is more instructive toconsider the trend in performance as it has manifested itself over the years than toconcentrate on small annual differences.
Table 12.1 shows the means of the raw scores for the six selection subjects foreach of the seven years available. Clearly, performance in 1984 and 1985 was not upto the same level as in previous years. Across all seven years, the lowest meanscores in English, mathematics, and Special Paper I were obtained in 1984, whilethe lowest scores in the remaining three subjects, social studies, science, andSpecial Paper II, were obtained in 1985 (although this year had the hi3hest meanscore in English). The highest mean scores in social studies, mathematics,science, and Special Paper II were all obtained in 1977. For the years in between,1982 seems to approximate more closely to the pattern of 1984 and 1985, whereas 1979and 1981 seem to belong more closely with 1977. This is seen more clearly byconsidering the rank order of the means across years. If these ranks areconsidered as weights and summed, they show that 1977-1981 stand together assuperior in overall performance to 1982-1985. A remarkable upturn, however,appears in 1986, with performance being slightly superior to that of 1977.
The foot of table 12.1 shows the years when those taking the grade 7 examinationwould have entered grade 1. Clearly the 1971 cohort, which completed in 1977, wouldhave passed through primary school before the worst effects of the financialdifficulties were felt. Those who entered grade 1 in 1973 and 1975 certainly passed

Table 12.1 Secondary Selection Examination, Means of Raw Scores, 1977-86
P. Mam
1977
Number of
Camiciaia Moos
1979
Number of
Catadates Meat
1981
Number of
Camickaa Mom
1982
Numb a? of
Coadisiroat MM.
1984
Millsbil of
amdiciotas Meat
1985
Mather of
&Midas: Meat
1986
Number of
Candidass
Esiliolt
Boys 383 76,815 38.6 117,204 405 94256 373 93,547 37.2 103,191 41.4 107,820 38.6 104,906
Girls 34.6 43,730 35.4 52,095 36.2 55,318 33.5 57,825 33.2 66,601 38.0 70,667 35.3 71,767
Both saes 36.9 120,545 37.4 139,209 38.9 146,574 35.9 151,372 35.6 169,692 40.0 178,487 37.3 176,673
Social Sesofee
Boys 33.7 76,815 27.9 87,203 30.9 91.221 28.5 93,520 29.9 103,187 25.6 107,813 30.7 104,903
Girls 283 43,730 22.7 52,090 25.0 55,288 23.4 57,791 24.3 66,498 21.5 70,660 26.3 71,758
Both sores 31.8 120,545 26.0 139,293 28.7 146,509 26.6 151,311 27.7 169,685 24.0 178,473 28.9 176,661
Modtemotia
Boys 40.7 76,815 35.8 87,211 38.0 91,248 38.8 93,538 35.8 103,197 36.0 107,782 40.3 104,884
Girls 36.4 43330 31.0 52,087 32.5 55,321 33.3 57,841 30.2 66,482 31.8 70,652 35.9 71,744
Both sexes 39.2 120,545 34.0 139,298 35.9 146.569 36.7 151,379 33.6 169,679 34.3 178,434 385 176.628
SCA47101
Boys 32.9 76,815 30.5 87,203 31.6 91,246 27.0 93,521 29.1 103,192 25.2 107,779 32.1 104.878
Girls 27.6 43,730 25.7 52,085 26.1 55,320 23.5 57,820 24.3 66,477 22.2 70,648 27.4 71,739
Bah sales 31.0 120,545 28.7 139,288 29.5 146,566 25.7 151,341 27.2 169,669 24.0 178,427 30.2 176,617
Spacial Paper 1
Boys 34.4 75,473 34.9 86.567 36.1 90,604 34.8 93,430 34.1 102,891 35.3 107,513 361 104,632Girls 31.2 42,838 31.6 51,778 32.2 55,019 31.0 57,741 30.4 66,364 31.8 70566 33.f, 71,660Both sous 33.3 118,311 33.6 138,345 34.6 145,623 33.3 151,171 32.6 169,255 33.9 178,079 ? .8 176,292
Special Paper 11
Boys 38.9 75,473 37.1 86,542 37.2 90,552 33.4 93,450 3!.1 102.871 28.3 107,504 38.1 104,608Girls 35.8 42838 33.6 51,762 33.3 54,979 29.5 57,764 29.9 66,354 26.3 70,539 35.1 71,634Both sexes 37.8 118,311 35.8 138,304 15.7 145,531 11.9 1513i4 32.3 169,225 27.5 178,043 36.9 176,242
Year of enurialgrads 1 1971 1973 1975 1976 1978 1979 1980
Source: Educational. Systems, Ministry of Finance.
1,1

Evaluating Educational Performance 123
through the schools during the years of hardship, but possibly they were shelteredfrom the worst effects of the shortages by the continued availability in Pchools ofmaterials from earlier years. But there is a strong suggestion that thote wbentered grade 1 in later years were strongly affected by some circums4ances thatbrought about a deterioration in their performance by comparison with that ofearlier years. Data for the coming years will be needed to s'e whether theimprovement shown in 1986 is being maintained. It is too early to expect that thedistribution of textbookr), with FINNIDA aid, would have had any noVcelale effectsince these books were 'issued to schools only during 1986. But there is somepossibility that SIDA's intervention in making avai;able exercise books and deskshas contributed to the improved performance.
A remarkable feature of the grade 7 examination results is the consistency withwhich boys have pert Irmed better than girls. This holds true for all six papers, foreach of the years for which data is available, and for each of the nine educationalregions. Moreover, the differences are substantial, ranging from 1.5 to 7.2 points,with an average of 3.9 at the national level (table 12.1). The difference is greatest insocial studies (4.5 average) and mathematics (4.4 average) and least in the specialpapers (3.3 in each). This lower level of performance by girls affects the selectionfor secondary schools when it is necessary to take a lower cutoff point for girls.This ensures that girls go forward in sufficient numbers to secondary school andbeyond, but does not address the more fundamental issue of why girls perform sodifferently from boys. The pra:tice of admitting girls to secondary schools withgrades that would not warrant the admission of boys can enshrine expectations thatgirls cannot perform as well as boys. This is harmful to the self-image of girls.
Studies show that performance is frequently alated to expectations (Rosenthaland Jacobson 1966; Burns 1979). In a recent study in the Eastern Province ofZambia, Serpell (1987) found that primary school teachers appear to define the goalsof education differently ior b.lys and girls. They emphasized the acquisition ofliteracy and skills for the local economy for boys, whereas for girls, they viewed theprincipal benefit of primary education as the acquisition of skills and knowledgefor domestic use. These expectations and perceptions very likely derive fromassumptions about differential sex roles in society. Such assumptions are unlikelyto change, except very slowly and by means of increasing attention to the educationof girls and to their advancement to careers and occupations where hitherto theyhave been unrepresentAd. But whatever the origins of the problem, girls clearlyform a disadvantaged school group, both in 1. ns of numbers and in terms ofperformance.
A second remarkable feature of the grade 7 examination results is the way inwhich performance in the Copperbelt was notably below that of all other regions inalmost every subject: English, social studies, science, mathematics, and the verbalreasoning paper. The only subject in which the Copperbelt did not regularly havethe lowest score was in Special Paper II (spatial reasoning paper). As was the casewith differences between b. ys and girls, the size of the mean difference issubstantial: never less than 1.6 points below the national mean. A significant pointmay be that four of the subjects involved are ones in which regular classroomteaching takes place, while the one subject in which the Copperbelt was not the lowestperformer is one of the two ability papers in which no formal teaching is given(although there is undoubtedly some coaching). The Copperbelt is one of the regionsthat experiences tremendous population pressure on primary school facilities. In1984, Kitwe was able to enroll only 82.6 percent of the relevant age group and Ndo:a75.8 percent, while at the grade 1 level neither city was able to admit more than two-
1 4

12/a Education in a Declining Economy: The Case of Zambia, 1975.85
thirds of the eligible children. This pressure has lead to serious overcrowding inclassrooms. The Copperbelt is also the region with the longest history of double
sessions and the most extensive use of classrooms for triple shift purposes. Thesefactors may have combined to make the performance of the Copperbelt studentspoorer than that of students elsewhere in the country. Clearly it is a matter worthexamining in greater detail, since the implications for educational provision aregrave, especially when the school-aged population is increasing rapidly.
Performance in the Junior Secondary School Leaving Examination
Obtaining good data about performance in the junior secondary school leavingexaminations (the JSSLE) is difficult, whether by year or by subject. The markingof the examination is manual, for some 50,000 candidates in a wide variety of
subjects. The marking is also decentralized. There do not seem to be any centralrecords to show the characteristics of the raw scores. Examiners' reports refer toadjustments made to raw marks, but it is clear that these are made on animpressionistic basis (which, be it said, often draws on the fruit of long andvaluable experience). Students may take the examination after various modes ofstudy: as full-time students from secondary schools, as students enrolled with theNational Correspondence College (for evening class, correspondence, orsupervised study group work), or as private candidates. Except in isolatedinstances, the records do not disaggregate the results by mode of study; indeed, noconsolidated records are kept that would enable this information to be gathered.Thus, for any one year one has no way of knowing whether one is dealing with theresults from school candidates or with those that include external candidates of'various kinds. This uncertainty should be borne in mind when noting theperformance in this examination since 1975.
This being said, it would arpear that the passing rate in the JSSLE over the years1975-84 averaged 60.6 percent (table 12.2). The data that are available do not allowcomparisons to be made between the performance of boys and girls in recent years,but for the early period (1975-78) 68.7 percent of thA boys obtained full certificates,whereas the figure for girls was only 43,1 percent. This large difference has itsorigins, of course, in the difference in performance already noted in the grade 7examination and in the cutoff point for girls entering secondary school being lowerthan that for boys.
Because examiners' reports give information on adjusted marks only, littlemeaningful comment can be made on the year by year performance in individualsubjects. However, since 1980, the examiners have tended to speak about the morefrequent need to adjust the marks upward. Thus, the chief examiner in geographyremarked in 1980: "A considerable amount of moderation was necessary. This waspartly due to a lower standard of performance in this examination than in 1979."
The results of e.-ternal (nonschool) candidates are available for eight of the tenyears 1975-84. The records show that for these years only 10,005 candidates passedout of a total of 110,917, giving a pass rate of only 9.0 percent. Although someimprovement has occurred in recent years, clearly the pass rate of externalcandidates is low. The point is raised here because of the tremendous waste ofresources, including valuable teacher time for marking, involved in mounting anannual examination for up to 19,000 candidates, of whom fewer than 2,000 arelikely to pass. Neither the high failure rate nor the fees deter individuals fromsubmitting themselves to this ordeal. The fervor with which external candidatesdevote themselves to examination attempts illustrates the extent of the paperqualification syndrome in Zambia.

Evaluating Educational Perfornutnce 1215
Table 12.2 Junior Secondary School Leaving Examination Results, 1975-84
Year Sex
(a) Internal (School) CandidatesNo. obtaining
No. of fullcandidates certificate
Percentagefull
certificate
1975 Boys 10,425 7,199 69.1Girls 5,393 2,480 46.0Both sexes 15,818 9,679 61.2
1976 Boys 12,350 8,454 68.5Girls 6,183 2,558 41.4Both sexes 18,533 11,012 59.4
1977 Boys 13,897 9,939 71.5Girls 7,198 3,201 44.5Both sexes 21,095 13,140 62.3
1978 Boys 14,976 9,879 66.0Girls 7,744 3,195 41.3Both sexes 22,720 13,074 57.5
1979 No records available1980 Both sexes 25,580 16,069 62.81981 Both sexes 24,479 14,669 59.91982 Both sexes 26,799 16,055 59.919E3 Both sexes 28,449 16,583 58.31984 Both sexes 31,267 19,857 63.5
Year
(b) External CandidatesNo. obtaining
No. of fullcandidates certificate
Percentageobtaining full
certificate
1975 6,918 616 8.91976 10,691 463 4.31977 13,306 1,051 7.91978 11,655 645 5.51979 14,085 1,140 8.11980 No records available1981 18,021 1,643 9.11982 No records available1983 17,248 1,627 9.41984 18,993 2,820 14.8
Sources: Education ministries (1975-78), Educational Statistics; Computer Centre,University of Zambia.

126 Education in aDeclining Economy: The Case of Zambia, 1975.85
Even after examiners have made upward adjustments in individual subjects,
only some three-fifths of the candidates pass the JSSLE. If the secondary selection
examination is successful in selecting the best 20 percent of primary school pupils togo on to secondary school, one would expect a superior standard of performance.The success rate in the JSSLE is depressed by the girls' performance, but evenconsidering only the pass rate for boys, the standard of performance is low. Thus, of100 boys who enter grade 1 in primary school, only about 20 proceed to secondaryschool, and of these only about 13 will receive a full Junior Secondary LeavingCertificate.
Any system that results in such waste must be flawed. The problem could be in anumber of areas. It could be in ,he selection examination's failure to select the bestprimary school students; it could be poor teaching in junior secondary classes; itcould be in the JSSLE examination itself. Because performance has always beenlow, the fault cannot lie with the financial problems, but it is strange that in a periodof financial difficulty, the government did not attempt to arrest this waste, which aswill be seen below, has large financial dimensions.
The JSSLE performance in mathematics can only be termed lamentable. Evenafter upward adjustments of the marks, only half of those who sat for mathematicsbetween 1978 and 1984 reached the passing standard. The results also sLow thatperformance is getting worse, silice only 49.3 percent of the candidates passed in1982-84 whereas 52.2 percent had passed in 1978-80. While this deterioration mighttempt one to attach some of the blame to the shortage of books and mathematicalinstruments, this is not the whole story, since performance from the outset was low.The difficulties experienced with mathematics and science have deeper roots thanthe shortage of teaching materials. These roots probably go back to the first years ofprimary school, when children find it difficult to grasp and internalize the conceptsinvolved and to master the basic computational techniques. This may be partlybecause of the language that is used for instruction, partly because of the type c.f rotelearning that the secondary selection examination fosters, and partly because theteachers themselves are unable to deal expertly with the concepts and techniquesemployed.
Imaginative and stimulating teaching in the junior secondary classes would nodoubt help remedy the situation, but these classes are taught by diploma holders,almost all of whom trained as such because they did not have the qualificationsneeded for university entry. Very few of these would be among the 10 percent or sowho obtain the higher levels of 0-level passes in mathematics. Zambia realises thatit is caught in a vicious circle where those with comparatively low qualifications,and possibly even a recol d of failure, become the teachers of the next generation,and thereby help to perpetuate an unacceptably low level of performance. If it is tobreak out of this situation it will have to take radical measures to ensure thatprimary teachers themselves gain confidence in their understanding ofmathematics and in their ability to communicate this understanding to children.This cannot be achieved without the commitment of resources for preservice and in-service training, curriculum materials, and trainers.
Performance in the School Certificate ExaminationOf the 109,641 candidates who sat for the School Certificate Examination between
1975 and 1985, a total of 68,366 or 62.4 percent passed fully and obtained a SchoolCertificate (table 12.3). A further 39,129 or 35.7 percent succeeded in obtaining0-level passes in one or more subjects, but did not pass the full School Certificate

Evaluating Educational Performance 127
Examination. The balance, 2,146 or 2.0 percent of the candidates, failed completely.There has been a very slight tendency for performance to improve: during 1975-79,an average of 61.2 percent of the candidates obtained a full School Certitii. ote, whileduring 1981-85 this average rose to 63.3 percent.
Table 12.3 School Certificate Performance, 1975-85
YearNo. who satexamination
Obtained fullschool certificate
Obtained0-levels,
not school
(no.)
one or morebut
certificate
(no.) (percentage) (percentage)
1975 6,984 3,956 56.6 2,008 28.81976 7,359 4,689 62.4 2,715 36.91977 8,071 5,119 63.4 2,901 35.91978 8,840 5,482 62.0 3,259 36.91979 10,233 6,226 60.9 3,891 38.01980 10,449 6,460 61.8 3,875 37.11981 11,134 6,835 61.4 4,120 37.01982 11,136 6,504 58.4 4,499 40.41983 11,315 7,128 63.0 4,053 35.81984 11,944 7,846 65.7 3,982 33.31985 12,176 8,211 67.4 3,826 31.41975-85 109,641 68,366 62.4 39,129 35.7
Sources: Education ministries (1975-78), Educational Statistics; Computer Centre,University of Zambia.
Let us now consider performance in some individual subjects. Performance inEnglish language remained uniform throughout the decade: each year around 46percent of the candidates obtained the equivalent of an 0-level pass. The percentagehas remained steady despite the greatly increased number of candidates, the dearthof teaching materials, and the decreasing proportion of graduate teach rs insecondary schools. However, a slightly different picture emerges from aconsideration of the raw scores, before examiners have adjusted the marks anddecided on passing grades and standards. These scores show that in overall terms,performance in English language has deteriorated somewhat: the mean hasdeclined and fewer candidates are obtaining high marks than in earlier years.
Mathematics and science results are considered in some detail because ofZambia's continued emphasis on the future need for personnel with scientificqualifications. In evaluating the results we must recall that the total sample fromwhich the examination candidates are drawn represents, theoretically, the best 10percent of Zambian students, or the top half of those who passed the JSSLE.Moreover, the small numbers actually taking physics and chemistry areindicative of the streaming of the more promising students into a science-orientedcurriculum and of the fear that students feel ehout choosing what is regarded as adifficult option.

128 Education in a Declining Economy: The Case of Zambia, 1976-88
The depressing results in mathematics obtained in the JSSLE are mirrored in
the School Certificate Examination. Again, the pass rate is only about 50 percent,with only about one-third of the candidates getting the equivalent of an 0-level pass.
However, some improvement is noticeable from 1982, with significant gains in1985 and 1986. These gains occurred at all levels of passirig but were mostpronounced at the upper performance levels. The improvement in recent years is
also shown by the increase in the mean of the raw scores, though these demonstrate
an astoundingly wide variability in performance.Performance in ...thysics, chemistry, and biology deteriorated across the period
1975 to 1986. The decline was particularly noticeable in physics. Examination of the
raw mean scores suggests that performance in physics and chemistry continues todecline, but that the decline in biology has been arrested, at least for the moment.Candidates who take the relatively new subjects of combined science or science are
more successful than their predecessors were in the subject physical science (thepredecessor of combined science). In agricultural science, the overall performancein 1983-86 was very much superior to that in 1975-78, with almost 50 percent of the
candidates gaining 0-level passes in the later period compared with less than 25percent in the earlier period. Nevertheless, there has been a drop ofsome magnitudein the weighted mean raw score for 1984-85 when compared with that for 1982-83.
The gradual deterioration in science results has occurred in unison with othercreepine changes in the school situation: the slow disappearance of sciencematerials and textbooks; the gradual deterioration in the condition of laboratoriesand their fixtures; the steady increase in class size; and the reduced proportion of
graduate teachers of science in the upper classes. All these factors collectively areprobably a major cause of the declining performance. In turn, all these factors canbe linked to the country's economic constraints, although these are not solely
responsible for their emergence. For example, the upkeep of laboratories is as mucha question of organization and maintenance routines as it is of funds.
The performance of boys and girls continues to differ substantially in the School
Certificate Examination. In almost every subject investigated the percentage ofboys obtaining an 0-level pass was higher during 1980-86 than the percentage ofgirls, and the percentage of boys who failed entirely was lower than the percentageof girls. Only in English literature was the girls' performance consistentlysuperior to that of the boys. This shows that girls can perform as well as boys. But italso makes one ask why girls do worse than boys in subjects such as biology, bibleknowledge, and English language, which are traditionally associated withequality, if not superiority, on the part of girls. The answer to this question may liein the different expectations teachers hold for girls and boys, as has been noted. Itmay also lie in the examinations themselves, which may be unintentionally biasedagain st gi rls.
The general decline in examination performance raises an economic questionthat is seldom considered. Only some two out of three candidates complete theSchool Certificate successfully. In financial terms, the failure of so high aproportion of grade 12 students to obtain a full School Certificate represents aconsiderable loss. If the two years they spent in the senior secondary school arecounted as wasted, then, using the unit costs given in table 5.5, some K13.2 million(at 1977 prices) were wasted over the period 1977-84. This grim picture becomes evenmore stark if the same procedure is applied to those who went through the juniorsecosidary school and did not obtain a full junior secondary certificate. Here,because the number is so much larger and the students have remained at school forthree years without obtaining their objective, the effect is very much greater: a
1
Evaluating Educational Performance 129
colossal K47 million wasted. Thus, a total of about 36 percent of the investment insecondary education over the years 1977 to 1984, years when the economy was ingrave trouble, did not attain its desired objective. Might it not have been moreprudent to use the same resources spread over a smaller number of students, inbetter equipped, maintained, and staffed institutions, in the hopes of achievingbetter results?
The Examination PyramidA mission that visited Zambia in 1963 described the education pyramid as they
found it at that time in these terms:Of every 100 Africans who start primary school, 82 would reach the fourth3ear, 42 the sixth and 21 would complete their full primary course. Of this 21,only six would find a place in secondary school, of them only three wouldenter a senior secondary form and only two would end up with a schoolcertificate (UN-ECA-FAO 1964, p. 101).
Although the position has greatly improved, the current examination pyramidessentially has the same shape: of every 100 children who start primary school, 81enter grade 5 and complete their full primary course. Of these 81, 18 find a place insecondary school and 12 pass the Junior Secondary Leaving Examination. Only 9enter a senior secondary class and only 6 of these end up with a full SchoolCertificate.
If one continues the pyramid to consider the numbers accepted at the university,it becomes slender, almost to the point of vanishing: approximately one out of everyten successful candidates in the School Certificate Examination has been offered auniversity place in recent years. This means that of every 200 children who entergrade 1, only 1 is likely to enter the universiLy 12 or 13 years later. Clearly, SchoolCertificate holders, and especially university entrants, are a very small and, ineducational terms, a very privileged group.
Overview of Examination PerformanceThe information presented in this chapter shows that examination performance
has not been satisfactory since 1975. However, it is to the system's credit thatperformance did not deteriorate even more when numbers increased so rapidly,supplies were so difficult to obtain, and the professional level of teachers declined soextensively. Nonetheless, performance remains at a very low level of' efficiencyand indicates considerable financial waste. The performance in mathematics andscience gives special cause for concern. While considerable improvement inmathematics has been observed for the most recent years, the performance inscience is clearly deteriorating. This does not augur well for efforts to basedevelopment on the promotion of science and technology.

13
The Teacher During the Years ofEconomic Difficulty
Teachers are key educational figures who have been affected by the economic
decline in both their incomes and in the discharge of their professionalresponsibilities. This chapter will present information on the number anddistribution of teachers at the primary and secondary levels, their qualificatons,professional preparation, and experience. It will then examine teachers' salariesand how these have developed during the past decade, in absolute terms and relative
to salaries in other areas. A related issue that deserves special consideration is theattrition of teachers, above all at the secondary level. Finally, the chapter will
endeavor to evaluate how teachers have reacted to the effects of the economic
decline.
Primary School Teachers
Many of the issues involving primary school teachers are similar to thoseinvolving secondary school teachers, but to clarify the situation for each group, they
will be discussed separately except for certain specific issues.
The Preparation of Primary Teachers
Trained primary teachers undergo a two-year training program in one ofZambia's ten primary teacher training colleges. Nine of these colleges have anenrollment capacity of 300 to 350 students each, while the remaining one can enroll
600 students. Students are prepared for teaching across all the years of primaryschool, from grade 1 to grade 7, although up to 1974 some were trained for teachingin grades 1 to 4 only and others for grades 5 to 7. Each college takes both male andfemale students for training as general teachers, and women for training asdomestic science teachers. The proportion of females among those training to begeneral teachers is somewhat less than 40 percent.
The annual output from the colleges now stands at about 1,800, having risen fromsome 1,200 in 1977. This output falls short of the need for trained teachers. Henceplans were developed to expand several colleges, but due to the shortage of funds,only K2.6 million was actually spent out of a planned capital development programof K12 million.
130 5,

The Teacher During the Years of Economic Difficulty 131
The quality of teachers the colleges produce depends on the quality of the studentintake, the quality of college staff, the availability of teaching resources, and thesuitability of the curriculum. Formerly, the minimum entry qualification forstudents was a pass in the JSSLE. In practice what happened was that the best of thosecompleting junior secondary school proceeded to senior secondary school, andcandidates for teacher training were selected from among those unable to continueat secondary school. However, as it became increasingly difficult for studentscompleting senior secondary school to find suitable training or employmentopportunities, especially those with mediocre examination results, the collegesbegan to receive applications from candidates who had completed senior secondaryschool or held School Certificates. This led in 1983 to a formal raising of the entryqualification to successful completion of secondary school, with 0-level passes inEnglish language and mathematics or a science subject.
All candidates in the training colleges now hold a School Certificate, but thespecific 0-level requirements are not yet being met. In a parallel development, theauthorities have given increasing priority to the admission of suitably qualifieduntrained teachers who have had one or more years of teaching experience. Morethan one-third of the trainees in 1984 were untrained teachers, and this group islikely to increase. The improvement in the formal educational background of thetrainees and the experience that the untrained teachers bring with them to theirtraining program are expected to improve significantly the academic andprofessional quality of the output from the teacher training colleges. The untrainedteachers are also expected to show more commitment to a teaching career aftertraining. Already the colleges are noting informally that their students are muchmore receptive today than they had been some years ago, quicker to learn, and moreenthusiastic about teaching as a career.
The Staffing of the Teacher Training Colleges
Significant developments have taken place in the composition of the lecturingstaff in the teacher training colleges (table 13.1). The number of graduates hasmore than doubled and their proportion has increased slightly. The proportion ofcollege staff with qualifications less than 0-level has decreased, while the numberand proportion with 0-levels have increased significantly. All teaching personnelin colleges are now trained. No informatioi. is available on the experience of staffin the training colleges other than the fact that all would have been teachers, themajority in the primary schools. Nevertheless, the staffing situation at the collegesis not fully satisfactory. In 1984, only 35 percent of the staff had educationalqualifications at the same level as or superior to those of the students they wererequired to train. Clearly this situation must be remedied by strenuous efforts toupgrade college staff academically.
Despite the stress on the colleges' staff development needs in the ThirdDevelopment Plan, concrete action has not materialized, probably because theeducation ministry failed to develop an appropriate training scheme. Possibly thisfailure was caused by resource constraints; however, a more likely cause was theministry's lack of planning and managerial capacity. A noticeable vacuum existsbetween plan formulation and execution. Ome a general plan has been approved,steps are not taken to allocate responsibility within the ministry for theimplementation of specific plan elements.
15 ;

132 Education in a Declining Economy: The Case of ZambiQ, 1973.85
Table 13.1 Staffing of the Primary Teacher Training Colleges, 1976-8S(number of college staff)
Item 1976 1978 1980 1992 1994
Educational Qualifications:Graduate 34 49 61 58 71
School certificate 57 45 35 58 53
Some 0-levels 100 165 166 154 192
Less than 0-levels 38 31 51 42 39
Professional Qualifications:Trained 175 222 287 312 354
Untrained 54 83 26 0 1
Sex:Male 186 232 253 260 300
Female 43 58 60 52 55
Total 229 290 313 312 3.i5
Sources: Education ministries (1976, 1978, 1980), Educational Statistics; Ministry of
Higher Education records.
The Resource Base of the Teacher Training Colleges
If the colleges are to perform their duties effectively, they need to be well equippedwith teaching aids, books (including the textbooks actually used in the schools), andequipment for teaching elementary science. Because of their limited resources andtheir recognition that the trainees will eventually teach in schools that are virtuallydevoid of teaching materials and science apparatus, the colleges have displayedgreat ingenuity in using locally available materials to support their trainingactivities. Their efforts are being supplemented through the FINNIDA-supportedscheme to train teachers in practical subjects and by the SIDA-suppurted assistancetoward the development of resource centers and production activities. However, theallocation the colleges receive to purchase teaching materials, science equipment,and library books appears to be quite inadequate to meet their needs. The totalexpenditure on student requisites for all teacher training colleges, secondary aswell as primary, was K234,271 in 1985. This was just K48.65 per student or, at 1975prices, less than K11, that is, only about one-third of 1975 and 1976 expenditures. Percapita expenditure on teaching items between 1982 and 1985 fell, on average, tobelow 60 percent of that between 1975 and 1979. Thus, spending on teachingmaterials for the colleges was severely affected by financing constraints.
A comparison of expenditures on primary teacher training with expenditures onsecondary schools reveals that during the years of shrinking resources thegovernment made greater efforts to maintain the level of expenditure for teachingmaterials in the secondary schools. This suggests that when resources are tight, thesecondary system is given preference over the primary system in the allocation of
disposable funds.
The Teacher During the Years of Ecoaornic Difficulty 133
The Curriculum of the Teacher Training Colleges
Developments in tho college curriculum must match those in the primary schoolcurriculum. However, these cannot be achieved without the financial means toproduce the necessary materials, disseminate the textbooks, support an extendedand adequately supervised period of practice teaching, and retrain the teachers inthe schools and the tutors in the colleges. However, some aspects of the teaching incolleges do not have the same heavy reliance on funds, for example, the structure ofthe college curriculum. The colleges have rigidly organized this in a manner thatprovides little time for private, independent study and does not encourage the use ofinitiative or innovative teaching techniques. Trainees have 0 very full, carefullytimetabied day, which they spend largely being taught the contents andmethodology of handbooks. The outcome is that the trainees develop anunimaginative teaching style that emphasizes factual knowledge, memorization,and convergent thinking. Several of the problems identified at higher levels ofeducation, and in particular the problem of lack of flexibility and originality inuniversity students, may be traced back to this form of teacher training, and itssubsequent perpetuation in the way primary school students are taught. The rigid,conservative training program in the colleges is closely linked to the college tutors'lack of knowledge and confidence, arising from their own low qualifications.There is an urgent need to improve these through a percipient and coherent staffdevelopment program. Until this is undertaken, the curriculum and methodologyof the training colleges will remain in the educational doldrums.
Size and Qualifications of the Teaching Force in Primary Schools
Along with the expansion of primary provision, the number of teachers grewfrom 18,096 in 1975 to 29,841 in 1986, an increase of 65 percent. During the sameperiod the primary school enrollment grew from 872,392 to 1,365,926, an increase ofless than 57 percent. This led to an improvement in the pupil-teacher ratio from 48.2in 1975 to 45.8 in 1986. Similarly, the number of trained teachers grew from 14,408in 1975 to 20,770 in 1983, an increase of 44.2 percent. This also was higher than therate of increase of enrollments during the same period, thus the number of pupilsper trained teacher decreased from 60.5 in 1975 to 57.5 in 1983. Not only are moreteachere trained, but an increasing proportion is more highly educated. Thisproportion will continue to increase as the colleges' new admissions requirementstake effect. Nevertheless, in 1983 about 10 percent of the trained teachers in primaryschool% some 2,000 teachers in all, had never done any secondary studies.
The number of assistant and untrained teachers varies from year to year, butthere has been some reduction in the proportion of such teachers, from 20.4 percent ofthe total primary teaching force in 1975 to 17.2 percent in 1983. Kelly and others(1985) found that 95 percent of the untrained teachers had completed the fullsecondary school program, and that about half of them had obtained the full SchoolCertificate. They were mostly confined to teaching in grades 2 to 6. More than halfhad participated in some form of orientation program organized by their districteducation officer. The assistant teachers were all female. Their educational levelwas uniformly low: none had gone beyond the junior secondary level, while 61percent had completed no more than grade 7. However, a recent decision was takento phase out this position altogether.
1 5 5

134 Education in a Declining Economy: The Case of Zambia, 11175-85
Female TeachersThe teaching force is predominantly male, but the proportion of female teachers
is rising steadily and reached 40 percent of all trained teachers in 1983. Femaleteachers are distributed unequally throughout the country, with the greatestconcentration in Lusaka, where they constituted over 60 percent of the total teachingforce in 1981, followed by the line-of-rail regions. The qualifications of the femaleteachers who are found in the line-of-rail regions also tend to be higher than thosefound elsewhere. In 1981, more than 80 percent of the female teachers in Lusakaand more than 70 percent of those in the line-of-rail regions had had two years oftraining on top of a minimum of two or three years of secondary school. By contrast,in the rural areas the proportion with similar qualifications ranged between 50 and56 percent. The balance of female teachers in these regions either had a primaryeducation plus two years of training or were untrained and assistant teachers.
The Recruitment and Use of Teachers
The rapid growth in the number of teachers, especially the more expensivetrained teachers, has inevitably put severe pressure on the budget for the primaryschools. Chapters 6 and 6 examined how this has affected the distribution ofresources, but we must still determine whether such expansion was necessary, andwhether we can expect similar growth in the future. All teacher trainees areguaranteed employment as teachers upon completion of their training. The largenumber of untrained teachers who continue to be employed and the relatively highpupil-teacher ratios suggest that a policy of employing the mAjority of trainingcollege graduates should continue, but much depends on the norms that are adoptedfor school staffing. One such norm is the pupil-teacher ratio. The government ofteninvokes the ratio of 40 pupile per teacher aR desirable, but has shown somewillingness to allow this to be extended to 46. The application of this ratio to the 1986enrollment suggests a shortfall of over 600 teachers. But a committee inquiring intothe size of the civil service advocated a different norm based on the number ofclasses in the upper and lower primary levels. The committee recommended that
the optimum staffing standards for each Primary School...be based on thefollowing;
(n)that each upper-primary class be manned by one full-time teacher;
(b)that two lower-primary classes be manned by one AID-time teacher (GRZ1986a, p. 637).
The application of this norm to the 1986 pattern of class distribution would suggestan overstaffing of 7,074 teachers.
The government rejected the proposal of its advisory committee (GRZ 1985b),although it continues to use the proposed norm as the basis for planning. Theconcern is that the lower primary curriculum requires no more than 17.5 hours ofactual classroom teaching per week, with a further 1.6 hours or so for organization,assembly, and breaks. Hence a teacher in the lower primary sector who had only asingle clas3 would be occupied for no more than 19 hours a week together withwhatever time the teacher devotes to lesson preparation and professional self-improvement. Experts believe this is an unjustifiably light load, especially whensuch severe financial constraints are present. This issue is a crucial one that the

The Teacher During the Yearn of Economic Difficulty 135
government must address if Zambia is to gain a greater measure of control over thebudget for primary schools and is to succeed in reducing the proportion of thisbudget needed for inescapable salary commitments.
Attrition Among Primary School TeachersThe wastage rate at the primary level has declined in recent years, from 3.5
percent in 1976-79 to less than 1 percent in 1980-83. Unlike at the secondary level, thenumber of students proceeding from college to the teaching profession hasincreased. In general, teacher loss has not been a serious problem at the primarylevel. The difficulty may actually run in the opposite direction: too manyunderqualified individuals tend to remain in the system.
Secondary School TeachersTwo groups of teachers fall into this category, those with university degrees and
those with diplomas. Both will be discussed in this section.
The Number of Secondary School TeachersBecause of the colonial legacy of an underdeveloped school system, in 1964
Zambia had very few qualified Zambian secondary teachers. The few there werequickly left to fill administrative posts within the government, the miningcompanies, and the private sector. In consequence the secondary schools tended tobe staffed almost entirely by expatriates. At the same th the schools wereexpanding with great rapidity. Under these circumstances ..ie of the highestnational manpower priorities established in 1967 was the production of qualifiedsecondary school teachers. Such teachers were to be trained either by e four-yearintegrated degree program at the university or by a two-year diploma program atspecial teacher colleges.
Two colleges have been established, one in Kabwe that trains teachers in all theuflual secondary subjects, and one in the Copperbelt that is responsible for trainingmathematics and science teachers for the junior classes in secondary schools. Inaddition a special institution in Luanshya trains teachers of technical subjects,while a three-year program at the Natural Resources Development College inLusaka trains teachers of agricultural science. This college is owned and operatedby the Ministry of Agriculture and Water Development and not by the educationministries. There is also a small output of teachers of art and music from aprogram based in the Evelyn Hone College, Lusaka. Collectively, these variousinstitutions produce about 600 teachers a year. Table 13.2 shows the output of trainedteachers from all institutions from the time of their inception to the end of 1986.
In 1985, Zambia had 234 secondary schools with 1,019 senior secondary classesand 1,958 junior classes. At a staffing ratio of 1.5 teachers per class, plus anadditional 2 staff per school as administrators, the theoretical staffing needs wouldhave been:
1,529 graduates for senior classes;2,937 diplomates for junior classes;
468 graduates for school administration.These staffing needs could have been met in overall numbers if all who had
trained as teachers since 1969 had entered and remained in the schools. Therewould, however, have been a small shortfall of graduates and a considerable

136 Education in a Declining Economy: The Case of Zambia, 1975.85
Tablo 13.2 Output of Qualified Secondary Teachers, 1969-86
YearAnnual output
BA Ed BSc Ed
UniversityCumulative output
Total BA Ed BSc Ed Total
CollegesAnnual Cumulative
output output
1969 11 0 11 11 0 11 99 99
1970 10 0 10 21 0 21 as 132
1971 45 8 Ea 66 8 74 71 203
1972 31 14 45 97 22 119 102 305
1973 0 0 0 97 22 119 153 458
1974 67 22 93 164 44 208 223 681
1975 103 37 140 267 81 348 264 945
1976 101 30 131 368 111 479 351 1,296
1977 112 22 134 480 133 613 347 1,643
1978 111 47 158 591 180 771 423 2,071
1979 117 31 148 708 211 919 422 2,493
1993 161 46 207 939 267 1,126 490 2,9033
1981 131 40 171 1,000 297 1,297 468 3,471
1982 135 49 184 3,136 346 1,481 383 3,837
1983 120 32 152 1,266 378 3,633 366 4,203
1984 103 27 130 1,358 405 1,763 341 4,544
1986 90 61 141 1,448 466 3,904 452 4,996
1986 123 23 156 3,576 484 2,060 508 5,504
Sources: University of Zambia (various years) Annual Reports and records,Statistical Yearbook 1971; Ministry of Higher Education (1983), EducationalStatistics.
surplus of diplomates. The actual staffing situation in 1985 is not known, but in 1984a total of 5,043 teachers were serving in secondary schools with a total enrollment of125,811 pupils. This gives a pupil-teacher ratio of 24.9 to one. There were 1,570junior secondary classes and 988 senior secondary. In theory, the schools wouldhave needed 2,355 diplomates and 1,868 graduates, a total of 4,223. In fact they had3,480 diplomates and 1,563 graduates, a total of 5,043. In these terms, they wereactually overstaffed, but the effect was counterbalanced to some extent by the pupil-teacher ratio, which is Ugh for the secondary level, and by the average class size of43.3, which is also high. Clearly the secondary schools have too few graduateteachers and too many diplomates.
Changing Composition of the Secondary School Teaching Force
A remarkable change has been taking place steadily in the composition of thesecondary school teaching force. In 1975, almost 57 percent of the teachers weregraduates, more than four-fifths of them trained. The proportion of graduates hasdecreased steadily, until by 1984 it stood at 31 percent. At the same time, theproportion of graduates who trained as teachers has increased from 80.3 percent in1975 to 96.4 percent in 1984.

The Teacher During the Years of Economic Difficulty 137
The decline in the proportion of graduates has affected different schools indifferent ways. In government schools the proportion fell to 25.8 percent, but thegrant-aided schools were able to keep their proportion considerably higher, at 42.6percent, presumably because of' the continuity of the mission personnel who own theschools and play such a large part in their staffing and management. The privateschools have been the least effected and more than half their staff are graduates.About two-thirds of the graduate teachers in private schools are expatriates, but theseschools ai e showing increasing success in attracting the services of Zambiangraduates, many of them trained.
The composition of the teaching force by nationality has also changed. In 1975,Zambians constituted only 30.4 percent of all the secondary school teachers, but by1979 Zambians constituted for the first time more than half the secondary schoolteaching force. Their proportion has continued to grow, so that by 1984 they formed82.4 percent of a teaching force that was more than 50 percent larger than it had beenin 1975. The rapidity with which the staff of the secondary schools is beingZambianized is due to the relatively high output from the training institutions, themore successful retention of those who enter the teaching profession, and thedeparture of expatriate teachers to take up better-paid appointments in other parts ofAfrica.
Graduate Teachers in Mathematics, Science, and EnglishA serious difficulty for the secondary school system is the production and
retention of the required number of staff qualified in the disciplines required at thesenior level, especially mathematics, science, and English. Not only do graduatemathematics and science teachers leave the system, but the university does notproduce the total number of graduate teachers these subjects require. The UNDP(1986) estimated that for 1985 there was a shortfall of at least 150 science andmathematics teachers and 135 graduate English teachers.
In the absence of sufficient graduates, diplomates are teaching senior classes. Asurvey conducted for this report in March 1987 revealed that in approximately halfthe secondary schools nongraduates were heavily engaged in teachingmathematics, science, English, and geography at the senior level, but theinvolvement was greatest in mathematics, science, and English. There are almostno graduate teachers of agricultural science.
Deployment of two-year diploma teachers to teach at the senior secondary leveldoes not contribute to high-quality teaching. The diplomates are trained to teach at alower level. Moreover, they have diploma-level training precisely because they didnot have the qualifications for university admission. Their position is rendered allthe more difficult by the shortage of books and science equipment and the nm-downstate of many school laboratories. They are not prepared, by training or experience,for the many improvisations and makeshift arrangements that this situation callsfor. However, responsibility for students' poor performance in mathematics andscience in the School Certificate Examination is not the fault of the diplomates. Theresults were equally poor when graduates dominated the staff of the secondaryschools. But the necessary improvements are unlikely to materialize when somany of those teaching mathematics and science at the senior level are notqualified for this task.
A number of initiatives are presently being taken to rectify this situation,prominent among them being the EEC-ftinded Zambia Science Teachers EducationProject (ZAMSTEP). During a three-year period, this project aims to provide one

138 Education in a Declining Economy: The Case of Zambka , 1975-85
year of in-service training for 300 mathematics and 300 science teachers, alldiplomates, and to upgrade a further 900 diplomates through seminars conductedduring school vacations. However, this project must have been conceived without aproper evaluation of the actual number of diplomate teachers in the field. Up to 1985,the colleges had produced a total of 1,234 mathematics and science teachers. Some ofthese are no longer teaching, while others have already upgraded theirqualifications to degree level. In late 1985, Kelly and others (1986, p. 373) estimatedthat there were 1,144 nongraduate teachers of mathematics and science in thesecondary schools. Therefore, where ZAMSTEP will find its target group of 1,500teachers is not clear. But apart from this detail, the undertaking is worthwhile andshould prove beneficial.
Attrition Among Secondary School TeachersThe main factor that will improve the proportion of graduate teachers of
mathematics, science, English, and other disciplines appears, ironically enough,to be the declining economy. The lack of' other jobs is inducing more universitygraduates to enter the teaching profession. In addition, more of them are adopting aprofessional attitude to teaching, viewing it as a lifetime commitment, and not justas a stepping stone to a better paid job. The recent decline in the rate at whichuniversity graduates are leaving teaching illustrates the combined effects of thesefac tors.
The attrition of secondary school teachers, and especially of trained graduates,was so serious in the past that several investigators examined the extent of theproblem. Jackman (1977) estimated that the annual attrition of Zambian secondaryschool teachers, both graduates and diplomates, was 18 percent during 1969-74. TheUniversity Tracer Project (1975) showed that the wastage rate for universitygraduates was approximately 20 percent, but only 1 to 2 percent for diplomates. Shaw(1979) summarized the position for 1969-77 as follows:
over one-fifth of all university trained teachers never enter teaching,whereas 87 percent of diplomates do pursue teaching careers;of those who enter teaching, about one-tenth leave the profession in any oneyear; the attrition of university graduates is about twice the total attrition rateand almost three times that nf Nkrumah College (Kabwe);the general trend has been for a rise in both the proi: Ion who never enterteaching (graduation loss) and the proportion who enter and then leave (activewastage) (Shaw 1979, pp. iii, 28).
However, Bardouille (1982) traced the 6 cohort of graduates five years aftertheir graduation and found quite a change from earlier years. Bardouille's firstfinding was similar to Shaw's, namely, approximately 27 percent of the trainedgraduates did not enter the teaching profession, but she also found that of those whohad entered teaching, 92 percent stayed in the profession, and about one-third ofthese professed that they intended to remain permanently in teaching. Bardou'lleinterprets this relative stability, which marks a significant improvement on thehigh attrition rates disclosed by Jackman and Shaw, in terms of the lack ofalternative jobs: "Occupational choices are consciously conceived in light of thereality of the labour market, even though a chosen occupation may not meet theexpectations of the incumbents" (Bardouille 1982, p. 65).
The change detected by Bardouille is brought out clearly by examining thenumber of trained graduates in the schools each year and comp:-.ring these with
1 i;

The Teacher During the Years of Economic Difficulty 139
what they would have been if all graduates had entered and remained in teaching.One assumption made was that all trained graduates in the schools received theirqualifications at the University of Zambia, which on the basis of available figures,is a reasonable assumption.
Up to 1979, the rate of attrition of university graduates was vely high, an annualaverage of 29.2 percent between 1976 and 1979. This figure is close to that ofBardouille. The rate dropped sharply in 1980 and continued to fall until 1983. By1984, however, the number of trained graduates in the schools exceeded the sum ofthose carried forward from 1982 and those who graduated in 1983. This means thatsome who had graduated earlier but had not gone into teaching had now entered theprofession.
By early 1984, almost half of all those who had ever graduated from theuniversity with an education degree were actually working in the secondaryschools. Bearing in mind mortality losses and those education graduates who havechosen to teach at the university or the teacher training colleges or to work withinthe education ministries, the proportion of education graduates who actually usetheir qualifications in the education field is :,f,t as low as critics make out: it isactually reassuringly high and is increasing.
For diplomate teachers the average attrition rate was 6.5 percent during 1976-79,and 4.8 percent during 1980-81".. In 1984, 77.9 percent of the total cumulative outputfrom the colleges was teaching in the secondary schools. This proportion has beendropping fairly steadily, partly because of actual losses, but partly because asignificant but unknown number of diplomates upgrade their qualifications bytaking degree studies, and hence "reappear" as graduates. The positive orientationof these students toward a career in teaching has probably contributed to the recentupsurge in the stability of the graduate teaching force.
For both categories of secondary teachers taken together, the attrition ratedropped from an annual average of 10.6 percent during 1976-79 to 5.5 percent during1980-83, but the loss in relation to institutional output remains high, approximately33 percent. Clearly, the rapid loss of secondary teachers experienced in the 1970shas slowed down. Given the slow growth of the secondary schools, the traininginstitutions appear to be adequate to meet their needs, although having moregraduates would be preferable. Although the proportion of graduates has risen since1981, concern still remains that the schools do not have an adequate number ofgraduate teachers of mathematics, science, and English. The almost completeabsence of graduate teachers of agricultural science deserves special mention. In1985, Zambia had only ten such teachers, yet as far back as 1978, the School ofEducation began preparations for a degree program in agricultural education. Theprogram has appeared formally in the university prospectus since 1983, but no stepshave yet been taken to mount it.
The Length of Experience of Secondary School Teachers
No quantitative information is available on the length of experience of Zambiansecondary school teachers, but some proxy for this can be had by examining theirage structure. The average age of secondary school teachers is increasing slowly.The proportion aged 31 and over has risen from some 25 percent in 1978 to over 38percent in 1984. This change is very likely a reflection of the decline in the rate ofattrition, but clearly the staff are generally young and have nftt yet had theopportunity to gain much experience. However, with the reduced tendency of

140 Education in a Declining Economy: The Case of Zambia, 1975-85
secondary teachers to leave the profession, an increase in the overall experience ofthe teaching force must occur.
Issues Affecting Both Primary and Secondary School Teachers
Certain issues affect both primary and secondary school teachers in much thesame way. The most important of these are salaries and the effect of these and thesituation in the schools on teachers' morale.
SalariesAll investigations of attrition among Zambian secondary teachers have found
that low salaries are the main reason for teachers leaving the profession. Otherreasons include poor promotion prospects, poor housing, and communicationdifficulties with the employer. Sanyal and others (1976, p. 200) found that teachers'salaries were low compared to those of other professionals. In 1974, the mean salaryof diplomates teaching in the secondary schools was K177 per month, whereasdiploma-trained teachers who were not teaching had a mean salary of K332 permonth. Similarly, trained graduate teachers received an average of K234 permonth, while education graduates who were not in the teaching profession had amean monthly salary of K399.
Table 13.3 shows the salary scales in the education sector for the period 1975-85. Itreveals that salaries have grown rapidly at currcnt prices: the 1986 entry levelsalary for a graduate was mc7e than double its 1975 level; for a two-year trainedteacher with a School Certificate it had increased by more than 125 percent; and forthe two-year trained less qualified primary teachers it had increased by more than14 percent.
Since 1975, no salary distinction has been drawn between the levels at whichtrained School Certificate holders teach. Teachers with the same qualificationsreceive the same salary, regardless of whether they teach in primary or secondaryschools. Table 13.3 underscores the heavy reliance on formal credentials. Thisphenomenon is not confined to the education sector, but appears throughout the civilservice and is also prevalent in the parastatal sector. Several participants in thenational debate on educational reforms made strong pleas to loosen thisconnection, but the government took no action. As a result, incomes in Zambia arestill governed by the conditions Colclough (1974, p. 465) described:
Instead of payment by results, wages i T. salaries are determined largely bypolitical, institutional or other factors which have little or no relevance to theeconomic realities of the economy.
As table 13.4 demonstrates, the apparent gains in teachers' salaries arecompletely wiped out when adjustments are made for inflation. The first part of thetable shows the starting salaries corrected to 1975 prices. It shows that teachers'salaries lost 20 percent of their purchasing power between 1975 and 1980 and afurther 20 percent of their 1975 value by January 1985. Thus, a teacher's 1985 salarywas worth only some 60 percent of its 1975 value. Inflation during 1985 was so highthat by December 1985 salaries had lost one-third of their January 1985 value. At the

The Teacher During the Years of Economic Difficulty 141
Table 13.3 Education Sector Salary Scales, 1975-85(k wacha)
Teacher'squalifications 1975 1980 1995
Trained graduate 3,288-5,388 (11) 5,208-7,044 (9) 6,792-9,036 (11)Untrained graduate 2,892-5,388 (13) 4,800-7,044 (11) 6,588-9,036 (12)Grade 12 + 3 years
training 2,376-4,560 (13) 3,480-4,248 (4) 5,184-8,064 (15)Grade 12 + 2 years
training 2,208-4,560 (14) 3,288-4,248 (5) 4,992-8,064 (16)Failed grade 12 + 2
years training 1,824-2,328 (7) 2,644-3,240 (8) 4,212-5,184 (8)Grade 9/10 + 3 years
training 1,752-2,328 (8) 2,592-3,240 (9)Grade 9/10 + 2 years
training 1,680-2,328 (9) 2,520-3,240 (10) 4,404-5,184 (9)Failed grade 12, no
training 1,464-2,328 (12)Grade 7 + 2 years
training 1,116-2,052 (13)Grade 7, no
training 600-1,116 (8)
Note: Figures in parentheses are the number of incremental steps in each scale. Adash indicates that the salary scales made no provision for qualifications ortraining that had been specially provided for in an earlier year.Source: GRZ (1975, 1980, 1985a).
rate of inflation prevailing throughout 1986, estiniated at 58.4 percent, the startingsalary of trained university graduate teachers had the purchasing power of about 30percent of their 1975 salary.
Teachers' Total EarningsIn addition to their salaries, teachers are paid a variety of special allowances,
for instance, as heads of certain subject areas in the secondary field or for teachingdouble sesbions at the primary level. At the secondary level, these allowances fellfrom 2.0 percent of the total salary bill for teachers in 1975-79 to 1.5 percent in 1980-84, while at the primary level they fell from 4.5 to 4.1 percent. To some extent, thesedeclines reflect economies of scale: a larger salary bill that is due to additionalteachers does not imply the addition of responsibility posts. To some extent,however, the decline is due to salary increases outstripping the rate of growth ofallowances.
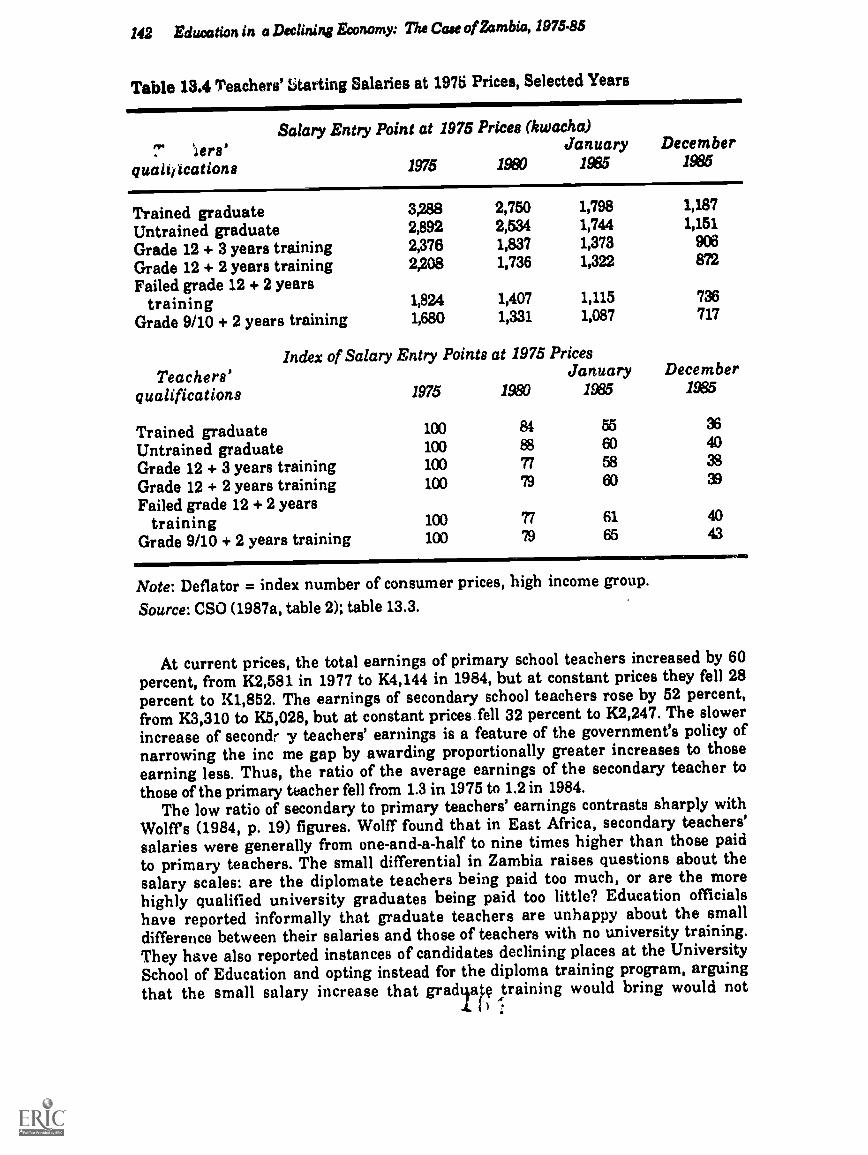
142 Education in a Declining Economy: The Case of Zambia, 1975-85
Table 13.4 Teachers' Litarting Salaries at 1976 Prices, Selected Years
Salary Entry Point at 1975 Prices (liwarlia)7! 'ars' January December
qualifications 1975 1930 15 1995
Trained graduate 3,288 2,750 1,798 1,187
Untrained graduate 2,892 2,534 1,744 1,151
Grade 12 + 3 years training 2,376 1,837 1,373 906
Grade 12 + 2 years training 2,208 1,736 1,322 872
Failed grade 12 + 2 yearstraining 1,824 1,407 1,115 736
Grade 9/10 + 2 years training 1,680 1,331 1,087 717
Index of Salary Entry Points at 1975 PricesTeachers' January
qualifications 1975 1980 1935December
19E6
Trained graduate 100 84 55 36
Untrained graduate 100 83 60 40
Grade 12 + 3 years training 100 77 53 38
Grade 12 + 2 years training 100 79 60 39
Failed grade 12 + 2 yearstraining 100 61 40
Grade 9/10 + 2 years training 100 79 65 43
Note: Deflator = index number of consumer prices, high income group.
Source: CSO (1987a, table 2); table 13.3.
At current prices, the total earnings of primary school teachers increased by 60percent, from K2,581 in 1977 to K4,144 in 1984, but at constant prices they fell 28percent to K1,852. The earnings of secondary school teachers rose by 52 percent,from K3,310 to K5,028, but at constant prices.fell 32 percent to K2,247. The slowerincrease of secondr y teachers' earnings is a feature of the government's policy ofnarrowing the inc me gap by awarding proportionally greater increases to thoseearning less, Thus, the ratio of the average earnings of the secondary teacher tothose of the primary teacher fell from 1.3 in 1975 to 1.2 in 1984.
The low ratio of secondary to primary teachers' earnings contrasts sharply withWolff's (1984, p. 19) figures. Wolff found that in East Africa, secondary teachers'salaries were generally from one-and-a-half to nine times higher than those paidto primary teachers. The small differential in Zambia raises questions about thesalary scales: are the diplomate teachers being paid too much, or are the morehighly qualified university graduates being paid too little? Education officialshave reported informally that graduate teachers are unhappy about the smalldifference between their salaries and those of teachers with no university training.They have also reported instances of candidates declining places at the UniversitySchool of Education and opting instead for the diploma training program, arguingthat the small salary increase that gradqape training would bring would not
The Teacher During the Year. of Economic Difficulty 143
compensate them for earnings foregone during the two extra years that universitytraining would necessitate.
Teachers' salaries have fluctuated somewhat in their relationship to the percapita GDP, but in recent years the primary teachers' salaries have averaged someseven times and the secondary teachers' about eight times the per capita GDP.Compared to elsewhere in East Africa this ir high for the primary teacher, theaverage ratio at this level being 4.6 (Wolff 1984, p. 6), and low for the secondaryteachers, for whom the average ratio is 11 (Wolff 1984, p. 19).
Compared to salaries in the parastatal sector, graduate teachers are poorly paid.So far as the public sector is concerned, since 1975 teachers' salaries tended to behigher than those paid at comparable levels elsewhere in the civil service.However, in 1985 the salary scales were changed and graduate teachers are nowpaid a lower starting salary than graduates entering other areas of the civilservice. This move has done little to enhance the image of teaching as a career foruniversity graduates or as a profession of comparable status to others that requiretraining of the same duration.
Teachers' Supplementary Economic Ac.witiesWilliams (1986, n. 97) and others have observed that to supplement their
declining real incomes, teachers are resorting to a variety of commercialactivities, such as running taxi services, grocery stores, bars, or market stalls;baking and selling foodstuffs; engaging in small-scale commercial farming;and so forth. Others have stated that much of the time teachers need for theseactivities is taken from time they should devote to teaching, with the result that thenumber of hours actually spent in teaching has fallen. Clearly if this were so, wewould expect some reduction in the level of pupil achievement. Hence, in addieon toits other effects, the economic decline, through its impact on teachers' salaries,could have an indirect effect on school quality.
Obtaining reliable information on the extent to which teachers might be engagedin supplementary economic activities is not easy. This is a sensitive issue and oneabout which teachers are reluctant to talk. However, some information wasobtained from primary school inspectors, field supervisors of student teachingpractice, and primary school heads. The overwhelming view, expressed by 217 outof 265 of the persons approached, was that teachers supplement their incomes by avariety of commercial activities and that this practice has been increasing inrecent years. Both urban and rural teachers are affected. Most of the primary schoolheads stated that the teachers conducted their commercial activities ir ir owntime, but the school inspectors and teaching practice supervisors believed that theteachers often absented themselves from school duties to attend to their businessenterprises or farms.
Teachers' Morale
The foregoing pages show that during 1975-85, the total number of teachersexpanded very rapidly, but that the growth of resources did not keep pace with therate of expansion. Funds to purchase teaching materials and school equipmentdeclined, and ev en when funds were available, the necessary items werefrequently unobtainable because of production or importation problems. Teachers'salaries lost so much of their purchasing power that many felt compelled to take upadditional money-generating activities to supplement their incomes.

144 Education in a Declining Eronomy: The Case ofZambia, 1975-85
The combination of these two factors, declining resources for the discharge ofprofessional responsibilities and declining personal incomes, seemed destined tosap the morale of the teaching force and to produce a dispirited body of men andwomen imbued with a fatalistic sense of hopelessness. Strangely, this is not whatb-s happened. Instead, despite cases of absenteeism and teachers having to'moonlight" to generate additional income, indications suggest that the teachingforce is becoming more professional, more highly motivated, and more confident ofits ability to master the adverse circumstances that have beset it. Increasingly thoseinvolved in the Zambian education scene today refer to the way teachers invokesuch characteristics as self-help, self-renewal, personal responsibility for self-development, self-reliance, active participation, personal involvement, andresourcefulness. Additionally, there are signs that the Zambian teaching force isbecoming increasingly confident of its ability to do things for itself and by itself.
Almost every edition of the Ministry of Education's Annual Report refers to theteachers' commitment' to eeeing the system through enother difficult year. Since1976, the reports mention teachers' contributions to an in-service training fund tocover thL. costs of courses being run by the inspectorate, but which the ministry couldnot finance. Most heads and teachers were very roceptive to the reintroduction of
practical subjects into the primary schools. Teachers have shown muchresourcefulness in integrating these subjects into their teaching activities and havebeen willing to use their own time to arsemble materiais for claws use, Equallywell-received and enthusiastically pursued was the whole concept of productionactivities in schools, despite mcst teachers' lack of preparation for this subject.Although the economic outcomes of this activity have generally been disappointing,this can be attributed largely to implementation failures, not to a lack of teachercommitment and dedieation. Coombe and Lauvas (1984, p. 4) spoke glowingly of thehigh professional quality of Zambian educahrs and of their strong sense ofcommitment toward improving education. They emphasized the consistent way inwhich Zambians of all ranks were endeavoring to come to grips with theireducational needs, in a spirt of resourcefulness, improvisation, and self-reliance.
Contrary to expectations, therefore, smaller personal incomes and decliningprofessional resources have not sapped the spirit of teachers. Instead, in an almostperverse manner, the economic crisis appears to have boosted personal andprofessional morale, Teachers recognize that there is financial security in being ateacher at a time when so many are not able to find employment. They are alsobecoming more professionally responsible in their desire to develop teachingresources through their own activities. The paradox of all this is that, whatever itsundisputed drawbacks, the economic decline has resulted in an important benefitfor the teaching profession in Zambia, namely, its advancement to a new stage ofprofession al matu rity.
The SHAPE MovementTeachers' efforts at self-improvemen' have given rise to the Self-Help Action
Plan for Education, or SHAPE. This is characterized as a program of the teachersfor the teachers by the teachers (Ministry of Higher Education 1987). The programaims at enhancing the capacity of teachers, schools, and colleges for professionaland material seif-help through the development of school-based teachers' centersand college-based resource centers and of production activities in agriculture,industrial arts, and home economics. By stimulating the self-development andself-renewal of teachers in the field, the program hopes to integrate theory and

The Teacher During the Yeare of Economic Difficulty 145
practice, to bridge the gap between school and community, and to ensure thatproduction activities bring both pedagogical and material benefits to the schools.Although guided by a central secretariat and assisted by contributions from SIDA,the program is field-based, is planned and managed by teachers, and swings intoaction with financial inputs only when local efforts to mobilize resources arepresent.
The SHAPE program is important in that it is endeavoring to develop a schoolcurriculum based on resourcefulness, self-reliance, and self-development. Theeventual achievement of its objectives will see the school curriculum structuredaround production activities and practical work, an objective that can only beachieved by raising the level of understanding and professional skills of teachersand other education personnel.
This program, initiated at the end of 1985, was significant in that it responded tothe growth of activities among teachers who were doing things for and bythemselves, but who needed the encouragement of interest, moral support, financialassistance, an guidance. The accounts of participants show that twoconsiderations were guiding the teachers in their efforts at professional self-renewal: first, the situation had deteriorated so much that they felt they must dosomething to improve it; and second, they realized that help would not beforthcoming from the education authorities, hence it was up to the teachers toremedy the situation themselves. The teachers felt that the Ministry of Educationwas remote, too far removed physically and psychologically, to respond to theirprofessional needs as experienced in the field.
Thus, unlike a number of other initiatives in the educational field, the SHAPEprogram originated in essence at the level of teachers in the schools and wassubsequently formulated into a national program. Its genesis and developmentmay well be the most important internal educational reform ever to occur inZambia. It is ironic that the catalyst for this all-important reform was theworsening financial situation and the lack of teaching resources to which it gaverise.
14The Pupil in School and Afterwards
The central figure in the whole educational process is the school pupil. YetZambia and other developing countries have made few systematic attempts to cometo know more about the pupils, their backgrounds, their aspirations, and what theeducational process means to them. In countries experiencing contractingeducational and employment opportunities, there have been few studies of howpupils deal with the pressures of a highly selective education system, how theirattitude to life is colored by these pressures, and what the financial squeeze hasmeant to them personally and academically. Some data are available on pupils'ages, socioeconomic backgrounds, and educational and employment prospects.Thanks to studies by Hoppers (1979; 1980a, b) we have gained some insights intotheir aspirations, postschool adjustments, and society's expectations. But other thanthis, little is known about how pupils use the experiences, knowledge, andunderstanding gained from their schooling in adjusting to life after school,whether they are pursuing further training, seeking employment, or adapting to therealities of unemployment. More extensive study of these and related areas wouldbe of great value to teachers, curriculum specialists, educational planners, careerguidance authorities, the social services and youth ministries, and allpolicymakers in the educational field.
Children's Nutritional StatusThe tendency for the age of primary school children to increase may also be
related to the worsening nutritional status of children. Less well-nourishedchildren appear younger than their years and hence may not be sent to school untilthey are older and appear more robust. Unfortunately information about thenutritional status of children in primary schools is not available. However, theevidence suggests the presence of serious malnutrition in Zambia, especially insome rural areas. National results and community-based surveys confirm thatroughly one-third of children under five are malnourished (UNICEF 1986, p. 60).
The mortality rate of children admitted to hospitals because of malnutrition hasincreased steadily since 1975. The highest incidence during the decade was in theNorthern, Luapula, and North-Western regions, but the drought that affected theWestern, Southern, and Central regions during much of 1980-85 increased themalnutrition rates in these areas. The deterioration of the nutrition situation is

The Pupil in School and Afterwards 147
attributed to "a complex of factors, including a continuing decline in economicconditions, rapid inflation, deteriorating rural/urban terms of trade, populationincrease, urbanization, and drought conditions affecting large areas of thecountry" (UNICEF 1986, p. 58). The rise in mortality due to malnutrition, and therole of malnutrition as an underlying factor in deaths attributable to otherdiseases, has made this Zambia's most serious health problem.
The seriousness and extent of the malnutrition problem is only now beginningto come home to many. Its impact on education, in terms of participation andperformance, has not yet IA.,en assesaed. Neither has the role the education systemmight play in educating the public aipaut this issue been evaluated. The only stepsthat have been taken within the education sector to intervene with supplementaryfeeding programs for schoolchildren have depended entirely on the initiative of'individual school heads and on the resources they could muster through voluntarysubscriptions. Given the commitment of almost all the funds at the primary levelfor the payment of salaries, it is difficult to know where public resources couldoriginate for any food intervention program in primary schools, unless somefunds could be diverted from other forms of student subsidies for this purpose. Afood intervention program might have far-reaching effects not only in improvingthe general level of health of primary school children, but also in improving theirattendance and performance.
The Family's Educational BackgroundAnother feature of the average primary school pupil is that he or she is more
likely than in the past to come from a family with some formal education, Thosestudents that succeed in going on to secondary school are likely to come fromfamilies with a relatively high educational background or reasonably highsocioeconomic status. The evidence relating to general educational backgroundstems from the data on the overall level of education in the population. In 1969, 78percent of the population had had no formal schooling, but by 1980 this proportionhad fallen to 66.3 percent. Moreover, the percentage of unschooled individualsbelow the age of 45 is declining rapidly (table 14.1). Note that in 1980, only 20.2percent of the females in the 15-24 age group, that is, the age group who todayconstitute a !arge proportion of the mothers of primary school children, wereunschooled, whereas more than half those in the 25-44 age group, most of whosechildren would now be beyond primary school age, had had no schooling. Clearly,the proportion of young parents with at least a primary school background is rising.
Information about the educational background of families of secondary schoolpupils is scattered across a number of studies that gathered this information in thecourse of other investigations. In her tracer study of the 1976 cohort of graduatesfrom the University of Zambia, Bardouille (1982) provided information on theeducational background of the graduates' parents. These graduates would havecompleted secondary school no later than December 1971, and hence theinformation is interesting in that it shows the family backgrounds of a speciallyprivileged group of secondary school pupils at a relatively early date. In a study of'the relationships between adolescents and their parents, Mwanalushi (1980)provided data on the educational background of the parents of 151 boys and girls ina secondary school in Lusaka and of 199 boys and girls in a rural school in theEastern region. Kaluba (1986) conducted a tracer study of all graduates-500 boysfrom two technical schools in the years 1977-84. These schools select their annualintake from the primary pupils who perform best in the national secondary school

148 Education in a Declining Economy: The Case of Zambia , 1973.83
Table 14.1 Educational Level of Selected Age Groups, by Sex, 1980(percentage of the age group with this level of education)
Age Age AgeEducation 18-24 25-44 45-64
No schoolMale 10.9 19.0 43.8
Female 20.2 51.1 82.8
Primary schoolMale 61.9 48.5 48.5
Female 61.9 39.7 15.5
Secondary schoolMale 26.4 30.5 6.0F emale 17.1 8.1 0.8
Level not statedMale 0.8 2.0 1.7
Female " 1.1 0.9
Source: CSO (1985a, table 4.3).
entrance examination. Hence the pupils represented a wide geographical spectrumand a narrow, but high, ability range. Finally, Ndondo (1984), in a study on theoccupational aspirations of secondary school pupils, collected information on thelevel of education of the parents of 316 boys and girls from 14 secondary schools inthe Northern, Western, and Lusaka regions.
The four investigations show clearly that pupils with unschooled parents areunderrepresented in schools: in the general population, 24.2 percent of the adultmen and 46.4 percent of the adult women had never been to school, but for theparents of the pupils in the surveys these figures were lower, 16.0 percent for fathersand 38.6 percent for mothers. However, pupils whose parents had secondary orhigher education are overrepresented in secondary schools: in the generalpopulation, 22.3 percent of adult men and 10.1 percent of adult women have hadsecondary or higher education, whereas in the surveys these figures were higher,29.8 percent for the fathers and 14.2 percent for the mothers of the secondary schoolpupils. The more highly educated tend to be better-off financially and more likelyto live in urban rather than in rural areas. Thus, we can say that well-off parentsare more successful than the less well-off in getting their children into secondaryschool and university, and the Eame holds true for urban parents. All this occursdespite the anonymous selection procedures used to determine which childrencontinue their education after primary school.
Two additional aspects of Ndondo's (1984) study are of interest. He providedinformation on the level of education of the parents of male and female studentstaken separately, and also on the educational level of the older siblings of hissample of secondary school pupils. Surprisingly, he found a relationship between

The Pupil in School and Afterwards 149
the educational level of the parents and the sex of the pupils. Both fathers andmothers of female pupils tended to have a much higher level of educationalattainment than the fathers and mothers of male pupils. It seems that more highlyeducated parents are likely to take special steps to ensure that their daughters arewell educated. For the siblings, Ndondo found that the older siblings of 31.8 percentof his sample had had no education, 10.3 percent had had primary schooling only,and 57.9 percent had had secondary or higher education. The latter high proportionwas found for both older brothers and older sisters, but was a little higher for sistersthan for brothers. In the absence of further information, explaining why such alarge proportion of older siblings had had no education whatsoever is difficult.Nevertheless, this finding reinforces the conclusion that pupils in secondaryschools tend to come from families that place a high premium on education andwhere several members of the family, whether parents or children, share similareducational advantages. Clearly Zambia is well along the road to producing a self-perpetuating educated class.
Children Not in School
Another question that needs examining is the number of children of primaryschool age who are not in school. Some information for the 1980 situation can bederived from the census, which states that almost half a million children in the 7-to14-year-old age group had had no schooling. In the country as a whole, both boysand girls were affected, but many more rural children were affected than urbanchildren: 42.3 percent of the 7-to 14-year-olds in the rural areas were not in school,compared with 28.7 percent in the urban areas. Data from the Ministry of GeneralEducation and Culture shows that 341,800 7-to 14-year olds were not in school in1980, but this figure is less reliable than the census figure. We should bear thisdiscrepancy in mind when considering the figures for other years, which can beobtained only from the ministry; they too could represent considerableunderestimates.
The total number of school-age children not in school increased steadily from1975 and reached a peak in 1982, although relative to the size of the school-agepopulation, the proportion of school-age children attending school has improvedoverall since 1975. The most recent information indicates that at least 350,000school-age children were not in school. To provide schooling for these wouldrequire an additional 8,000 classes and up to 5,500 teachers.
School-Leavers
Attention and resources tend to focus on those who successfully negotiate thevarious stages of the educational selection process. Less attention is devoted to thosewho do not go through the .iole system, except to decry the waste represented by thesecondary schools' inability to admit all grade 7 leavers and to express concernabout the utimebomb" this is supposed to create of discontented, alienated youngpeople who are characterized as loafers and seen as a threat to society's stabilityand security. The school-leaver question is a grave social issue in Zambia andother developing countries. With only imperfect information on its scale there isno consensus on how it should be addressed. This makes it important to establishthe magnitude of this problem and how its dimensions have been changing over theyears.

150 Education in a Declining Economy: The Case ofZambia, 1975-85
Table 14.2 provides information on the number of school-leavers at differentlevels. Note that the number of children terminating their education at grade 4decreased from 23,586 in 1975 to 11,795 in 1985. This reflects the reduced number ofincomplete schools and the improvement in the transition rate from grade 4 tograde 5. At all other levels, however, the number of school-leavers increased,notwithstanding the rapid increase in secondary school enrollments.
'A'able 14.2 School-Leavers by Grade and Year, 1975-85
Number who left school at the end ofYear Grade 4 Grade 7 Grade 9110a Grade 12 Total
1975 23,586 69,369 7,793 7,341 108,089
1976 23,556 74,858 9,111 7,724 115,249
1977 23,596 79,694 9,948 8,307 121,545
1978 23,178 83,443 10,419 9,120 126,160
1979 18,392 85,330 10,851 10,426 124,999
1980 18,556 94,938 11,206 10,739 135,439
1981 15,458 96,694 11,280 11,491 130231982 13,103 96,836 12,069 11,678 133,686
1983 13,459 104,942 13,796 12,434 144,631
1984 10,371 104,126 13,726 13,253 141,476
1985 11,795 112,079 18,841 13,575 156,290
a. The figures in this column refer to school-leavers after grade 10 for the years1975-84. For 1985 they refer to a combined total from grades 9 and 10 because of the1985 reorganization.Sources: Education ministries (1978-81), Educational Statistics; Ministry ofGeneral Education and Culture unpublished data.
Secondary school-leavers compete for the appropriate available trainingopportunities and jobs, of which there are not enough to accommodate all of them.'a table 14.3 shows, in 1985, 5,845 people graduated from tertiary institutions, but
that same year 13,575 students left secondary school, leaving almost 8,000 studentswith no access to further education (assuming that the number of entry places wasroughly equal to the number of graduates). Since all the higher level institutionsreserve some places for people with work or postscileol experience, the ceiling ontraining opportunities for secondary school-leavers is reduced still further, to atbest somewhere between 5,000 and 5,500. Thus, admission to training institutions isbecoming increasingly difficult and competitive for secondary school graduates.Most institutions have raised their admission criteria, so only the top 35 to 40percent of those completing the full secondary cycle can obtain places in traininginstitutions. The remainder, together with almost all the leavers from juniorsecondary, grade 7, and grade 4, must ackjust themselves to the world of adult lifeand work. This means that about 150,000 young people, some of whom do not havean adequate base for the retention of literacy, most of whom had a poor and highly
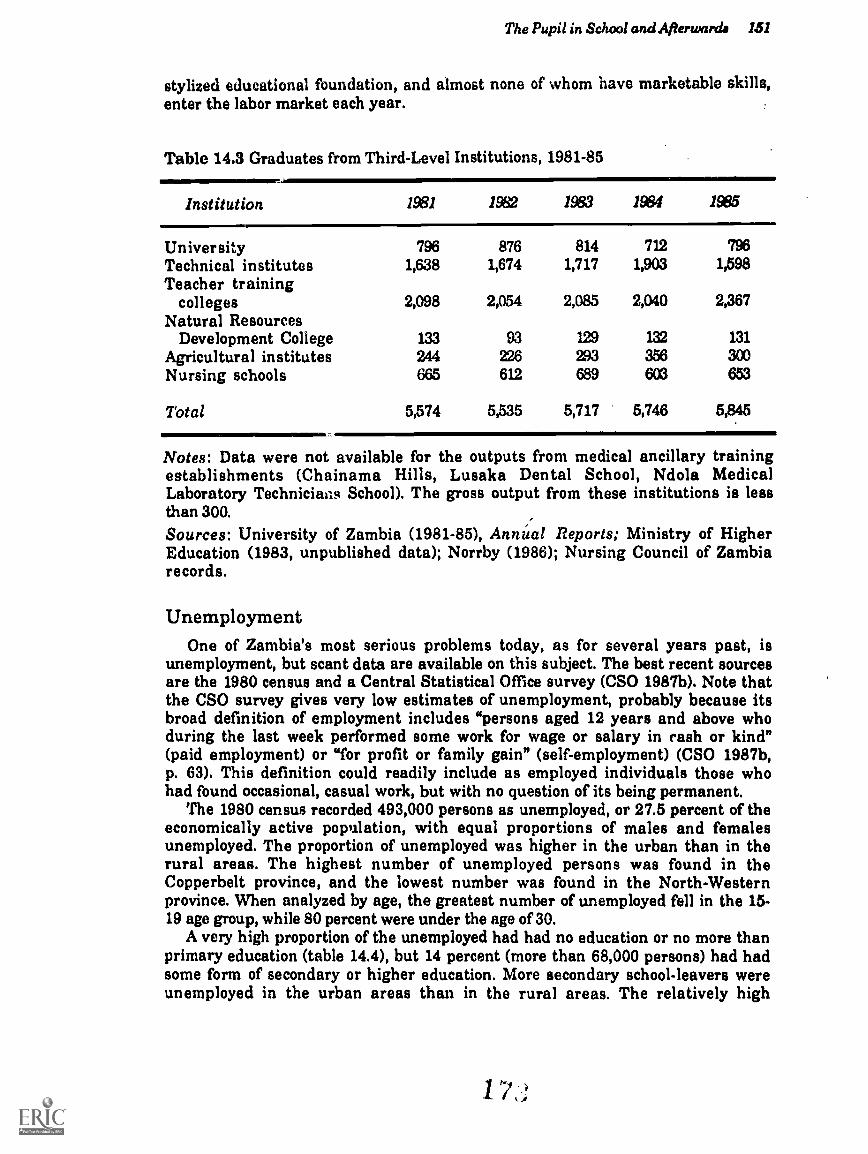
The Pupil in School and Afterwards 151
stylized educational foundation, and almost none of whom have marketable skills,enter the labor market each year.
Table 14.3 Graduates from Third-Level Institutions, 1981-85
Institution 1981 19W 1983 1994 1985
University 796 876 814 712 796Technical institutes 1,638 1,674 1,717 1,903 1,598Teacher training
colleges 2,098 2,054 2,085 2,040 2,367Natural Resources
Development College 133 93 129 132 131
Agricultural institutes 244 226 293 356 300Nursing schools 665 612 689 603 653
Total 5,574 5,535 5,717 5,746 5,845
Notes: Data were not available for the outputs from medical ancillary trainingestablishments (Chainama Hills, Lusaka Dental School, Ndola MedicalLaboratory Technicians School). The gross output from these institutions is lessthan 300.Sources: University of Zambia (1981-85), Annual Reports; Ministry of HigherEducation (1983, unpublished data); Norrby (1986); Nursing Council of Zambiarecords.
UnemploymentOne of Zambia's most serious problems today, as for several years past, is
unemployment, but scant data are available on this subject. The best recent sourcesare the 1980 census and a Central Statistical Office survey (CSO 1987b). Note thatthe CSO survey gives very low estimates of unemployment, probably because itsbroad definition of employment includes "persons aged 12 years and above whoduring the last week performed some work for wage or salary in cash or kind"(paid employment) or 'for profit or family gain" (self-employment) (CSO 1987b,p. 63). This definition could readily include as employed individuals those whohad found occasional, casual work, but with no question of its being permanent.
The 1980 census recorded 493,000 persons as unemployed, or 27.5 percent of theeconomically active population, with equal proportions of males and femalesunemployed. The proportion of unemployed was higher in the urban than in therural areas. The highest number of unemployed persons was found in theCopperbelt province, and the lowest number was found in the North-Westernprovince. When analyzed by age, the greatest number of unemployed fell in the 15-19 age group, while 80 percent were under the age of 30.
A very high proportion of the unemployed had had no education or no more thanprimary education (table 14.4), but 14 percent (more than 68,000 persons) had hadsome form of secondary or higher education. More secondary school-leavers wereunemployed in the urban areas than in the rural areas. The relatively high
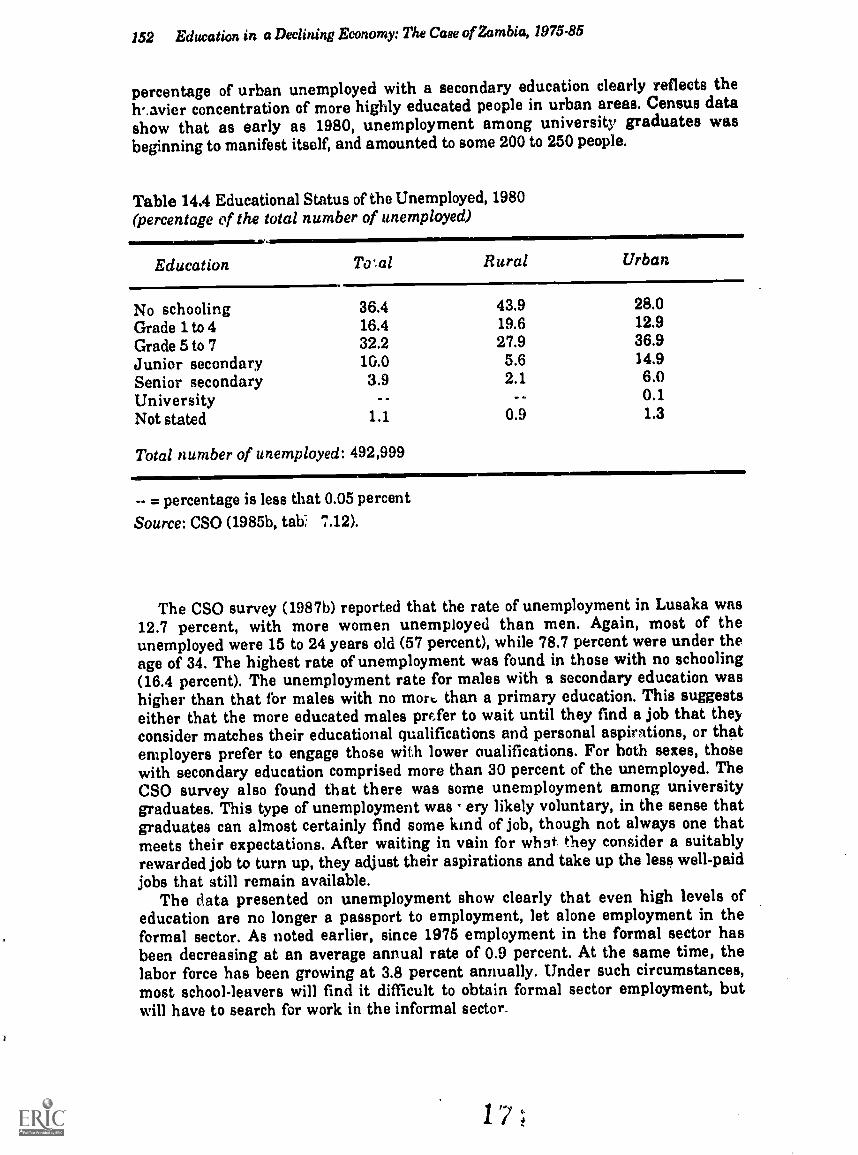
152 Education in a Declining Economy: The Case of Zambia, 1975-85
percentage of urban unemployed with a secondary education clearly reflects theh'.avier concentration of more highly educated people in urban areas. Census datashow that as early as 1980, unemployment among university graduates wasbeginning to manifest itself, and amounted to some 200 to 250 people.
Table 144 Educational Status of the Unemployed, 1980(percentage of the total number of unemployed)
Education Toal Rural Urban
No schooling 36.4 43.9 28.0
Grade 1 to 4 16.4 19.6 12.9
Grade 5 to 7 32.2 27.9 36.9
Junior secondary 10.0 5.6 14.9
Senior secondary 3.9 2.1 6.0University -- - 0.1
Not stated 1.1 0.9 1.3
Total number of unemployed: 492,999
= percentage is less that 0.05 percentSource: CSO (1985b, tali 7.12).
The CSO survey (1987b) reported that the rate of unemployment in Lusaka was12.7 percent, with more women unemployed than men. Again, most of theunemployed were 15 to 24 years old (57 percent), while 78.7 percent were under theage of 34. The highest rate of unemployment was found in those with no schooling(16.4 percent). The unemployment rate for males with a secondary education washigher than that fbr males with no mom than a primary education. This suggestseither that the more educated males pre,fer to wait until they find a job that theyconsider matches their educational qualifications and personal aspirations, or thatemployers prefer to engage those with lower oualifications. For both sexes, thosewith secondary education comprised more than 30 percent of the unemployed. TheCSO survey also found that there was some unemployment among universitygraduates. This type of unemployment was ery likely voluntary, in the sense thatgraduates can almost certainly find some kind of job, though not always one thatmeets their expectations. After waiting in vain for what. they consider a suitablyrewarded job to turn up, they adjust their aspirations and take up the less well-paidjobs that still remain available.
The data presented on unemployment show clearly that even high levels ofeducation are no longer a passport to employment, let alone employment in theformal sector. As noted earlier, since 1975 employment in the formal sector hasbeen decreasing at an average annual rate of 0.9 percent. At the same time, thelabor force has been growing at 3.8 percent annually. Under such circumstances,most school-leavers will find it difficult to obtain formal sector employment, butwill have to search for work in the informal sector.

The Pupil in School and Afterwards 153
The Informal SectorPrecise information on the size of the informal sector does not exist, but some
orders of magnitude can be deduced. In 1980, the toi.al labor force wasapproximately 1.8 million. With 493,000 unemployed and 381,500 employed in theformal sector, the balance (925,500), must have been employed in the informalsector. The CSO survey (1987b, p. 51) found that 42.4 percent of the labor force inLusaka were involved in informal sector activities. As for the distribution ofinforma: sector employment between rural and urban areas, with the exception ofthe large-scale commercial farms, employment on all other farms (subsistence,small- and medium-scale commercial farms) probably falls into the category ofinformal sector employment. On this basis, 66 percent of employment in theinformal sector is found in the rural areas.
One of the dominant eleracteristics of the informal sector is its lack ofregulation. Self-employment is a key concept, but an informal tyre of wageemployment is possible within the sector. Enterprises are frequently family ownedand workers may be unpaid family members. Operations are 1:An.ally
with a low capital-to-labor ratio and heavy reliance on indigenous resounes. Ahigh level of market competition is often present, but the goons and servicesprodeced may be of low quality. Access to credit is restricted and very littleopportunity to acquire or accumulate capital for injection into the enterprise isavailable. As wide range of skills is needed to ensure success in the informalsector, but participants develop most of these outside the formal school system.
The Informal Sector and the School CurriculumThe size and characteristics of the informal sector and its distribution over
rural and urban areas are of considerable importance for school-leavers. Theyshould therefore influence the school curriculum. From the data, large numbers ofschool-leavers must have been absorbed by the informal sector, especially in ruralareas, in recent years, else unemployment would have risen dramatically. Thus,both primary and secondary schools should somehow address the special learningneeds of those who will be absorbed into informal sector employment. However, theschools do not do this. In fact, educationists do not know what these special learningneeds are. Thus, the first step toward preparing school children for informal sectoremployment is to determine the knowledge arsd the skills required in this sector.Some things can be taught in schools, such as the management of small-scaleenterprises, simple bookkeeping, practical electronics, access to credit, cooperativeand credit union movements, and farm management. However, these subjectscannot just be tacked on to the curriculum, This would lead to the sameunsatisfactory outcomes as exper4enced from the addition of practical subjects to thecurriculum or from the inclusion of some technical subjects in an academiccurriculum in the hope that this would then constitute technical education.
If the primary and secondary schools are to provide the kind of education thatmost of their pupils will need, then the curriculum must no longer be directedtoward a final examination designed to secure entry to higher education, andultimately to formal sector employment. Instead of being concerned with theacquisition of d set body of knowledge, the curriculum should be directed toward thedevelopment of the skills and attitudes that will facilitate transition from school tothe world of work. Such a major change could not be undertaken withoutconsiderable political will and popular support. Traditional forms of education

154 Education in a Declining Economy: The Case of Zambia, 1975.85
were able to prepare their pupils for the real world, but similar success has eludedthe formal primary and secondary schools as they are currently organized andoriented. The past still haq much to teach us.
r
1 1t'i l.)

15Educational Supervision, Planning,
and Decisionmaking
What goes on within the formal education system is greatly influenced by twoseparate groups within the educational bureaucracy and their interaction with eachother, namely, the supervisory and planning authorities belonging to the educationministries. Through professional activities related directly to the work of schools,educational supervisors or inspectors monitor the schools' success as institutions oflearning, while through their interactions with policymakers and planners, theyhelp shape the ideas that should enable the education system to respond to the goalsestablished for it. Indeed, through this interaction, the inspectors, together with
-k policy and planning personnel, teachers, and parents should be constantly re-examining the aims of the education system and making whatever adjustmentsare required by developments at the local, national, and international levels. Inaddition to this basic function that they share with the inspectorate, the planningpersonnel within an education ministry have the task of converting issues, ideas,and policies into attainable plans. Clearly these two groups, the inspectors and theeducational planners, are of pivotal importance with an education ministry. Thus,we will examine the extent to which their activities have been affected by difficulteconomic circumstances, such as those that beset Zambia during 1975-85.
The InspectorateThe inspectorate should be an important agency in the promotion of educational
quality in Zambia. The members of this section of the education ministriesconstitut the most direct link between the ministries and educational practitionersin the classrooms. Their primary task is to provide an advisory service within theschools aimed at improving teacher competence and facilitating the learningenvironment. Their other responsibilities include involvement in curriculumdevelopment, examination setting and marking, in-service teacher education,and professional associations. Inspectors see for themselves how teachers areteaching and schools arc functioning. From persor al contact with teachers andschools they learn how a curriculum and its comp:Tient syllabuses are translatedinto classroom practice and how meaningful it is to pupils. They support teachingactivities through the professional advice and feedback they can supply to teacherson the content and method of their teaching and on the availabilit, and use ofequipment. They have been characterized as sales representatives of educational

156 Education in a Declining Economy: The Case of Zambia, 1975-85
ideas, but they also learn from the schools about teaching content and method andabout the improvisation and use of resources.
The decline in the financing of education has affected the inspectors' primarytask most severely. Their number has not increased in proportion to the increase inthe number of schools and teachers. Rather, it has decreased (table 15.1). In 1975,th ere were 80 primary school inspectors for just over 18,000 teachers; this figure wast} e same in 1984, when there were more than 27,500 teachers, and for 1987, when thenumber of teachers was even larger, the number of inspectors was reduced to 75. In1975, one inspector was respcnsible for 225 teachers on average; today that inspectoris responsible for more than 400. The same holds true at the secondary level. In 1975the ratio was one inspector to 160 teachers, in 1980 it was one to 220, and in 1985 one to360. Ever. without other constraints, this would make visiting individual teachersfrequently impossible.
Table 15.1 Number of School Inspectors, Selected Years
Location 1976 1983 1987
At central headquartersChief inspector 1 1 1
Deputy chief inspector 1 1 1
Senior inspector 5 5 4Inspector 21 27 15
Total 28 34 21
At regional officesInspector of schools o2 21 21Senior regional inspecter 0 9 9Senior primary school inspector 30 21 21
Primary school inspector 80 80 75
Total 142 131 126
Grand Total 170 165 147
At Ministry of Higher Education 13
= not applicableSource: GRZ (1976, 1983, 1987), Establishment Register.
Other constraints are present, however. Since 1973, the inspectorate has suffe-from insufficient transport and from inadequate traveling funds. Resources were80 limited in 1976 that seconda7 inspectors were restricted to 11 nights of touringeach. In 1981, the only year that brought some improvement in the allocation fortravel, inspectors were able to visit only one-seventh of all secondary school

Educational Supervision, Planning, and Deciitionnzaking 157
teachers. At the primary level, the number of national and district inspections ofschools and teachers declined steadily. In 1975, district inspectors visitedapproximately one-third of the primary schools, but by 1985 this had fallen to aboutone-twelfth. Clearly, the inspectors are no longer able to discharge satisfactorilytheir primary task of providing an advisory service on the spot to teachers andschool administrators.
The inspectors now devote their time to their subsidiary professional tasks andvarious administrative duties. Three areas in particular appear to absorb the timeof secondary school inspectors: cooperation with the Curriculum DevelopmentCentre in producing syllabuses and writing supporting teaching materials;setting, marking, and standardizing public examinations and trainingexaminers; and organizing and teaching courses, seminars, and workshops forsecondary school administrators and teachers. Because of their intimateawareness of the critical shortage of educational supplies in schools, mostinspectors have also become involved in efforts to alleviate the problem, even to theextent of becoming, at times, procurement officers. They have also worked closelywith professional subject associations to produce teaching notes and economicallypriced journals and magazines. The primary school inspectors have a similarrange of subsidiary professional duties: mounting courses, promoting the resourceteacher and resource center concept, and trying to alleviate the shortage of teachingmaterials in schools.
The inspectors' actual workwhen they manage to visit schoolshas also beencomplicated by the financial decline. If the sclicol is rural, the inspector is likely tobe the only education official to visit it. The school may be experiencing manykinds of problernsoverenrollment; insufticn stettt; staff housing problems;disciplinary issues; lack of textbooks, exercise books, and writing materials; andso forth. All of these problems are presented tc inspector on arrival. Much of thetime that the inspector would prefer to spent' with techers in the classroom must bespent instead with the school adminictrators, sorting through their prcble is andproviding advice. In other words, the multitude of problems the schools areexperiencing, many of them because of the financial crisis, are tending to deflectthe inspector from the role of "itinerant teacher educator" (Ministry of' Education1977, p. 67) and turn him or her into a fzetotum who will assuage all the ills of thebeleaguered schools. Thus financial problems hinder the inspectors' work in twoways. First, they cannot get out as often as they should to visit the schools; andsecond, when they do succeed in getting to the schools, the financial problems diverttheir attention from the tca hing-learning interchange in the classroom.
Educational PlanningShortly after independence, a development planning unit was established
within the Ministry of Education to plan for the expansion of educational provisionat the national level and manage the execution of development p %.jects. In 1976, theunit was freed of the latter responsibility so that it could focus on planning. As aprerequisite for its planning activities the unit requires comprehensive, reliable,and up-to-date data. Hence its secondary preoccupation has heen with thecompilation of CLatistics from educational institutions.
The planning unit's relationship to primary school development is somewhatcomplex. Regional authorities plan and exe-ute primary school projects, using forthis purpose capital funds allocated for all development at the regional level. Localauthorities also plan development undertaken on a self-help basis. The role of the

158 Education in a Declining Economy: The Case ofZambia, 1975.85
ministry's planning unit is to set targets for new grade 1 openings and for theupgrading of incomplete schools to ensure balanced national development. Theunit is also responsible for the execution of certain technical assistance projectsthat affect primary schools, particularly those SIDA finances for the supply ofdesks, readers, teachers' handbooks, and exercise books to schools. The unit is alsoinvolved in monitoring the organizational aspect of primary eduk:ation and ineffecting developments such as the extension of multiple session teaching or theconversion of primary schools with low enrollm9nts ',Ito multigrade schools.
The planning unit is also responsible for planning the development ofsecondary schools and until 1982, when the Ministry of Higher Education wasestablished, oversaw teacher training facilities. At these levels developmentinvolves large credits from the World Bank and other organizations. The ZambiaEducational Projects Implementation Unit manages and executes these projects.This semi-autonomous unit also executes, on behalf of the Ministry of GeneralEducation and Culture, the secondary school maintenance and rehabilitationprogram, which is supported by NORAD and the World Bank. The recentburgeoning of self-help basic schools means that the planning unit must now facethe problem of reconciling central control with local initiatives. However, thepressures of popular demand and political intervention are so great that the unithas not yet managed to bring about this reconciliation, with the resultantuncontrolled and unbalanced growth noted earlier.
The planning unit was greatly involved in the 1977 proposals for educationalreform (Ministry of Education 1977), and because of this involvement, exertedconsiderable influence on policy formulation. But this influence appears to havewaned since 1978. Since that time the unit has concerned itself principally withforecasting the need for school buildings and teachers, promoting self-helpactivities, gathering educational statistics, negotiating with aid agencies, andexecuting some aid-funded projects. Thus, instead of being a source of ideas abouteducational change and innovation, the planning unit confined itself toreinforcing the educational status quo by concentrating simply on making theexisting system bigger. It did not have the resources to evaluate educationalprovision or to use research findings to plan, manage, and generally improve theoverall system. The unit continued its annual data collection exercise, butperformed only a minimum of data analysis. The compilation of educationalstatistics fell behind from 1979 onward, with the result that comprehensive,reliable, and up-to-date information was not available to guide the ministry'sdecisionmaking activities.
In the etiov 1980s, the planning unit was revitalized through technicalassistance inisl 1.s from Sweden, which enabled it to undertake extensive trainingactivities in data collection, forecasting, and needs analysis. At the same time,local personnel have been sent abroad for training in educational planning andmanagement.
The reversal that occurred in the planning unit's status was due largely tounderstaffing and a lack of staff continuity. The small size of the approved staffestablishment also contributed to the staffing difficulties since it did not providescope for the recruitment of professionals in such areas as tne economics ofeducation (GRZ 1987, p. 35). Present efforts to strengthen the unit will not have theirdesived effects unless steps are taken to improve its status. Zambia would do well tohead the words of the Windsor Conference, in which its minister of educationparticipated:

Educational Supervision, Planning, and Decisionnsaking 159
What requires equally serious attention is the frequency with which staff withplanning responsibilities aro moved about, destroying continuky in datamanagement and control, and the low status or marginalization of planningstaff within some aninistTies, which effectively depreciates not only the advicethey may be able to give but the information at their disposal. The remedy liessquarely in the hands of the governments concerned (ODA.T.ILIE 1986, p. 50).
The downgrading of the planning unit after 1978 may also have been tue to twoinfluences arising from the economic crisis of the 1970s, one at the internationallevel and the other at the national level. At the international level, somedisenchantment was being expressed with education as the great equalizer or theinstrument of modernization. Despite massive investments in education, thepoverty and inequalities that remained cast doubts on education's role inpromoting material advancement. In particular, concern was growing thatconcentratioa on formal educational provision through schools and colleges wasdiverting resources from the needs of the poor that, critics felt, could be moreadequately addressed through a wide variety of nonformal educational activities(UNESCO 1972). Thus, doubts about the valne of expanding forrnal educationalprovision could be expected to attach themselves to the unit with responsibility forsuch expansion, and hence to contribute somewhat to reducing its importance az anadvisory unit.
At the local level, the virtual cessation of capital funds, except for the universityand for externally supported projects, meant that little physical development couldtake place. The planning unit appears to have been oriented mums toward suchquantitative expansion than toward improving the effectiveness and quality ofprimary and secondary education. Until it could address itself more strenuously tomaking the system perform better, it tended to be outside the mainstream ofeducational activity and decisionmaking. However, the unit was unable to changethe direction of its activities as quickly as it should have done because it lacked aresearch arm that could have provided it with good information on the quality ofeducation in the schools, the possible underlying causes, and the remedial stepsnecessary. In brief, the recession underlined the need t.o pay more attention toqualitative issues, but the planning unit was not well equipped to deal with these. Inconsequence, it lost much of its importance and ceased to have the major advisoryrole that it had played in the past.
The Educational Reform MovementThe educational reform movement of 1974-78 was the culmination of efforts to
expand educational provision in the immediate postindependence years, to removeconditions that led to unequal access, and to relate the content of education toindependent Zambian society. The very development of the system in the yearsafter 1964 had created a host of problems. The speed of its growth outstripped thesupply of qualified and experienced teachers, particularly at the secondary level.After the first few years of massive growth, the rate of expansion slowed down, to theclnsternation of the public. Fears were expressed about a "serious decline ineducational standards (judged by examination results)" (Jolly 1971, p. 54), andconcern was growing about the increasing number of bchool-leavers who werebeing eliminated from the school system without adequate preparation for adultlife. Concern was also expressed at the imbalances and inequalities that weredeveloping in society and the role education might be playing in giving rise to

160 Education in a Declining Economy: The Case ofZambia, 1975-85
these. Several of these concerns surfaced at the First National EducationConference, held in 1969, and in his opening address to the Conference, PresidentKaunda called for a fundamental reform of educational policies.
Initial steps to reshape objectives and curricula were made during the period ofthe Second National Development Plan (1972-76), which faced up to the problem thatfor many years to come, most children would receive no more than seven years offull-time schooling and hence that the primary school must
help children to prepare themselves for a productive life in theircommunities,whether rural or urban. It should foster children's self:confidence and self-
reliance by arousing vocational interests and teaching practical skills, and byhelping to make intelligible the social and economic changes which theircommunities are undergoing. The community itself should in fact become amAjor instrument of education (GRZ 1971, pp. 128-9).
Although curricula were diversified and a new Zambia Primary Course wasintroduced, the earlier problems persisted. In 1975 a representative group ofeducationists found that the education system encouraged white collar aspirationsamong young people, fostered social stratification based on educational attainmentand income, paid too little attention to practical skills, tended to alienate childrenfrom their own environment, and did not inve've the community in educating andtraining young people (Ministry of Education 1975).
It was against this background that the educational reform movement waslaunched in 1974, and culminated in 1978 in the publication of the government'sdefinitive reform proposals, Educational Reform, Proposals and Recommenda-tions (Ministry of Education 19"). The reform exercise, the national debate thatformed an integral part of it, and the relationship of the final document to the draftstatement on educational reform (Ministry of Education 1976a) have been thesubject of extensive treatment i the educational literature. The issues thatattracted the greatest attention were the ideological implications of the change fromthe radical draft proposals to the more conservative recommendations a the finaldocument, am. process of formulating educational policy. The literature haspaid less attention to the actual contents of the approved proposals beyond a tendencyto write ther Am a "restatement of the position prior to 1974" (O'Brien 1982, p. 229)or as a "comprehensive reversal of all the previous radical proposals" (Clarke 1979,p. 6). No attention was devoted to the greatly revised draft proposals that Ministry ofEducation officials and university personnel developed in response to publicreaction during the national debate, or to the circumstances that led to the exclusionof these proposals from the final document
Essentially, the reforms are concerned with gradual changes in the establishedsystem. They pay special attention to the way the system's quality can be improvedand its standards raised. They are not concerned with radical or revolutionarychanges. The incrementalist model that this implies has been associated with theinfluence of elite groups. O'Brien (1982, p. 228) describes the final plan asrepresenting "the interests of the emerging middle-class and those who had aninterest in retaining the status quo," while Lungu writes that
it is readily apparent that...elites or the well-to-do sections of the Zqrnbiansociety have the upper hand in the formulation of educational policy. Evident,too, is the preference for gradual reform strategies rather than the officiallydeclared "radical" changes (Lungu 1985, p. 294).
Educational Supervision, Planning, and Decisionrnaking 161
But it could hardly be otherwise. Educational Reform itself notes that 'educationis a social institution which will continue to reflect the characteristics of Zambiansociety* (p. 6), and one of the features of society in Zambia is the presence of anarticulate and literate minority who greatly influence the decisions that affect themajority. Zambia is not alone in this, and history demonstrates that even whensocial differences are eradicated by radical measures, they reassert themselves innew forms, oft.-- through the system of formal education (Coombs 1985, pp. 216-7).Merely dem. '.1ie way in which decisionmaking must take cognizance of elitesand power groups is not a productive exercise. Instead, trying to ensure that therights and needs of the less powerful are well served and that they can share in thefruits of national development would be mure
The Educational Reform Movement and the Decline of the Economy
Although the economy was still reeling from the body blows inflicted by thegeneral world recession and the collapse of copper prices, no sense of financialhardship restricted the activities or the scope of the reform movement. In 1975,education officials traveled to several foreign countries to study their educationalreforms; seminars with over 100 participants were organized in 1976 and 1977; alarge drafting committee spent twe weeks "in retreats' at an expensive hotel in 1976working on the initial document; over 40,000 copies of the 81-page draft statementwere distributed free, and summaries were published in heavily subsidized locallanguage newspapers; a second retreat group devoted more than three-quarters oftheir working days over a period of four-and-a-half months to the preparation of anew draft; and secretarial services, stationery, and transport were freely availableat qll times during the exercise.
If activities directed toward reform proposals could go ahead as if a worseningfinancial situation did not exist, so also the proposals themselves appeared to takelittle account of the harsh economic realities of Zambia's situation in 1976 and 1977.The draft statement spoke of the need to commit "ever-increasing public funds tocover the capital and recurrent costs of the new educational system," but statedcategorically that school fees would not be introduced as the revenues they mightrealize "cannot offset educational costs significantly, unless fees are very high"(Ministry of Education 1976a, p. 49). Instead, it proposed that new sources ofrevenue be found for educational development by way of deductions from workers'salaries, a levy on the net profits of all business enterprises, and the revenues fromschool production activities. The approved reform proposals reiterated the need foran everincreasing allocation of public funds, but stated that although it encouragedparental contributions, the policy of completely free tuition and boarding wouldremain. Elsewhere the document indicated the scale of additional capital andrecumnt funds that would be needed to implement its proriosals on the provision ofnine years' basic education. However, beyond the acknowledgment that this wouldbe a formidable task, there was no recognition that the proposals would be affectedby the worsening economic situation. This apparent indifference to financialrealities was far removed from the minister of education's observations nJanuary 1977:
...our reforms exercise is entering its final stage at a time of almostunparalleled financial difficulty.... It would be foolish to pretend that thisgrave situation has nothing to do with the proposed reforms, or that we canseriously propose changes in our educational system without regard for the
183

162 Education in a Declining Economy: The 17cise of Zambia, 1945.85
economic and financial realities which stare us in the face and preoccupy our
every working day (Goma 1977, p. 4).
The policymaker ack of attention to the financial stringencies means that evennow several of the proposals, especially those concerned with extending nine yearsof education to all children, show no possibility of being implemented in the near&two.
Content of the Educational ReformsThe salient features of the approved educational reforms are as follows:
The aim of education is to develop people's potential to the full for their owwell-being as well as that of society. Education must reflect t..echaracteristics of society, but society must also be influenced by education.
Production work and service to the school community and nation are to beamong the main features of education and are to be emphasized in thecurriculum. However, production is to be used principally as an educationaltool and not as an economic measure.Universal basic education is to be provided through nine years of schoolingfor every child from the age of seven; the first step in attaining this goal is toenable every child to enter grade 1 and to proceed through to grade 7. Theexisting structure of seven years primary, three years junior secondary, andtwo years senior secondary (7 - 3 - 2) is to be changed, in the interim, into a 72 - 3 system, and eventually into a 6 - 3 - 3 system.Responsibility for programs outside the formal education system, such asliteracy programs or those for out-of-school youth, should rest with ministriesother than the Ministry of Education.The curriculum should consist of core subjects that provide a generaleducation and optional subjects, including practical subjects, that are to bestudied in greater depth.English should continue to be the medium of instruction from grade 1. Thestatus of Zambian languages should be improved and the university shouldextend its work here.Examinations will continue to be used for certification and selection. Theyshould seive to test knowledge and understanding, to provide an incentive forhard work, and to improve quality. Continuous assessment should be used inthe teaching-learning process. It could also play a part in certification and, inborderline cases, in selection. Attitudes could be assessed, but suchassessment should play no part in certification or selection.Preservice training of teachers should be for two years on a full-time basis.Because the success of the system depends on teachers' competence,commitment, and resourcefulness, efforts should be made to improve theirstatus and encourage them to remain in the system.Am.reciation is expressed for the role played by voluntary organizations andmission agencies in providing education, and their continued participationis encouraged. Private schools will be allowed, subject to compliance withregulations.Local participation in decisionmaking on educational matters is advocated,but before more serious responsibilities can be devolved on the local
isi

Educational Supervision, Planning, and lecitionmaking 183
community, it must show itself mature enough by its invo,vement in othermatters, notably in self-help projects.There should be "positive discrimination" in favor of the handicapped in theprovision of educational facilities and amenities.
Status of the Educational Reforms, 1978-84After 1978 the educational reform movement made slow progress. Indeed, in
many respects it ran out of steam, although whether this was because ofdisillusionment with the outcomes or because of the growing realization that thefinancial resources to implement the reforms were beyond the country's capacity isnot clear. The education and training chapter of the Third National DevelopmentPlan (1979-83) was elaborated on the basis of the reforms, but significantly it spokeabout beginning the implementation of only part of the reforms (GRZ 1979, p. 342),stressed the least capital-intensive aspects, set universal entry of seven-year-oldsto grade 1 and automatic promotion from grade 4 to grade 5 as targets, and confinedcapital investment to the completion of earlier projects rather than to thecommencement of new ones. Apart from the rather general statement of intent inthe plan, there was no coherent attempt to translate the reform proposals from anagenda for action into a plan for implementation. Instead, the plan focused onspecific issues that were assuming increasing importance because of the decline ofreal resources.
Almost all the issues that preoccupied education officials in the years after 1978were related to quality aspects of educational provision. Thus, the Ministry ofEducation's annual reports referred increasingly to the difficulty of ensuring anadequate supply of textbooks and exercise books at the primary level. The firstreference to inadequate equipment, furniture, and books at the primary leveloccurred in 1978, but thereafter the matter was mentioned every year. At thesecondary level, the issues of concern were the deteriorating condition of schoolbuildings, the need to use laboratories for regular class teaching, and theincreasing difficulty in obtaining textbooks and science supplies. The quantitativeaspects did, of course, also receive attention. Those that caused most concern werethe inability to respond to the rising demand for increased access to education at alllevels, overcrowding in urban primary classrooms, and "the abominable legacy'(Ministry of Education Annual Report 1977) of double sessions.
Nevertheless the system continued to expand and to outstrip the allocation offunds. In the absence of sufficient resources to meet all its needs, senior educationofficials were obliged to devote more of their attention to the multiple adjustmentsneeded to keep the system operating. Problems that might have been dealt withexpeditiously by a visit from a mid-level officer, or that might not have arisen ifmore resources had been available, tended to be directed to an unnecessarily highlevel for solution. An increasing amount of time had to be devoted to negotiationswith suppliers of educational materials or with aid agencies anxious to helpalleviate the shortages. Every decision that involved a commitment of fundsrequ'red more careful scrutiny and a more cautious approach than would have beenneeded in easier financial times. The result was that education officials became sopreoccupied with keeping the education system going that they did not have the timeto think about its purpose or destination. Neither did they have the opportunity todevelop a comprehensive plan to implement the reforms. At an early stage of theevolution of the reform proposals, the secretary general of UNIP had noted that a
185

164 Education in a Declining Economy: TheCase of Zambia, 1975.85
feature of the Zambian education system was that
...the educational train is on a single track whose destination seems to be the
school certificate examination, or even something beyond that. Yet, almostwithout stopping, the train attendants eject mostof the passengers at pointsalong the way (Ministry of Education 1976a, p. 79).
The main thrwit of educational endeavors in the early 1980s appears to have been tokeep this train on its track.
These comments are not intended as a criticism of the officials in the educationministries. Over several difficult years, their duty was to keep the educationsystem operating as efficiently as possible, regardless of problems and shortages.They did so extraordinarily well, bnt they did not have the opportunity to reflectdeeply on the 1977 reform proposals, to evaluate and criticize them in the light ofchanging financial circumstances, or to set about translating them into acomprehensive plan of operations. Neither could they undertake a thoroughassessment of the entire educational process, although once they received theopportunity to do so, senior education policymakers showed their readiness to graspthe need for new directions.
An example of this was seen in January 1985 when the Economic DevelopmentInstitute of the World Bark conducted a seminar in Nairobi. Officials fromeducation, finance, and planning ministries in a number of anglophone Africancountries, including Zambia, participated. The seminar gave participants anopportunity to reflect on the financing of their education systems, the directionsthey were moving in, and possible options (Kelly 1985). Although one cannot pointwith certainty to a cause and effect relationship, the twelve-months following theseminar saw the implementation in Zambia of several of the proposals raised inNairobi, for example, the reintroduction of boarding fees, the beginning ofdiscussions about some form of payment by beneficiaries of higher education, amore vigorous encouragement of private schools, greater concern about theimprovement of educational quality, a greater preoccupation with the problemsinherent in the explosive growth of the school-aged population, and a generallywelcoming attitude to the Provision of Education for All report (Kelb and others1986), despite the many new departures that it proposed.
The Education Reform Implementation Project
In many ways, The Provision of Education for All (the Educational ReformImplementation Project or ERIP report) (Kelly and others 1986) rounded off theeducational reform movement by its efforts to express some of the major reformproposals in operational form, with targets and costs spelled out on an annual basisup to the year 2000 and vdth concrete proposals on how to meet these costs. Thedocument also shows how many teachers will be required on an annual basis andwhat must be done if output is to attain a desirable level of quantity and quality.There is considerable coverage of the examination system and of areas in which itcan be reformed so that it can better serve intrinsic educational objectives. Quality,with special reference to educational materials and curriculum development, andrelevance, with emphasis on the role of the community and parent teacherassociations, are considered at length. The principal quantitative element of thereport is that population growth is so rapid, the educational backlog so marked, andthe economic prospects so poor that the only target that can be realistically aimed atis universal primary education by the year 2000. Hence it accords the highest
I 6;

Educational Supervision, Planning, and Decisionmaking 165
priority to the development of primary education (and of the supporting teachereducation sector) so that every child can in time be assured of seven years of topquality, relevant education.
The ERIP report was transmitted to the Ministry of General Education andCulture in 1986, but the ministry has not commented on it formally as yet. However,the report is being used extensively in training sessions for education planningofficers and senior education personnel, has had some of its recommendations,tables, and language incorporated in the 1987 annual plan, and has been used as thebasis for the ministry's submission for the Fourth National Development Plan(1987-91). Although all this indicates that the report has been well received, itastatus will remain doubtful until the ministry makes a definite pronouncement.This uncertainty is inhibiting decisions not only of ministry personnel, but also ofaid agencies.
Forms of Educational DecisionmakingThe foregoing account of the educational reform movement demonstrates that
educational decisionmaking in Zambia takes many forms. Popular participationdominated in 1975-77 when the reforms were being elaborated. Decisionmaling inreaction to circumstances also occurs, for example, the decision to reintroduceboarding fees in schools. Here, in contrast to the open model of 1975-77, many of thedeliberations took place behind closed doors. Decisionmaking by decrees made at ahigh political level is also found. Striking examples were the 1975 decision onestablishing a federal university, when the policymaking bodies at the universitywere by-passed (Nyirenda 1986, p. 13), and the 1982 decision to establish a Ministryof Higher Education. Finally, there is decisionmaking by delegation, whereevaluation studies are commissioned that will provide the basis for policydecisions. These have a long history in Zambia, from the Radford Commission,which recommended the direction educational development should take in whatwas to be Zambia (UNESCO 1964), and the Lockwood Commission, which advisedon the establishment of the university (NRG 1964), to the ERIP report on theimplementation of the educational reforms (Kelly and others 1986).
These methods of decisionmaking are not unique to education. Publicinvolvement, reaction to circumstances, and commissioned evaluation studieshave all played their part in guiding Zambia's decisions in the political andeconomic spheres, as well as in the educational sphere. However, direct publicparticipation is problematic because it tends to be very costly. The cost could bereduced in the education sector by giving more formal recognition to groups such asparent teacher associations that would represent the public.
The Personnel Needed for DecisionmakingAlthough the education sector as R whole has grown enormously, the staff of the
education ministries has not increased accordingly. In 1975, the ministryheadquarters had 278 staff members; in 1985 it had 275, with an additional 87 postsat the more recently established Ministry of Higher Education. Of this grossincrease of 84 posts, 34 were secretarial positions and 23 were in the financesection. At the regional level, the number of posts declined overall.
Another striking feature of the education ministries is the large proportion ofjunior officers and the small proportion of mid-level and senior officials. Thepersonnel structure of the ministries bears a close resemblance to the structure of
1
166 Edt. ehon in a Declining Economy: The Case of ZambSa, 197345
the education system itself: a pyramid with a very wide base that narrows rapidly.Mere inspection of the establishment structures for the two minisries does not
reveal the processes involved in formulating policy or in executing decisions, butthe impression that only a limited number of officers at headquarters canactually contribute to the formulation of proposals, the development ofpolicy, or theexecution of decisions. Much depends, however, on the mechanisms established forconsultation within the ministries and on whether senior officers see themselvesas playing an almost exclusively executive role or one that allows more scope forinput to the decisionmaking process. The same holds true for chief educationofficers in charge of regional offices. Clearly, as the heads of educationaladministration at the regional level, these officers have executive responsibilities,but as they are in operational cortact with teachers and institutions, they also havemuch to contribute to overall policy formulation ane decisionmaking. It is notclear that much prominence has lx4en given to this important function of the chiefeducation officers.
The preponderance of low-le-0 Ifficers in the ministries, and the sluggishgrowth in the number of mid-kvel personnel in comparison to the growth of theeducation system as a whole, are probably among the factors that have contributed toan acknowledged slowing down in the ministries' handling of routine business.This inefficiency has resulted in considerable demoralization of teachers in thefield, and in 1987 the minister c.ir general education and culture pinpointed it asone of the causes of a teachers' strike:
Teachers should bear with the ministry whose staff at headquarters could notcope with the growing teaching servi-e.... (The Minister) apologized for theinconvenience caused to teachers and promised that the entire section atheadquarters would be reorganized (Times of Zambia, March 10, 1947,.
Reformed structures and procedures are doubtless needed within the educationministries. Education and training are also required (Lungu 1986). In the absenceof these corrective measures, the weakness that pervades the administration of theentire education system, but that is concentrated at headquarters, will aggravatethe financial difficulties and will frustrate efforts to deal with the economicproblems.

16Continuing Education Programs
In common with most countries, Zambia provides continuing educationprograms to complement or extend the education acquired in school, to enableyoung people and adulcs to acquire practical skills or useful knowledge, and tomeet some of the needs for personal development and self-expression. Again, as inother countries, continuing education programs constitute a bewildering m dleythat involves various institutions. Some are of a formal nature and lead to clearlydefined outcomes. Others are much less formally organized. No systematicattempt has been made to develop an inventory of nonschool educational andtraining opportunities or to estimate the resources devoted to providing them.Neither has any attempt been made to compile a register of training or furthereducational opportunities for school-leavers at various levels. Young people'sknowledge of these programs is sketchy and is obtained in an informal andfreqmintly incomplete way. This review does not set out o identify all theeducational and training possibilities and their development in years of economichardship. Instead it confines itself to the programs offered by the Department ofContinuing Education in the Ministry of General Education and Culture andattempts to assess the impact the financial crisis has had on their availability andpopularity.
The Department of Continuing EducationThe main focus of the Department of Continuing Education is on formal
education. It provides ad,ilts who may not have had an opportunity to undertake orcomplete formal education to do so through part-time study. It also provides thosewho have failed public examinations with an opportunity to prepare themselves foranother attempt. Given the high premium that Zambian society places oncredentials, it is not surprising that most of the students for which the department isresponsible see its primary role as helping them to "obtain paper qualificationsbecause society and employers demand these before they recognize the worth of anindividual" (Ministry of Education 1977, p. 56).
The department is responsible for four types of educational activity:
providing junior and senior secondary courses to students enrolled in theNational Correspondenc College;
167 8

168 Education in a Declining Economy: The Case of Zambia, 1976.85
organizing and managing supervised study groups and providing them withlearning materials produced by the National Correspondence College;organizing and teaching evening classes for adults;arranging training in specific skills for recent school-leavers and adults.
In addition, the department provides teaching and administrative staff for generaleducation classes in all the major visons.
The National Correspondence CollegeNotwithstanding the education ministry's financial problems and students'
difficulties in getting the necessary fees, enrollment for correspondence programshas imreased from about 21,000 in 1975 to some 36,500 in 1985. These figures can,however, give a misleading impression, since a very large proportion of theenrollees are inactive; they are forma)'y registered for courses but do notparticipate. In 1976, about 73 percent of the students were active, but reports indicatethat this figure dropped to 40 percent during the year.
Most correspondence students are located in urban centers, where postalservices and study facilities are better than in rural areas. The Third NationalDevelopment Plan envisaged moving the college from Luanshya, considered to betoo remote to serve correspondence education effectively, to Lusaka. But, this movedid not take place because of the lack of accommodation for staff in Lusaka.However, the college's location in Luanshya will not serve to promote its status orfacilitate a more dynamic and professional use of the correspondence mode ofeducational delivery.
Supervised Study GroupsThe supervised study group scheme was desigrud to give unemployed primary
school-leavers who could not proceed to secondary sthool or to training institutionsan opportunity for ongoing education. The scheme b-gan in 1972 and initiallycovered the junior secondary level only, but in 1979 it was extended to :r,ludestudents preparing for 0-level examinations. The scheme was clearly aimed atthose who had completed grade 7, but were not selected for grade 8. The groups of 30to 60 students study materials in regular secondary school subjects, sit the JSSLEafter three years, and if they pass at a levei comparable to full-time schoolcandidates and are young enough, may be selected to enter a regular seniorsecondary school. The scheme is a self-study program, supervised but not actuallytaught by a trained teacher.
Enrollment records are inconsistent, but apparently enro'dment has it isen fromabout 9,200 in 1976 to 12,000 in 1985. Approximately 2,500 new students enroll eacbyear. The success rate, in terms of examination performance, cannot bedetermined, since with the exception of 1980, can iidates from this cgtegory were notdistinguished from the other external candidates who took the JSSLE (some 10,000 to15,000 students in all). In 1980, of 2,093 study group students who s the JSSLE, 11percent obtained full certificates and 13.7 percent failed completely (Ministry ofEducation and Culture 1980 Annual Report). This can be compared with the 7percent of all external candidates who obtained fu 1 certificates during 1975 to 1979,and the 23.6 percent who failed completely. On the limited evidence of t'ais one year,study group students perform better than external candidates as a whole,. but

Continuing Education Programs 169
nowhere near as well as school candidates, whose pass rate averages about 60percent.
In 1980, 3.5 percent of the study group students entered senior secondary school,but constituted less than 1 percent of the admissions at that level. Unfortunately,information on their subsequent performance at the School CertificateExamination is unavailable, thus an assessment of the scheme's overall success isnot possible.
The scheme's development has been constrained by the lack of funds to paysupervisors and produce teaching materials in the quantity required. The numberof groups tends to fluctuate from year to :ear depending on the availability offunds. Unfortunately, disaggregating the scheme's costs from other costs borne bythe Department of Continuing Education is impossible. Hence we cannot comparethe scheme's costs with those of regular schools, programs for those who studyexclusively by correspondence, or evening classes.
Evening ClassesThe department's most extensive activity is the provision of evening classes.
These classes provide formal academic programs at the primary, juniorsecondary, and senior secondary levels. The enrollment is about 16,000 students, ofwhom approximately two-thirds are male. Participtition in primary eveningclasses has been gradually giving way to participation at the secondary level,which may indicate that the regular school system is meeting the need for primaryprovision. Alternatively, it could indicate that uneducated adults no longerunderstand the benefits of obtaining a primary school education.
Enrollments in evening classes tend to vary in relation to the amount of fundsallocated for this activity. Classes may have to be suspended because sufficientfunds are not released to pay teachers, or because payment arrears carried forwardfrom the previous year may reduce the funds available for the next year. The lackof stability in the allocation and availabiLy of funds has an adverse effect on themorale of all who organize, teach, and study it evening classes. This is probablyan additional reason for the decline in enrollments at the primary level, since theunsettling effect of uncertainty about the continuation of classes would not be offsetby the prospect of gaining a certificate that will help obtain employment.
Schools for Continuing EducationPrograms to teach specific skills are provided in 12 schools for continuing
education. The objective af these schools is to teach locally useful skills, but at thesame time the participants may be able to prepare themselves, as study groupstudents, for formal examinations. The skills taught include leatherworking,pottery, tailoring, carpentry, and weav'ing, with schools concentrating on thoseskills for which human and material resources are avnilable locally. Although thenumber of continuing education schools increased from 6 in 1979 to 12 in 1982, theenrollment dropped from 2,648 in 1977 to 2,173 in 1985. This reflects the financialproblems that continually beset the Department of Continuing Education.
ConclusionThe general picture that emerges of the programs the Department of Continuing
Education offers is that they are marginal to the mainstream of educational
19 1
170 Education in a Declining Economy: The Case of Zambia, 1975.85
9rovision in the country and that they enjoy a low priority in resource allocation.This has led to an irregular pattern of expansion and curtailment determined bythe resources actually allocated, despite the enormous growth in the potentialclientele for the department's services. The very factor that brings about theparticipation of many of the department's students, the opportunity to reenter theformal school system, necessarily subordinates the deparanent to providing asecond-chance role. This appears to have prevented it from attending to the wideissues of adult education or to the provision of opportunities to develop marketableskills.
There is no doubt that the department's activities have been hampered byfinancial problems. As these grew worse within the education sector as a whole,continuing education suffered badly, and was the only education subsector obligedto offer educational services in so erratic a fashion. It might not have suffered sobadly if it had not been viewed as a parallel system, perceived by many as second-best, and patronized largely by those who wanted to get out of it as quickly aspossible. Hence, the adverse effect of the declining economy on the department'sactivities may be as much a reflection of the image the department projects as of thefinancial problems themselves.

17The University of Zambia During the
Years of Economic Difficulty
The University of Zambia opened in March 1966 with 310 full-time students, 20percent of them female, registered in degree studies in the natural sciences andeducation and in a diploma in social work. At that time the university functionedon two sites in Lusaka, the Ridgeway Campus for teaching and the site of the formerModes-Livingstone Institute for research.
Twenty-one years later, the university had grown into a federal structure, withconstituent institutions in Lusaka and Kitwe; operated from three sites in Lusaka,one in Kitwe and, through its extension wing, one site in each province; had anenrollment of 3,831 full-time undergraduate students (with a further 167 part-timestudents and 621 taking correspondence courses), of whom 17.8 percent werefemale, and 207 postgraduate students; was organized into 11 teaching schools anda Centre for Continuing Education; and had five research institutes.1
During its existence, the university has conferred a total of 491 postgraduateawards, 8,057 undergraduate first degrees, 609 diplomas, and 515 certificates. It hasraised the proportion of Zambians on its teaching and research staff from a tinyminority in 1966 to almost 50 percent, and has Zarnbianized most of theadministrative, technical, and support posts. To accomplish this it has devoted overone-tenth of its annual budget to a staff development program that has providedmore than 2,500 staff-years of training for academic and senior administrativestaff and over 600 for staff at other levels.
The analysis that follows seeks to ulitierstand these developments in the light ofthe guiding principles set out for thE university at the time of its establishment,bearing in mind the financial constraints that have become so pronounced since1975. The Lockwood Report enunciatei these principles when it stated that theuniversity "must be responsive to C.1 real needs of the country (and) secondly itmust be an institution which on t erii; will win the respect and recognition of theuniversity world" (1NTRG 1964, p. 1).
1. This chapter was drafted before the announcement in July 1987 that the federal structureof the university was to be dissolved and that separate universities were to be established, one inLusaka and the other on the Copperbelt.

172 Education in a Declining Economy: The Case of Zambia, 1975-85
Admissions and EnrollmentsEach year the university admits 900 to 1,100 students on a full-time basis for
degree, diploma, and certificate courses in Lusaka or Kitwe, together with anadditional 150 to 200 students for correspondence courses. About 80 percent of theadmissions are school-leavers. Thus, the university admits annually about 880 ofthe roughly 8,000 students who pass the School Certificate Examination. But eventhis highly selective procedure does not ensure enough suitably qualifiedcandidates in the sciences because of the low levels of performance in mathematicsand science at school. For school-leaven, admission is based on their performancein five acceptable subjects. This criterion is rigidly applied, even in borderlinecases, despite the notoriously unr Jiable nature of these grades (see Wilmott andNuttall 1975).
Of the remaining 20 percent who are admitted to the university, 80 percent applyfor direct admission on the basis of qualifications obtained outside the schoolsystem. A significant proportion of these hold diplomas underwritten by theuniversity, especially in education and agriculture. Another 16 percent are nursesentering the nursing education and nursing degree programs. The final 4 percentfall into the mature student category. These candidates, who must be of a certainminimum age, are selected for admission on the basis of a special examinationadministered by the university. In principle they should be candidates whoseprogression through the education system was hindered by the lack of facilities. Inpractice they are often candidates making their final desperate attempt to gainadmission to the university. The number of mature applicants is large: over 1,700in 1983, of whom 26 were admitted for full-time studies and 70 for study bycorrespondence.
The University and Development Needs
Two aspects of student enrollment are of particular interest in relation toZambia's developmental needs, namely, the numbers enrolled in areas of nationalneed and the proportion of female students. Because of the highly developedindustrial and mining sector, and because so much faith is pinned on scklatificand technological development, the government considered that the universityshould give priority to the sciences in terms of enrollment and resources. However,bringing this abnut has not been easy, partly because of the cost of developing andmaintaining science fields of study, but more so because the supply of suitablyqualified candidates for admission to scientific studies has always beeninadequate, as already discussed. In order to augment the supply, in 1981 theuniversity established a pre-university science program to upgrade marginalcandidates (since 1982 this program has been funded by the United NationsFinancing System for Science and Technology for Development). The programhas increased somewhat the number of students admitted annually to science-based programs, but the number is still below the university's capacity.
Thus, the university is not yet producing the number of science and technologygraduates Zambia needs. However, commendable progress has been made, with theproportion of science students increasing significantly: for full-timeundergraduates, this proportion grew from 36.2 percent in 1979/80 to 50.3 percent in1986/87 (table 17.1). The university is now aiming for 60 percent of the enrollmentto be in scientific subjects in line with the country's projected manpower needs(Ministry of Education and Culture 1980 Annual Report).

Table 17.1 University Enrollments by Sex and Principal Field of Study, 1979-86
Science schoolsNo. of No. of Percentage
Year men women of women
Non-science schoolsaNo. 4 No. of Percentagemen women of women
All sc.tools- Percentage ofNo. of No. of Percentage students in sciencemen women of womtn schools
1979 928 98 9.6 1,312 576 30.5 2,240 674 23.1 35.2
1982 1,378 190 12.1 1,271 569 30.9 2,649 759 22.3 46.0
1983 1,478 151 9.3 1,205 557 31.6 2,675 708 20.9 47.9
1984 1,627 178 9.9 1,379 504 26.8 3,006 602 18.5 48.9
1985 1,694 264 13.5 1,334 504 27.4 3,028 768 20.2 51.6
1986 1,739 184 9.6 1,403 494 26.0 3,142 678 17.7 50.3
Note: Data wert not available for 1980 and 1981.
a. Non-science schools include the humanities, social sciences, law, and education schools.
Soarce: University Planning Office.
193

Table 17.2 University of Zambia Graduates by Sex and Principal Field of Study, 1974-85
SCielfee degrees ------ ------ Non-science degree ----- All degrees --- Percentage ofNo. of No. of Percentage No. of No. of Percentage No. of No. of Percentage students obtaining
Year men women of women men women of women men women of women science degree
1974 163 10 5.8 205 55 21.2 368 65 15.1 40.01975 152 6 3.8 201 45 18.3 353 51 12.6 39.11976 166 14 7.8 305 50 14.1 471 61 12.0 33.61977 151 20 11.7 265 91 25.6 416 111 21.1 32.41978 116 12 9.4 259 77 22.9 375 83 19.2 27.61979 242 11 4.3 317 99 23.8 559 110 16.4 37.81980 172 17 9.0 397 124 23.8 569 137 19.4 26.81981 223 23 8.2 381 154 28.8 601 174 22.4 31.21982 174 14 7.4 368 161 30.4 542 175 24.4 26.21983 239 17 6.6 265 110 29.3 504 127 20.1 40.6
1984 257 51 17.4 152a 87b 36.4b 409a 141a 25.6a 44.21985 278 41 12.9 308 129 29.5 586 170 22.5 42.2
a. Non-science degrees include the humanities, social sciences, law, and education degrees.b. Does not include 154 education degrees not analyzed by sex.Source: University Planning Office.
1

The University of Zambia During the Years of Eccnoric Difficulty 175
The inadequate supply of science students has required the university to admitcandidates who, on paper, may not be well qualified. As a result, the scientificsubjects werience very high and costly failure rates, especial;y at the end of thefirst year. The failure rates are particularly high ir physics, although recent yearshave seen some improvement.
The ichool of Agricultural Sciences
The Lockwood Report singled out agriculture as a high priority area. Yet it tooka oinguhrly long time for the university to give this subjeq the recognition itdeaerved. To some extent this eelay was caused by doubts about the most suitablelocation for the agricultural school, but even these doubts are indicative of theinferior status thet the university accorded to agriculture for several years. Theschool's status was further depressed by the system that existed up to 1979 whereby atthe end of the first year in the School of Natural Sciences, students were allocated,on the basis of performance kind preference, to the various science-based degreeprograms. Students had a poor view of agriculture and science education, hencethese rarely featured among first preferences. In consequence, the agriculture andscience education programs usually received a large prolortion of very weak andunwilling studentc. The high wastage to which this gave the, in the form of drop-outs, failures, and subsequent abandonment of agricultural and teaching careers,led the university to reconsider the procedure and to adopt a system wherebystudents could be allocated to agriculture and education on the basis of preferencesexpressed before admission to the university. The initial years of this newarrangement saw some difficulties, especially in the form of candidates whothought that they could switch programs once admitted. However, current attitudestoward agriculture and education are now more positive, although they both stillreceive a large proportion of weak students. Possibly a contributing factor to theimproved attitude is the perception of likelyjob security in both these areas.
The increasing priority given to agriculture by the university is demonstratedby the increase in the proportion of full-time students in the school from 4.9 percentof the university's enrollment in 1981 to 6.5 percent in 1987 and in the proportion ofthe funds it receives: from 7.4 percent in 1975, to 11.1 percent in 198C, to 12.3 percentin 1984. These latter proportions actually seriously underestimate the share ofresources agriculture receives since they do not take into account the large amountof technical assistance the school receives from various governments and othersources. To date 331 students have graduated from the school.
The School of Engineering
Engineering was also accorded priority early in the uniyersity's history,demonstrated by the use of a World Bank loan to lwild the school. The school offersregular degrJe programs in civil, electrical, and mechanical engineering, andreceivem technical assistance fi orn SID.A for Lpecialized programs intelecommunications and land surveying. Its enrollment is increasing gradually,but is limited by the number of candidqes suitably qualined in mathematics andphysics. The school has awarded a total of 552 engineering degrees, while the allieriSchool of Mines has conferred 301 degrees in mining engineeriks., geology, andmetallurgy.

176 Education in a Declining Economy: The Case ofZambia, 1975-85
The School of Education
A third area that has been given priority since the university's earliest days iseducation. The preparation of graduate teachers for the senior classes of secondaryschools has always accounted for a substantial proportion of university resources.Some 20 percent of the full-time students and 60 percent of correspondence coursestudents are enrolled in this school, although it is receiving a declining proportionof funds. Some of this decline is due to organizational changes within theuniversity, such as the transfer of the Geography Department out of the educationschool and into natural sciences in 1983, but even allowing for this change,education and other humanities-based schools have been receiving a smallerproportion of the university's teaching funds. The school has graduated over 2,000teachers, 484 in science education and 1,563 in arts subjects, but as alreadydiscussed, less than half of these are still teaching in the secondary schools.
The School of Business and Industrial StudiesA final area that the government considers very important is accounting.
Training in accounting :e conducted in Kitwe in the School of Business andIndustrial Studies. This school currently enrolls over 7 percent of all full-timestudents at the university, though it receives only about 4 percent of the teachingfunds. About 75 percent of the students in the school are enrolled in the accountingprogram. A degree in accounting does not qualify the holder for professionalmembership of the Zambia Institute of Accountancy, but it confers advancedstanding in relation to professional examinations. Since the school was opened in1978, the Bachelor of Accountancy has been conferred on 371 graduates.
The University's Response to Manpower NeedsOn the basis of the sheer number of graduates, both in the priority fields already
noted and in other areas, the university appears to have responded well to itsmandate to produce high-level manpower for the country's needs, although Shaw(1980) maintained that university outpt ts during 1973 to 1978 did not alwaysaccurately reflect the national manpower priorities. The university's efforts torespond to national needs continue, although they are undoubtedly hampered byfinancial problems. There is no decline in student numbers at any level; instead,there is a slow but steady growth in enrollments. The university has also attemptedto diversify the programs offered and to introduce new fields of study, such asveterinary medicine, that are considered to be of national importance.
The question of whether the university's numerical output of graduates reallymeets national manpower requirements is worth addressing. To begin with, thereis no clear picture of what those requirements are. No recent survey of manpowerneeds has been carried out and given to the university to guide it in planning itsprograms and enrollments. In the absence of such a survey, the emphasis given tocertain programs will vary with the perceptions of the university authorities. Insuch circumstances outputs will tend to match real needs only fortuitously and notin a systematic way. At the very least, there should be closer liaison between themanpower planning section of' the National Commission for DevelopmentPlanning and the university authorities.
There should also be closer contact between the teaching departments and thosewho hire graduates, whether in the public, parastatal, private sector. 'Admittedlythe "consumers" of the university's graduate output arc xst,..11y represented on the

The University of Zambia During the Years of Economic Difficult," 177
Boards of Studies, which organize the structure and content of study programs, butthis participation is often of a very formalized nature. Much closer contact andinteraction are needed at an earlier stage so that the consumers' needs can beunderstood and built into the program of instruction and study.
Attaining these goals implies two things that may prove a stumbling block forthe university. One is that to enable it to respond quickly and effectively to needs asthey are identified, the university will have to restructure i'a procedures andbureaucracy. The slowness with which the institution can adaiv, itself ta acceptedpriorities has reduced its crechbility in a number of public sectors and has caused anotable degree of demoralization amonb its own staff. An example is the proposal torefashion the School of Education into a professional school that caters to a varietyof pressing needs in the educational field, without being confined just to producingsecondary school teachers. The proposal was thoroughly considered andresearched six years ago, but has not yet been implemented (or rejected).
Second, if the university's programs are to be tailored to fit users' needs mereclosely, academic standards may have to be redefined. From the outset, theuniversity adopted wholeheartedly the Lockwood charter that it be "an institutionwhich on merit (would) win the respect and proper recognition of the academicworld* (NRG 1964, p. 1). However, the university seems to have interpreted thisprinciple in such a restrictive way, that formal academic requirements have %Wineto play a more important role than the substance that underlies them. For example,five 0-level passes in a suitable combination ansure admission, but adequateallowance is not made for other forms of pre-university preparation, especiallywork experience. This had led to the phenomenon of applicants who have beendenied admission to the university on the grounds that they are not suitablyqualified, seeking and gaining admission to institutions F;:ou.)act where they aregiven advanced standing for earlier training or experbaco, and where theycomplete their studies successfully.
The same restrictive view of academic requirements is seen in the universitypromotion procedures, which place heavy stress on traditional formi of scholarlypublication, but less on thoroughly researched technical reports and internalseminar papers, and even less on accomplishments as a university teacher.Responsiveness to the nation's real needs requires considerably more flexibility inadmission requirements, the appointment and promotion of staff, and the content ofprograms.
The Quality of Graduates
The university could pay more attention to another Lockwood principle, that "theevident quality and subsequent performance of the men and women to whomdegrees have been awarded will end all remaining argument about theinternational recognition of the University's awards" (NRG 1964, p. 2). Theuniversity is now sufficiently mature not to be unduly concerned aboutinternational standards. Moreover, the performance of its students in postgraduatestudies abroad has to some extent validated its programs However, some peoplehave expressed concern about the mediocre quality of some of those who do not goabroad and their inability to respond flexibly, creatively, and competently to theresponsibilities that are placed on their shoulders. University staff are aware ofthis problem and of the challenges that graduates face, but many of them feel thatthey cannot adequately prepare their students for their future responsibilitiesbecause thny are tied, by the students themselves, to a method of teaching that does
1 9,",

178 Education in a Declining Economy: The Cam of Zambia, 1975.85
not go much beyond the expository method of school teaching; because studentsperceive university learning as consisting primarily of the reproduction of poorly
assimilated lecture material; and because resources (textbooks, library materials,reproduction facilities, science supplies) are so limited that a teaching style thatforces students to think and penalizes those who do not cannot in fai:ness beadopted.
The introduction of courses for staff in university teaching methods might helpto improve the situation, although significant improvements may not be possiblewhile textbooks and teaching materials remain so scarce. In addition, theuniversity night consider adopting much more rigorous standards for studentprogress, particularly by restricting the possibility of repeating courses andexaminations. The present system of gradually accumulating course creditsenables students to meet degree requirements over a long period of time, but the
course of study is likely to be so disjointed that it provides only students ofexceptional quality with a sound, all-round university education.
Female Students
As noted earlier, the higher one ascends the educational ladder, the lower thefemale participation rate. This is all too true of the university. Although the recordsshowing enrollment by sex and field of study are incomplete, enough are availableto show ,hat women students seldom constitute more than 20 percent of theundergraduate enrollment (table 17.1). The proportion of graduating femalestudents is higher than their proportion in the enrollment warrants (table 17.2), butthis is accounted for by the preponderance of female students in some diploma andcertificate courses that last for only one or two years and that have a high passingrate. At the degree level there is no evidence to suggest that female students do anybetter or worse than their male counterparts.
In addition to being underrepresented in the overall enrollment, femalestudents are severely underrepresented in the sciences. Between 1982 and 1987 theyaveraged just 10.9 percent of the total enrollment in science-based disciplines,whereas they formed 28.5 percent of those in the humanities. In the sciences theyare most strongly represented in the medical school where, in addition + 0 themedical degrer program, they can enroll in nursing degrees and diplomas.However, there has never been a female student in the mining school, and only twohave ever registered for engineering. In education they constitute about 25 percentc the full-time enrollment, but their largest representation is in humanities andsocial sciences where they account for 37 percent of the enrollment. At the degreelevel, between 1974 and 1985, 9.2 percent of ihe science degrees awarded and 19.7percent of the humanities degrees were to women.
This sev ere underrepresentation of female students has its origins in theundarrepresentation of girls at the upper primary level, the further contraction oftheir proportion at the selection points for junior and senior secondary school, andthe consistently lower level at which girls perform in public examinations. In ti emajority of cases, the university admits applicants on the sole basis of performancein these examinations and has no special quota to ensure the balancedrepresentation of girls. The fact that so few women qualify for university training,especially in the sciences, is a cause for concern. Although the remedy does not liewith the university, but much earlier, with the society and the education system,examination of the roots of the problem by the university might be helpful.
u

The University of Zambia During the Years of Economic Difficulty 179
StaffingIn common with several developing countries, the university has difficulty in
attracting and retaining academic staff in the numbers and specialties required.Because so little development of high level manpower had taken place at the time ofZambia's independence in 1964, the process of building up a tadre of local teachingand research staff was slow, and is not yet over. Approximaely half the teachingand research staff are now Zambians; the remainder are recruited from abroad.
The university has never been able to fill all its posts. Even in 1975, before theeffects of the economic visis were felt, only some three-quarters of the posts werefilled, and this ratio has declined to about two-thirds during the past five years. Thedecline has not come about because of any significant drop in the number ofexpatriate lecturers, but is due principally to additional posts called for by theincreased number of students and the introduction of new subjects.
Given the number of approved posts, the theoretical staff to student ratio of one toseven is very generous (table 17.3). However, given the number of unfilled posts,the actual staffing ratios of 1 to 10 or 11 are less generous. They also vary from oneschool to another. In general the science schools have more generous ratios than thehumanities schools, but again the ratios vary with the subject. In the science area,natural science and environmental studies lack staff, as do busineas studies andeducation on the humanities side. Thus, although in broad terms the universitydoes not suffer from gross understating, human resources are unevenlydistributed, leading to individual schools, departments, and disciplines beinginadequately catered for.
The number of expatriate staff has remained steady for several years. Part ofthe reason for this is the support received from donor countries: in 1986, about halfthe expatriate staff were completely or partly supported by aid arrangements withvarious countries. The remainder of the non-Zambian staff were hired on the samebasis as Zambians, but with provision for the university to pay terminal gratuitiesand for the banking system to transfer funds abroad. Difficulties over the latterarrangement, arising from Zambia's shortage of foreign exchange, mayprecipitate the departure of some of the unaided expatriate staff. Expatriates stillform a disproportionately large component of the senior r,caff, accounting for morethan three-quarters of those at the level of senior lectwer and above in 1983. Tosome extent this is because the aid agencies have tended to give preference toexperienced teachers who could help build up the capabilities of the departments inwhich they were located.
The Staff Development ProgramAlthough the university's staffing situation is not perfect, it could not be at iLs
present strength were it not Cor the vigorous staff development program into which ithas injected over one-tenth of its annual budget since 1975. At the program's peakin 1982, the number of trainees for academic posts was the equivalent of about two-thirds of those actually in post that year. If there was no wastage among currentstaff and trainees, and no need for further training of existing staff, the programas it stands in 1987 would see the Zambianization of staff almost completed.
From 1970 to 1987, the program provided 1,022 man-years of training foracademic staff at the Ph.D. level and for a few senior administrative staff; 1,493man-years for first degree holders who have shown potential as members of theacademic staff, usually to enable them to complete master's degrees; and 641 man-

Table 17.3 Academic and Nonacademic Staffing Ratios, University of Zambia, 1975-85
Year
No. offull-timestudents
Approvedno. of teaching
postsNo. of students per
teaching postFilled teaching
posts
No. of studentsper filled
teaching post
Fillednonteaching
postsNo. of students pernonteaching staff
1915 2,587 324 8.0 250 10.3 n.a. n.a.1976 2,326 325 7.2 235 9.9 1,677 1.4
1977 3,351 348 9.6 264 12.7 1,930 1.7
1978 3,529 402 8.8 n . a. n.a. n.a. n.a.1979 3,761 465 8.1 335 11.2 2,028 1.9
1980 3,813 445 8.6 348 11.0 2,034 1.9
1981 3,897 491 7.9 334 11.7 2,249 1.7
1982 3,828 497 7.7 347 11.0 2,093 1.8
1983 3,975 587 6.8 36 10.3 2,272 1.7
1984 4,174 591 7.1 436 9.6 2,573 1.6
1985 4,352 625 7.0 410 10.6 2,528 1.7
n.a. = not available
Source: University 1975-85, Annual Reports.
C . I
The University of Zambia During the Years of Economic Difficulty 181
years for staff in technical and other support areas. The exact number of traineesin the different categories is not knowr, but the number of awards is estimated at225 for Ph.D. and comparable studies, 600 for master's programs, and 170 for otherforms of training.
TI.:a staff development program has helped raise the level of Zambianizationfrom 9.Z percent in 1975 to 47.3 percent in 1985. Most of the training was conductedat universities abroad, principally in the United States, the United Kingdom, andCanada. The staff development award covers all program-related expenses: fees,travel (including the family of a married trainee), equipment and books, livingallowance, and rasearch expenses. If trainees are already on the university's staff,they retain their salary; otherwise they are appointed on a special staff developmentsalary scal e.
In addition to its own resources, the university was able to call upon fellowshipsawarded under technical assistance, cultural exchange, and scholarshipc.rrangements to help defray the costs of the program. It could not haveaccomplished as much as it did without this form of aid, which in May 1987 washelping to support 98 of the 209 on the program. The cost per fellow has increaseddramatically in recent years, the real cost in 1986 being more than twice what it hadbeen three years earlier. In part, this reflects the rising real costs of university feesabroad, especially in the United Kingdom, of transport, and of living allowances,out it also reflects the higher salaries the university must pay to catch up oninflation at home, as well as the larger number of senior persons in the program.
The staff development program is one of the university's success stories and atribute to the foresight of its originators, the commitment of the university's chiefexecutives, and the dedication of the program's administrators. Although theuniversity did not escape the financial hardships that struck the rest of the country,it was able to maintain and expand this program steadily, and always received thenecessary cooperation from government and banking authorities to transfer fundsabroad.
However, success has come at a price. The regular commitment to the programof over 10 percent of the university's resources has been a serious drain. Nocomparable commitment was made to develop the library, purchase textbooks, orobtain apparatus and supplies for the sciences. Even more costly were some of theprogram's backwash effects, especially the adverse way it affected the developmentof postgraduate work at the university. Each year the cream of the year's graduatecrop was appointed to the program and sent abroad to pursue master's studies. A fewstayed at the university, but in 1987, only 19 out of 209 fellows were studying locally.Clearly, the development of local postgraduate programs waa inhibited by thepractice of sending the best qualified candidates abroad. Some interaction with theacademic world outside Zambia is obviously desirable, and clearly Zambia couldnot provide training in every specialty it needed. Nevertheless, more effort andmore resources could have been devoted to the development of local postgraduateprograms. This can still be done by redirecting some of the resources and aid goingto the staff development program.
Staff AttritionThe vigorous development of local postgraduate programs, and the institutional
and resource growth that this would imply, would help to remove one of the sourcesof staff discontent at the university and one of the factors contributing to staffwastage, namely, the lack of opportunity and incentive for research. The loss of

182 Education in a Declining Economy: The Case of Zambia, 1975.85
staff, especially more experienced and highly qualified staff, has caused concernin recent years. Up to May 1987, the university had lost a total of 123 academic staff
members, roughly half of them since the beginning of 1983. The high attritionfigures in recent years are partly due to the larger number of Zambian staff who, ashighly qualified nationals, can readily obtain rewarding and challengingemployment in areas outside the university. Of the staff who let, about halfresigned, a quarter were granted leave of absence or were seconded to governmentservice, and a quarter had their services terminated (mostly, for failing to returnafter postgraduate studies). Information ori die subsequent activities of more thanhalf of those who left is also available: about 30 percent went into governmentservice , 25 percent secured positions with international bodies and United Nationsagencies (mostly outside Zambia), and 25 percent found employment in othercountries in southern Africa.
Various factors have led to these losses, some, but not all, outside the university'scontrol. The reasons cited by staff for leaving include dissatisfaction with salariesand conditions of service, especially with regard to loans and accommodation;frustration with insensitivity to personal problems; exasperation with the apparentsubordination of teaching and research to administrative concerns; excessivelyhigh teaching loads; and poor research facilities.
At the level of those supported for master's studies, the total recorded loss sincethe staff development program began is 45 (some 3 percent): 14 failed theirprograms entirely, 14 did not return after their studies, 6 had their fellowshipsterminated, and 11 resigned for various reasons. The rate of loss from the programis small. That speaks well for the caliber of those sent for studies and for theirloyalty to the university and the country.
The subsequent loss of Zambian lecturing staff (6 percent per year) is moreserious. The loss of these staff members is all the more keenly felt because many ofthem were senior staff. To the extent that deteriorating financial conditions withinZambia as a whole, as well as comparatively low university salaries, havecontributed to these losses, they can be seen as a function of Zambia's economicproblems. Their increase in re4ent years suggests that if conditions grow worse,the university may sustain even greater losses.
Financing the UniversityThe most striking feature about the university's financing is that its income did
not decline in real terms during the years of shrinking national resources.Instead, it increased substantially, with the government grant during the years1982-85 being almost 50 percent higher than that during 1977-80 (table 17.4). Not allthis increase was accounted for by increased enrollment: the expenditure perstudent, at constant prices, was 10 percent higher in 1984 than it had been in 1977(table 17.5). The university's income from all sources has grown in real termssince 1977 at an annual average rate of 4.7 percent, but the number of full-timestudents grew at a rate of no more than 2.5 percent.
Government provides funds to the university in two ways: as a grant in aid forrunning costs and in the form of student bursaries. The annual grant hasremained stable at about 77 percent of the university's income since 1979, butbetween 1979 and 1984, bursary payments increased from 13 to 15 percent of theuniversity income. Hence, over 90 percent of the university's income originatesdirectly from public funds, and this proportion is increasing. The balance of theincome comes from fees from nongovernment sources, from interest on

The University of Zambia During the Years of Economic Difficulty 183
Table 174 Government Grant to the University, 1975-85
YearGrant in
current kwachaGrant in
1977 kwacha
19751976
5,887,5008,640,000 la=
1977 9,000,000 9,000,0001978 9,600,000 8,672,0001979 11,280,000 9,148,0001980 12,900,024 9,402,0001981 19,707,011 12,957,0001982 27,25,454 15,848,0001983 22,465,809 11,061,0001984 27,813,276 12,433,0001985 34,835,581 14,190,000
= not applicableSource: GRZ 1975-85, Financial Reports.
Table 17.5 University Expenditure per Student, 1975-84
Year
Actualexpenditure
(kwacha)Number of
full-time students
Expenditure perfull-time student
Current kwacha 1977 kwacha
1974 7,575,167 2,882 2,628 M
1975 7,844,932 2,587 3,032 10.
1976 9,769,817 2,326 4,2001977 11,712,541 3,351 3,495 3,4951978 11,969,233 3,529 3,392 3,0641979 14,786,491 3,761 3,932 3,1891980 16,960,582 3,813 4,480 3,2421981 21,616,039 3,897 5,547 3,6471982 26,585,774 3,828 6,945 4,0381983 31,761,886 3,975 7,990 3,9341984 36,484,0& 4,174 8,741 3,907
= not applicableSource: University of Zambia data.
investments, from rents on property, from the university farm (about 0.8 percent ofthe total income), and from sundry other sources.
During the first few years of the economic setbacks, the university, like otherinstitutions, was thrown into a state of financial disarray. Expenditure exceeded
2 0 5

184 Educa:ion in a Declining Economy: The Case ofZanthia, 1975.85
income in 1975 and 1977 through 1979, but this state of affairs did not occur againuntil 1984, by which time the university had accumulated sufficient surplus fundsto cushion the excess. To keep the deficit within manageable proportions during theearlier years, and to facilitate its financial operations during other years, theinstitution resorted to some undesirable financial procedures: financing recurrentexpenditure from the capital account, using earmarked funds for normaloperations, running a bank overdraft that was tai large for a noncommercialundertaking (over K979,000 in 1980), retaining taxes deducted from staff salariesfor operating expenses instead of passing them on to the income tax authority (aboutK1 million by 1981), and delaying before settling debts (Nyirenda 1986). However,this downward slide into financial anarchy was arrested after 1981 by theprovision of larger government grants that enabled the university to straighten outmost of its accounts. Thereafter its financial position improved, but the heavydependence on government funds remained. The university itself was not verysuccessful in generating income, despite considerable rhetoric on the subject.
The university's actual annual costs are considerably higher than the publishedfigures. This is because they e.o not include items paid for by technical assistance:complete support for around 50 members of staff, partial support for 50 or so more,equipment, transport, teaching materials, books, and training awards for those onthe staff development program. Neither do the published figures reflect all thesupport provided by aid and other agencies for research and publishingundertakings and for participation in conferences locally and abroad.
The Use of FundsThe proportion of funds used by the teaching schools has declined from year to
year, from 39.2 percent in 1974 to 29.9 percent in 1984 (table 17.6). At the same time,the proportion used for administration and support services (estates organization,material resources center, computer center, horticultural office, and so on) grew
Table 17.6 Distribution of University Expenditures, 1974-84
Year
Administrationand support
servicesStaff
developmentStudent
accommodationTeachingschools Research Library
1974 29.4 7.7 18.5 39.2 2.3 2.91975 29.0 10.1 15.0 40.1 2.5 3.21976 28.6 10.9 15.7 39.4 2.7 2.81977 28.5 12.9 16.4 38.0 2.1 2.11978 30.2 12.2 13.7 39.3 1.7 2.41979 29.9 13.0 16.6 33.1 1.5 3.31980 34.4 12.7 14.3 34.9 2.1 1.7
1981 36.8 11.6 14.4 32.7 2.3 2.11982 38.2 11.4 13.6 32.6 2.1 2.01983 40.2 11.2 13.2 29.8 2.3 3.31984 38.6 12.6 13.3 29.9 2.7 2.7
Source: University audited accounts, 1974-84.
The University of Zambia During the Years of Economic Difficulty 185
from 29.4 percent in 1974 to 38.6 percent in 1984 (with a high of 40.2 percent in 1983).Research activities have accounted for a little over 2 percent of the university'sannual spending, while about 2.5 percent is used for the library.
As table 17.6 shows, the allocation of resources shifted in 1979-80 away from theteaching schools and into administration and services. This shift coincided withthe establishment of the University Federal Office in January 1980, following theappointment of the chief executives in November 1979. The obvious conclusion isthat the development of the federal structure and the resulting increase inadministrative and service costs led to a distorted use of university funds, with aneverdeclining proportion going to the teaching schools while the number ofundergraduate and postgraduate students was growing steadily, if slowly, andwhen two new schools of study were coming into existence (in Kitwe). These factslend strong weight to staff concern that the university's teaching activities havebeen subordinated to administration.
A further index of the unbalanced use of university resources is the largenumber of nonteaching and nonresearch staff. The university averages three suchstaff for every two full-time students, or about six for every member of the teachingand researeh staff. This clearly absorbs a considerable proportion of theuniversity's budget. Some of the staff concernsi belong to the teaching schools andresearch units as administrators, secretaries, or technicians, but this number hasremained relatively steady. Overall, however, since 1979, the nouteachingworkforce has been growing at an annual rate of 3.7 percent. During the sameperiod the teaching staff actually in post grew at 3.4 percent and the number of flan-time students at 1.4 percent. It is significant that the number of ancillary staff wasallowed to grow so rapidly when restraints were being experienced in the economyand when the university could not supply the teaching schools with necessarymaterials.
Even though enrollments in the wience schools are smaller, these schoolsaccount for a larger proportion of the spending. Thus, in 1975, a year when 39.1percent of the graduates received science degrees, the science schools accounted for24.2 percent of the university's spending, and the humanities schools, with 60.9percent of the graduates, accounted for 15.6 percent. By 1984 the proportions for eachgroup had fallen, reflecting the shift away from spending on the teaching schools,but the gap between the sciences and humanities had widened, reflecting the largernumber of science schools and the increase in the proportion of students takingscience programs: science schools, with 48.9 percent of the enrollment of full-timestudents, accounted for 19.7 percent of the total university expenditure for 1984,while the humanities schools, with 51.1 percent of the enrollment, accounted for 10.2percent. The ratio of the expenditure on the science schools to that on the humanitiesincreased from approximately 1.5 in 1974 to 1.9 in 1984. The university, therefore,spends almost twice as much on the science schools as it does on the humanities,even though the enrollments are smaller in the sciences. This shows that in theallocation of resources the university is successfully pursuing its policy ofaccording priority to the sciences, even though the allocation to all the teachingareas taken together represents less than a third of its total budget.
The Cost of a University GraduateFor the period 1982 through 1984, the average teaching expenditure per student
was highest in medicine (K6,800 per annum), followed by agriculture (K4,900 perannum). It was lowest in business and industrial studies (K950 per annum),
2 1

186 Education in a Declining Economy: The Caseof Zambia, 1975-85
followed by education (K1,240 per annum). These figures show no more than theteaching costs. To arrive at the full annual cost of a student in the different schoolswe must add the expenditure incurred by the university in all other areas. lilt usassume that this expenditure is shared equally over all schools and all students,except for expenditure on the library and research, since these are academic areasin their own right. The remaining nonacademic expenditure incurred by theuniversity averaged K4,868 per student per year during 1982 through 1984. (Notethat the nonteaching expenditure per student is more than five times the per studentteaching cost in business and industrial studies.)
Using these figures and considering the duration of a degree program, we carAestimate the approximate cost of producing a graduate in each discipline (at 1982-84prices). This ranged from K74,000 for a full medical degree to less than K25,000 fora B.A., a B.A. with education, or a degree in business administration. A sciencedegree cost some K30,000, and degrees in engineering or mining ran at K38,000.
The size of the estimated annual cost needs to be borne in mind whenconsidering student wastage from the university. Each "student failure year"implies a loss of some K6,000 for a humanities student and K8,000 for a sciencestudent. During the period 1979 through 1986, such losses amounted to a total of overK7 million. In addition, costs are incurred if a student takes longer than theminimum period to graduate. Only 50 percent of the students taking sciencedegrees, whether the straight B.Sc. or the B.Sc. with education, graduate after fouryears, and some take six or more years. While they do not spend all these years infull-time studies at the university, their participation as part-time studentsnevertheless constitutes a cost.
The magnitude of the coot of producing a graduate is relevant to discussionsabout passing on some of the costs of university education. If the full cost were to bepassed on to students, it would clearly impose an intolerable burden, since fewstudents could raise the amounts needed or would be willing to begin their workinglife shouldered with a debt of the size implied (at least three times the startingsalary of the graduate entering government service). If xospective employers wererequired to compensate the government or the university for the costs of employees'degrees, the likely result would be a lower demand for graduates (though this wouldnot be altogether undesirable in areas where graduates are employed because oftheir paper qualifications and not because of their expertise). A more workablesolution might be for students to be personally responsible, by direct payment orthrous h a loan, for all personal expenses (accommodation, allowance, transport,books, stationery), for a future employer (or self-employed graduate) to beresponsible for the teaching expenses, and for the university to be responsible for allnonteaching expenses and library costs.
The Cost of University ClosuresMajor student disturbances led to closures of the university for a total of 400 days
in 1976, 1982, 1984, and 1986. In addition, minor disturbances disrupted teaching onnumerous occasions. Nyirenda (1986) has analyzed the issues involved in the 1982closure, but the factors underlying the more recent disturbances still await acomprehensive investigation. We do not propose to go into these here, our task beingthe simpler one of estimating the financial cost of the four major universityclosures. Knowing how costly these were might help the government and theuniversity to work harder to prevent any further closures. It might also stimulate

The University of Zambia During the Yuan! of Economic Difficulty 187
both authorities to work with a greater sense of urgency for the speedy reopening ofthe university, in the event of another closure.
We estimate the cost of closures by treating as loss the costs of paying staff andmaintaining nonteaching operations during closure periods. These costs were nota complete write-off since some of the university's normal work, such as itsresearch and the teaching of correspondence and postgraduate students, continuedduring these periods. But since the university's foremost activity is the directteaching of undergraduates, the method gives an estimate of how great a loss wasincurred. Taking account of the daily running costs at the time of the four majorclosures, the total loss was about K67 million (at 1986 prices). If we generouslyallowed that such teaching, research, and consultancy activities as continuedduring the closures accounted for half the daily cost, the four closures since 1976still entailed a loss in excess of K30 million.
The government bore the greater part of this loss, since the government is theprincipal source of funds for the university. That a loss of such magnitude couldoccur, almost without question, is remarkable. That it could occur during a periodwhen public funds could not be found to provide adequate support for primary andsecondary schools reveals the willingness to direct resources to higher educationthat could be used more profitably at other levels. Tho steady, unquestioningfinancial support of the university when closures prevented it from performing itsprimary teaching task manifests very clearly how powerful an institution theuniversity is when scarce resources are being allocated.
The Salaries of Teaching Staff
This section will examine faculty salaries from 1975 to 1985. It will not takeaccount of the new scales that became operative in April 1987. University salarieshave grown very rapidly at current prices. By :985, the entry salary at the lowestlevel of academic appointment was higher than a trained graduate could earn aftereight years of government service. This explains why university appointments arecoveted. It also explains why members of the public, and civil servants inparticular, tend to look askance on claims by university academics that theirsalaries are poor. University salaries have always tended to be high, whether inrelation to other sectors or to the GDP. There is also a tendency for them to improvemore rapidly than salaries in other areas. In 1975 academic salaries rangedbetween 11 and 21.5 times the per capita GDP; in 1985 the range had become 14.1 to28.2 (table 17.7).
The development of university salaries in real terms has varied with the level ofappointment. The salary of a professor lost almost none of its purchasing powerbetween 1977 and 1985, while that of a senior lecturer was higher in 1985 than it hadbeen in 1977 (though lower than it had been in 1981). Salaries at all other levelsdeclined 3 to 9 percent between 1977 and 1985. During the same period the per capitaGDP lost 24 percent of its 1977 value, and the salaries of most senior public officialslost 50 percent or more of their value. Although these comparisons imply thatuniversity staff have been very favorably treated, academics are quick to drawcomparisons with salaries outside the country. In these terms, the universitysalaries are not high. In real dollar terms, a professor received US$11,400 in 1975and US$7,400 in 1985. The lowest level of lecturer received US$5,000 in 1975 andUS$3,700 in 1985. The low value of university salaries, when converted intodollars, is a major contributor to the problem of staff wastage.
2 ;)

188 Education in a Declining &many: The Case of Zambia, 1975-85
Salaries are frequently viewed n the context of overall conditions of service.Probably the most favorable aspect of these at the university relates to leave. Threemonths leave on full salary are provided every second year, with two weeks "localleave" in the intervening years. In addition, since 1982 upon completion of sevenyears of service, an academic member of staff has been able to enjoy sabbaticalleave, on full pay, for an entire academic year. Housing is provided at belowmarket rents, though with the increase in numbers, staff may face a long delay
Table 17 .7 University Teaching Staff Starting Salaries, Selected Years
Position 1976 1977 1981 --1985 1987
a. In current kwacha
Professor 7,400 8,232 13,800 14,208 20,160 31,680
Associate professor 6,800 7,812 12,060 12,4444.) 17,760 26,640
Senior lecturer 5,600 6,324 10,080 10,500 15,696 22,644
Lecturer I 4,000 5,700 9,600 10,056 13,044 20,388
Lecturer II 4,956 7,980 8,400 11,100 16,884
Lecturer III 3,200 4,248 7,164 7,584 10,092 15,229
b. In 1977 prices 1977 1991 1984 1935
Professor 8,232 9,073 6,351 8,212
Associate professor 7,812 7,929 5,552 7,234
Senior lecturer 6,324 6,627 4,694 6,393
Lecturer I 5,700 6,312 4,495 5,313
Lecturer II 4,956 5,247 3,755 4,521Lecturer III 4,248 4,710 3,390 4,111
c. As multiple of the per capita GDP 1977 1985
Professor 21.5 28.2Associate professor 20.5 24.4Senior lecturer 16.6 22.0Lecturer 1 14.9 18.3Lecturer II 13.0 15.6Lecturer III 11.1 14.1
Source: University contract documents.
before a house becomes available. Loans are not as readily available as in someparastatals, largely because the university does not have enough liquidity.Moreover, parastatal employees enjoy fringe benefits such as transport,entertainment allowances, and service charges that their university colleagues donot enjoy. Salaries in the parastatals may also be much higher (Bardouille 1987).Hence, although university salaries have more or less maintained their 1977 value

The University of Zambia During the Years of Economic Difficulty 189
and conditions of service have been upgraded, the overall position of a universitystaff member does not compare favorably with that of some parastatal staff.
Postgraduate Studies and ResearchAs already noted, the practice of appointing outstanding graduates to the staff
development program and sending them abroad for master's studies has had thecounterproductive effect of slowing down the development ofpostgraduate studies atthe university. In addition, the development of postgraduate work was hampered bythe lack of continuity of senior staff, most of whom were expatriates on relativelyshort contracts, and the inadequacy of resources, such as books, journals, andscientific equipment. The development of progv.i.ins at this level was alsoeffectively discouraged by the absence of any policy governing financial supportfor postgraduate students. Within the university, the development of postgraduatestudies never appears to have received the sustained care and concern that wererequired to get them properly off the ground. The lack of urgency with which theuniversity views postgraduate work comes through in the length of time it takes toprocess students starting and completing postgraduate studies.
In part reflecting the lethargic development of postgraduate work and in partcontributing to it is the university's generally weak research base. Excellentresearch has, of course, been conducted by individuals and by research institutes,but there has not been enough of it, and to too great an extent it has depended on theinterests of individual researchers and not enough on comprehensive researchprograms developed by departments in response to national needs. Moreover,because of the limited resources that the university can make available forresearch, much is being undertaken at the request of external agencies who canprovide funds. In many respects this has turned much of the university's researchwork into a series of consultancies. No doubt these are valuable and possibly evennecessary, but they do not always fit into a coherent program of research adopted bya research unit or a school, and mean that the initiative for undertaking researchlies outside the university.
The conduct of worthwhile research has probably also been inhibited byremoteness from the government and other bodies that might use the outcomes ofsuch research. Where close contact has been established, as between the RuralDevelopment Studies Bureau and the Ministry of Agriculture, or betweendepartments in the medical school and the Ministry of Health, research is activelypursued and its outcomes used. Where this contact is lacking, the research is oftenmore haphazard and projects originate and terminate without significant impacton bodies outside the university. Perhaps the need to see research ending withpublication in a scholarly journal, and not merely with a technical report relevantonly locally, has led staff to concentrate more on what is acceptable in theinternational, scholarly world and less on what is needed in Zambia. If thisevaluation is correct, then it would indicate that too rigid an interpretation ofLockwood's view of the university as "a seat of learning, a treasure-house ofknowledge and a creative centre of research" (NRG 1964, p. 1) has tended toovershadow the complementary view that the university must be responsive to thecountry's needs.
Limitation of resources is a further and very real inhibiting factor on theamount of university-initiated research that is undertaken. In many areas thechief resource that is lacking is time, although the recent granting of the sabbaticalyear will provide some relief. But staff are generally so tied down with teaching
2 1

190 Education in a Declining Economy: The Case of Zambia, 1975.85
activities, with bureaucratic procedures, and with the need to attend penionally to
countless small details and arrangements that should be taken care of by acompetent administrative and seaetarial staff, that they have little time leftduring the teaching year to undertake meaningful research. Supervision of
student activities during vacations or teaching of correspondence students may
make such inroads into vacation periods that little time remains for majorresearch. The problems of payments abroad make it difficult to ensure the supply of
journals, books, equipment and materials needed to support and stin.ulate good
research, while the rapid increases in local costs have not been accompanied by
corresponding increases in local research grants. Hence the volume of research
has been affected by the financial difficulties, although these are only one among
many factors that have a bearing on the somewhat haphazard and uneven flow of
good research from the university.
ConclusionThis review of university activities during the time of financial hardship was
not intended to be comprehensive. An exhaustive study would look more closely at
the work of the individual schools and research units. It would also analyze the
very structure of the university. This review has concentrated primarily on the
way the university has used its resources to produce high-level manpower, andsecondarily on postgraduate studies and research.
The production of manpower received the highest priority, and in terms ofnumerical output, the university's impressive record has not been impaired by the
economic problems experienced in other sectors. In the absence of good information
on precise manpower needs, assessing the match between output and actual needs isnot easy, but the supply in several major areas of need has been large and continues
to grow. Likewise, in the absence of a thorough survey of employers' perceptions
and experiences, determining how well graduates perform, or are equipped toperform, when in employment, is not easy. However, some staff misgivings about
student learning behavior coincide with informal reports that a significantproportion of graduates are ill-equipped to perform competently and flexibly. Thegrowing scarcity of teaching resources is likely to aggravate this problem.
Several circumstances combined to underplay the need for developing vigorouspostgraduate programs. The low priority accorded to postgraduee studies wasaccompanied by a relatively low priority in fostering research, ..iotwithstanding
the establishment of additional research units. The growth within the university of
a locally developed sand relevant research program appears to be in danger ofbeing frustrated by the scarcity of resources for local initiatives.
During the years of financial difficulty the university fared very well. Itsfinancial and real resources increased enormously during years when othernational institutions were struggling to survive. Although greatly concerned with
its own financial management, the university has not shown equal concern for the
efficient use of its resources to meet its objectives. This has shown itself in theremarkable shift of expenditure away from the teaching sectors and into theadministrative and service sections and in apparent indifference to the financial
costa of university closures.Ironically, too great a concern with standards may be preventing the university
from providing as much service as it could to national needs. Good quality work
that is pertinent to national needs is probably more of a priority than research andpublications that are too esoteric to address actual requirements. Closer
2 1

The University of Zambia During the Years of Economic Difficulty 191
relationships with the users of university products would very likely help theinstitution perform better as a producer of manpower and of high-quality research.At the same time, students may need to be evaluated more rigorously, with someinvestigation of whether the presont system of qualification by an accumulation ofcourse credits is sufficiently discOminating.
The channeling of more resources to teaching and research activities, in theform of staff, books, journals, stationery, transport, equipment and materials, anda clearer orientation of the university's resources to its primary teaching andresearch objectives, should permit more imaginative teaching of students. Such areordering of priorities does not entail additional financial resources; it doesentail a clear perception of the need to use resources in accordance with priorities.

18
The General Level of Education
Before concluding this book, a review of the general educational and literary
levels of the population is appropriate. Such information helps to provide a context
for the accomplishments of the past and to delineate the magnitude of what 'tillremains to be accomplished. The principal source of information is the 1980
census.
The Educational Level of the Population
In general, the educational level of the Zambian population is low. In 1980, 42.2
percent of the population aged five years and above were reported as having had no
schooling, while no more than about 10 percent had a secondary or highereducation. Yet the situation has improved significantly since 1969, when more than
50 percent had no schooling and when less than five percent had a secondary orhigher education. The improvements between 1969 and 1980 occurred when the
population was growing very fast, hence the higher proportions reported for 1980
represent very large increases in absolute numbers.The seemingly large proportion of 42.2 percent with no schooling should be
looked at in the light of what was stated earlier about the age of primary school
children. The legal school entry age is seven or eight, but many children do not
begin school until they are much older. This inflates the number of childrenamong those with no schooling and distorts the figures. We can obtain a betterpicture by considering a more adult population, namely, those aged 15 and above.
Of this group, 35.8 percent had no schooling, 47.1 percent had a primary education
only, 15.9 percent had a secondary education, and 0.14 percent had a universityeducation (table 18.1). Even in these terms the educational level is low, and clearly
much remains to be done.As table 18.1 shows, sex differences in educational attainment are pronounced:
at every level the position of males is more favorable than that of females. Similardifferences are found in the population's educational profile when it is classified as
rural or urban: the rural population is generally less well educated than the urban
population. A larger proportion of the rural people had no education, and a smaller
proportion had a secondary or higher education. The most seriously affected rural
areas were the North-Western province, where 60.7 percent had no schooling, the
Eastern (58.5 percent), and the Western (56.0 percent). The most favored urban

The General Level of Education 293
Table 18.1 The Educational Level of Zambians Over the Age of 15 as of August 1980'111Educationa: Level Total Male Female
Ruralresidents
Urbanresidents
No schooling 982,354 317,321 665,033 779,439 202,915Primary 1,293,210 681,481 611,719 758,776 534,434Sedondary 436,492 292,759 143,733 137,898 298,594Higher education 3,740 2,758 922 524 3,216Not stated 27,645 16,112 11,533 13,271 14,374
'otal 2,743,441 1,310,431 1,433,010 1,689,908 1,053,533
:entage distribution Total Male Female Rural Urban
No schooling 35.80 24.20 46.40 46.10 19.30Primary 47.10 52.00 42.70 44.90 50.70Secondary 15.90 22.30 10.00 8.20 28.30Higher education 0.14 0.21 0.07 0.03 0.31
Source: CSO (1985a, table 4.3).
areas were in the Central province, where the proportion having no schooling wasas low as 27.4 percent, in the Copperbelt (28.3 percent), and in the Luapula province(30.1 percent).
This rural-urban dichotomy appears also at the level of those with primaryeducation. The proportion with educational attainment limited to grades 1 to 4 ishigher in rural than in urban areas, but for each of the upper primary grades, 5 to 7,the proportions in the urban areas are always higher. Thus, in addition to a highpercentage of the rural population having no schooling, 56.9 percent had only fouryears of schooling or less, and only 19 percent had the full seven years of primaryschool. Much of this imbalance is due to the bottleneck that still prevents ruralgrade 4 children from enjoying automatic promotion to grade 5.
The educational impoverishment of the rural areas is also seen at the secondaryand tertiary levels. It is remarkable that although secondary schools are notconcentrated in urban areas, some two-thirds of all ilipse who had a secondaryeducation were found in urban areas. Clearly there must be a considerable influxof secondary school-leavers from the rural areas into the towns. Similarly,although no more than 10 percent of the intake to the University of Zambia comesfrom Lusaka, more than half the 1980 population with a university education wasbased in the urban parts of Lusaka province. The prospect of better job opportunitiesin urban areas clearly attracts the more highly qualified individuals. In theprocess rural areas are being drained of many of their most promising youngpeople, and those best qualified to promote their development. There is no way ofknowing whether this movement is continuing, or whether the more difficulteconomic conditions of recent years have affected it in any way. The 1990 censusshould help answer these questions.
Finally, the proportion of the population with higher education fell from 0.3percent in 1969 to 0.2 percent in 1980. Given the high rate of population growth, such
2 1 5

194 Education in a Declining Economy: The Case of Zambia, 1975.85
a fall in proportions is perfectly feasible, even with a substantial increace inabsolute numbers. However, the reported fall in proportions should also beinterpreted in the light of the criterion used for higher education. The 1969 censusindicated that 2,052 Zambians had completed technical or higher education, wherehigher education included those who had completed 12 years of schooling and someadditional technical or professional training. The criterion for inclusion inhigher education was therefore very broad. The 1980 census, however, using themore stringent criterion of 1.2 years of schooling and university level attainment,recorded 3,766 Zambian-born persons as having higher education (CSO 1985a, table4.3). Not surprisingly, only 26 percent of these were female and only 14 percentlived in rural areas.
LiteracyNo direct measures have been made of the extent of illiteracy in Zambia.
Instead, indirect measures are derived from census data on the numbers who havehad no schooling. This method overlooks those who might have become literateoutside the formal school system, in particular, those who might have becomeliterate through literacy classes. The number who became literate through theirown informal efforts is probably very small, since such resources as reading andwriting materials are not sufficiently widespread to support such efforts in anextensive way. But the number who have participated in literacy classes over theyears is significant. Their exclusion from the estimates of the literate populationmeans that this estimate may understate the true figure.
At the same time, many of those who complete the lower primary cycle butproceed no further in school probably relapse into illiteracy, partly because of thepoor foundation the primary school can lay, partly because .1f the absence of suitablereading and writing materials in the home environmeri: P:"..r leaving school andthe lack of stimulation to use those that may be available. In a study of grade 7school-leavers, Hoppers (1979, p. 14) referred to "their education witheringaway...even though it was often carefully nourished by re-reading the contents oftheir exercise-books." This is even more likely for grade 4 leavers. Between 1975and 1979 approximately 112,000 children terminated their formal education at theend of grade 4. These and all the others who in earlier years had had no more thanfour years of primary education should probably be considered illiterate. Studiesfrom other countries, such as Kenya, show that a large proportion of the participantsin literacy classes are individuals who had completed some years of primaryschool, and that these individuals are no more proficient than their unschooledcolleagues in acquiring (or reacquiring) literacy skills.
Thus, the illiterate population is taken to comprise all those with no schooling orwith no more than a grade 4 education. In accordance with UNESCOrecommendations, the literacy rate is determined on the basis of the populationaged 15 and above. With these criteria Zambia's illiteracy rate in 1980 was 47.0percent. This estimate is based on data provided in the census report (CSO 1985b,table 6.7), but does not agree with the estimate provided in the report itself. Thislatter extends the estimate of literacy to include those who had received as little asone year of schooling, and COME up with an illiteracy rate for 1980 of 36.2 percent,but adm its that this is according to a rather broad criterion (CSO 1985b, p. 185).
Literacy rate for males is higher than that for females: 64.3 percent of themale adult population was literate, but only 42.6 percent of the female population.

The General Level a f Education 195
The largest proportion of illiterate males is found among those aged 45 and above,whereas for the females the most illiterate group is mothers, aged 25 to 44.
Literacy ProgramsThe principal method Zambia is using to attack illiteracy is through the formal
school system and the extension of primary education to all children. However,this approach can only be effective for the young and for future generations. For theexisting population of illiterate adults two forms of literacy programs, basic andfunctional, are available. The basic literacy program concentrates on the directteaching and learning of reading, writing, and simple arithmetic. In thefunctional program, literacy skills are taught as the vehicle for certain practicalskills with immediate application to daily life, such as those relating toagriculture, health, and hygiene. Neither program has reached a very largeaudience: the total enrollment in the basic literacy program from 1966 to 1985 wasjust over 106,000, while the total enrollment in the functional literacy program fromthe time of its inception in 1971 up to 1985 was 53,680. Women have outnumberedmen by four to one in each program, probably because of the higher rate of illiteracyamong women.
The financial commitment to the eradication of illiteracy has always been verysmall, notwithstanding the strong verbal support provided by policy statements.Since 1975, the budget for literacy programs has fallen so sharply, that by 1985 it hadbeen reduced to a mere 10 percent of its 1977 value. The rapid decline is probablyattributable as much to a lack of real commitment to the eradication of adultliteracy as to the decline in the availability of resources. Even during the years ofprosperity, in the late 1960s and early 1970s, funds allocated to the literacy programwere progressively reduced.
Why were more funds not made available to the functional literacy program?Early results were promising. In the year of its commencement, when it wasapplied to maize growing, the yields obtained by functional literacy studentsexceeded those of subsistence farmers by 300 percent and of small-scalecommercial farmers by 25 percent, and in isolated cases the yields even exceededthose of large-scale farmers (Mwamba 1986). Although the intention was to extendthe program countrywide, and texts were prepared for it in seven local languages,other priorities gobbled up the resources and the literacy program was allowed todecline. Its low status today suggests that an extensive attack on adult illiteracy isunlikely. Rather, the government seems to accept that with the passage of time andthe extension of formal education to all young people the problem of adult illiteracywill eventually fade away. The draft statement on educational reform hadrecommended that responsibility for literacy education should be assumed by theMinistry of Education, and that an all-out campaign be launched to eradicateilliteracy in the shortest possible time (Ministry of Education 1976, pp. 20-23).Unfortunately neither proposal survived the subsequent rewriting of the draft.

19The Robustness of the
Education System
The foregoing analysis of aspects of Zambia's education system suppc most ofthe hypotheses outlined in the first chapter. Total resources for education haveincreased, but these increases were not commensurate with the system's growth.Consequently, the real amount spent on education declined at most levels, but notall sectors suffered equally. The more vulnerable areas bore the brunt of thecutbacks that had to be made in real terms: primary schools, teacher education,continuing education, out of school youth, literacy education. Such improvementsas occurred were experienced by the more powerful and prestigious areas, namely,thu university and some aspects of secondary provision. A small shift in theallocation of resources occurred away from the lower levels and toward the higher.In addition, structural changes occurred in the use of funds. At almost all levels aneverincreasing proportion was reserved for salaries and an eversmaller amountfor operating purposes and supplies; and at the university, an everincreasingproportion was used to provide administrative and other services and aneversmaller proportion was devoted to teaching and research activities.
At the same time, the government increasingly relied on the private sector forsupport, even though this necessitated some changes in cherished policies. Theauthorities explored almost every method of raising educational revenue from thepublic except directly charging tuition fees for public education. There was alsoincreasing recourse to aid agencies for very diverse forms of assistance, rangingfrom capital investments to operating expenses.
The authorities tended to pay more attention and devote more resources to gettingildren into schools than on their accomplishments once there. Educational
quality fell, and educational achievement, as measured by examination results,was mediocre. A relatively low level of performance persisted, with few signs ofimprovement, but with some signs of deterioration.
Despite all this, the system displayed a certain robustness. Indeed, one of themost striking features to emerge is the resilience of the education system.Notwithstanding the very severe decline in resources, it managed to stay afloatand continue doing what it was supposed to do. In the first few years of the setbacks,signs of considerable strain and disorientation appeared, but when educationpersonnel and the general public had adjusted, things were brought back on courseagain. Quantitative expansion resumed its pace and educational opportunitieswere offered to the country's children in a way that had never been attempted before.
196
2t3
The Robustness of the Education System 197
At the same time, the authorities exhibited an increased awareness of the need toimprove quality.
Above all, there were the very encouraging signs that the teaching professionwas standing up to the s-Tious problems it had encountered and was developingstrategies for dealing with financial problems and shortages. Self-reliance, self-help, self-renewal, and resourcefulness all became important key words in theeducational world during the past decade, but more especially during the past fiveor six years. Although the odds were against them, some efforts were made tomaintain standards, and even to improve them. But regardless of the standards,regardless of the quality, the people's faith in education's ability to deliver themand their children from the oppression of poverty remained as strong as ever. Theynot only continued to make sacrifices for it, but they undertook to support theeducation system in a way that would not have been thought possible in earlieryears.
These considerations give rise to considerable optimism despite the gloomyeconomic prospects. What can the authorities do to capitalize on so much goodwilland readiness to assist? One thing, surely is to share responsibility wherefinancing is shared. The community has effectively been cut off from the school,from what really goes on within its walls and from its professional life andactivities. This divorce has been accentuated by an examination system whose aimis to select a small percentage of students to progress to the next stage of education,and which fosters a curriculum that turns its back on the community. This has ledto many justifiable charges that the education the schools provide is irrelevant andalienates young people from their surroundings.
Thus, the community needs to be involved more directly in the total life of theschool, including its professional affairs and, on occasion, even its actualteaching. This latter is probably essential if education is "to restore to their rightfulstatus the African cultural heritage and the traditional social and human valuesthat hold potential for the future and for progress" (Cisse 1986, p. 21). Communityinvolvement and the redesign of the examination system so that it serveseducational purposes and not merely selective, administrative functions, areprerequisites for the development of an education that is truly responsive to thepeople's needs.
Th9 government must also recognize that nine years of education for allchildren, though a noble and praiseworthy goal, is something that it simply cannotaccomplish with current or likely future resources. Instead, every effort should bechanneled toward that sector of education where the mkjority of children are found:the primary sector. In other words, seven years of primary education are all thatcan be made universally available for at least a generation to come. Success innational development will depend more on success here than in any othereducational sphere, and failure here will condemn the country to perpetualunderdevelopment.
A further need in the education system is for more data about the system and forthe use of such information in guiding policymakers' decisions.
Finally, and most difficult of all, is the clear need to finance education in waysthat have not been practiced up to now, and the need to consider offering educationin ways that have not been conventional up to now. The pincer squeeze of decliningfinances and increasing population make such considerations necessary. IfZambia is to achieve universal primary education by the end of this century, anadditional 1.26 million primary school places will be needed if every child is to beassured of seven years of primary education. The government is unlikely to
2 1 ;)

198 Education in a Declining Economy: The Cam of Zambia, 1975-85
achieve this by relying on conventional methods. Very few new sources foreducational finances exist, and those that do will bring no more than marginalrelief, particularly as they must originate from a population that is impoverishedand from an economy that is in decline. Until efforts are directed to the design ofthese new methods, there is no way of knowing what form they might take, but itwould be surprising if they did not make liberal use of the one resource that isavailable in abundance, the people of the country, who in the days be: 'we theintroduction of formal education succeeded in equipping young people with aneducation that was both meaningful and satisfying.

References
Africa, H. P. 1980. "Language in Lducation in a Multilingual State: A Case Studyof the Role of English in the Educational System of Zambia."Unpublished Ph.D. dissertation, University of Toronto.
Bardouille, R. 1982. The Mobility of First Degree Level Graduates of the Unlversityof Zambia. The Case of the 1976 Cohort of Graduates. Manpower F.r.searchReport No. 11. Lusaka: Institute for African Studies, Unive.-sity ofZambia.
. 1987. "Manpower and Employment: Review of Recent Tren, in theLabour Market in Zambia.* In National Technical CooperationAssessment and Programming Mission to Zambia. Technical Papers.Technical Paper No. 1. New York: United Nations Developmenti'rogramme.
Castle, E. B. 1966. Growing up in East Africa. London: Oxford University Press.
CTiC. 1982. Annual Report. Lusaka.
Central African Council. 1953. Report of the Commission on Higher Education forAfricans in Central Africa. Salisbury: Cen xal African Council.
Chishimba, M. M. 1980. "Observations on the Englisl Medium Component of theZambia Primary Course." Zambia Edu :ational Review 2(1): 32-48.Department of Education, University of Zimbia, Lusaka.
Christian Churches. 1979. Marxism, Human.:sm and Christianity. Lusaka:Teresianum Press.
Cisse, S. Y. 1986. Education in Africa in the Light of the Harare Conference (1982).Educational Studies and Documents No. 50. Paris: UNESCO.
Clarke, R. 1979. "The Rise and Fall of the Educational Reform Movement."Zamoia Education Review 1(1): 4-8. Department f Education,University of Zambia, Lusaka.

200 Education in a Declining Economy: The Case of Zambia, 1975.85
Clarke, R., and L. H. Kaluba. 1987. "Technical Assistance to the Education Sectorin Zambia: Trends, Needs, and the Potential for Development." InNational Technical Cooperation Assessment and ProgrammingMission to Zambia. Technical Papers. Technical Paper No. 7. NewYork: UNDP.
Cochrane, S. H. 1979. Fertility and Educatioh : What Do We Really Know?Baltimore, MD: Johns Hopkins UniverE ity Press.
Cochrane, S. H., D. J. O'Hara, and J. Leslie. 19W. The Effects of Education onHealth. Staff Working Paper No. 405. 'Washington, D. C.: World Bank.
Colclough, C. 1974. "Education or Change? Some Choices for Central and SouthernAfrica." Journal of Modern African Stud!es 12 (3): 459-470.
Colclough, C., K. Lewin, and J. Oxenham. 1985. "Donor Agency Support forPrimary Education: Strategies Reconsidered." International Journal ofEducational Development 5 ,4): 295-306.
Coombe, T. 1967a. "The Origins of Secondary Education in Zambia." AfricanSocial Research 3 (June): 173-205.
1967b. "The ()T.:gins of Secondary Education in Zambia." AfricanSocial Research 4 (December): 283-315.
. 1968. "Tae Origins of Secondary Education in Zanik 1." AfricanSocial Reseamh 5 (June): 365-405.
C ombe, T., and P. Lauvas. 19+.i4. Facilitating Self-Renewal in ZambianEducation. Educational Reports No. 1. Oslo: NORAD.
Coombs, P. H. 1985. The Woqd Crisis in Education. The View from the Eighties.New York: Oxfola University Press.
CSO. 1971. Statistical Yearbook. Lusaka.
. 1985a. 1980 Census of Population and Housing. Volume 1: GeneralPopulation and Migration Tables. Lusaka.
. 1985h. 1980 Population and Housing Census of Zambia. AnalyticalReport, *Volume II: DemograpPo and Socio-Economic Characteristics ofZambia Population. Lusaka.
. 1986. Monthly Digest of Statistics. Vol. XXII, Sept./Dec. Lusaka.
. 1987a. Consumer Price Statistics. No. 24, May. Lusaka.
. 1987b. Lusaka Urban Labour Force Survey 195. Lusaka.
Daniel, P. 1985. "Zambia: Economy." IP Africa South of the Sahara, 1986. 15thEdition. London: Europa Publications.
Dutcher, N. 1982. The Use of First and Second Languages in Primary Education:Selected Case Studies. Staff Working Paper No. 504. Washington, D. C.:World Bank.

Reference. 201
Eicher, J. C. 1984. Educational Costing and Financing in Developing Countries:Focus on Sub-Saharan Africa. Staff Working Paper No. 655.Washington, D. C.: World Bank.
EIU. Various issues, 1975 to 1987. Economist Intelligence Unit Country Series:Zambia. London: The Economist Intelligence Unit.
Examinations Council. 1984. The Structure of the New Curriculum. Lusaka.
FINNIDA. 1984. Zambia Educational Materiuls Project. Helsinki: FINNIDA.
Fuller, B. 1985. Raising School Quality in Developing Countries: WhatInvestments Boost Learning? Education snd Training SeriesDiscussion Paper No. EDT7. Washington, D. C.: World Bank.
Goma, L. H. K. 1977. Opening kddress to the Evaluation Seminsr on the NationalDebate on Educational Refo, ns, Lusaka, January 31, 197". Lusaka:Ministry of Education. Processed.
Green, R. H., and H. Singer. 1984. "Sub-Saharan Africa in Depression: TheImpact on the Welfare of Children." Werld Development 12(3): 283-296.
GRZ. 1966a. Manpower Report. Lusaka: Government Printer.
. 1966b. First National Development Plan (1966-1970). Lusaka:Government Printer.
. Annual issues, 1968-85. Financial Report. Lusaka: GovernmentPrinter.
. 1969. Zambian Manpower. Lusaka: Government Printer.
. 1971. Second National Development Plan (1972-1976). Lusaka:Government Printer.
. Annual issues, 1975 to 1987. Estabtishment Register. Lusaka:Government Printer.
1975. White Paper No. 1 of 1975 (The Reactions of the Party and itsGovernment to the Recommendations of the Mwanakatwe SalariesCommission). Lusaka: Government Printer.
1979. Third National Development Plan (1979-1983). Lusaka:Government Printer.
. 1980. White Paper No. 3 of 1980 (The Reactions of the Party and itsGovernment to the Recommendations of the Muchangwe SalariesCommission). Lusaka: Government Printer.
. 1983. The Examinations Council of Zambia Act, 1983. Lusaka:Government Printer.
. 1985a./Report o/ the Ad Hoc Committee of Inquiry into the Size andComposition of the Civil Service, its Organisational Structures andGrading of Posts (The Lavu Report). Lusaka: Government Printer.

202 Education in a Declining Economy: 77:c Case of Zambia, 1975.85
. 198513. White Paper No. 4 of 1985 (The Reactions of the Party and itsGovernment to the Recommendations of the Ad Hoc Committee ofInquiry into :he Size and Composition of the Civil Service). Lusaka:Government Penter.
. 1986. Annual Plan 1987. Lusaka: Government Printer.
. 1987. Budget Address by the Hon. Prime Minister and Min:ster ofFinance and National Commission for Development Planning.Lusaka: Government Printer.
Heyneman, S. P. 1983. "Education during a Period of Austerity: Uganda, 1971-1981." Comparative Education R -view 27 (3): 403-413.
Hopkins, T., and R. Siamwiza. 1987. "Technical Cooperation Personnel and theirZambian Counterports: An Exploratory Study." In National TechnicalCooperation Assessment and Programming Mission to Zambia.Technical Papers. Technical Paper No. 9. New York: UNDP.
Hoppers, W. 1979. "What Sort of Crisis is the Primary School Leaver Crisia inZambia?" Zambia Educational Review 1 (December): 9-21. Departmentof Education, University of Zambia, Lusaka.
. 1980a. Education in a Reral fiociety: Primary Pupils and School-Leavers in Mwinilunga, Zambia. Centre for the Study of Education inDeveloping Countries: The Hague, and Lusaka: Institute for AfricanStudies, University of Zambia.
.11
. 1980b. "The Aftermath of Failure: Experiences of Primary School-Leavers in Rural Zambia." African Social Research (29).
ILO/JASPA. 1977. Narrowing the Gaps for Basic Needs and ProductiveEmployment in Zambia. Addis Ababa: ILO.
. 1981. Basic Needs in an Economy under Pressure. Findings andRecommendations of an ILO/JASPA Basic Needs Mission to Zambia.Addis Ababa, Ethiopia.
Imenda, S. N., and G. A. Chibesakunda. 1986. Baseline Study on the Science andMathematics Educational Support Project (SCIMSESP) and theEstablishment of a Science and Mathematics Equipment Centre.Consultancy Report. Lusaka: UNDP.
Jackman, R. H. 1977. "The Rate of Zambianisation of the Secondary SchoolTeaching Force." Unpublished M.Ed. thesis, University of Zambia.
Jolly, R. 1971. "The Skilled Manpower Constraint." In C. Elliott (ed.), Constraintson the Economic Development of Zambia. Nairobi: Oxford UniversityPress.
Kaluba, L. H. 1986. A Tracer Study of Grade 12 Graduates from David Kaunda andHillcrest Secondary Technical Schools. Educational Reform

References 203
Implementation Project. Lusaka: School of Education, University ofZambia.
Kapambwe, G. M. 1980. "An Investigation into the Relationship between HomeBackground and Scholastic Achievement of a Group of Junior SecondarySchool Pupils in Zambia." Unpublished M.Ed. thesis, University ofZa nbia, Lusaka, Zambia.
Kaunda, K. D. 1982. "Humanism and Development." Presidential address tochurch leaders, Humanism and Development Seminar, Lusaka, March,18-19, 1982.
. 1987. New Economic Recovery Programme. Presidential address tothe nation, May 1, 1987. Lusaka: Government Printer.
Kelly, M. J. 1985. Financing Education. Report on Economic Development InstituteWorkshop on the Mnancing of Education in Some English-SpeakingCountries of Sub-Saharan Africa, Nairobi, January 28-February 1, 1985.School of Education, University of Zambia, Lusaka. Processed.
Kelly, M. J., E. B. Nkwanga, L. H. Kaluba, P. P. W. Achola, and X Nilsson. 1986.The Provision of Education for All: Towards the Implementation ofZambia's Educational Reforms under Demographic and EconomicConstraints, 1986-2000. Educational Reform Implementation Project.Lusaka: School of Education, University of Zambia.
King, N. 1986. Problems and Prospects of Aid to Education in Sub-Saharan Africa.In H. Hawes and T. Coombe, eds., Educ:stion Priorities and AidResponses in Sub-Saharan Africa. London: Overseas DevelopmentAdministration and University of London Institute of Education.
Krumm, K L. 1985. The External Debt of Sub-Saharan Africa. Origins, Magnitudeand Implication for Action. Staff Working Paper No. 741. Washington,D. C.: World Bank.
Lane, W. 1976. "Jesuit Religious Education. Zambesi to Zambia, 1875-1975."Unpublished M.Ed. thesis, University of Dublin, Ireland.
Lewin, K. 1986. "Educational Finance in Recession." Prospects XVI (2) (serial no.58): 215-230.
Lourie, S. 1986. "Impact of Recession and Adjustment on Education.* Paperpresented at the North-South Round Table on Development: The HumanDimension, Salzburg, September 7-9, 1986.
Lungu, G. F. 1985. "Elites, Incrementalism and Educational Policymaking inPost-independence Zambia." Comparative Education 21(3): 287-296.
. 1986. "The Church, Labour and the Press in Zambia: The Role ofCritical Observers in a One-Party State." African Affairs 85(340): 38C410.
204 Education in a Declining Economy: The Case of Zambia, 1975.85
McAdam, B. 1973. "The Effectiveness f the New English Medium Primary SchoolCurriculum in Zambia." Unpublished Ph.D. dissertation, University ofManchester.
Mingat, A., and J. P. Tan. "Subsidization of Higher Education versus Expansionof Primary Enrollments: What can a Shift of Resources Achieve in Sub-Saharan Africa?" Internaaonal Journal of Educational Development5(4): 2G9-268.
( 1986. "Who Profits from the Public Funding of Education: AComparison of World Regions." Comparative Education Review 30(2):260-270.
Ministry of Education. Annual issues, 1970 to 1977. Educational Statistics. Lusaka.
. Annual issues, 1975 to 1977. Annual Report. Lusaka.
. 1976. Education for Development. Educational Reforms Study ToursBriefing Seminar, Lusaka, April 29-30, 1975. Processed.
. 1976a. Education for Development. Draft Statement on EducationalReform. Lusaka.
. 1976b. "The Localisation of the Form 5 Examination: A Programmefor Action." Lusaka. Processed.
. 1977. Educational Reform. Proposals and Recommendations.Lusaka.
Ministry of Education and Culture. Annual issues, 1978 to 1982. Annual Report.Lusaka.
. 1978 to 1980. Educational Statistics. Lusaka.
Ministry of General Education and Culture. 1986. Educational Statistics 1981.Lusaka.
Ministry of Higher Education. 1983. Educational Statistics. Lusaka.
. 1987a. Guide Notes on the Implementation of the Self-Help ActionPlan for Education (SHAPE) A Programme of the Teachers for theTeachers by the Teachers. Lusaka: SHAPE Secretariat.
Ministry of Higher Education and Ministry of General Education and Culture.1985. Self-Help Action Plan for Education (SHAPE), 1986-88. Lusaka.
Munachonga, M. 1937. Impact of Economic Adjustmecats on Women in Zambia."In National Technical Cooperation Assesement and ProgrammingMission to Zambia. Technical Papers. Technical Paper No. 2. NewYork: UNDP.
Mwamba, 0. M. 1986. "Some Information on Mass Literacy and Social WelfareProgrammes." Lusaka: Department of Social Development, Ministry ofLabour and Social Services. Processed.

References 205
Mwanakatwe, J. M. 1968. The Growth of Education in Zambia since Independence.Lusaka: Oxford University Press.
Mwanalushi, M. 1980. "Adolescents and Their Parents: An Exploratory Study ofZambian Secondary School Youth." ZANGO: Zambian Journal ofContemporary Issues (8): 60-78.
Ndondo, W. C. 1984. Differential Influence of Environment, Gender and Socio-Economic Status on the Occupational Aspirations and Expectations ofPupils in Selected Secondary Schools in Zambia. Incomplete M.Ed.dissertation, University of Zambia.
Norrby, G. 1986. Assessment of Training Needs for the Agricultural Sector inZambia with Special Reference to the Utilisation of Existing Colleges forAgricultura Training. Uppsala: Swedish University of AgriculturalSciences, International Rural Development Center.
NRG. Department of Native Education. 1930. Annual Report. Lusaka:Government Printer.
Department of Native Educaticn. 1937. Annual Report. Lusaka:Government Printer.
. 1964. Report of the Committee on the Development of a University inNorthern Rhodesia (The Lockwood Report). Lusaka: GovernmentPrinter.
Nyirenda, W. P. (chairman) 1986. Report of the Commission of Inquiry Appointedto Inquire into the Affairs of the University of Zambia. Lusaka:Government Printer.
O'Brien, D. 1982. "Party, Polity and Bureaucracy: The Zambian Education Debate,1974-77." African Affairs 81(323): 207-230.
ODA-ULIE. 1986. Education Priorities and Aid Responses in Sub-Saharan Africa.Report of a conference at Cumberland Lodge, Windsor, December 4-7,1984. H. Hawes and T. Coombe, eds., with C. Coombe and K. Lillis.Ltindon: Overseas Development Administration and University ofLondon Institute of Education.
OECD. 1985. Twenty-Five Years of Development Cooperation. A Review. Effortsand Policies of the Members of the Development Assistance Committee.Paris.
. 1987. Development Cooperation. Efforts and Policies of the Membersof the Development Assistance Committee. Paris.
Ohanessian, S., and M. E. Kashoki, eds. 1978. Language in Zambia. Lusaka:University of Zambia.
Oxenham, J. 1984. "Expenditure and Output in Education." International Journalof Educational Development 4(1): 1-7.
2 ') 7

206 Education in a Declinim Economy: The Case of Zambia, 1975.85
Rigg, J. A. 1980. "Secondary School Libraries in Zambia: Results of aQuestionnaire.' Zambia Educational Review 1(June): 32-34.Department of Education, University of Zambia, Lusaka.
Rosenthal, R., and L. Jacobson. 1966. "Teachers' Expectancies: Determinants of IQ
Gains." Psychological Reports 19(1): 115-118.
Sanyal, B. C., J. H. Case, P. S. Dow, and M. B. Jackman. 1976. Higher Educationand the Labour Market in Zambia: Expectations and Performance.Paris: UNESCO, and Lusaka: University of Zambia.
Serpell, R. 1987. "Teachers, Pupils and Parents in a Rural Area: Experience andOpinions of Some Primary School Teachers in Zambia's EasternProvince." Paper presented at Educational Research Bureau Seminar,University of Zambia, March.
Shana, S. C. P. 1980. "Which Language? A Brief History of the Medium of'
Instruction Issue in Northern Rhodesia.* Zambia Educational Review2(1): 4-20. Department of Education, University of Zambia, Lusaka.
Shanks, I. P. 1983. "Production Units in Zambian Schools." Journal of theFoundation for Education with Production 2(1): 5-27.
Sharma, R. 1973. "The Reading Skills of Grade III Children." Lusaka: Ministry of
Education. Processed.
. 1975. Examinations, Evaluation and Guidance. EducationalReforms Special Investigation Report. Lusaka: Ministry of Education.
Shaw, C. P. 1979. Teacher Wastage: A Study of Wastage among Trained ZambianSecondary School Teachers, 1970-1977. Manpower Research Report No.3. Lusaka: Institute for African Studies, University of Zambia.
. 1980 "The University of Zambia and National ManpowerRequirements." African Social Research (29): 741-765.
SIDA/GRZ. 1983. Joint Annual Review. Lusaka: Swedish Embassy and Ministryof General Education and Culture.
Simson, H. 1985. Zambia. A Country Study. Uppsala: Scandinavian Institute ofAfrican Studies.
Snelson, P. D. 1974. Educational Development in Northern Rhodesia, 1883-1945.Lusaka: National Educational Company of Zambia.
Somerset, H. C. A. 1982. "Examination Reform. The Kenya Experience."Washington, D. C.: World Bank. (See also World Bank Education andTraining Series, EDT64, February 1987.)
'Itracer Project. 1975. "Attrition from the Teaching Force." Draft mimeo CRP-73-03. Lusaka: University of Zambia.
UNDr. Annual issues, 1976 to 1985. Report on Development Cooperation withZambia. Lusaka.

References 207
. 1986. Restructuring and Development in Zambia. Roles forTechnical Cooperation. Report of the National Technical CooperationAssessment and Programming Mission to Zambia (The NATCAPReport). New York.
UN/ECAJFAO. 1964. Economic Development of Zambia. Report of theUN 1 ECA /FAO Economic Survey Mission. New York: United Nations.
UNESCO. 1962. Higher Education in Africa. Report of the TannanariveConference. Paris: UNESCO.
1964. Education in Northern Rhodesia: Report andRecommendations Pr pared by th,q UNESCO Planning Mission (TheRadford Report). Paris: UNESCO, and Lusaka: Government Printer.
. 1972. Learning to Be: The World of Education Today and Tomorrow.Report of the International Commission for the Development ofEducation (The Faure Report). Paris: UNESCO.
UNICEF. 1986. Situation Analysis of Children and Women in Zambia. Lusaka.
United Church of Zambia. 1982. A Paper Written to Inform our Church's Membersabout Scientific Socialism. Lusaka: Lusaka Synod.
United National Independence Party. 1985. The National Policies for the Decade1985-1995. Lusaka: Freedom House.
University of Zambia. 1974 to 1985. Annual Report. Lusaka.
Weiler, H. N. 1983. "Aid for Education: The Political Economy of InternationalCooperation in Educational Development." Manuscript Roport IDRC-MR84e. Ottawa: International Development Research Centre. October.Processed.
Williams, P. 1986. "African Education under Siege." In H. Hawes and T.Coombe, eds., Education Priorities and Aid Responses in Sub-SaharanMica. London: Overseas Development Administration and Universityof London Institute of Education.
Wilmott, A. S., and D. L. Nuttall. 1975. The Reliability of Examinations at 16+.Schools Council Research Studies. London: MacMillan Education.
Wolff, L. 1984. Controlling the Costs of Education in Eastern Africa. A Review ofData, Issues and Policies. Staff Working Paper No. 702. Washington,D. C.: World Bank.
World Bank. 1986. Financing Education in Developing Countries. An Explorationof Policy Options. Washington, D. C.: World Bank.

Distributors of World Bank PublicationsARGIINTDIAWoo HSWE, SRLWed ComaWorld' 165, Mk Row Ok 451140133311unard Aires
AUSTRALLA, PAPUA NEW GUM%FIJI, SOLOMON ISLAND%VANUATU, AND WISTERN SAMOAOA. Seeks Cows&644 WIedobane RoadMown 3132%aced
AUSTRIAGerald and CoGrob= 31A1011 WW1
AHRAINBahrain R. Ind 0011111.114M7
Asooddeo Ltd.P.O. Bat 211t0MINIM Town 317
ANGLADISHMicro bidweid Dertiopmant
Modumm Soddy 04IDA53Howe 5, Rood 16Ottesonondi R/AraoMika 1200
i he'd "yrs:154 Nur Ahmed SaabCleittegors 4003
76, n.DA Avet.Kul.
BELGIUMJun De LamelyAv. du Rai 2021040 Bruise&
BRAZILR&M:role Tux.. 1111t1rRactOrtla
ULU.Rua PtxooGsidi. 70701109 Sso Paulo SP
CANADAto 1306.seurC.P W, 193111 rue AntpkraBoudiarville, Oahe141 5E6
CHINA(NM lirtandal & Boman& Publishing
Bowe& Ds Po SI DavilaPatPs
COLO/ASIAMIcenlars LidaApartado Arno 34270Begets D.E.
COTE IYIVOIRECentre el' Ed Ism et de Whaled
Atacama (CEDA)0111 P 541Abidjan 04 Plateau
CYPRUSmaw Information SetvicesP 0 Box 2096Nicosia
DENMARKSunh.mdsUttereturRaler.Oeitia AIN 11DK-19711 Pmderikabers C
DOMINICAN REPUBLICEditors Tail. C. por AReetatracito a Isabel is Cataire 309Amitotic Postal 2190SMID 001111140
EL SALVADORNudesAvenida Manuel Enrique Amigo I3530B&W° MS& ler &noSat Salado/
EGWT, ARAB REPUBLIC OFAI AttractAI Galas SiredCairo
The Middle 'Ins Observer8 Ch marts StreetCdro
FINLANDAbalassiow 17tsdkaupyaP.O. ImiIRC0101Haifild 10
PRANG%Wald Iw.b Publimtled46, mow riftsPali Pals
GOMA" MORAL REPUBIX OFUNOVorlisPoppoidarke A/leo 55DOW Bair 1
24.
MICR
Ippodutou Strad MO PliweirmAdems$1435
tWATIMALAUlarerios /Wm SamsSa Carlo 7432.46111
Guabondia City
HONG KONG, MACAOAda IWO tad.6 R. 146 Prince Medd
Road, W.ItowfoosHong Kuts
HUNGARY/GuinnPO Pea 14013W Sudapoot 62
INDIAAlbod PUMAS., Privabe751 Moult RoadMadam WO 002
offincMN. Revd& MorsBallud EdamBombay 400 0311
13/14 Aed Ali RoodNow Deihi 110 W2
17 Mama* AdamCaloom 71:0 072
Nye:lava Hood Building5th Mal% ROOd Gandhanar
- 540 039
34.1129 Kachiguda Crow RoadHyduabad 51:0 027
Prarthans Rad 26d PlowNaar Thakare Baug, NawangpuraAhmadabad 300009
PAWL House14-A Ashok MarsLocknow 226 COI
INDONESIAPt Indira UmitedJI. Sem Ratulangi 37P 0 Box IIINur& Puma
ITALYLicosa Canunissiaiaris Sanded SPAVia Benedetto Fortini. 120/10Camelia Posta& 55250125 Ramon
JAPANEwen Book Service37-3 Hongo 3.0itane, BurikyoAs 113Trdiyo
KENYAAfrica Rook Service DIA LtdP 0 Box 4524.5Nairobi
KOREA. REPUBlIc OPPim Kora Book Ccepaa EatP 0 Box 101. KwengwhastunSoul
KuWAITMEMRB Information Savo.PU Bon 5665
MALAYSIAUnivudty d Maliya CO:IperatiVi
9, Uniwd
P 0 12111111; Nut how BaruKuda Lumpur
WROCONFU=/*Mods Pedal O46014010 Ups% Meade D.P.
MOROCCOWoad MAU WAWA Mudrolaa12 nal Mona% It d'AriaCarbines
MOORLANDSloOPPublikalir So.P.O. Ion 14710 RA Loom
NEW IZALANDHOD Ulm mil Mondial ServicePrivilegesNow Motte1Audtlood
NMI=Undwity Rye Undialnem Crowds Bulldog bride,Paw* MallBas 5016hada
NORWAYNarrow Isladiabao OmarRook DepuleteidP.O. Ion 6173 IdemtadNOM Ode 6
OMANMENU Sofornisdoe SwimP.O. Bar 1612 Saab AiipodMudd
PAKISTANMina Rook Agony45, SoloraboQuaidet-AuanP.O. Roo No 729Ware 3
PERUMudd Daurrollo SAApdtado 3124Lb.
PHILIPPINESNational Soak Store701 Riad AmurP.O. los 1934Moro Malta
Miamattemai Bock CantuPIM Roar, Rliplosa Ufa BuildingAyala Avon" MakaaMoto Motile
POLANDORPANPalm Wray I Nagai03431 Warszawa
PORTUGALUwaria PortugalRua Do Cum 713.741203 Lid=
SAUDI ARABIA, QATARIda Ilozic SloeP.O. Box 3196%yolk 11471
MENU Inharnation Servicesgawk oft=AI Ales StreetAI Dahno CantuRrsi RomP 0. Boo 7164Riyadh
Hall Abdullah Alt,. BuildingKing Khaled SawP.O. Box 3969Damotan
33. Ma/mused Hassan Awad StileP 0. BOX ginJeddals
SINGAPORE, TAIWAN, MYANMAR.SRUNEIInfornadon Publications
Payson Ud.0246 IN H. Pd-Ra hxduabial
Blds.24 New Induaerki RoadSingapore 19S3
SOUTH AFRICA. 10T8W ANAFes link LiamOda d University Prue Stuthern
AtticaPO Box 1141Cape Town SX0
Fersalurilpilm vimIdwastria6 lobscrIploa SordatPA, B. 41016010aIsludowburs 3724
WADIMirall4twas Labrok IACeded 17WWI blada
Ubrodo imoodood AB=Omit 44 Cud, 301WOW Borodino
SW LANKA AND MR MALDIVE!Laka Hsu. loolo&opP.O. I. 144100, Se Cbieunpakm A. Guam
MardisColombo 2
IWIWW41Fersioys digPriam PukboldforetasdRosorloesdw 12, B. 113563403 27 Sodded.
Pariceptio mks*WaerawWiriairelee6104 23 Stodadoo
SWITZIRIANDre Faqir AlmMudd hypefa No GrowCam padde311CH 1211 Goma 11
Fe. ariast,lan edamIgraine hyotSwim de AbarutemattoCase postale 3312CH1002 Loom*
TANZANIADiked lintradly PruePA. Boo 5299Du es Sdado
THAILANDCamel Darrdst Sam336 SlamMO*TRINIDAD & TOBAGO, ANTIGUASAMOA, ARBADOS,DOMINICA, GRINAD A. GUYANA,IAM AICA. MONTSERRAT, ST.Km. & NEVIS, ST. LUCIA,ST. VINCENT & GRENADINESSymmt dim Studios Unit44 Watts SandCloneTrinidad, Wed lodes
TURRETHari Kit.evi. ASlaiilal Cadded No. 469BeYughtlouribul
UGANDAUsual. BockahopPO. Boa 7145Kampala
UNITED ARAN EMIRATESMIDARB Gull Co.P.O. Box 0:97
shirlak
UNITED KINGDOMMIcromfo LtdP 0. Box 3
Hampdtire GU34 2P6England
URUGUAYMotown Nadcmal dd MinaSan Jaw 1116Maury idiot
VENEZUELAUtowis del EsteAptdo 03337Conan IOWA
TUGO PAVIAJugadoveuks KokoP.O. Box 36Trg Republik*TIM1030 Belgrade

--
. -
'is,)':.
W(..)r1(.1 13,i4 IA h.-
,
i1quartel-s-1S1.ti N,
P11011V.: 2()2.47-'Vicin
1
i202-)..47'Iti'j9,1..,.
Wuld,1)11:('iii)k A1dres...INTR.\.1:}01).
,k - V-;11l \ ;It? \
Eti rtipn. Office66 a volut d'Iti)a
tf,t . .
lt)p119.m...) 1) 111:Aii.;Itl.tAid:
Flu:slit))
.k .
.
TatiV4)4 OffkeIxAtis;:zik:::1;11:11( .
,.
1 Niariiiiouchi.:3Chonn:Jiipon
.;),S,.
.,t/ I P?ffil (
.
: -,(1111L-knul Ativer (.:use r.. .
ji 04t imsc pf.-0.4)(cms. P(p/11111g /)itItcy012(1(i1s ! c1 e,,624iiqf le)r -
I !) SSfIL IIJI del' .5;114(1(1 'I.,/ (I ,
Mat'.(?.11:(1 i 111-41Ydr...,c/C11,01-(1/
Af oits behm mur ot..11/ t,ii(rnitc,-.: a/1(14
.
" .
.
,Te..)143phome:-CIA. 21-1-ii0A1)
i'ausittit1v- 211.73tj57
:
BEST COPY AVAILABLE,!*1=Ntir.,:11&1150:111,14VVY.O.Wr`C,IIII
" 14. .
: `i : 4. ; .