education in peru: the challenge of the perverse triangle
TRANSCRIPT

Education in Peru: the challenge of the
perverse triangleSantiago Cueto, Juan León & Alejandra Miranda
Group for the Analysis of Development

Introduction
• Education in Peru has experienced an uneven growth over the last decades.
• Enrolment has increased quite significantly, especially for primary-age students. However, in spite of claims by successive Governments that education is a priority, the quality of schools and student´s achievement on international (PISA), regional (UNESCO) and national assessments are on average low, and strongly correlated with the socioeconomic characteristics of children.

The notion of Equity in educationBased on works from Opheim (2004), Field, Kuczera & Pond (2007), and Unesco (2008); an equitable educational system involves the following aspects:
• Access to schools
• Educational opportunities at school
• Educational opportunities, none of which should be associated with students´ socio-demographic characteristics or family background.
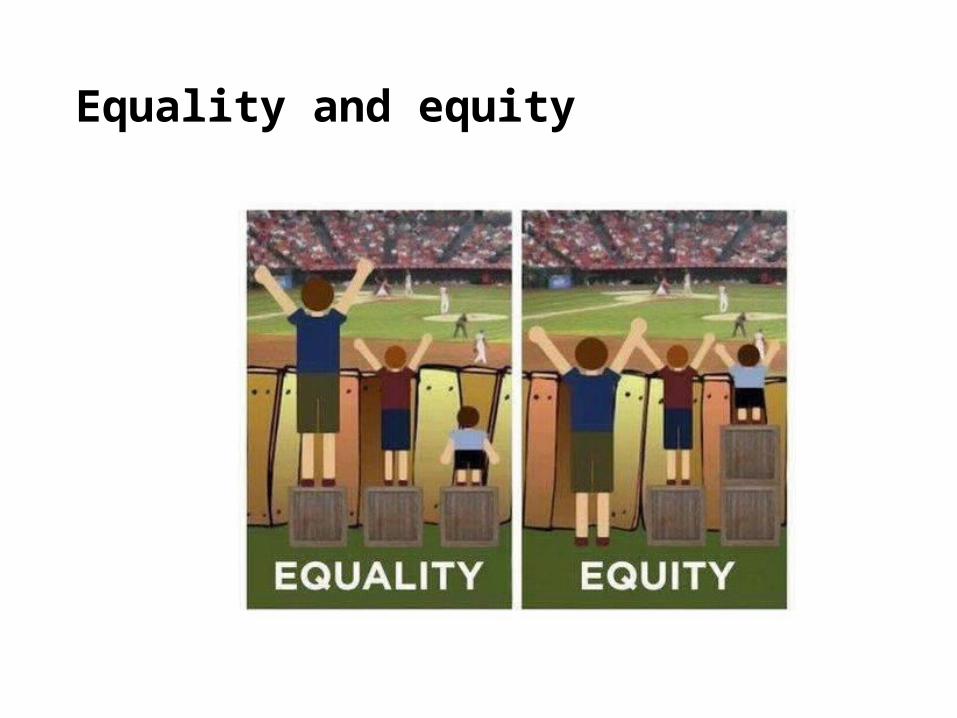
Equality and equity

Educational regulations in Peru
The General Law of Education (28044), approved by Congress in 2003, specifies the goals and guidelines for this sector.
It indicates that education is a right, and education should be free in public institutions. It also includes several principles, including quality, equality, inclusion of students with special needs, mandatory provision of education for students considering their culture and language, and an orientation to strengthen democracy, among others.
The Law also specifies the need for a National Education Project (NEP), which was implemented later by the National Council of Education (Consejo Nacional de Educación, 2006).

The National Education Project (NEP)• The NEP specifies one general and six specific goals for Peruvian education
until 2021.
• The general goal ("vision") for Peruvian education is: "Everybody develops their potential from early childhood, has access to literacy, solves problems, practices values, knows how to continue learning, sees themselves as citizens with rights and responsibilities, and contributes to the development of their communities and country, by combining their cultural and natural capital with world advances" (p.11)
• The six specific goals refer to: Quality educational opportunities and outcomes for all; Students and institutions achieve pertinent and quality learning levels; Well prepared teachers exhibit professional levels of teaching; Educational management is decentralized, funded with equity and achieves expected results; Quality higher education is a positive factor for development and national competitiveness; Society is an agent of education of its citizens and promotes commitment with their community.
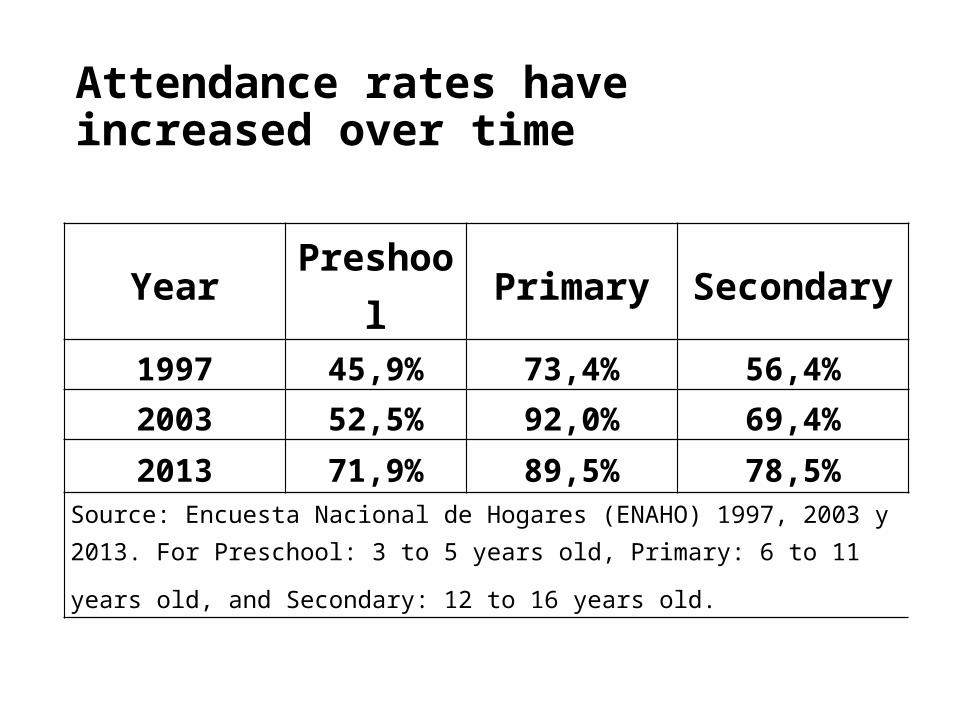
Attendance rates have increased over time
Year Preshool Primary Secondary
1997 45,9% 73,4% 56,4%2003 52,5% 92,0% 69,4%2013 71,9% 89,5% 78,5%
Source: Encuesta Nacional de Hogares (ENAHO) 1997, 2003 y 2013. For Preschool: 3 to 5 years old, Primary: 6 to 11 years old, and Secondary: 12 to 16 years old.
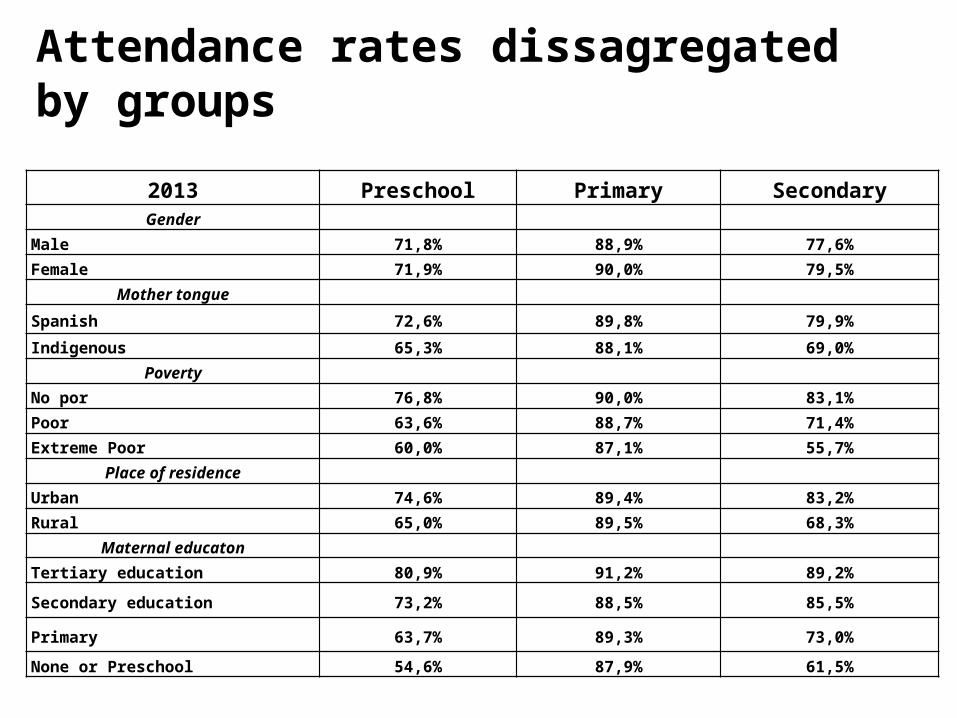
Attendance rates dissagregated by groups
2013 Preschool Primary SecondaryGender
Male 71,8% 88,9% 77,6%Female 71,9% 90,0% 79,5%
Mother tongue
Spanish 72,6% 89,8% 79,9%
Indigenous 65,3% 88,1% 69,0%Poverty
No por 76,8% 90,0% 83,1%Poor 63,6% 88,7% 71,4%Extreme Poor 60,0% 87,1% 55,7%
Place of residence Urban 74,6% 89,4% 83,2%Rural 65,0% 89,5% 68,3%
Maternal educaton Tertiary education 80,9% 91,2% 89,2%
Secondary education 73,2% 88,5% 85,5%
Primary 63,7% 89,3% 73,0%
None or Preschool 54,6% 87,9% 61,5%

Access to schooling is enough?
• It used to be that inequality in education was linked to access to school, but as shown above this trend is changing rapidly for the better.
• Access to primary school was one of the goals set in United Nation´s Millennium Development Goals and UNESCO´s Education for All for 2015. However, more recent initiatives have emphasized the importance of not only attending school but also achieving at expected levels (i.e. enrolment plus learning, see for example recommendations of Learning Metrics Task Force -LMTF- from Unesco, & Systems Approach for Better Educaton Results -SABER- initiative by the World Bank).

Rendimiento en Matemática (ECE)
National Student Census EvaluationMath Achievement
2008 2009 2010 2011 2012 2013
National average 512.4 519.9 515.7 519.4 523.0 526.0
Type of schoolPrivate 545.5 565.5 553.5 555.6 550.1 546Public 504.4 507.7 503.6 507.5 513.2 519Gap (Pr - Pu) 41.1 57.8 49.9 48.2 36.9 27.0
GenderBoy 513.9 523.1 518.1 522.1 525.4 530Girl 510.9 516.6 512.8 516.7 519.5 522Gap (B – G) 3.0 6.5 5.2 5.3 5.9 8.0
School characteristicFull grade 521.8 533.1 529.1 533.6 535.4 538Multigrade 489.6 474.3 469.0 458.2 463.1 474Gap (F – M) 32.2 58.8 60.1 75.4 72.3 64.0
Place of residence (school)
Urban 525.5 538.7 532.4 536.3 539.0 540Rural 485.7 482.5 466.4 457.2 462.4 470Gap (U - R) 39.8 56.1 66.0 79.1 76.6 70.0
Note: Overall mean is 500 and standard deviation 50

Rendimiento en Comprensión deLectura (ECE)
National Student Census EvaluationReading Comprehension achievement
2008 2009 2010 2011 2012 2013National average 503.2 523.9 535.0 535.0 541.0 545.0
Type of schoolPrivate 561.2 572.2 591.2 588.2 592.9 581Public 489.3 511.1 517.2 517.4 523.3 532Gap (Pr - Pu) 71.9 61.1 74.0 70.8 69.7 49.0
GenderBoys 499.0 519.1 530.4 529.6 536.6 541Girls 507.4 528.7 539.6 540.4 545.0 550Gap (B - G) -8.4 -9.6 -9.2 -10.7 -8.4 -9.0
School characteristicFull grade 519.5 536.9 554.2 552.4 555.7 558Multigrade 463.7 479.1 468.7 459.5 471.5 489Gap (F - M) 55.8 57.8 85.5 92.9 84.2 69.0
Place of residence (School)
Urban 525.8 541.8 559.3 556.2 561.1 561Rural 457.4 488.4 463.9 456.8 466.3 481Gap (U – R) 68.4 53.4 95.4 99.3 94.8 80.0
Note: The mean was fixed at 500 and the standard deviation was 50

Vocabulary, Peabody Picture of Vocabulary Test (PPVT) Younger Cohort Older Cohort 2006 (5 yo) 2009 (8 yo) 2013 (12 yo) 2006 (12 yo)Overall mean 27.79 57.51 83.9 79.22Gender Boys 28.54 58.45 86.12 81.14 Girls 27.05 56.59 81.69 77.11 Gap (B - G) 1.49 1.86 4.43 4.03Mother tongue Spanish 32.12 62.15 88.55 83.64 Indigenous 19.98 49.13 75.41 73.43 Gap (S - I) 12.14 13.02 13.14 10.21Place of residence in 2002 Urban 34.48 63.71 89.82 86.09 Rural 16.46 47.12 73.97 70.63 Gap (U - R) 18.02 16.59 15.85 15.46Maternal Education Tertiary Education 45.19 72.27 99.74 97.56 Secondary Education 29.05 60.13 85.74 84.11 None or Primary Education 17.74 46.72 73.78 71.52 Gap (extreme groups) 27.45 25.55 25.96 26.04Poverty in 2002 Highest Quintile 40.64 68.67 96.17 88.2 Lowest inferior 15.7 46.61 74.65 72.65 Gap (H - L) 24.94 22.06 21.52 15.55Source: Young Lives Study

Achievement, opportunities and equity
From the results on standardized tests mentioned above, the question remains if the gaps between groups could be associated to socioeconomic characteristics of children and their families, or if opportunities at school are set up in a way that tend to reinforce inequalities.

Educational opportunities:Association between math achievement and public expenditure per pupil at primary level, by region (r=0.38)
1000 1500 2000 2500 3000 3500400
450
500
550
600
650
Amazonas
AncashApurimac
Arequipa
Ayacucho
Cajamarca
Callao
Cusco
Huancavelica
Huanuco
Ica
Junin
La LibertadLambayeque
Lima Metropolitana
Lima Provincias
Loreto
Madre de Dios
Moquegua
PascoPiura
Puno
San Martín
Tacna
Tumbes
Ucayali
Public expenditure per pupil at primary level (2011)
Mat
h ac
hiev
emen
t (20
12)

Association between reading comprehension achievement and public expenditure per pupil at primary level, by region (r=0.26)
1000 1500 2000 2500 3000 3500440
490
540
590
640
AmazonasAncash
Apurimac
Arequipa
Ayacucho
Cajamarca
Callao
Cusco
Huancavelica
Huanuco
Ica
Junin
La LibertadLambayeque
Lima Metropolitana
Lima Provincias
Loreto
Madre de Dios
Moquegua
Pasco
Piura
Puno
San Martín
Tacna
Tumbes
Ucayali
Public expenditure per pupil at primary level (2011)
Read
ing
Com
preh
ensio
n (2
012)

Educational opportunities: School inputs by type of school
Private Urban Public Rural
PublicPhone 95% 72% 2%Internet 90% 65% 8%Piped water 100% 93% 41%Library 50% 60% 18%Sports field 40% 67% 29%Computer Lab 60% 77% 18%Psychologist at school 60% 12% 2%Administrative staff 80% 67% 20%Source: School Survey, Young Lives Study 2010.

Educational process at school: An explanation for low results and high inequities

Missmatch in educational opportunities for students
solo
solo

The socioeconomic background ar age one is associated with educational opportunities at fourth grade

Reasons for hope
• Access to schooling: Enrollment is increasing in all levels of basic education, and attending school is an important prerequisite for learning and development.
• Gender Gaps: Enrollment and achievement show very similar results for boys and girls, or at least the gaps are much smaller than found with other demographic characteristics.
• Public investment in education is increasing: the budget for education has been steadily increasing during the current administration of President Humala (2011-2016), going from 2.9% of GDP in 2012, to 3.11% of GDP in 2014, and a petition to Congress, for 3.54% of GDP in 2015.

Challenge and policy implications
The major challenge for Peruvian education lies in the inequality of educational opportunities for children who come from indigenous, poor, rural backgrounds, or who come from families with poorly educated mothers, and even worse for children who exhibit several or all of these characteristics (Cueto and Leon 2010; Guadalupe, Leon and Cueto 2013).
It is necessary to develop policies in order to increase average levels of learning, while at the same time decreasing the disparities between groups as defined by socioeconomic characteristics. It would seem that the best way to do this would be to increase the educational opportunities of those children, who for the most have access to education, adapting programs and investing differentially, so that the needs and interests of individuals and groups are met, and their potential for learning fulfilled.

The education perverse triangle
Individual and family characteristics
Students� educational outcomes
Educational opportunities