education matters in guilford county
TRANSCRIPT

Education Matters in Guilford County:Measuring Community and School Success
TABLE OF CONTENTS
Letter from the Guilford Education Alliance . . . . . . . . . . . . . . . . . . . . . . . . . . . . . 3
Introduction . . . . . . . . . . . . . . . . . . . . . . . . . . . . . . . . . . . . . . . . . . . . . . . . . . . . . . 4
Snapshots . . . . . . . . . . . . . . . . . . . . . . . . . . . . . . . . . . . . . . . . . . . . . . . . . . . . . . . . . 6 Overview of Guilford County Overview of Guilford County Schools
Community Indicators . . . . . . . . . . . . . . . . . . . . . . . . . . . . . . . . . . . . . . . . . . . . . . 10 Local Funding Allocation Students Ready for School Community Connections to the Classroom
School Performance Indicators . . . . . . . . . . . . . . . . . . . . . . . . . . . . . . . . . . . . . . . 13 Adequate Yearly Progress High School Achievement - SAT Scores - AP Scores - Graduation Rates - Drop-out Rates Suspension/Expulsion Rates College Performance Classroom and School Leadership - Teacher Profi le - Teacher Turnover - Principal Profi le - Principal Turnover
Next Steps . . . . . . . . . . . . . . . . . . . . . . . . . . . . . . . . . . . . . . . . . . . . . . . . . . . . . . . 27
2

THE MISSION OF …
… the Guilford Education Alliance is to make education the TOP priority of all citizens so that each resident can reach his or her educational potential. The Alliance was formed in 2004 and is guided by a board drawn from leadership in High Point, Greensboro and the County at large. Its work is comprehensive, with all activities designed to increase the public’s involvement in, access to, and knowledge of our educational system with its opportunities and challenges. Indeed, we envision families as active participants in the education of their children, individuals and organizations in the community working together effectively to advance quality education for all, and students demonstrating measurable superior academic achievement. We work with but we are not a part of the Guilford County Schools.
Guilford County’s economy is moving from its traditional manufacturing base to one that requires new and different skills, where creative thinking, problem solving and higher order skills are critical. One of the best ways to assure that we are successfulis to ensure that our greatest resource – our public schools – has the programs and resources needed to prepare our citizens. The quality of education in Guilford County is strategic to our economic future. This is a task that all citizens must assume; it cannot be left to elected offi cials or the schools alone. We are all responsible.
This report, Education Matters in Guilford County: Measuring Community and School Success, is designed to inform the community about education and to stimulate conversation among our citizens about ways to address the needs of our schools. This report will be issued each year and will enable all of us to track progress in two ways – how we as a community are contributing to the success of the schools and how the system is performing. We invite you to study the data; examine the comparisons of our Guilford County Schools to other systems in North Carolina; determine the important areas that need our collective involvement and focus for improvement; and, share in the responsibility for the education of our children by being an involved and informed citizen.
Sincerely,
Richard L. Moore Chair, Board of Directors
Margaret Bourdeaux ArbuckleExecutive Director
3
INTRODUCTION
Welcome to “Education Matters,” your independent review of community and school success in Guilford County. This report seeks to inform the citizens of Guilford County about the factors that defi ne excellence in education for our students, teachers, principals and community members. A strong school system is a critical element in the economic development of any community—so how do we measure success in Guilford County?
“Education Matters” offers a fi rst-time examination of indicators we can use as benchmarks by looking at a range of information, exploring our community’s fi nancial and individual commitment to education, reporting our students’ academic achievements, and exploring the qualifi cations of our school and classroom leaders. As a community that cares about our public schools, how do we maximize our successes and turn challenges into opportunities?
It’s been said that what gets measured gets done. We believe this report will provide useful information, dispel myths, and offer a starting point for raising the bar for excellence in our public schools. It is our hope that we can turn our shared vision for excellence into reality.
4

SNAPSHOTS
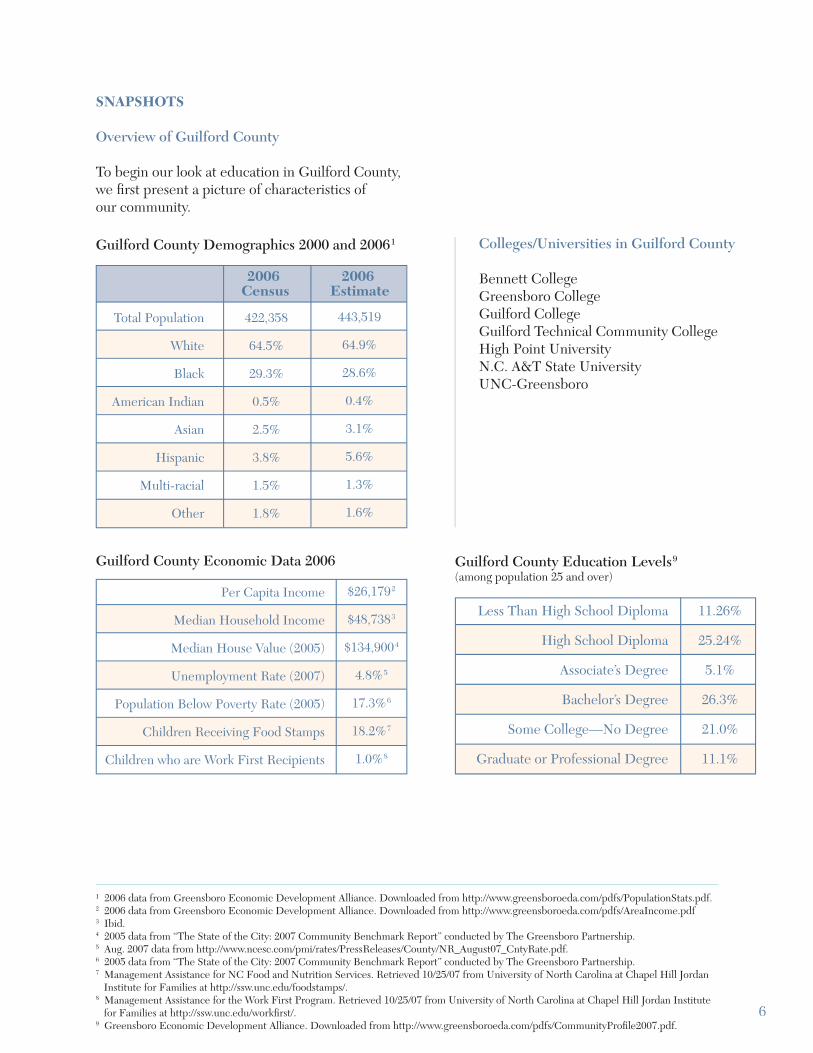
Overview of Guilford County
To begin our look at education in Guilford County, we fi rst present a picture of characteristics of our community.
Guilford County Demographics 2000 and 20061
Guilford County Economic Data 2006
1 2006 data from Greensboro Economic Development Alliance. Downloaded from http://www.greensboroeda.com/pdfs/PopulationStats.pdf.2 2006 data from Greensboro Economic Development Alliance. Downloaded from http://www.greensboroeda.com/pdfs/AreaIncome.pdf3 Ibid.4 2005 data from “The State of the City: 2007 Community Benchmark Report” conducted by The Greensboro Partnership.5 Aug. 2007 data from http://www.ncesc.com/pmi/rates/PressReleases/County/NR_August07_CntyRate.pdf.6 2005 data from “The State of the City: 2007 Community Benchmark Report” conducted by The Greensboro Partnership.7 Management Assistance for NC Food and Nutrition Services. Retrieved 10/25/07 from University of North Carolina at Chapel Hill Jordan Institute for Families at http://ssw.unc.edu/foodstamps/.8 Management Assistance for the Work First Program. Retrieved 10/25/07 from University of North Carolina at Chapel Hill Jordan Institute for Families at http://ssw.unc.edu/workfi rst/.9 Greensboro Economic Development Alliance. Downloaded from http://www.greensboroeda.com/pdfs/CommunityProfi le2007.pdf.
Guilford County Education Levels9
(among population 25 and over)
Colleges/Universities in Guilford County
Bennett CollegeGreensboro CollegeGuilford CollegeGuilford Technical Community College High Point UniversityN.C. A&T State University UNC-Greensboro
6
10 Greensboro Economic Development Alliance. Downloaded from http://www.greensboroeda.com/pdfs/GsoAreaEmp.pdf. Colleges and universities in Guilford County, listed on p. 6, are also major employers.11 2006 report from the National Center for Education Statistics providing data from 2004. Downloaded from http://nces.ed.gov/ pubs2006/2006329.pdf.12 All data in chart taken from the GCS Progress Report, 2006-07, unless otherwise noted.13 From presentation by GCS CFO Sharon Ozment on Oct.17, 2007. Total budget includes state, local, federal, capital outlay, school food service and ACES funds.14 Ibid. Capital budget includes funding for new school construction and major renovations and repairs on existing schools. Total amount budgeted was not spent in 2006-07 because of the long-term nature of construction projects.
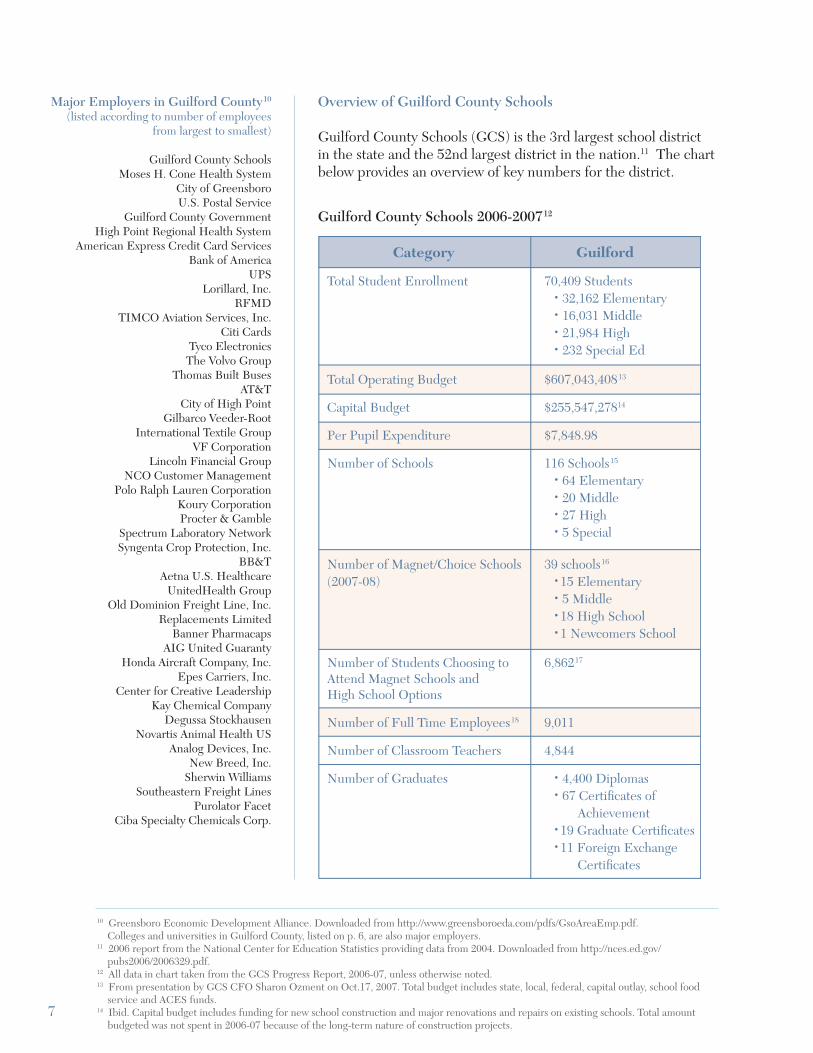
Overview of Guilford County Schools
Guilford County Schools (GCS) is the 3rd largest school district in the state and the 52nd largest district in the nation.11 The chart below provides an overview of key numbers for the district.
Guilford County Schools 2006-200712
Major Employers in Guilford County10 (listed according to number of employees
from largest to smallest)
Guilford County Schools Moses H. Cone Health System
City of GreensboroU.S. Postal Service
Guilford County Government High Point Regional Health System
American Express Credit Card Services Bank of America
UPS Lorillard, Inc.
RFMD TIMCO Aviation Services, Inc.
Citi Cards Tyco Electronics
The Volvo Group Thomas Built Buses
AT&T City of High Point
Gilbarco Veeder-Root International Textile Group
VF Corporation Lincoln Financial Group
NCO Customer Management Polo Ralph Lauren Corporation
Koury Corporation Procter & Gamble
Spectrum Laboratory Network Syngenta Crop Protection, Inc.
BB&T Aetna U.S. Healthcare
UnitedHealth Group Old Dominion Freight Line, Inc.
Replacements Limited Banner Pharmacaps
AIG United Guaranty Honda Aircraft Company, Inc.
Epes Carriers, Inc. Center for Creative Leadership
Kay Chemical Company Degussa Stockhausen
Novartis Animal Health US Analog Devices, Inc.
New Breed, Inc. Sherwin Williams
Southeastern Freight Lines Purolator Facet
Ciba Specialty Chemicals Corp.
7
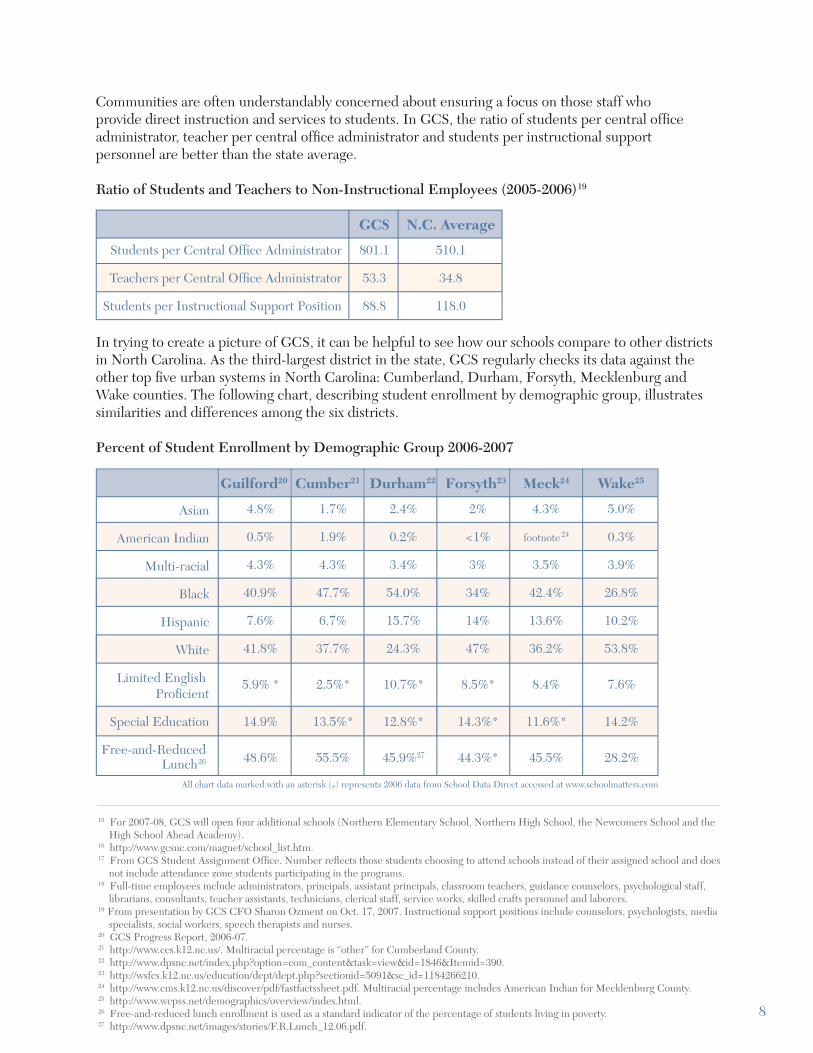
Communities are often understandably concerned about ensuring a focus on those staff who provide direct instruction and services to students. In GCS, the ratio of students per central offi ceadministrator, teacher per central offi ce administrator and students per instructional support personnel are better than the state average.
Ratio of Students and Teachers to Non-Instructional Employees (2005-2006)19
In trying to create a picture of GCS, it can be helpful to see how our schools compare to other districts in North Carolina. As the third-largest district in the state, GCS regularly checks its data against the other top fi ve urban systems in North Carolina: Cumberland, Durham, Forsyth, Mecklenburg and Wake counties. The following chart, describing student enrollment by demographic group, illustrates similarities and differences among the six districts.
Percent of Student Enrollment by Demographic Group 2006-2007
15 For 2007-08, GCS will open four additional schools (Northern Elementary School, Northern High School, the Newcomers School and the High School Ahead Academy).16 http://www.gcsnc.com/magnet/school_list.htm.17 From GCS Student Assignment Offi ce. Number refl ects those students choosing to attend schools instead of their assigned school and does not include attendance zone students participating in the programs.18 Full-time employees include administrators, principals, assistant principals, classroom teachers, guidance counselors, psychological staff, librarians, consultants, teacher assistants, technicians, clerical staff, service works, skilled crafts personnel and laborers.19 From presentation by GCS CFO Sharon Ozment on Oct. 17, 2007. Instructional support positions include counselors, psychologists, media specialists, social workers, speech therapists and nurses.20 GCS Progress Report, 2006-07.21 http://www.ccs.k12.nc.us/. Multiracial percentage is “other” for Cumberland County.22 http://www.dpsnc.net/index.php?option=com_content&task=view&id=1846&Itemid=390.23 http://wsfcs.k12.nc.us/education/dept/dept.php?sectionid=5091&sc_id=1184266210.24 http://www.cms.k12.nc.us/discover/pdf/fastfactssheet.pdf. Multiracial percentage includes American Indian for Mecklenburg County. 25 http://www.wcpss.net/demographics/overview/index.html.26 Free-and-reduced lunch enrollment is used as a standard indicator of the percentage of students living in poverty. 27 http://www.dpsnc.net/images/stories/F.R.Lunch_12.06.pdf.
8
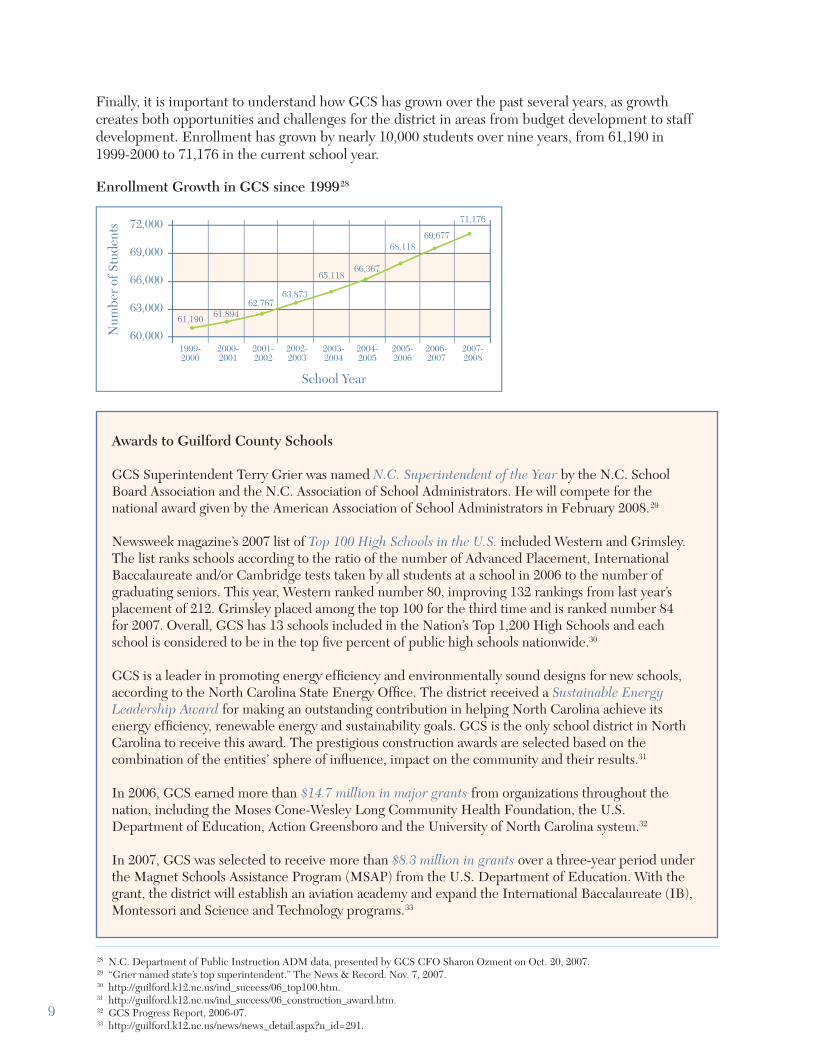
Finally, it is important to understand how GCS has grown over the past several years, as growth creates both opportunities and challenges for the district in areas from budget development to staff development. Enrollment has grown by nearly 10,000 students over nine years, from 61,190 in 1999-2000 to 71,176 in the current school year.
Enrollment Growth in GCS since 199928
28 N.C. Department of Public Instruction ADM data, presented by GCS CFO Sharon Ozment on Oct. 20, 2007.29 “Grier named state’s top superintendent.” The News & Record. Nov. 7, 2007.30 http://guilford.k12.nc.us/ind_success/06_top100.htm.31 http://guilford.k12.nc.us/ind_success/06_construction_award.htm.32 GCS Progress Report, 2006-07.33 http://guilford.k12.nc.us/news/news_detail.aspx?n_id=291.
9
Awards to Guilford County Schools
GCS Superintendent Terry Grier was named N.C. Superintendent of the Year by the N.C. School Board Association and the N.C. Association of School Administrators. He will compete for the national award given by the American Association of School Administrators in February 2008.29
Newsweek magazine’s 2007 list of Top 100 High Schools in the U.S. included Western and Grimsley. The list ranks schools according to the ratio of the number of Advanced Placement, International Baccalaureate and/or Cambridge tests taken by all students at a school in 2006 to the number of graduating seniors. This year, Western ranked number 80, improving 132 rankings from last year’s placement of 212. Grimsley placed among the top 100 for the third time and is ranked number 84 for 2007. Overall, GCS has 13 schools included in the Nation’s Top 1,200 High Schools and each school is considered to be in the top fi ve percent of public high schools nationwide.30
GCS is a leader in promoting energy effi ciency and environmentally sound designs for new schools, according to the North Carolina State Energy Offi ce. The district received a Sustainable Energy Leadership Award for making an outstanding contribution in helping North Carolina achieve its energy effi ciency, renewable energy and sustainability goals. GCS is the only school district in North Carolina to receive this award. The prestigious construction awards are selected based on the combination of the entities’ sphere of infl uence, impact on the community and their results.31
In 2006, GCS earned more than $14.7 million in major grants from organizations throughout the nation, including the Moses Cone-Wesley Long Community Health Foundation, the U.S. Department of Education, Action Greensboro and the University of North Carolina system.32
In 2007, GCS was selected to receive more than $8.3 million in grants over a three-year period under the Magnet Schools Assistance Program (MSAP) from the U.S. Department of Education. With the grant, the district will establish an aviation academy and expand the International Baccalaureate (IB), Montessori and Science and Technology programs.33
COMMUNITY INDICATORS
The success or failure of the public’s schools is not determined solely by what happens each day in classrooms across the county or by decisions made at central offi ce. The broader community must make a commitment to support public education—through contributions of time, energy and money —in order to attain excellence in our schools.
Local Funding
One tangible measure of a community’s commitment to education is its funding of the public schools from local tax dollars. Education is Guilford County’s largest expenditure, accounting for 39 percent of total expenditures in the 2006-07 County budget. Of the $204,462,786 spent by the county for education expenditures in the 2006-07 fi scal year, 77 percent (over $156 million) went to GCS operating expenses and 3 percent ($7 million) went to GCS capital expenses. The rest of the county’s education budget went toward operating and capital expenses at GTCC and debt service.34
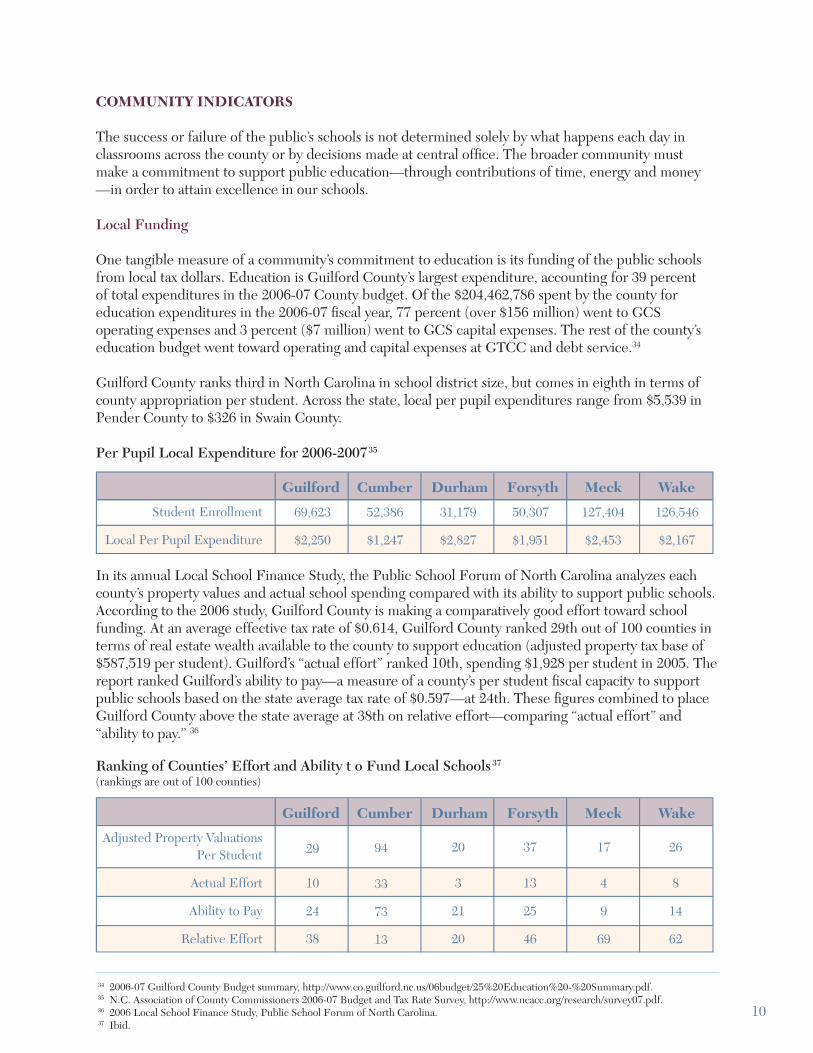
Guilford County ranks third in North Carolina in school district size, but comes in eighth in terms of county appropriation per student. Across the state, local per pupil expenditures range from $5,539 in Pender County to $326 in Swain County.
Per Pupil Local Expenditure for 2006-200735
In its annual Local School Finance Study, the Public School Forum of North Carolina analyzes each county’s property values and actual school spending compared with its ability to support public schools. According to the 2006 study, Guilford County is making a comparatively good effort toward school funding. At an average effective tax rate of $0.614, Guilford County ranked 29th out of 100 counties in terms of real estate wealth available to the county to support education (adjusted property tax base of $587,519 per student). Guilford’s “actual effort” ranked 10th, spending $1,928 per student in 2005. The report ranked Guilford’s ability to pay—a measure of a county’s per student fi scal capacity to support public schools based on the state average tax rate of $0.597—at 24th. These fi gures combined to place Guilford County above the state average at 38th on relative effort—comparing “actual effort” and “ability to pay.” 36
Ranking of Counties’ Effort and Ability t o Fund Local Schools37
(rankings are out of 100 counties)
34 2006-07 Guilford County Budget summary, http://www.co.guilford.nc.us/06budget/25%20Education%20-%20Summary.pdf.35 N.C. Association of County Commissioners 2006-07 Budget and Tax Rate Survey, http://www.ncacc.org/research/survey07.pdf.36 2006 Local School Finance Study, Public School Forum of North Carolina.37 Ibid.
10
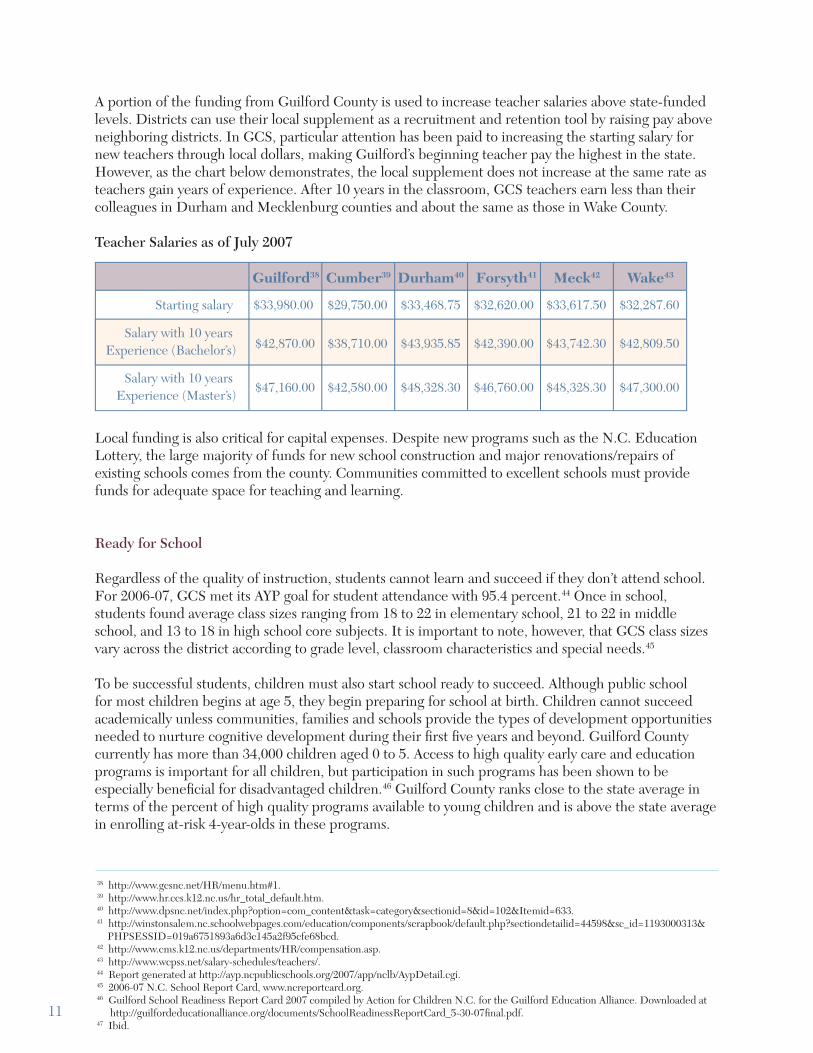
A portion of the funding from Guilford County is used to increase teacher salaries above state-funded levels. Districts can use their local supplement as a recruitment and retention tool by raising pay above neighboring districts. In GCS, particular attention has been paid to increasing the starting salary for new teachers through local dollars, making Guilford’s beginning teacher pay the highest in the state. However, as the chart below demonstrates, the local supplement does not increase at the same rate as teachers gain years of experience. After 10 years in the classroom, GCS teachers earn less than their colleagues in Durham and Mecklenburg counties and about the same as those in Wake County.
Teacher Salaries as of July 2007
Local funding is also critical for capital expenses. Despite new programs such as the N.C. Education Lottery, the large majority of funds for new school construction and major renovations/repairs of existing schools comes from the county. Communities committed to excellent schools must provide funds for adequate space for teaching and learning.
Ready for School
Regardless of the quality of instruction, students cannot learn and succeed if they don’t attend school. For 2006-07, GCS met its AYP goal for student attendance with 95.4 percent.44 Once in school, students found average class sizes ranging from 18 to 22 in elementary school, 21 to 22 in middle school, and 13 to 18 in high school core subjects. It is important to note, however, that GCS class sizes vary across the district according to grade level, classroom characteristics and special needs.45
To be successful students, children must also start school ready to succeed. Although public school for most children begins at age 5, they begin preparing for school at birth. Children cannot succeed academically unless communities, families and schools provide the types of development opportunities needed to nurture cognitive development during their fi rst fi ve years and beyond. Guilford County currently has more than 34,000 children aged 0 to 5. Access to high quality early care and education programs is important for all children, but participation in such programs has been shown to be especially benefi cial for disadvantaged children.46 Guilford County ranks close to the state average in terms of the percent of high quality programs available to young children and is above the state average in enrolling at-risk 4-year-olds in these programs.
38 http://www.gcsnc.net/HR/menu.htm#1.39 http://www.hr.ccs.k12.nc.us/hr_total_default.htm.40 http://www.dpsnc.net/index.php?option=com_content&task=category§ionid=8&id=102&Itemid=633.41 http://winstonsalem.nc.schoolwebpages.com/education/components/scrapbook/default.php?sectiondetailid=44598&sc_id=1193000313& PHPSESSID=019a6751893a6d3c145a2f95cfe68bcd.42 http://www.cms.k12.nc.us/departments/HR/compensation.asp.43 http://www.wcpss.net/salary-schedules/teachers/.44 Report generated at http://ayp.ncpublicschools.org/2007/app/nclb/AypDetail.cgi.45 2006-07 N.C. School Report Card, www.ncreportcard.org.46 Guilford School Readiness Report Card 2007 compiled by Action for Children N.C. for the Guilford Education Alliance. Downloaded at http://guilfordeducationalliance.org/documents/SchoolReadinessReportCard_5-30-07fi nal.pdf.47 Ibid.
11
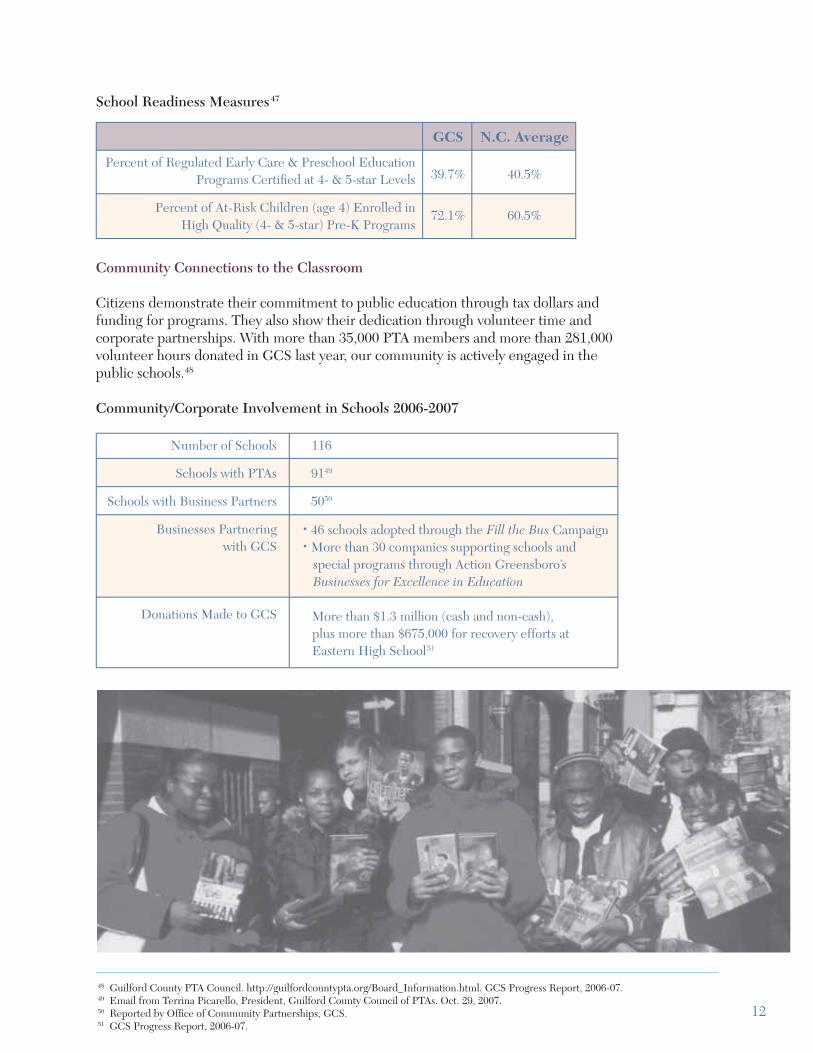
School Readiness Measures47
Community Connections to the Classroom
Citizens demonstrate their commitment to public education through tax dollars and funding for programs. They also show their dedication through volunteer time and corporate partnerships. With more than 35,000 PTA members and more than 281,000 volunteer hours donated in GCS last year, our community is actively engaged in the public schools.48
Community/Corporate Involvement in Schools 2006-2007
48 Guilford County PTA Council. http://guilfordcountypta.org/Board_Information.html. GCS Progress Report, 2006-07.49 Email from Terrina Picarello, President, Guilford County Council of PTAs. Oct. 29, 2007.50 Reported by Offi ce of Community Partnerships, GCS.51 GCS Progress Report, 2006-07.
12
SCHOOL PERFORMANCE INDICATORS
Although there are many ways to measure student success, the emphasis on data created by the federal No Child Left Behind Act (NCLB) has turned the primary focus toward standardized testing in reading and math. GCS remains committed to offering a broad curriculum, with options for students including courses and extracurricular offerings in arts, foreign language, athletics and other areas. However, for the purposes of this report, we will focus on the results of NCLB and the state’s standardized testing program as a key measure of student achievement.
Adequate Yearly Progress
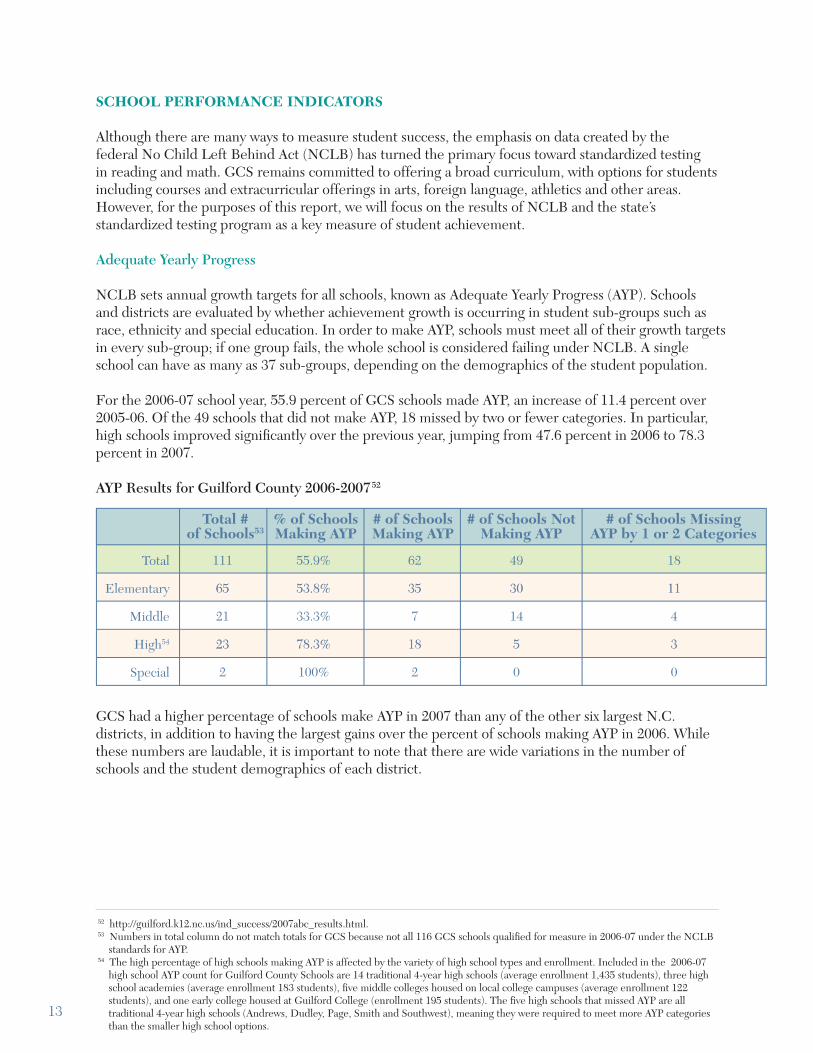
NCLB sets annual growth targets for all schools, known as Adequate Yearly Progress (AYP). Schools and districts are evaluated by whether achievement growth is occurring in student sub-groups such as race, ethnicity and special education. In order to make AYP, schools must meet all of their growth targets in every sub-group; if one group fails, the whole school is considered failing under NCLB. A single school can have as many as 37 sub-groups, depending on the demographics of the student population.
For the 2006-07 school year, 55.9 percent of GCS schools made AYP, an increase of 11.4 percent over 2005-06. Of the 49 schools that did not make AYP, 18 missed by two or fewer categories. In particular, high schools improved signifi cantly over the previous year, jumping from 47.6 percent in 2006 to 78.3 percent in 2007.
AYP Results for Guilford County 2006-200752
GCS had a higher percentage of schools make AYP in 2007 than any of the other six largest N.C. districts, in addition to having the largest gains over the percent of schools making AYP in 2006. While these numbers are laudable, it is important to note that there are wide variations in the number of schools and the student demographics of each district.
52 http://guilford.k12.nc.us/ind_success/2007abc_results.html.53 Numbers in total column do not match totals for GCS because not all 116 GCS schools qualifi ed for measure in 2006-07 under the NCLB standards for AYP.54 The high percentage of high schools making AYP is affected by the variety of high school types and enrollment. Included in the 2006-07 high school AYP count for Guilford County Schools are 14 traditional 4-year high schools (average enrollment 1,435 students), three high school academies (average enrollment 183 students), fi ve middle colleges housed on local college campuses (average enrollment 122 students), and one early college housed at Guilford College (enrollment 195 students). The fi ve high schools that missed AYP are all traditional 4-year high schools (Andrews, Dudley, Page, Smith and Southwest), meaning they were required to meet more AYP categories than the smaller high school options.
13
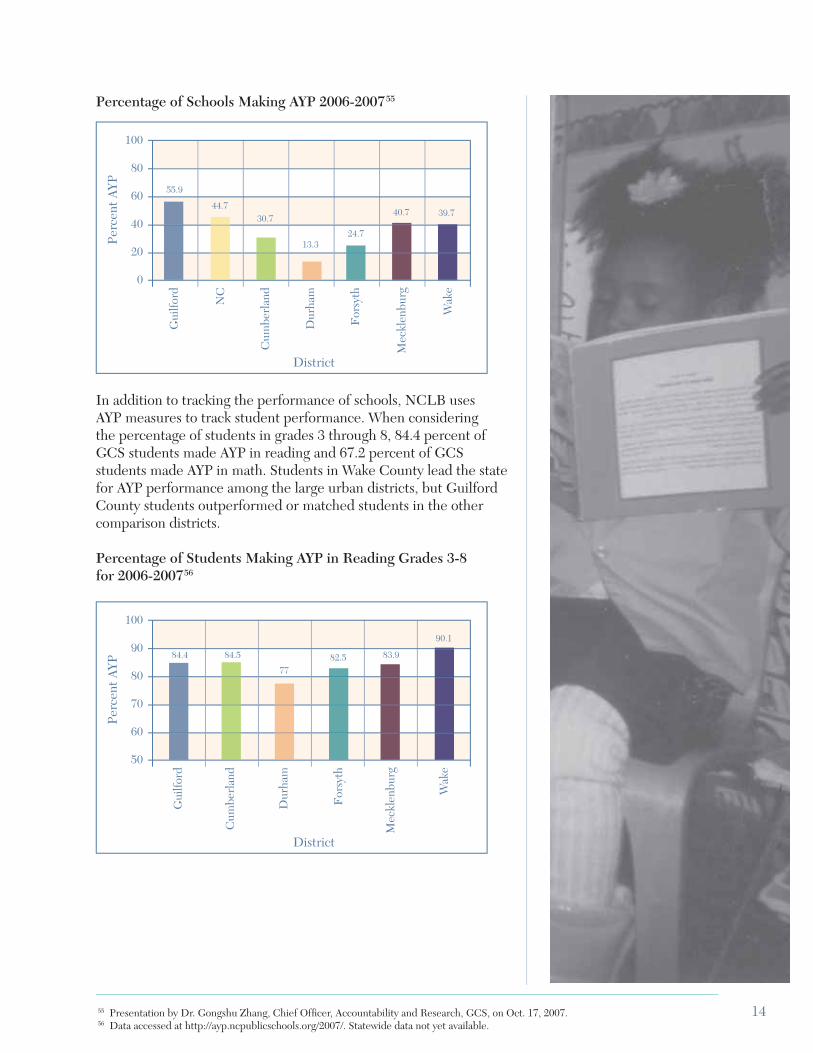
Percentage of Schools Making AYP 2006-200755
In addition to tracking the performance of schools, NCLB uses AYP measures to track student performance. When considering the percentage of students in grades 3 through 8, 84.4 percent of GCS students made AYP in reading and 67.2 percent of GCS students made AYP in math. Students in Wake County lead the state for AYP performance among the large urban districts, but Guilford County students outperformed or matched students in the other comparison districts.
Percentage of Students Making AYP in Reading Grades 3-8 for 2006-200756
55 Presentation by Dr. Gongshu Zhang, Chief Offi cer, Accountability and Research, GCS, on Oct. 17, 2007.56 Data accessed at http://ayp.ncpublicschools.org/2007/. Statewide data not yet available.
14
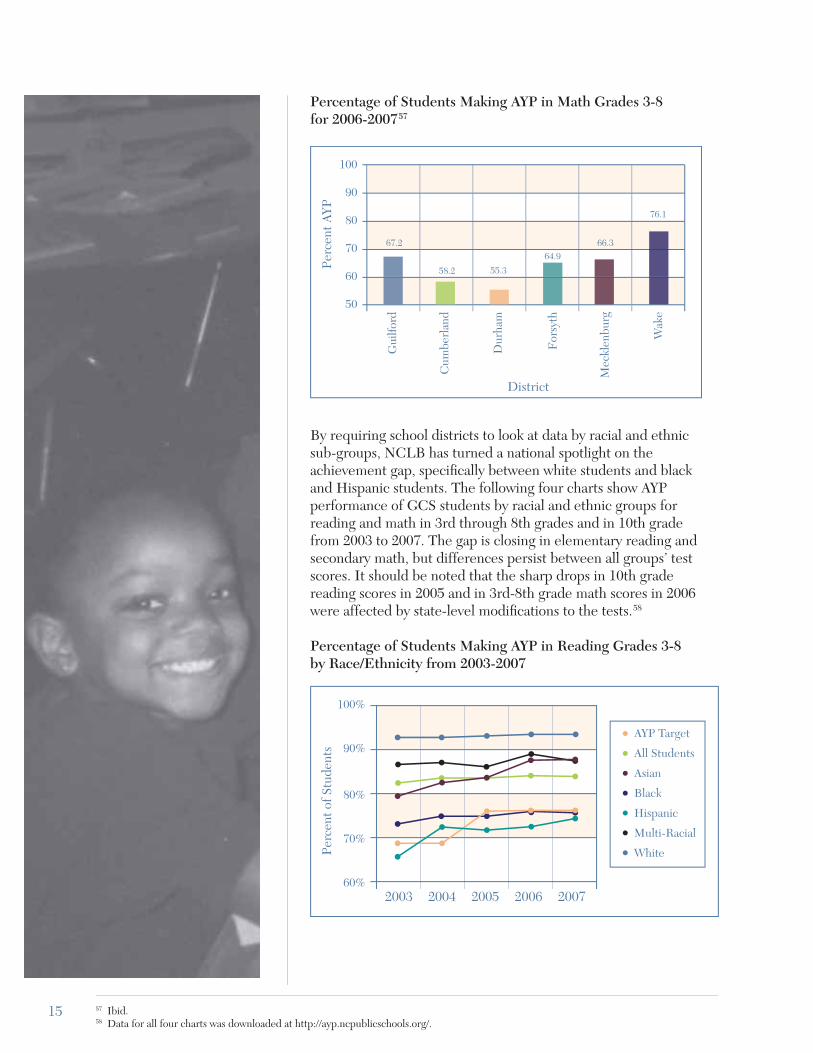
Percentage of Students Making AYP in Math Grades 3-8 for 2006-200757
By requiring school districts to look at data by racial and ethnic sub-groups, NCLB has turned a national spotlight on the achievement gap, specifi cally between white students and black and Hispanic students. The following four charts show AYP performance of GCS students by racial and ethnic groups for reading and math in 3rd through 8th grades and in 10th grade from 2003 to 2007. The gap is closing in elementary reading and secondary math, but differences persist between all groups’ test scores. It should be noted that the sharp drops in 10th grade reading scores in 2005 and in 3rd-8th grade math scores in 2006 were affected by state-level modifi cations to the tests.58
Percentage of Students Making AYP in Reading Grades 3-8 by Race/Ethnicity from 2003-2007
57 Ibid. 58 Data for all four charts was downloaded at http://ayp.ncpublicschools.org/.
15
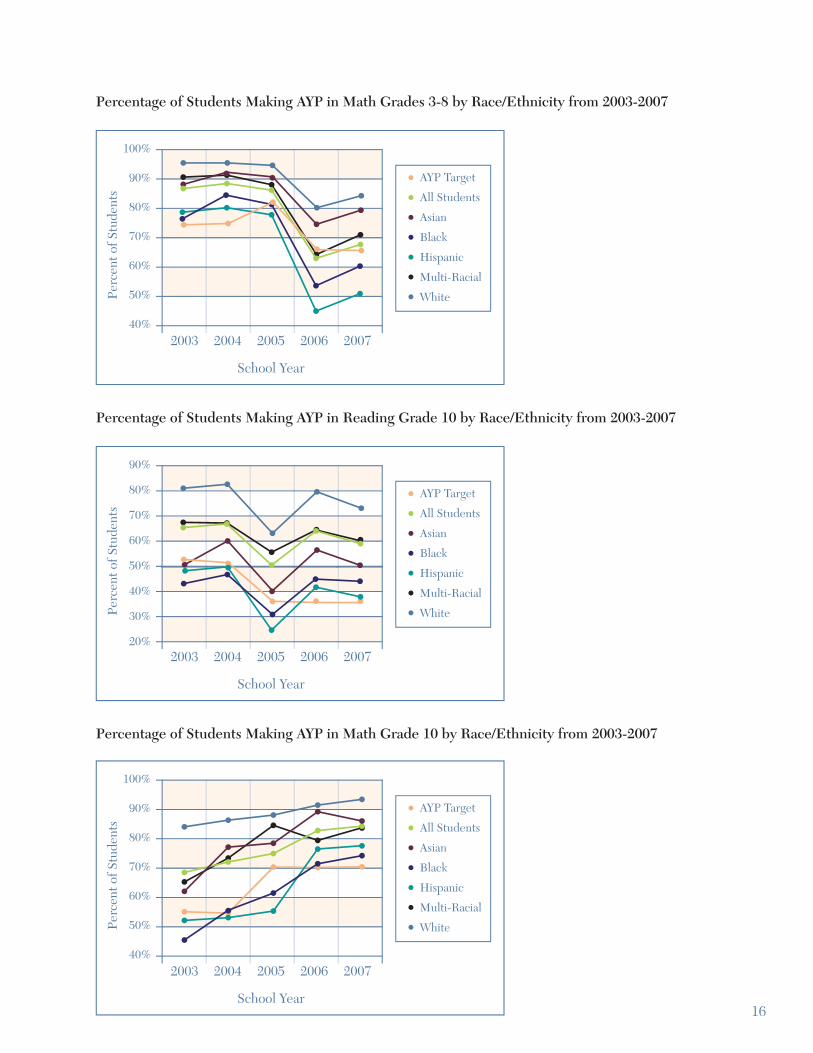
Percentage of Students Making AYP in Math Grades 3-8 by Race/Ethnicity from 2003-2007
Percentage of Students Making AYP in Reading Grade 10 by Race/Ethnicity from 2003-2007
Percentage of Students Making AYP in Math Grade 10 by Race/Ethnicity from 2003-2007
16
Because AYP is based on state testing programs, it is diffi cult to compare results between districts indifferent states using NCLB. However, national comparisons can be made using the National Assessment of Educational Progress (NAEP), also known as “the Nation’s Report Card.” NAEP is the only nationally representative and continuing assessment of what America’s students know and can do in various subject areas based on a representative sample of 4th- and 8th-grade students in each state. On the most recent tests (reading and math in 2007, science in 2005 and writing in 2002), North Carolina students performed statistically the same as or better than the nation’s public school students in all but one category (8th grade science). Although this data cannot be analyzed at the county level, it is useful for understanding North Carolina’s student achievement in a national context.59
High School Achievement
At the high school level, several measures in addition to AYP offer information about student achievement. SAT scores and AP coursework indicate college-readiness, while performance data from the UNC system and GTCC measure the success of GCS graduates in post-secondary programs. Graduation and drop-out rates show success with school completion, while suspension/expulsion rates provide additional data about how students perform in school.
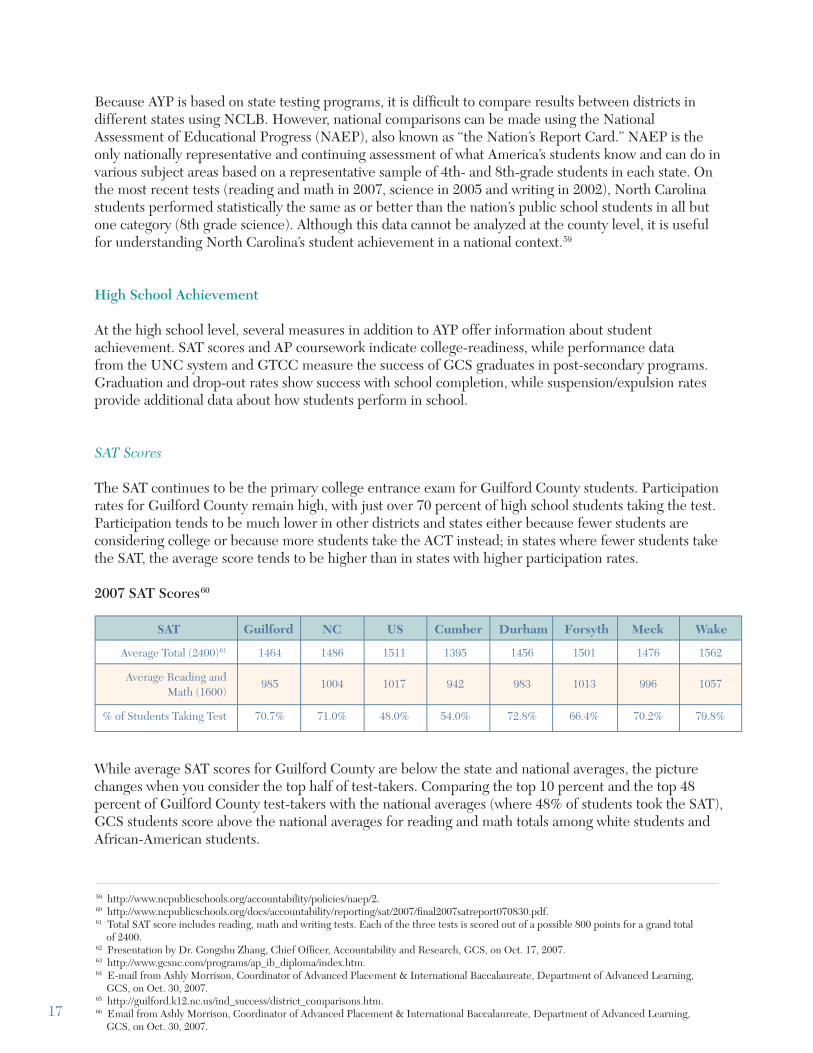
SAT Scores
The SAT continues to be the primary college entrance exam for Guilford County students. Participation rates for Guilford County remain high, with just over 70 percent of high school students taking the test. Participation tends to be much lower in other districts and states either because fewer students are considering college or because more students take the ACT instead; in states where fewer students take the SAT, the average score tends to be higher than in states with higher participation rates.
2007 SAT Scores60
While average SAT scores for Guilford County are below the state and national averages, the picture changes when you consider the top half of test-takers. Comparing the top 10 percent and the top 48 percent of Guilford County test-takers with the national averages (where 48% of students took the SAT), GCS students score above the national averages for reading and math totals among white students and African-American students.
59 http://www.ncpublicschools.org/accountability/policies/naep/2.60 http://www.ncpublicschools.org/docs/accountability/reporting/sat/2007/fi nal2007satreport070830.pdf.61 Total SAT score includes reading, math and writing tests. Each of the three tests is scored out of a possible 800 points for a grand total of 2400.62 Presentation by Dr. Gongshu Zhang, Chief Offi cer, Accountability and Research, GCS, on Oct. 17, 2007.63 http://www.gcsnc.com/programs/ap_ib_diploma/index.htm.64 E-mail from Ashly Morrison, Coordinator of Advanced Placement & International Baccalaureate, Department of Advanced Learning, GCS, on Oct. 30, 2007.65 http://guilford.k12.nc.us/ind_success/district_comparisons.htm.66 Email from Ashly Morrison, Coordinator of Advanced Placement & International Baccalaureate, Department of Advanced Learning, GCS, on Oct. 30, 2007.
17
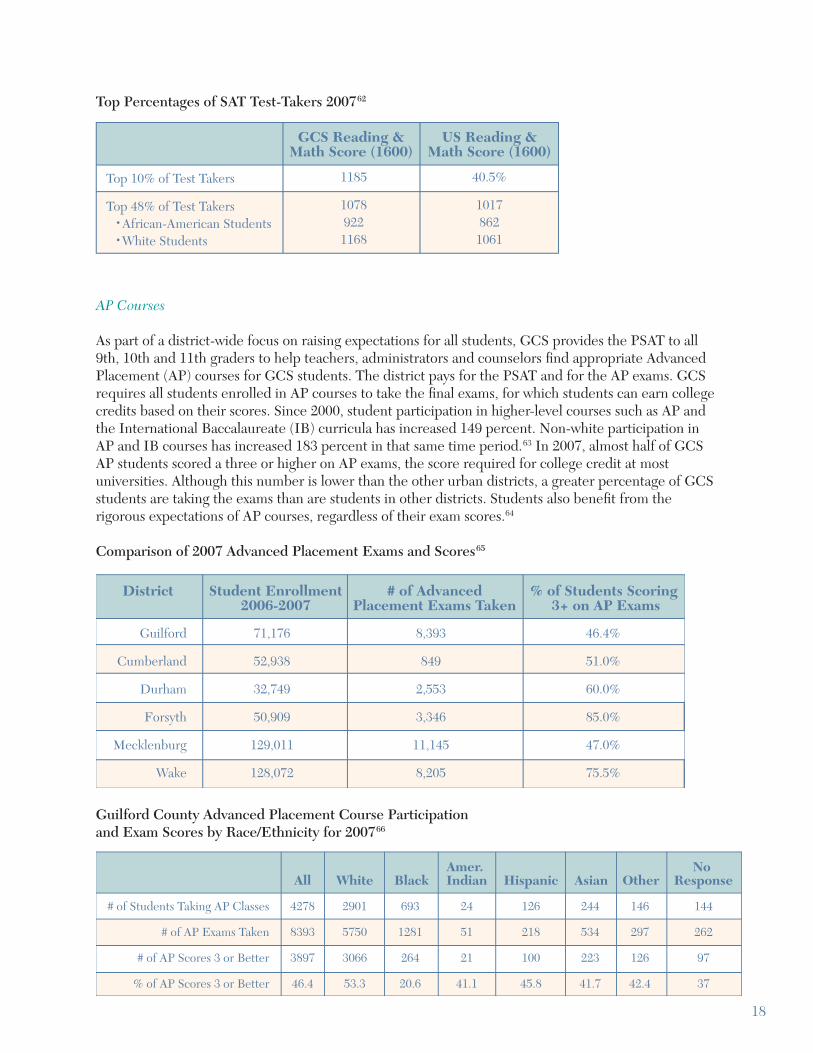
Top Percentages of SAT Test-Takers 200762
AP Courses
As part of a district-wide focus on raising expectations for all students, GCS provides the PSAT to all 9th, 10th and 11th graders to help teachers, administrators and counselors fi nd appropriate Advanced Placement (AP) courses for GCS students. The district pays for the PSAT and for the AP exams. GCS requires all students enrolled in AP courses to take the fi nal exams, for which students can earn college credits based on their scores. Since 2000, student participation in higher-level courses such as AP and the International Baccalaureate (IB) curricula has increased 149 percent. Non-white participation in AP and IB courses has increased 183 percent in that same time period.63 In 2007, almost half of GCS AP students scored a three or higher on AP exams, the score required for college credit at most universities. Although this number is lower than the other urban districts, a greater percentage of GCS students are taking the exams than are students in other districts. Students also benefi t from the rigorous expectations of AP courses, regardless of their exam scores.64
Comparison of 2007 Advanced Placement Exams and Scores65
Guilford County Advanced Placement Course Participation and Exam Scores by Race/Ethnicity for 200766
18
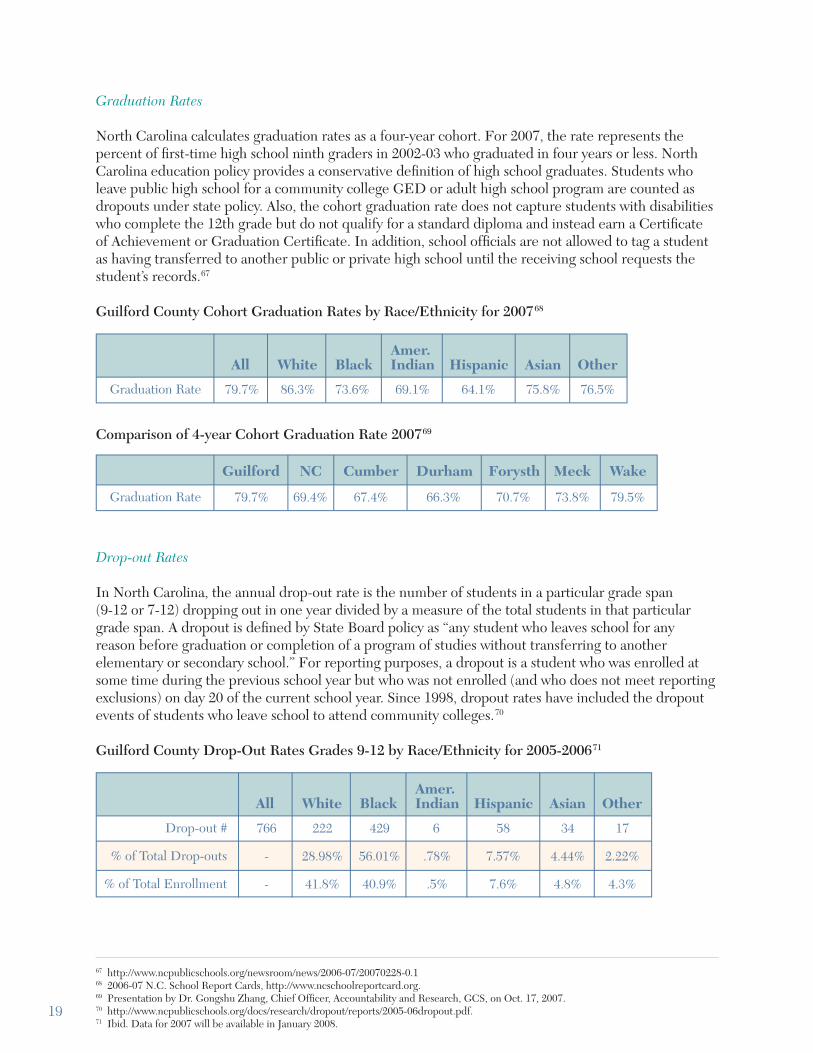
Graduation Rates
North Carolina calculates graduation rates as a four-year cohort. For 2007, the rate represents the percent of fi rst-time high school ninth graders in 2002-03 who graduated in four years or less. North Carolina education policy provides a conservative defi nition of high school graduates. Students who leave public high school for a community college GED or adult high school program are counted as dropouts under state policy. Also, the cohort graduation rate does not capture students with disabilities who complete the 12th grade but do not qualify for a standard diploma and instead earn a Certifi cate of Achievement or Graduation Certifi cate. In addition, school offi cials are not allowed to tag a student as having transferred to another public or private high school until the receiving school requests the student’s records.67
Guilford County Cohort Graduation Rates by Race/Ethnicity for 200768
Comparison of 4-year Cohort Graduation Rate 200769
Drop-out Rates
In North Carolina, the annual drop-out rate is the number of students in a particular grade span (9-12 or 7-12) dropping out in one year divided by a measure of the total students in that particular grade span. A dropout is defi ned by State Board policy as “any student who leaves school for any reason before graduation or completion of a program of studies without transferring to another elementary or secondary school.” For reporting purposes, a dropout is a student who was enrolled at some time during the previous school year but who was not enrolled (and who does not meet reporting exclusions) on day 20 of the current school year. Since 1998, dropout rates have included the dropout events of students who leave school to attend community colleges.70
Guilford County Drop-Out Rates Grades 9-12 by Race/Ethnicity for 2005-200671
67 http://www.ncpublicschools.org/newsroom/news/2006-07/20070228-0.168 2006-07 N.C. School Report Cards, http://www.ncschoolreportcard.org.69 Presentation by Dr. Gongshu Zhang, Chief Offi cer, Accountability and Research, GCS, on Oct. 17, 2007.70 http://www.ncpublicschools.org/docs/research/dropout/reports/2005-06dropout.pdf.71 Ibid. Data for 2007 will be available in January 2008.
19
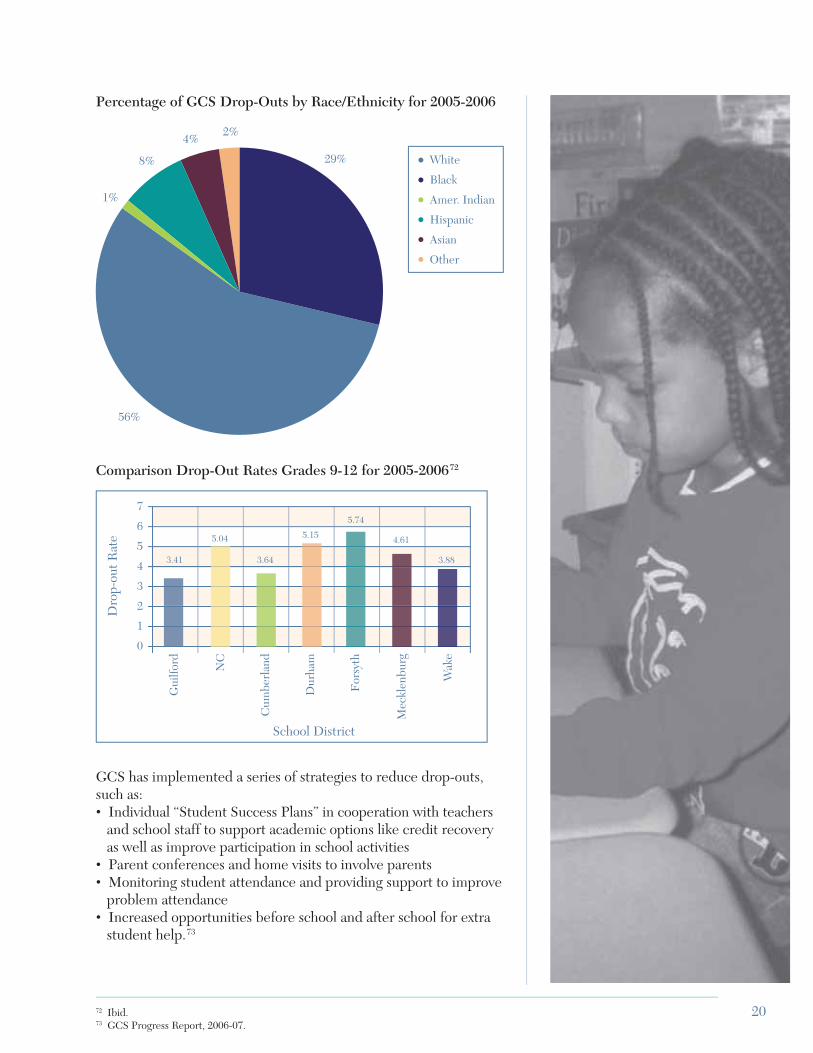
Percentage of GCS Drop-Outs by Race/Ethnicity for 2005-2006
Comparison Drop-Out Rates Grades 9-12 for 2005-200672
GCS has implemented a series of strategies to reduce drop-outs, such as:• Individual “Student Success Plans” in cooperation with teachers and school staff to support academic options like credit recovery as well as improve participation in school activities• Parent conferences and home visits to involve parents• Monitoring student attendance and providing support to improve problem attendance• Increased opportunities before school and after school for extra student help.73
72 Ibid.73 GCS Progress Report, 2006-07.
20
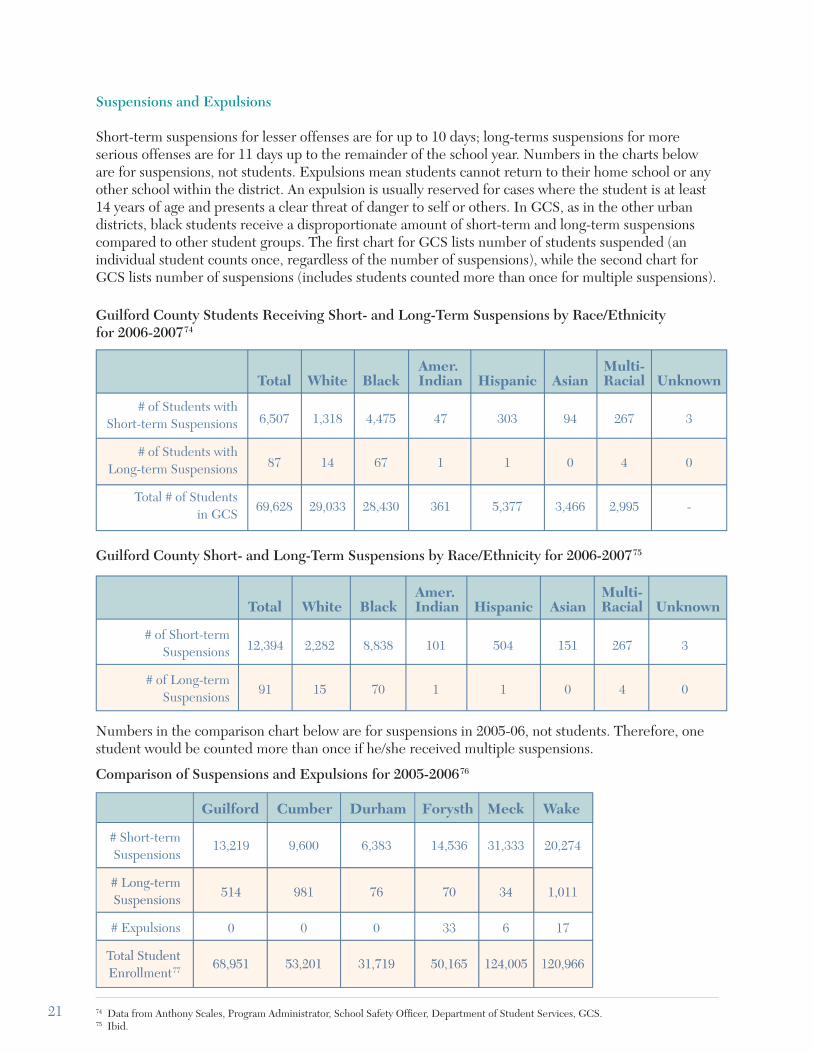
Suspensions and Expulsions
Short-term suspensions for lesser offenses are for up to 10 days; long-terms suspensions for more serious offenses are for 11 days up to the remainder of the school year. Numbers in the charts below are for suspensions, not students. Expulsions mean students cannot return to their home school or any other school within the district. An expulsion is usually reserved for cases where the student is at least 14 years of age and presents a clear threat of danger to self or others. In GCS, as in the other urban districts, black students receive a disproportionate amount of short-term and long-term suspensions compared to other student groups. The fi rst chart for GCS lists number of students suspended (an individual student counts once, regardless of the number of suspensions), while the second chart for GCS lists number of suspensions (includes students counted more than once for multiple suspensions).
Guilford County Students Receiving Short- and Long-Term Suspensions by Race/Ethnicity for 2006-200774
Guilford County Short- and Long-Term Suspensions by Race/Ethnicity for 2006-200775
Numbers in the comparison chart below are for suspensions in 2005-06, not students. Therefore, one student would be counted more than once if he/she received multiple suspensions.
Comparison of Suspensions and Expulsions for 2005-200676
74 Data from Anthony Scales, Program Administrator, School Safety Offi cer, Department of Student Services, GCS.75 Ibid.
21
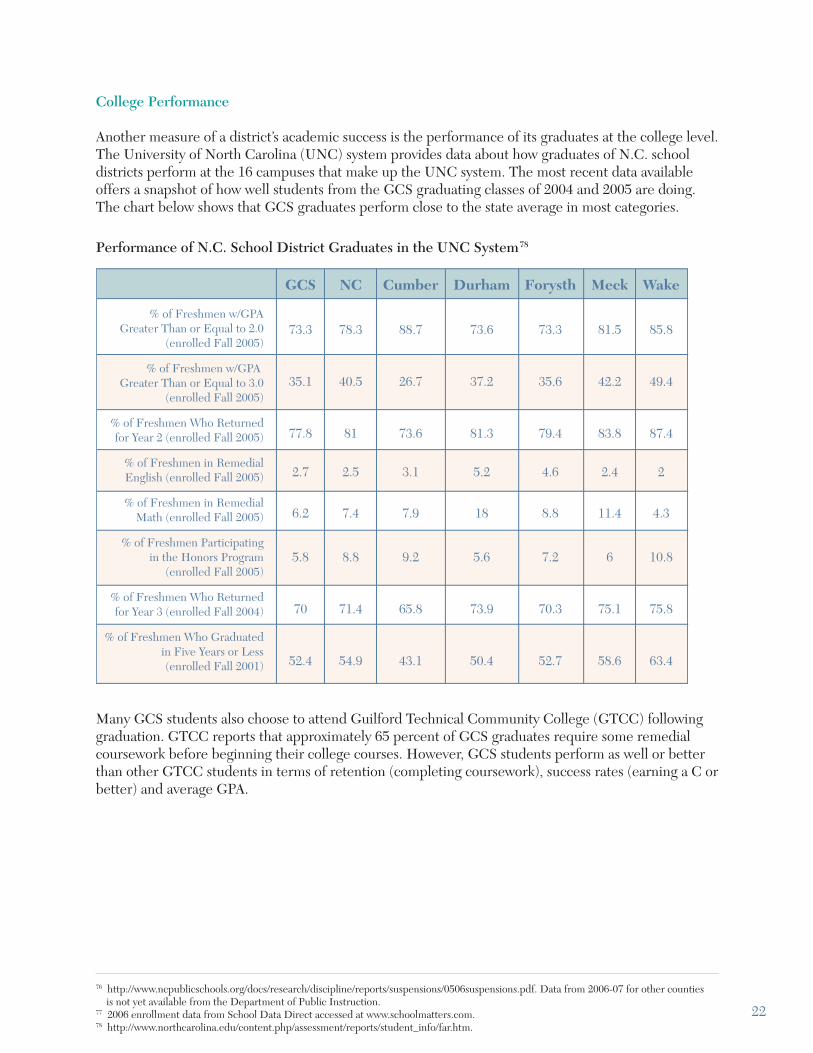
College Performance
Another measure of a district’s academic success is the performance of its graduates at the college level. The University of North Carolina (UNC) system provides data about how graduates of N.C. school districts perform at the 16 campuses that make up the UNC system. The most recent data available offers a snapshot of how well students from the GCS graduating classes of 2004 and 2005 are doing. The chart below shows that GCS graduates perform close to the state average in most categories.
Performance of N.C. School District Graduates in the UNC System78
Many GCS students also choose to attend Guilford Technical Community College (GTCC) following graduation. GTCC reports that approximately 65 percent of GCS graduates require some remedial coursework before beginning their college courses. However, GCS students perform as well or better than other GTCC students in terms of retention (completing coursework), success rates (earning a C or better) and average GPA.
76 http://www.ncpublicschools.org/docs/research/discipline/reports/suspensions/0506suspensions.pdf. Data from 2006-07 for other counties is not yet available from the Department of Public Instruction.77 2006 enrollment data from School Data Direct accessed at www.schoolmatters.com.78 http://www.northcarolina.edu/content.php/assessment/reports/student_info/far.htm.
22
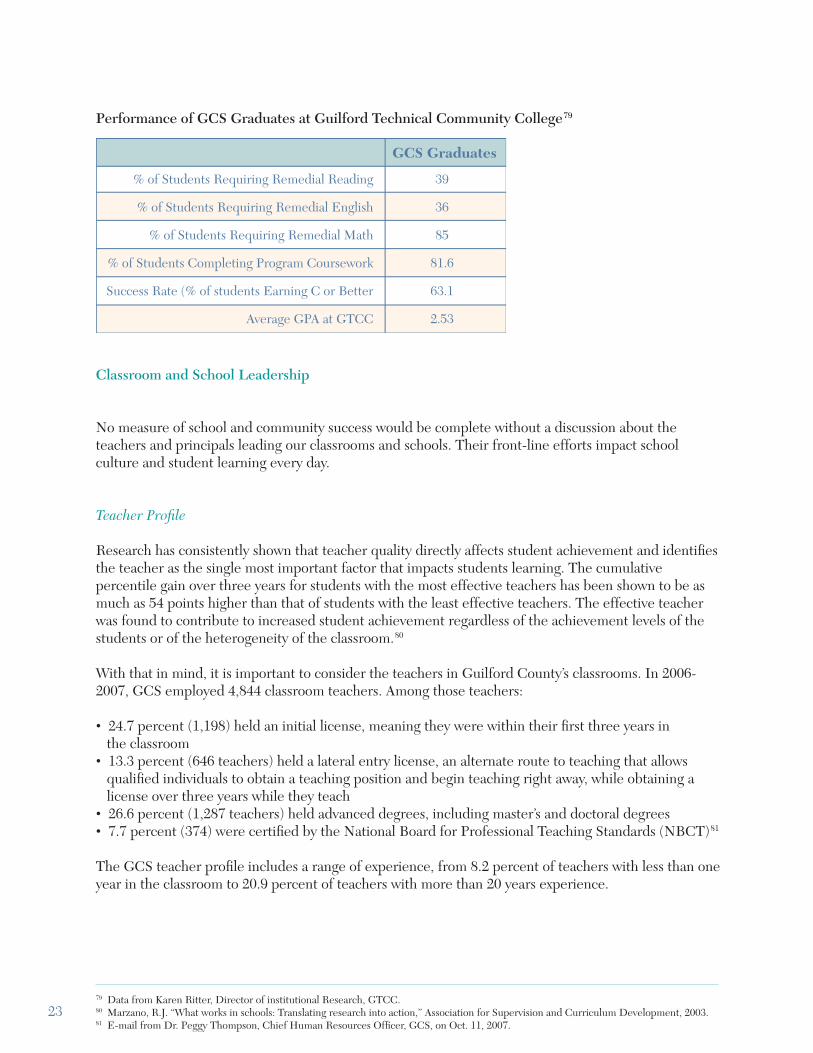
Performance of GCS Graduates at Guilford Technical Community College79
Classroom and School Leadership
No measure of school and community success would be complete without a discussion about the teachers and principals leading our classrooms and schools. Their front-line efforts impact school culture and student learning every day.
Teacher Profi le
Research has consistently shown that teacher quality directly affects student achievement and identifi es the teacher as the single most important factor that impacts students learning. The cumulative percentile gain over three years for students with the most effective teachers has been shown to be as much as 54 points higher than that of students with the least effective teachers. The effective teacher was found to contribute to increased student achievement regardless of the achievement levels of the students or of the heterogeneity of the classroom.80
With that in mind, it is important to consider the teachers in Guilford County’s classrooms. In 2006-2007, GCS employed 4,844 classroom teachers. Among those teachers:
• 24.7 percent (1,198) held an initial license, meaning they were within their fi rst three years in the classroom• 13.3 percent (646 teachers) held a lateral entry license, an alternate route to teaching that allows qualifi ed individuals to obtain a teaching position and begin teaching right away, while obtaining a license over three years while they teach• 26.6 percent (1,287 teachers) held advanced degrees, including master’s and doctoral degrees• 7.7 percent (374) were certifi ed by the National Board for Professional Teaching Standards (NBCT)81
The GCS teacher profi le includes a range of experience, from 8.2 percent of teachers with less than one year in the classroom to 20.9 percent of teachers with more than 20 years experience.
79 Data from Karen Ritter, Director of institutional Research, GTCC.80 Marzano, R.J. “What works in schools: Translating research into action,” Association for Supervision and Curriculum Development, 2003.81 E-mail from Dr. Peggy Thompson, Chief Human Resources Offi cer, GCS, on Oct. 11, 2007.
23
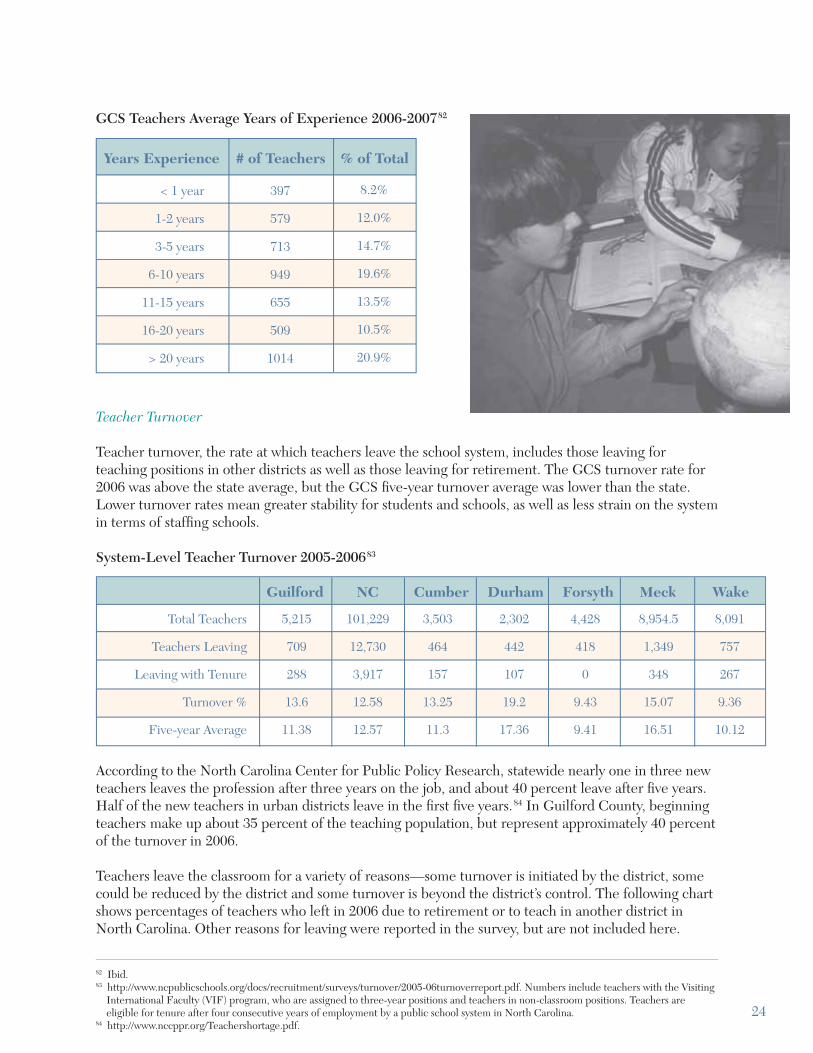
GCS Teachers Average Years of Experience 2006-200782
Teacher Turnover
Teacher turnover, the rate at which teachers leave the school system, includes those leaving for teaching positions in other districts as well as those leaving for retirement. The GCS turnover rate for 2006 was above the state average, but the GCS fi ve-year turnover average was lower than the state. Lower turnover rates mean greater stability for students and schools, as well as less strain on the system in terms of staffi ng schools.
System-Level Teacher Turnover 2005-200683
According to the North Carolina Center for Public Policy Research, statewide nearly one in three new teachers leaves the profession after three years on the job, and about 40 percent leave after fi ve years. Half of the new teachers in urban districts leave in the fi rst fi ve years.84 In Guilford County, beginning teachers make up about 35 percent of the teaching population, but represent approximately 40 percent of the turnover in 2006.
Teachers leave the classroom for a variety of reasons—some turnover is initiated by the district, some could be reduced by the district and some turnover is beyond the district’s control. The following chart shows percentages of teachers who left in 2006 due to retirement or to teach in another district in North Carolina. Other reasons for leaving were reported in the survey, but are not included here.
82 Ibid.83 http://www.ncpublicschools.org/docs/recruitment/surveys/turnover/2005-06turnoverreport.pdf. Numbers include teachers with the Visiting International Faculty (VIF) program, who are assigned to three-year positions and teachers in non-classroom positions. Teachers are eligible for tenure after four consecutive years of employment by a public school system in North Carolina.84 http://www.nccppr.org/Teachershortage.pdf.
24
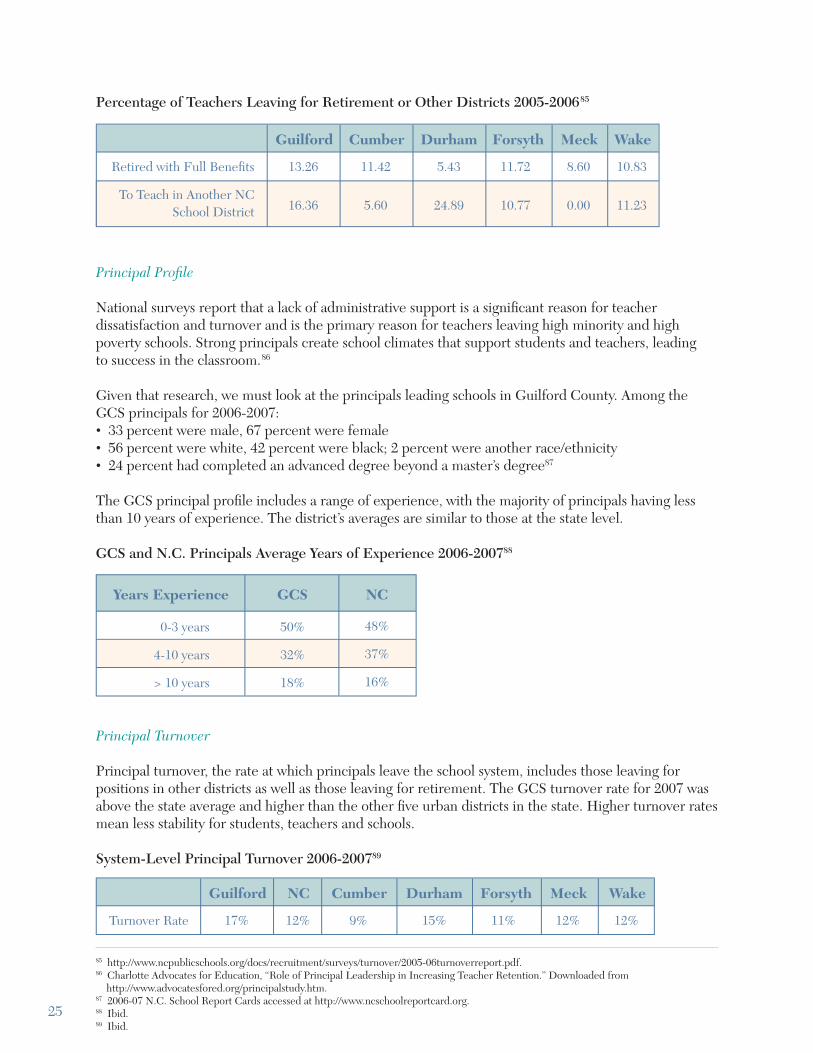
Percentage of Teachers Leaving for Retirement or Other Districts 2005-200685
Principal Profi le
National surveys report that a lack of administrative support is a signifi cant reason for teacher dissatisfaction and turnover and is the primary reason for teachers leaving high minority and high poverty schools. Strong principals create school climates that support students and teachers, leading to success in the classroom.86
Given that research, we must look at the principals leading schools in Guilford County. Among the GCS principals for 2006-2007:• 33 percent were male, 67 percent were female• 56 percent were white, 42 percent were black; 2 percent were another race/ethnicity• 24 percent had completed an advanced degree beyond a master’s degree87
The GCS principal profi le includes a range of experience, with the majority of principals having less than 10 years of experience. The district’s averages are similar to those at the state level.
GCS and N.C. Principals Average Years of Experience 2006-200788
Principal Turnover
Principal turnover, the rate at which principals leave the school system, includes those leaving for positions in other districts as well as those leaving for retirement. The GCS turnover rate for 2007 was above the state average and higher than the other fi ve urban districts in the state. Higher turnover rates mean less stability for students, teachers and schools.
System-Level Principal Turnover 2006-200789
85 http://www.ncpublicschools.org/docs/recruitment/surveys/turnover/2005-06turnoverreport.pdf.86 Charlotte Advocates for Education, “Role of Principal Leadership in Increasing Teacher Retention.” Downloaded from http://www.advocatesfored.org/principalstudy.htm.87 2006-07 N.C. School Report Cards accessed at http://www.ncschoolreportcard.org.88 Ibid.89 Ibid.
25
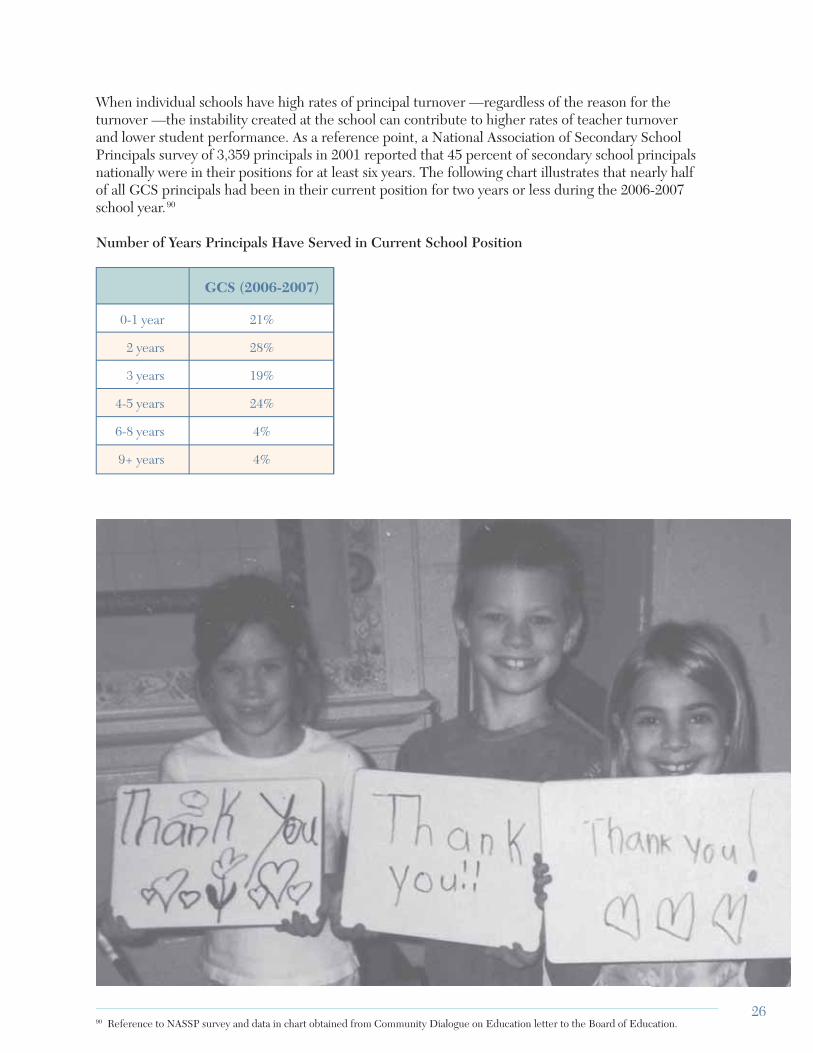
When individual schools have high rates of principal turnover —regardless of the reason for the turnover —the instability created at the school can contribute to higher rates of teacher turnover and lower student performance. As a reference point, a National Association of Secondary School Principals survey of 3,359 principals in 2001 reported that 45 percent of secondary school principals nationally were in their positions for at least six years. The following chart illustrates that nearly half of all GCS principals had been in their current position for two years or less during the 2006-2007 school year.90
Number of Years Principals Have Served in Current School Position
90 Reference to NASSP survey and data in chart obtained from Community Dialogue on Education letter to the Board of Education.26
NEXT STEPS
If education truly matters to the people of Guilford County, then this report is the starting point for discussion and action to ensure that every student in our public schools has an opportunity to succeed. The Guilford Education Alliance hopes that the data included here will help our community begin to defi ne excellence for our schools and create ways to make that vision a reality.
Over the next year, additional reports will be available on the Guilford Education Alliance website, to offer in-depth information on specifi c topics referenced in this report. The second annual “Education Matters” report will be released in the fall of 2008, giving us the chance to review our progress and set new goals for improvement. As the conversation about our expectations evolves over the coming months, our community must maintain this focus on employing data and facts to replicate successes and tackle challenges for our students, teachers and schools.
For more information, visit www.GuilfordEducationAlliance.org.
27
Education Matters Indicator ReportAdvisory Committee
Richard L. (Skip) Moore, Weaver Foundation, Guilford Education Alliance Board Chair
Alan Pike, Bank of North Carolina, Guilford Education Alliance Board
Eric Becoats, Guilford County Schools
Frank Kendall, Community Leader, Guilford Education Alliance Board
Betty Epanchin, UNCG School of Education
Uma Aava, Community Leader, Guilford Education Alliance Board
Judy Wicker, News & Record, Guilford Education Alliance Board
Margaret Bourdeaux Arbuckle, Guilford Education Alliance Executive Director
Cyndi Soter O’Neil, Researcher
Education Summit Steering CommitteeTom Dayvault, High Point Chamber of Commerce,
Guilford Education Alliance Board member
Hoyt Phillips, Greensboro Chamber of Commerce, Guilford Education Alliance Board member
Denise Turner, Greensboro Partnership for Economic Development
Alan Pike, Bank of North Carolina, Guilford Education Alliance Board member
Uma Aava, Community Leader, Guilford Education Alliance Board member
Robin Sauls, News & Record
Robin Britt, Guilford Child Development
Richard L. Moore, Weaver Foundation, Guilford Education Alliance Board Chair
Margaret Bourdeaux Arbuckle, Guilford Education Alliance Executive Director
SPECIAL THANKS
This report is supported by a grant from Lincoln Financial Group.
Design services provided by Mitre Agency.
www.mitreagency.com
Education Summit invitations designed by Marty Cooper at Code Blue.
Guilford Education Alliance2007-2008 Board of DirectorsRichard L. (Skip) Moore,Weaver Foundation
Ann Busby,Community Leader
Jarvis Harris, R. Steve Bowden & Associates
Doug Boike, Triad Consulting
Jim Morgan, Morgan, Herring, Morgan, Green, Rosenblutt & Gill, LLP
Mike Abel, Schell, Bray, Aycock, Abel & Livingston PLLC
Chris Adams, Ashford Suites Hotel
Uma Avva, Community Leader
Al Barnett, Scott & Stringfellow
Sherri Brown, Smith Barney
Charles Cornelio, Lincoln Financial Group
Tom Dayvault, High Point Chamber of Commerce
Barbara Frye, United Way of Greater High Point
Martin Green, Brij
Chris Greene, Community Leader
Tom Guthrie, Duke Power
Teresa Hairston, American Express
Joyce Johnson, Beloved Community Center of Greensboro
Frank Kendall, Community Leader
Father Philip Kollithanath, Christ the King Catholic Church
Nolo Martinez, Center for New North Carolinians
James McNeil, Florence Elementary School
Ivan Mosley, North Carolina A&T State University
Hoyt Phillips, Greensboro Chamber of Commerce
Alan Pike, Bank of North Carolina
Bob Powell, North Carolina A&T State University
Michael Prioleau, Greensboro Education and Development Council
Jack Shields, United Health Care
Richard Shope, Shope Law
Pam Sprinkle, Community Leader
Judy Wicker, News & Record
Laura Wiley, North Carolina Legislature
Shinita Wrenwick, Community Leader
Ex-Offi cio MembersDr. Terry Grier, Superintendent, Guilford County Schools
Alan Duncan, Chairman, Guilford County Board of Education
Terrina Picarello, Chairman, Guilford County Council of PTAs
Mark Jewell, President, Guilford County Association of Educators
28

Guilford Education Alliance902 Bonner Drive Jamestown, NC 27282
P (336) 841-4332 F (336) 841-3696www.GuilfordEducationAlliance.org