education pays 20071 education pays
TRANSCRIPT

Education Pays 20071
www.collegeboard.com
Education Pays

Education Pays 20072
www.collegeboard.com
Individual and Societal Benefits of Higher Education
Education Pays 20073
www.collegeboard.com
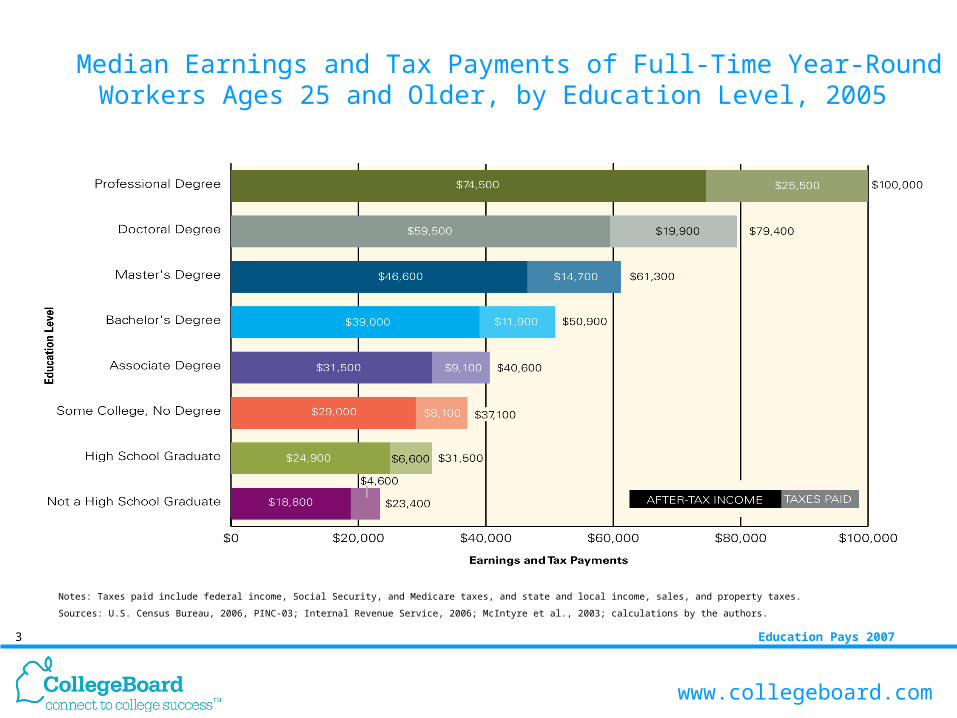
Notes: Taxes paid include federal income, Social Security, and Medicare taxes, and state and local income, sales, and property taxes.
Sources: U.S. Census Bureau, 2006, PINC-03; Internal Revenue Service, 2006; McIntyre et al., 2003; calculations by the authors.
Median Earnings and Tax Payments of Full-Time Year-Round Workers Ages 25 and Older, by Education Level, 2005

Education Pays 20074
www.collegeboard.com
Notes: Based on the sum of median 2005 earnings from ages 25 to 64 for each education level. Future earnings are discounted using a 3 percent annual rate to account for the reality that, because of foregone interest, dollars received in the future are not worth as much as those received today.
Sources: U.S. Census Bureau, 2006, PINC-03; calculations by the authors.
Expected Lifetime Earnings Relative to High School Graduate, by Education Level

Education Pays 20075
www.collegeboard.com
Median Earnings of Full-Time Year-Round Workers Ages 25–34, by Race/Ethnicity, Gender, and Education Level, 2005
Note: Sample sizes for Asian females as well as Asian males with less than a high school diploma and associate degrees are too small to allow reliable reporting.Sources: U.S. Census Bureau, 2006, PINC-03.

Education Pays 20076
www.collegeboard.com
Mean Earnings of Full-Time Year-Round Workers Ages 25 and Older, by Education Level, 2006
Source: Current Population Survey, Annual Social and Economic Supplement, 2007
28,534
38,063
45,731
78,101
$27,193
$40,369
$52,352
$87,083
$0 $20,000 $40,000 $60,000 $80,000 $100,000
Not a High School Graduate
High School Graduate
Some College or AssociateDegree
Bachelor's Degree or Higher
Ed
uca
tio
n L
evel
Mean Earnings
CA
US

Education Pays 20077
www.collegeboard.com
Percentage of Full-Time Year-Round Workers Ages 25 and Older Who Were Offered Employer-Provided Pension Plans, by Education Level, 2005
Sources: U.S. Census Bureau, Current Population Survey, 2006 Annual Social and Economic Supplement; calculations by the authors.

Education Pays 20078
www.collegeboard.com
Percentage of Private-Sector Workers Ages 18–64 Working at Least Half-Time Covered by Employer-Provided Health Insurance, by Education Level, 1979–2005
Sources: Mishel et al., 2007, Table 3.12.
Education Pays 20079
www.collegeboard.com
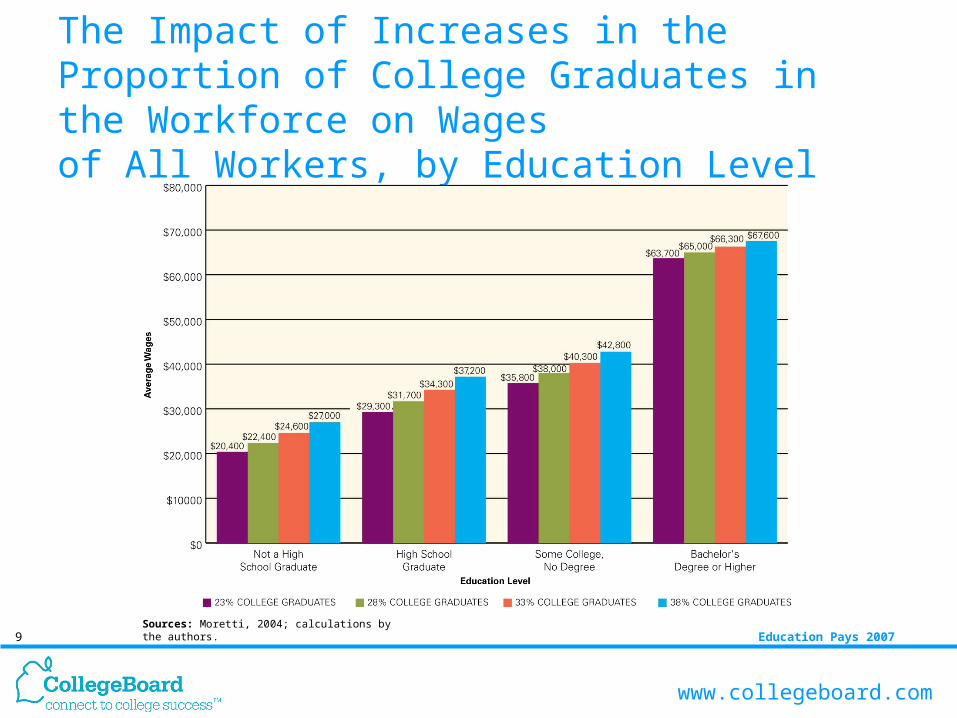
The Impact of Increases in the Proportion of College Graduates in the Workforce on Wagesof All Workers, by Education Level
Sources: Moretti, 2004; calculations by the authors.

Education Pays 200710
www.collegeboard.com
Unemployment Rates of Individuals Ages 25 and Older, by Race/Ethnicity and Education Level, 2006
Sources: Bureau of Labor Statistics, 2007, Table 7 (based on U.S. Census Bureau, Current Population Survey).

Education Pays 200711
www.collegeboard.com
Percentage of Individuals Ages 25 and Older Living in Households in Poverty, by Household Type and Education Level, 2005
Sources: U.S. Census Bureau, Current Population Survey, 2006 Annual Social and Economic Supplement; calculations by the authors.
Education Pays 200712
www.collegeboard.com
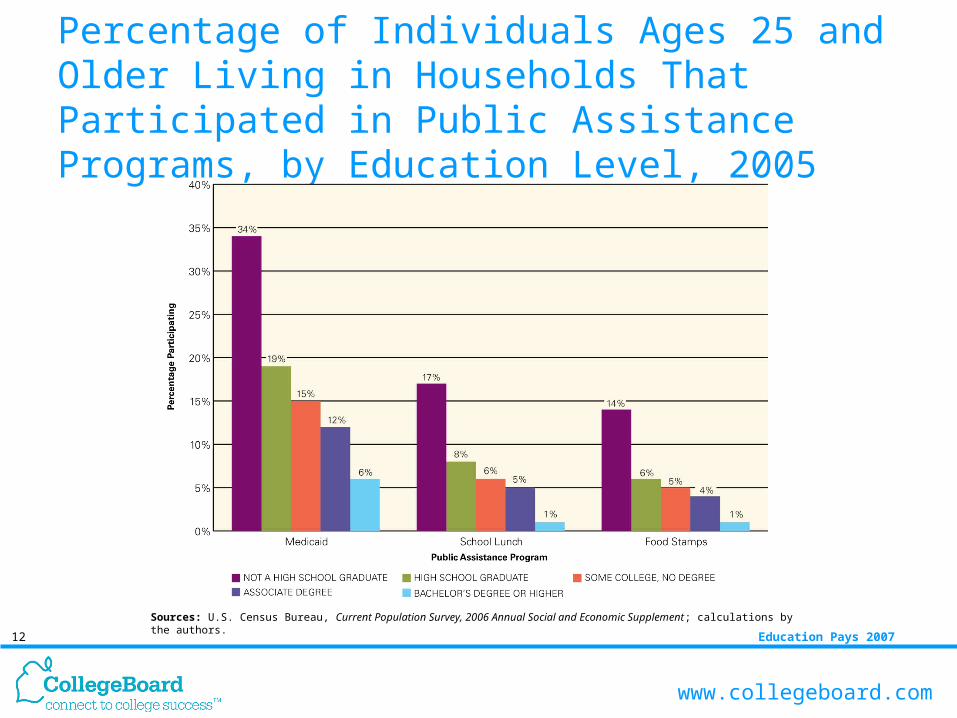
Percentage of Individuals Ages 25 and Older Living in Households That Participated in Public Assistance Programs, by Education Level, 2005
Sources: U.S. Census Bureau, Current Population Survey, 2006 Annual Social and Economic Supplement; calculations by the authors.
Education Pays 200713
www.collegeboard.com
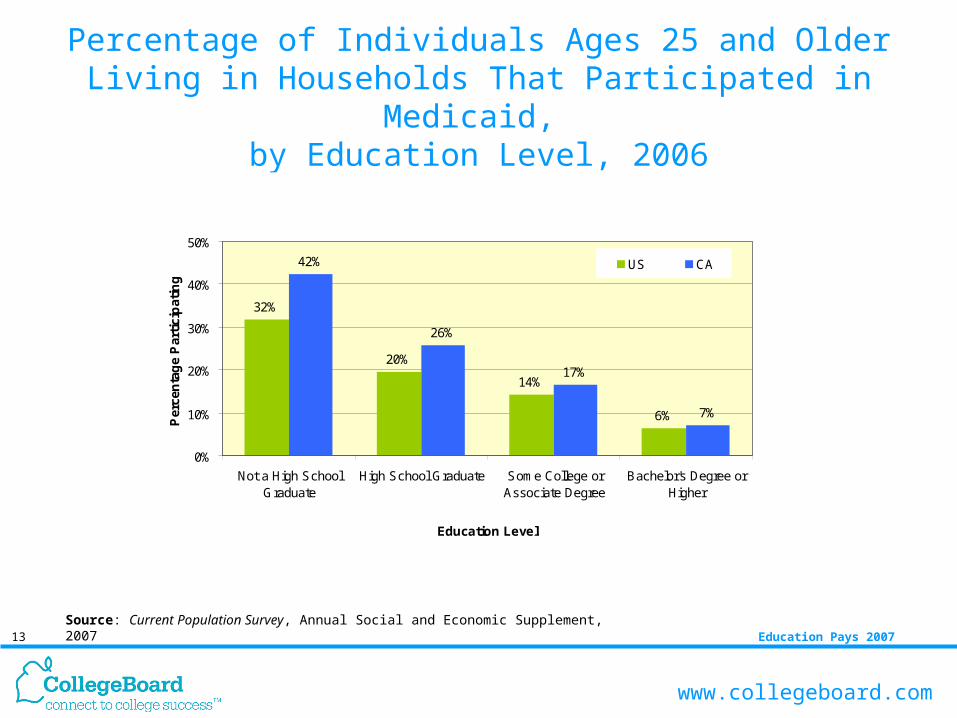
Percentage of Individuals Ages 25 and Older Living in Households That Participated in Medicaid,
by Education Level, 2006
Source: Current Population Survey, Annual Social and Economic Supplement, 2007
32%
20%
14%
6%
42%
26%
17%
7%
0%
10%
20%
30%
40%
50%
Not a High SchoolGraduate
High School Graduate Some College orAssociate Degree
Bachelor's Degree orHigher
Education Level
Per
cen
tag
e P
arti
cip
atin
g
US CA
Education Pays 200714
www.collegeboard.com
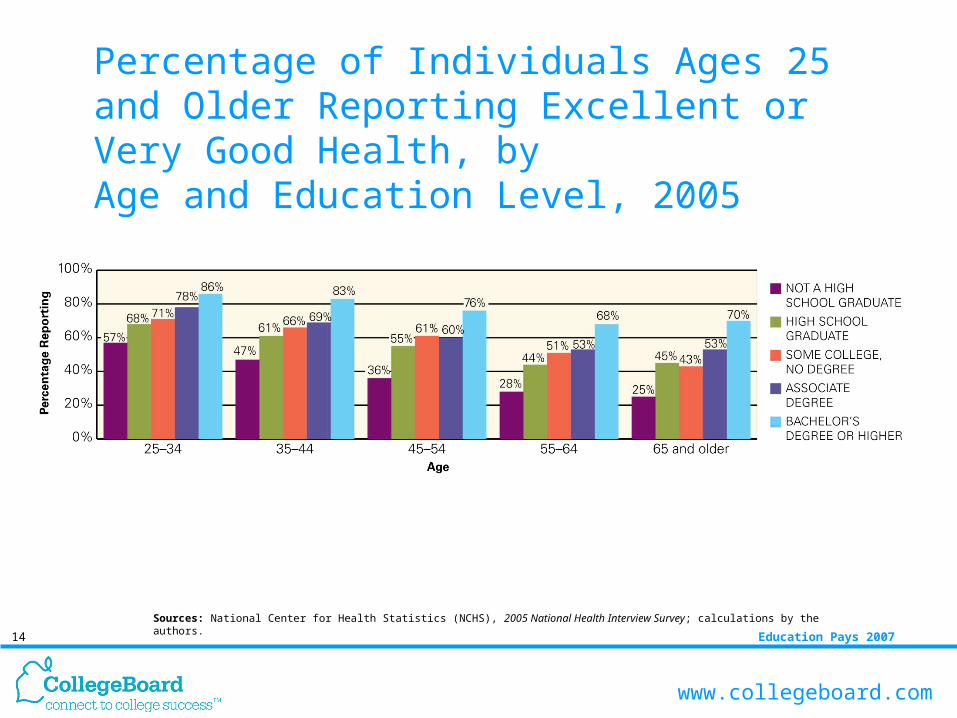
Percentage of Individuals Ages 25 and Older Reporting Excellent or Very Good Health, by Age and Education Level, 2005
Sources: National Center for Health Statistics (NCHS), 2005 National Health Interview Survey; calculations by the authors.

Education Pays 200715
www.collegeboard.com
Cognitive Skills of Preschool Children Ages 3–5, by Mother’s Education Level, 2005
Sources: U.S. Census Bureau, 2007, Table 224 (based on 2005 National Household Education Survey).

Education Pays 200716
www.collegeboard.com
Percentage of Individuals Ages 25 and Older Who Donated Blood in the Past 12 Months, by Education Level, 2005
Sources: NCHS, 2005 National Health Interview Survey, calculations by the authors.
Education Pays 200717
www.collegeboard.com
Distribution of the Benefits
Who Participates and Succeeds
In Higher Education?

Education Pays 200718
www.collegeboard.com
Postsecondary Enrollment Rates of Recent High School Graduates by Family Income, 1983–2005
Notes: Based on enrollment in college within 12 months of high school graduation. Income quintiles are defined in terms of all households. In 2005, the upper income limits of the quintiles were: lowest, $16,799; 2nd, $31,998; 3rd, $50,380; and 4th, $80,662. High school graduates are not evenly distributed among income quintiles. In 2005, 13 percent of high school graduates were in the lowest income quintile, 15 percent were in the 2nd, 16 percent were in the 3rd, 24 percent were in the 4th, and 31 percent were in the highest income quintile.
Sources: NCES, unpublished tabulation using data from the Current Population Survey.
Education Pays 200719
www.collegeboard.com
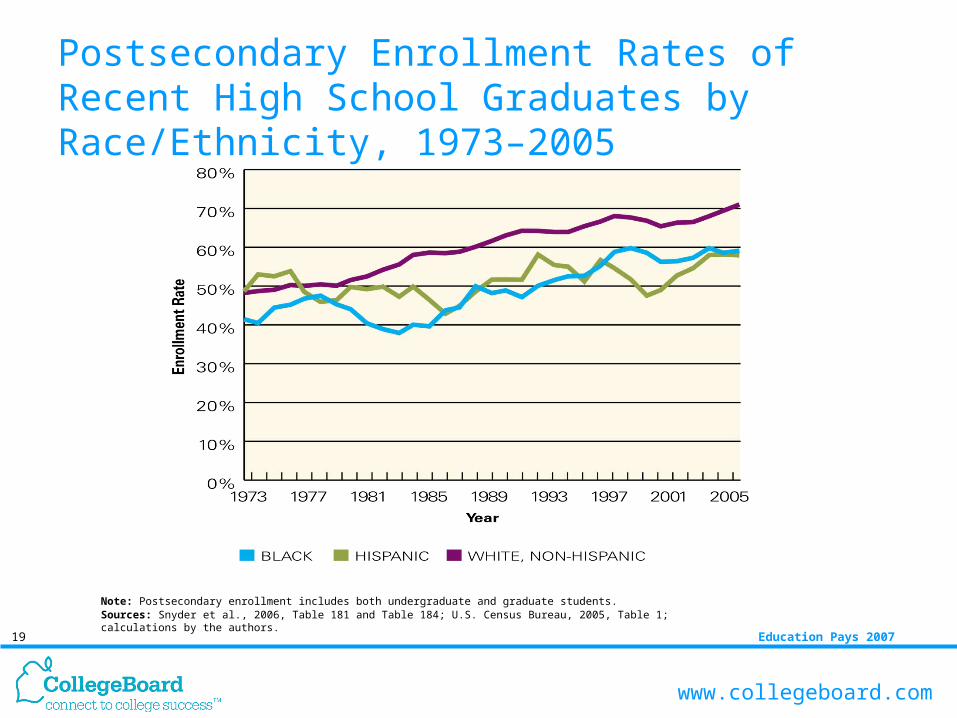
Postsecondary Enrollment Rates of Recent High School Graduates by Race/Ethnicity, 1973–2005
Note: Postsecondary enrollment includes both undergraduate and graduate students. Sources: Snyder et al., 2006, Table 181 and Table 184; U.S. Census Bureau, 2005, Table 1; calculations by the authors.
Education Pays 200720
www.collegeboard.com
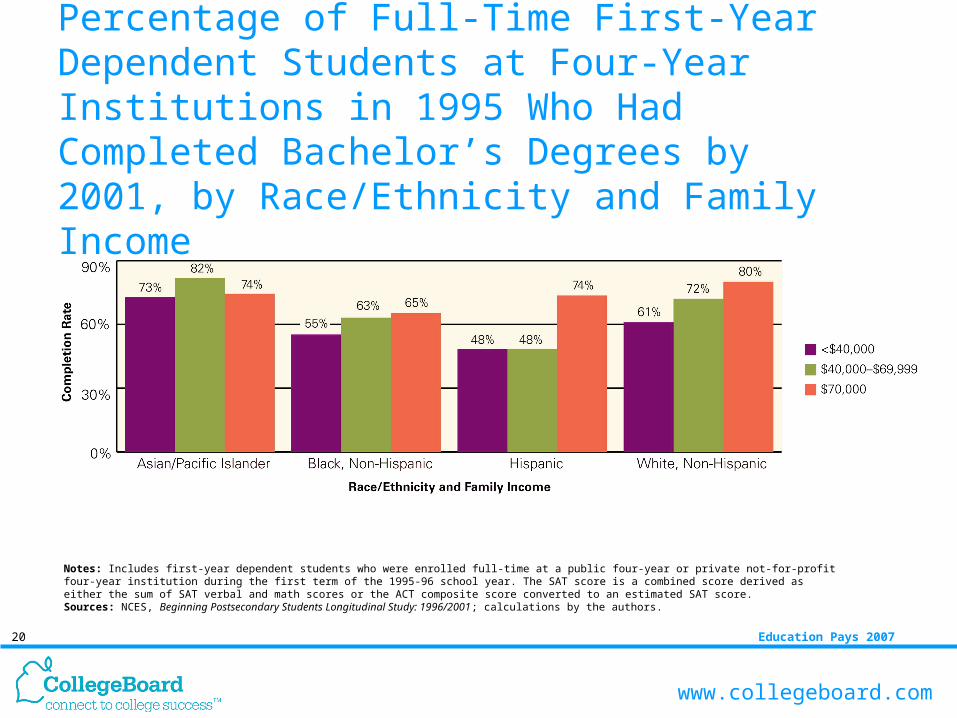
Percentage of Full-Time First-Year Dependent Students at Four-Year Institutions in 1995 Who Had Completed Bachelor’s Degrees by 2001, by Race/Ethnicity and Family Income
Notes: Includes first-year dependent students who were enrolled full-time at a public four-year or private not-for-profit four-year institution during the first term of the 1995-96 school year. The SAT score is a combined score derived as either the sum of SAT verbal and math scores or the ACT composite score converted to an estimated SAT score.Sources: NCES, Beginning Postsecondary Students Longitudinal Study: 1996/2001; calculations by the authors.

Education Pays 200721
www.collegeboard.com
Education Level of Individuals Ages 25 and Older, 1940–2006
Note: Percentages may not add up to 100 due to rounding.Source: U.S. Census Bureau, 2006a, Table A-1.
Education Pays 200722
www.collegeboard.com
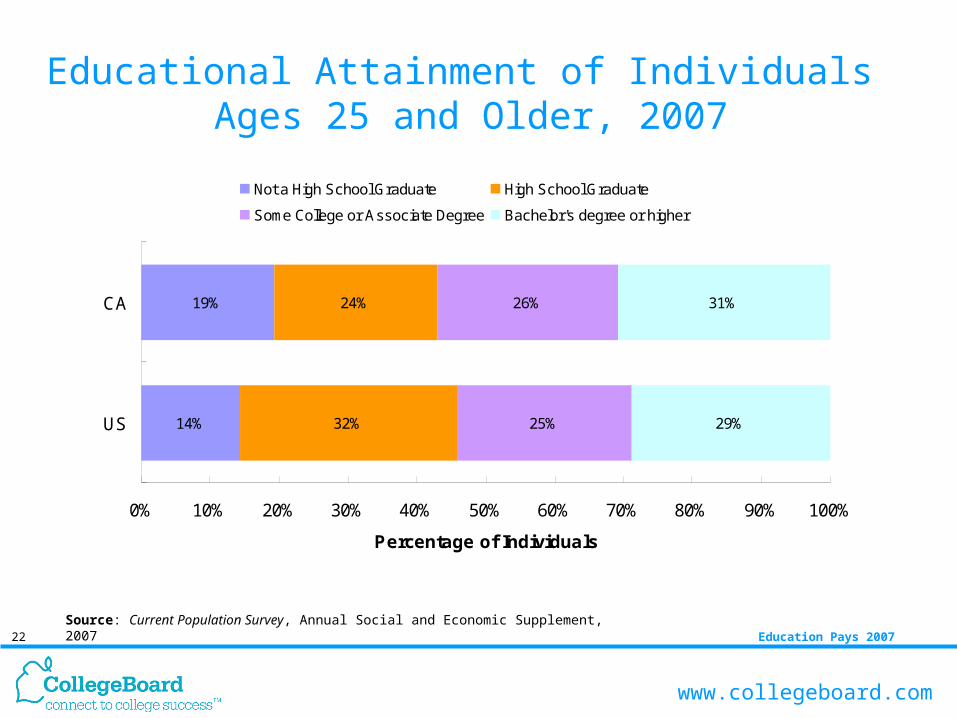
Educational Attainment of Individuals Ages 25 and Older, 2007
Source: Current Population Survey, Annual Social and Economic Supplement, 2007
14%
19%
32%
24%
25%
26%
29%
31%
0% 10% 20% 30% 40% 50% 60% 70% 80% 90% 100%
US
CA
Percentage of Individuals
Not a High School Graduate High School Graduate
Some College or Associate Degree Bachelor's degree or higher