education, research, training and capacity … research, training and capacity building activities...
TRANSCRIPT

Manzul Hazarika Ph.D.
Associate Director, Geoinformatics CenterAsian Institute of Technology
E-mail: [email protected]
Education, Research, Training and Capacity Building Activities in AIT
(Research & Training Node for Sentinel Asia)

Asian Institute of Technology (AIT)
AIT Academic Structure (Schools and Extension)
Computer Science
School of Engineering and Technology
AIT Extension(Non-degree
training, consultancy and
services)
School of Environment Resources and Development
Geotechnical and Geoenvironmental
Engineering
Agricultural Systems and Engineering
International Business
Industrial Engineering and Management
Management of Technology
Remote Sensing and Geographic
Information Systems
Gender and Development Studies
Urban Environmental Management
Construction,Engineering and
Infrastructure Management
Structural Engineering
Natural Resources Management
Regional and Rural Development Planning
Environmental Engineering and Management
Pulp and Paper Technology
Aquaculture and Aquatic Resources Management
Food Engineering and Bioprocess Technology
Transportation Engineering
Design and Manufacturing Engineering
Water Engineering and Management
Service Marketing and Technology
International Public
Management
Environment, Infrastructure and
Urban Development
Development Management
Agriculture, Resources and
Rural Development
School of Management
Business Management
Education and Training
Development
Information and Communications
Technology
Information and Communications
TechnologiesMechatronics
Telecommunications
InformationManagement
Executive MBAEMBA Bangkok EMBA Vietnam
EMBA-HRM
Energy
Microelectronics
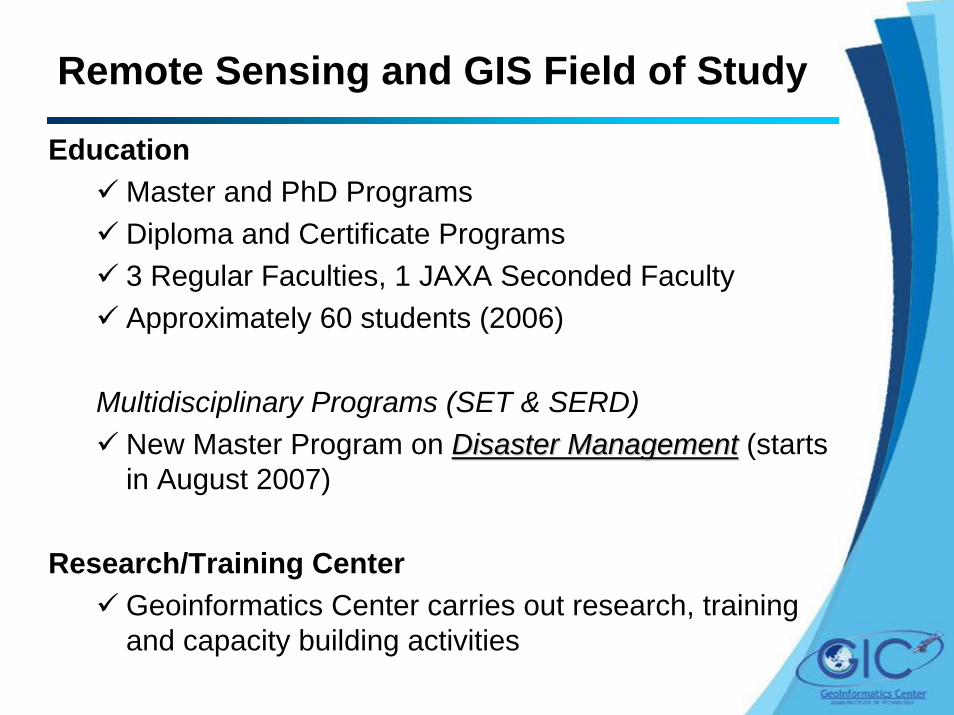
Remote Sensing and GIS Field of Study
EducationMaster and PhD ProgramsDiploma and Certificate Programs3 Regular Faculties, 1 JAXA Seconded FacultyApproximately 60 students (2006)
Multidisciplinary Programs (SET & SERD)New Master Program on Disaster ManagementDisaster Management (starts in August 2007)
Research/Training CenterGeoinformatics Center carries out research, training and capacity building activities

Capacity Building : Mini-Projectsby
Geoinformatics Center (GIC)

Mini-Projects - Characteristics
Training and comprehensive capacity building through real-world problems such as flood, drought, landslide, etc.Involve data/service provider agencies and services/products user agencies,Explore the theoretical aspects and identify most appropriatedata analysis and integration techniqueCalibration/validation through field observationsGenerate products with participation of both users and service providersDevelop case studies to share in the region

Mini-Projects in 2006
Capacity building projects are being sponsored by the Japan Aerospace Exploration Agency (JAXA) in developing countries.
Projects:
Flood – 5 Projects (Bangladesh, Cambodia, China, Laos & Nepal)
Drought – 1 Project (Philippines)
Landside – 3 Projects (Philippines, Sri Lanka & Vietnam)
Activities:1. Workshop and Training in AIT– Aug/Sep, 2006
2. Field Visit – Nov/Dec, 2006
3. Data Analysis and Report Writing in AIT– Jan/Feb, 2007
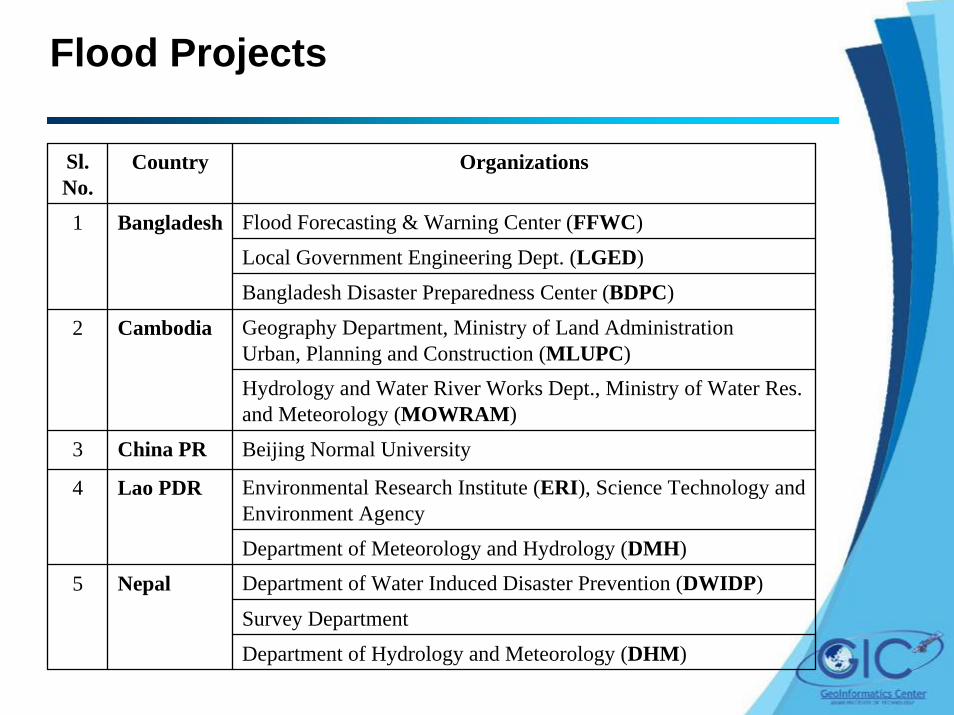
Flood Projects
Sl. No.
Country Organizations
Flood Forecasting & Warning Center (FFWC)
Local Government Engineering Dept. (LGED)
Bangladesh Disaster Preparedness Center (BDPC)
Geography Department, Ministry of Land AdministrationUrban, Planning and Construction (MLUPC)
2 Cambodia
Hydrology and Water River Works Dept., Ministry of Water Res. and Meteorology (MOWRAM)
3 China PR Beijing Normal University
Environmental Research Institute (ERI), Science Technology and Environment Agency
4 Lao PDR
Department of Meteorology and Hydrology (DMH)Department of Water Induced Disaster Prevention (DWIDP)
Survey Department
Department of Hydrology and Meteorology (DHM)
5 Nepal
1 Bangladesh
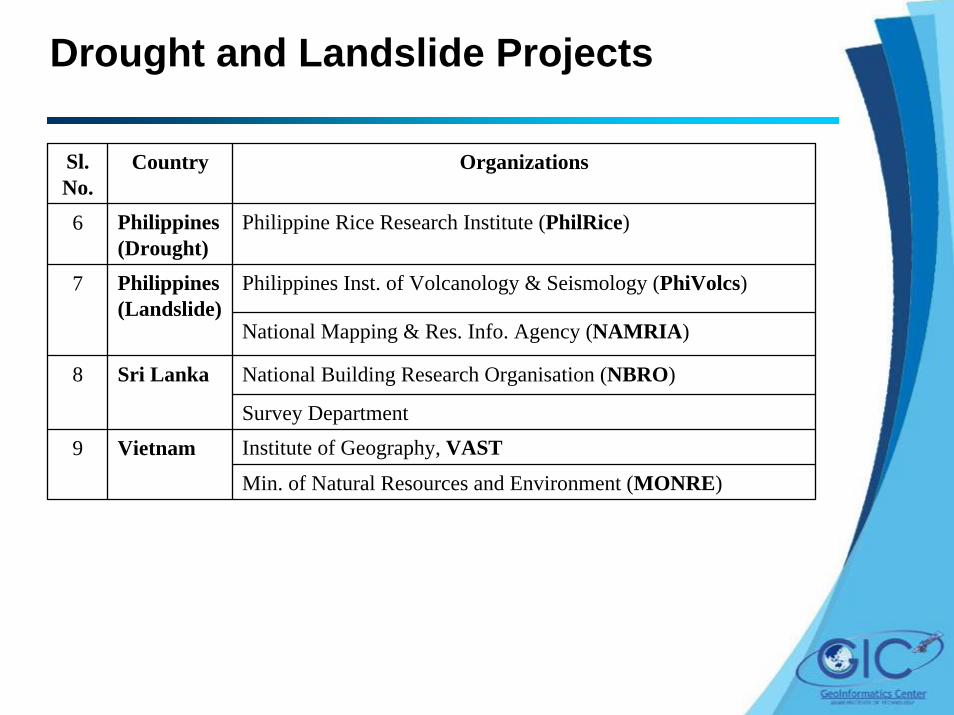
Drought and Landslide Projects
Sl. No.
Country Organizations
6 Philippines(Drought)
Philippine Rice Research Institute (PhilRice)
Philippines Inst. of Volcanology & Seismology (PhiVolcs)7 Philippines(Landslide)
National Mapping & Res. Info. Agency (NAMRIA)
National Building Research Organisation (NBRO)8 Sri Lanka
Survey DepartmentInstitute of Geography, VAST9 Vietnam
Min. of Natural Resources and Environment (MONRE)

Bangladesh: Flood Mapping by Integrating Remote Sensing Data & MIKE 11 Model
Munshiganj
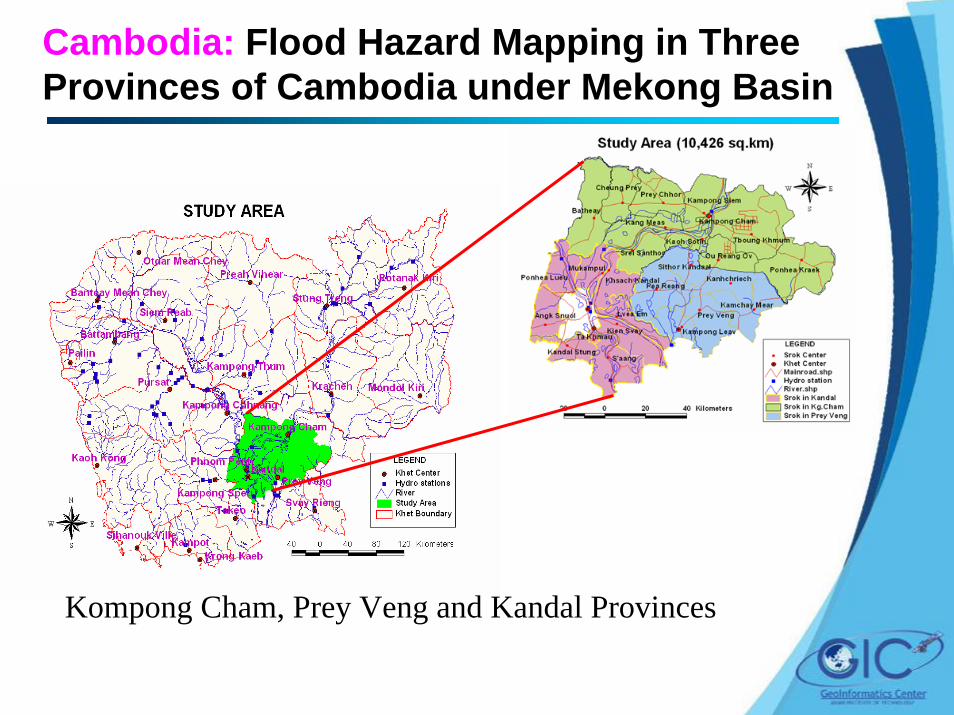
Cambodia: Flood Hazard Mapping in Three Provinces of Cambodia under Mekong Basin
Kompong Cham, Prey Veng and Kandal Provinces
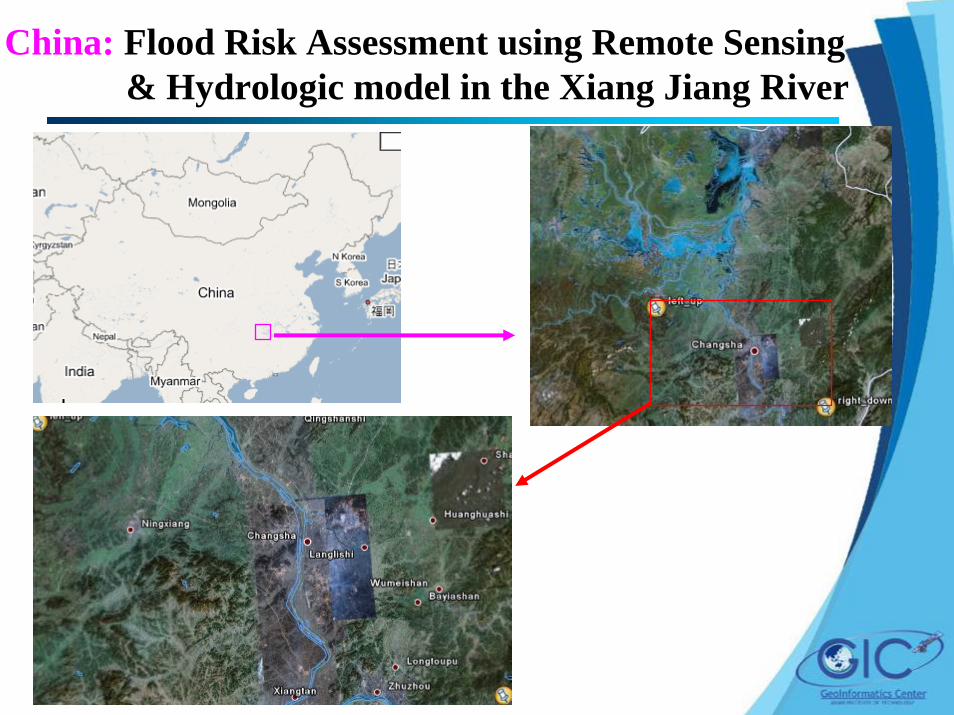
China: Flood Risk Assessment using Remote Sensing & Hydrologic model in the Xiang Jiang River
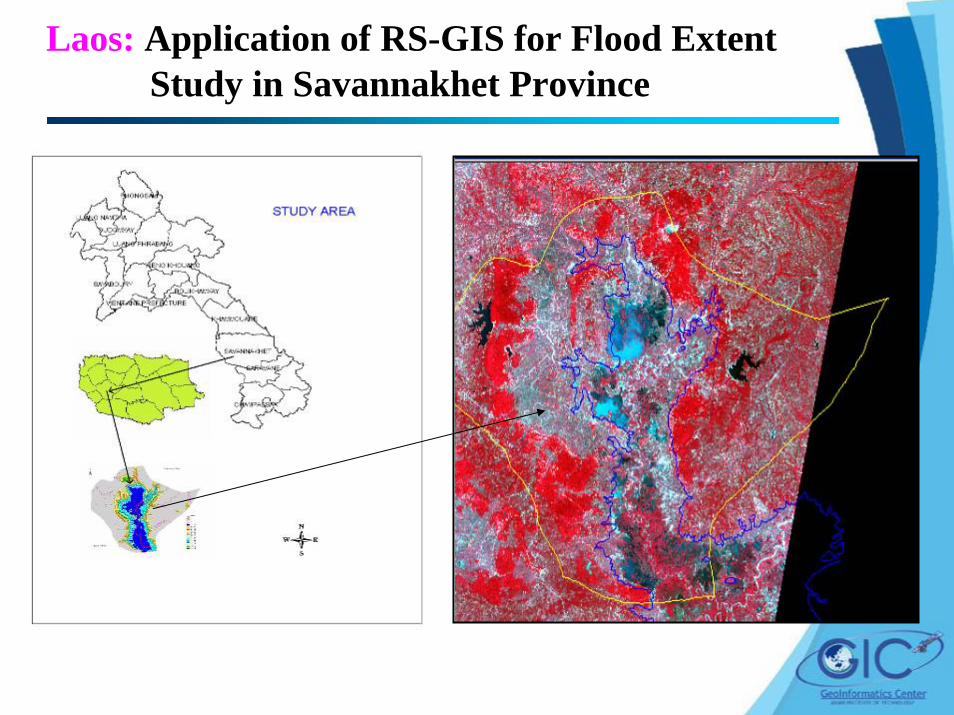
Laos: Application of RS-GIS for Flood Extent Study in Savannakhet Province
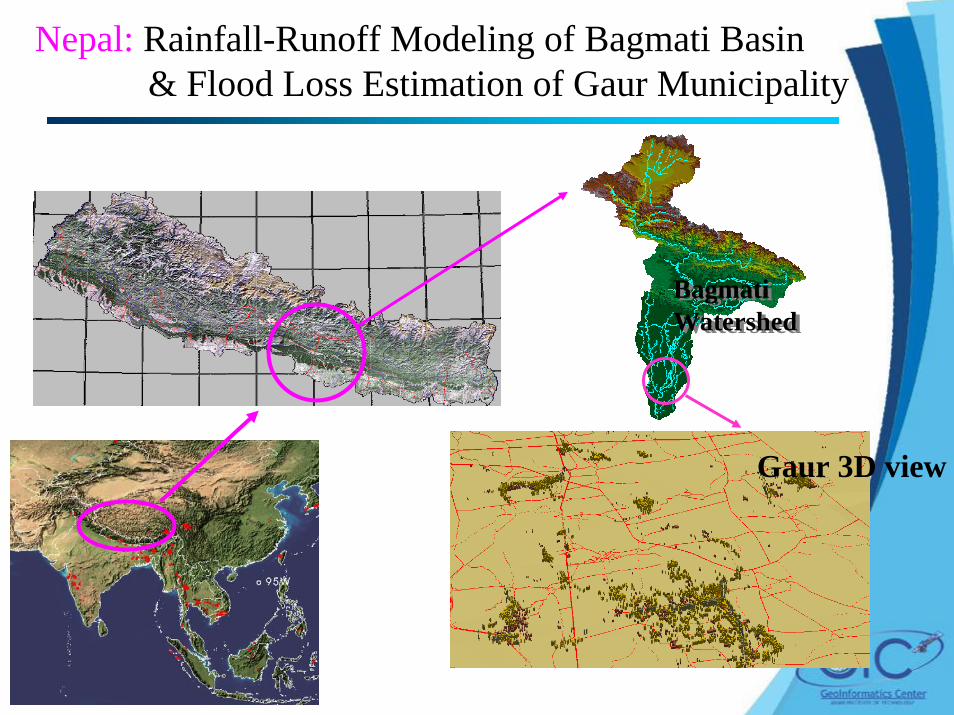
Nepal: Rainfall-Runoff Modeling of Bagmati Basin & Flood Loss Estimation of Gaur Municipality
BagmatiWatershedBagmatiWatershed
Gaur 3D view

Philippines-I: Detection of Drought Prone Areas Using Remote Sensing and Meteorological Approach in Iloilo
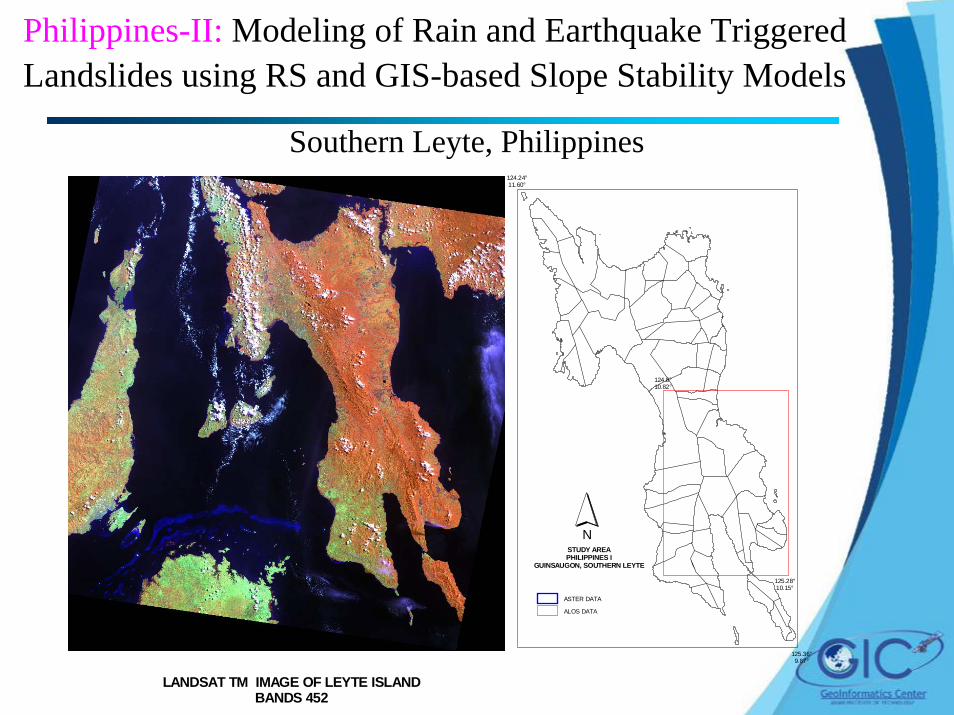
Philippines-II: Modeling of Rain and Earthquake Triggered Landslides using RS and GIS-based Slope Stability Models
Southern Leyte, Philippines
LANDSAT TM IMAGE OF LEYTE ISLANDBANDS 452
124.24°11.60°
124.8°10.82°
125.28°10.15°
125.36°9.87°
STUDY AREAPHILIPPINES I
GUINSAUGON, SOUTHERN LEYTE
N
ASTER DATA
ALOS DATA
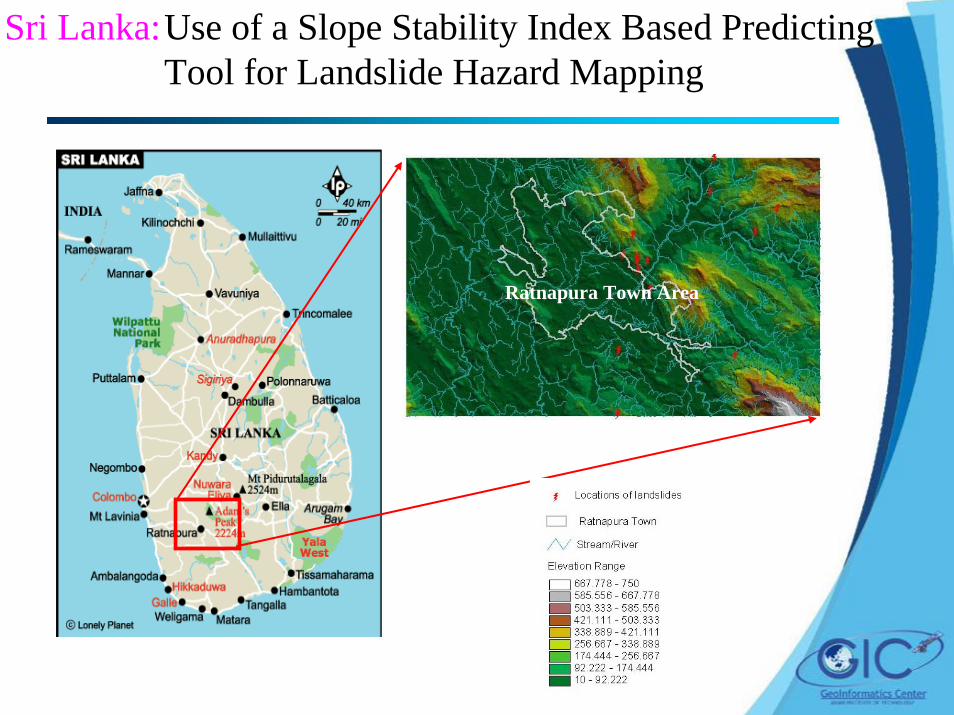
Sri Lanka:Use of a Slope Stability Index Based Predicting Tool for Landslide Hazard Mapping
Ratnapura Town Area

Vietnam: Application of Remote Sensing and GIS for Landslide Hazard Mapping in a Mountainous Areas
Yen Chau & Bac Yen Districts

IntroductionIntroduction
Mini ProjectsMini Projects
LandslideLandslide
FloodFlood
DroughtDrought
ContactContact
JAXAJAXA
Sentinel AsiaSentinel Asia
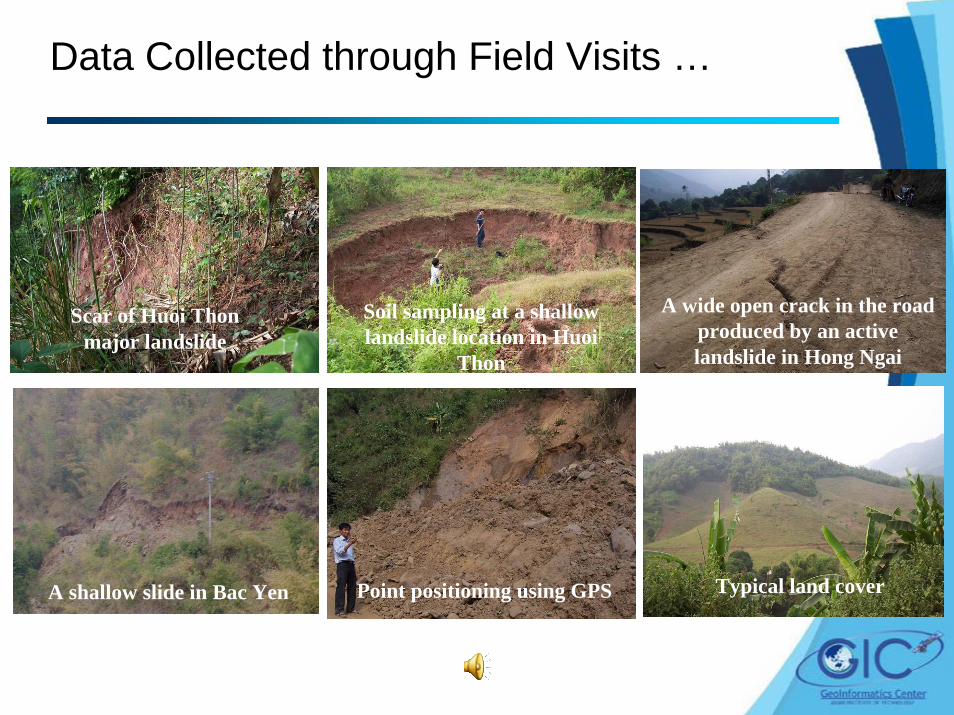
Data Collected through Field Visits …
Soil sampling at a shallow landslide location in Huoi
Thon
Scar of Huoi Thon major landslide
A wide open crack in the road produced by an active landslide in Hong Ngai
Typical land cover A shallow slide in Bac Yen Point positioning using GPS
Cambodia
A Detail Example for Flood Hazard Mapping
Flood Hazard Mapping in Three Provinces of Cambodia under Mekong Basin

Study Area
Study area covers 3 provinces (Kompong Cham, Prey Veng, and Kandal) with a population of 245,000.

2000 Flood (Dartmouth Flood Observatory)
• Aug., 2000 • 208,200 sq. km area flooded; 1,139 dead; 6.5 Million displaced• Property Damage: 78 Million US$
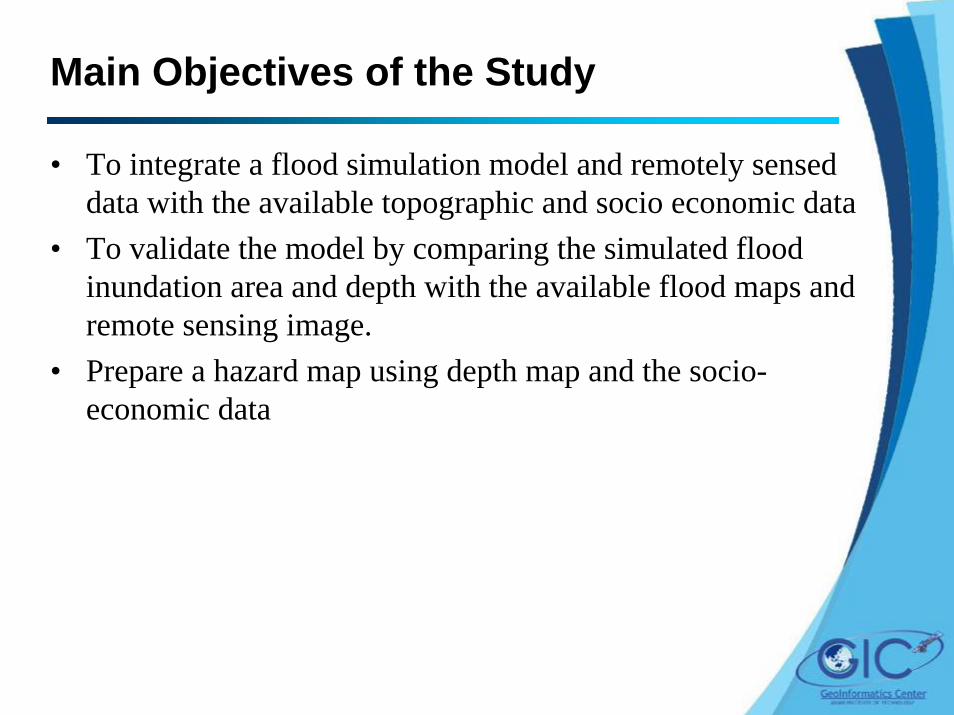
Main Objectives of the Study
• To integrate a flood simulation model and remotely sensed data with the available topographic and socio economic data
• To validate the model by comparing the simulated flood inundation area and depth with the available flood maps and remote sensing image.
• Prepare a hazard map using depth map and the socio-economic data
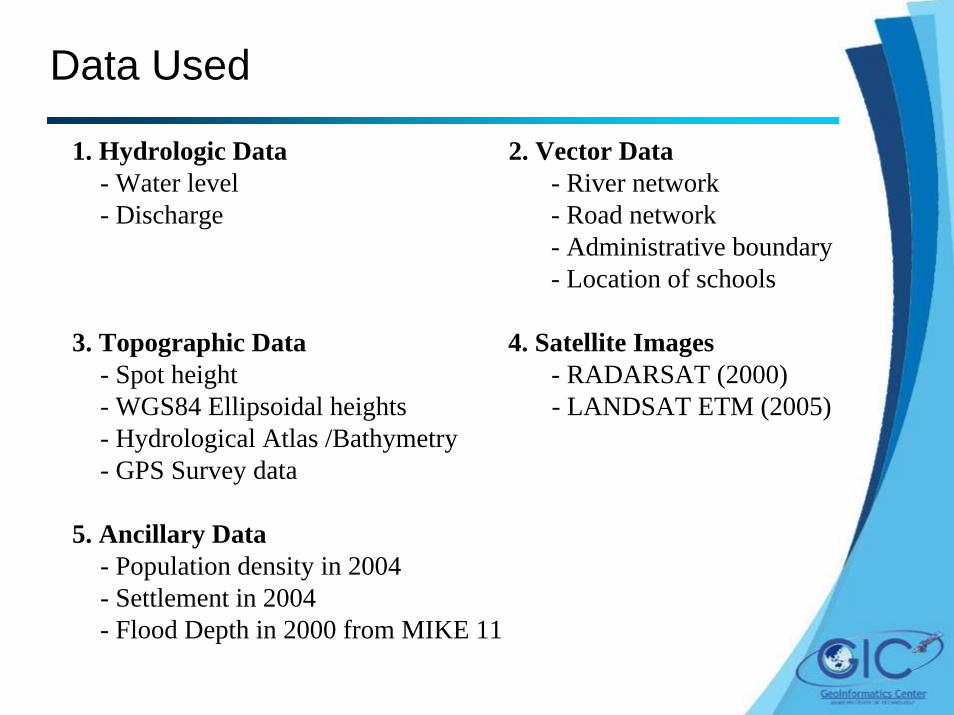
Data Used
1. Hydrologic Data 2. Vector Data- Water level - River network- Discharge - Road network
- Administrative boundary- Location of schools
3. Topographic Data 4. Satellite Images- Spot height - RADARSAT (2000)- WGS84 Ellipsoidal heights - LANDSAT ETM (2005)- Hydrological Atlas /Bathymetry- GPS Survey data
5. Ancillary Data- Population density in 2004- Settlement in 2004- Flood Depth in 2000 from MIKE 11
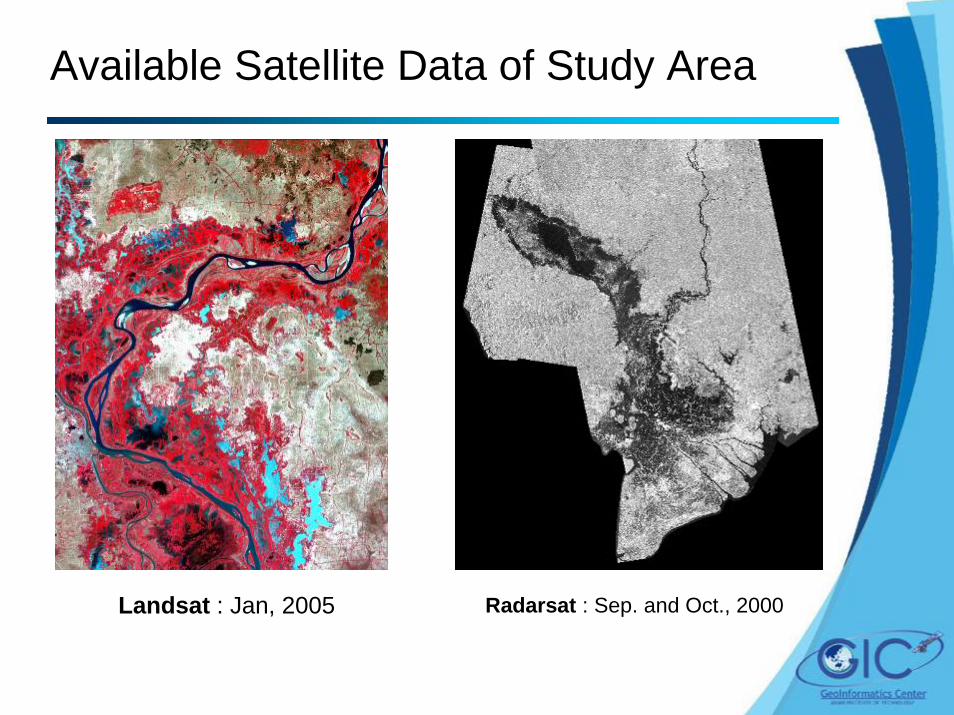
Available Satellite Data of Study Area
Landsat : Jan, 2005 Radarsat : Sep. and Oct., 2000

Methodology
Hydrological Data
Flood hazard map
Topographic and GPS Data
TIN Land use map
Population density
Road network
Vulnerability Assessment
HEC-RAS
Satellite ImageLANDSAT ETM

Field Survey
Right Bank: 95.15KmLeft Bank: 43.62 KmPP-Kg.Cham:

During Field Survey

Comparison of Results
RADARSAT-1 Image, September, 2000
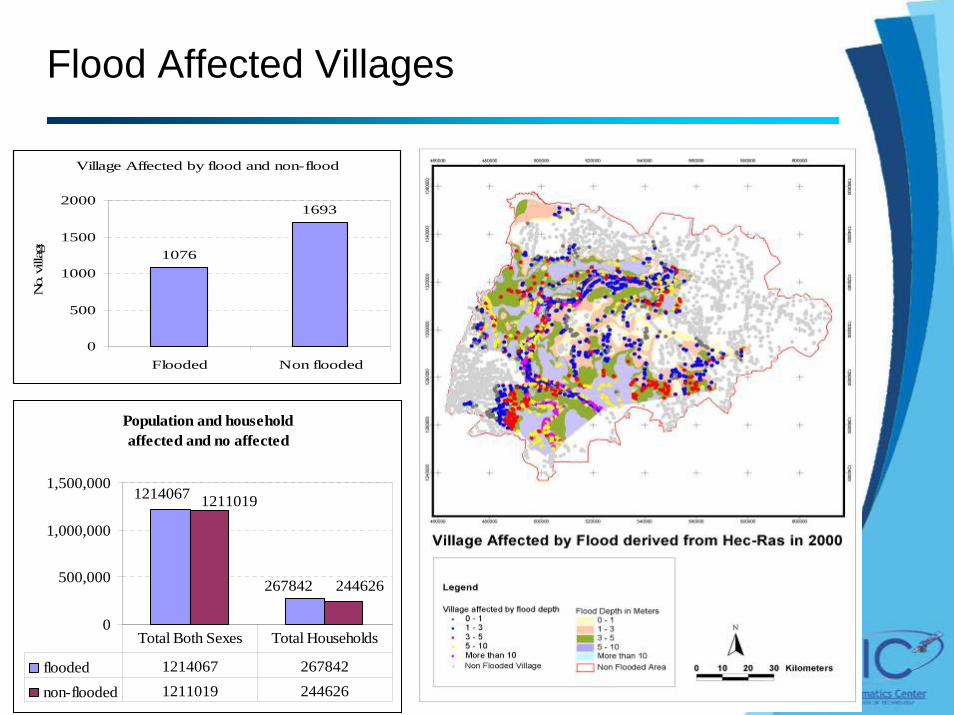
Flood Affected Villages
Village Affected by flood and non-flood
1076
1693
0
500
1000
1500
2000
Flooded Non flooded
No.
vill
age
Population and householdaffected and no affected
267842
1214067
244626
1211019
0
500,000
1,000,000
1,500,000
flooded 1214067 267842
non-flooded 1211019 244626
Total Both Sexes Total Households
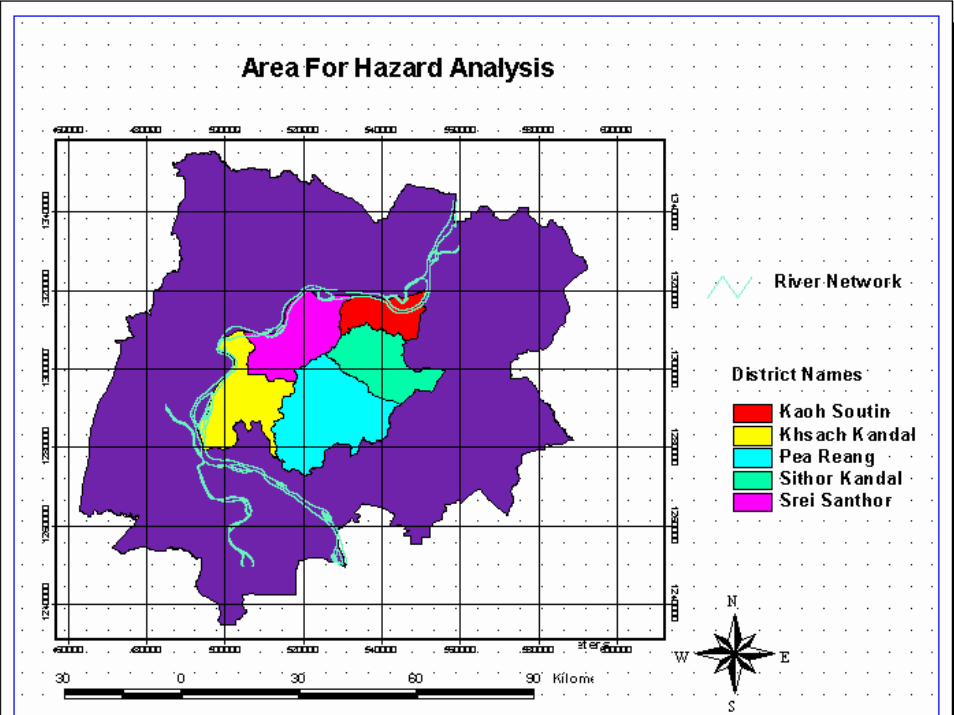
Area For Flood Hazard Mapping

Weighted Population Map
+
=Population per commune X Weighted Landuse
Total Weight
Weighted Population per pixel

Enlarged Weighted Population Map
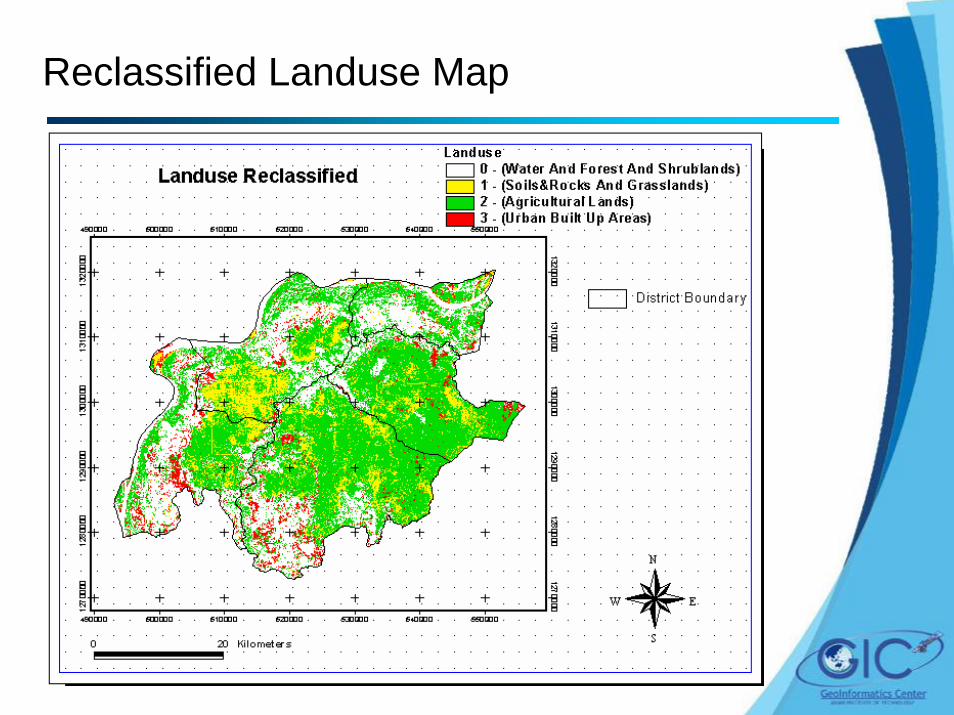
Reclassified Landuse Map

Flood Depth Map

Final Flood Hazard Map
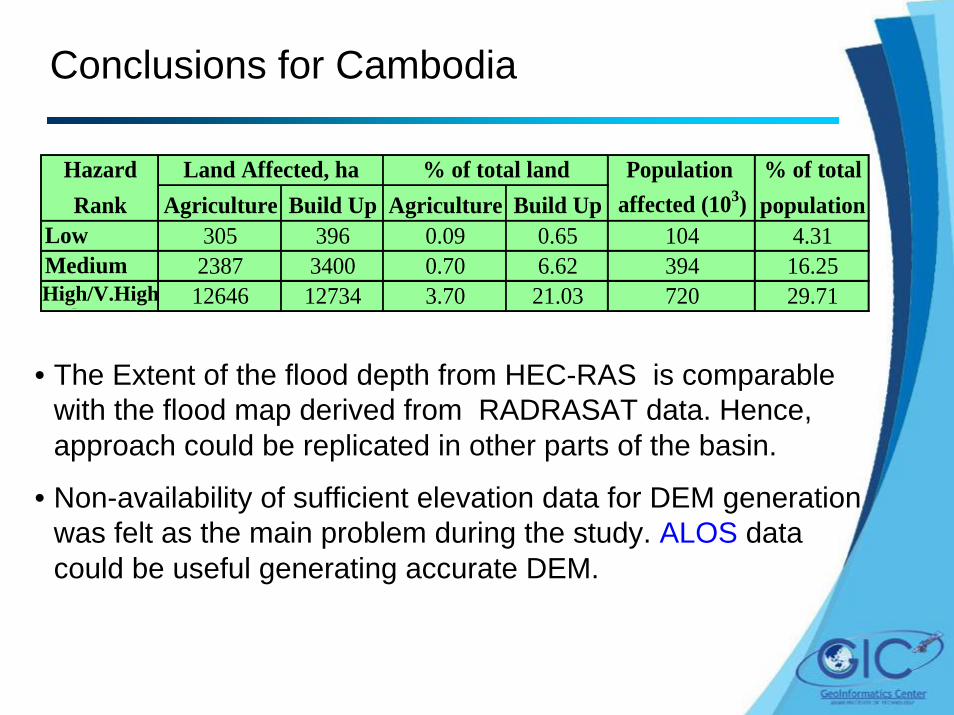
Conclusions for Cambodia
Hazard Population % of totalRank Agriculture Build Up Agriculture Build Up affected (103) population
Low 305 396 0.09 0.65 104 4.31Medium 2387 3400 0.70 6.62 394 16.25High 12646 12734 3.70 21.03 720 29.71
Land Affected, ha % of total land
High/V.High
• The Extent of the flood depth from HEC-RAS is comparable with the flood map derived from RADRASAT data. Hence, approach could be replicated in other parts of the basin.
• Non-availability of sufficient elevation data for DEM generation was felt as the main problem during the study. ALOS data could be useful generating accurate DEM.
NepalFlood Forecasting and Early Warning System
in Bagmati Flood Plain

Objectives
• To compute flood hydrograph by rainfall-runoff modeling using hydrologic and statistical data
• To prepare flood hazard maps for various return periods
• To generate loss functions, estimate flood loss and prepare flood loss map for Gaur municipality
• To suggest a mechanism for flood forecasting and early warning system

Methodology
Rainfall dataRainfall data
Hydrological Hydrological modelmodel
Flood hydrograph Flood hydrograph
Hydraulic modelHydraulic model
Flood mapsFlood maps
Comparison &Comparison &ImprovementImprovement
Direct floodDirect flooddamage assessmentdamage assessment
Population Population datadata Flood risk mapsFlood risk maps
Satellite imageSatellite image
1. DEM1. DEM2. Flood map2. Flood map3. Landuse map3. Landuse map
Flood maps forFlood maps forDiff. Return periodsDiff. Return periods
Rating curveRating curve
Flood Early Flood Early WarWar ning Systemning System
Flood maps forFlood maps forDiff. Water levelsDiff. Water levels
TopographicalTopographicalDataData
(1. TRMM & 2. Rain gauge data)
(1. HEC HMS and 2. Statistical)(1. HEC HMS and 2. Statistical)
(HEC RAS)(HEC RAS)
Flood hazardFlood hazardmapsmaps
CommunityCommunitysurveysurvey

Data Available
• Satellite imagery– Aster– Landsat
• Hydrological data– Rainfall data– Discharge data
•• Vector dataVector data– Topographic data– DEM– Landuse data
•• Ancillary dataAncillary data– Socio-economic data– Census data

Rainfall-Runoff Modeling (HEC-HMS)
Simulated vs. Observed Discharges
0
1000
2000
3000
4000
5000
6000
1-Jun-04 21-Jun-04 11-Jul-04 31-Jul-04 20-Aug-04 9-Sep-04 29-Sep-04
Time in Days
Dis
char
ge in
m̂3/
s
Simulated
Observed
Observed peak discharge = 5600cumecsSimulated peak discharge = 5321cumecs
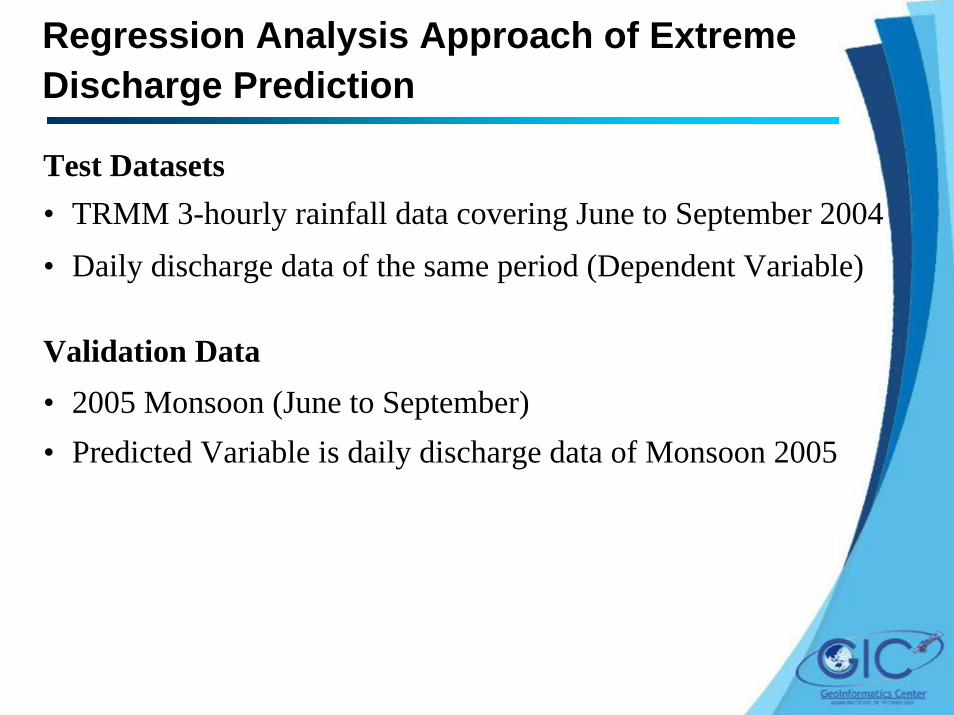
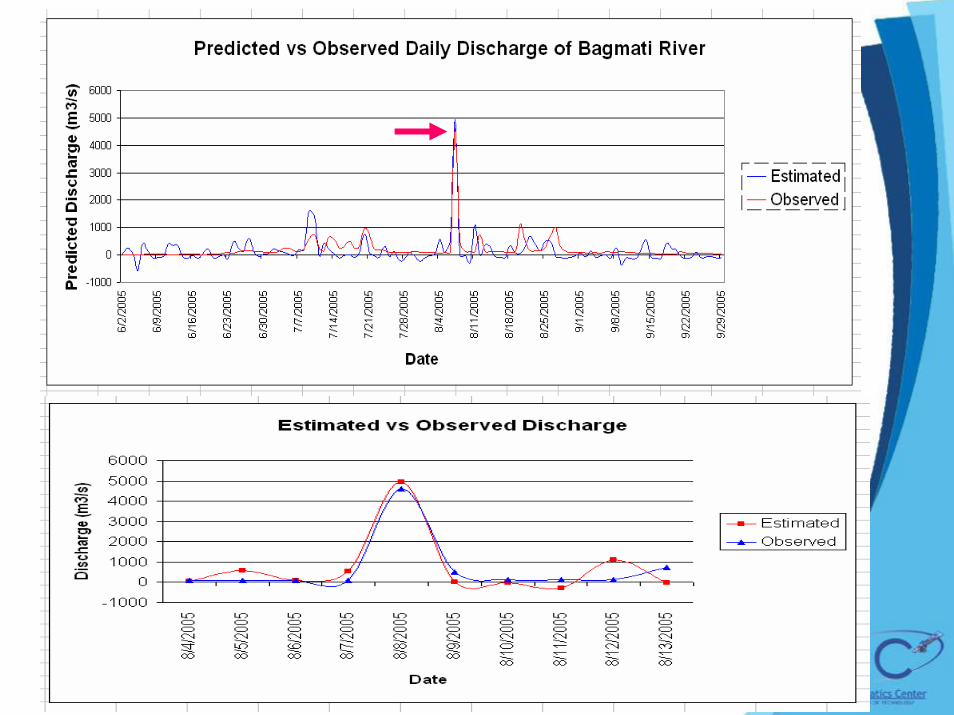
Regression Analysis Approach of Extreme Discharge Prediction
Test Datasets• TRMM 3-hourly rainfall data covering June to September 2004• Daily discharge data of the same period (Dependent Variable)
Validation Data• 2005 Monsoon (June to September)• Predicted Variable is daily discharge data of Monsoon 2005
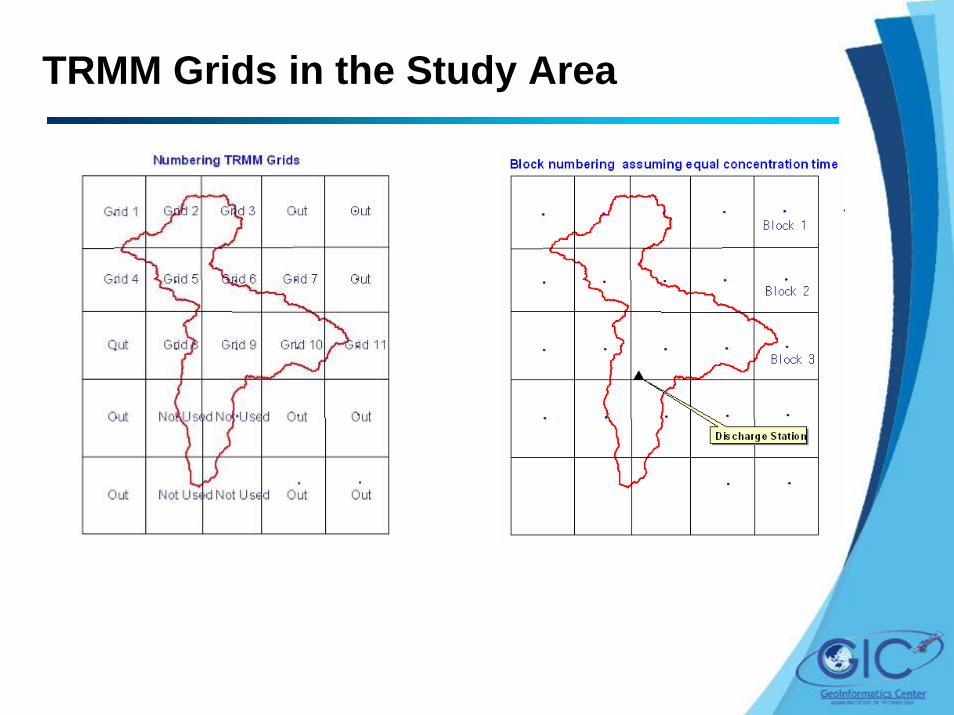
TRMM Grids in the Study Area
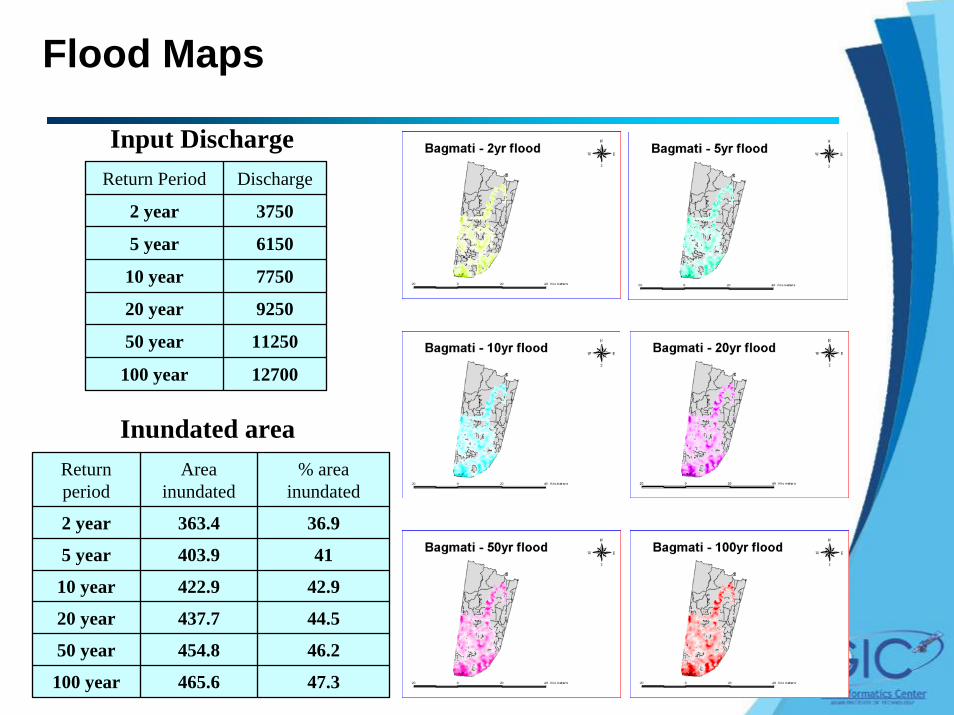
Flood Maps
Input DischargeReturn Period Discharge
2 year 3750
5 year 6150
10 year 7750
20 year 9250
50 year 11250
100 year 12700
Inundated areaReturn period
Area inundated
% area inundated
2 year 363.4 36.9
5 year 403.9 41
10 year 422.9 42.9
20 year 437.7 44.5
50 year 454.8 46.2
100 year 465.6 47.3
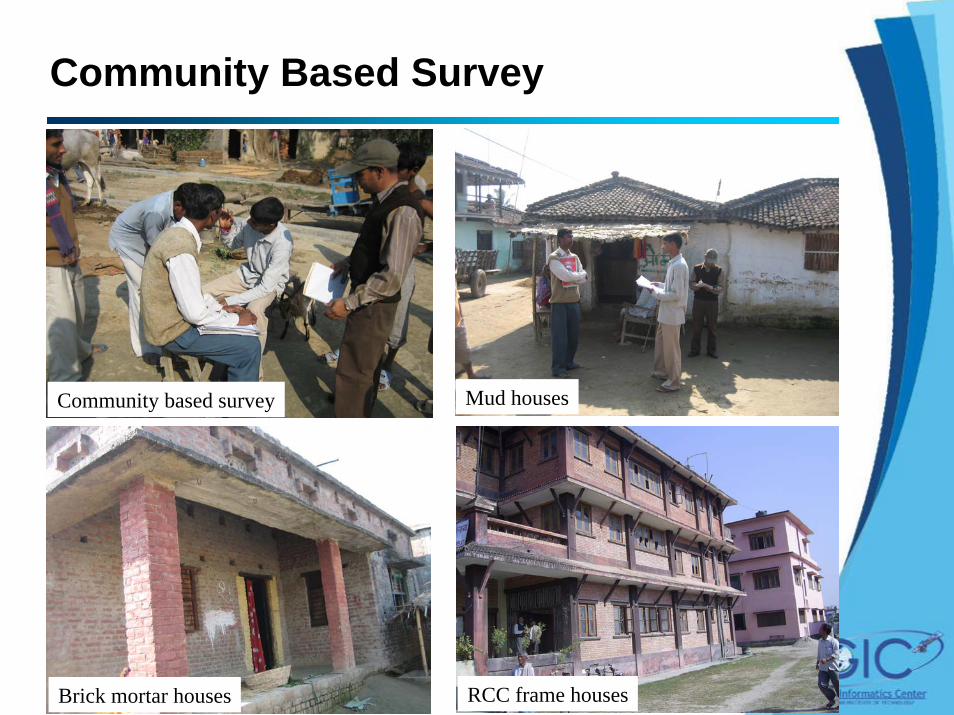
Community Based Survey
Mud housesCommunity based survey
RCC frame housesBrick mortar houses
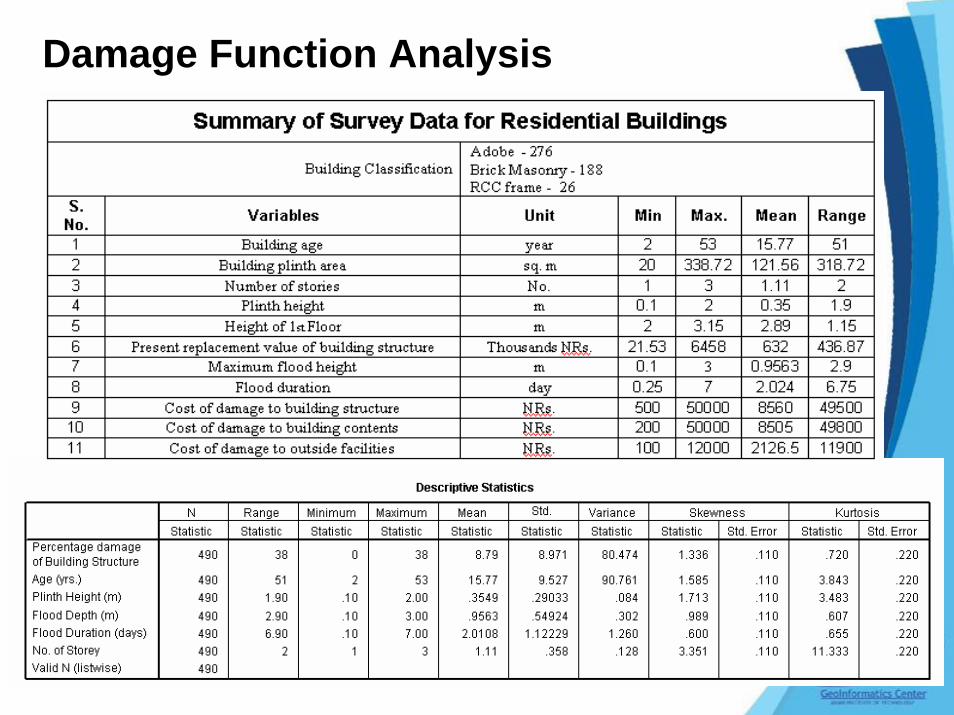
Damage Function Analysis
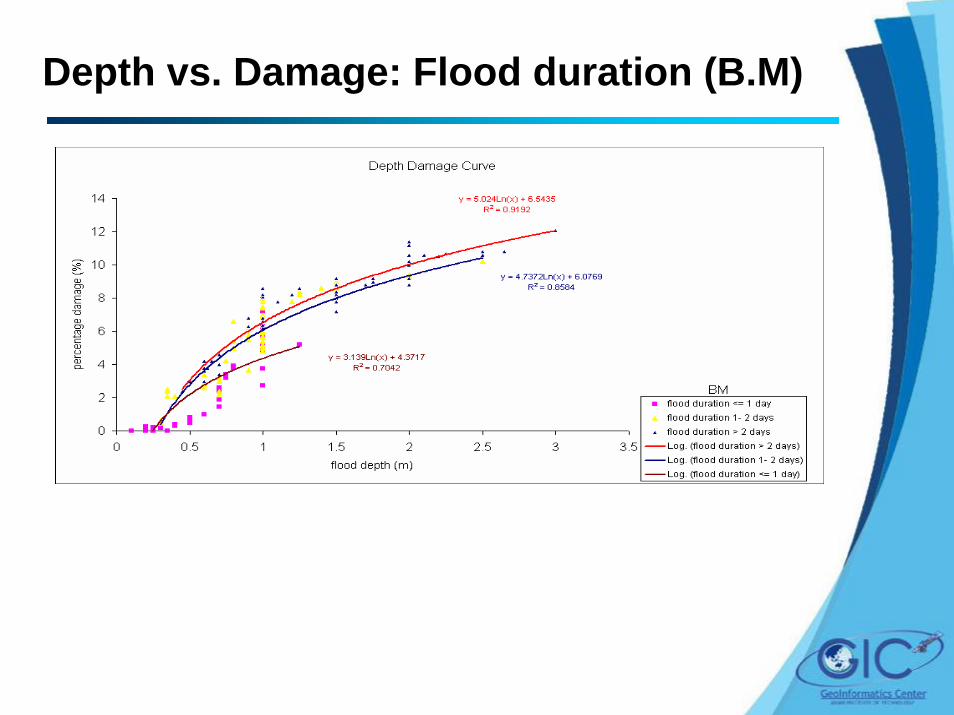
Depth vs. Damage: Flood duration (B.M)

Depth vs. Damage: Building Age (B.M)

Flood Hazard Map
Type Equation
RCC D=1.4687 * Ln(x) + 1.8713
BM D=4.1053 * Ln(x) + 5.27
Adobe D=15.161 * Ln(x) + 17.502
Type Height (m)
RCC 0.67
BM 0.42
Adobe 0.67
Average plinth level
Damage functions

Flood Loss Estimation
Construction rates
Estimated loss corresponding to Q50 = NRs 225 million
Type Minimum Maximum Mean Count
RCC 0 3.84 3.28 339
BM 0 11.04 8.44 3532
Adobe 0 39.33 29.13 1514
Damaged houses
Replacement ValueNepalese Rupees (NRs) Number of houses
0 – 5,000 739
5,000 – 15,000 1083
15,000 – 25,000 827
25,000 – 50,000 1222
50,000 – 100,000 1040
>100,000 474
Damage values
Type Nepalese Rupees/sq ft Nepalese Rupees/sq m
RCC 1100.00 11830.00
BM 700.00 7530.00
Adobe 200.00 2150.00

Flood Forecasting and Early Warning
Conclusions for Nepal
• Rainfall-runoff model in combination with the flood hazard maps provides a good basis for real-time flood forecasting
• Flood damage functions were generated for buildings and a flood loss map was produced for Gaur Municipality.
• Downscaling of TRMM data could be useful in flood forecasting, especially for ungauged river basins

Thank you for your kind attention