education roller coaster physics teachers guide...
TRANSCRIPT
78890
TEACHER’SGUIDE
ROLLER COASTER PHYSICS
Education®
ROLLER COASTER

R o l l e r C o a s t e r P h y s i c sTeacher’s Guide
V4-09/14© 2014 K’NEX Limited Partnership Group and its licensors.
K’NEX Limited Partnership GroupP.O. Box 700Hatfield, PA 19440-0700
K’NEX is a registered trademark of K’NEX Limited Partnership Group.Protected by International Copyright. All rights reserved.
Visit our website at www.knexeducation.comEmail: [email protected]: 1-888-ABC-KNEX (Toll Free)
Photo Credits: - Pages 1, 37, 43, 51: iStockPhoto.com- Page 55: Six Flags Great Adventure, Jackson, NJ.- Cover (background), Page 1 (center):
©2005 JupiterImages Corporation
Author:James A. Musolino, M.Ed.- Governor’s Institute for Physical Science
Educators, Carnegie-Mellon University: Teacher/mentor.
- Pennsylvania Department of Education: Consultant.
- NASA/IGES: Education Specialist and Reviewer.- Presidential Award for Excellence in the
Teaching of Mathematics and Science, 1996.
Acknowledgements: Excerpts from the Science Content Standards: Reprinted with permission. National Science Education Standards, ©1996 by the National Academy of Sciences, courtesy of the National Academies Press, Washington, DC.
Excerpts from the Standards for School Mathematics: Reprinted with permission. Principles and Standards for School Mathematics, ©2000 by the National Council of Teachers of Mathematics. All rights reserved.
A Note About SafetySafety is of primary concern in science and technology classrooms. It is recommended that you develop a set of rules that governs the safe, proper use of K’NEX in your classroom. Caution students to keep hands, face, hair and clothing away from all moving parts.
www.knexeducat ion.com
WARNING:CHOKING HAZARD – Small parts. Not for children under 3 years.
ATTENTION :RISQUE D’ÉTOUFFEMENT – Pièces de petite taille. Ne convient pas aux enfants de moins de 3 ans.
Education®

Ta
ble o
f Co
nTen
Ts
1
Table of ContentsIntroductIon 2-6
StandardS: MatheMatIcS and ScIence 7-11
ForMatIve aSSeSSMent rubrIcS 12-18
LeSSonS Lab 1: Measurement in 3-D 19-23 Large Roller Coaster with Clothoid Loop
Lab 2: Time-of-Flight 24-28 Inclined Plane I (for a car) OR Inclined Plane II (for a ball) Lab 3: Uniform Acceleration 29-32 Inclined Plane II (for a ball)
Lab 4: Elastic Collision in 2-Dimensions 33-37 Inclined Plane with Circular Loop (for a ball)
Lab 5: Projectile Motion 38-43 Half Pipe System II (for a ball)
Lab 6: Centripetal Force and Acceleration 44-47 Roller Coaster without Loop
Lab 7: Centripetal Force in a Vertical Direction 48-51 Half Pipe System with Loop (for a ball)
Lab 8: Weightiness and Weightlessness 52-55 Gravity-fed Double Hill
Lab 9: Motion in a Clothoid Loop 56-61 Inclined Plane with Clothoid Loop (for a car)
Education®
2
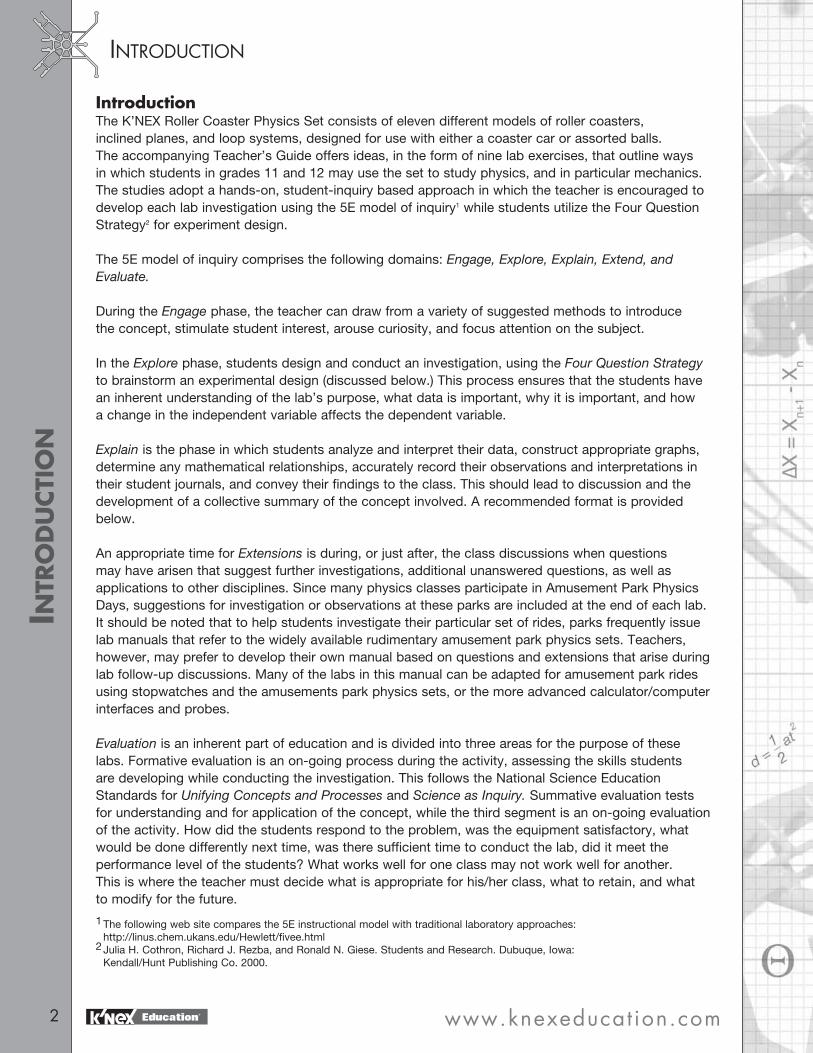
IntroductionThe K’NEX Roller Coaster Physics Set consists of eleven different models of roller coasters, inclined planes, and loop systems, designed for use with either a coaster car or assorted balls. The accompanying Teacher’s Guide offers ideas, in the form of nine lab exercises, that outline ways in which students in grades 11 and 12 may use the set to study physics, and in particular mechanics. The studies adopt a hands-on, student-inquiry based approach in which the teacher is encouraged to develop each lab investigation using the 5E model of inquiry1 while students utilize the Four Question Strategy2 for experiment design.
The 5E model of inquiry comprises the following domains: Engage, Explore, Explain, Extend, and Evaluate.
During the Engage phase, the teacher can draw from a variety of suggested methods to introduce the concept, stimulate student interest, arouse curiosity, and focus attention on the subject.
In the Explore phase, students design and conduct an investigation, using the Four Question Strategy to brainstorm an experimental design (discussed below.) This process ensures that the students have an inherent understanding of the lab’s purpose, what data is important, why it is important, and how a change in the independent variable affects the dependent variable.
Explain is the phase in which students analyze and interpret their data, construct appropriate graphs, determine any mathematical relationships, accurately record their observations and interpretations in their student journals, and convey their findings to the class. This should lead to discussion and the development of a collective summary of the concept involved. A recommended format is provided below.
An appropriate time for Extensions is during, or just after, the class discussions when questions may have arisen that suggest further investigations, additional unanswered questions, as well as applications to other disciplines. Since many physics classes participate in Amusement Park Physics Days, suggestions for investigation or observations at these parks are included at the end of each lab. It should be noted that to help students investigate their particular set of rides, parks frequently issue lab manuals that refer to the widely available rudimentary amusement park physics sets. Teachers, however, may prefer to develop their own manual based on questions and extensions that arise during lab follow-up discussions. Many of the labs in this manual can be adapted for amusement park rides using stopwatches and the amusements park physics sets, or the more advanced calculator/computer interfaces and probes.
Evaluation is an inherent part of education and is divided into three areas for the purpose of these labs. Formative evaluation is an on-going process during the activity, assessing the skills students are developing while conducting the investigation. This follows the National Science Education Standards for Unifying Concepts and Processes and Science as Inquiry. Summative evaluation tests for understanding and for application of the concept, while the third segment is an on-going evaluation of the activity. How did the students respond to the problem, was the equipment satisfactory, what would be done differently next time, was there sufficient time to conduct the lab, did it meet the performance level of the students? What works well for one class may not work well for another. This is where the teacher must decide what is appropriate for his/her class, what to retain, and what to modify for the future.
IntroductIonIn
Tro
du
CTIo
n
1 The following web site compares the 5E instructional model with traditional laboratory approaches: http://linus.chem.ukans.edu/Hewlett/fivee.html 2 Julia H. Cothron, Richard J. Rezba, and Ronald N. Giese. Students and Research. Dubuque, Iowa: Kendall/Hunt Publishing Co. 2000.
www.knexeducat ion.comEducation®

InTr
od
uCTIo
n
3
ObjectivesStudents should be active participants in the educational process. A student-centered classroom is typically more active, more enthusiastic, and produces more results than one that is teacher-directed. The National Education Standards in Science and in Mathematics underpin the structure of the labs in this guide, with the Unifying Concepts and Processes of Science, Science as Inquiry, and Mathematics as a Tool addressed for the 9-12 grade level. For those schools fortunate enough to have appropriate technology, those standards may also be addressed, but are not listed in the guide. Students are also encouraged to keep records of their experiences and to communicate their findings verbally to their peers, thus addressing National Education Standards in Communication.
The students will learn how to design and conduct scientific investigations. They will identify variables of the problem and select appropriate independent and dependent variables for investigations. In groups, or as a class, they will determine the steps necessary to control a variable, observe and record the response, and interpret the results. They will measure, record, and analyze the data for patterns, construct scatter plots or histograms as a graphic representation of the data, and mathematically interpret those graphs. A record of the activity will be kept in a journal and oral presentations will be made for class discussions. Since individual lab groups might be investigating different aspects of the problem, it is important to have each group present its findings to the entire class so that everyone has a clear picture of the concept. This will also allow the teacher to resolve any misinterpretations or misconceptions. A null result is also important in that it eliminates a variable or a dependency of a particular concept, but the teacher should guide the majority of the groups toward valid investigations through probing or leading questions.
The students should also be able to apply the concepts studied in the lab to problem solving. By observing the origin of concepts and how they are affected by different variables, students will have an intuitive understanding of how things behave in a certain set of circumstances. To this end, there is a specific set of outcomes for the study of mechanics. These will range from the simple position of an object with respect to time, to the escape velocity needed for a potential energy well.
Lab GroupsAn ideal size for most lab groups would be four, although it should be noted that each K’NEX Education Roller Coaster Physics set will support six to eight students working collaboratively. The teacher should monitor the groups to guarantee that each student is taking an active part in designing the experiment, conducting the investigation, and collecting and analyzing the data obtained in the lab. Each student should maintain a record of all of the data obtained by the group and should represent that data graphically, where appropriate.
JournalsJournaling is an accepted way of life for scientists and engineers. It is a record of the entire investigatory process, from concept to conclusion. Each time the student makes an entry into the journal, the date and time should be recorded. Nothing should ever be erased from a journal. Rather, errors should simply be crossed out and entries made from that point on. A suggested format follows.
I. EngagEmEnt: The student should make a short note as to what the investigation will be about and how it was introduced. Notes on demonstrations or discrepant events might be of use later.
II. BraInstormIng: Each lab journal should have notes answering the 4 Questions (see below). This is the process by which students gain an understanding of the objective of the lab, what variables are involved, what response they are looking for, and how they intend to measure that response.
IntroductIon
888-ABC-KNEX Education®

4
Q1. What materials are available to study _____? The teacher should display all appropriate materials that are available. From this collection the students will decide how they will continue. Q2. How do(es) _____ behave? From their experiences or from a teacher demonstration, the students should be able to describe characteristics of behavior of _____. Q3. How can the set of _____ materials be changed to affect the action? Students identify independent variables in this step. One variable will be selected for experimentation and the others (constants) will remain unchanged. Q4. How can the response of _____ to the change be measured? Students describe dependent variables that can be observed and measured, decide what data is important to collect, and establish a procedure for measuring it (after obtaining teacher approval.)
III. thE LaB rEport: Before conducting the lab, the student group should decide on a formal Statement of the Problem, Hypothesis, and Procedure. Data should then be collected and observations made, followed by the construction of any suitable graphs. A complete statement of conclusions and observations is very important for class discussion. Explanations and results from other groups should be included. A. Statement of the Problem: To determine the …
B. Hypothesis:
C. Procedure: Step-by-step list of necessary steps to conduct the lab, including what data to collect and what analysis will be anticipated.
D. Data/Observations: Data expressed in table format with proper headings and unit labels. Formulae for any calculated values are given. Observations are recorded in clear and concise sentence form.
E. Conclusions: The verbal and mathematical interpretations of any observations are made, together with notes from other lab groups, and from the teacher, which contribute to the complete description of the scientific concept being investigated.
IV. ExtEnd: Here the student might record applications of the concept, suggestions for further investigations, and applications to Amusement Park Physics.
V. EVaLuatIons: Record or summarize any teacher assessments and list any peer evaluations, if given.
This format ensures that each student will have a complete record of the investigation from conceptualization to conduct, to analysis, and to explanation.
EquipmentA wide range of labs may be conducted using a minimum of equipment. The K’NEX Education Roller Coaster Physics set comprises building materials for eleven different models. The roller coaster models can be built one at a time, while the inclined planes, hills and loop systems can be built two at a time.
Building instructions for the two roller coaster models are provided in a color-coded, printed booklet and on an accompanying CD-ROM. The nine models of inclined planes, hills and loop systems are provided on the CD-ROM. A CD-ROM of building instructions offers the teacher a number of advantages over a printed booklet:
IntroductIonIn
Tro
du
CTIo
n
www.knexeducat ion.comEducation®

IntroductIonIn
Tro
du
CTIon
5
•Teacherscanselectandprintinstructionsforjustthosemodelstheywishtouse.TheCDcontains one set of files for those wishing to print to 8.5” x 11” paper and a second set for those who opt to print to 11” x 17” paper. (Printing on 11” x 17” sized paper is recommended.)
•Multiplecopiesofinstructionscanbeprovided.Thisisparticularlyusefulwhenfourormore students are involved in constructing a large model.
•Instructionscanbedisplayedonacomputerscreenandstudentscanthenbuildthemodelsona table in front of the computer. No hard copies of the instructions are needed.
The building instructions have been designed with the age of the student in mind, incorporating a ‘large build’ rather than a small scale, step-by-step approach. These large build sections have been tested extensively with high school students and areas of potential complexity have been expanded to show the construction in greater detail. Depending on the time available, construction of the models can be accomplished in-class with lab groups designating appropriate sub-assemblies for their members to complete. Alternatively, teachers may wish to have the models built as an out-of-class activity.
In addition to the K’NEX Education Roller Coaster Physics Set your students will need: •Metrictapemeasures,metricrulers(mmdivision),andmetersticks. •Stopwatches,oneortwoperlabgroup,sensitivetoatleast0.1sec.
•Assortedballs,withaminimumdiameterof4.5cm.Suggestionsincludeatennisball,highbounce rubber ball (hollow), super ball (large), wooden ball, pool ball, hard rubber ball (solid), handball, etc.
•Classroomscale(sensitiveto0.01gm),springscales(recordingto100gm.)
•Maskingtape,AAbatteries(ridersforthecoastercar),graphpaper,andlargesheetsofpaper.
Optional equipment to consider: •Asetofelectronicphotogates.Thesewillproduceexcellentresultsandreducestudent frustration. They may be stand-alone items of equipment with numerical displays and gate and pulse functions.
•Datacollectionprobeswithcomputerorcalculatorinterfacesmaybeusedforanyofthelabs,but their use does not guarantee any better results than those obtained from the use of photogates.
•Ifclassroomcomputersareavailable,graphinganddataanalysissoftwarecanbeusedto incorporate technology for solving complex problems. Determining the mathematical function of some graphs is beyond the axis transformation method. The use of this software will introduce students to the way in which technology can tackle such issues. Several companies that manufacture and sell electronic data collection devices provide useful software for this purpose. Any analysis software should have scientific plotting available, as well as curve fitting and formula entry functions.
•Someteachersmayhaveaccesstovideorecordingequipment.Thiscanbeusedtostopmotion by stepping from frame to frame and provides an additional tool for data collection and analysis. There are also some video analysis software programs, which help with the visual analysis.
888-ABC-KNEX Education®

6
AssessmentAssessment in a hands-on, student inquiry based environment focuses on how students manipulate materials, design investigations, establish procedures, make observations, use technology to collect and manipulate data, and present findings in written and verbal formats. It should also evaluate how they are able to apply those concepts to problem solving.
Assessment of the scientific process is an on-going, formative evaluation, summarized in several rubrics provided below. Alternatively, teachers may wish to develop their own rubrics or consult, for example, www.rubristar.4teachers.org.
Summative evaluation is testing for understanding and application of the concept. This usually involves problem solving, essays, or short questions, and is reflected in the objectives of the lab. It may also include an evaluation of the lab report in the student journal and the oral presentation for the class discussion.
Communications and English StandardsThe National Council of Teachers of English has established a set of national standards for communication, literacy, and English. While these lab activities do not directly address the standards, they do utilize Standards 3, 4, 5, 7 and 12 to some extent in journal writing and the presentation of observations and conclusions. Please refer to the National Council of Teachers of English web site at www.ncte.org for further information.
Further Resources American Association for the Advancement of Science. 1994. Benchmarks for Science Literacy. Project 2061. Cary, NC: Oxford University Press. Also available at www.project2061.org/research/goals.htm
Cothron, Julia H., Richard J. Rezba, and Ronald N. Giese. 2000. Students and Research. Dubuque, Iowa: Kendall/Hunt Publishing Co.
National Research Council. 1996. National Science Education Standards. Washington, D.C: National Academy Press.
__________. 2000. Inquiry and the National Science Standards. Washington, D.C: National Academy Press.
Web Sites International Technology Education Association www.iteaconnect.org
National Council of Teachers of English www.ncte.org/about/over/standards
National Council of Teachers of Mathematics www.nctm.org/standards
National Science Teachers Association www.nsta.org/standards
Roller Coasters www.funderstanding.com/k12/coaster
IntroductIonIn
Tro
du
CTIo
n
www.knexeducat ion.comEducation®

StandardSs
Cho
ol M
aTh
eMa
TICs sTa
nd
ard
s
7
I. Numbers and Operations
A. Understanding numbers, ways of representing numbers, relationships among numbers and number systems.
B. Understand meanings of operations and how they relate to one another.
C. Compute fluently and make reasonable estimates.
1. Understand vectors as systems that have some of the properties of real numbers.
1. Develop an understanding of properties of, and representations for, the addition and multiplication of vectors (and matrices).
1. Develop fluency in operations with real numbers, (matrices and) vectors using mental computation or pencil and paper calculations for simple cases and technology for more complicated cases.
schooL mathEmatIcs standards for gradEs 9 - 121
1. Identify essential quantitative relationships in a situation and determine the class or classes of functions that might model the relationship.
2. Draw reasonable conclusions about a situation being modeled.
II. Algebra
A. Understand patterns, relations, and functions.
1. Generalize patterns using explicitly defined (and recursively defined) functions.
2. Analyze functions of one variable by investigating rates of change, intercepts, zeroes, asymptotes, and local and global behavior.
3. Understand and perform transformations such as arithmetically combining, composing, and inverting commonly used functions, using technology to perform such operations on more complicated functions.
4. Understand and compare the properties of classes of functions, including exponential, polynomial, rational, logarithmic, and periodic functions.
5. Interpret representations of functions of two variables.
The following Mathematics* and Science Standards are addressed by the lab activities offered in this teacher’s guide.
1National Council of Teachers of Mathematics. 2000. Principles and Standards for School Mathematics. Reston, VA: NCTM.
B. Use mathematical models to represent and understand quantitative relationships.
888-ABC-KNEX Education®
8
StandardSsC
ho
ol
Ma
TheM
aTI
Cs s
Tan
da
rd
s
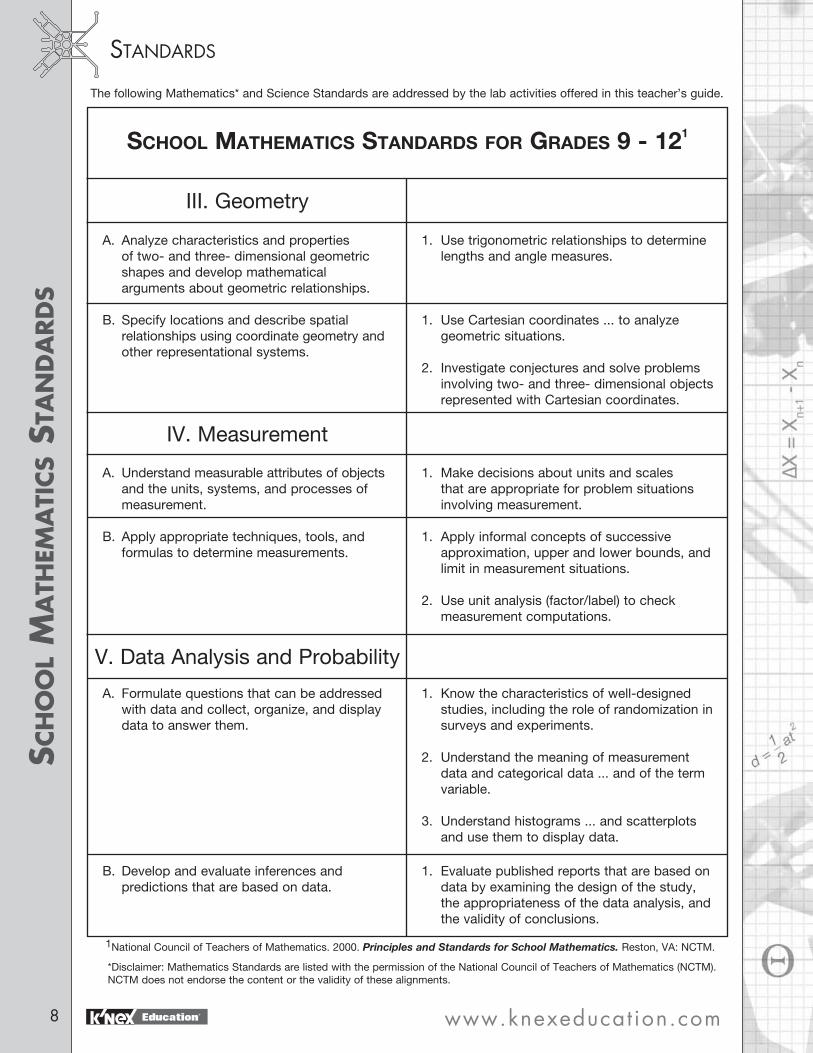
III. Geometry
A. Analyze characteristics and properties of two- and three- dimensional geometric shapes and develop mathematical arguments about geometric relationships.
B. Specify locations and describe spatial relationships using coordinate geometry and other representational systems.
1. Use trigonometric relationships to determine lengths and angle measures.
1. Use Cartesian coordinates ... to analyze geometric situations.
2. Investigate conjectures and solve problems involving two- and three- dimensional objects represented with Cartesian coordinates.
schooL mathEmatIcs standards for gradEs 9 - 121
The following Mathematics* and Science Standards are addressed by the lab activities offered in this teacher’s guide.
1National Council of Teachers of Mathematics. 2000. Principles and Standards for School Mathematics. Reston, VA: NCTM.
IV. Measurement
A. Understand measurable attributes of objects and the units, systems, and processes of measurement.
B. Apply appropriate techniques, tools, and formulas to determine measurements.
1. Make decisions about units and scales that are appropriate for problem situations involving measurement.
1. Apply informal concepts of successive approximation, upper and lower bounds, and limit in measurement situations.
2. Use unit analysis (factor/label) to check measurement computations.
V. Data Analysis and Probability
A. Formulate questions that can be addressed with data and collect, organize, and display data to answer them.
1. Know the characteristics of well-designed studies, including the role of randomization in surveys and experiments.
2. Understand the meaning of measurement data and categorical data ... and of the term variable.
3. Understand histograms ... and scatterplots and use them to display data.
B. Develop and evaluate inferences and predictions that are based on data.
1. Evaluate published reports that are based on data by examining the design of the study, the appropriateness of the data analysis, and the validity of conclusions.
*Disclaimer: Mathematics Standards are listed with the permission of the National Council of Teachers of Mathematics (NCTM). NCTM does not endorse the content or the validity of these alignments.
www.knexeducat ion.comEducation®

II. Guide and facilitate learning. (P. 32) (Standard B)
A. Focus and support inquiries while interacting with students.
B. Orchestrate discourse among students about scientific ideas.
C. Challenge students to accept and share responsibility for their own learning.
D. Encourage and model the skills of scientific inquiry, as well as the curiosity, openness to new ideas and data, and skepticism that characterizes science.
StandardSn
aTIo
na
l sCIen
Ce Tea
ChIn
g sTa
nd
ard
s
9
StandardsI. Plan an inquiry-based science program for their students. (P. 30) (Standard A)
A. Develop a framework of ... short-term goals for students.
B. Select science content and adapt and design curricula to meet the interests, knowledge, understanding, abilities, and experiences of students.
C. Select teaching and assessment strategies that support the development of student understanding and nurture a community of learners.
natIonaL scIEncE tEachIng standards2
2National Research Council. 1996. National Science Education Standards. Washington, DC: National Academy Press.
IV. Design and manage learning environments that provide students with the time, space and resources needed for learning science. (P. 43) (Standard D)
A. Structure time so that students are able to engage in extended activities.
B. Create a setting for student work that is flexible and supportive of scientific inquiry.
C. Ensure a safe working environment.
D. Make the available science tools, materials, media, and technology resources accessible to students.
V. Develop communities of science learners that reflect the intellectual rigor of scientific inquiry and the attitudes and social values conducive to science learning. (P. 45-46) (Standard E)
A. Nurture collaboration among students.
B. Structure and facilitate ongoing formal and informal discussion based on shared understandings of the rules of scientific discourse.
C. Model and emphasize the skills, attitudes, and values of scientific inquiry.
III. Engage in ongoing assessment of their teaching and student learning. (P. 37-38) (Standard C)
A. Use multiple methods and systematically gather data about student understanding and ability.
B. Analyze assessment data to guide teaching.
C. Guide students in self-assessment.
888-ABC-KNEX Education®

10
StandardSn
aTI
on
al
sCIe
nCe
ed
uCa
TIo
n s
Tan
da
rd
s
Standards
I. Unifying Concepts and Processes (P.104) A. Systems, order, and organization.
B. Evidence, models, and explanation.
C. Change, constancy, and measurement.
D. Evolution and equilibrium.
E. Form and function.
natIonaL scIEncE EducatIon standards3
3National Research Council. 1996. National Science Education Standards. Washington, DC: National Academy Press.
Levels 9 - 12
II. Science as Inquiry (P. 173) (Content Standard A – Grades 9-12)
A. Abilities necessary to do scientific inquiry.
1. Identify questions and concepts that guide scientific investigations.
2. Design and conduct scientific investigations.
3. Use technology and mathematics to improve investigations and communication.
4. Formulate and revise scientific explanations using logic and evidence.
5. Recognize and analyze alternative explanations and models.
6. Communicate and defend scientific arguments.
B. Understandings about scientific inquiry.
1. Use conceptual principles and knowledge to guide scientific inquiry.
2. Use tools (technology) to gather and manipulate data.
3. Use mathematical tools and models to guide and improve the posing of questions, gathering of data, constructing explanations, and communicating results.
4. Proposed explanations are logically consistent, abide by the rules of evidence, are open to questions and modification, and are based on historical and current scientific knowledge.
www.knexeducat ion.comEducation®

na
TIon
al s
CIenCe e
du
CaTIo
n sTa
nd
ard
s
11
StandardS
Standards
III. Physical Science (P. 176) (Content Standard B – Grades 9-12)
natIonaL scIEncE EducatIon standards3
3National Research Council. 1996. National Science Education Standards. Washington, DC: National Academy Press.
Levels 9 - 12
A. Structure and properties of matter.
B. Motions and forces.
1. Use laws of motion to calculate precisely the effects of forces on the motion of objects.
C. Conservation of energy and increase in disorder.
D. Interactions of energy and matter.
IV. History and Nature of Science (P. 200) (Content Standard G – Grades 9-12)
A. Science as human endeavor.
1. Recognize that science is done by individuals and teams and that scientists have ethical traditions, value peer review, and are truthful reporting about methods and outcomes of investigations.
B. Nature of scientific knowledge.
1. Recognize that science uses empirical standards, logical arguments, and skepticism.
2. Recognize that scientific explanations must be consistent with experimentation and observation, and must make accurate predications.
C. Historical perspectives.
888-ABC-KNEX Education®

12
rubrIcSfo
rM
aTI
ve
ass
essM
enT
ru
brIC
s
Formative Assessment RubricsSeveral examples of formative assessment rubrics are provided on the following pages. They are assessed at 100 points with scores of 100% for Excellent, 80% for Good, and 60% for Acceptable. The teacher should feel free to assign whatever point value or letter grade they deem suitable for the rubric. In that case, the point values will represent the percentage of the total possible score for the assessment. The percentage values are based on a progression of skills that the student should develop and the relative importance of those skills in science. Not all rubrics need to be used for every lab exercise, but they do reflect statements of the objectives for the lab. If a particular assessment is not to be used, the corresponding objective should be removed from the lesson plan.
www.knexeducat ion.comEducation®

fo
rM
aTIv
e assessM
enT r
ubrICs
13
3
3
3
6
6
3
6
Designing Experiments
Title/Statement of the Problem are complete and clear.
Hypothesis is plausible and clearly stated.
Variables are correctly and completely identified.
There is a good selection for the independent variable.
The selection of dependent variable is proper for the objective of the experiment.
Other variables have been set constant.
Procedures are complete, clear, and in proper order.
Basic Design Percent Excellent Good Acceptable
Percent Excellent Good Acceptable
5
5
5
10
10
5
10
5
5
5
10
10
5
10
4
4
4
8
8
4
8
4Q Strategy
Lists materials that are available for use.
States how objects behave.
Identifies what to observe in experiment.
Clear, concise, and complete method for obtaining data.
10
5
20
15
10
5
20
15
8
4
16
12
6
3
12
9
rubrIcS
888-ABC-KNEX
Education®

14
rubrIcSfo
rM
aTI
ve
ass
essM
enT
ru
brIC
s
Experiment Procedures
Essential steps are listed and are complete.
Material/equipment used is completely listed and/or diagrammed.
The independent and dependent variables have been clearly identified.
The data to be collected supports the variables identified.
There are sufficient repetitions of the experiment to ensure statistical validity.
The report/journal is written in the approved format.
Spelling and grammar are correct, proper, and written in third person neuter.
Procedure Design Percent Excellent Good Acceptable
20
20
20
20
10
5
5
20
20
20
20
10
5
5
16
16
16
16
8
4
4
12
12
12
12
6
3
3
www.knexeducat ion.comEducation®
rubrIcSf
orM
aTIv
e assessM
enT r
ubrICs
15
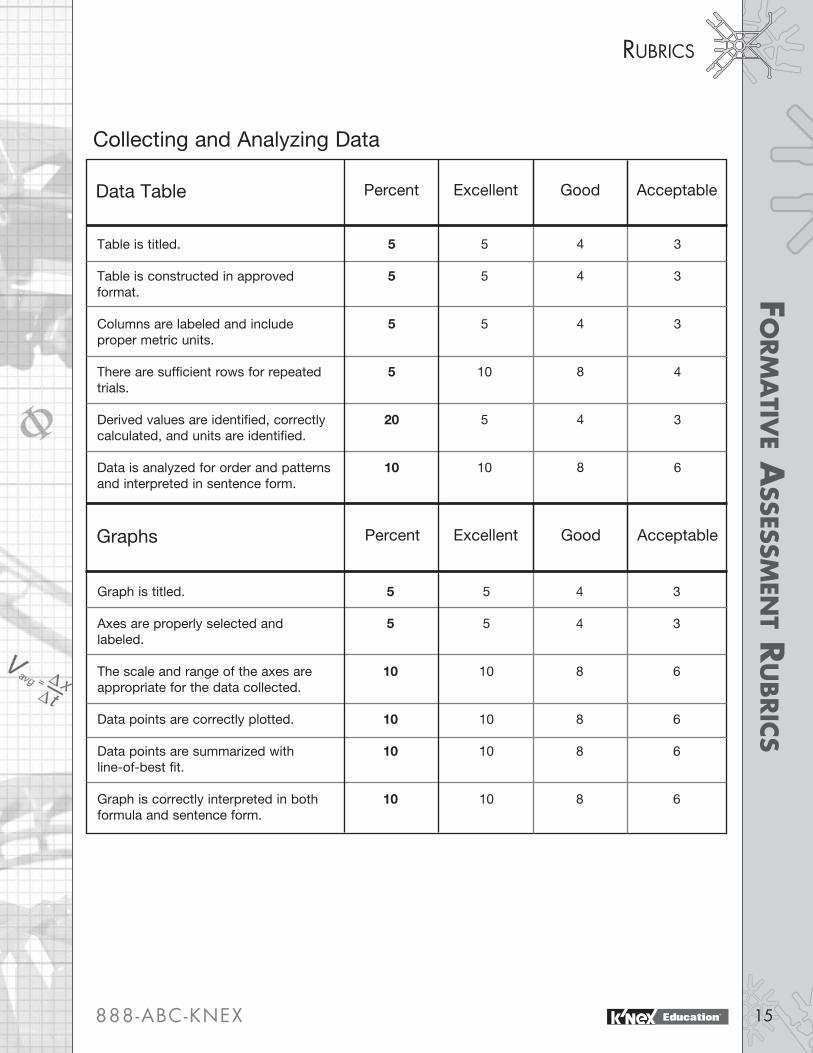
Table is titled.
Table is constructed in approved format.
Columns are labeled and include proper metric units.
There are sufficient rows for repeated trials.
Derived values are identified, correctly calculated, and units are identified.
Data is analyzed for order and patterns and interpreted in sentence form.
5
5
5
5
20
10
5
5
5
10
5
10
4
4
4
8
4
8
3
3
3
4
3
6
Graph is titled.
Axes are properly selected and labeled.
The scale and range of the axes are appropriate for the data collected.
Data points are correctly plotted.
Data points are summarized with line-of-best fit.
Graph is correctly interpreted in both formula and sentence form.
5
5
10
10
10
10
5
5
10
10
10
10
4
4
8
8
8
8
3
3
6
6
6
6
Collecting and Analyzing Data
Data Table Percent Excellent Good Acceptable
Graphs Percent Excellent Good Acceptable
888-ABC-KNEX Education®

16
rubrIcSfo
rM
aTI
ve
ass
essM
enT
ru
brIC
s
Peer Evaluation of Oral Presentation
Title/Statement of the Problem are clearly stated.
The Hypothesis and its rationale are clearly explained.
The variables are clearly identified.
Data is clearly displayed and method of collection is completely described.
Graphs are displayed and clearly explained.
Major observations and interpretations are explained and justified by data and statistical analysis.
Conclusions and extensions are plainly presented.
Peer Review Percent Excellent Good Acceptable
10
10
10
15
15
20
20
10
10
10
15
15
20
20
8
8
8
12
12
16
16
6
6
6
9
9
12
12
www.knexeducat ion.comEducation®

rubrIcSf
orM
aTIv
e assessM
enT r
ubrICs
17
Observations
Students are meticulous in making measurements.
Material, tools, and equipment are properly used in collecting data.
All variables are identified.
Reasonable independent and dependent variables are selected.
The independent variable is manipulated properly.
The response in the dependent variable is correctly observed and measured.
All other variables are held constant with their values and conditions recorded.
Basic Observations Percent Excellent Good Acceptable
15
15
10
10
20
20
10
15
15
10
10
20
20
10
12
12
8
8
16
16
8
9
9
6
6
12
12
6
888-ABC-KNEX Education®

18
rubrIcSfo
rM
aTI
ve
ass
essM
enT
ru
brIC
s
Journals
Title/Statement of the Problem are clearly stated.
The Hypothesis is clearly written.
The variables are clearly identified.
The procedure for conducting the experiment is complete and concise.
Data is clearly displayed and method of collection is completely described.
Graphs are properly constructed, labeled, and analyzed, where appropriate.
Major observations and interpretations are explained and justified by data and statistical analysis.
Conclusions and extensions are plainly presented.
Journal Review Percent Excellent Good Acceptable
5
5
10
10
20
15
20
15
5
5
10
10
20
15
20
15
4
4
8
8
16
12
16
12
3
3
6
6
12
9
12
9
www.knexeducat ion.comEducation®

lab 1
19
Estimated Time (not including construction of model) •3x45/50minuteclassperiods.
ObjectivesThe students will: •Constructa3-dimensionalrollercoaster.
•Identify,measure,andrecordcrucialpoint locations in a 3-dimensional Cartesian coordinate system.
•Calculatethedistancearoundthetrack.
•Measurethedistancearoundthetrack.
•Compareandcontrastcalculatedand measured distances.
•Calculateandmeasureanglesofincline, radii of curves, and banking angles.
•Suggestmethodsforimproving calculations.
•Grapha2-dimensionalprofileofthetrack’s length vs. height.
•Developexperimentaldesigntechniques.
•Developandhoneobservationalskills.
Standards Please refer to Page 7-11 for descriptions of the Standards listed below. Science: IA, IB, IC, IIA(2,3,) IIB(2,3,) IVA1. Mathematics: IIIA, IIIB(1,2,) IVA1, IVB.
Materials Each group will need: •Materialsfrom1K’NEXEducationRoller Coaster Physics Set
•BuildingInstructionBooklet:Pages30-58
•ORBuildingInstructionsCD-ROM–File: Large Roller Coaster with Clothoid Loop
•Metersticks
•Metrictapemeasures
•Protractors
•Largesheetsofbulletinboardpaper
•Ballofstring
•Maskingtape
Each student will need: •Sciencenotebook/journal
•Graphpaper
Preliminary Activities •DiscussionofCartesiancoordinatesin 3-dimensions.
•Discussionofalternatemethodsof mapping in 3-dimensions.
•PythagoreanTheorem.
•Abilitytouseaprotractor.
888-ABC-KNEX Education®
20
LAB 11:
Mea
sureM
enT
In 3
-d
OverviewThis is the first activity in a series of roller coaster labs designed to investigate mechanics and motion in physics. During this activity emphasis should be placed on:
•Establishingamethodfordesigningalaboratoryexercise.
•Establishingcriteriaforwhatmakesagoodobservation.
•Howdatacollectioncanbeimproved.
•Howtomakecarefulmeasurements.
•Howtodrawconclusions.
Points of emphasis can be drawn from scoring rubrics suggested for formative assessments. At this point, however, formative assessment is not recommended. The students should become familiar with the process before they are evaluated.
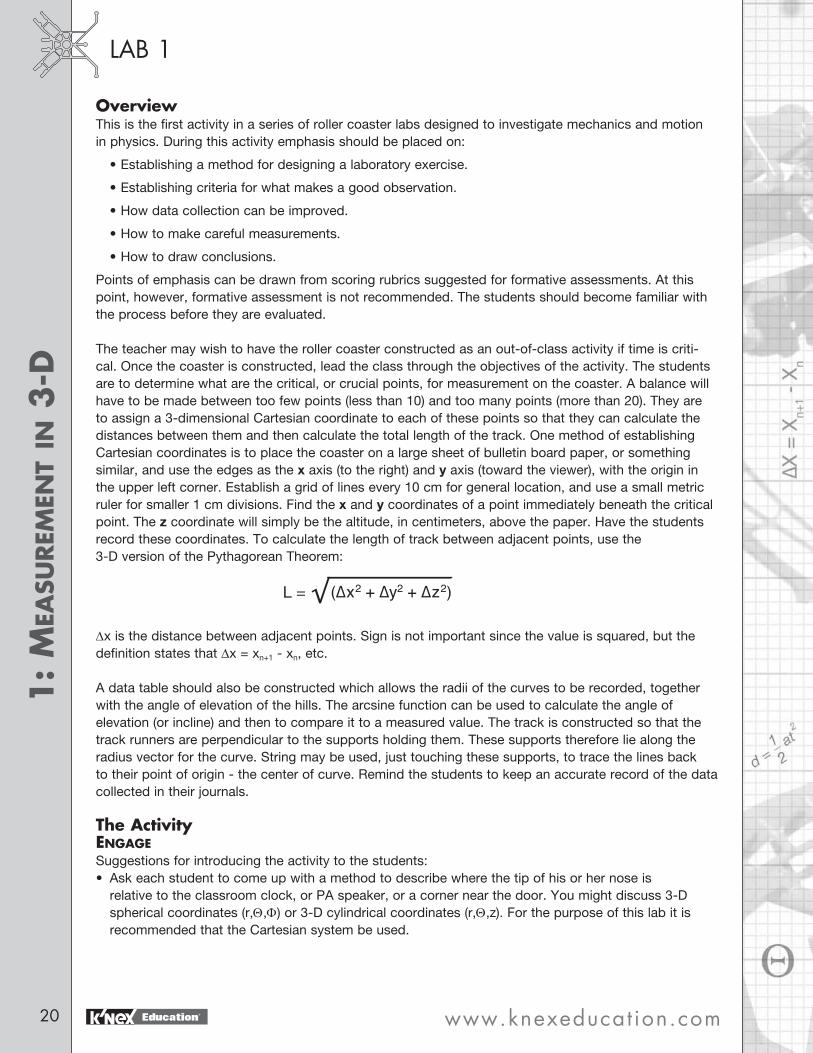
The teacher may wish to have the roller coaster constructed as an out-of-class activity if time is criti-cal. Once the coaster is constructed, lead the class through the objectives of the activity. The students are to determine what are the critical, or crucial points, for measurement on the coaster. A balance will have to be made between too few points (less than 10) and too many points (more than 20). They are to assign a 3-dimensional Cartesian coordinate to each of these points so that they can calculate the distances between them and then calculate the total length of the track. One method of establishing Cartesian coordinates is to place the coaster on a large sheet of bulletin board paper, or something similar, and use the edges as the x axis (to the right) and y axis (toward the viewer), with the origin in the upper left corner. Establish a grid of lines every 10 cm for general location, and use a small metric ruler for smaller 1 cm divisions. Find the x and y coordinates of a point immediately beneath the critical point. The z coordinate will simply be the altitude, in centimeters, above the paper. Have the students record these coordinates. To calculate the length of track between adjacent points, use the 3-D version of the Pythagorean Theorem:
∆x is the distance between adjacent points. Sign is not important since the value is squared, but thedefinition states that ∆x = xn+1 - xn, etc.
A data table should also be constructed which allows the radii of the curves to be recorded, together with the angle of elevation of the hills. The arcsine function can be used to calculate the angle of elevation (or incline) and then to compare it to a measured value. The track is constructed so that the track runners are perpendicular to the supports holding them. These supports therefore lie along the radius vector for the curve. String may be used, just touching these supports, to trace the lines back to their point of origin - the center of curve. Remind the students to keep an accurate record of the data collected in their journals.
The ActivityengageSuggestions for introducing the activity to the students:• Askeachstudenttocomeupwithamethodtodescribewherethetipofhisorhernoseis relative to the classroom clock, or PA speaker, or a corner near the door. You might discuss 3-D spherical coordinates (r,Θ,Φ) or 3-D cylindrical coordinates (r,Θ,z). For the purpose of this lab it is recommended that the Cartesian system be used.
www.knexeducat ion.comEducation®
Lab 11: M
easu
reM
enT In 3
-d
21
• Nowaskstudentshowtheycoulddeterminethedistancefromtheirownnosetosomebodyelse’s nose if they knew the coordinates of each. Extend the 2-D Pythagorean Theorem to 3-D. They are to apply this to points on the roller coaster.
• Iftheclasshasabackgroundintrigonometry,askhowtheymightdeterminetheangleofelevation of the track from the data collected. Θ= invtan(rise / length between two points)
• Challengethestudentstomakecarefulmeasurementsandrecordingsinordertomakefuturelab activities accurate.
Teacher’s NotesThe 4 Question Strategy will be used in the Explore section throughout this guide.
exploreFor this lab only, discuss the following questions as a whole class. Students are encouraged to make notes in their journals.
Q1. What materials are available to measure the K’NEX Education coaster?
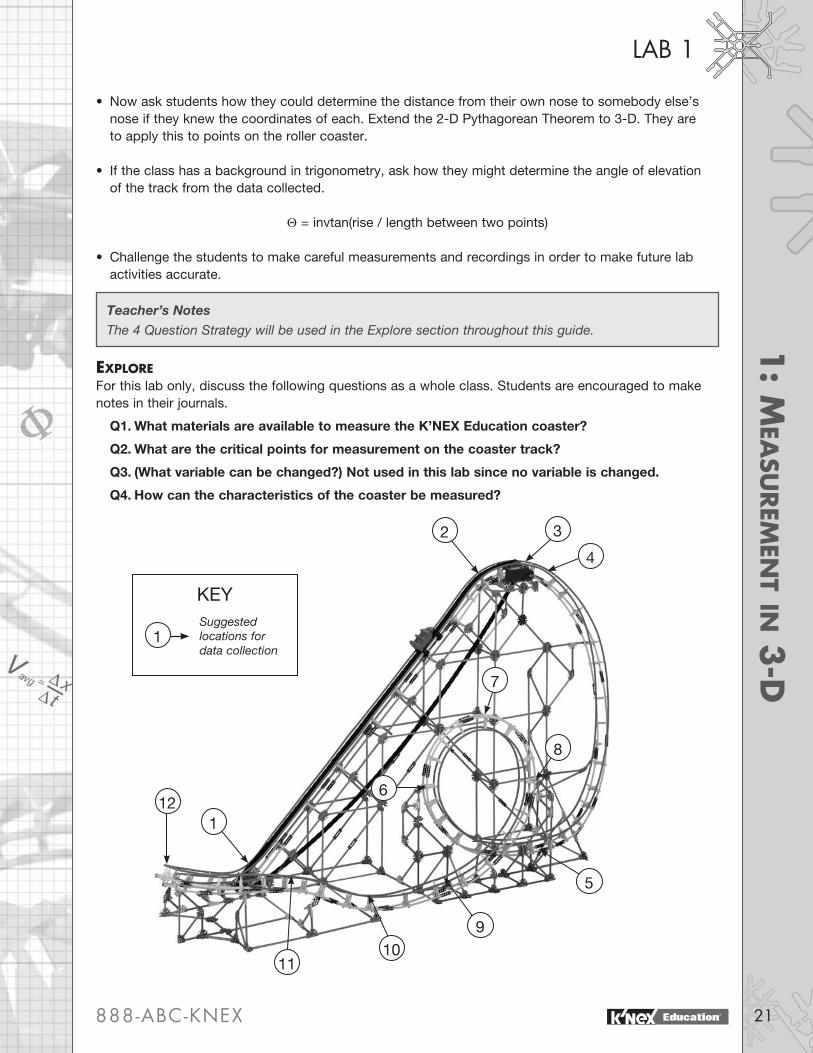
Q2. What are the critical points for measurement on the coaster track?
Q3. (What variable can be changed?) Not used in this lab since no variable is changed.
Q4. How can the characteristics of the coaster be measured?
3
121
2
4
5
6
7
8
910
11
1Suggested locations for data collection
KEY
888-ABC-KNEX Education®

22
Lab 11:
Mea
sureM
enT
In 3
-d• Inindividualjournalsstudentswillwriteaformallabreportthatincludes: Statement of the Problem For example: To determine the coordinates, the segment lengths, total length, radii of curvature, and angles of elevation of the K’NEX Education coaster, and to graph the profile of the coaster’s length vs. corresponding height.
Hypothesis For example: Using 3-D Cartesian coordinates, the Pythagorean Theorem, and basic trigonometric functions, it will be possible to obtain an accurate profile of the K’NEX Education coaster track. Procedures A step-by-step listing of the procedures established by the class.
Data/Observations Example of a data table for this lab:
• Describeotherimportantobservationsandmeasurementssuchasthemethodusedtocalculate the angles of the hills. Drawings and sketches should be encouraged.
• Studentsshouldmakeagraphofthetrackprofile:i.e.thedistancetraveledversustheheightofthe track. Note that the loop will be displayed as a hill. The teacher should provide graph paper for this and it should be taped or stapled into their journals.
www.knexeducat ion.comEducation®

Lab 11: M
easu
reM
enT In 3
-d
23
explaIn • Insmallgroupsthestudentswill:
1. Analyze and summarize their explorations.
2. Record the results in their journals under “Conclusions”.
3. Present their findings, observations, and conclusions to the class for discussion.
• Asaclass,discussthemajormeasurementsandobservations.Pointstoconsiderinclude:
1. How accurate were the calculations of length versus the actual measured values? How could they be improved?
2. How accurate were the calculations for the angles of elevation? How could they be improved?
3. How can accuracy be arrived at with a limited number of data points?
exTend Possible points of extended discussion could include:• Whatexactlyisaclothoidloopandhowdoesitcomparetoacircularloop?Isthereanyhistorical significance to either of these loops?
• WhatformulaewouldbeneededtocalculateLifsphericalorcylindrical3-Dsystemswereused?
• Whatwouldhappentoariderinthecoastercariftherewerenolapbeltorsafetyharness?
• Whatisthespeedofthecararoundthetrack?Doesitvary?Howcoulditbemeasured?
• Amusement Park Physics: What sensations would a rider feel on different parts of the roller coaster? Make a chart of predictions and then compare it to the actual sensations felt on a similar ride at an amusement park. What effect would a ride of this type have on heart rate, or breathing, or on the feeling in the stomach?
evaluaTe Formative• Observationalskillsshouldstarttobedeveloped,butnotnecessarilyevaluatedatthistime. Care and precision in making measurements could be evaluated, as well as participation in group discussion, lab work, and whole class discussion.
SummativeThe student should be able to:
• Measurein3-DCartesiancoordinates.
• Calculatedistancesin2-Dand3-DCartesiansystems.
• Computeanglesofelevationfromheightanddistance,orheightandlength.
Activity• Theteachershouldevaluatetheactivityandmakedecisionsaboutanyfuturemodifications.
888-ABC-KNEX Education®

24
Estimated Time (not including construction of model) •2x45/50minuteclassperiods.
ObjectivesThe students will: •Deriveamethodformeasuringvave.
•Measurevave.
•Developexperimentaldesigntechniques.
•Furtherdevelopobservationalskills.
•Designandconstructadatatable.
Standards Please refer to Pages 7-11 for descriptions of the Standards listed below. Science: IA, IB, IC, IE, IIA(1, 2, 3, 4, 5, 6,) IIB(1, 2, 3,) IVA1, IVB2. Mathematics: IA1, IB1, IC1, IIB1, IVA1, IVB1, VA2.
Materials Each group will need: •Materialsfrom1K’NEXEducationRoller Coaster Physics Set
•BuildingInstructionsCD-ROM–File: Inclined Plane I (for a car) modelOR •BuildingInstructionsCD-ROM–File: Inclined Plane II (for a ball) model
•Rollercoastercarorassortedballs, (minimum of 4.5 cm in diameter)
•Metersticks,metricrulers,ormetrictape measures
•Stopwatchorelectronictiminggates
•Maskingtape
Each student will need: •Sciencenotebook/journal
Preliminary Activities •Discussionofhowtocalculateaverage velocities.
•Familiaritywithkinematicequations.
lab 2
www.knexeducat ion.comEducation®

LAB 22: T
IMe-o
f-flIg
hT
25
OverviewAfter a discussion of how police identify speeding drivers, the teacher should challenge the students to come up with a method of calculating the speed of a coaster car or a rolling ball as it travels down one of the inclined plane systems. If one group of students constructs the ball system and the other group constructs the roller coaster car system, students could complete activities below on both systems to enable a comparison of results. Both inclined plane systems have three different starting heights so that the students can record a variety of speeds after the object has accelerated. It is also important to make a sufficient number of trials so that every member of the group is familiar with how to time the motion and how to calculate the corresponding speed. This method will be used throughout the series. If stopwatches are used, a large enough distance should be allowed between gates so that reaction time is not a significant factor. This is often as much as 0.4 sec +/- 0.05 sec. It is the +/- 0.05 that is important since the reaction times will probably be close at both the start and end of the timing zone. A distance, therefore, of at least 20 cm between gates is recommended. If electronic timing gates are used, it is best to use two photocells, with the recorder in pulse mode. This will allow for refinement of the measurements later.
If time permits, repeat the lab exercise, recording speeds on the inclined portion of the coaster. This will enable students to calculate the vave at the middle of the ramp. Kinematic equations can be used to compute the vf at the bottom of the ramp. Compare this value with the speed measured on the horizontal portion. If the starting speed of the ball or car is zero, the vf will be equal to 2vave. The timing gates should be positioned at the top and bottom of the incline.
Method 1: Stopwatch Identify a reference point at the bottom of the ramp with masking tape, or something similar. Using a single finger or ruler, hold a test ball in place at the top of the inclined plane system for balls. Start the stopwatch at the same time as the ball is released. Stop the stopwatch when the ball passes the marked point at the bottom of the ramp. Repeat several times for each group member. Compare results and discuss possible sources of error or variance. Measure the distance the ball rolls while it is being timed.
Method 2: Electronic Timing Gates Hold a test ball at the top of the ramp. Place the first timing gate just below the ball so that as soon as the ball is released it will trigger the gate. Place the second gate at the bottom of the ramp. Repeat several times for each member of the group to ensure that they are familiar with the equipment and its use. Compare results and discuss possible sources of error or variance. Measure the distance between the timing gates.
Teacher’s NotesIf electronic data collection software is included with your timing gates, refer to the manufacturer’s documentation to determine a strategy that will report student data in a useable form. Instruct the students in the proper use of the electronic hardware and software.
888-ABC-KNEX Education®

26
Lab 22:
TIM
e-o
f-fl
Igh
T
The Activityengage“I was handed a speeding ticket on my way to school today. Has that ever happen to any of you? When I saw the officer, I slowed down immediately, so how did I get caught?” • MostmunicipalitiesusesomethingtheycallVASCAR.Twowhitelinesarepaintedontheroada known distance apart. An officer will time how long it takes a driver to pass between the two lines. If the time is less than the ‘magic’ number, the driver is pulled over. • Trytoduplicatethisinthelab.
exploreIn small groups the students will design the lab exercise by discussing the questions listed below. They should be encouraged to make notes and diagrams in their journals.
Q1. What materials are available to study the speed of a car or ball?
Q2. How does a moving car or ball behave on a flat surface?
Q3. What can be changed to affect the speed of the car or ball?
What can be changed to affect the ∆t of the observation?
Q4. How can the speed of the car or ball be measured?
Timing Gate
Ball
Timing Gate
Startposition
www.knexeducat ion.comEducation®

Lab 22: T
IMe-o
f-flIg
hT
27
Teacher’s NotesIf the Inclined Plane I system (for a car) has been used, there is a horizontal section of the track that can be marked with one point to represent the beginning of the timing sequence and a second point to represent the end of the timing segment.
Conclusions
explaIn• Insmallgroupsthestudentswillanalyzeandsummarizetheirexplorations,recordtheresultsin their journals under “Conclusions,” then present their findings, observations, and conclusions to the class for discussion.
• Asaclass,discussthetechniquesusedtogatherthedata.Howaccurateandconsistentwere the measurements and calculations? What could be done to improve the measurements? What constitutes a sufficient number of data entries? Could this technique be used for accelerated motion? Could it work for vertical circular motion?
888-ABC-KNEX
• Inindividualjournalsstudentswillwriteaformallabreportthatincludes: Statement of the Problem For example: To determine the speed of a ball moving on a horizontal surface at the end of an incline.
Hypothesis For example: The speed of the ball can be determined by the formula vave = ∆x/∆t, where ∆x and ∆t can be physically measured.
Procedures
Data/Observations A sample of a data table: (Students have the ability to change the elevation of the ramp and to construct a data table to record results from one or two additional elevations.)
Education®

28
Lab 22:
TIM
e-o
f-fl
Igh
T
exTendPossible points of extended discussion could include:• Couldthismethodworkforacceleratedmotion?Repeatthelabandmeasurethetimeneeded to accelerate from a standing start to the bottom of the ramp. (In the case of the inclined plane for a coaster car, the bottom of the ramp will correspond to the section of the track where the car begins a horizontal path.) What does the vave measure in this case? Could the final velocity (vf) be calculated and compared to the velocity measured in the lab?
• ∆x is a fairly large distance. If ∆x is allowed to approach a small distance, then vave will approach vinst. This could lead to a discussion of the limit theorem of calculus.
• Amusement Park Physics: What techniques from this lab could be used to estimate or calculate various speeds of rides at an amusement park?
evaluaTeFormative
• 4QStrategy
• Observationalskills
• Experimentaldesign
SummativeThe student should be able to:
• Calculatevave from ∆x and ∆t.
• Describewhatvave measures.
• Explainhowtoobtainvinst.
• Performcalculationswithkinematicequations.
Activity
• Theteachershouldevaluatetheactivityandmakedecisionsaboutanyfuturemodifications.
www.knexeducat ion.comEducation®

lab 3
29
Estimated Time (not including construction of model) •2x45/50min.periods
ObjectivesThe students will: •Measure“time-of-flight.”
•Calculatevf and aave.
•Identifyvariablesofmotiononaninclined plane.
•Designaninvestigationofaccelerationon an inclined plane system.
Standards Please refer to Pages 7-11 for descriptions of the Standards listed below. Science: IA, IB, IC, IIA(1, 2, 3,) IIB(1, 2, 4,) IIIB1. Mathematics: IC1, IIA(1, 5,) IIC2, IVA1, VA(1, 2,) VB.
Materials Each group will need: •Materialsfrom1K’NEXeducationRoller Coaster Physics Set
•BuildingInstructionsCD-ROM–File: Inclined Plane II (for a ball) model
•Metersticksormetrictapemeasures
•Stopwatchesorelectronictiminggatesets
•Protractors
•Ballsofdifferenttypesandsizes(minimum of 4.5 cm in diameter)
Each student will need: •Sciencenotebook/journal
•Graphpaper
Preliminary Activities •Lab2:Time-of-Flight.
•Derivationofkinematicformulas.
•Calculatevf and aave: Measure d and t (from above). Assume vi = 0 Since d = vit + 0 at2
And since vi = 0 Then d = !s at2
2d = at2
Therefore 2d t2
Also d = !s (vi + vf)t And since vi = 0
Therefore vf = 2d t
dt
=vf
a =
2
888-ABC-KNEX Education®
30
LAB 33:
un
Ifo
rM
aCC
eler
aTI
on
OverviewStudents will design and construct their own investigation of uniform acceleration using the K’NEX Education inclined plane ball ramp (Inclined Plane II model.) They will identify variables that could affect the rate of acceleration, select one variable at a time and determine its qualitative and quantitative effect on acceleration. The concepts of initial velocity, final velocity, average velocity, and uniform acceleration can be introduced. Additional discussion might also include mass, gravity, and friction. Students with requisite skills may be able to compare experimental values to theoretical values by using free body diagram analysis of accelerations on an inclined plane.
The Activityengage• Showtheclassavideoofasoapboxderbycar,avideoofaskieronaskijumpacceleratingdowna
hill, or simply a ball as it rolls down a ramp. Follow up by asking: •Whatcausestheaccelerationdowntheslope? •Howcanyouchangetherateofacceleration? •Whatsensationswouldyoufeelifyouwereskiingdownaslopeorridingarollercoasterdown a hill? Why?
explore• Insmallgroupsthestudentswilldesignthelabexercisebydiscussingthefollowingquestions:
Q1. What materials are available to study acceleration?
Teacher’s NotesYou may wish to display the materials you have collected for the students to use after they have brainstormed suggestions on their own.
Q2. How does a rolling ball behave? Make a list of possible variables that could affect the rate of acceleration. Q3. What can be changed? Select an independent variable to control. Possible independent variables the students may suggest include: angle of the ramp, starting position on the ramp, mass of the ball, surface of the ball, size of the ball, etc. Q4. How can the response to the change be measured? Have students determine how they can measure and describe the response to the change they will investigate.
• Inindividualjournalsstudentswillwriteaformallabreportthatincludes:
Statement of the Problem
Hypothesis
Procedures
Data/Observations
Graphs
www.knexeducat ion.comEducation®

Lab 33: u
nIfo
rM
aCCeler
aTIo
n
31
Possible graphs might include:
•vf as a function of angle of elevation
•vf as a function of starting position on ramp
•vf as a function of mass of the ball
•accelerationasafunctionofangleofelevation
•accelerationasafunctionofstartingpositiononramp
•accelerationasafunctionofmassoftheball
explaIn• Insmallgroupsthestudentswillanalyzeandsummarizetheirexplorations,recordtheresults in their journals under “Conclusions,” then present their findings, observations, and conclusions to the class for discussion.
Teacher’s NotesStudents should maintain records of their group discussions, data tables, graphs, results, etc. in their science notebooks/lab journals.
• Studentsshouldbeencouragedto:
•Discusswaysofmeasuringresponsetochangesintheindependentvariable.
•Setupadatatableandrecordinformation.
•Graphtheresultsofthedependentversusindependentvariables.
•Interpretthegraphs.
•Iftimepermits,repeatthelabusingadifferentvariable. • Leadaclassdiscussionofthestudents’outcomesandconclusions.
exTend• Calculatethetheoreticalaccelerationusingfreebodydiagramanalysis.Comparethetheoretical value to your measured value. Is there a difference? If so, what could have caused it? Is there a way you might be able to identify and measure the cause?
• Whatwouldhappeniftheendoftherampwereinclined?
• Whatwouldhappeniftherampwerenotstraightbutbowedorcurved?Wouldtheaverage acceleration be greater, less, or the same?
• Usetherampasasourceofconstantaccelerationandidentifyasmall,horizontalsectionatthe end of the ramp. If this section was elevated and you knew what the final velocity would be, could you predict where the ball would land?
• Amusement Park Physics: What aspects of this lab could be utilized at an amusement park to analyze forces and motion?
888-ABC-KNEX Education®

32
Lab 33:
un
Ifo
rM
aCC
eler
aTI
on
evaluaTe Formative• Actualtime-of-flightisnotthatimportantatthistime,rathertheprocessbywhichthestudent obtained the value should be evaluated. (See the Designing Experiments rubric on Page 13.)
• Theprocessesthestudentsusetoobtainvaluesfordandtandtosolveforvf and aave are important. Depending on the ability level of the class, the students may be given the formulae for vf and aave or the students can offer their own suggestion as to how the values can be determined.
• Observationalskillsshouldbedevelopedandhonedasstudentsprogresstomoredifficultlabsin this guide. Students should be able to describe their observations in well-formed sentences, using appropriate vocabulary.
• Manystudentslacktheskillsandstrategiestodesigninvestigationsontheirown.Thedesignofan investigation will take time to develop, but the student should be able to utilize the structure of the 5E approach to inquiry and the 4 Question Strategy to design an appropriate investigation.
SummativeThe student should be able to:• Solvekinematicmotionproblems.
• Describethemotionofanacceleratedobjectandidentifythefactorsthataffectit.
Activity• Theteachershouldevaluatetheactivityandmakedecisionsaboutanyfuturemodifications.
www.knexeducat ion.comEducation®

lab 4
33
Estimated Time (not including construction of model) •2-3x45/50minuteperiods.
ObjectivesThe students will: •Observeanelasticcollisionin2-dimensions.
•Measuremomentumin2-dimensions.
•Add2-Dvectors.
•Designanexperiment.
•Collectandanalyzedata.
Standards Please refer to Pages 7-11 for descriptions of the Standards listed below. Science: IA, IB, IC, ID, IE, IIA(1, 2, 3, 4, 5, 6,) IIB(1, 2, 3, 4,) IIIA, IIIB1, IIIC, IIID. Mathematics: IA1, IB1, IC1, IIB, IIIA1, IIIB, IVA1, IVB, VA.
Materials Each group will need: •Materialsfrom1K’NEXEducationRoller Coaster Physics Set
•BuildingInstructionsCD-ROM–File: Inclined Plane with Circular Loop (for a ball) model
•Assortedballs(minimumof4.5cmin diameter and of a type that will not break or cause damage upon hitting the floor)
•Electronicphotogatesorstopwatch
•Tapemeasureormetersticks
•Carbonpaperortransferpaper
•Bulletinboardpaper
•Optional:videocamera
•Optional:videoanalysissoftware
Each student will need: •Sciencenotebook/journal
Preliminary Activities •Additionofvectorsin2-Dusing scale drawing.
•Additionofvectorsusingtrigonometry law of sines and law of cosines for honors groups.
•Additionofvectorsusingresolutioninto components for academic groups.
•Momentumchangesinacollision.
888-ABC-KNEX Education®
34
LAB 44
: el
asT
IC C
oll
IsIo
ns
In 2
-dIM
ensI
on
s
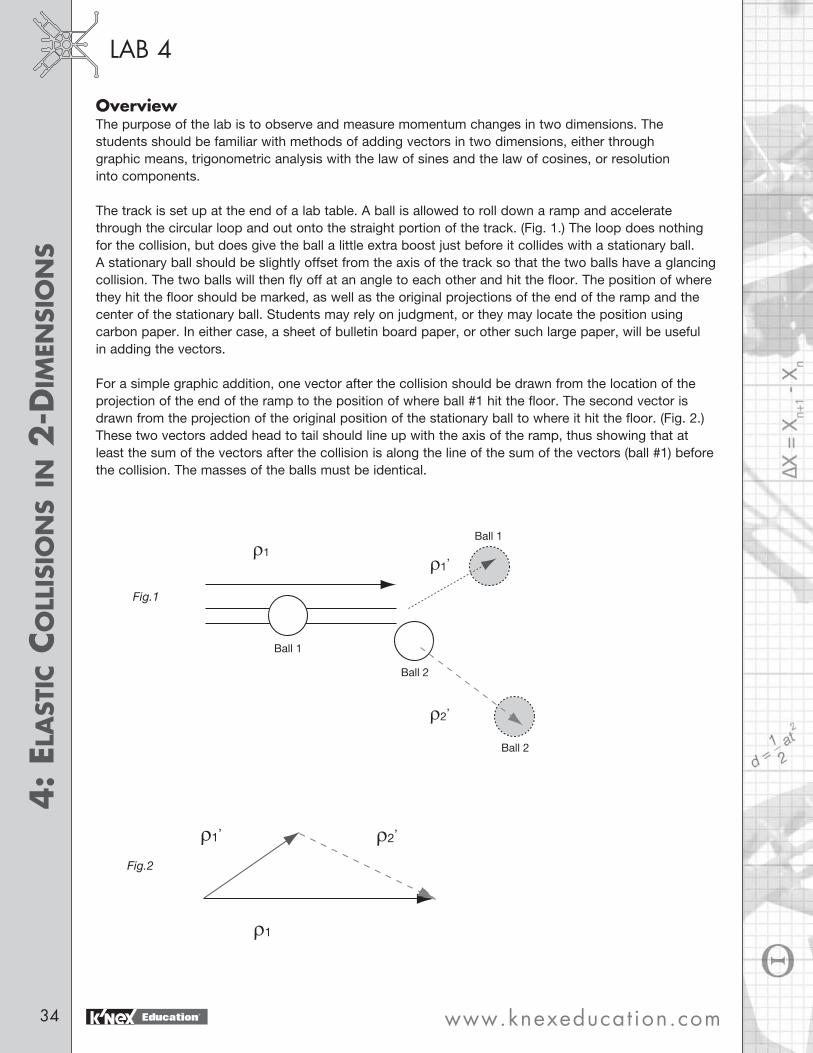
OverviewThe purpose of the lab is to observe and measure momentum changes in two dimensions. The students should be familiar with methods of adding vectors in two dimensions, either through graphic means, trigonometric analysis with the law of sines and the law of cosines, or resolution into components. The track is set up at the end of a lab table. A ball is allowed to roll down a ramp and accelerate through the circular loop and out onto the straight portion of the track. (Fig. 1.) The loop does nothing for the collision, but does give the ball a little extra boost just before it collides with a stationary ball. A stationary ball should be slightly offset from the axis of the track so that the two balls have a glancing collision. The two balls will then fly off at an angle to each other and hit the floor. The position of where they hit the floor should be marked, as well as the original projections of the end of the ramp and the center of the stationary ball. Students may rely on judgment, or they may locate the position using carbon paper. In either case, a sheet of bulletin board paper, or other such large paper, will be useful in adding the vectors.
For a simple graphic addition, one vector after the collision should be drawn from the location of the projection of the end of the ramp to the position of where ball #1 hit the floor. The second vector is drawn from the projection of the original position of the stationary ball to where it hit the floor. (Fig. 2.) These two vectors added head to tail should line up with the axis of the ramp, thus showing that at least the sum of the vectors after the collision is along the line of the sum of the vectors (ball #1) before the collision. The masses of the balls must be identical.
Fig.1
Fig.2
www.knexeducat ion.comEducation®

Lab 44: e
lasTIC C
ollIsIo
ns In 2
-dIM
ensIo
ns
35
For a more detailed analysis the students should measure the individual masses of the balls and calculate the velocity of ball #1 just before the collision. After the collision, the balls will fall to the floor. Since they will be in the air the same amount of time, motion in the vertical direction can be ignored. The individual momenta after the collision can be determined using the following derivation:
ρ = mv
ρ =
and h = vit + !s a∆t2
since vi in the z direction (vertical) = 0 then
h = !s a∆t2
Teacher’s NotesYou may wish to display the materials you have collected for the students to use.
Q2. How do balls in a 2-D collision behave if one ball is initially at rest?
The momentum of the system before the collision is simply the momentum of ball #1, which is mv. Students can use a single timing gate, in gate mode rather than pulse mode, positioned very close to the end of the ramp. The distance to be measured is the diameter of the ball. They should ensure that the photocell is centered on the height of the ball. The momentum of the system before the collision should be equal in magnitude and direction to the momentum of the system after the collision.
If a video camera and either video analysis software or a video player with single step function is available, the collision may be analyzed directly in two dimensions. From an overhead position students can record the collision on a large plane, (such as a large table or the floor,) and analyze. A meter stick may be placed on the floor for exact measurement, or values may be taken from a monitor or screen in scale. Time may be exact if the speed of the camera is known, (often 1/16 or 1/24 of a second), or it may simply be called a “tock.” Students can use a scale drawing to add the vectors and use trigo-nometry methods to verify their results. They may do this trigonometry in groups if they have had expe-rience with the method, or the teacher may undertake this as a demonstration.
The Activityengage• Showvideoclipsoffootballorhockeycollisions,oftenreferredtoas“whooo”hits(whenthecrowd goes “whooo”), or collisions from a demolition derby. An air hockey table could also be used. Ask why the bodies behave the way they do and what are some of the factors governing the physics of the collision.
explore• Insmallgroupsthestudentswilldesignthelabexercisebydiscussingthefollowingquestions:
Q1. What materials are available to study collisions in 2-dimensions?
or
and
md__∆t
888-ABC-KNEX Education®

36
Lab 44
: el
asT
IC C
oll
IsIo
ns
In 2
-dIM
ensI
on
s
Q3. What can be changed to affect the action of the 2-D collisions? Possible independent variables the students may suggest include:
•Angleofinitialcontact
•Massoftheballs
•Lightmasshittingaheaviermass
•Heavymasshittingalightermass
•Initialvelocityofball#1
Q4. How can the response to the change be measured?
•Datatocreateatwo-dimensionalvectoranalysisisneeded.
•Detailedprocedureofhowtoobtainthedataisimportant.
• Inindividualjournalsstudentswillwriteaformallabreporttoinclude: Statement of the Problem Students should now be able to construct their own statement of the problem based on their selection of an appropriate independent variable for experimentation.
Hypothesis Students should be able to formulate an educated guess as to the outcome of their experiment.
Procedures Student groups should decide on the process they will use to measure the response to the variables and list them in detailed step format.
Data/Observations Data should include the masses of the balls, velocity of ball #1, distance and direction traveled of balls #1 and #2, and the height of the table (optional).
Graphs A graphic representation of the vector addition should be included. The group can use the original piece of bulletin board paper for the full-scale addition of the vectors. The trigonometric solution is also suggested.
Conclusions The students should conclude that momentum is conserved in two-dimensional collisions.
explaIn• Insmallgroupsthestudentswillanalyzeandsummarizetheirexplorations,recordtheresultsin their journals under “Conclusions,” then present their findings, observations, and conclusions to the class for discussion.
exTend• Wouldmomentumbeconservedifbothballswereinitiallyinmotion?Trythiswithanairtableand video analysis.
• Wouldthisworkforaninelasticcollisionin2-dimensions?
• Whataboutanexplosionin3-dimensions?
www.knexeducat ion.comEducation®
Lab 44: e
lasTIC C
ollIsIo
ns In 2
-dIM
ensIo
ns
37
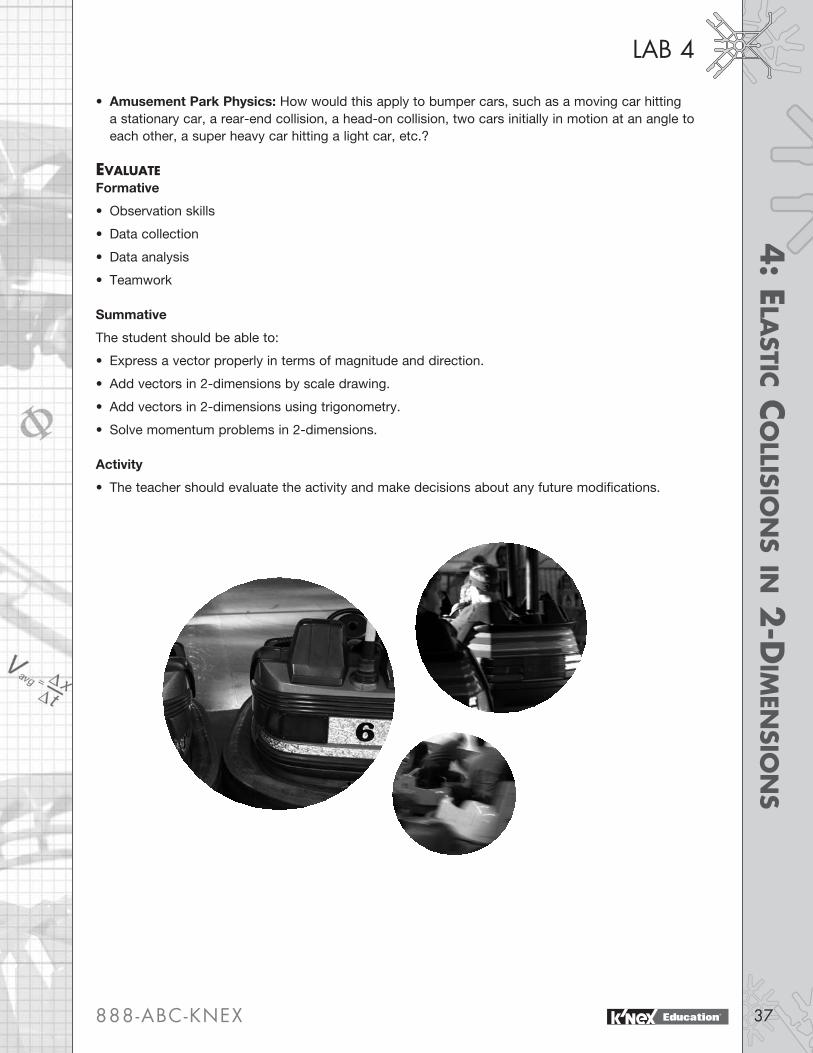
• Amusement Park Physics: How would this apply to bumper cars, such as a moving car hitting a stationary car, a rear-end collision, a head-on collision, two cars initially in motion at an angle to each other, a super heavy car hitting a light car, etc.?
evaluaTe Formative
• Observationskills
• Datacollection
• Dataanalysis
• Teamwork
Summative
The student should be able to:
• Expressavectorproperlyintermsofmagnitudeanddirection.
• Addvectorsin2-dimensionsbyscaledrawing.
• Addvectorsin2-dimensionsusingtrigonometry.
• Solvemomentumproblemsin2-dimensions.
Activity
• Theteachershouldevaluatetheactivityandmakedecisionsaboutanyfuturemodifications.
888-ABC-KNEX Education®

38
Estimated Time (not including construction of model) •2-3x45/50minuteperiods.
ObjectivesThe students will: •Determinehowtheangleofelevationand muzzle velocity affect projectile motion.
•Developequationsfortherange,altitude, and time-of-flight of a projectile.
•Designandconductanexperiment.
•Collectandanalyzedata.
•Makeandinterpretobservations.
•Presentfindingstoajuryofpeers.
Standards Please refer to Pages 7-11 for descriptions of the Standards listed below. Science: IA, IB, IC, ID, IE, IIA(1, 2, 3, 4, 5, 6,) IIB(1, 2, 3, 4,) IIIA, IIIB1, IIID, IVA1, IVB(1, 2,) IVC. Mathematics: IA1, IB1, IC1, IIA1, IIA2, IIB1, IIB2, IIIA1, IIIB, IVA1, IVB, VA1, VA3.
Materials Each group will need: •Materialsfrom1K’NEXEducationRoller Coaster Physics Set
•BuildingInstructionsCD-ROM– File: Half Pipe System II (for a ball)
•Highbounceball(minimumdiameter4.5cm)
•Protractors
•Metricmeasuringtapes
•Carbonpaperandbulletinboardpaper (optional)
Each student will need: •Sciencenotebook/journal
•Graphpaper
Preliminary Activities •Discusswhataprojectileis.
•Discusstheeffectsofgravity.
•Describemotionin2-dimensions.
lab 5
www.knexeducat ion.comEducation®

LAB 55
: pro
jeCTIle Mo
TIon
39
OverviewThe students will study (i) projectile motion in 2-dimensions and (ii) what effects the angle of elevation and muzzle velocity have on the range (X), altitude (Y), and time-of-flight (T) of a projectile. The notes will show a derivation for the x and y Cartesian coordinates at any time (t) and what the maximum range, altitude, and time-of-flight will be for any give set of initial values for Θ and vi. The range of the projectile should be measured, with qualitative observations done on altitude and time-of-flight. These parameters may be studied in greater depth if video analysis equipment is available. The apparatus should be set up as shown in the photo and diagram (Fig. 1 and Fig. 2) with modifications being made to the half-pipe system. It should be truncated about 20cm from the bottom of the valley, but strongly supported. The end of the ramp may be anchored for a constant angle of elevation, or movable for a variable angle of elevation. The teacher should mention that motion in the x direction is not affected by motion in the y direction, but that together they determine the path of the projectile.
After the lab is completed and student findings presented, the teacher may develop the trigonometry functions describing the x and y coordinates, range, altitude, and time-of-flight. The student conclusions should suggest the nature of the trigonometry functions governing projectile flight. As an extension for advanced classes, students may graph the developed trigonometry functions and compare them to data collected.
Set Up GuidelinesFig. 1: Students should modify the half-pipe, removing most of one side and leaving 20 cm extending beyond the bottom of the valley. This should be supported, but should also be flexible in order to provide a variable angle of elevation. Timing gates should be placed at the end of the ramp.
Fig. 2: Θ is the angle of elevation.
888-ABC-KNEX Education®

1. vx = constant since no force acts in the x direction vx = Vi cos Θ vy is accelerated by gravity with the initial velocity vyi = Vi sin Θ or the velocity at any time given by vf = vi + a t vy = Vi sin Θ - g t
2. now x = vx t or
x = Vi (cos Θ) t
since y = vyi t + !s a t2 will become y = Vi sin Θ t – !s g t2 (the negative sign indicates that Vy and g are originally in opposite directions.) y = (Vi sin Θ - g t) t + !s g t2
y = Vi sin Θ t - g t2 + !s g t
y = Vi (sin Θ) t – !s g t2
3. Time-of-Flight (T) y = 0 when t = 0 and when t = T (Cartesian y coordinate), therefore y = V (sin Θ) t – !s g t2
0 = V (sin Θ) T - !s g T2
dividing every term by T yields 0 = V (sin Θ) - !s g T therefore V (sin Θ) = !s g T and so
T = 2 V (sin Θ) / g
4. Range (R) x = maximum x (the range R) when t = T therefore x = V (cos Θ) t or R = V (cos Θ) T R = V (cos Θ) (2 V sin Θ / g) R = 2 V2 sin Θ cos Θ / g but 2 sin Θ cos Θ = sin (2 Θ) resulting in
R = V2 sin (2 Θ) / g
40
Lab 55
: pr
oje
CTIl
e M
oTI
on
www.knexeducat ion.comEducation®
Lab 55
: pro
jeCTIle Mo
TIon
41
These equations will suggest that the maximum range will occur at an angle of 45˚, the maximum altitude will occur at 90˚, and the maximum time-of-flight will also occur at 90˚. There is also symmetry about the 45˚ mark, with 30˚ and 60˚ producing the same range. This does not include friction or the Coriolis Effect.
The Activityengage• Possiblevideoclipstoshowtheclassincludefiringapersonfromacannon,launchingwater balloons, or firing a catapult or trebuchet. Ask the question, “How can I determine where my shot will go? On what does it depend?”
explore• Insmallgroupsthestudentswilldesignthelabexercisebydiscussingthefollowingquestions:
Q1. What materials are available to study projectile motion?
Teacher’s NotesYou may wish to display the materials you have collected for the students to use.
5. Altitude (A) with parabolic symmetry y = A when t = T / 2 now y = V (sin Θ) t – !s g t2 so A = V (sin Θ) (T/2) – !s g (T / 2)2
A = V (sin Θ) T / 2 - g T2 / 8 A = V (sin Θ) 2 V (sin Θ) / 2g - g (4 V2 sin2 Θ ) / 8 g2
A = (V2 sin2 Θ / g) – !s ( V2 sin2 Θ / g)
A = !s (V2 sin2 Θ /g)
Q2. How do projectiles behave? On what factors does range depend? Qualitatively, on what factors do altitude and time-of-flight depend?
•Theymoveincurvedorparabolicarcs.
•Pathsarefairlysymmetrical.
•Theparabolacanbecompletelydescribedbytherange,maximumaltitude,andtime-of-flight.
Q3. What can be changed? Possible independent variables the students may suggest include:
•Angleofelevation.
•Initialvelocityofprojectile.
•Massofprojectile.
Q4. How can the range be measured?
• Inindividualjournalsstudentswillwriteaformallabreporttoinclude: Statement of the Problem Students should now be able to construct their own statement of the problem based on their selection of an appropriate independent variable for experimentation.
Hypothesis Students should be able to formulate an educated guess as to the outcome of their experiment.
888-ABC-KNEX Education®

42
Lab 55
: pr
oje
CTIl
e M
oTI
on
Conclusions Range is similar to a sine function when velocity = constant. Range is similar to a parabola when Θ = constant.
explaIn• Insmallgroupsthestudentswillanalyzeandsummarizetheirexplorations,recordtheresultsin their journals under “Conclusions,” then present their findings, observations, and conclusions to the class for discussion.
exTend• Extendtheconceptstosports.Analyzeparabolicarcsinfootball,basketball,baseball,trackand field. What is the effect of friction? Which sport would be affected the most by friction? Which would be affected the least? Why? • Developthetrigonometryfunctionsdescribingparabolicmotionandanalyzeformaximumvalues of range, altitude, and time-of-flight for a fixed angle and velocity. • Howdoesthisrelatetolong-rangeprojectilessuchasartillery,intercontinentalmissiles,oreventhe launch of the Space Shuttle. What is the Coriolis Force? • Amusement Park Physics: Why is a high arc more likely to win at a “toss-‘em” game than a low arc?
Procedures Student groups should decide on the process they will use to measure the response to the variables and list them in detailed step format.
Data/Observations Data may compare range to angle of elevation, range to initial velocity, or range to mass of projectile. Graphs A graph should reflect data collected and could include:
www.knexeducat ion.comEducation®

Lab 55
: pro
jeCTIle Mo
TIon
43
evaluaTe Formative• 4QuestionStrategy
• Experimentdesign
• Datacollectionandanalysis
• Graphs
• Journals
• Oralpresentations
SummativeThe student should be able to:
• Solveprojectilemotionproblemsgivenvelocityandangleofelevation.
• Describeprojectilemotionintermsofxandycomponents.
• Sketchtheparabolicarcofaprojectile.
Activity• Theteachershouldevaluatetheactivityandmakedecisionsaboutanyfuturemodifications.
888-ABC-KNEX Education®

44
Estimated Time (not including construction of model) •3x45/50minuteperiods.
ObjectivesThe students will: •Describeandmeasurecentripetal acceleration and force.
•Constructavectordiagramoftheacting centripetal acceleration or force.
•Designandconductanexperiment.
•Collectandanalyzedata.
•Makeandinterpretobservations.
•Presentfindingstoajuryofpeers
Standards Please refer to Pages 7-11 for descriptions of the Standards listed below. Science: IA, IB, IC, ID, IE, IIA(1, 2, 3, 4, 5, 6,) IIB(1, 2, 3,) IIIA, IIIB1, IVA1, IVB(1, 2,) IVC. Mathematics: IA1, IB1, IC1, IIB2, III3, IVA1, IVB.
Materials Each group will need: •Materialsfrom1K’NEXEducationRoller Coaster Physics Set
•BuildingInstructionsbooklet:Roller Coaster without Loop model (Pages 4-29)
OR
•BuildingInstructionsCD-ROM– File: Roller Coaster without Loop
•Coastercar
•Electronictiminggatesorstopwatches
•Metricmeasuringtapes,metricrulers,or meter sticks
•String
•Bulletinboardpaper(optional)
Each student will need: •Sciencenotebook/journal
•Graphpaper
Preliminary Activities •Discussionofmomentum.
•Familiaritywithhowtoconstructvector diagrams.
•Discussionofcentrallyactingforces.
•Discussionofcentripetalacceleration.
•Newton’sLawsofMotion.
lab 6
www.knexeducat ion.comEducation®

LAB 66: C
enTr
IpeTal f
orCe a
nd a
CCelera
TIon
45
OverviewFrom Newton’s Second Law of Motion, acceleration will be in the direction of the force that causes it. In each half of the roller coaster’s figure eight there is a force pulling the coaster car to the inside of the circle. The value of the acting centripetal force is given by Fc = mv2 / R or by Fc = (4π2 mR) / T2. Using a photogate set to gate mode, students will calculate the velocity of the car for 6-10 segments of the first half of the figure eight and then for 6 -10 segments for the second half of the figure eight. While the speed of the car is a result of gravity pulling the car down the track, the magnitude of the velocity will determine the size of the centripetal force needed to keep the car moving to the inside of the circle. For any given segment of track, as the velocity decreases, so does the centripetal force necessary for the motion. If the photogate is in gate mode, the distance traveled during the time ∆t is simply the length of the car. If a stopwatch is used, the distance should be as short as can reasonably be timed by the students. This will depend on their reaction times and the speed of the car.
The radius vectors are parallel to the structural pieces holding the track. By placing a string or meter stick next to two support pieces and extending to where they intersect, the average radius between the two can be determined. Rave = (R1 + R2) / 2.
Students can calculate the centripetal force acting and the resultant centripetal acceleration and graph on a profile of the track. An optional method of mapping the coaster is to place a large piece of bulletin board paper under the coaster and then use a plumb bob, from the middle of the track, to draw the track profile. A grid of 10 cm will make mapping easy.
If time permits, the students can recalculate the centripetal force needed for slower moving cars by releasing the car at the middle of the figure eight and comparing the results for the second half of the figure eight to the values computed when the car was traveling at full speed for the same segments. For the same radius of curvature they will see the effect of speed on centripetal force and acceleration.
The Activityengage• Showashortvideoofanobjectmovinginacircle,ordemonstrateswingingabucketorother object in a circle. Ask the students why it does not move in a straight line. Why does it move in a circular path? Wait for an answer that suggests there is a force, continually acting, which is pulling the object toward the center of the circle.
• Describeanddiscusssomeothercentrallyactingforces;i.e.thesunpullingontheearth,theearth pulling on the moon and other satellites, a merry-go-round, a car going around a turn. In each case there is a force causing the object to move in an arc. This force, in turn, causes what is known as centripetal acceleration. While the speed of an object might remain constant, because it is continually changing direction it is undergoing acceleration.
888-ABC-KNEX Education®

46
LAB 66
: Ce
nTr
IpeT
al
forCe
an
d a
CCel
era
TIo
n
explore• Insmallgroupsthestudentswilldesignthelabexercisebydiscussingthefollowingquestions:
Q1. What materials are available to study centrally acting forces and acceleration?
Teacher’s NotesYou may wish to display the materials you have collected for the students to use.
Q2. How do objects traveling in a circular arc behave?
Q3. What can be changed in analyzing circular motion? Since the coaster will run continually, it is best to observe and measure under normal operating circumstances. By taking readings at 6-10 segments in each half of the figure eight, the students will get a good variety of radii and speeds for analysis.
Q4. How can the response to the change be measured? Calculate the centripetal forces acting in several segments by measuring the radius of curvature and speed, configure in a data table, and then draw scale vectors on a profile of the track.
• Inindividualjournalsstudentswillwriteaformallabreporttoinclude: Statement of the Problem Students should now be able to construct their own statement of the problem similar to: How does centripetal force depend on speed and radius of curvature? Hypothesis Students should be able to formulate an educated guess as to the outcome of their experiment. Centripetal force will vary directly with the speed in a segment and inversely with the radius of curvature. Procedures Student groups should decide on the process they will use to measure the response to the variables and list them in detailed step format.
Data/Observations Data should include: mass of the car, ∆x,∆t, v, R, ac, and Fc.
1
2
34
5
6
78
910
11
12
1Suggested locations for data collection
KEY
www.knexeducat ion.comEducation®

Lab 66: C
enTr
IpeTal f
orCe a
nd a
CCelera
TIon
47
Graphs A graph should reflect data collected and could include a scale profile of the track in two dimensions with the corresponding force or acceleration vectors drawn to scale. This will be a map of the force field of the coaster.
Conclusion
explaIn• Insmallgroupsthestudentswillanalyzeandsummarizetheirexplorations,recordtheresultsin their journals under “Conclusions,” then present their findings, observations, and conclusions to the class for discussion.
exTend• Whataretheforcesactingonahigh-speedracecarinatightturn?Whatchangescouldbemadeto the car, the track, or both, to enable the racecar to travel through the curve faster?
• Whydotruckstendtotipoveronsharpturns?Whatchangescouldbemadetotheroadwayto enable the truck to safely pass through the curve?
• Amusement Park Physics: What sensations do you feel on a high-speed coaster when it goes into a turn? How do you explain them? What about your sensations on other rides that move in a circle? Many amusement parks have a ride where you stand against the inside wall of a cylinder. The cylinder spins and then the floor drops away. Why don’t you slide down? Sometimes some people will begin to slide. Why? Why do swing rides swing to the outside? Is there a limit to how great an angle they will achieve?
evaluaTe Formative• 4QuestionStrategy
• Experimentdesign
• Datacollectionandanalysis
• Graphicrepresentationofforcefield
• Journals
• Oralpresentations
SummativeThe student should be able to:
• Solvecentripetalaccelerationproblems.
• Solvecentripetalforceproblems.
• Diagramanddescribetheaccelerationandforcevectorsinvolvedincircularmotion.
Activity• Theteachershouldevaluatetheactivityandmakedecisionsaboutanyfuturemodifications.
888-ABC-KNEX Education®

48
Estimated Time (not including construction of model) •2x45/50minuteperiods.
ObjectivesThe students will: •CalculatetheCentripetalForceatthe6,3, 12, & 9 o’clock positions of a vertical loop.
•CalculatetheNormalForceatthe6,3,12, & 9 o’clock positions of a vertical loop.
•InterpretthemeaningoftheNormalForce acting on a rider in a vertical loop.
•Determinethevelocityneededtoproduce a net force of 0 g at the top of the loop and determine what the corresponding g force at the bottom will be.
•Determinetheminimumvelocityneededto enter and complete a vertical loop.
•Determinewhatinitialvelocityisneededfor the ball to go through the loop twice, once forward and once backward.
•Designandconductanexperiment.
•Collectandanalyzedata.
•Makeandinterpretobservations.
•Presentfindingstoajuryofpeers
Standards Please refer to Pages 7-11 for descriptions of the Standards listed below. Science: IA, IB, IC, ID, IE, IIA(1, 2, 3, 4, 5, 6,) IIB(1, 2, 4,) IIIA, IIIB1, IVA1, IVB(1, 2,) IVC. Mathematics: IA1, IB1, IC1, IIB, IIB2, IIIA, IVA, IVB, VA.
Materials Each group will need: •Materialsfrom1K’NEXEducationRoller Coaster Physics Set
•BuildingInstructionsCD-ROM–File:Half Pipe System with Loop (for a ball)
•Electronicphotogatesorstopwatch.
•Metricrulerortapemeasure.
•Optional:videocamera,playerwithsingle frame advance or video analysis software.
Each student will need: •Sciencenotebook/journal
•Graphpaper
Preliminary Activities •Lab6.
•Discussionofcentripetalacceleration and force.
•Discussionofweightandg forces.
lab 7
www.knexeducat ion.comEducation®

LAB 77: C
enTr
IpeTal f
orCe In Th
e ver
TICal d
IreCTIo
n
49
OverviewThis lab will demonstrate the concept of a Normal Force. The definition of a Normal Force is that force which presses two surfaces together. Sitting on a chair, without it moving or accelerating, we are aware of our own weight by the force the chair exerts in an upward direction. For this situation, the Normal Force FN = - Fg. To find the FN in a vertical acceleration we must also consider the centripetal force of the loop. At the top of the loop, gravity is pulling us down, away from the seat of a coaster car, but the coaster car is accelerating down due to the centripetal force. We are accelerating down and the coast-er car is accelerating down. If they accelerate at the same rate, we would not be aware of the car’s seat pushing on us. Therefore, the force that we would feel, FN, is equal to the vector sum of Fa and –Fg;FN = (-Fa – (-Fg)) (Fa is negative because it is directed down.) If the centripetal acceleration is equal to the acceleration of gravity, then the force we would feel at the top is 0 g. At the bottom of the loop gravity is pulling us down, so we would feel the force of the seat as normal. But the coaster car is also being pulled toward the center of the loop by a force Fc. This would be an added force that we would sense. If the centripetal acceleration were again equal to the acceleration of gravity, the Normal Force experienced at the bottom of the loop would be 2 g;i.e.FN = (Fa — (-Fg)). (Fa is positive because it is directed upward.) To find the Normal Forces at the 3 and 9 o’clock positions, a vector addition in 2 dimensions must be done. It would also be beneficial to determine the velocities at these positions since this is where the maximum change in velocity with respect to gravity will occur. Many people consider these points to be the positions of “maximum thrill” on a coaster loop. A discussion of “why” would certainly be in order, as well as discussions of other ride sensations for the 6, 3, 12, & 9 o’clock positions. It is also important to determine a relationship as to how high above the loop the ball must start in order to just make it through the loop. This should be expressed in terms of radius of the loop, given that the loop is 2 radii high. This will be addressed in a later lab (Lab 9) when a circular loop is compared to a clothoid loop.
The Activityengage• Showavideoclipofastronautstraininginthe“VomitComet,”orapilotinajetfighterplane undertaking a high-speed turn.
• Askthestudents,“Whatisag force? What is weightlessness? Have any of you ever experienced weightlessness? Describe the sensation. What were the circumstances? Were you really weightless? What do you feel in a high-speed elevator going down? … Going up? How do you account for the sensation?”
• TrytoarriveatadefinitionforNormalForceas: that force that we sense on our bodies as a result of all the forces acting on it. Relate the sensations to a roller coaster with a vertical loop and ask the students what they have experienced.
• Developthequestionsforthelabandchallengethemtofindvaluesforvelocity,acceleration,and force at the 6, 3, 12, & 9 o’clock positions for a circular loop coaster.
explore• Insmallgroupsthestudentswilldesignthelabexercisebydiscussingthefollowingquestions:
Q1. What materials are available to study vertical acceleration and force?
888-ABC-KNEX Education®

50
LAB 77
: Ce
nTr
IpeT
al
forCe
In T
he
ver
TICa
l d
IreC
TIo
n
Q2. How do balls moving in a vertical circular loop behave?
Q3. What is Fc at 6, 3, 12, & 9 o’clock positions? What is FN at the same locations? What initial velocity is needed to produce 0 g at the top of the loop? What initial velocity is needed to produce 2 g at the bottom of the loop? What initial velocity is needed to traverse the loop twice? What is the minimum height needed for a starting point for the ball to just make it through the loop?
Q4. How can the response be measured? For a given starting position on the incline, record the time needed to traverse a distance ∆x at the 6, 3, 12, & 9 o’clock positions. ∆x should be centered on the clock positions with equal distance above and below, or left and right, of the mark. Keep the distance to a minimum. If electronic photogates are used, place them in gate mode and use the diameter of the ball as the distance ∆x. Fc will change because v is changing. Calculate Fc and FN for these locations.
• Inindividualjournalsstudentswillwriteaformallabreporttoinclude: Statement of the Problem Students should now be able to construct their own statement of the problem based on their selection of an appropriate independent variable for experimentation.
Hypothesis Students should be able to formulate an educated guess as to the outcome of their experiment. Procedures Student groups should decide on the process they will use to measure the response to the variables and list them in detailed step format.
Data/Observations Graphs Vector diagrams showing the solution for the Normal Forces should be included. Conclusions Among other values and conclusions, the students should verify that the ball must start at least 2.5 radii above the bottom of the loop in order to complete the loop.
explaIn• Insmallgroupsthestudentswillanalyzeandsummarizetheirexplorations,recordtheresultsin their journals under “Conclusions,” then present their findings, observations, and conclusions to the class for discussion.
exTend• Whatareg forces? Simply, the force divided by 9.8 N, resulting in multiples of the force due to gravity.
• Wheremightyouexperienceg forces?
Teacher’s NotesYou may wish to display the materials you have collected for the students to use.
www.knexeducat ion.comEducation®

Lab 77: C
enTr
IpeTal f
orCe In Th
e ver
TICal d
IreCTIo
n
51
• Howmanyg forces can the body take before it blacks out? How do fighter pilots know when they are approaching the maximum g forces that they can handle?
• Amusement Park Physics: Coasters are designed for maximum accelerations. Where are the major accelerations of your favorite coaster? Does high speed necessarily mean high acceleration? Compare and contrast the forces you feel on a wooden coaster with those you feel on a steel coaster. evaluaTe Formative• 4QuestionStrategy
• Experimentdesign
• Datacollectionandanalysis
• Graphs
• Journals
• Oralpresentations
SummativeThe student should be able to:
• DefinetheNormalForce.
• Solveforcentripetalaccelerationandforceinverticalcircularmotion.
• SolveforNormalForceatquadrantpositionsonaverticalcircle.
• Determineconditionsnecessarytoproduce0 g in vertical circular motion.
• Constructafreebodydiagramofforcesactingonanobjectmovinginaverticalcircle.
Activity• Theteachershouldevaluatetheactivityandmakedecisionsaboutanyfuturemodifications.
888-ABC-KNEX Education®

52
Estimated Time (not including construction of model) •2x45/50minuteperiods.
ObjectivesThe students will: •Relatetheportionsofthegravity-fed double hill coaster to circles in order to analyze motion.
•Observetheeffectsofcentripetal acceleration and centripetal force in vertical loops with the use of an accelerometer.
•Designandconductanexperiment.
•Collectandanalyzedata.
•Makeandinterpretobservations.
•Presentfindingstoajuryofpeers.
Standards Please refer to Pages 7-11 for descriptions of the Standards listed below. Science: IA, IB, IC, ID, IE, IIA(1,2, 3, 4, 5, 6), IIB(1,2, 3, 4), IIIA, IIIB1, IVA1, IVB(1,2). Mathematics: IA1, IB1, IC1, IIB, IIB2, IIIA, IVA1, IVB1.
Materials Each group will need: •Materialsfrom1K’NEXEducationRoller Coaster Physics Set
•BuildingInstructionsCD-ROM–File: Gravity-fed Double Hill
•Accelerometerandappropriaterecording device
•Dataanalysissoftware
•AAbattery“riders”
Each student will need: •Sciencenotebook/journal
•Graphpaper
Preliminary Activities •Lab7.
•Familiaritywiththeuseofprobesand analysis software.
Set Up Guidelines
5
3
4 2
1
1Suggested locations for data collection
KEY
lab 8
www.knexeducat ion.comEducation®
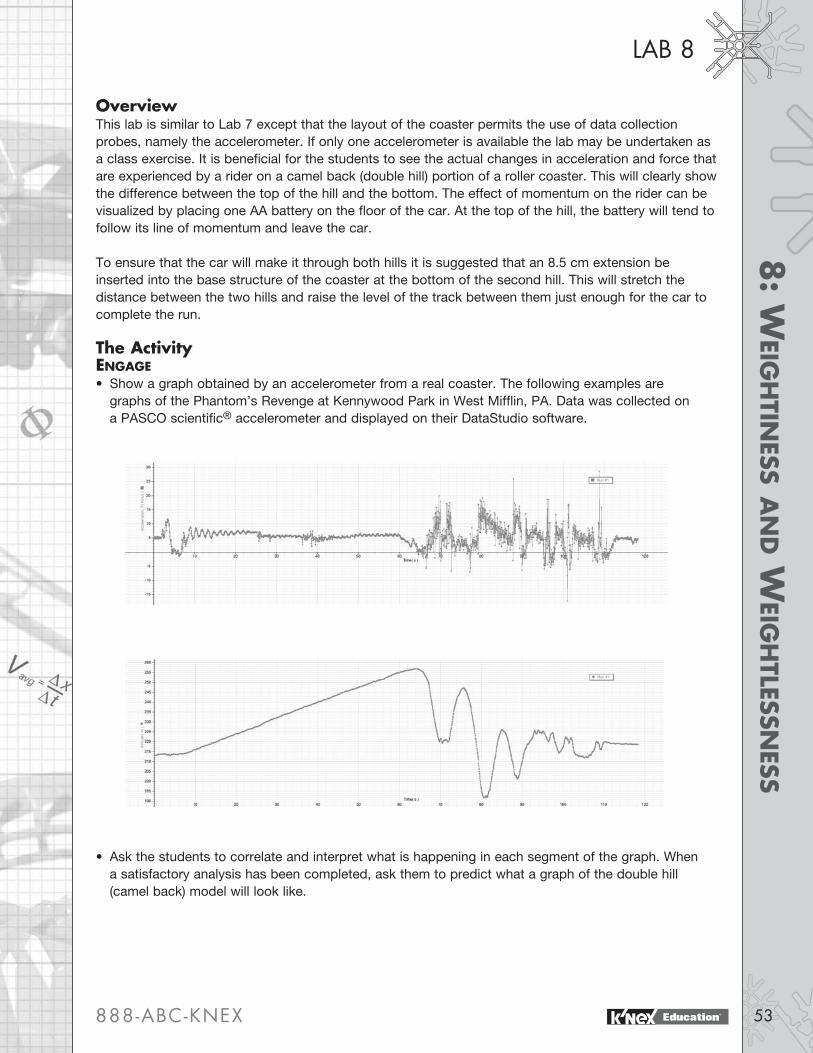
LAB 88: W
eIgh
TIness a
nd W
eIgh
Tlessness
53
OverviewThis lab is similar to Lab 7 except that the layout of the coaster permits the use of data collection probes, namely the accelerometer. If only one accelerometer is available the lab may be undertaken as a class exercise. It is beneficial for the students to see the actual changes in acceleration and force that are experienced by a rider on a camel back (double hill) portion of a roller coaster. This will clearly show the difference between the top of the hill and the bottom. The effect of momentum on the rider can be visualized by placing one AA battery on the floor of the car. At the top of the hill, the battery will tend to follow its line of momentum and leave the car.
To ensure that the car will make it through both hills it is suggested that an 8.5 cm extension be inserted into the base structure of the coaster at the bottom of the second hill. This will stretch the distance between the two hills and raise the level of the track between them just enough for the car to complete the run. The Activityengage• Showagraphobtainedbyanaccelerometerfromarealcoaster.Thefollowingexamplesare graphs of the Phantom’s Revenge at Kennywood Park in West Mifflin, PA. Data was collected on a PASCO scientific® accelerometer and displayed on their DataStudio software.
• Askthestudentstocorrelateandinterpretwhatishappeningineachsegmentofthegraph.When a satisfactory analysis has been completed, ask them to predict what a graph of the double hill (camel back) model will look like.
888-ABC-KNEX Education®

54
LAB 88
: W
eIg
hTI
nes
s a
nd W
eIg
hTl
essn
ess
explore• Insmallgroupsthestudentswilldesignthelabexercisebydiscussingthefollowingquestions:
Q1. What materials are available to study accelerated motion on a camel back (double hill) portion of a coaster?
Teacher’s NotesYou may wish to display the materials you have collected for the students to use.
Q2. How does a roller coaster car moving through the camel back hill behave?
Q3. What does a rider experience in various portions of the camel back hill?
Q4. How can the physiological response be measured?
• Inindividualjournalsstudentswillwriteaformallabreporttoinclude: Statement of the Problem Students should now be able to construct their own statement of the problem. Hypothesis Students should be able to formulate an educated guess as to the outcome of their experiment. Procedures Student groups should decide on the process they will use to measure the response to the variables and list them in detailed step format.
Data/Observations Graphs A sketch of the data collected by the accelerometer should be made with notations added about acceleration or g forces.
Conclusions
explaIn• Insmallgroupsthestudentswillanalyzeandsummarizetheirexplorations,recordtheresultsin their journals under “Conclusions,” then present their findings, observations, and conclusions to the class for discussion.
exTend• Askthestudentshowtheymightconstructanon-electronicaccelerometer.Underwhat circumstances would it be effective? How might they obtain data from it? (A simple example is a pendulum. Suspended from the mirror of a car, it clearly demonstrates acceleration of the car. Also consider the astrolabe-accelerometers in most ‘amusement park physics’ sets.)
• Amusement Park Physics: How could an accelerometer be used on a real coaster, or any other amusement park ride? How would the data be interpreted?
www.knexeducat ion.comEducation®

Lab 88: W
eIgh
TIness a
nd W
eIgh
Tlessness
55
evaluaTe Formative• 4QuestionStrategy
• Experimentdesign
• Datacollectionandanalysis
• Graphs
• Journals
SummativeThe student should be able to:
• Readandanalyzeagraphofacceleratedmotionobtainedwithanaccelerometer.
Activity• Theteachershouldevaluatetheactivityandmakedecisionsaboutanyfuturemodifications.
Photograph by arrangement with Six Flags Great Adventure, Jackson, NJ. All rights reserved.
888-ABC-KNEX Education®

56
Estimated Time (not including construction of model) •2-3x45/50minuteperiods.
ObjectivesThe students will: •Observemotioninaclothoidloop.
•Determinetheminimumheightofadropin order for a coaster to complete a clothoid loop and express that height in terms of loop radii.
•Compareandcontrastaclothoidloop design with that of a circular loop.
•Determinetheg forces at the bottom of the loop for a corresponding 0 g sensation at the top of the loop.
•Comparethemaximumg forces of a clothoid loop to those of a circular loop.
•Designandconductanexperiment.
•Collectandanalyzedata.
•Makeandinterpretobservations.
•Presentfindingstoajuryofpeers
Standards Please refer to Pages 7-11 for descriptions of the Standards listed below. Science: IA, IB, IC, ID, IE, IIA(1, 2, 3, 4, 5, 6), IIB(1, 2, 3, 4), IIIA, IIIB1, IIIC, IIID, IVA1, IVB(1, 2), IVC. Mathematics: IA1, IB1, IC1, IIA2, IIB2, IIIA, IVA1, IVB, VB1.
Materials Each group will need: •Materialsfrom1K’NEXEducationRoller Coaster Physics Set
•BuildingInstructionsCD-ROM–File: Inclined Plane with Clothoid Loop (for a car)
•Stopwatchorelectronicphotogates
•Metersticks,metricrulers,ormetrictape measure
•Scalesensitiveto0.1grams.
Each student will need: •Sciencenotebook/journal
•Graphpaper
Preliminary Activities •Lab7.
•Discussionofenergy.
•Discussionofg forces.
lab 9
www.knexeducat ion.comEducation®
LAB 99: M
oTIo
n In a Clo
Tho
Id loo
p
57
OverviewA clothoid loop is also known as Euler’s Spiral or Cornu’s spiral. It is a loop in which the radius is continually decreasing at a constant rate. The formulae1 may be expressed several ways.
1Encyclopedia Britannica. 15th ed., Vol 7: 1090. Chicago, Illinois: Encyclopedia Britannica, Inc. 1975.
Teacher’s NotesYou may wish to display the materials you have collected for the students to use.
Q2. How do cars in a clothoid loop behave? What entry speed is necessary in order to just complete the loop? How high above the bottom of the loop must the car start in order to just complete the loop?
Q3. What can be changed? Possible independent variables the students may suggest include:
•Thestartingpointontheincline.
•Themassofthecarandriders.
This can also be expressed as ∆R / ∆Θ = Constant or dR / dΘ = Constant
For an analysis of a clothoid coaster, the loop can be considered to be an intersection of a small circle for the top of the loop and two large circles for the bottom of the loop. (See Fig.1 on Page 61 for an approximation of this.) The velocity of the coaster car decreases as it approaches the top of the loop. Since, however, R also decreases, the centripetal force needed to provide a 0 g experience at the top of the loop is less than that of a circular coaster. This means that the corresponding centripetal force and g force at the bottom of the loop will be less, thereby imparting smaller g forces on the riders. A detailed derivation of the loop development, g forces experienced, and the height of the drop needed to produce those effects is provided on Page 59. For the purpose of the lab, the student should realize that the speed needed to complete a clothoid loop is smaller than that needed for a circular loop. The same weightless feeling can be experienced at the top of the loop, but with less dangerous g forces at the bottom. The height necessary to complete a clothoid loop is 2.33 radii above the bottom of the clothoid loop, while for a circular loop it is 2.5 radii above the bottom. The height of the loop in both cases is 2 radii. For a 0 g sensation at the top of each loop, the clothoid loop will produce a centripetal force of 3.5 g at the bottom. Combined with a 1 g gravitational force, the Normal Force exerted on the rider is 4.5 g. The circular loop will produce 5.0 g of centripetal force at the bottom. Combined with 1 g of gravitational force, its Normal Force will be 6.0 g. The Activityengage• Showavideoclipofaclothoidloopcoaster.Discussitsshape.Askthestudentsiftheycanfind the force at the bottom of the loop when a 0 g force is experienced at the top. How high above the loop must the car start in order to complete the loop?
explore• Insmallgroupsthestudentswilldesignthelabexercisebydiscussingthefollowingquestions:
Q1. What materials are available to study clothoid loop coasters?
888-ABC-KNEX Education®

58
LAB 99
: M
oTI
on In
a C
loTh
oId
lo
op
Q4. How can the response to the change be measured?
• Inindividualjournalsstudentswillwriteaformallabreporttoinclude: Statement of the Problem Students should now be able to construct their own statement of the problem based on their selection of an appropriate independent variable for experimentation. Hypothesis Students should be able to formulate an educated guess as to the outcome of their experiment. Procedures Student groups should decide on the process they will use to measure the response to the variables and list them in detailed step format.
Data/Observations Graphs A graph of the approximation of the clothoid loop, together with the derivations, might be included after the lab has been discussed.
Conclusions The car must start at least 2.33 radii above the bottom of the loop. The top of the loop is 2 radii high. Neglecting friction, this should allow the car to complete the loop. Anything lower will not make it through the loop and anything higher will not produce a 0 g sensation.
explaIn• Insmallgroupsthestudentswillanalyzeandsummarizetheirexplorations,recordtheresultsin their journals under “Conclusions,” then present their findings, observations, and conclusions to the class for discussion.
exTend• Whataretheforcesafighterpilotexperiences?
• Whatisag suit and how does it work?
• Whatarethelimitsofg forces that the human body can withstand?
• Amusement Park Physics: What physical sensations do you feel on a clothoid coaster? If a coaster with a circular loop portion is available, compare the forces felt at the bottom of the loops. What is the greatest number of inversions of any coaster? Why have most of the circular loops disappeared? What does the future of coaster design suggest?
www.knexeducat ion.comEducation®

Lab 99: M
oTIo
n In a Clo
Tho
Id loo
p
59
evaluaTe Formative• 4QuestionStrategy
• Experimentdesign
• Datacollectionandanalysis
• Graphs
• Journals
•Oralpresentations
SummativeThe student should be able to:
• Describethestructureofaclothoidloop.
• SolvefortheNormalForcesatthetopandbottomofaclothoidloop.
• Solveforthevelocityneededtoproducea0g sensation at the top of a clothoid and circular loop.
Activity• Theteachershouldevaluatetheactivityandmakedecisionsaboutanyfuturemodifications.
The Clothoid LoopThe approximation of the clothoid loop is described in Fig. 1 below. The total height of the loop is 2R. It is approximated by the intersection of a small circle of radius @d R and two larger circles with radii of $d R. The center of the overlapping circles is $d R above the bottom of the loop. The smaller circle is centered at (0, $d R) and the larger circles are centered at (- @d R, $d R) and (+ @d R, $d R).
For a 0 g sensation at the top of either the clothoid loop or the circular loop, the centripetal force must equal the gravitational force (see Lab 7). Therefore:
Fc = Fg Fc = mg
Fc = mv2 / R which for the smaller circle on the top of the loop becomes
Fc = mv2 / ( @d R) or
Fc = #s mv2 / R but
Fc = Fg therefore
mg = #s (mv2 / R) or
v2 = @d (gR)
Now KE is needed to continue through the loop. This KE comes from the PE lost by the car dropping from some point above the top of the loop. Therefore:
mg∆h = !s mv2 mg∆h = !s m ( @d (gR)) or ∆h = !d R above the top of the loop or
∆h = 2.33 R above the bottom of the loop.
888-ABC-KNEX Education®

60
Lab 99
: M
oTI
on In
a C
loTh
oId
lo
op
The corresponding Fc at the bottom of the loop will be determined by:
PE = KE
mg∆h = !s mv2
mg ( &d ) = !s mv2 and
v2 ( AeF (gR)) therefore
Fc = mv2 but R for the larger bottom circle ( $d R) so R
Fc = m( AeF (gR)) / ( $d R)
Fc = ArF (mg) or
Fc = 3.5 g
Combined with 1g due to weight and the Normal Force at the bottom is
FN = Fc + Fg = 3.5 g + 1.0 g = 4.5 g
For a circular loop of the same height and with a 0 g sensation at the top of the loop: Fc = mg mv2 = mg R v2 = gR The KE needed to get through the loop will be equal to: KE = !s mv2
KE = !s m (gR)
This KE will come from the PE lost when the car drops from above the top of the loop.
Therefore: PE = KE
mg∆h = !s mv2
mg∆h = !s m (gR)
∆h = !s R or
∆h = 2.5 R above the bottom of the loop.
The KE at the bottom of the loop comes from the PE above the top of the loop, so
PE = KE
mg∆h = !s mv2
mg (2.5R) = !s mv2
v2 = 5.0 gR and
Fc = mv R
Fc = m (5.0 gR) / (R)
Fc = 5.0 mg or
Fc = 5.0 g
Combined with 1 g due to weight and the Normal Force at the bottom is
FN= Fc + Fg = 5.0 g + 1.0 g = 6.0 g
www.knexeducat ion.comEducation®

Lab 99: M
oTIo
n In a Clo
Tho
Id loo
p
61
Fig. 1: Clothoid Loop
888-ABC-KNEX Education®