educational technology€¦ · educational technology: availability and use in chicago’s public...
TRANSCRIPT

Holly M. HartElaine Allensworth
Douglas L. LauenRobert M. Gladden
Educational Technology:Availability and Use in Chicago’s Public Schools
September 2002
Consortium on Chicago School Research

AcknowledgmentsThe authors are deeply grateful to the many individuals and organizations that contributed to this report.First and foremost, we thank the Chicago Urban League for providing the impetus and primary fundingfor the study. Thanks in particular to Paul Street and Dennis Kass who facilitated this partnership.
From start to finish, this project has benefited from many helping hands. Continual support and guid-ance was provided by our Senior and Deputy Directors, Anthony Bryk and John Easton and by theConsortium’s analysts—Stuart Luppescu, Shazia Miller, Jenny Nagaoka, and Todd Rosenkranz. TheConsortium’s directors and Steering Committee offered insight and support. We particularly thank VictoriaChou, Arie van der Ploeg, and Steven Zemelman for their helpful comments and suggestions.
Early on we assembled an Advisory Group of individuals from different organizations involved in edu-cational technology in Chicago. We relied on this group to help focus our research questions, design surveyitems, interpret results, and provide feedback on drafts. We are grateful to past and present members:Cynthia Felton (Chicago Principals and Administrators Association); Richard Dynis, Ana Espinoza, JohnFrantz, Christopher Grant, and Phyllis Tate (Chicago Public Schools—CPS); Clare Munana (Board ofEducation of the City of Chicago); Laurie Borders and Michael Lach (CPS eBrigade); Richard White(formerly of CPS); Molly Carroll (Chicago Teachers Union); Donald York (CPS and University of Chi-cago Internet Project—CUIP); Frank Nardine (Governors State University); Peter Mich (Joyce Founda-tion); Dany Fleming (Leadership for a Quality Education); Robert Blomeyer, Kristin Ciesemier, andLawrence Friedman (North Central Regional Educational Laboratory—NCREL); Louis Gomez (North-western University and Center for Learning Technologies in Urban Schools—LeTUS); and George Olson(Roosevelt University).
Thank you to Craig Cunningham (CUIP and the Center for School Improvement); Lou Ellen Finn andChandra James (LeTUS); David Greene (Bay Area Research); Sharnell Jackson and James Sweet (formerlyof CPS Technology Infusion Planning—TIP); Diana Joseph and Sara Spurlark (Center for School Im-provement); and Jennifer Leimberer (North Kenwood/Oakland Charter School) who shared their experi-ence and knowledge of technology and schools with us and aided us in selecting appropriate field schools.We are also very grateful to the principals and staff of our field schools for fascinating and enjoyableclassroom visits and the insights they provided. Thanks also to Nikki Edgecomb, Raquel Farmer-Hinton,Nicole Holland and Lisa Rosen, the Qualitative Researchers Group at the Consortium, who providedmuch appreciated guidance in planning fieldwork. Thanks also to our excellent field staff, Sabrina Billingsand Stephanie Stecz, and our transcriptionist, Patricia Jones.
The report itself owes its expression and presentation to our “wordsmith” and editor, Rose Sweeney, andour graphic designer and production specialist, Sandra Jennings.

Executive Summary . . . . . . . . . . . . . . . . . . . . . . . . . . . . . . . . . . . .
Public Education: Technology’s Final Frontier . . . . . . . . . . . . . . . . .
How Do Chicago Public Schools Use Educational Technology? . . . .
The Digital Divide: Equity Analysis of Technology Availability and Use . . . . . . . . . . . . . . . . . . . . . . . . . . . . . . . . . . . .
What Encourages Technology Use in Schools? . . . . . . . . . . . . . . . .
Where Does Chicago Stand and Where Does It Need to Go? . . . . . . . . . . . . . . . . . . . . . . . . . . . . . .
Appendix A: Further Details on the Methods Used in Analyses . . . . . .
Appendix B: Details of Equity Analyses . . . . . . . . . . . . . . . . . . . . . .
Appendix C: Details of Essential Support Analyses . . . . . . . . . . . . . .
Endnotes . . . . . . . . . . . . . . . . . . . . . . . . . . . . . . . . . . . . . . . . . . . .
References . . . . . . . . . . . . . . . . . . . . . . . . . . . . . . . . . . . . . . . . . . .
Table of Contents
1
3
7
1 9
3 9
5 5
5 9
6 9
7 3
7 8
8 1


Executive Summary
Although there are some
notable exceptions, technology
use in Chicago’s public schools
is at a rudimentary level. Most schools
have not substantially integrated technolo-
gy into students’ coursework and, as a
whole, the district lags behind the rest of
the country in providing teachers and
students with adequate access to
computers and the Internet. Although use
and availability are not evenly distributed
across the district, inequities do not follow
differences in student-, teacher-, and
school-level demographics. In fact,
differences between schools are small.
Instead, equity within school buildings
appears to be the greater challenge.
Most schools have teachers with varying
levels of comfort with technology.
Increasing and improving technology use
therefore, is not only a matter of providing
hardware or infrastructure, but of developing
schools’ capacities for supporting use across
all students and teachers.
The limited use of educational technology
in CPS schools does not appear to be
due to a lack of belief in its benefits.
The vast majority of students and teachers
believe that the use of computers and the
Internet brings academic and occupational
advantages. Nonetheless, the availability
of technology in Chicago is lower than
other urban school systems, particularly
in terms of access to the Internet in
the classroom. This may partially be a
consequence of Chicago’s decentralized
school system. Although the district has
provided funding for some expenditures,
individual schools are responsible for the
costs of most internal wiring, hardware,
and software needs. The tasks of rewiring
an old school building, purchasing and
installing expensive hardware, and
supplying teachers with the training to
retool their classrooms may be daunting for
many schools.
Once schools are able to provide students
and teachers with sufficient and reliable
access to technology, a combination of
essential supports is needed to propel
the use of educational technology forward.
In particular, teachers need high quality
professional development that leads to a
professional community centered around
the integration of technology into the
curriculum. Principals are critical to this
process, especially given Chicago’s
commitment to local school governance.
Where schools have embraced technology,
there are leaders committed to this goal. ■
A
E D U C AT I O N A L T E C H N O L O G Y 1

E D U C AT I O N A L T E C H N O L O G Y 3
Public Education: Technology’s Final Frontier1
lthough they lag behind the
business world, in recent years,
public schools have been thrust
into the digital age. According to the
National Center for Education Statistics
(NCES), in 2000, 98 percent of all public
schools and 77 percent of all instructional
classrooms had some type of Internet
access.1 This compares to only 50 percent
of public schools and 8 percent of classrooms
having access in 1995. The introduction of
technology to education brings with it both
promise and concern. Advocates see the
opportunity for a student-centered teaching
revolution and students well prepared to
excel in an increasingly computerized labor
force. Skeptics question whether costly
equipment and training will meet these
expectations, or only create more expensive
typewriters and encyclopedias.
With expectations for technology use and
its potential costs continuing to rise, the
Consortium on Chicago School Research
sought to provide baseline information on
educational technology—the use of computers
and the Internet for instructional purposes—in
Chicago public schools. We address three
questions: (1) What are the current levels
of technology availability and use? (2)
Are availability and use distributed equitably
across students, teachers, and schools in the
A
The introduction of technology
to education brings with it
both promise and concern.
Advocates see the opportunity
for a student-centered teaching
revolution and students well
prepared to excel in an increas-
ingly computerized labor force.
Skeptics question whether costly
equipment and training will
meet these expectations, or only
create more expensive typewriters
and encyclopedias.
district? and (3) What essential organiza-
tional supports are necessary to encourage
technology use in schools? We examine
these topics by looking at nearly 100,000
responses to the Consortium's biannual
survey of teachers and students in 434 of
Chicago's schools (see Appendix A for
details on surveys, fieldwork, and methods
of analysis). Further insight was gained
through site visits to schools with model
technology programs.

Regardless of whether technology's goalis improved educational practice, or abetter-prepared workforce, there is general concern that disadvantagedstudents will not benefit from its useequally. Despite many initiatives tomake computing technology availablein all schools, studies have foundinequities between more and lessadvantaged schools in national samples.
BENEFIT, EQUITY, SUPPORTAdvocates of educational technology have advanced
two major arguments for the importance of bringing
computers and the Internet into the classroom.
The first is that technology will improve student
achievement by being a catalyst for the development
of more student-centered teaching practices. When
used appropriately by well-trained teachers, technology
can help engage student attention, develop basic
skills, and build higher order thinking skills.2 Second,
advocates also argue that technology should be
stressed in school because computers have changed
the "skill content of employment."3 The US
Department of Labor identified the 54 jobs with the
highest growth potential by 2005; only eight do not
require some type of technological fluency, none of
which currently pays more than twice the minimum
wage.4 Both arguments suggest that students are
better served if technology is widely used and
available in schools. In this study, we describe the
frequency and types of technology use in the Chicago
Public Schools (CPS), as well as student and teacher
beliefs about technology and its benefits.
Regardless of whether technology's goal is
improved educational practice, or a better-prepared
workforce, there is general concern that disadvantaged
students will not benefit from its use equally. Despite
many initiatives to make computing technology
available in all schools, studies have found inequities
between more and less advantaged schools in national
samples. These inequities exist in terms of access and
use both at home and at school.
A study conducted by the Annenberg Public Policy
Center at the University of Pennsylvania found that in
2000, 93 percent of families with children aged 2 to 17
with incomes of $75,000 or more owned a home com-
puter. This compares to 40 percent of families with
incomes less than $30,000.5 A study by Henry J. Becker
at the University of California at Irvine reported that
schools serving poor children are more likely to
emphasize remediation and skill building while those
serving more affluent student populations tend to focus
on analyzing data and presenting information.6 Authors
of The Connected School: Technology and Learning in
High School (2001) argue, "In schools serving mostly
middle-class students, there is an emphasis on teaching
students to think and create with technology rather
than simply learning from technology. Instruction for
middle-class students is geared toward putting the
students in control, whereas instruction for low-income
students is more likely to put the technology in control." 7
C O N S O RT I U M O N C H I C AG O S C H O O L R E S E A R C H4

manage the types of learning environments that are
facilitated by these technologies."11 They describe
three common requirements for the successful
support of teachers as they work to become comfortable
in these new environments:
ADEQUATE TIME—schools must find ways tomake time for teachers to learn new technology, collaborate with other teachers, and organize curriculum. Suggestions include providing teacherswith the authority and flexibility to adjust daily instructional schedules and develop curriculum objectives that promote team teaching and interdisciplinary instruction; allow time each day for teachers to meet and plan; and provide timefor teachers to reflect on their practice.
RESPONSIVE ASSISTANCE to teachers and administrators when they need it. Technologycoordinators could fill this role, but according toBecker’s 1994 study, tech coordinators only spendabout 9 percent of their time actually workingwith teachers.
A CLEAR VISION shared by staff, students and parents of the purpose and educational goals thatguide the school’s technology program and itsrole in the classroom.
How do these supports translate to schools and
classrooms in Chicago? Through our fieldwork
in two model and one emerging school, we look at
how the Consortium’s framework for school
development facilitates the adoption of technology
as an indispensable educational tool.■
Similarly, a national study showed that while the
frequency of computer use in school does not vary
substantially by race/ethnicity or income, there is
some evidence that the type of instructional use of
computers does.8 Specifically, African-American,
Latino, and low-income students were more likely
than white, Asian, and higher income students to use
computers for drill and practice than for simulation and
application. Another study found that African-American
students and Title I participants were about three
times more likely to use computers for drills than for
simulations.9 In our examination of equity in Chicago
public schools, we look at a range of indicators, including
race, income level, and achievement level.
Schools Need More than Greater AccessAs the availability of technology in schools has
increased, it has become increasingly clear that access
alone will not significantly affect teaching and learning.
Larry Cuban found that, in highly resourced
Silicon Valley schools, abundant "availability of hard
infrastructure...and a growing 'soft' infrastructure...in
schools in the late 1990s has not led, as expected,
to frequent or extensive teacher use of technologies
for tradition-altering classroom instruction."10
Writing on the challenges of enabling schools to use
technology well, Thomas Glennan and Arthur Melmed
argue that teachers do not face obstacles learning to
use technology, but with "learning to develop and
E D U C AT I O N A L T E C H N O L O G Y 5


How Do Chicago Public SchoolsUse Educational Technology?2
E D U C AT I O N A L T E C H N O L O G Y 7
ata for this study come from a
survey of all CPS students and
teachers conducted by the
Consortium on Chicago School Research
in the spring of the 2000-01 school year.
There was a 75 percent participation rate
among schools and, overall, 11,214 teachers
and 87,732 students in grades six through
ten responded. These subgroups are similar
to students and teachers systemwide. Most
of our analysis is based on measures created
through Rasch techniques. In addition,
for some of the analyses, we use three-level
hierarchical linear regression models to
control for measurement error and to appor-
tion individual- and school-level
variance. (Further details about these models
can be found in Appendices B and C).
To supplement our quantitative analysis,
we conducted fieldwork in several schools
that exhibited exemplary technology
usage.12 These schools were selected on the
basis of their survey responses and expert
recommendations.
The student and teacher responses reported
here are not based on single items from
our surveys, but on measures comprised
of multiple items that tap underlying
constructs. This approach provides more
In This Chapter We Show:
■ Student and teacher attitudes towardseducation technology
■ The availability of computing resourcesin CPS schools
■ Frequency and type of technology usereported by students and teachers
a substantively meaningful interpretation
of the underlying distribution of responses
in the continuous measure. To create
categories from the continuous measures,
we looked for natural clumps of data or
logical distinctions between groups.
D valid and reliable measurements across
respondents and over time. Each measure
is based on a continuous scale developed
through Rasch analysis. By creating our
measures this way, we can determine how
respondents with a particular score on
a measure most likely answered each
question used to create the scale. For some
statistical analyses, we use the continuous
scale. For displays, we use a three- to five-
category characterization of the same
measure. The categorical measure creates

Example #1: Collaborative Recycling ProjectAt Burley Elementary School, two teachers felt that recycling was not only an important issue but that it wasalso a topic that would provide many different avenues forlearning. They developed a project that involved collectingand analyzing data and communicating findings. Studentslearned how to use digital cameras, edit videos, design webpages, analyze survey data, and create graphs and charts.They also conducted creative and collaborative research on a variety of problems and worked together to devise andcommunicate their solutions to the school. This is an exampleof what technology advocates consider transparent technologyuse. It is used in service to an instructional goal in a way thatis natural and endemic rather than as an awkward additionto an old task.At the beginning of the project, students were broken down into different groups: Video crews were charged with conducting interviews about recycling knowledge and habits. Exposé teams crept into classrooms to obtaingarbage and recycling samples and assess recycling practices. After careful analysis, their findings were alsorecorded on videotape. One student formed his own teamto design an educational web page. Another team designed,administered, and analyzed student surveys. As the project progressed, it became clear to students that each group's data would provide pieces of a comprehensive picture of the school's recycling program.Teams began to share information and support each other'sstrategies. For example, the survey team decided to analyzetheir data classroom by classroom so that they could compare their findings with the exposé team to see the relationship between what students claimed to know about recycling and actual behavior. The project evolved furtherwhen the exposé team, upon seeing that many members of the school community were not recycling properly, made aneducational video demonstrating proper recycling practices.
Example #2: Weaving Technology into aTraditional AssignmentStudents at Hayt Elementary School were studying a novelin which a young person lives through a tornado. As a supplemental activity, the teacher had students studytornados on the Internet. She recommended several goodwebsites that provided explanations of different types of tornadoes and excellent photographs and diagrams.Since the classroom only had three computers, most
What Does Good Technology Use Look Like?In our visits to our field schools, we observed several exemplary instances of technology being used as a tool to achieve
curriculum goals. These examples illustrate the unique benefits technology can provide without becoming the focus ofinstruction itself.
students read silently during the reading period while six (two per computer) conducted research. Different students used the computers on different days and theteacher paired weaker readers with stronger ones.
Example #3: Computer SimulationsAt Burley, a teacher uses a computer program called "Model It" that helps students simulate environmental problems and propose possible solutions. In one instance, students choose a city and research a particular environmentalproblem that city faces. They must determine the problem'sunderlying causes and other factors that affect it and they enter their findings into the program. Model It is able to depict the students' system and allows for adjustments of individual factors. For example, the program shows studentswhat happens if the number of dead fish in a stream rises andhow that affects the water quality downstream. In another case,students can use a solar simulator to study passive solar energyby creating their own solar house. They must keep the temperature in their houses between 65 and 80 degrees usingthe sun as their only source of energy. The simulator showsthem how their homes cool off when the sun sets or how it holds heat when skylights are added, different buildingmaterials are used, or the seasons change. Although creating simulations is perhaps one of the chiefadvantages for using technology in education, few teachers inour survey reported using them. This particular teacher relatedthe impact the program makes on her students' understandingof a particular problem, "[With traditional methods] they cando it and a lot of times they'll get the results and they'll have a table or they'll have graphs, but they really won't quiteunderstand it, but if you put it onto a simulation or onto the computer and you let them actually see how...things gotogether, they really do get it."
Example #4: EZineNorthwestern University's Collaboratory began an electronicmagazine called EZine at Hayt by training several teachers andfive sixth-grade students. Northwestern also provided a $700digital camera and $500 worth of software so that the magazine could have streaming video. Students select topics, write articles, edit video, and design the layout of the magazine, often coming in on their own time before andafter school. The computer teacher provides technical assistance and another teacher provides editorial support. The project began with a small group of students and nowthese students are training others.
C O N S O RT I U M O N C H I C AG O S C H O O L R E S E A R C H8

0 10 20 30 40
4
15
38
25
17
percent of student reports
intensive
moderate
limited
none
highly intensive
STUDENT RESPONSES
Beliefs about Importance and Reportsof AvailabilityIn general, students are enthusiastic about using
technology to learn. Three quarters (76 percent)
agreed that learning how to use computers and the
Internet helps them perform better in their classes,
makes classwork more fun, and will help them find
employment. Students also have positive reports about
the availability of technology at school; the majority
(65 percent) felt that their schools have enough
computers and that they can usually find an available
one to use for homework. It is important to note,
however, that more than a third of students
(35 percent) report insufficient computer availability
at school, suggesting that certain schools or groups of
students may have inadequate access to technology
resources. (Equity across schools and among teachers
and students is discussed in detail in Chapter 3.)
Use of Technology in SchoolWe measure student technology use in terms of intensity,
which captures the frequency and breadth of use, both at
school (for specific tasks) and for core academic subjects.
For each, intensity is considered to be the frequent use of
technology across a wide variety of activities or courses.
In the first measure, students reported how
frequently (during this school year) they used a
computer at school to perform a number of tasks,
including word processing, Internet research, and
analyzing/graphing data. Based on these responses,
we find that only 19 percent of students use technology
intensively at school (see Figure 1). These students
performed common tasks such as word processing or
Internet research almost every day and other tasks,
such as analyzing/graphing data or creating presentations,
about once a week. The typical CPS student is a
moderate (38 percent) or limited (25 percent) user
of technology at school. Moderate technology users
perform basic tasks once or twice a week and activities
such as analyzing/graphing data once or twice a
semester. Limited technology users are only exposed
to basic tasks (word processing and Internet research)
and do these less frequently (from once or twice a
semester to once or twice a month). Another 17
percent of students never use technology at school
for any of the activities listed.
E D U C AT I O N A L T E C H N O L O G Y 9
Figure 1:
Students’ Use of Technology in School

Figure 2 shows the individual items that comprise
the Student Use of Technology measure. Those items
at the bottom of the graph (e.g., creating web pages,
email, computer programming ) are done the least
frequently. Students perform word processing most,
with over 70 percent reporting that they do this
activity at least once a semester. Internet research
is another relatively common task, 64 percent of
students reported that they access the web at least
once during the school year. Fewer than half of
students, 45 percent, use technology for analyzing
or graphing data. Most students rarely engage in
computer programming and creating web pages.
Does Use Vary by Subject?
The second measure of student use of technology
examines the frequency of technology use across
several or all of the core academic subject areas:
English/reading, social studies/history, math, and
science. One-quarter of students use technology at
least weekly for all of their core courses. Slightly more
than a third (36 percent) do not use technology for
any core academic classes. The balance (40 percent) use
technology at least weekly for English/reading, and at
least monthly for all the other core academic courses.
Students are most likely to report using a computer
to work on an assignment for English/reading, with
57 percent reporting that they complete at least some
of their assignments using technology. Students were
least likely to use technology in math class; only 38
percent reported using technology for at least some
math assignments. This means that 62 percent, or
nearly two-thirds of CPS students, never used
technology for a math assignment during the
2000-01 school year.
C O N S O RT I U M O N C H I C AG O S C H O O L R E S E A R C H1 0
percent of student reports
word processing or typing
research using the Internet
practice drills
analyze or graph data
create presentations
computer programming
correspond with others via email or Internet
create web pages
This school year, how often have you used a computer at school for …
26161828 12
20161736 10
1791551 8
12111755 5
12121655 5
1181264 6
97869 8
66976 3
never once or twice a semester once or twice a month once or twice a week daily or almost daily
Figure 2: How Are Elementary and High School Students Using Technology?

E D U C AT I O N A L T E C H N O L O G Y 1 1
TEACHER RESPONSES
Beliefs about Importance and Reportsof AvailabilityLike students, most teachers have positive attitudes
about technology's potential to enhance students'
educational experiences. They believe that it can play
a role in strengthening students academically, that it
can prepare students for the work force, and that
technology can help promote student engagement
in the classroom and project-based learning. These
findings suggest that those who seek greater technology
integration in Chicago classrooms do not face a
skeptical teachers corps.
Nearly all teachers agree or strongly agree that
technology can contribute to typical educational
objectives such as engaging students in the classroom,
developing critical thinking skills, and preparing
students for future jobs. One item on the survey
had a somewhat lower level of agreement, however.
Only three-quarters of teachers (versus about 90
percent for the other items) endorsed the statement,
"Computing technology should be used to raise
standardized test scores." Although the reasons for
fewer endorsements of this item are not clear from
More than half of students surveyed report having a computer at home (60 percent) and 41 percent report having Internet access at home. (There is no significant difference between elementary and high school students on this measure). Of those students who have a computer at home, 63 percent report using it almost every day. Another 20 percent say they use it once or twice a week. Thosestudents who have a computer at home with Internet access are even more likely to use it frequently—72 percent use it almost every day and 18 percent use it once or twice a week).
Students are also more likely to use a computer at home than in their regular classroom. Forty-two percent of
How Do Students Use Technology at Home?students report that they never used a computer in their classroom in the 2000-01 school year. This compares to only 31 percent saying they never used a computer at home.Furthermore, only 12 percent of students say they used a computer daily in their regular classroom, but 43 percent ofstudents say they used their home computer daily.
Given the frequency with which students use their home computers, it may seem that home access gives students anacademic advantage. We do not know, however, whether students use computers at home for academic purposes or for entertainment (e.g., instant messaging and computer games) and so the extent of this benefit is not yet known.
the survey data, one possibility is that some teachers are
uneasy about using computers for particular activities,
such as test prep programs, that focus on raising test
scores. Several teachers in our field study schools
expressed such concerns. One admitted that while there
was potential value in some drill and practice programs,
there was not sufficient value in these activities to
warrant the exclusive use of drill software: "I see the com-
puter as a tool as opposed to a teacher....There's some
valuable stuff out there...but I don't think that a student
could learn enough from that to take up a workstation."
Although nearly all teachers believe that technology
is an important educational tool, a substantial number
lack access to critical technological resources. Nearly all
teachers have access to a computer and the Internet
somewhere in the school, but only a third of teachers
have Internet access in their classrooms (see Figure 3).
This indicates that most teachers need to go to a
computer lab, library, or another office to use email
and the Internet. In addition, a large difference in
access exists between elementary and high school teachers.
At the time of data collection, more than three quarters
of elementary teachers (77 percent) had a computer
available to them in their classrooms compared to only
52 percent of high school teachers.

school classroom school classroom
computer Internet
perc
ent o
f tea
cher
repo
rts
0
100
60
70
80
90
50
40
30
20
10
89
95
77
52
79
92
3330
elementary
high school
Figure 3:
Teacher Accessto Computersand the Internet
C O N S O RT I U M O N C H I C AG O S C H O O L R E S E A R C H1 2
How Do Teachers Use Technology for Professional Work?Research indicates that teachers are generally extraor-
dinarily pressed for time and are often quite isolated
from their peers. Under optimal conditions, technol-
ogy could make administrative tasks less
time consuming, communication more fluid, and
information sharing more efficient. In addition, it
is difficult to "teach" if you cannot or do not "do."
In other words, in order for students to become
computer literate, teachers themselves should be
proficient enough with technology to feel comfortable
integrating it into their classroom lessons.
For Teaching and Lesson Planning
To investigate the extent to which teachers are using
technology to prepare classroom lessons, we asked a
series of questions about teachers' typical
use of technology, such as preparing instructional
materials, doing research on the Internet, and preparing
multimedia presentations (see Figure 4). We find that
31 percent of teachers use technology either minimally
or not at all. At most, they use technology once a
semester to create instructional materials or gather
information for planning lessons, but do not use it
for other activities. Slightly more than half, or 52
percent, use technology in a manner we characterize
as limited, meaning that teachers use technology for
more basic tasks up to once a week, access model
lesson plans and best practices for teaching up to
once or twice a month, and create multimedia
presentations occasionally. Although most teachers
either do not use technology at all or use it in a
limited way, there is a small minority of intensive
technology users (17 percent). These teachers regularly
use technology for basic tasks; access information,
such as best practices, at least weekly; and create
multimedia presentations weekly or daily.

E D U C AT I O N A L T E C H N O L O G Y 1 3
As suggested above, teachers' most common use of
technology centers on creating instructional materials
such as handouts or tests. Eighty-two percent have used
technology in some way for this purpose. About the same
proportion use the Internet to access information for les-
sons (79 percent). Most teachers have also accessed model
lesson plans and research and best practices for teaching
(62 percent and 65 percent, respectively).
Less common tasks are accessing the CPS Intranet
(51 percent of teachers had done so) and creating
multimedia presentations for the classroom (37 percent).
For Administrative Tasks
An important indicator of teachers' comfort with
technology is their ability to perform administrative tasks
efficiently. The faster teachers can take care of day-to-day
business, the more time and energy they have to devote
to student learning. We asked teachers about their use of
technology to communicate, analyze data, and keep
records. We find that half of teachers never use technology
to analyze student data or do record keeping. More than
half (61 percent) never email other teachers and most
(87 percent) never email students. However, one-quarter
of teachers do use computers to analyze student data
from once to twice a week to daily.
One factor that may explain low levels of technology
use for administrative purposes is that many schools
have not yet adopted software and installed the
necessary computers and computer networks to
enable teachers to track attendance and grades.
In addition, when such equipment is available,
this software is sometimes not compatible with CPS
systems and complications with installation can
make them difficult to manage. While this may be
surprising given the extent of technology use for
record keeping and communication in other professions,
it is clear that CPS schools are well behind the
business world when it comes to tapping network
computing's possibilities. Evidence of this lies in
the reality that CPS does not provide students and
teachers with email accounts. Many students and
teachers have free email accounts, such as through
Yahoo!, but these services are often swamped beyond
capacity during school time. In one case study school,
teachers and students had to access their email via
the Yahoo! Sweden website because Yahoo! will only
accept a certain number of connections from within a
particular network.
0 40 5010 20 30 60
3
14
52
31
highly intensive
intensive
limited
none or rare
percent of teacher reports
Figure 4:
Level of Teachers’Professional Useof Technology

C O N S O RT I U M O N C H I C AG O S C H O O L R E S E A R C H1 4
Teachers' Assignment of TechnologyTeacher assignment of technology is perhaps the
most important determinant of whether students
use technology at school. If teachers assign lessons
that integrate technology, students will use it.
We constructed a measure of technology integration
into classroom lessons that uses the same list of
activities presented to students (e.g., word processing,
analyzing/graphing data, research on the Internet).
Because the scope of the questions differ, however,
and we only have data from students in grades six
through ten (compared to teachers from all grades),
the measures are not directly comparable.13
We find that only 17 percent of teachers practice
an "integrated" or "highly integrated" approach to
lesson planning (see Figure 5). We characterize
integrated teachers (11 percent) as assigning basic
tasks (such as word processing and Internet
research) weekly, and more advanced tasks, such as
analyzing/graphing data or creating presentations,
at least once per semester. Highly integrated
teachers, 6 percent, assign uncommon tasks
(i.e., demonstrations, creating web pages or computer
programming) as well as assigning students to use
computers in more common ways. More than half of
teachers, or 55 percent, assign technology in modest
or limited ways. These teachers assigned word
processing and Internet research from once or
twice a semester to once or twice a month. Those
characterized as modest integrators also assigned more
complex tasks such as analyzing/graphing data as
much as once or twice a month. Limited teachers did
not assign any tasks other than word processing or
Internet searching. Finally, 29 percent, or nearly
a third, do not assign technology at all.14
Teacher assignment of technology parallels student
reports of the ways they use technology. Word
processing and Internet research were the most
common activities listed by both teachers and students.
More than half (50 to 60 percent) of teachers assigned
these activities at least once a semester. The most
infrequent activities were corresponding with others
via the Internet or email, computer programming,
and creating web pages, which only 10 to 20 percent
of teachers assigned at least once a semester.
0 10 20 30 40
6
11
24
31
29
highly integrated
modest
limited
none
percent of teacher reports
integrated
Figure 5:
Level ofTeacherIntegration of Technologyinto StudentAssignments

E D U C AT I O N A L T E C H N O L O G Y 1 5
HOW DOES CHICAGO COMPARENATIONALLY?In 1999, the National Center for Education Statistics
(NCES) surveyed public school teachers across the
country on their use of computers and the Internet.15
In order to compare Chicago to this national sample,
we included several items from the NCES survey in
the Consortium's spring 2001 survey.
Given the fast growth of technology in the last few
years, one might expect that 2001 CPS data should
surpass the 1999 NCES figures. Instead, technology
access and use reported by CPS teachers in 2001
either equaled or lagged behind levels reported by
NCES teachers two years earlier. Most notable is the
low level of Internet availability inside classrooms.
Only a third of CPS teachers reported Internet access
in their classrooms, compared to 60 percent of
elementary and 72 percent of high school teachers
in the NCES survey two years before (see Table 1).
In addition, three quarters of NCES high school
teachers reported having a computer in their
classrooms compared to only half of CPS high school
teachers. In contrast, home Internet access was higher
for CPS teachers. This may be due to the growth in
the availability of low cost Internet service providers
since 1999. In general, CPS teachers assigned most
computer tasks at rates similar to those reported by
NCES teachers (see Table 2), with the exception of
assignment of demonstration/simulations, which CPS
teachers report doing less. CPS teachers were also
slightly less likely to ask students to correspond
via email. These differences may partly reflect the
hardware availability issues described.
NCES 1999CPS 2001 CPS 2001 NCES 1999 NCES 1999 City Sample
Elementary High School Elementary High School Elem and HS
Computer in classroom 77 52 89 75 80
Internet in your classroom 33 30 60 72 60
Computer elsewhere in school 89 95 93 99 94
Internet elsewhere in school 79 92 87 96 90
NCES 1999CPS 2001 NCES 1999 City Sample
ELEMENTARY & HS ELEMENTARY & HS ELEM & HSComputer at home 85 82 79
Internet at home 75 63 62
Percent of teachers reporting
Table 1: Availability of Technology: CPS Schools Compared to National Sample
Note: NCES defines "city" as the central city of a Metropolitan Statistical Area (MSA). Besides Chicago, examples of other Illinois cities are Peoria and Rockford.

C O N S O RT I U M O N C H I C AG O S C H O O L R E S E A R C H1 6
One group of questions that asked about the barri-
ers that affected teachers' use of technology produced
very similar results for both samples (see Table 3).
Although two years apart, in both groups, around
80 percent of teachers cited lack of release time, lack
of time for students to use computers, and not having
enough computers as barriers. Lack of support for
integrating technology into the curriculum was
also a barrier for a majority of teachers (79 percent
for CPS and 68 percent for NCES). In addition,
finding appropriate software was a barrier for over
70 percent of teachers. Lack of support from school
administration was a barrier for over a third of
teachers in both samples.
*These items are similar but not identical to NCES items.
Percent of teachers identifying items as small, moderate, or great barriers to technology use
Table 3: Barriers to Technology Use: Chicago Compared to National Sample
CPS 2001 NCES 1999
Lack of release time for teachers to learn/practice/plan ways to use computers or the Internet 85 82
Lack of time in schedule for students to use computers in class 82 80
Not enough computers 83 78
Difficulty in selecting appropriate instructional software* 75 71
Lack of principal support* 36 43
Lack of appropriate professional development on how to integrate computing technology into curriculum* 79 68
Percent of teachers assigning computers/Internet for the following (at all):
Table 2: Teacher Use of Technology: CPS Schools Compared to National Sample
NCES NCESCPS full sample city
Practice drills 50 50 49
Create presentations 40 43 44
Demonstrations/simulations 29 39 39
Research using Internet 52 51 49
Correspond via email 18 23 25

E D U C AT I O N A L T E C H N O L O G Y 1 7
SUMMARYTechnology has not become an integral part of most
students' learning experiences in the most central
aspects of the curriculum. Most CPS students and
teachers use technology infrequently and for a
narrow range of activities. The typical student in
Chicago uses computers for word processing and
Internet searches, but very seldom for any other
purpose. Although these uses do have some value,
they represent a small piece of technology's potential
as an educational tool. Furthermore, about 17
percent of students never use technology for any
reason at school and 36 percent report no assignment
of technology use in their core classes. It is difficult
to see how these students in particular will succeed
in higher education and in an increasingly computerized
economy without some level of school-based
computer literacy.
Computer use among teachers mirrors that of students.
The typical CPS teacher uses technology either not at
all or in a limited way to prepare classroom lessons
and perform administrative tasks, and integrates
technology into classroom lessons either modestly or
in a limited way. About a third of teachers never or
rarely use technology themselves. Levels of teacher
integration of technology into classroom assignments
are higher than levels of teacher professional use.
About four in ten teachers assign classroom lessons
that integrate technology in more than a limited way.
The modest use of technology by students and
teachers cannot be attributed to a lack of belief in
technology's benefits. The vast majority of students
and teachers believe learning technology has educational
and occupational benefits. Most teachers, for example,
agree that technology should be used to strengthen
students' basic skills, improve standardized test scores,
and develop critical thinking. One obvious obstacle
to higher technology use is the limited availability
of hardware and Internet access in the classroom.
CPS lags behind other US cities in providing computers
and Internet access, especially at the classroom level.
This is particularly true in high schools. Other potential
obstacles such as lack of professional development
and technical support are discussed later in this report.■


The Digital Divide: Equity Analysis of TechnologyAvailability and Use3
E D U C AT I O N A L T E C H N O L O G Y 1 9
ational studies have shown that
a "digital divide" exists among
the information rich and the
information poor.16 Access to technology
did increase dramatically over the course
of the 1990s, but it was not distributed
equitably—computer and Internet users are
more likely to be white or Asian and from
households with higher income levels and
levels of education. Americans who are
non-Asian minorities, have lower income
and education levels, or live in central
city areas use computers and the Internet
less frequently.17
Chicago is no exception to these national
trends. Maps A and B in Figure 6 show that
CPS students who live in neighborhoods
with high median incomes tend to use
computers frequently at home. Conversely,
students in neighborhoods with low median
incomes tend to use computers infrequently
In This Chapter We Show:
■ Student use of technology at home, by school, race, and income level
■ Student access to and use of technologyat school, by demographic characteristicsand the characteristics of schools
■ Teacher access to and use of technologyat school, by demographic characteristicsand the characteristics of schools
at home. The census-tract-level correlation
between median income and students' use
of technology at home is quite high (+0.73),
indicating a strong relationship between the
two. Although the price of home computers,
software, and Internet access has fallen
sharply in the last ten years, their cost
continues to be prohibitively high for
many lower income Chicago families.
N

C O N S O RT I U M O N C H I C AG O S C H O O L R E S E A R C H2 0
Harlem Ave.
Pulaski Rd.
Belmont Ave.
Kinzie St.
Cermak Rd.
Bryn Mawr Ave.
106th S
83rd St.
Ashland Ave.
State St.Stony Island Ave.
55th St.
37,500 to 70,00030,000 to 37,50022,500 to 30,000
9,000 to 22,500
Harlem Ave.
Pulaski Rd.
Belmont Ave.
Kinzie St.
Cermak Rd.
Bryn Mawr Ave.
106th S
83rd St.
Ashland Ave.
State St.Stony Island Ave.
55th St.
Top 25%Second QuartileThird QuartileBottom 25%
Harlem Ave.
Pulaski Rd.
Belmont Ave.
Kinzie St.
Cermak Rd.
Bryn Mawr Ave.
106th S
83rd St.
Ashland Ave.
State St.Stony Island Ave.
55th St.
Top 25%Second QuartileThird QuartileBottom 25%
Harlem Ave.
Pulaski Rd.
Belmont Ave.
Kinzie St.
Cermak Rd.
Bryn Mawr Ave.
106th S
83rd St.
Ashland Ave.
State St.Stony Island Ave.
55th St.
Top 25%Second QuartileThird QuartileBottom 25%
C. Availability of Technology at Schools: by Community Area D. Student Technology Use at School: by Community Area
A. 1997 Estimated Median Family Income: by Community Area B. Student Technology Use at Home: by Community Area
Figure 6: Digital Divide in Student Technology Use at Home Not Replicated in Schools

less than 90% low income
more than 90% low income more than 85% Latino
mixed minority
integrated
more than 85% African American
Low
High
system
average
Low
High
system
average
percent low income students: school racial composition:
How to Interpret Equity Displays
E D U C AT I O N A L T E C H N O L O G Y 2 1
School comparisons also show a divide in the extent
to which CPS students use computers at home (see
Figure 7). Elementary students who attend schools
that do not serve primarily low-income students tend
to use computers at home much more than students
at predominantly low-income schools.18 This also
holds true when we look at the racial composition
of schools. Students at integrated elementary schools
are much more likely to use computers at home than
students who attend schools whose enrollment is
primarily non-Asian minority. Similar differences
exist among high schools.
Figure 7: Digital Divide in Student Use of Technology at Home: Elementary Reports
Equity displays show the average technology use oravailability for each group against the range ofresponses across the system. The dashed line indicatesthe system average. Surrounding the system average is a box that indicates a range of two standard deviations around the mean (one above the system average and one below); two-thirds of all students/teachers/schools fall within the range of the box for that measure. Spreading out from the box are lines that end two standard deviationsfrom the mean. These represent extreme values(approximately the 2nd and 98th percentiles).
These figures allow us to easily see how groups ofstudents, teachers, and schools differ from eachother compared to the total range of responses. It is important to note that that there are manymore differences in computer use and availabilityamong students and teachers in the same schoolthan between schools. (Student measures haveabout three times more variance within schools thanbetween them; teacher measures have about tentimes more variance.)

C O N S O RT I U M O N C H I C AG O S C H O O L R E S E A R C H2 2
DO SCHOOLS MAGNIFY THE DIVIDE?Our findings confirm that a digital divide does exist
in Chicago students' use of computers and the
Internet at home. In general, however, schools do not
seem to be magnifying the problem substantially.
Where disparities along the line of the digital divide
do exist, they are small. This is not to say that
students and teachers in all schools have the same
levels of technology availability, or that they are using
it to an equal degree. They are not. However, the
differences in school availability and use are not
strongly related to the racial composition or family
income levels of students in the school. On the other
hand, although schools are not exacerbating the digital
divide, they are not compensating for substantial
inequity in home use.
Technology Availability in Schools NotRelated to Community Income LevelComparison of Maps A and C in Figure 6 shows that
the availability of technology in elementary schools is
not strongly related to the median income of house-
holds in the community, as was found in home use
(Map B). School availability is high in some high-
income neighborhoods (as in the Northwest area of
the city), but it is high in many lower income neigh-
borhoods as well. The tract-level
correlation between median income and student
reports of school availability is low (+0.11),
indicating that there is not a strong relation between
the two. Furthermore, students from more affluent
neighborhoods do not report more use of technology
at school than students from less advantaged ones
(see Maps A and D). In fact, the association, though
weak, goes in the opposite direction (-0.14).
Are Schools Bridging the Digital Divide?Although schools may not be exacerbating the digital
divide that exists in home use, they are not helping students overcome it. In Chapter 2 we show that, on average, technology use in CPS schools is at a low level. In most cases, this is unlikely to compensate for the substantial difference in students' home use, particularlysince students report using technology much more athome than at school (see page 9). At the same time, we donot know how students are using computers at home; our measure of school use takes into account the types of
activities students are using technology for, our measure of home use does not. If students' computer use at homeconsists of mostly computer games and instant messaging,then a disparity between home and school use may be of little educational importance. On the other hand, if students are using their computers at home for educational purposes, they may have a substantial advantageover their classmates. At this time, any definitive comparisonof in home versus school use is beyond the capacity of our data.

E D U C AT I O N A L T E C H N O L O G Y 2 3
Are Certain Students Using TechnologyMore than Others?See pages 27 to 29 for equity displays on the measuresdescribed below.
Given the national digital divide and our findings
regarding home use in Chicago, we expected to find
substantial differences in school availability and use
based on students' race/ethnicity, parent level of
education, and income. Contrary to our expectations,
differences were modest and not consistently lower
for groups with less technology use at home.22
Only very small differences were found in school
availability and use based on students' economic status
or their race/ethnicity. One indicator of the divide
was slightly evident—students with the most educated
parents reported using technology at school slightly
more than students whose parents did not go to
college. Again, these differences were small.
There is some evidence that Chicago schools may
be using technology in compensatory education
programs for students who are low achieving,
limited-English-proficient, or have a disability.
The lowest achieving CPS students report the most
technology use in school. In addition, students in
bilingual and special education programs report using
technology slightly more than other students. These
slight differences may be due to measurement effects
or a response bias; our data cannot be conclusive on
this. Many more low achieving students did not
THE EQUITY OF COMPUTERAVAILABILITY AND USE AMONGSTUDENTSWe analyzed differences in computer access and use
in school among different groups of students and
among different types of schools.19 Originally, we
looked at elementary and high schools separately.
However, because differences between types of
students (i.e., by family income, race/ethnicity
and achievement) were similar at both levels,
we combine them for our displays and discussion.
We present school differences separately for elementary
and high schools because different patterns emerged
based on school characteristics.
Among students, we examined whether differences
exist in terms of their:
■ Race/ethnicity■ Gender■ Economic status20
■ Achievement level21
■ Parent level of education■ Grade level
Among schools, we considered whether there were
differences in student computer use and access by:
■ Racial/ethnic composition of the school■ Percent of students classified as low income
(over 90 percent compared to under 90 percent)■ Average student achievement levels
C O N S O RT I U M O N C H I C AG O S C H O O L R E S E A R C H2 4
answer technology questions on our survey than
high achieving students. Those that did choose to
answer questions on technology may tend to be those
using technology more.23 We were also concerned that
these students may be reporting higher use of technol-
ogy but doing mostly low-level tasks such as word
processing and Internet searches. We found, however,
that they reported doing more of all types
of tasks, including more sophisticated ones such as
designing web pages and analyzing data. It is possible
that because special education and bilingual teachers
tend to have more flexibility and smaller class sizes, it
might be easier for them to integrate technology into
their lessons. It is also possible that students who are
low achieving, have a disability, or are limited-English
proficient are allowed more school time to work on
technology assignments and so report using technology
more frequently in school. Nonetheless, several teachers
at our case study schools highlighted the benefits of
technology for reaching students with disabilities.24
One might expect that high school students would
report greater technology use because they are those
most in need of job and post-secondary readiness
skills. This is not the case for CPS, however. The
oldest students that we sampled, those in 10th grade,
reported using technology less than students in grades
six through nine. Technology use may be greater in
grades 11 and 12, but we have no evidence that this is
the case. We performed additional analysis to discern
any gender differences among CPS students, as other
studies have found that girls tend to be less intensive
technology users.25 We found no difference; boys and
girls report similar levels of both availability and use
of technology.
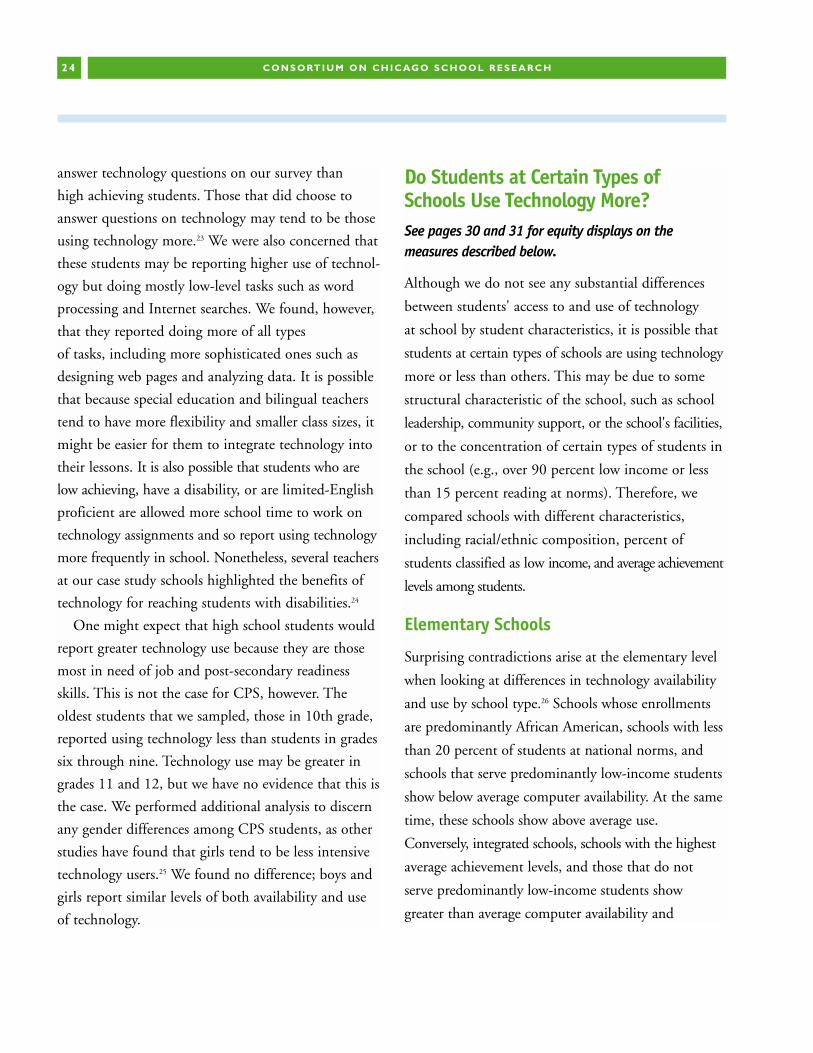
Do Students at Certain Types ofSchools Use Technology More?See pages 30 and 31 for equity displays on the measures described below.
Although we do not see any substantial differences
between students' access to and use of technology
at school by student characteristics, it is possible that
students at certain types of schools are using technology
more or less than others. This may be due to some
structural characteristic of the school, such as school
leadership, community support, or the school's facilities,
or to the concentration of certain types of students in
the school (e.g., over 90 percent low income or less
than 15 percent reading at norms). Therefore, we
compared schools with different characteristics,
including racial/ethnic composition, percent of
students classified as low income, and average achievement
levels among students.
Elementary Schools
Surprising contradictions arise at the elementary level
when looking at differences in technology availability
and use by school type.26 Schools whose enrollments
are predominantly African American, schools with less
than 20 percent of students at national norms, and
schools that serve predominantly low-income students
show below average computer availability. At the same
time, these schools show above average use.
Conversely, integrated schools, schools with the highest
average achievement levels, and those that do not
serve predominantly low-income students show
greater than average computer availability and

E D U C AT I O N A L T E C H N O L O G Y 2 5
less-than-average use. Almost all these differences can
be attributed entirely to the clustering of certain types
of students in certain types of schools rather than any
structural characteristic of the school. Small differences
in computer use and availability between types of
students are magnified when they are clustered in
certain schools. After controlling for the characteristics
of the students in schools, only one of these effects
remains statistically significant: schools with predomi-
nantly African-American enrollments show lower
levels of student access to computers than other types
of schools.
High Schools
On the high school level, there were no significant
differences in equity based on the percentage of
low-income students a school served. There were
two significant differences based on a school's racial
composition, however. First, high schools with
predominantly Latino enrollments showed lower
levels of student access to computers than others.27
Assuming that students at predominantly Latino high
schools mirror their elementary school counterparts,
it is possible that they are using computers more
in school because they have less access at home (see
Figure 7 on page 21). Second, integrated high schools
showed higher technology use than other types of
high schools. Differences in access for Latino high
schools disappear when we control for student
characteristics, indicating these differences are due to
characteristics of students and not schools. Integrated
schools continue to show higher student use, howev-
er, indicating that these schools are different beyond
the students that they serve.
The largest differences in student access to technology
occur among high schools with different levels of
student achievement. Students in selective admissions
high schools report much greater access in school
than those at non-selective schools. Selective
admissions schools clearly have substantially more
computing resources available to students than other
types of schools. At the same time, however,
students' reports of technology use at these schools
were not significantly different from those at
neighborhood and probation high schools. Indeed,
although students in probation high schools report
the least access to technology in school, their reports
of use are not far behind those of selective high
schools. Although this pattern is similar to
that for the elementary schools, it is particularly
surprising given the disparity in students' access
to technology between probation and selective
admissions high schools. Unlike elementary schools,
inequity in computer availability remains after
controlling for the characteristics of students. Also,
the difference between selective admissions and other
types of high schools in students' computer use grows
after controlling for student characteristics.

More about Selective Admissions High SchoolsData reported here indicate that selective admissions high schools are exceptional in student and teacher reports of computer availability and use. These highschools were established to attract and retain the most academically qualified students in the system. Enrollment is academically selective and is not primarily made up from students living in the neighborhood immediatelysurrounding the school. About 11 percent of CPS highschool students enrolled in a selective admissions school inthe spring of 2001.Several selective admissions high schools were created after1997, and were built or remodeled with computing
technology incorporated into their designs. The followingeight are considered selective admissions high schools:
Chicago High School for Agricultural Sciences
Chicago Military Academy
Gwendolyn Brooks College Preparatory Academy
Jones College Preparatory High School
Lane Technical High School
Lindblom College Preparatory High School
Northside College Preparatory High School
Whitney M. Young Magnet High School
C O N S O RT I U M O N C H I C AG O S C H O O L R E S E A R C H2 6
EQUITY OF COMPUTER AVAILABILITYAND USE AMONG TEACHERSAnother important gauge of technology equity in
CPS schools is the distribution and use of technology
among teachers. Clearly, if some teachers are using
technology more than others, some students will be
placed at a disadvantage. As with other tools of
instruction, teachers mediate students' exposure to
technology. If certain types of teachers have less access
or are less likely to use it, this will have
implications for human resource development.
We examine equity among teachers in the same
way as for students—Are certain types of teachers
using technology more than others? Are teachers in
certain types of schools reporting greater or less use?
Three measures were established: teachers' reports of
computer availability, use for their own work, and
assignment of technology to students. Each was
compared among groups of teachers with different
individual characteristics, including:
■ years of teaching experience ■ race/ethnicity■ gender■ level of education■ subject area (self-contained classroom, English,
mathematics, etc.)■ grade
As the patterns in computer use based on demographic
characteristics were very similar among elementary
and high school teachers, we combined them for our
displays and discussion, unless explicitly stated. We
present elementary and high school comparisons
separately for our analysis of teachers in types of
schools, as they showed very different patterns. As with
the student measures, school comparisons are based on
the schools' racial/ethnic composition, percent low
income, and average student achievement level.

E D U C AT I O N A L T E C H N O L O G Y 2 7
Are Certain Teachers Using TechnologyMore than Others?See pages 32 and 33 for equity displays on the measures described below.
Experience and Education
It is often assumed that newer teachers and those
with advanced degrees are more likely to use
technology for their own work. We do find that
higher levels of education are associated with more
technology use; teachers with master's degrees are
somewhat more likely to use technology for their
own work and to integrate it into classroom lessons
than their colleagues who do not have master's degrees.
We find a more complicated pattern in technology use
when we look at teachers' level of experience.
Teachers with fewer years' experience report lower
levels of computer availability and integration of
technology into lessons than teachers with more
experience. On the other hand, newer teachers report
higher levels of technology use for their own work.
This suggests that although new teachers are perhaps
more comfortable with technology as a productivity
tool for their own work, their lack of adequate access
to computer resources may limit their ability to
integrate it in lessons. New teachers may also be
working to master classroom management and
curriculum before bringing technology to their students,
especially if educational technology was not a focus
of their teacher training.28 These findings also suggest
that professional use of technology, while an important
indicator of teachers' comfort with computers, is not
sufficient to ensure that technology will be integrated
into the classroom. (See Chapter 4 for further discussion.)
Subject and Grade
Teachers' access to and use of technology are
somewhat related to the subject and grade they teach.
Not surprisingly, vocational/business/technology teachers
report the highest levels of availability and use. Junior
high teachers (grades seven and eight) report the
highest levels of computer availability. These and high
school teachers report more professional use and
assignment of technology than primary grade teachers.
Gender and Race
We found no substantial gender or race/ethnicity
differences in teachers' reports of availability,
professional use, or assignment. White teachers
report somewhat less assignment of technology to
students than other teachers. Male teachers report
slightly more assignment of technology, but this
disappears when we control for other teacher and
school characteristics.
Do Teachers at Certain Types of SchoolsUse Technology More?
See pages 34 and 35 for equity displays on the measures described below.
Elementary Schools
Like students, teachers in schools with predominantly
African-American and low-achieving enrollments
report lower availability than teachers in integrated
and higher achieving schools. Teachers in probation
schools are the least likely to assign technology to
their students.29 There are only slight differences
between schools based on the percentage of
low-income students served. Only two school-level

C O N S O RT I U M O N C H I C AG O S C H O O L R E S E A R C H2 8
differences remain significant after controlling for
individual teacher characteristics. First, higher achieving
elementary schools continue to show greater availability
and assignment of technology beyond the individual
characteristics of their teachers. Second, schools
whose students are predominantly African-American
continue to show lower levels of computer availability
for teachers than other types of schools.
High Schools
High school teacher reports show greater inequities
by school achievement level and percent low
income than reports from their elementary school
colleagues. The most striking high school finding is
the tremendous gap between selective admissions
and probation high schools. Although a similar
pattern was found in student reports, the differences
in teacher reports are even more striking. In all three
measures, selective schools show levels of teacher
access and use far above the mean while probation
schools are far below.
Mirroring findings among high school students,
teachers' reports of availability, use, and assignment
are lowest in high poverty schools. However, although
students in predominantly Latino schools reported
the lowest availability, teachers in these schools report
the highest availability. Latino schools continue to
show the lowest levels of teacher assignment of
technology, concurring with student reports.
Many of the differences across schools can be
explained by the characteristics of teachers. After
controlling for individual characteristics, only one
school-level difference remains significant. Selective
high schools show much greater availability, teacher
professional use, and assignment of technology than
other types schools regardless of the characteristics of
their teachers.
SUMMARYA digital divide does exist among CPS students in
the degree to which they use computing technology
at home. This divide is largely not replicated in
Chicago's public schools. There are some notable
exceptions, however. Elementary schools that serve
primarily African-American students show less
availability of computing technology for students and
teachers than other elementary schools. The biggest
exceptions, however, exist among high schools;
selective admissions high schools have substantially
more computing technology available to students and
teachers than other high schools, especially compared
to those on probation.■

E D U C AT I O N A L T E C H N O L O G Y 2 9
higher income higher income
low income
low incomeCPS average income
CPS average income
Low
High
system
average
Low
High
system
average
Family Income
African American
Native American
White
Latino
Asian
African American
Native American
White
Latino
Asian
Low
High
system
average
Low
High
system
average
Race/Ethnicity
higher degree
college
high school
some post secondary
less than high school
higher degree
college
high school
some post secondary
less than high school
Low
High
system
average
Low
High
system
average
Parent Education Level
ARE CERTAIN STUDENTS USING TECHNOLOGY MORE THAN OTHERS?Access to Technology at School Use of Technology at School

more than one GE below grade level
GE = grade equivalent or10 months’ learning
average achievement
more than one GE above grade level
more than one GE below grade level
average achievement
more than one GE above grade level
Low
High
system
average
Low
High
system
average
Individual Achievement Level
enrolled in bilingual program
not in bilingual program
enrolled in bilingual program
not in bilingual program
Low
High
system
average
Low
High
system
average
Bilingual Education Status
C O N S O RT I U M O N C H I C AG O S C H O O L R E S E A R C H3 0
Access to Technology at School Use of Technology at School
without disability
with disability
with disability
without disability
Low
High
system
average
Low
High
system
average
Special Education Status

E D U C AT I O N A L T E C H N O L O G Y 3 1
grade 8
grade 9
grade 7
grade 6
grade 10
grade 9
grade 7
grade 10
grade 8
grade 6
Low
High
system
average
Low
High
system
average
Grade Level
female
male
male
female
Low
High
system
average
Low
High
system
average
Gender
Access to Technology at School Use of Technology at School

3 2 E D U C AT I O N A L T E C H N O L O G Y
integrated
more than 85% Latino
more than 85% African American
mixed minority
integrated
more than 85% Latino
more than 85% African American
mixed minority
Low
High
system
average
Low
High
system
average
School Racial Composition: Elementary Schools
integrated
more than 85% Latino
more than 85% African American
mixed minority
integrated
more than 85% Latino
more than 85% African American
mixed minority
Low
High
system
average
Low
High
system
average
School Racial Composition: High Schools
50% or more at norms
less than 20% at norms
20 – 35% at norms
35 – 50% at norms
50% or more at norms
less than 20% at norms
20 – 35% at norms
35 – 50% at norms
Low
High
system
average
Low
High
system
average
Student Achievement Level: Elementary Schools
DO STUDENTS AT CERTAIN TYPES OF SCHOOLS USE TECHNOLOGY MORE?Access to Technology at School Use of Technology at School

E D U C AT I O N A L T E C H N O L O G Y 3 3
selective admissions
on probation
regular
selective admissions
regular
on probation
Low
High
system
average
Low
High
system
average
Student Achievement Level: High Schools
less than 90% low income
over 90% low income
over 90% low income
less than 90% low income
Low
High
system
average
Low
High
system
average
Percent Low Income: Elementary Schools
less than 90% low income
over 90% low income
less than 90% low income
over 90% low income
Low
High
system
average
Low
High
system
average
Percent Low Income: High Schools
Access to Technology at School Use of Technology at School

master’s degree
no master’s degree
master’s degree
no master’s degree
master’s degree
no master’s degree
Low
High
system
average
Low
High
system
average
Low
High
system
average
Level of Education
more than 15
11 – 15
6 – 10
1 or less
2 – 3
4 – 5
1 or less
2 – 3
4 – 5
11 – 15
more than 15
6 – 10
more than 15
6 – 10
11 – 15
2 – 3
1 or less
4 – 5
Low
High
system
average
Low
High
system
average
Low
High
system
average
Years’ Experience
vocational/technical
math
other
English
self-contained
special education
vocational/technical
other
math
English
self-contained
special education
vocational/technical
other
math
self contained
English
special education
Low
High
system
average
Low
High
system
average
Low
High
system
average
Subject Area
ARE CERTAIN TEACHERS USING TECHNOLOGY MORE THAN OTHERS?
C O N S O RT I U M O N C H I C AG O S C H O O L R E S E A R C H3 4
Availability of Technology Professional Use of Technology Assignment of Technology

E D U C AT I O N A L T E C H N O L O G Y 3 5
grades 7 – 8
grades 4 – 6
primary
pre-k/ungraded
high school
grades 7 – 8
high school
grades 4 – 6
primary
pre-k/ungraded
high school
grades 7 – 8
grades 4 – 6
pre-k/ungraded
primary
Low
High
system
average
Low
High
system
average
Low
High
system
average
Grade Level
African American
Latino
White
other
other
African American
Latino
White
other
Latino
African American
White
Low
High
system
average
Low
High
system
average
Low
High
system
average
Race/Ethnicity
female
male
female
male
male
female
Low
High
system
average
Low
High
system
average
Low
High
system
average
Gender
Availability of Technology Professional Use of Technology Assignment of Technology

50% or more at norms
35 – 50% at norms
20 – 35% at norms
less than 20% at norms
50% or more at norms
20 – 35% at norms
35 – 50% at norms
less than 20% at norms
20 – 35% at norms
less than 20% at norms
50% or more at norms
35 – 50% at norms
Low
High
system
average
Low
High
system
average
Low
High
system
average
Student Achievement Level: Elementary Schools
selective admissions
regular
on probation
selective admissions
regular
on probation
selective admissions
regular
on probation
Low
High
system
average
Low
High
system
average
Low
High
system
average
Student Achievement Level: High Schools
more than 85% Latino
mixed minority
integrated
more than 85% African American
integrated
more than 85% Latino
more than 85% African American
mixed minority
more than 85% African American
more than 85% Latino
integrated
mixed minority
Low
High
system
average
Low
High
system
average
Low
High
system
average
School Racial Composition: Elementary Schools
C O N S O RT I U M O N C H I C AG O S C H O O L R E S E A R C H3 6
DO TEACHERS AT CERTAIN TYPES OF SCHOOLS USE TECHNOLOGY MORE?Availability of Technology Professional Use of Technology Assignment of Technology

more than 85% Latino
mixed minority
integrated
more than 85% African American
mixed minority
integrated
more than 85% African American
more than 85% Latino
mixed minority
more than 85% African American
more than 85% Latino
integrated
Low
High
system
average
Low
High
system
average
Low
High
system
average
School Racial Composition: High Schools
less than 90% low income
more than 90% low income
more than 90% low income
less than 90% low income
less than 90% low income
more than 90% low income
Low
High
system
average
Low
High
system
average
Low
High
system
average
Percent Low Income: Elementary Schools
less than 90% low income
more than 90% low income
less than 90% low income
more than 90% low income
less than 90% low income
more than 90% low income
Low
High
system
average
Low
High
system
average
Low
High
system
average
Percent Low Income: High Schools
E D U C AT I O N A L T E C H N O L O G Y 3 7
Availability of Technology Professional Use of Technology Assignment of Technology


What Encourages TechnologyUse in Schools? 4
E D U C AT I O N A L T E C H N O L O G Y 3 9
In This Chapter We Show:
■ Factors that directly affect student technology use at school
■ Factors that directly affect teachers' use and assignment of technology
■ School structures that facilitate technology use
n general, Chicago public schools
have shown only modest progress in
integrating educational technology
in the classroom. Some schools, however,
have exceptional technology programs.
Their adoption of new technology practices
both in and outside of the classroom is due
to more than demographic characteristics
and participation in systemwide programs.
What about these schools makes them
different than others? What are the supports
that encourage technology use?
We organize our discussion of school
structures that influence productive
technology use around a framework of
essential supports that builds on earlier
Consortium studies of effective school
development (see Figures 8 and 9).30
We discuss each element of the framework
separately, first by looking at factors that
affect student use, and then at those that
affect teacher use and assignment. Although
we present some simple charts of bivariate
relationships to demonstrate how variables
of the framework are related, our conclusions
are based on a series of statistical models
presented in Appendix C. In addition to
our statistical analyses of student and
teacher survey data, we also conducted
fieldwork in two model and one emerging
school. The stories of Burley, Hayt, and
Murray elementary schools provide a
perspective on some of the obstacles
and opportunities that many CPS schools
face as they move foward.
I

C O N S O RT I U M O N C H I C AG O S C H O O L R E S E A R C H4 0
teachers and staff
humanresource
support fortechnology
technologyavailabilityto teachers
homeuse/background
teacherprofessional use
teacherassignment
belief in technologyprofessional development
professional community
Note: Absence of an arrow indicates that this relationship did not remain after controlling for other factors.
Figure 9: FactorsThat DirectlyAffect Teachers’ Use andAssignment of Technology
students
technologyavailabilityto students
homeuse/background
belief in technology
teacherassignment of
technology
studentuse of
technology
Note: Absence of an arrow indicates that this relationship did not remain after controlling for other factors.
Figure 8:Factors ThatDirectly AffectStudents’ Useof Technology

E D U C AT I O N A L T E C H N O L O G Y 4 1
Challenge #1: Hardware
Hayt and Burley happened on good fortune on this point.Dr. Williamson and Ms. Laho were both faced with theimmediate need of securing appropriate hardware for theirschools. Dr. Williamson approached TCI, a cable companynew to the community and looking for a school partner,and convinced them that Hayt would be a good match. TCIprovided the school with over a quarter of a million dollarsworth of hardware, software, and training. At Burley, in thesecond year of Ms. Laho's principalship, the state threatenedto recall a substantial amount of rollover funds. Ms. Lahochose to invest this money in technology and that yearBurley spent tens of thousands of dollars outfitting eachclassroom with a computer.
Challenge #2: Networking and the Internet
It took patience, determination, and discretionary fundsto get Hayt and Burley elementary schools wired for theInternet. Although e-rate grants are a great opportunityfor schools to get support to wire their buildings, schoolsmust first demonstrate that they can plug computers inand use them. This means that many schools need a powerupgrade before they can take advantage of the e-rate grant.Ms. Laho made the decision to commit a third of Burley'sdiscretionary funds ($87,000) to pay for power upgradesrather than wait for the central office to provide it.
Challenge #3: Training and Support
Once the resources were in place, both principals workedto help their teachers become more comfortable with theirnew instructional tools. They paid for technical supportpositions with their discretionary funds because central
Strong Leadership and Extraordinary Effort:The Story of Two Schools
Hayt and Burley elementary schools and their principals are fairly similar. Their student enrollments are ethnically diverseand fairly high achieving. Both have efficient operations and administrative teams and involved Local School Councils(LSCs). Their principals share an excellent rapport with teachers, parents, LSCs, and the central office. They seek theirteachers' input and encourage them to pursue innovative ideas. These principals are willing to take risks and work hardto make the contacts necessary to secure the resources their schools need. Their stories prove that any school's efforts tobuild a strong technology program require a continual focus on time and money.Dr. Williamson, principal of Hayt Elementary, and Ms. Laho, principal of Burley, had both worked at their schools prior to becoming principals. When they assumed their new positions, each adopted technology as a key component of their new administrations. In both cases, they received support for their technology initiatives from teachers, parents, and their LSCs.
office did not provide funding to staff these positions.Moreover, candidates were difficult to find; they wantedsomeone with both technical and instructional expertisewho would work for the available salary. The need for training did not end once the position was filled,however. Burley had a lot of success with the CPS TechnologyInfusion Program, which provided professional development forteachers, but that program was dissolved. Hayt participated inmany different partnerships with universities and othergroups, including the Teachers Academy for Math and Science(TAMS); Northwestern University's Collaboratory; theCenter for Learning Technologies in Urban Schools (LeTUS); LaSalle Bank; the Chicago Public Libraries; andDePaul, Governor State, Loyola, and Roosevelt universities.Dr. Williamson says she looks for programs that come to her school, provide coaching, and conduct follow-up sessions. Dr. Williamson says she thinks of her school as a laboratory. Many of the programs her school participated in were not ones she found herself, but that found her, "People hear what you're working at and they want to know about that. And people will help you, I think, if you'retrying to help yourself."Although Dr. Williamson and Ms. Laho continually look forsupport and training opportunities for their teachers, they also expect their staff to take advantage of what has been made available. Ms. Laho takes a patient but firm approach,saying you have to "personalize your push" if you want teachers to "take a risk and devote their personal time to it." At Hayt, Dr. Williamson feels her teachers are ready for some tasks to be required, such as submitting lesson plans electronically. "After a while," she says, "you have to come to a conscious decision that you can't just say, 'Well, I hope you come along with this.'"

C O N S O RT I U M O N C H I C AG O S C H O O L R E S E A R C H4 2
STRUCTURES THAT ENCOURAGESTUDENT TECHNOLOGY USEAccess to Technology. The most obvious way that
schools facilitate students' technology use is ensuring
that there are a sufficient number of working computers
for students to use. Quite simply, students are unlikely
to use technology frequently if they have limited
access to computers. In fact, availability explains
almost half of the variation between schools in student
use of computers at school.31 Small improvements in
computer availability are associated with substantial
increases in student use, especially in schools with
limited access. As shown in Figure 10, this continues
until most of the students report sufficient access, at
which time it weakens but persists (the vertical line
represents the point at which all students report
sufficient access).
Even in our technology-rich fieldwork schools,
principals and teachers faced the problem of providing
their students with adequate access. Because greater
use leads to greater demand for resources, the
problem of availability persisted. For example, despite
having one to three computers in each classroom and
a computer lab, one principal continued to feel her
school didn't have enough computers.
1 32 54 6 7 8
availability of technology reported by students (10 point scale)
stud
ent u
se o
f tec
hnol
ogy
(10
poin
t sca
le)
5
6
7
8
4
3
2
all students reportsufficient access totechnology
at least some studentsreport insufficientaccess to technology
Figure 10:
RelationshipBetweenTechnologyAvailability andStudents Useis Strongest inSchools withInsufficent Access

E D U C AT I O N A L T E C H N O L O G Y 4 3
There aren't enough computers in the class-room and there aren't enough computers inthe lab to send a whole group of kids in there.So logistics is one of those obstacles that weare constantly trying to overcome. This yearwe literally, for intermediate and upper gradechildren, split the class in half; half would goto the library and half would go to the com-puter lab and the teacher would put togethera unit of some kind where French researchwas appropriate in the library or draft writingor whatever and web research or web designwas what they could do in the lab, because wecan only fit half of them.
Even when teachers are completely satisfied with
current availability, there is always the concern about
replacement of outdated equipment. As one teacher
said, "I'm very, very, very lucky to be able to access
these laptops, but they are getting outdated...So I
foresee when these start to get shot, I might have
one more year out of them, then what do I do?"
Integration into Assignments. Once schools
have sufficient computers, the most direct way to
encourage students' technology use is by incorporating
it into assignments. In schools where many teachers
integrate technology, students are much more
likely to report substantial computer use at schools.
The extent to which teachers are able to do this
also depends upon the degree to which technology
is available.
Students' Backgrounds and BeliefsInfluence UseStudents come to school with various levels of
experience with computers at home. They also have
their own beliefs about the benefits of using new
technologies. Although both of these factors, home
use and beliefs, might be expected to influence the
level of student use at school, we found that beliefs
are a more important determinant. Students who
believe in the utility of technology are far more likely
to use computers at school whether or not they use it
substantially at home. Students' computer use at
home is only weakly associated with school use.
Students who do not have access to computers at
home are only slightly less likely to use technology
intensively at school.32
The relationship between students' beliefs about
technology and the extent of their use is probably
bi-directional. Through providing adequate computer
access and engaging assignments, schools are able to
build enthusiasm for technology among students
who would otherwise have had little exposure. On the
other hand, students who are already enthusiastic will
seek it out more when it is readily available. This is
good news for schools—although they may have little
influence over students' use of technology at home,
they can have a substantial impact on school use by
exposing students to technology and helping them
recognize its utility.

C O N S O RT I U M O N C H I C AG O S C H O O L R E S E A R C H4 4
STRUCTURES THAT ENCOURAGETEACHER TECHNOLOGY USE
Teachers' Individual CapacitiesPersonal Use. Not surprisingly, teachers who are
comfortable with technology and use it often are
more likely to expect their students to use it as well.
The strongest predictor of teacher assignment of
technology is the extent to which they use technology
for their own professional work.33 Likewise, teachers
that use technology extensively at home are more
likely to use it for their professional work at school.34
Many teachers feel self-conscious about their lack
of computer skills compared to other professionals,
and sometimes even to their students. One teacher
joked, "My parents...know so much more about
technology than I do, my sister [too], and they are
way ahead of me....I am like the family dope when it
comes to technology....But here, yes, I'm the 'Deputy
Technology Coordinator.'" Unfamiliarity with
technology leads to anxiety about how it will work
and how to deal with problems when they arise.
As one principal said, "If [the computer] doesn't work
exactly the way it's supposed to work, [the teachers]
get very frustrated and are afraid to fool around for
fear they are literally going to break the computer."
Without the freedom to get comfortable with
technology, teachers sometimes find starting to use
it difficult. One principal found a program that
offered low cost laptops to teachers to be an excellent
way for teachers to become more comfortable,
"Time is in my mind the biggest obstacle....So, being
able to provide teachers with a computer at home
gave them a little flexibility with regard to time and
playing around with it, which is what one has to do."
Professional Development. Increasing teachers'
comfort level with computing technology is only
the first step in building a technology-rich curriculum.
Most teachers need additional support to incorporate
these new tools into their professional and classroom
work. One principal realized that, despite having a
number of fairly computer-literate teachers, she
had to do more:
They're on the Internet at home, they use itfor research for their work, they're using it in all the kinds of ways that people do on apersonal level...but how does it translate intothe classroom? And so that was an eye openerfor us. Because I think we all felt and I felt thatif you personally knew how to use this well,the translation into using this in the classroomwould not be that hard. But actually it's such adifferent experience. What you need to knowand what you need to think about is so differentthat in that sense they were starting over.
In our survey of teachers, we asked not only if
teachers had taken professional development, but
also if they felt it was meaningful. We found that
teachers who reported receiving useful professional
development were more likely than other teachers to
integrate it into their classroom assignments and to
use it for their own professional work.35 In fact,
differences in professional development experiences
explain a substantial proportion of the school
variation in teachers' assignment and use of technology.
This suggests that groups of teachers at some schools
received professional development that significantly
increased the degree to which they use technology
for their own work and integrate it into their
classroom teaching.

E D U C AT I O N A L T E C H N O L O G Y 4 5
In our fieldwork schools, teachers and principals
seemed to find professional development most helpful
when it provided: (1) training in the school for a
group of teachers who would be working together
afterwards; (2) modeling by other teachers in the
classroom with students; and (3) time and guidance
to develop lessons or other materials that could
be directly translated to teachers' own classrooms.
One principal explained:
[We] found that just sending someone out toa workshop, oftentimes it's in such isolation.You don't get the whole impact of what theygot, for the whole group....So we actually wantyou to come into the classroom, team withthat teacher, model a lesson, show that personhow they can do that better. So we tend tolook for those kinds of staff developmentopportunities.
Another teacher described what she found most
useful about her professional development program,
"Well, it allowed you to create something that was
useful. Because a lot of times you get these nice
resources when you go to an in-service or whatever
and it sounds good, but in terms of having time to
take it from that theory to your specific needs and
then using it, it's usually lost."
Beliefs about Technology. Teachers' attitudes also
play a significant role in the degree of their technology
use. Those who believe in its utility are most likely
to use it for their own work and to assign it to
students. Attitudes about the value of technology
for students are shown to be important, even
after controlling for the level of teachers' personal
use. This suggests that even if teachers are not
especially comfortable using technology in their
own professional work, they may ask their students
to use it if they think it is a beneficial learning tool.36
Teachers' ability to use technology, their belief in
its importance, and the quality of their professional
development represent their individual capacity to
promote technology-rich learning. In our quantitative
analyses, individual capacity accounts for 40 to 70
percent of the differences between schools in teachers'
technology use, depending on the school (elementary
or high school) and type of use (teachers' own
professional use or assignment to students).
Therefore, teachers' personal capacities and their
development of them are strong determinants of
how extensively technology is used in a school.37 It is
important to stress, however, that individual capacity
is shaped by the larger school environment.

C O N S O RT I U M O N C H I C AG O S C H O O L R E S E A R C H4 6
School-Level Structures that PromoteTeachers' Technology UseSupportive Professional Community. A key
structural element that shapes teachers' capacity to
integrate technology into their teaching is the degree
to which a professional community promotes
technology use. Professional development is more
productive when a group of teachers is able to share
what they've learned and master and develop it
further together. Working as a team to locate and
evaluate resources can make the overwhelming
abundance of books, websites, and training opportunities
more manageable for teachers. Teachers who learn
new approaches also can serve as models for others.
In our fieldwork schools, new technology practices
often started with a few teachers and spread as the
teachers shared what they learned with others.
As one technology coordinator said, "Let's say there
are three teachers in a unit, if one starts doing some-
thing and then shares it, then the other teacher says,
'Well maybe I could try that. Can you help me do
that?'" A principal shared a similar experience,
"Once that first group was trained and had worked
for that year then I looked for some teachers for the
second year....And then of course we made sure that
the teachers who had already [gone through the
training] assured the new ones that they would help
them....and I think that was a big piece that was
very important."
Our survey data confirms the importance of professional
community. In schools with a strong professional
community around technology, teachers report
participating in more professional development and
are more likely to report that those experiences were
positive.38 Of course, this relationship is reciprocal;
as teachers work together on professional development
they develop a stronger professional community.
Adequate Access to Technology. Even the most
computer savvy teacher cannot be expected to use
technology if he does not have reliable access to the
equipment he needs. For beginning teachers, limited
availability may be so frustrating that they retreat
from any effort to integrate it into their teaching.
The more technology is available, the more likely
teachers are to use it for their own professional work,
and the more likely they are to assign it to their
students. Furthermore, teachers' ability to
integrate technology into their teaching is shaped
by the degree to which computers are available for
students, regardless of what is available for their
own work.39 In schools where there is greater access,
teachers assign and use technology more, regardless
of their individual capacity.40

E D U C AT I O N A L T E C H N O L O G Y 4 7
Human Resource Support for Technology.
In both survey and case study data, we find that the
extent to which technology is available to teachers
and students is strongly associated with the amount
of human resource support for technology in the
school. Survey data show very strong positive
relationships between human resource support and
students' and teachers' reports of availability.41
One principal explained that her school learned the
hard way that a technology coordinator was crucial:
We did go through a number of years wherewe...thought well, there's enough of us whoknow all these things about computers thatwe can do this ourselves. Including keepingthem all running. And what we discoveredthe hard way was that we could not. So it'sunfortunate that I think that there isn't arecognition at large yet that really a technolo-gy coordinator in every school is a must. It'snot a luxury. It's not a luxury. And we reallydid do I think everything possible to avoidspending the money in that way.
Another principal related a similar feeling,
Stuff happens with the hardware and not thatsomebody did something wrong; it just happens.And to have somebody in the building who isable to go to the room and fix it or talk to theteacher....If there isn't that kind of person in theschool, I can see why if something breaks orsomething doesn't work right, it just sits therebecause you don't have the $400 an hour orwhatever they charge to come out and fix the machines.
Beyond simply keeping the equipment running,
which in itself is a demanding task, the teachers
and principals we spoke to valued their technology
coordinators for many things: teaching basic computer
skills; modeling lessons; assisting teachers by providing
techniques, programs, tips, resources, and even
specific ideas. Not surprisingly, our survey data also
show that human resource support increases the
likelihood that teachers will incorporate technology
into their teaching (see Figure 11).42 One case study
principal described what happened when they hired
their technology coordinator:
It makes a statement that we really are goingto put our money where our mouth is and wevalue this....Because our discretionary moneyis small, we talk long and hard before wespend it. Then also I think when you havesomeone come in who knows what they needto know about instruction...that's exciting tothe teachers cause it's a colleague that theycan work with...who also knows this othersubject piece, which is what technology cando and how to use it, it's pretty exciting.
Finding a technology coordinator who fulfills both
these needs is another challenge. Several of the case
study principals discussed the difficulty of staffing
these positions:

C O N S O RT I U M O N C H I C AG O S C H O O L R E S E A R C H4 8
I have a staff here who really understands how to
teach and they understand what current research
says. I cannot have somebody come in who
cannot support them instructionally, otherwise
what's the point?...It took me two full years of
interviewing to find somebody who both knew
the technical side...and at the same time knew
what good instructional practices look like and
be able to support that.
Such assistance is not limited to a technology
coordinator per se. In our fieldwork schools we
observed not only technology coordinators helping
teachers, but also college and graduate student
volunteers, student teachers, and outside groups
working in schools. A dramatic illustration of the
benefits of extra technology support took place in a
classroom of third graders learning to graph data for
the first time. There were four adults (the technology
coordinator, her assistant, the classroom teacher, and
her student teacher), all busy throughout the class
period responding to raised hands. This lesson was
greatly facilitated by the number of teachers and
assistants. Imagine the enormous challenge faced by
an individual teacher, new to this skill herself and
alone in a classroom, dealing with a constant stream
of both substantive and technical questions, as well as
equipment glitches. To be able to integrate
technology into the complex web of classroom life,
and to integrate it well, schools need more than just
equipment or training. Technology coordinators and,
in some cases, external partners help teachers direct
their own professional development (see Figure 12).
low (bottomquartile)
high (topquartile)
human resource support
perc
ent o
f sch
ools
in to
p qu
artil
efo
r tec
hnol
ogy
inte
grat
ion
0
60
50
40
30
20
10
4
18
31
47
Figure 11:
Teachers AssignTechnology MoreOften WhenHuman ResourceSupport is High

human resource support
perc
ent o
f sch
ools
in to
p qu
artil
e fo
rpr
ofes
sion
al d
evel
opm
ent
0
60
50
40
30
20
10
4
15
25
56
low (bottomquartile)
high (topquartile)
Figure 12:
Teachers atSchools withSubstantialHuman ResourceSupport AreMore Likely toHave PositiveProfessionalDevelopmentExperiences
E D U C AT I O N A L T E C H N O L O G Y 4 9
THE IMPORTANCE OF SCHOOLLEADERSHIPMoving a school toward effective technology use is a
multi-step process—first there's the need for access,
and then there's training. The key to creating any
technology-rich environment, especially in a decen-
tralized district like Chicago, is a school's leadership.
Introducing and integrating technology demands an
enormous amount of resources; leadership must be
committed to making technology a priority. As one
technology coordinator explained, "It costs an awful
lot of money to do all of this stuff, and it's a terrible
money-hungry beast because there is always new
stuff coming out." Most school budgets are not
sufficient to provide equipment, power upgrades,
and wiring. Someone must write grants, seek and
accept donations, and implement pilot programs.
In the absence of district funding, CPS principals
have to find alternative resources to provide adequate
technology resources and support. Principals in our
technology-rich fieldwork schools did an enormous
amount of networking. They and their technology
coordinators were always seeking new resources.
A teacher gave the following example:
You can't do this unless...the administrationmakes a commitment to say—okay, we'regoing to do this and we're going to find themoney to do this. We had a guy here, he wasthe math/science coordinator, but basically allhe did was write grants and for, I think, twoor three years in a row, he brought $400,000a year into the building....You just have tohave somebody...[who] can give a couple ofhours every day to getting the grants written....But, if the administration doesn'tbelieve in it, then it's not going to happen.
Not surprisingly, our survey data show that technology
availability in school is strongly associated with
principals' support for technology (see Figure 13).

C O N S O RT I U M O N C H I C AG O S C H O O L R E S E A R C H5 0
Principals are also the driving force behind developing
staff capacity, which they do by hiring teachers who
are excited by the school's technology plan, and by
hiring human resource support. Principals influence
the kind of professional development that teachers
receive and can encourage teachers to incorporate
new skills into their work. They promote new
practices by giving teachers time to learn new skills,
prepare new lessons, and work with their colleagues.
Principals also define expectations for technology use
in the school.43 One principal argued that this last
function was very important, "You also have to be
willing to not only talk to your staff as a group, but
talk to your teachers one at a time and say, 'I really
think the time is right for you to do this. This is in
place, this opportunity is here, and really, you know,
I'm hoping you'll reach out and participate,' and I
think you have to take the time to do that."
Survey data confirm the important roles principals
play in developing their staff's technology capacity.
This support is not only strongly related to the
degree that human resource support is available in
the school, but also to the quality of teachers'
professional development and the strength of the
school's professional community (see Figures 14
and 15). Finally, school leaders are often the authors
of their school's vision of how technology should
be used and are responsible for its realization.
Through their support and leadership, they foster
environments where teachers are comfortable with
possible failure and where teachers receive the
training they need. Such direction is not limited to
the principal alone. In one case, the LSC initiated the
school's commitment to technology by finding a way
to fund a technology coordinator.
low (bottomquartile)
high (topquartile)
degree of principal support
perc
ent o
f sch
ools
in
top
quar
tile
for a
cces
s
0
60
50
40
30
20
105
16
25
55Figure 13:
Teachers ReportMore Access toTechnology inSchools withStrong PrincipalSupport

E D U C AT I O N A L T E C H N O L O G Y 5 1
One challenge principals must overcome is ensuring
that students from all classrooms receive similar
opportunities. Survey data show many more
differences in technology use among teachers and
students in the same school than differences across
schools.44 A fieldwork principal recognized this
low (bottomquartile)
high (topquartile)
degree of principal support
perc
ent o
f sch
ools
in to
p qu
artil
e fo
r h
uman
reso
urce
sup
port
0
60
50
40
30
20
10
1
16
27
56Figure 14:
Principal SupportIs StronglyRelated toGreater HumanResource Support
degree of principal support
low (bottomquartile)
percent of schoolswith substantialparticipation in pro-fessional developmentfor technology(top quartile)
percent of schoolswith a strong pro-fessional communitycentered aroundtechnology(top quartile)
high (topquartile)
low (bottomquartile)
high (topquartile)
perc
ent o
f sch
ools
0
70
60
50
40
30
20
10
1
11
28
61
2
15
26
57
Figure 15:
Principal SupportPromotesProfessionalDevelopmentand aProfessionalCommunityCentered AroundTechnology
as a problem, "I think another challenge is to try to
find some equity across the building...so that every
child, regardless of whose classroom they're in, has
this advantage of having a really truly integrated
curriculum with technology as one of its pieces."

C O N S O RT I U M O N C H I C AG O S C H O O L R E S E A R C H5 2
SUMMARYCreating technology-rich learning environments
takes more than a one-time infusion of computers,
or even a few professional development seminars on
basic technology use. As Figure 16 shows, many
distinct components are necessary to make technology
a regular part of students' academic lives. First, school
leadership must be committed to developing students'
and teachers' technology capacities, and have a vision
to meet those goals. Crucial to leaders' commitment
is providing financial support. Substantial financial
resources must be found and made available to make
a significant initial investment and provide ongoing
support, upgrades, and expansion. Computers,
infrastructure, and human resource support are all
necessary. Some districts may be committed to adopting
technology and so work with schools to secure
appropriate funding. In Chicago, however, the handful
of schools that have highly integrated technology
programs have done so only through very active and
creative efforts.
It is important to stress that simply providing
adequate resources is not enough to ensure that they
are used well. Teachers' capacity to use technology
must be developed—they must feel comfortable with
computers, how they work, and what the possibilities
for their use are. Teachers need continual support to
learn how to incorporate technology into their teaching.
It is easiest to achieve this when there is a professional
community around technology; teachers need a
students
technologyavailabilityto students
homeuse/background
belief in technology
studentuse of
technology
teachers
and staff
humanresourcessupport fortechnology
technologyavailabilityto teachers
homeuse/background
teacherprofessional use teacher
assignment
belief in technologyprofessional development
professional community
principalleadership
Figure 16:Essential Supportsfor EducationalTechnology

E D U C AT I O N A L T E C H N O L O G Y 5 3
New Technology Initiatives of the Chicago Board of EducationSince spring 2001, the Chicago Board of Education established a new entity called the eBrigade to addresstechnology issues in CPS schools and provide the districtwith a strategic plan. Members of the eBrigade includecommunity leaders, local and national educators, administrators, and technology professionals. TheeBrigade's first task was to assess the role education technology plays in CPS schools and in other districts.They spent 18 months interviewing teachers and administrators, conducting best practice studies, organizing focus groups and community discussions, andvisiting schools. A list of findings and plans can be foundon the eBrigade's website (http://ebrigade.cps.k12.il.us).
The eBrigade has begun to implement some changes to CPS's technology structure, which includes massive reorganization of departments and staff. The Department of Instructional Technologies (DoIT) was created within theOffice of Professional Development to provide leadership,support, and development of appropriate technology training for teachers and staff. DoIT has also developed assessment tools and strategies to evaluate current professional development offerings and the current levels of computer and Internet proficiency of CPS teachers. The department has established the Curriculum, Instructionand Technology Integration (CITI) program to integrate technology into all curriculum departments.
The eBrigade has listed the following accomplishments on its website:
■ Wiring all CPS high school classrooms, computer labs, and libraries
■ Completing minimum wiring configuration for 50 additional elementary schools,
■ Providing all principals with email accounts
■ Distributing 6,000 laptops and web-based email accountsto high school principals, teachers, librarians, and technology coordinators, and distributing refurbishedcomputers to schools.
Before the end of 2002, the eBrigade also plans to implementseveral more initiatives, including:
■ Creating online learning communities for high school teachers and librarians
■ Providing email to teachers
■ Providing one computer to each high school teacher and graphing calculators for all high school students
■ Supplying 140 elementary schools with minimum configuration
■ Developing a strategy to provide schools with maintenanceand support.
community in which they can help each other, model
lessons, and receive support from the principal and
technology specialists. We found that teachers'
individual capacity with technology, which includes
their personal use of technology, beliefs about, and
the quality of their professional development, was a
strong determinant of their success in bringing
technology into the classroom. Moreover, this was
greatly shaped by the human resource support they
received and the extent to which technology was
available for their use.
Finally, students need to see technology in action
and believe in its importance for their academic success
and future. Students who believe in technology's
utility are more likely to use it at school, regardless of
their home access or experience with it. Schools can
work to compensate inequities in computer use at
home by providing access at school and encouraging
technology use by actively promoting its integration in
classroom lessons and assignments.
Those schools that can least afford to allocate monies
for investment in technology may be those schools that
serve students who are least likely to have computers at
home. It may be difficult for a school on probation to
rationalize spending for a new technology initiative at
the expense of other instructional programs. As long as
technology funding is left to the discretion of schools,
CPS can expect wide variation in computer use among
its schools.


Where Does Chicago Stand and Where Does It Need to Go?5
E D U C AT I O N A L T E C H N O L O G Y 5 5
tudents and teachers in Chicago’s
public schools believe that
technology is important for both
succeeding academically and preparing for
the labor market. And yet, use across the
system is rudimentary; most students do
only occasional word processing and
Internet searches and most teachers only
use technology to create worksheets and
tests. Some CPS schools, selective admissions
high schools in particular, have been very
successful in creating technology-rich
learning environments. Many of these
schools were built or remodeled in recent
years, however, and technology was a central
focus of both their physical and curricular
designs. A few other schools have successfully
procured sufficient technology resources
and integrated it into their teaching.
This was accomplished, however, only by
the very active efforts of school leaders
committed to this goal. In most schools, a
few students and teachers are comfortable
with technology and use it intensively while
the rest use it rarely, or only for simple
tasks. There are even some schools that
have few to no working computers and
no Internet capacity.
Our portrait of technology use in CPS
schools is not altogether surprising.
Educational technology is an enormous and
costly innovation, particularly for a large
urban school district like Chicago.
Moreover, its adoption is complicated by
the decentralized nature of Chicago’s system.
In general, technology has not been a
primary focus of the administration
(the Board has taken steps to change this
with its creation of the eBrigade, see page
53). This has left individual schools in the
position of finding their own resources.
Besides the obvious obstacles of securing
expensive hardware, schools have had to
initiate many of their own renovations
to their physical plants such as power
upgrades and Internet wiring. Many of
the supports crucial to developing a
technology-focused school, such as qualified
technology coordinators and effective
professional development, are difficult to
both find and afford.
S

C O N S O RT I U M O N C H I C AG O S C H O O L R E S E A R C H5 6
Although it is easy to identify the reasons why
Chicago lags behind other cities, the business world’s
technological demands are changing and CPS students
must be prepared to compete with students from smaller
and more advantaged districts. Equity analyses indicate
that CPS schools are largely not replicating the digital
divide that is currently present in homes both locally
and across the nation. At the end of the day, however,
low levels of equitably distributed technology access
and use at school will not compensate for students’
infrequent home use. In The Connected School:
Technology and Learning in High School (2001),
the authors observe, "Given differences in home access
and support, students in urban schools need not just
equal but better access to technology and high-quality
learning activities involving technology if they are to
get to the same place as their peers in well-to-do
suburban schools."45
engage students in new ways of learning. Email and
electronic bulletin boards facilitate communication
among teachers, students, and parents. In a select
number of CPS schools, a critical mass of teachers is
using technology in meaningful and innovative ways.
These schools have done so by making technology
integration a priority and mobilizing all their resources to
realize this vision. Can we ask this of every school in a
struggling urban district? Currently, elementary schools
that are predominantly African American and high
schools on probation show lower levels of technology
access for students and teachers. It will be difficult for
many of these schools to justify allocating large
portions of their budget to new technology. Without a
change in district policy, most are unlikely to raise their
current levels of access and use.
In this report, we identify two major steps in creating
good technology programs: adequate resources
(i.e., hardware and human resource support), and
developing teachers' individual capacity to use
technology well. The typical CPS school has yet to
overcome the first obstacle. They must not only find
funding to purchase hardware, but also ensure that
technical assistance and upgrades will be available.
The scarcity of computing resources in CPS high
schools may be lessening with the Board's new
initiative to provide laptops for teachers and
administrators and to establish networks in schools,
but a one-time infusion of hardware will not be
sufficient to bring about truly integrated technology
use on a systemwide level.
Even though there is limited technology use in
most CPS schools, those teachers who are able to use
it in meaningful ways are scattered; only a few
schools are able to boast a critical mass of teachers
who are maximizing technology's potential in the
Although it is easy to identify thereasons why Chicago lags behind othercities, the business world's technologicaldemands are changing and CPS studentsmust be prepared to compete with students from smaller and moreadvantaged districts.
The schools we visited illustrate what can be done
to engage students and provide them with current
and often unique information with unprecedented
speed and convenience. If used well, the Internet
brings the world into the classroom. Demonstrations
and simulations can make abstract concepts tangible.
Computers provide immediate feedback on tasks and

E D U C AT I O N A L T E C H N O L O G Y 5 7
classroom. Many new teachers are entering schools with
knowledge of how to use computers for their own work,
but they have not been prepared to integrate it into
assignment. Some experienced teachers do encourage
students to use technology, but they are not entirely
comfortable with the tasks they are asking their students
to do. Once schools have a sufficient number of reliable
computers for students and teachers, they must develop
the capacity of their teachers.
Building on previous Consortium research on
the necessary organizational supports for quality
professional development, we find that teachers
require (1) time to participate in training and to
evaluate new ideas; (2) principal leadership to
provide goals and secure resources; and (3) a
professional community where teachers can
collaborate and learn together.46 We find that teachers
appreciate professional development that produces
classroom-ready lessons so that evaluating and working
through new skills can take place at the same time.
Many teachers also prefer professional development
that models techniques in the classroom and encourages
interaction and collaboration among colleagues.
Additionally, the presence of an expert at the school
who is knowledgeable about technology's capabilities
and how it can aid in instruction can greatly facilitate
teachers' adoption of new practices. A technical
coordinator provides many kinds of support to
teachers—from ensuring reliable access to working
hardware and software, to identifying quality
professional develop opportunities, to serving as an
advisor before, during, and after implementation.
Neither of these obstacles will be overcome,
however, if school and district leadership is not
committed to the goal of creating technology-rich
learning environments for CPS students. If the
district fails to commit to this goal, it will be up to
individual principals and LSCs to see that their
schools get the resources and support their students
and teachers need. The major challenge the district
faces is to ensure that technology development takes
place in all schools in the system. The major challenge
principals and LSCs face is to ensure that develop-
ment happens throughout their schools.
In this report, we identify two major stepsin creating good technology programs:adequate resources (i.e., hardware andhuman resource support), and developingteachers' individual capacity to usetechnology well. The typical CPS schoolhas yet to overcome the first obstacle.


E D U C AT I O N A L T E C H N O L O G Y 5 9
SURVEY PARTICIPANTSStudents: We collected surveys from 59,663 elementary and 28,069 high school students and used them in our
analyses. This represents 59 percent of all students in grades six through ten. Of these students, 51 percent were
female; 45 percent were African American; 38 percent were Latino; 4 percent were Asian; and 12 percent were white.
Teachers: We collected surveys from 8,572 elementary and 2,642 high school teachers and used them in our
analyses. All teachers were surveyed, regardless of grade taught. Of these teachers, 79 percent were female;
31 percent were African American; 12 percent were Latino; 2 percent were Asian; and 48 percent were white.
Fifty-eight percent had earned a degree past a bachelor’s. Six percent were new to teaching (less than one year)
and 46 percent had been teaching for more than 15 years. Twenty-five percent taught pre-kindergarten to
second grade, 24 percent taught grades three through five; 41 percent taught grades six through 10 (grades in
which students were surveyed); 7 percent taught grades 11 and 12; and 3 percent taught ungraded classrooms.
Twenty-five percent more did not identify the grade they taught.
Schools: Surveys were sent to 577 schools, of which 434 participated (75 percent). Only a small number of
schools were excluded from the survey. These included alternative schools and child care centers.
FIELD SCHOOLSA list of potential field schools was developed by selecting elementary schools that scored in the top quartile
on four of our measures of technology availability and use (teachers’ professional use of technology, teachers’
assignment of technology, having a computer in the classroom, and using a computer daily or almost daily at
school). Because our survey measures indicate quantity of use but not quality, we also consulted a number of
experts with experience working on technology in CPS. These included individuals at CPS working with the
Technology Infusion Planning (TIP), other researchers doing fieldwork in schools and members of groups such
as CUIP (Chicago Public Schools and University of Chicago Internet Project) and LeTUS (the Center for
Learning Technologies in Urban Schools) that were working with CPS schools to develop technology programs.
We chose schools from different regions when making our final selections. One school declined to participate
due to scheduling conflicts.
Appendix A Further Details on the Methods Used in Analyses

C O N S O RT I U M O N C H I C AG O S C H O O L R E S E A R C H6 0
MEASURES USED IN ANALYSISAll measures were constructed using Rasch scaling methods.
StudentsStudents Attitudes Toward Technology. Students’ belief that use of computers or the Internet will benefit
them in terms of preparing them for the workforce, assisting them with class work and adding to their
enjoyment of class. Individual reliability = 0.78; school reliability = 0.54.
Items are answered on a four-point, strongly disagree to strongly agree scale:
■ Learning how to use computers and the Internet will help me get a job.■ Learning how to use computers and the Internet helps me do better in my classes.■ Using computers and the Internet makes class work more fun.
Category Students
Very positive strongly agree that learning computers will help them get a job and do better in their classes and that computers make class work more fun.
Positive agree with all items.
Negative disagree with all items.
Very negative strongly disagree with all items.
Access to Computers. Access to computers measures the extent to which students report computer hardware is
available to them. A high score indicates greater availability. Individual reliability = 0.44; school reliability = 0.88.
Items are answered on a four-point, strongly disagree to strongly agree scale:
■ At school I can usually find an available computer to use for homework.■ My school has enough computers for students to use.
Category Students
Ample strongly agree with both items
Positive agree with both items.
Negative disagree with both items.
Very negative strongly disagree with both items.
Student Use of Technology. Student use of technology measures the extent to which students report using a
computer at school for various activities including practice drills, word processing, research on the Internet
and creating presentations. A high score indicates more frequent and diverse use of technology in school.
Individual reliability = 0.67; school reliability = 0.90.

E D U C AT I O N A L T E C H N O L O G Y 6 1
This school year, how often do you use a computer AT SCHOOL for the following things? (Never, Once or
Twice a Semester, Once or Twice a Month, Once or Twice a Week, Almost Every Day)
■ Practice drills (for example, math problems, vocabulary, spelling)■ Analyze or graph data (in Excel, for example)■ Word processing or typing (in Word, for example)■ Create presentations (in Power Point, for example)■ Create web pages■ Computer programming■ Do research using the Internet■ Correspond with others via email or the Internet
Category Students
Very intensive use a computer or the Internet at school for basic and more advanced activities daily andthe most advanced tasks at least once or twice a week.
Intensive perform basic tasks daily and more advanced tasks, such as creating presentations and analyzing or graphing data, weekly.
Moderate perform basic tasks once or twice a week and more advanced tasks once or twice a semester.
Limited use a computer or the Internet to perform basic tasks such as word processing or research fromonce or twice a semester to once or twice a month; more advanced activities are never performed.
None never use a computer or the Internet at school to do any of these activities.
Technology Use Across the Curriculum. Technology use across the curriculum measures to what extent stu-
dents use technology in English, Social Studies/History, Math and Science classes. A higher score indicates more
frequent use in a larger number of classes. Individual reliability = 0.66; school reliability = 0.85.
This school year, how often do you use a computer AT SCHOOL for the following things? (Never, Once or
Twice a Semester, Once or Twice a Month, Once or Twice a Week, Almost Every Day.)
■ Work on an assignment for Reading/Language Arts class
■ Work on an assignment for Math class
■ Work on an assignment for Science class
■ Work on an assignment for Social Studies or History class
Category Students
Daily use technology daily in all core classes.
Frequent use technology weekly in most core classes.
Infrequent occasionally use technology in core classes.
Never never use technology in any core classes.

C O N S O RT I U M O N C H I C AG O S C H O O L R E S E A R C H6 2
Students’ Home Use of Technology. Home use of technology measures students’ availability and use of home
computers. Individual reliability = 0.65; school reliability = 0.53.
■ Which of the following does your family have in your home? A computer■ Which of the following does your family have in your home? Internet access■ This school year, how often have you used a computer in the following places? At home (Never, Once or Twice
a Semester, Once or Twice a Month, Once or Twice a Week, Almost Every Day)
TEACHERSTeacher Attitudes Toward Technology. Teachers’ attitudes toward technology measures teachers’ belief that
technology is beneficial for teaching critical thinking and job skills and is a good way to engage students with
project-based learning in a real world context. Individual reliability = 0.80; school reliability = 0.21.
Items are answered on a four-point, strongly disagree to strongly agree scale:
Computing technology…
■ Should be used to raise standardized test scores.■ Plays only a small role in strengthening students’ basic academic skills.
■ Skills are critical in preparing students for the work force.
■ Should be used to develop students’ critical thinkingand problem solving skills.
■ Skills are essential in only a small number of specialized jobs in the work force.
■ Provides real-world context for learning.
■ Can be used to facilitate project-based learning.
■ Is a good way to engage student attention.
Category Teachers
Very positive Agree that computing technology should be used in strengthening basic skills and raising test scores. They strongly agree with all other items.
Positive Some disagree and others plays a role in strengthening basic skills and should be used to raise standardized test scores. Teachers agree that computing technology engages students and should be used to develop critical thinking. They agree or strongly agree that it prepares students for future jobs.
Negative While some agree, most disagree or strongly disagree that computing technology prepares students for future jobs. Teachers disagree or strongly disagree with all other items.

E D U C AT I O N A L T E C H N O L O G Y 6 3
Availability of Technology. Hardware availability measures the extent to which teachers are able to use technology
hardware including computers, the Internet and email in their schools and classrooms. Higher scores indicate
more extensive availability of technology for teachers. Individual reliability = 0.36; school reliability = 0.88.
Are the following available to you, and if yes, how often do you use them? (Never, Once or Twice a Semester,
Once or Twice a Month, Once or Twice a Week, Daily or Almost Daily)
■ Computer in your classroom
■ Computer elsewhere in the school
■ Internet in the classroom
■ Internet elsewhere in the school
■ Email in your classroom
■ Email elsewhere in the school
Category Teachers
Excellent have computers in the classrooms that are wired to the Internet.
Good are wired to the Internet somewhere in the school and have computers in their classrooms.
Basic have access to a computer in the school, and are wired to the Internet, but do not have computers n the classroom.
None may or may not have access to a computer in the school but are not wired to the Internet.
Teacher Use of Technology. Teachers’ use of technology measures how frequently teachers use technology in
their own work. Activities include creating instructional material, accessing model lesson plans, and creating
multimedia presentations. A high score indicates more frequent and diverse use of technology. Individual
reliability = 0.80; school reliability = 0.53.
For each activity below, please indicate how often you use computers or the Internet to complete the activity.
(Never, Once or Twice a Semester, Once or Twice a Month, Once or Twice a Week, Daily or Almost Daily)
■ Create instructional materials (i.e., handouts, tests, etc.)
■ Gather information for planning lessons
■ Access model lesson plans
■ Access research and best practices for teaching
■ Access the CPS Intranet
■ Create multimedia presentations for the classroom
Category Teachers
Highly intensive perform most activities with technology daily and create multimedia presentations weekly to daily.
Intensive regularly use technology for basic tasks and access information, such as best practices, weekly; some also create multimedia presentations weekly.

C O N S O RT I U M O N C H I C AG O S C H O O L R E S E A R C H6 4
Limited use technology for basic tasks up to once a week; they also use technology to access model lesson plans and best practices for teaching up to once or twice a month; some also occasionally create multimedia presentations for the classroom.
None never or seldom use technology; those that do make instructional material or gather information for planning lessons once or twice a semester or once or twice a month.
Teacher Assignment of Technology. Teacher assignment of technology in the classroom measures teachers’
assessment of how frequently they include various uses of technology in their assignments. Activities include
practice drills, word processing, creating presentations and research on the Internet. A high score indicates more
frequent and diverse use of technology. Individual reliability = 0.70; school reliability = 0.49.
For each activity below, please indicate how often you use computers or the Internet to complete the activity.
(Never, Once or Twice a Semester, Once or Twice a Month, Once or Twice a Week, Daily or Almost Daily)
■ Practice drills
■ Analyze or graph data
■ Do word processing or typing
■ Create presentations
■ Create web pages
■ Computer programming
■ Do research using the Internet
■ Correspond with others via email or Internet
■ Do demonstrations/simulations
Category Teachers
Highly integrated assign basic to moderate tasks on a weekly to daily basis; more complex activities such as demonstrations, email, computer programming and web page creation are assigned anywhere from once or twice a semester to daily.
Integrated assign basic tasks as much as once or twice a week and moderately uncommon tasks, such as analyzing or graphing data and creating presentations, from once or twice a semester or once or twice a month; some occasionally assign using technology for demonstrations or email.
Modest assign basic tasks once or twice a semester to once or twice a month. Most also assign moderately uncommon tasks up to once or twice a month but do not assign more complextasks such as demonstrations.
Limited assign low level tasks like word processing, practice drills and research on the Internet fromonce or twice a semester to once or twice a month. Never assign any more complex tasks.
None never assign technology to students in their target class.

E D U C AT I O N A L T E C H N O L O G Y 6 5
Teacher Home Use of Technology. Teacher home use is a measure of the extent to which teachers have and
use computers, the Internet or email at home. A high score indicates greater use of technology at home.
Individual reliability = 0.76; school reliability = 0.003.
Are the following available to you, and if yes, how often do you use them? (Never, Once or Twice a Semester,
Once or Twice a Month, Once or Twice a Week, Daily or Almost Daily)
■ Computer at home
■ Internet at home
■ Email at home
Human Resource Support for Technology. Human resource support for technology measures the amount
of basic support teachers find for their technology use including access to a technology coordinator, working
computers, and support for curriculum integration and trouble-shooting. Individual reliability = 0.79; school
reliability = 0.82.
Items are answered on a four-point, strongly disagree to strongly agree scale:
■ Our school’s technology coordinator helps teachers integrate computing technology into lessons.
■ I can find help in my school when I have trouble using computing technology.
■ The computing technology in my school is in good working order.
Please indicate the extent, if any, each of the following are barriers to your use of school computers or the
Internet for instruction. (Not a Barrier, Small Barrier, Moderate Barrier, Great Barrier)
■ Lack of technology coordinator in school.
Category Teachers
Very strong strongly agree with all the items.
Strong can find help when they have trouble and their technology coordinator can help them withintegrating technology into lessons; they agree that computers are in good working order.
Weak can find some technical support for technology use, but report that the lack of a technologycoordinator to be a small or moderate barrier; some teachers agree and others disagree that their computers are in good working order.
None lack support for technology use; they describe a lack of a technology coordinator as a great barrier and cannot find help when they have trouble using technology; they disagree that their computers are in good working order.

C O N S O RT I U M O N C H I C AG O S C H O O L R E S E A R C H6 6
Professional Community Around Technology. Measures the general willingness of the teachers in a school to
support technology integration. Individual reliability = 0.72; school reliability = 0.52.
Please indicate the extent, if any, each of the following are barriers to your use of school computers or the
Internet for instruction. (Not a Barrier, Small Barrier, Moderate Barrier, Great Barrier)
■ Lack of teacher agreement that integrating technology into lessons is important.
■ Reluctance among teachers to take professional development about integrating technology into lessons.
■ Lack of teacher support.
Category Teachers
Very strong do not find any of these factors to be barriers to technology use.
Strong describe lack of teacher agreement regarding technology’s importance and their reluctanceto take professional development in technology as small barriers; general lack of teacher support was not a barrier to technology use.
Weak describe lack of teacher agreement regarding technology’s importance and their reluctanceto take professional development in technology as moderate barriers to technology use.
Very weak describe lack of teacher agreement regarding technology’s importance and their reluctance to take professional development in technology as great barriers; general lack of teacher support was described as a moderate barrier to technology use.
Professional Development for Technology. Measures the extent to which a teacher is aware of and
participating in professional development regarding use of technology in the classroom. A high score indicates
that a teacher has been able to find and take advantage of professional development opportunities in technology
use. Individual reliability = 0.79; school reliability = 0.62.
Items are answered on a four-point, strongly disagree to strongly agree scale:
■ I am aware of professional development that could enhance my ability to use computing technology in classroom instruction.
■ I have taken professional development that enhances my ability to use computing technology in classroom instruction.
■ The professional development available to me is relevant to how I believe computers should be used in the classroom.
■ I have tried to take advantage of computing technology training, but was not able to do so because of circumstances outside of my control (access, cost, etc.).
Please indicate the extent, if any, each of the following are barriers to your use of school computers or the
Internet for instruction. (Not a Barrier, Small Barrier, Moderate Barrier, Great Barrier):
■ Lack of release time to learn/practice/plan ways to use computers or the Internet.
■ Lack of appropriate professional development on how to integrate computing technology into curriculum.

E D U C AT I O N A L T E C H N O L O G Y 6 7
Category Teachers
Very strong strongly agree with all items and find lack of professional developmentand release time not to be barriers at all.
Strong agree that they are aware of and have taken professional development that they found relevant to their use of computers in the classroom; lack of both professional development and release time are described as small to moderate barriers.
Weak most disagree but some agree that they are aware of professional development opportunities for technology use; they disagree or strongly disagree with all other items and find lack of both professional development and release time to be great barriers to technology use.
Very weak strongly disagree with items regarding the availability and usefulness of professional development for technology; they describe lack of both professional development and release time for learning and planning to be great barriers to technology use.
Principal Support for Technology. Measures teachers’ perception of how much support the principal has given
to the use of technology for classroom instruction. A high score indicates greater principal support. Individual
reliability = 0.01; school reliability = 0.74.
Items are answered on a four-point, strongly disagree to strongly agree scale:
■ The principle encourages teachers to take professional development on how to integrate omputers and the Internet into classroom instruction.
Please indicate the extent, if any, each of the following are barriers to your use of school computers or theInternet for instruction. (Not a Barrier, Small Barrier, Moderate Barrier, Great Barrier)
■ Lack of principal support.
Category Teachers
Strong support strongly agree that the principal encourages professional development in technology, and consider lack of principal support not a barrier.
Some support agree that the principal encourages professional development in technology; most find lack of principal support not a barrier.
Mixed either agree or disagree that the principal encourages professional development in technology;they describe lack of principal supportas a moderate or small barrier.
Negative disagree and strongly disagree that the principal encourages them to participate in professionaldevelopment or to integrate technology into instruction; they describe the lack of principalsupport as a great barrier to using technology in instruction.


E D U C AT I O N A L T E C H N O L O G Y 6 9
Equity analyses were designed to determine whether there were differences in technology use or access between
students, teachers, and schools that had different demographic characteristics. For each technology outcome
measure, four series of analyses were performed, all using three-level hierarchical linear models. In each
equation, the first level was a measurement model, which determined the most accurate estimation of each
person’s score on the technology measure, given their standard error on the measure (determined through
Rasch analysis by their response pattern to the items in the question). The second level modeled individual-level
characteristics of students or teachers, while the third level compared schools.
Each series was initially run separately for elementary and high schools. However, because the individual-level
patterns were similar at both levels, elementary and high school responses were combined for the equations
modeling individual-level group differences. School-level patterns were different among elementary and high
schools, so separate school-level results are presented.
SERIES 1The first series of equations explored whether there were differences in technology use or access across the system based
on students’ and teachers’ personal demographic characteristics, without regard for other variables. For example,
"Are African-American students in CPS using technology more or less in school than students of other races? Are CPS
teachers with more experience more likely to have access to computing technology than newer teachers?"
Each characteristic of individuals (students or teachers) was studied by itself at Level 2, fixed across schools, so that
the coefficient/s would represent total differences between groups across the system:
Level-1 Models (Measurement Models)Y = Π1*(WGT) + e
Level-2 Models (Student or Teacher Models)Π1 = B10 + B12 … B1j (Individual Level Group Dummy variables) + r1
Level-3 Models (School Models)B10 = γ100 + u10
B12 = γ120 … B1j = γ1j0
Appendix B Details of Equity Analyses

C O N S O RT I U M O N C H I C AG O S C H O O L R E S E A R C H7 0
Dummy variables representing the groups defining each characteristic were entered simultaneously (e.g.,
dummy variables for African American, white, Latino entered together to study race), but no other variables at
Level 2 were included, with the exception of grade level and subject area. Dummy variables representing grade
level (both students and teachers), and subject area (teachers) were entered as control variables for equations
modeling all other characteristics, since these were structural characteristics that might have biased analyses of
demographic differences.
This series of analyses was used to create the individual-level boxplot charts in Chapter 3 that show differences
among groups of students and teachers. The coefficients of the individual-level characteristics provided the
information used to calculate the difference of each group from the system mean.
One final model was run for each measure to determine whether any differences found between groups remained
after controlling for other individual-level characteristics. The models were the same, except that all student- or
teacher-level characteristics were entered simultaneously at Level 2. The individual-level characteristics were
grand-mean centered to discern differences across the system. No substantial differences were found when other
characteristics were controlled.
SERIES 2The second series of models examined whether the individual characteristics studied in Series 1 showed different
patterns within schools than across the system. For example, "Do low achieving students tend to use technology
less than high achieving students who are in the same school?"
These models were the same as those in Series 1, but the individual characteristics were group-mean centered,
instead of grand-mean centered. No substantial differences were found, compared to Series 1.
SERIES 3The third series of analyses examined differences in technology use and access between different types of
schools. For example, "Do high poverty schools report less availability of technology than low poverty schools?"
In this series, each school characteristic (racial composition, average achievement level, percent low-income
students), was entered separately at Level 3 with dummy variables representing the groups defined by that char-
acteristic. At Level 2, only controls for grade level were entered (grand-mean centered), to adjust for differences in
the grade levels served by each school:

E D U C AT I O N A L T E C H N O L O G Y 7 1
Level-1 Models (Measurement Models)Y = Π1*(WGT) + e
Level-2 Models (Student or Teacher Models)Π1 = B10 + B12 … B1j (Grade Level Dummies) + r1
Level-3 Models (School Models)B10 = γ100 + γ101 … γ10k (School Characteristic Dummies) + u10
B20 = γ200 … B1j = γ1j0
These analyses provided information for the school-level equity displays presented in Chapter 3. Each coefficient
representing a school characteristic provided information on the difference of each group from the system mean.
SERIES 4One final model was run for each technology measure that included all individual-level variables at Level 2,
grand-mean centered, and all school-level variables entered simultaneously at Level 3. These final models allowed
us to discern whether school differences found in Series 3 could be explained by other school-level characteristics,
or by the composition of students/teachers in the school. For example, "Do selective high schools show greater
teacher assignment of technology because they are composed of higher achieving students, or because of some
unique structural characteristic of selective high schools?"
We found that many of the differences in technology use and access found between groups of schools could
be attributed to differences in the composition of students/teachers in the schools.


E D U C AT I O N A L T E C H N O L O G Y 7 3
Appendix C Details of Essential Support Analyses
Each portion of our model describing factors that affect technology use in schools was tested using three-level
hierarchical linear models. In each equation, Level 1 was a measurement model that weighted individual scores by the
standard error in that person’s measure. Because these measures were developed through Rasch analysis, each score had an
associated standard error based on the response pattern of the respondent. The measurement model allowed for better
estimation of the true relationships of the predictors with the dependent variable. Individual student or teacher variables
were entered at Level 2, and school variables were entered at Level 3. For each series of equations that predict student
or teacher use of technology, the contribution of demographic and technology variables to the explanation of use are
presented in summary tables below. The final models predicting other technology variables (technology availability,
professional development in technology, availability of human resource support in technology) are also presented to
show the relationships among those other variables.
1 Person-level demographic controls include: gender, race (White, Latino, African American, other), grade level (separate variable for each grade), special education marker, bilingual educationmarker, poverty indicator (percent of males unemployed and percent of residents below the poverty line in student’s census block group), social status indicator (mean income and percent ofmales employed as managers/professionals in student’s census block group), summer school marker, mother’s education level, reading score on ITBS or TAP, math score on ITBS or TAP.2 School-level demographic controls include: racial composition of the school (over 85 percent African American, over 85 percent Latino, over 30 percent white, less than 30 percent white but notpredominantly African-American or Latino), and a marker for over 90 percent low income. Elementary school controls include variables differentiating schools on probation (less than 20 percent ofstudents at norms), near probation (20 to 35 percent of students at norms), not near probation (35 to 50 percent at norms), and high achievement (50 percent or more at norms). High schoolcontrols included markers differentiating selective schools, probation schools, and other schools (neighborhood and technical).
Table A1: Equations Predicting Student Use of Technology in SchoolLevel 2 Percent Level 3 Percent
Elementary Schools Variance Explained Variance Explained
Unconditional model 2.21 0.81
Models with level-2 predictor variables added to previous model:
Person-level demographic controls1 4.57 2.10
Student’s home use of technology 5.86 2.16
Student’s beliefs about technology 10.36 10.31
Models with level-2 predictor variables added to previous model:
School-level demographic controls2 10.36 13.28
Availability of technology at school for students 10.30 58.46
Teacher assignment of technology 10.32 62.71Level 2 Percent Level 3 Percent
High Schools Variance Explained Variance Explained
Unconditional model 1.52 0.45
Models with level-2 predictor variables added to previous model:
Person-level demographic controls1 4.60 6.18
Student’s home use of technology 5.65 6.63
Student’s beliefs about technology 11.64 12.17
Models with level-2 predictor variables added to previous model:
School-level demographic controls2 11.64 17.38
Availability of technology at school for students 11.62 50.06
Teacher assignment of technology 11.61 57.89

Table A2: Equations Predicting Teacher Assignment of Technology to Students
C O N S O RT I U M O N C H I C AG O S C H O O L R E S E A R C H7 4
1 Person-level demographic controls include: gender, race (white, Latino, African American, other), grade level taught (elementary teachers only: pre-k/ungraded, primary, middle, gradesseven to eight), experience (less than three years; more than three years), master’s degree marker, self-contained marker, vocational education marker. 2 School-level demographic controls include: Racial composition of the school (over 85 percent African American, over 85 percent Latino, over 30 percent white, less than 30 percent whitebut not predominantly African-American or Latino), and a marker for over 90 percent low income. Elementary school controls included variables differentiating schools on probation (lessthan 20 percent of students at norms), near probation (20 to 35 percent of students at norms), not near probation (35 to 50 percent at norms), and high achievement (50 percent ormore at norms). High school controls included markers differentiating selective schools, probation schools, and other schools (neighborhood and technical).3 At the high school level, almost no variance is left to be explained by technology variables once demographic controls are included (especially the dummy variables for selective and probation schools). The selective high schools are substantially higher than other schools on all technology measures, including teachers’ assignment of technology, while schools on probation are substantially lower on these measures.
Level 2 Percent Level 3 Percent Elementary Schools Variance Explained Variance ExplainedUnconditional model 2.36 0.32
Models with level-2 predictor variables added to previous model:
Person-Level Demographic Controls1 14.24 0.31
Teacher’s use of technology for their own professional work 31.36 41.69
Professional development in technology 32.3 50.16
Home use of technology and beliefs about technology 33.1 49.84
Models with level-2 predictor variables added to previous model:
School-level demographic controls2 33.90 59.25
Availability of technology at school for teachers 33.47 73.67
Availability of technology at school for students 33.18 77.43
Human resource support in technology 33.05 80.75
Professional community around technology and Principal support for technology 33.05 80.56
Level 2 Percent Level 3 Percent High Schools Variance Explained Variance Explained
Unconditional model 2.44 0.13
Models with level-2 predictor variables added to previous model:
Person-level demographic controls1 5.74 0.0
Teacher’s use of technology for their own professional work 27.66 60.94
Professional development in technology 29.10 74.22
Home use of technology and beliefs about technology 30.33 69.53
Models with level-3 predictor variables added to previous model:
School-level demographic controls2 30.90 100.00
Availability of technology at school for teachers, Availability of technology at school for students, Human resource support in technology, Professional community around technology, Principal support for technology3 29.50 100.00

1 Person-level demographic controls include: gender, race (white, Latino, African American, other), grade level taught (elementary teachers only: pre-k/ungraded, primary, middle, gradesseven to eight), experience (less than three years, more than three years), master’s degree marker, self-contained marker, vocational education marker. 2 School-level demographic controls include: racial composition of the school (over 85 percent African American, over 85 percent Latino, over 30 percent white, less than 30 percent whitebut not predominantly African American or Latino), and a marker for over 90 percent low income. Elementary school controls included variables differentiating schools on probation (lessthan 20 percent of students at norms), near probation (20 to 35 percent of students at norms), not near probation (35 to 50 percent at norms), and high achievement (50 percent ormore at norms). High school controls included markers differentiating selective schools, probation schools, and other schools (neighborhood and technical).
Table A3: Equations Predicting Teachers’ Professional Use of Technology for their Own Work
E D U C AT I O N A L T E C H N O L O G Y 7 5
Level 2 Percent Level 3 Percent Elementary Schools Variance Explained Variance ExplainedUnconditional model 2.21 0.26
Models with level-2 predictor variables added to previous model:
Person-level demographic controls1 4.89 6.64
Teacher’s computer use at home 18.03 21.37
Professional development in technology 23.00 40.84
Beliefs about technology 26.18 41.60
Models with level-3 predictor variables added to previous model:
School-level demographic controls2 26.18 43.13
Availability of technology at school for teachers 26.18 68.85
Human resource support in technology, Professional community around technology, Principal support for technology 26.18 70.61
Level 2 Percent Level 3 Percent High Schools Variance Explained Variance ExplainedUnconditional model 2.25 0.19
Models with level-2 predictor variables added to previous model:
Person-level demographic controls1 4.85 8.85
Teacher’s computer use at home 14.18 27.61
Professional development in technology 22.85 63.00
Beliefs about technology 27.52 65.15
Models with level-3 predictor variables added to previous model:
School-level demographic controls2 27.70 73.46
Availability of technology at school for teachers 27.52 86.60
Human resource support in technology, Professional community around technology, Principal support for technology 27.52 91.96

C O N S O RT I U M O N C H I C AG O S C H O O L R E S E A R C H7 6
Table A4: Final Equation Predicting Availability of Technology for Teachers, Elementary Schools
Schooldemographics
Individualdemographics
Technologymeasures
School-Level Predictors of the Intercept Coefficient p-level
Intercept 4.981 0.000
Professional community around technology 0.215 0.093
Human resource support for technology 0.752 0.000
Principal support for technology 0.543 0.001
Predominantly African American (comparison: mixed minority) -0.855 0.002
Predominantly Latino (comparison: mixed minority) 0.083 0.805
Integrated (comparison: mixed minority) -0.277 0.466
Over 90 percent low income (comparison: under 90 percent) 0.081 0.739
On probation (comparison: middle achieving) -0.046 0.925
Near probation (comparison: middle achieving) -0.380 0.297
High achieving (comparison: middle achieving) -0.334 0.338
Person-Level Predictors of the Intercept Coefficient p-level
Teachers’ home use of technology 0.038 0.002
Three or more years’ experience (comparison: less than three years) 0.408 0.001
Dummy: teacher experience unknown 0.303 0.108
African American (comparison: white) 0.237 0.008
Latino (comparison: white) 0.048 0.717
Other race (comparison: white) -0.073 0.578
Race unknown 0.156 0.347
Male (comparison: female) -0.022 0.827
Master’s degree (comparison: no master’s) -0.031 0.659
Education unknown -0.337 0.135
Pre-K or ungraded classroom (comparison: primary grade) -0.311 0.035
Middle grade (comparison: primary grade) 0.367 0.001
Jr. high grade (comparison: primary grade) 0.614 0.000
Self-contained classroom (comparison: other subject area) 0.110 0.189
Vocational/tech teacher (comparison: other subject area) 2.391 0.000
Grade level unknown 0.430 0.002

Table A5: Final Equation Predicting Professional Development Among Teachers, Elementary Schools
School-Level Predictors Coefficient p-level
Intercept 4.024 0.000
Professional community around technology 0.151 0.000
Human resource support for technology 0.145 0.000
Principal support for technology 0.250 0.000
Predominantly African American (comparison: mixed minority) -0.009 0.881
Predominantly Latino (comparison: mixed minority) 0.020 0.795
Integrated (comparison: mixed minority) -0.045 0.552
Over 90 percent low income (comparison: under 90 percent) 0.047 0.429
On probation (comparison: middle achieving) -0.083 0.438
Near probation (comparison: middle achieving) -0.047 0.578
High achieving (comparison: middle achieving) 0.013 0.854
Person-Level Predictors of the Intercept Coefficient p-level
Teachers’ home use of technology 0.074 0.000
Three or more years’ experience (comparison: less than three years) 0.048 0.414
Dummy: teacher experience unknown 0.057 0.599
African American (comparison: white) 0.359 0.000
Latino (comparison: white) -0.126 0.072
Other race (comparison: white) 0.011 0.894
Race unknown 0.048 0.625
Male (comparison: female) -0.018 0.743
Master’s degree (comparison: no master’s) 0.094 0.024
Education unknown -0.145 0.281
Pre-K or ungraded classroom (comparison: primary grade) 0.228 0.009
Middle grade (comparison: primary grade) 0.034 0.535
Jr. high grade (comparison: primary grade) 0.022 0.727
Self-contained classroom (comparison: other subject area) -0.150 0.002
Vocational/tech teacher (comparison: other subject area) 1.102 0.000
Grade level unknown 0.041 0.554
Schooldemographics
Individualdemographics
Technologymeasures
E D U C AT I O N A L T E C H N O L O G Y 7 7

ERRATA Series 1 models on page 69 should read:
Level-1 Models (Measurement Models) Yijk = π1jk(WGTijk) + eijk Level-2 Models (Student or Teacher Models, example is for grade level. Other characteristics were modeled in the same way.) π1jk = β10k + β11k(Grade 7jk) + β12k(Grade 8jk) + β13k(Grade 9jk) + β14k(Grade 10jk)+ r1jk
Level-3 Models (School Models) β10k = γ100 + u10k β11k = γ110 β12k = γ120 β13k = γ130 β14k = γ140
Series 3 models on page 71 should read:
Level-1 Models (Measurement Models) Yijk = π1jk(WGTijk) + eijk Level-2 Models (Student or Teacher Models, example is for elementary schools. High school models were the same, but with grades 9 and 10 instead of 6, 7, and 8.) π1jk = β10k + β11k(Grade 7jk) + β12k(Grade 8jk) + r1jk
Level-3 Models (School Models, example is for school achievement. Other school-level characteristics were modeled in the same way.) β10k = γ100 + γ101 (selective admissions dummyk) + γ102 (probation dummyk)+u10k β11k = γ110 β12k = γ120

C O N S O RT I U M O N C H I C AG O S C H O O L R E S E A R C H7 8
1 NCES (2001).2 Dwyer (1996); Kulick (1994); and Jonassen and
Reeves (1996).3 Author, Levy, and Murnane (2001), 39-40.4 Thornburg (1998).5 Woodward and Gridina (2000), 12.6 Becker (2000), 55.7 Means, Penuel and Padilla (2000), 4.8 Wenglinsky (1998).9 CEO Forum (1999).10 Cuban (2001), 171.11 Glennan and Melmed (2000), 69. 12 For simplicity's sake, we will use technology as
shorthand for educational computing technology.By this we mean educational uses of computers,computer peripherals, the Internet, and computersoftware.
13 Although our teacher measure of technology assignment parallels the student measure of technologyuse with respect to the activities listed, there is one important difference. Students were asked to reporton technology use at school for any class or any purpose(clubs, personal use, etc). Teachers, on the other hand, were asked about assignments for one particularclass, regardless of whether students completed thatassignment at school, home, or another location.Therefore, although the measures use the same items,their scope differs and so they arenot directlycomparable.
14 The low levels of teacher technology assignment didnot result simply because most teachers respondingto the survey were in the lower grades. Forty-onepercent of teachers responding to the survey taughtgrades six through ten (the grades students were surveyed), and the assignment of technology among these teachers was almost exactly the same as the levelsof technology assignment among all teachers combined.
15 Smerdon, et al. (2000).16 US Department of Commerce (1999), xiii.17 Ibid. 18 A school is defined as predominantly low income if
more than 90 percent of students are eligible for freeand reduced lunch.
19 Results in this section are model-based effects fromthree-level hierarchical linear models that account formeasurement error and then portion student- andschool-level variance separately. Each student characteristic,such as gender, was modeled separately without controlling for other demographic factors. We also performed more elaborate models that examined eachgroup difference controlling for the other demographicfactors. When relevant, we discuss whether the groupdifferences we see at the bivariate level disappear whenother student or school characteristics are controlled.See Appendix B for more details.
20 Economic status is based on students' place of residence—the characteristics of the census blockgroup where students live. The measure is derivedfrom census data on the percentage of familiesunder the poverty line and the percentage of unemployed males in the students' census block group. This measure is much better at discerning economic differences between students than the often-used criterion of whether the student qualifies for free/reduced lunch, since 85 percent of CPS students qualify as low income. We grouped studentsinto quartiles based on this measure to distinguishthose who live in high poverty neighborhoods fromthose who live in low poverty areas.
21 This was based on students' performance on theIowa Tests of Basic Skills (ITBS) for elementaryschool students, or on the Tests of Achievementand Proficiency (TAP) for high school students.
22 The relationships between the student demographicvariables and the technology variables were similar within schools and across the system.
23 Among elementary students, difference in non-response rates between the highest achievingquartiles and lowest achieving quartile was 10 percent.In high schools, this was close to 20 percent.
24 One special education teacher explained, "It's been atremendous tool for kids that are learning disabled, for example, who have trouble getting things in writing....They're still going to have errors in it...butthey can fix them, and they produce something that is on the same level as the rest of the class....Technology has taken that stigma away....It's made a big, big difference."
25 Sutton (1991); Butler (2000).
Endnotes

E D U C AT I O N A L T E C H N O L O G Y 7 9
26 Small differences between types of schools appearlarger in the displays than differences between typesof students because there is three times more variationin computer use and availability among studentsthan among schools.
27 Because there are only four predominantly Latinohigh schools in our sample, this difference did notemerge as statistically significant in the multilevelanalysis. However, three of the four schools had substantially lower than average reports of computer availability (i.e., one standard deviation or more below average).
28 Although these data suggest that teacher use and assignment arenot correlated, in fact they are. We find that personal use and student assignment are positively correlated (r=0.39 among elementary teachers; r=0.46 among high school teachers).
29 Students in low achieving schools show a different pattern thanteachers in terms of use; students at these schools report the lowestlevels of access to technology, but the highest levels of use. This incongruence between teacher and student reports is initially surprising because, in general, students report using technology morein schools where teachers report assigning it more. There are many potential explanations for these inconsistencies, however. The Consortium's survey asked students questions about how frequently they use a computer "at school" to perform various tasks. Higher achieving students could be working on assignments more at home.Alternatively, high achieving students may need less time to completeassignments involving technology than low achieving students. Ourdata cannot determine the reason for these differences.
30 Wenzel et al. (2001).31 Computer availability explains about 45 percent of the school
variance in student computer use beyond demographic characteristicsand student-level characteristics alone.
32 This may be due to students with greater home access having less of a need to use technology at school for assignments.
33 Teachers' use of technology for their own professional work explains over 17 percent of the person-level variance in assignment of technology at the elementary level and over 40 percent of the school-level variation (22 percentand 61 percent,respectively, at the high school level).
34 Our measure of home computer use explains 13 percent of the person-level variance in the measure of professional use of computers and almost 15 percent of the school-level variance inprofessional computer use at the elementary level (9 percent and 19 percent, respectively, at the high school level).
35 Professional development in technology explains only 1 percent of the person-level variance in assignment of technology, and 3percent (high schools) to 5 percent (elementary schools) of theperson-level variance in professional use of technology. It doesexplain, however, substantial proportions of the school level variance in assignment of technology, (8 percent elementary, 13 percent high school) and professional use (18 percent elementary, 33 percent in high schools).
36 Even after entering all other technology variables, belief about the utility of technology remains a significant predictor of bothteacher professional use and teacherassignment of technology.
Because belief is correlated with other technology predictors,however, it adds only slightly to the variance explained in themodel beyond other technology and demographic variables.
37 Most of the variance in both teachers' professional use andassignment of technology exists at the individual level (i.e., thereare more differences within schools than between them). Of thevariance that exists at the school level, much can be explained by teachers' individual characteristics and professional development experiences(i.e., teachers with certain characteristics tend to belocated at certain schools). For example, at the elementary level, 50 percent of the school-level variance in assignment of technologyis explained by teachers' demographic characteristics, use for
their own professional work, home use, and the quality of theirprofessional development (70 percent at the high school level). See Appendix C for further details.
38 The effect of professional community on professional developmentpersists after controlling for all other technology and demographicvariables.
39 Controlling for teacher access to computers, student access is asignificant predictor of teachers' assignment of technology.
40 At the elementary level, computer availability explains 25 percentmore school-level variation in teachers' professional use of technology than demographic and individual-level characteristics alone (13 percent at the high school level), and 18 percent moreschool-level variation in teachers' assignment of technology (not calculable at the high school level).
41 After controlling for demographic characteristics and the other technology variables in the model (including principal support for technology) the relationship between human resource support and technology availability for teachers is still very strong.
42 Figure 15 shows the bivariate relationship between human resource support and teachers' assignment of technology. Evenafter controlling for technology availability, however, humanresource support is significantly related to teacher assignment of technology, explaining an additional 3 percent of the school-levelvariance in elementary schools.
43 Principal support for technology is a strong predictor of technologyavailability, teacher professional development in technology, andprofessional community around technology. It is through thesemechanisms that principals have an impact on teachers' and students' use of technology. Once we control for availability, professional development, and professional community, principalsupport for technology is no longer a significant predictor
of use.44 The within-school variance in teachers' professional use of
technology was 9.2 times greater than the between-school variance. The within-school variance in teachers' assignment oftechnology was 8.4 times greater than the between-school variance.Likewise, the within-school variance in students' use of technologyat school was 2.6 times greater than the between-school variance,and the within-school variance in students' use of technology across the curriculum was 4.4 times greater than the between-school variance.
45 Means, Penuel, and Padilla (2001), 228.46 Wenzel et al. (2001).


References
E D U C AT I O N A L T E C H N O L O G Y 8 1
Autor, David H., Frank Levy, and Richard Murnane. (2001). The skill content of recenttechnological change: An empirical exploration.MIT Department of Economics working paper no. 01-22.
Becker, Henry J. (2000). "Who’s wired and who’snot: Children’s access to and use of computertechnology." The Future of Children 10 (2).
Butler, Deborah A. (2000). Gender, girls, and computer technology: What’s the status now.The Clearing House 73 (4): 225-29.
CEO Forum. (1999). School Technology and Readiness Report. Washington, DC: Author.
Cuban, Larry. (2001). Oversold and Underused: Computers in the Classroom. Cambridge:Harvard University Press.
Dwyer, David C. (1996). The imperative to change our schools. In Charles Fisher, David C. Dwyer, and Keith Yocam (Eds.),Education and Technology: Reflections onComputing in Classrooms. San Francisco:Jossey-Bass.
Glennan, Thomas K. and Arthur Melmed.(2000). Challenges of creating a nation of technology-enabled schools." In The Jossey-Bass Reader on Technology andLearning. San Francisco: Jossey-Bass.
Jonassen, David H. and T.C. Reeves. (1996).Learning with technology: Computers as cognitive tools." In David H. Jonassen andAssociation for Educational Communicationsand Technology (Eds.), Handbook of Researchfor Educational Communications and Technology:A Project of the Association for EducationalCommunications and Technology. New York:Macmillan Library Reference USA.
Kulik, J.A. (1994). Meta-analytic studies of findings on computer-based instruction. In Eva L. Baker and Harold F. O’Neil (Eds.),Technology Assessment in Education and Training. Vol 1. Hillsdale, NJ: L.Earlbaum Associates.
Means, Barbara, William R. Penuel, and Christine Padilla. (2001). The ConnectedSchool: Technology and Learning in High School,The Jossey-Bass Education Series.San Francisco: Jossey-Bass.
National Center for Education Statistics. US Department of Education. (2001). Internetaccess in U.S. Public Schools and Classrooms:1994-2000. Available online athttp://nces.ed.gov/pubs2001/internetaccess/5.asp.
Smerdon, Becky and Bernard Greene. (2000).Teachers’ Tools for the 21st Century: A Report onTeachers’ Use of Technology. Washington, DC:US Dept. of Education, Office of EducationalResearch and Improvement.

C O N S O RT I U M O N C H I C AG O S C H O O L R E S E A R C H8 2
Sutton, Rosemary E. (1991). Equity and computers in the schools: A decade of research. Review of Educational Research 61 (4): 475-503.
Thornburg, David D. (1998). Reading the future: here’swhat’s on hand for technology and education. ElectronicSchool, available online at www.electronic-school.com/0698f1.html.
US Department of Commerce, National Telecommunicationand Information Administration. (1999). Falling throughthe net: Defining the digital divide. Washington, DC: US Department of Commerce.
Wenglinsky, H. (1998). Does it compute? The relationshipbetween educational technology and student achievement in mathematics. Princeton: The Educational Testing Service.
Wenzel, Stacy A., Mark A. Smylie, Penny Bender Sebring,Elaine Allensworth, Tania Gutierrez, Sara Hallman, StuartLuppescu, and Shazia Rafiullah Miller. (2001).Development of Chicago Annenberg Schools: 1996-1999.Chicago: Consortium on Chicago Schools Research.
Woodward, E.H. IV and N Gridina. (2000). Media in the home 2000: The fifth annual survey of parents andchildren. Philadelph: Annenberg Public Policy Center,University of Pennsylvania.
This report reflects the interpretations of the authors. Although the Consortium's Steering Committee providedtechnical advice and reviewed an earlier version, no formal endorsement by these individuals, organizations, or the full Consortium should be assumed.

About the AuthorsHolly M. Hart is a Research Analyst at the Consortium and the Principal Survey Coordinator. Her currentresearch compares the organizational characteristics of Chicago’s public and Catholic schools using theConsortium’s Model of Essential Supports for Student Learning. Prior to joining the Consortium, Ms. Hartwas a Senior Project Coordinator at the Survey Research Laboratory of the University of Illinois at Chicago.She holds a Ph.D. in Human Development and Social Policy from Northwestern University, and a B.A. inPsychology from Loyola University.
Elaine Allensworth is the Associate Director for Archives, Analyses, and Statistics at the Consortium. Herwork has included analysis of dropout rates, magnet schools, and organizational factors that affect schoolimprovement. Work outside of the Consortium includes research on immigration and community develop-ment. Ms. Allensworth holds a Ph.D. in Sociology from Michigan State University, a M.A. in Sociology/Urban Studies from Michigan State, and a B.A. in Spanish from Kent State University. She worked as a highschool Spanish and science teacher prior to entering graduate school.
Douglas L. Lauen is a part-time Research Assistant and Data Analyst at the Consortium. Prior to joiningthe Consortium, Mr. Lauen worked at MPR Associates, an education research and consulting firm, wherehe specialized in high school reform, the school-to-work transition, and training school staff on how to usedata for program improvement. Doug is a doctoral student in the Department of Sociology at the Univer-sity of Chicago. He received his B.A. from Oberlin College and a M.A. in Public Policy from the Universityof Chicago.
Robert M. Gladden is a Research Analyst at the Consortium. He has worked on the Bank Street Study ofSmall Schools and various Consortium projects. His current research focuses on school safety and the com-munity context of schools. Mr. Gladden is a doctoral candidate at the City University of New York, Gradu-ate Center in Social/Personality Psychology. He received his B.A. from Wesleyan University in Connecticut.

Consortium on Chicago School Research
DirectorsAnthony S. Bryk Melissa RoderickUniversity of Chicago University of Chicago
John Q. Easton Penny Bender SebringConsortium on Chicago University of ChicagoSchool Research
Albert L. Bennett Mark A. SmylieRoosevelt University University of Illinois at Chicago
Consortium on Chicago School Research
1313 East 60th Street, Chicago, IL 60637
773-702-3364 fax -773-702-2010
www.consortium-chicago.org
Steering CommitteeVictoria Chou, Co-Chair
University of Illinois at ChicagoJames H. Lewis, Co-Chair
Roosevelt University
Institutional Members
Christy Carterfor the Chicago Board of Education
Barbara Eason-Watkinsfor the Chief Executive Officer
Philip HansenAccountability Office
Jorge OclanderAcademic Accountability Council
Chicago Public Schools
Illinois State Board of EducationConnie Wise
for the Superintendent
Individual MembersJohn Ayers
Leadership for Quality Education
Gina BurkhardtNorth Central Regional Educational Laboratory
Louis M. GomezNorthwestern University
Anne C. HallettCross City Campaign for Urban School Reform
G. Alfred Hess, Jr.Northwestern University
Janet KnuppThe Chicago Public Education Fund
Rachel W. LindseyChicago State University
George LoweryRoosevelt University
Angela Perez MillerDePaul University
Donald R. MooreDesigns for Change
Sharon RansomUniversity of Illinois at Chicago
Barbara A. SizemoreDePaul University
James SpillaneNorthwestern University
Linda S. TafelNational-Louis University
Chicago Teachers UnionDeborah Lynch
Chicago Principals and Administrators AssociationBeverly Tunney
MissionThe Consortium on Chicago School Research is an independentfederation of Chicago area organizations that conducts research onways to improve Chicago’s public schools and assess the progress ofschool improvement and reform. Formed in 1990, it is a multipar-tisan organization that includes faculty from area universities,leadership from the Chicago Public Schools, the Chicago TeachersUnion, education advocacy groups, the Illinois State Board ofEducation, and the North Central Regional EducationalLaboratory, as well as other key civic and professional leaders.
The Consortium does not argue a particular policy position.Rather, it believes that good policy is most likely to result from agenuine competition of ideas informed by the best evidence thatcan be obtained.