edward szado, ph.d., cfa...author of the study "portfolio risk management with rvx sm...
TRANSCRIPT

Portfolio Risk Management with RVXSM
Futures
6 March 2018
Edward Szado, Ph.D., CFA
Associate Professor of Finance, Providence College Director of Research, INGARM (Institute for Global Asset and Risk Management)
"Portfolio Risk Management with RVXSM Futures" 6 March 2018 Please see the last slide for important disclosures
1

Author of the Study
"Portfolio Risk Management with RVXSM Futures" 6 March 2018 Please see the last slide for important disclosures
2
Edward Szado, Ph.D., CFA
Edward Szado is Associate Professor of Finance, Providence College. He is also the Director of Research at the Institute for Global Asset and Risk Management and received his Ph.D. in Finance from the Isenberg School of Management, University of Massachusetts, Amherst. He has taught Risk Management at the Boston University School of Management, Derivatives at Clark University and a range of finance courses at the University of Massachusetts Amherst. He is a former Option trader and his experience includes product development in the areas of volatility based investments and structured investment products. He is also a Chartered Financial Analyst and has consulted for the Option Industry Council, the Cboe®, the CFA Institute, the Chartered Alternative Investment Analyst Association and the Commodity Futures Trading Commission.

Overview
"Portfolio Risk Management with RVXSM Futures" 6 March 2018 Please see the last slide for important disclosures
3
1. Long RVXSM Futures Strategies in Two Key Years –2008 and 2016
2. Inverse RVX Futures in Two Key Years – 2008 and 2016
3. Select Characteristics of RVX Futures with comparisons to VIX® Futures

RVXSM Futures-Based Strategies in Two Key Years
4
• Cost of holding futures in contango suggests that long RVXSM
futures may be best suited to strategic uses rather than buy and hold.
• However, the convex relationship and strong negative conditional correlation between the RVX index and the Russell 2000® Index suggests long RVX futures may provide effective diversification for traditional portfolios in times of market stress.
• The following section considers the impact of a small allocation of long RVX futures to a traditional stock and bond portfolio and a hypothetical endowment portfolios.
• Two years were chosen to represent periods favorable to long positions in RVX futures (2008) and generally unfavorable to long positions in RVX futures and (2016)
"Portfolio Risk Management with RVXSM Futures" 6 March 2018 Please see the last slide for important disclosures

Exhibit 1: RVXSM Futures-Based Strategies in 2008
5"Portfolio Risk Management with RVXSM Futures" 6 March 2018 Please see the last slide for important disclosures
Exhibit 1: This exhibit illustrates the performance of two traditional portfolios as well as two RVX futures-based portfolios in 2008. The RVX portfolios are both fully collateralized and rebalanced daily. The one month portfolio invests in one month RVX futures and rolls out on the close the night before expiration. The Three month RVX futures portfolio purchases three month RVX futures and rolls into a new 3 month RVX futures contract after one month at the close before the front month RVX futures contract expires. The traditional portfolios consist of a 60/40 Stock/Bond portfolio and a hypothetical endowment portfolio which invests in a variety of indices based on the average yearly asset allocation of a representative endowment. It is clear from the exhibit that 2008 was favorable year for a long RVX futures exposure. The hypothetical endowment portfolio is constructed by using annually reported asset allocation from an actual endowment and applying them to a set of total return indices representing the corresponding asset classes.
Source: Bloomberg, CFE, Cboe Options Exchange

Exhibit 2: 60/40 Portfolio Performance in 2008 with RVXSM Futures
6"Portfolio Risk Management with RVXSM Futures" 6 March 2018 Please see the last slide for important disclosures
Exhibit 2: This exhibit illustrates the performance of a traditional 60/40 portfolio with and without a small allocation to long RVX futures. A 5% allocation to RVX futures improves 2008 returns from a 21% loss to a 15% loss, with a decrease in volatility and drawdowns.
Source: Bloomberg, CFE, Cboe Options Exchange2008 60/40 Stock/Bond Portfolio
60/40 Plus 5% 1 Mo. Futures
60/40 Plus 5% 3 Mo. Futures Held 1 Mo.
Annual Return -20.9% -15.3% -15.9%Annual Std Deviation 24.1% 18.8% 20.3%
Sharpe Ratio -0.87 -0.82 -0.78Maximum Drawdown -30.9% -23.9% -25.5%
Skew 0.16 0.42 0.27Kurt 4.14 4.34 4.38

Exhibit 3: Endowment Portfolio Performance in 2008 with RVXSM Futures
7"Portfolio Risk Management with RVXSM Futures" 6 March 2018 Please see the last slide for important disclosures
Exhibit 3: This exhibit illustrates the performance of a hypothetical endowment portfolio with and without a small allocation to long RVX futures. Similarly to the 60/40 portfolio, a 5% allocation to RVX futures provides the an improvement in 2008 returns from a 39% loss to a 33% loss, with a reduction in volatility and drawdowns.
Source: Bloomberg, CFE, Cboe Options Exchange
2008 EndowmentEndowment Plus 5% 1 Mo.
FuturesEndowment Plus 5% 3 Mo.
Futures Held 1 Mo.
Annual Return -38.6% -32.7% -33.3%Annual Std Deviation 31.0% 25.4% 27.0%
Sharpe Ratio -1.25 -1.29 -1.24Maximum Drawdown -50.4% -42.9% -45.0%
Skew -0.13 -0.01 -0.06Kurt 3.21 3.57 3.30

Exhibit 4: RVXSM Futures-Based strategies in 2016
8"Portfolio Risk Management with RVXSM Futures" 6 March 2018 Please see the last slide for important disclosures
Exhibit 4: This exhibit illustrates the performance of two traditional portfolios as well as two RVX futures-based portfolios in 2016. The RVX portfolios are both fully collateralized and rebalanced daily. The one month portfolio invests in one month RVX futures and rolls out on the close the night before expiration. The Three month RVX futures portfolio purchases three month RVX futures and rolls into a new 3 month RVX futures contract after one month at the close before the front month RVX futures contract expires. The traditional portfolios consist of a 60/40 Stock/Bond portfolio and a hypothetical endowment portfolio which invests in a variety of indices based on the average yearly asset allocation of a representative endowment.
Source: Bloomberg, CFE, Cboe Options Exchange

Exhibit 5: 60/40 Portfolio Performance in 2016 with RVXSM Futures
9"Portfolio Risk Management with RVXSM Futures" 6 March 2018 Please see the last slide for important disclosures
Exhibit 5: This exhibit illustrates the performance of a traditional 60/40 portfolio with and without a small allocation to long RVX futures. While a 5% long allocation to one month RVX futures reduces returns by 4%, it also reduces volatility, albeit by a smaller amount. Three month futures reduce returns by 2% while also reducing volatility and drawdowns.
Source: Bloomberg, CFE, Cboe Options Exchange
2016 60/40 Stock/Bond Portfolio60/40 Plus 5% 1 Mo.
Futures60/40 Plus 5% 3 Mo. Futures Held 1 Mo.
Annual Return 8.4% 4.4% 6.6%Annual Std Deviation 7.6% 4.9% 5.9%
Sharpe Ratio 1.11 0.89 1.13Maximum Drawdown -5.4% -2.9% -3.9%
Skew -0.29 0.28 -0.04Kurt 2.23 1.73 1.86

Exhibit 6: Endowment Portfolio Performance in 2016 with RVXSM Futures
10"Portfolio Risk Management with RVXSM Futures" 6 March 2018 Please see the last slide for important disclosures
Exhibit 6: This exhibit illustrates the 2016 performance of a hypothetical endowment portfolio with and without a small allocation to long RVX futures. Similarly to the 60/40 portfolio, a 5% long allocation to RVX futures results in a small decrease in returns, and a small reduction in volatility and drawdowns.
Source: Bloomberg, CFE, Cboe Options Exchange2016 Endowment
Endowment Plus 5% 1 Mo. Futures
Endowment Plus 5% 3 Mo. Futures Held 1 Mo.
Annual Return 9.2% 5.3% 7.5%Annual Std Deviation 10.0% 7.6% 8.4%
Sharpe Ratio 0.92 0.69 0.89Maximum Drawdown -9.6% -6.6% -7.8%
Skew -0.48 -0.31 -0.34Kurt 2.56 2.22 2.35

Short (Inverse) RVXSM Futures in two key years
11
• Cost of holding futures in contango (when futures prices are above spot price) suggests that RVX Futures may be best suited to strategic uses rather than buy and hold.
• Periods of strong contango may generate high returns to short (inverse) RVX futures strategies if a volatility event does not occur.
• However, a volatility event may result in catastrophic losses to inverse RVX futures positions.
• The following section considers the impact of a small allocation of inverse RVX futures to a traditional stock and bond portfolio and a hypothetical endowment portfolios.
• Two years were chosen to represent periods generally unfavorable for inverse RVX positions (2008) and generally favorable for inverse RVX positions (2016).
"Portfolio Risk Management with RVXSM Futures" 6 March 2018 Please see the last slide for important disclosures

Exhibit 7: Inverse RVXSM Futures-Based strategies in 2008
12"Portfolio Risk Management with RVXSM Futures" 6 March 2018 Please see the last slide for important disclosures
Exhibit 7: This exhibit illustrates the performance of two traditional portfolios as well as two inverse RVX futures-based portfolios in 2008. The RVX portfolios are both fully collateralized and rebalanced daily. The one month portfolio takes short positions in one month RVX futures and rolls out on the close the night before expiration. The Three month RVX futures portfolio shorts three month RVX futures and rolls into a new short 3 month RVX futures contract after one month at the close before the front month RVX futures contract expires. The traditional portfolios consist of a 60/40 Stock/Bond portfolio and a hypothetical endowment portfolio which invests in a variety of indices based on the average yearly asset allocation of a representative endowment. It is clear from the exhibit that 2008 was an unfavorable year for inverse RVX futures exposure.
Source: Bloomberg, CFE, Cboe Options Exchange

Exhibit 8: 60/40 Portfolio Performance in 2008 with Inverse RVXSM Futures
13"Portfolio Risk Management with RVXSM Futures" 6 March 2018 Please see the last slide for important disclosures
Exhibit 8: This exhibit illustrates the 2008 performance of a traditional 60/40 portfolio with and without a small allocation to inverse RVX futures. In this period of crisis, a small allocation to inverse RVX futures further reduces returns with a slight increase in volatility and drawdowns.
Source: Bloomberg, CFE, Cboe Options Exchange2008 60/40 Stock/Bond Portfolio
60/40 Plus 5% 1 Mo. Inverse RVX Futures
60/40 Plus 5% 3 Mo. Inverse RVX Futures Held 1 Mo.
Annual Return -20.9% -22.7% -23.2%Annual Std Deviation 24.1% 25.8% 24.8%
Sharpe Ratio -0.87 -0.88 -0.94Maximum Drawdown -30.9% -34.5% -33.0%
Skew 0.16 0.00 0.05Kurtosis 4.14 3.44 3.79

Exhibit 9: Endowment Portfolio Performance in 2008 with Inverse RVXSM Futures
14"Portfolio Risk Management with RVXSM Futures" 6 March 2018 Please see the last slide for important disclosures
Exhibit 9: This exhibit illustrates the 2008 performance of a hypothetical endowment portfolio with and without a small allocation to inverse RVX futures. In this period of crisis, a small allocation to inverse RVX futures slightly reduces returns and increases volatility and drawdowns.
Source: Bloomberg, CFE, Cboe Options Exchange
2008 EndowmentEndowment Plus 5% 1 Mo.
Inverse RVX FuturesEndowment Plus 5% 3 Mo.
Inverse RVX Futures Held 1 Mo.Annual Return -38.6% -39.4% -39.7%
Annual Std Deviation 31.0% 32.4% 31.3%Sharpe Ratio -1.25 -1.22 -1.27
Maximum Drawdown -50.4% -52.4% -51.3%Skew -0.13 -0.22 -0.20
Kurtosis 3.21 2.85 3.09

Exhibit 10: Inverse RVXSM Futures-Based strategies in 2016
15"Portfolio Risk Management with RVXSM Futures" 6 March 2018 Please see the last slide for important disclosures
Exhibit 10: This exhibit illustrates the performance of two traditional portfolios as well as two inverse RVX futures-based portfolios in 2016. The RVX portfolios are both fully collateralized and rebalanced daily. The one month portfolio takes short positions in one month RVX futures and rolls out on the close the night before expiration. The Three month RVX futures portfolio shorts three month RVX futures and rolls into a new short 3 month RVX futures contract after one month at the close before the front month RVX futures contract expires. The traditional portfolios consist of a 60/40 Stock/Bond portfolio and a hypothetical endowment portfolio which invests in a variety of indices based on the average yearly asset allocation of a representative endowment. It is clear from the exhibit that 2016 was a generally favorable year for inverse RVX futures exposure.
Source: Bloomberg, CFE, Cboe Options Exchange

Exhibit 11: 60/40 Portfolio Performance in 2016 with Inverse RVXSM Futures
16"Portfolio Risk Management with RVXSM Futures" 6 March 2018 Please see the last slide for important disclosures
Exhibit 11: This exhibit illustrates the 2016 performance of a traditional 60/40 portfolio with and without a small allocation to inverse RVX futures. In this period of low volatility and generally positive market returns, a small allocation to inverse RVX futures slightly improved returns with a moderate increase in volatility.
Source: Bloomberg, CFE, Cboe Options Exchange2016 60/40 Stock/Bond Portfolio
60/40 Plus 5% 1 Mo. Inverse RVX Futures
60/40 Plus 5% 3 Mo. Inverse RVX Futures Held 1 Mo.
Annual Return 8.4% 11.3% 8.8%Annual Std Deviation 7.6% 10.2% 8.8%
Sharpe Ratio 1.11 1.10 1.00Maximum Drawdown -5.4% -7.5% -6.8%
Skew -0.29 -0.63 -0.53Kurtosis 2.23 2.95 2.82
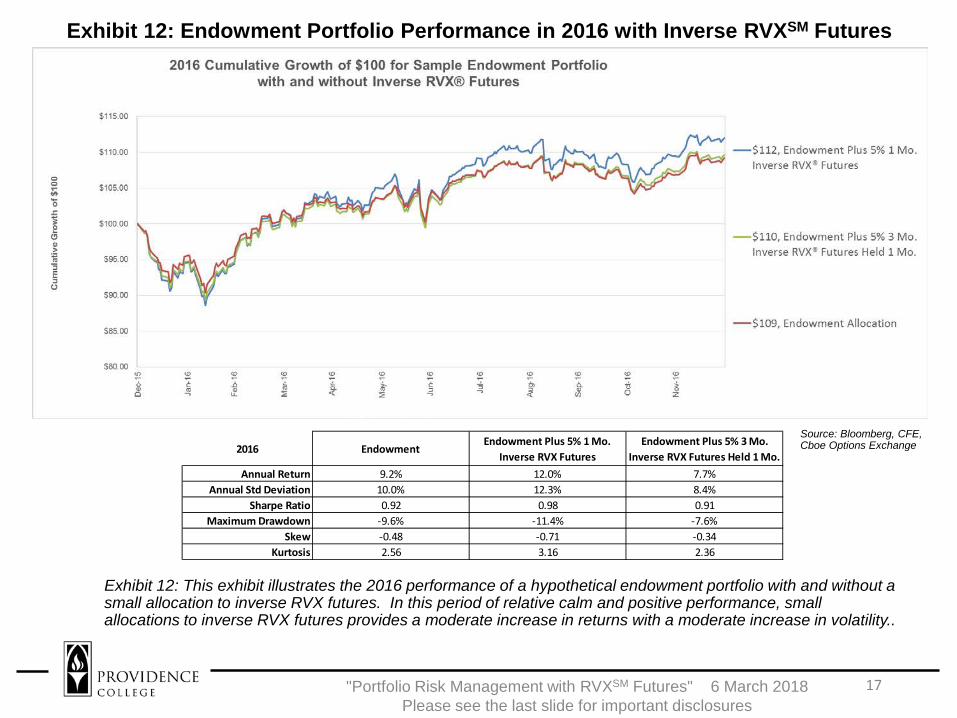
Exhibit 12: Endowment Portfolio Performance in 2016 with Inverse RVXSM Futures
17"Portfolio Risk Management with RVXSM Futures" 6 March 2018 Please see the last slide for important disclosures
Exhibit 12: This exhibit illustrates the 2016 performance of a hypothetical endowment portfolio with and without a small allocation to inverse RVX futures. In this period of relative calm and positive performance, small allocations to inverse RVX futures provides a moderate increase in returns with a moderate increase in volatility..
Source: Bloomberg, CFE, Cboe Options Exchange2016 Endowment
Endowment Plus 5% 1 Mo. Inverse RVX Futures
Endowment Plus 5% 3 Mo. Inverse RVX Futures Held 1 Mo.
Annual Return 9.2% 12.0% 7.7%Annual Std Deviation 10.0% 12.3% 8.4%
Sharpe Ratio 0.92 0.98 0.91Maximum Drawdown -9.6% -11.4% -7.6%
Skew -0.48 -0.71 -0.34Kurtosis 2.56 3.16 2.36

Levels, Realized Volatility Risk Premiums and Term Structure of RVXSM Futures
"Portfolio Risk Management with RVXSM Futures" 6 March 2018 Please see the last slide for important disclosures
18
• RVX Index is consistently higher than the VIX Index
• Russell 2000® realized volatility is also generally higher than S&P 500® volatility
• Russell 2000® generally exhibits more moderate realized volatility risk premiums than S&P 500®
• While levels of spot the VIX Index and the RVX Index tend to be highly correlated, the slope of the term structure is less correlated.

Exhibit 13: Level of Spot RVXSM Index Ranked on Level of Spot VIX®
Exhibit 13: This exhibit illustrates the historical levels of the spot RVX Index ranked on contemporaneous levels of the spot VIX Index. It is clear that the indexes are highly correlated and the RVX Index is consistently higher than the VIX index.
19"Portfolio Risk Management with RVXSM Futures" 6 March 2018 Please see the last slide for important disclosures
Source: Bloomberg, CFE, Cboe Options Exchange
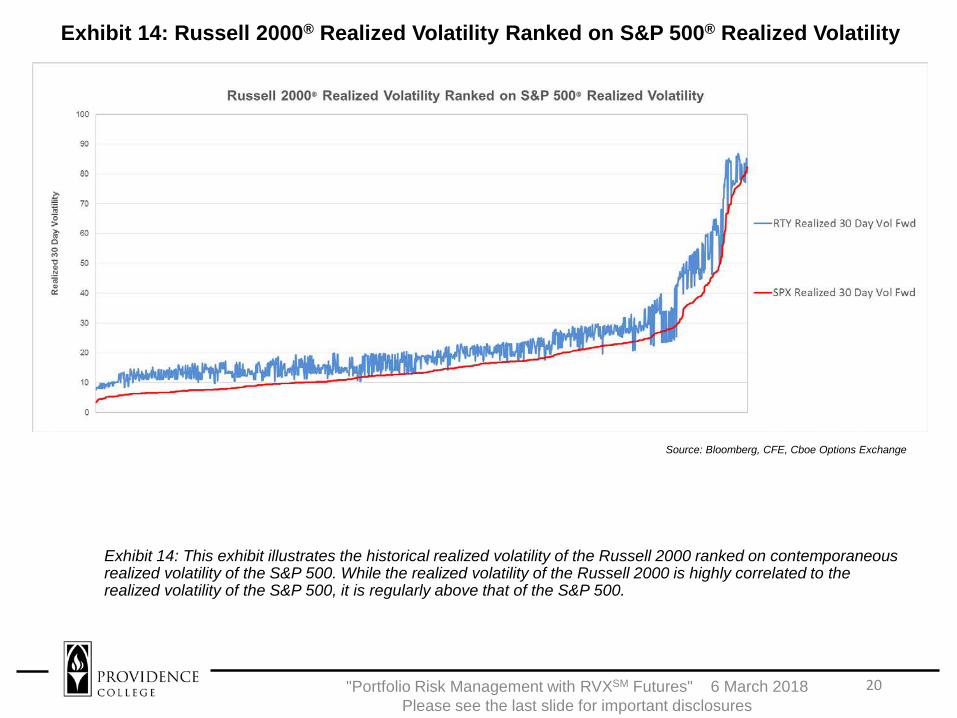
Exhibit 14: Russell 2000® Realized Volatility Ranked on S&P 500® Realized Volatility
Exhibit 14: This exhibit illustrates the historical realized volatility of the Russell 2000 ranked on contemporaneous realized volatility of the S&P 500. While the realized volatility of the Russell 2000 is highly correlated to the realized volatility of the S&P 500, it is regularly above that of the S&P 500.
20"Portfolio Risk Management with RVXSM Futures" 6 March 2018 Please see the last slide for important disclosures
Source: Bloomberg, CFE, Cboe Options Exchange

Exhibit 15: Russell 2000® Volatility Risk Premium Ranked on S&P 500® Volatility Risk Premium
Exhibit 15: This exhibit illustrates the historical realized volatility risk premium of the Russell 2000 ranked on the realized volatility risk premium of the S&P 500. The realized volatility risk premium measures the amount by which implied volatility (VIX and RVX) tend to be above the subsequent realized volatility of the underlying index (S&P 500 and Russell 2000). The RVX/Russell 2000 tend to exhibit more moderate realized volatility risk premiums than the VIX/S&P 500.
21"Portfolio Risk Management with RVXSM Futures" 6 March 2018 Please see the last slide for important disclosures
Source: Bloomberg, CFE, Cboe Options Exchange

Exhibit 16: RVXSM Front Month Futures Basis Ranked on VIX® Front Month Futures Basis
Exhibit 16: This exhibit illustrates the historical front month futures basis of the RVX Index ranked on the front month futures basis of the VIX Index. While the spot indexes tend to be very highly correlated, the basis is much less so. The basis is defined as the spot price minus the futures price and in this analysis is calculated using the closest futures contract to expiration.
22"Portfolio Risk Management with RVXSM Futures" 6 March 2018 Please see the last slide for important disclosures
Source: Bloomberg, CFE, Cboe Options Exchange

Exhibit 17: RVXSM Front Month Futures Basis Ranked on VIX® Front Month Futures Basis
Exhibit 17: This exhibit provides snapshots of the term structure of RVX futures and VIX futures for two select days: 24 October 2008 in which the term structure was in steep backwardation (spot price above futures price) and 29 December 2017 in which the term structure was in contango (spot price below futures price). While the RVX and VIX term structures are not always so smooth and consistently spaced, on these days the term structures are very similar with RVX futures and spot prices consistently about 5 points higher than those of the VIX Index. It is worth noting that the term structure of both RVX and VIX futures are rarely in backwardation.
23"Portfolio Risk Management with RVXSM Futures" 6 March 2018 Please see the last slide for important disclosures
Source: Bloomberg, CFE, Cboe Options Exchange
Cboe Exchange, Inc. provided financial support for the research for this paper. Futures trading is not suitable for all investors, and involves the risk of loss. The risk of loss in futures can be substantial. You should, therefore, carefully consider whether such trading is suitable for you in light of your circumstances and financial resources. For additional information regarding futures trading risks, see the Risk Disclosure Statement set forth in CFTC Regulation §1.55(b). The information in these materials are provided for general education and information purposes only. No statement within these materials should be construed as a recommendation to buy or sell a security or future or to provide investment advice. Past performance is not indicative of future results. Parameters relating to past performance of strategies discussed are not capable of being duplicated. These materials contain index performance data based on back-testing, i.e., calculations of how the index might have performed prior to launch. Back-tested performance information is purely hypothetical and is provided in these materials solely for informational purposes. Back-tested performance does not represent actual performance and should not be interpreted as an indication of actual performance. Index performance returns do not reflect management fees, transactions costs or expenses. No representation is being made that any investment will or is likely to achieve a performance record similar to that shown. The views of third party speakers and their materials are their own and do not necessarily represent the views of Cboe. Third party speakers are not affiliated with Cboe. These materials should not be construed as an endorsement or an indication by Cboe of the value of any non-Cboe product or service described in these materials. Cboe® and VIX® are registered trademarks, and RVXSM and Cboe Russell 2000 Volatility IndexSM are service marks of Cboe Exchange, Inc. Russell 2000® is a registered trademark of the Frank Russell Company, used under license by Cboe Exchange, Inc. S&P 500® is a registered trademark of Standard and Poor's Financial Services, LLC. Financial products based on S&P indices are not sponsored, endorsed, sold or promoted by Standard & Poor’s, and neither Standard &Poor’s nor Cboe make any representation regarding the advisability of investing in such products. All other trademarks and service marks are the property of their respective owners. More information is or will be available at www.cboe.com/funds. Please email comments to [email protected], or [email protected].
24"Portfolio Risk Management with RVXSM Futures" 6 March 2018 Please see the last slide for important disclosures