eea activities related to the coastal atlases ...dusk.geo.orst.edu/ican_eea/eea_andrus.pdf · 1 eea...
TRANSCRIPT
1
EEA activities related to the coastalEEA activities related to the coastalatlases atlases –– assessments, ICZM assessments, ICZMevaluation and future plansevaluation and future plans
Andrus Meiner, EEA
EEA coastal atlases conference, 9-10 July 2008,Copenhagen
2
OverviewOverview
• EEA activities
• Tools and indicators
• Vision of coastal/marine IS
3
We need an integrated approach for ourWe need an integrated approach for ourcoasts and seascoasts and seas
• Vision of marine and coastal ecosystems– ecosystem-based management approach– implementation of ICZM, including adaptation
to climate change– integrated monitoring and assessments
• Vision of common maritime space– holistic approach for development of all sea-
related activities in a sustainable manner– better characterization of maritime areas and
introducing maritime spatial planning
4
What EEA is doing in relation toWhat EEA is doing in relation tocoasts and seas?coasts and seas?
• Integrated marine assessments
• Assessment of regional and territorial development ofcoastal areas
• Support to the European Commission in relation to
– Marine Strategy Framework Directive
– Broad-scale seabed mapping and European Atlas of the Seas
– Formation of European Marine Observation and Data Network (EMODNET)
– Indicators and exchange of experiences and comparative analysis for ICZM
– Water Information System for Europe (WISE)
– SEBI2010 and Natura2000 network (e.g. marine and coastal)
5
EEA approach for integrated spatialEEA approach for integrated spatialassessment of coastal zonesassessment of coastal zones
• Relevant to EU policies
• European focus
• Multi-scale nested approach
• Geospatial data assimilation
• Trend analysis / Accounting
• Environment as entry point
• Ecosystem approach
• Economic sector integration
6
Approach for policy analysis ofcoastal areas
Sectoral policies
Need for additional
integration
Integrated policies
Need for full
implementation
Unique policy
element
for
sea/land interface
Sectoral policies
Need for additional
integration
Integrated policies
Need for full
implementation
Unique policy
element
for
sea/land interface
Analytical frameworksAnalytical frameworks

7
Nested approach: multi-scale analysisNested approach: multi-scale analysis
CORINE Land Cover,GMES High resolution LC,national sources10 m
LocalLocalAction and policy implementation,monitoring
GlobCORINECORINE Land Cover,EuroRegionalMapGMES High resolution LC100 m
European marketEuropean marketNational/regional governmentNational/regional governmentPolicy design and implementationguidelines, enforcement
GlobCoverGlobCORINE (reclassified)EuroGlobalMap300 m
Global, pan-EuropeanGlobal, pan-EuropeanInternational agreements, globalobjectives
Typical data, spatialresolution
Governance level
Land and ecosystem accounting
at 3 different interconnected
scales
grids-based statistics

8
Example: regional assessment ofExample: regional assessment ofcoastscoasts
• Developmentof coastalzones
• Services of thecoastal zone
• Climate changeand need foradaptation
• Policyresponses
Current use ofcoasts is notsustainable
9
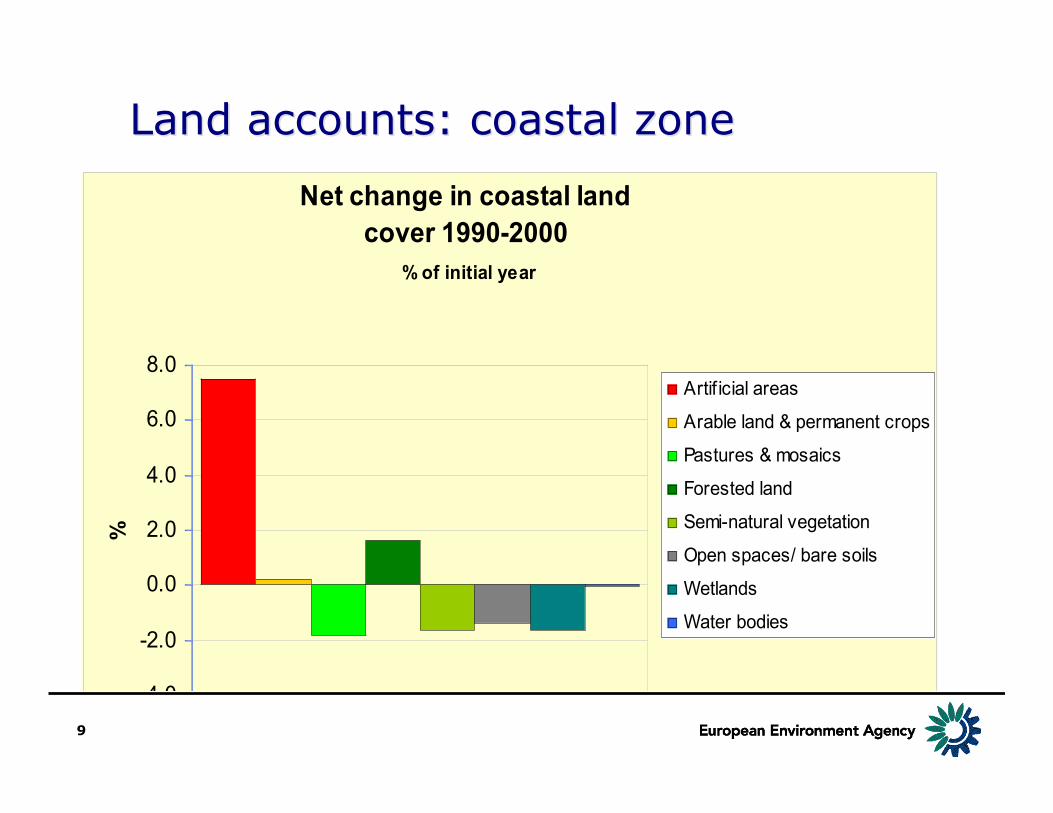
Net change in coastal land
cover 1990-2000
% of initial year
-4.0
-2.0
0.0
2.0
4.0
6.0
8.0
%
Artif icial areas
Arable land & permanent crops
Pastures & mosaics
Forested land
Semi-natural vegetation
Open spaces/ bare soils
Wetlands
Water bodies
Land accounts: coastal zoneLand accounts: coastal zone
10
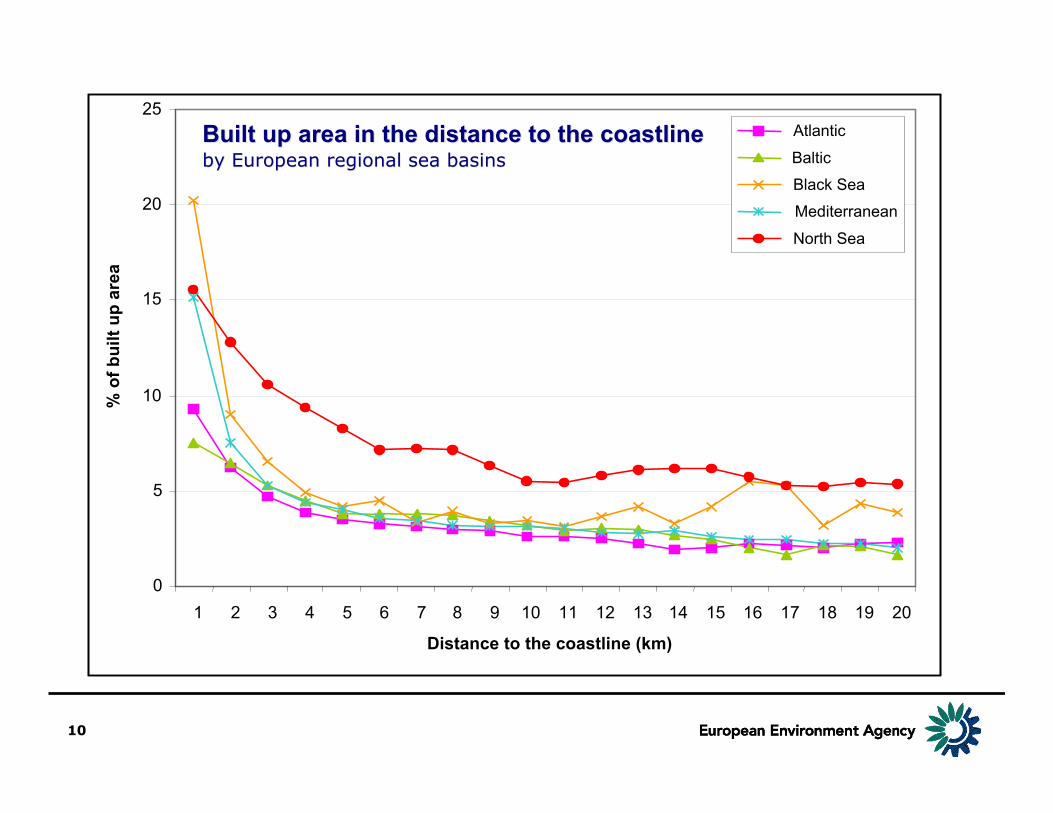
Built up area in the distance to the coastlineBuilt up area in the distance to the coastlineby European regional sea basinsby European regional sea basins
0
5
10
15
20
25
1 2 3 4 5 6 7 8 9 10 11 12 13 14 15 16 17 18 19 20
Distance to the coastline (km)
% o
f bui
lt up
are
aAtlantic
Baltic
Black Sea
Mediterranean
North Sea

11
Main messages from EEA reportMain messages from EEA report
• Results of quantitative spatial analysis:Accelerated land take by built-up areas and infrastructure
• Economic intensification at the coastal zone:more space demanded by tourism infrastructure, ports, shipping, off-shoreenergy, aquaculture, sand extraction etc.
• Awareness raising:Coastal services degraded as a result of development and resource use
• Think global, act local:Climate change and need for adaptation

12
European expert group and indicatorsEuropean expert group and indicators
• To support implementation of the EU ICZM Recommendation,the Commission facilitates an expert group, which held its firstmeeting on 3 October 2002
• Set up by the expert group, the working group on indicatorsand data established 2 sets of indicators
– one aimed to measure progress in ICZM (framework of 31 actions)– the other one measuring sustainability on the coast (set of 27
indicators)
• The role of indicators was to provide– Baseline fixation and facilitating comparison in ICZM– Structured approach for national stocktaking
• Communication from the Commission 7 June 2007: Anevaluation of Integrated Coastal Zone Management (ICZM) inEurope
13

14
GOALS INDICATORS MEASUREMENTS SIF IFS
1-1-Size, density and proportion of the population living on the coast
1-DEMAND FOR PROPERTY ON THE COAST
1-2-Value of residential property.
2-AREA OF BUILT -UP LAND 2-1-Percentage of built -up land by distance from the coastline
3-RATE OF DEVELOPMENT OF PREVIOUSLY UNDEVELOPED LAND
3-1-Area converted from non -developed to developed land uses
4-DEMAND FOR ROAD TRAVEL ON THE COAST
4-1-Volume of traffic on coastal motorways and major roads
5-PRESSURE FOR COASTAL AND MARINE RECREATION
5-1-Number of berths and moorings for recreational boating
1 -To control further development of the undeveloped coast as appropriate.
6-LAND TAKEN UP BY INTENSIVE AGRICULTURE
6-1-Proportion of agricultural land farmed intensively
7-AMOUNT OF SEMI -NATURAL HABITAT
7-1-Area of semi -natural habitat
8-AREA OF LAND AND SEA PROTECTED BY STATUTORY DESIGNATIONS
8-1-Area protecte d for nature conservation, landscape and heritage
9-EFFECTIVE MANAGEMENT OF DESIGNATED SITES
9-1-Rate of loss of or damage to, protected areas
10-1-Status and trend of specified habitats and species
10-2-Number of species per habitat type
2 -To protect, enhance and celebrate natural and cultural diversity.
10-CHANGE IN SIGNIFICANCE COASTAL AND MARINE HABITATS AND SPECIES
10-3-Number of Red List coastal area species
11-LOSS OF CULTURAL DISTINCTIVENESS
11-1-Number and value of sales of local products with regional quality labels or European PDO/PGI/TSG
12-1-Full time, part time and seasonal employment per sector
12-PATTERNS OF SECTORAL EMPLOYMENT
12-2-Value added per sector
13-1-Number of incom ing and outgoing passengers per port
13-2-Total volume of goods handled per port
13-VOLUME OF PORT TRAFFIC
13-3-Proportion of goods carried by short sea routes
14-1-Number of overnight stays in tourist accommodation
14-INTENSITY OF TOURISM
14-2-Occupancy rate of bed places
3 -To promote and support a dyn amic and sustainable coastal economy
15-SUSTAINABLE TOURISM 15-1-Number of tourist accommodation units holding EU Eco -label
15-1-Number of tourist
accommodation units holding EU Eco -label
15-SUSTAINABLE
TOURISM
15-2-Ratio of overnight stays to number of residents
16-QUALITY OF BATHING WATER
16-1-Percentage of bathing waters compliant with the guide value of the European Bathing Water Directive
17-AMOUNT OF COASTAL, ESTUARINE AND MARINE LITTER
17-1-Volume of litter collected per given length of shoreline
18-CONCENTRATION OF NUTRIENTS IN COASTAL WATERS
18-1-Riverine and direct inputs of nitrogen and phosphorus in in shore waters
19-1-Volume of accidental oil spills
4 -To ensure that beaches are clean and that coastal waters are unpolluted
19-AMOUNT OF OIL POLLUTION
19-2-Number of ob served oil slicks from aerial surveillance
20-DEGREE OF SOCIAL COHESION
20-1-Indices of social exclusion by area
21-1-Average household income 21-RELATIVE HOUSEHOLD PROSPERITY
21-2-Percentage of population with a higher education qualificati on
5 -To reduce social exclusion and promote social cohesion in c oastal communities
22-SECOND AND HOLIDAY HOMES
22-1-Ratio of first to second and holiday homes
23-1-State of the main fish stocks by species and sea area
23-2-Recruitment and spawning stock biomass by species
23-3-Landings and fish mortality
by s pecies
23-FISH STOCKS AND FISH LANDINGS
23-4-Value of landings by port and species
6 -To use natural resources wisely
24-WATER CONSUMPTION
24-1-Number of days of reduced supply
25-1-Number of ‘stormy days’ 25-SEA LEVEL RISE AND EXTREME WEATHER CONDITIONS
25-2-Rise in sea level relative to land
26-1-Length of pro tected and
defended coastline
26-2-Length of dynamic coastline
26-COASTAL EROSION
AND ACCRETION
26-3-Area and volume of sand nourishment
27-1-Number of people living within an ‘at risk’ zone
7 -To recognise the threat to coastal zones posed by climate change and to ensure appropriate and ecologically responsible coastal protection
27-NATURAL, HUMAN AND ECONOMIC ASSETS AT RISK 27-2-Area of protected sites
within an ‘at risk’ zone
http://www.deduce.eu
DEDUCE aimed at testing the set of 27 indicators and 45measurements for sustainable development in coastalzones developed for the EU ICZM working group. Eachindicator has:
- The Standard Indicator Format - SIF: defines anddescribes the methodology of calculation.
- The Indicator Fact Sheet – IFS: summarises andcommunicates the main information obtained bypartners on each indicator.

15
Land and EcosystemLand and EcosystemAccounting (LEAC)Accounting (LEAC)
• Databases
The core data of the LEAC project havebeen structured in a relationaldatabase model in order to allow quickand easy analyses. These databaseshave been made publicly accessiblethrough the Internet
• LEAC map layers
From the LEAC database, variousgeographical layers have been derivedsuch as land cover flows, Corilis, thegreen potential background layer andthe dominant land-cover types
• Interactive tools
Online Analytical Processing (OLAPcube) pivot applications andmethodological guidebook
16
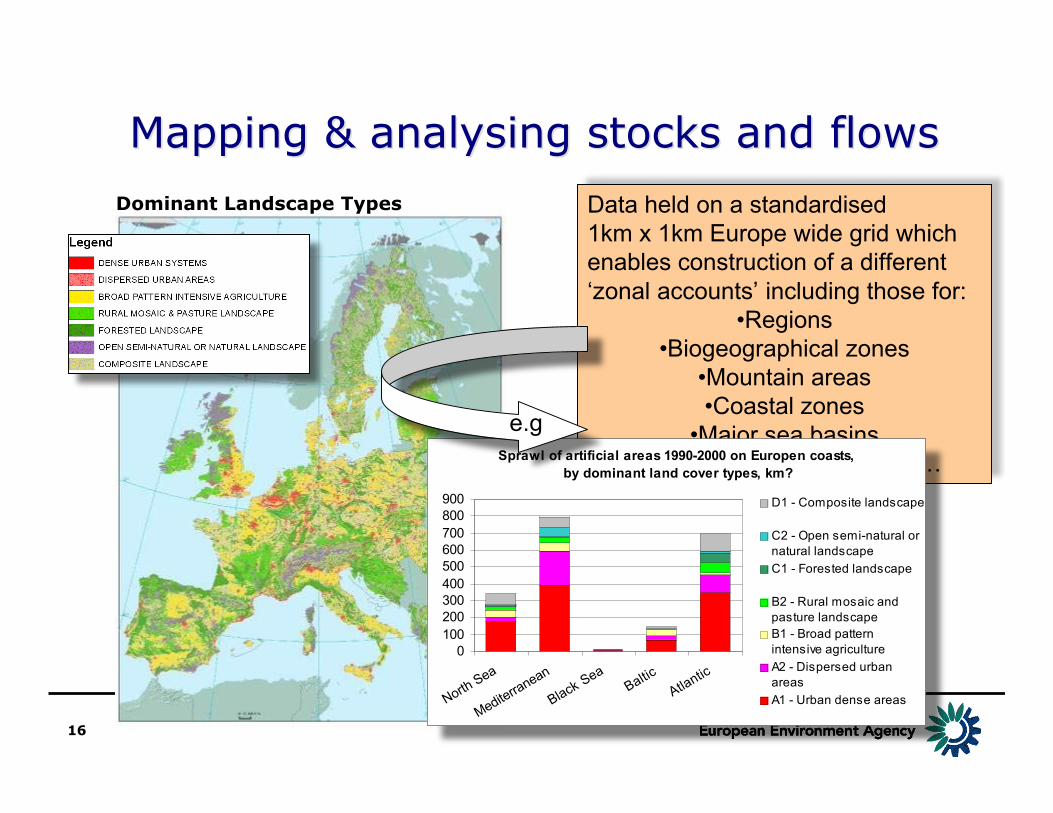
Mapping & analysing stocks and flowsMapping & analysing stocks and flows
Data held on a standardised1km x 1km Europe wide grid whichenables construction of a different‘zonal accounts’ including those for:
•Regions•Biogeographical zones
•Mountain areas•Coastal zones
•Major sea basins•Dominant landscape types…Sprawl of artificial areas 1990-2000 on Europen coasts,
by dominant land cover types, km?
0
100
200
300
400
500
600
700
800
900
North S
ea
Mediterra
nean
Black Sea
Baltic
Atlantic
D1 - Composite landscape
C2 - Open semi-natural or
natural landscape
C1 - Forested landscape
B2 - Rural mosaic and
pasture landscape
B1 - Broad pattern
intensive agriculture
A2 - Dispersed urban
areas
A1 - Urban dense areas
e.g
Dominant Landscape Types

17

18
Relevant examplesRelevant examplesfrom MESH andfrom MESH andBALANCE projectsBALANCE projects
• Seabed map showingEUNIS habitat types
• Benthic marinelandscapes
Source: Source: BALANCE Interim Report No. 10Source: Source: searchmesh.netsearchmesh.net
Dominant LandscapeTypes of the Seas?
19
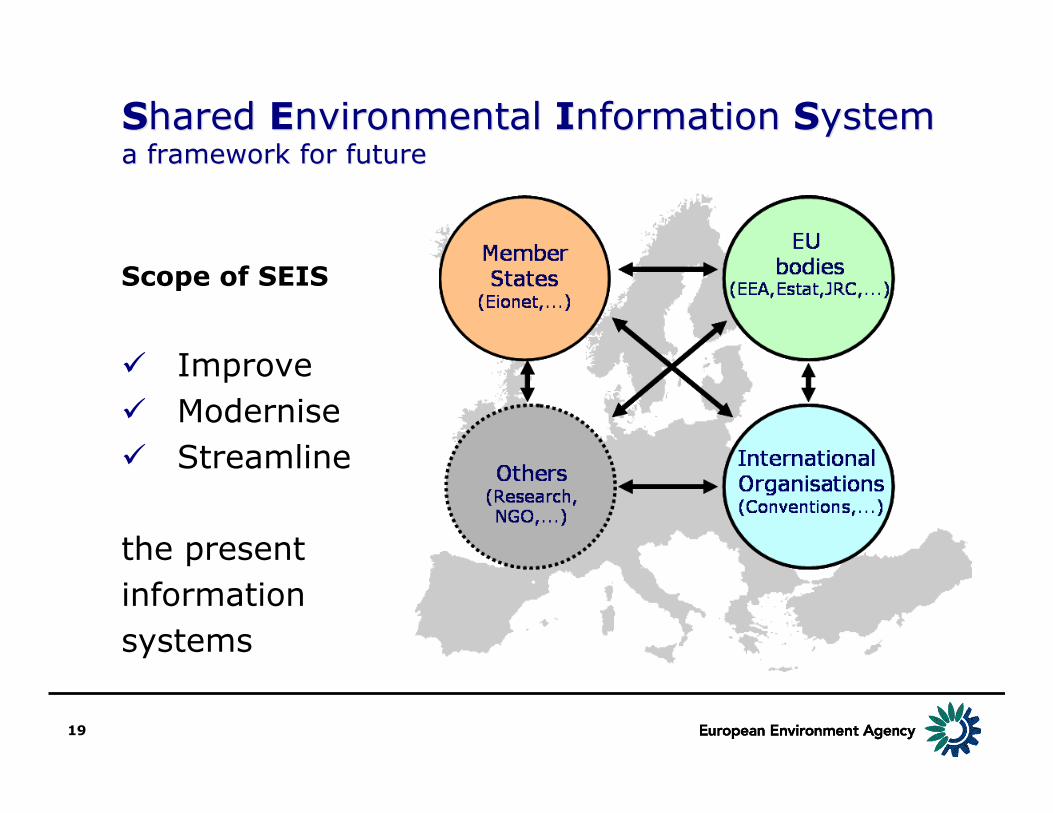
SShared hared EEnvironmental nvironmental IInformation nformation SSystemystema framework for futurea framework for future
Scope of SEIS
Improve Modernise Streamline
the presentinformationsystems

20
1. Sharing• Organisation (political commitment)• Partnership (giving and taking)• Networking (connecting)
2. Environmental Information• Content (horizontal integration)• Local to global (vertical integration)• Real time• Quality assurance
3. System• Infrastructure• e-Services
In other words, SEIS is about...In other words, SEIS is about...
21
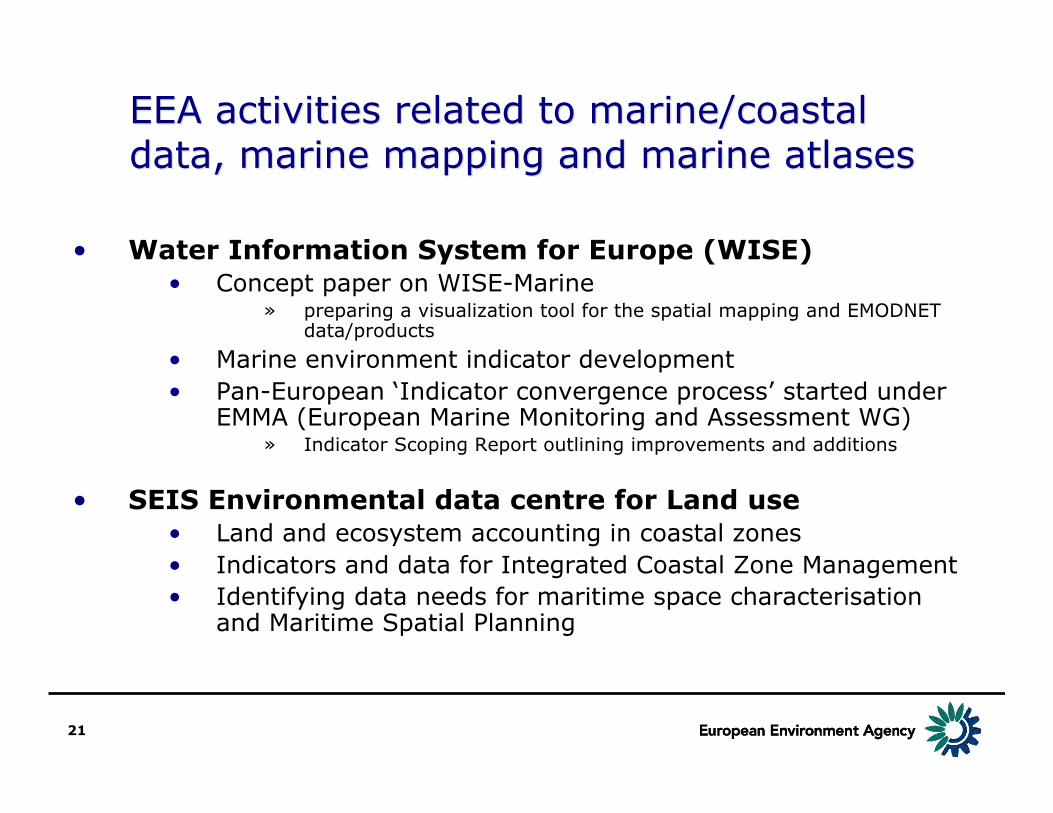
EEA activities related to marine/coastalEEA activities related to marine/coastaldata, marine mapping and marine atlasesdata, marine mapping and marine atlases
• Water Information System for Europe (WISE)• Concept paper on WISE-Marine
» preparing a visualization tool for the spatial mapping and EMODNETdata/products
• Marine environment indicator development• Pan-European ‘Indicator convergence process’ started under
EMMA (European Marine Monitoring and Assessment WG)» Indicator Scoping Report outlining improvements and additions
• SEIS Environmental data centre for Land use• Land and ecosystem accounting in coastal zones• Indicators and data for Integrated Coastal Zone Management• Identifying data needs for maritime space characterisation
and Maritime Spatial Planning
22
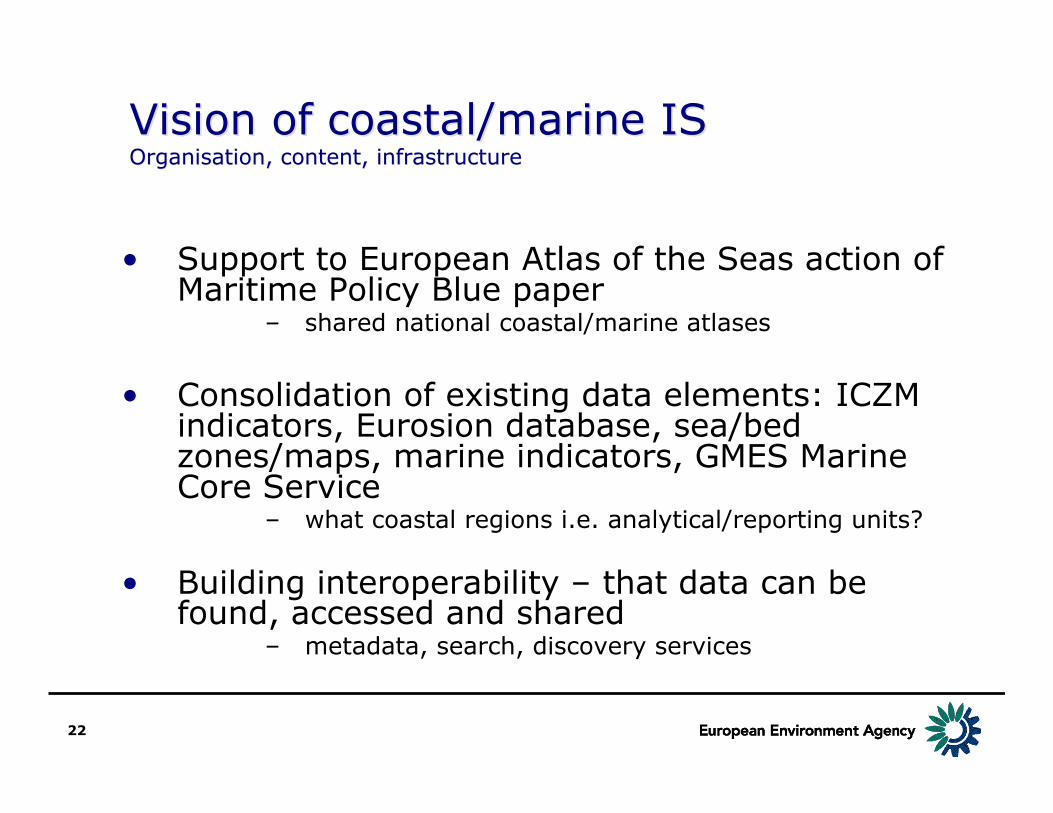
Vision of coastal/marine ISVision of coastal/marine ISOrganisation, content, infrastructureOrganisation, content, infrastructure
• Support to European Atlas of the Seas action ofMaritime Policy Blue paper
– shared national coastal/marine atlases
• Consolidation of existing data elements: ICZMindicators, Eurosion database, sea/bedzones/maps, marine indicators, GMES MarineCore Service
– what coastal regions i.e. analytical/reporting units?
• Building interoperability – that data can befound, accessed and shared
– metadata, search, discovery services

23
Coastal Zone
Off-shore area
CatchmentsTourism
Marine energy
Aggregate materials
ICZM / Marine Spatial Planning
Marine Protected
Areas
Marine ecosystems
Maritimetransport
Fisheries
Human dimension
Aquaculture
Land basedpollution
Sand, gravel, rock extraction
Wind & wave
Oil & gas
Maritimeheritage
Territorialcohesion
Dredging and disposal
Beach recreation
Leisure boating
Natura2000 at sea
• physical• chemical• biological
Vessels
Ports
Coastal riskmanagement (erosion, SLR)
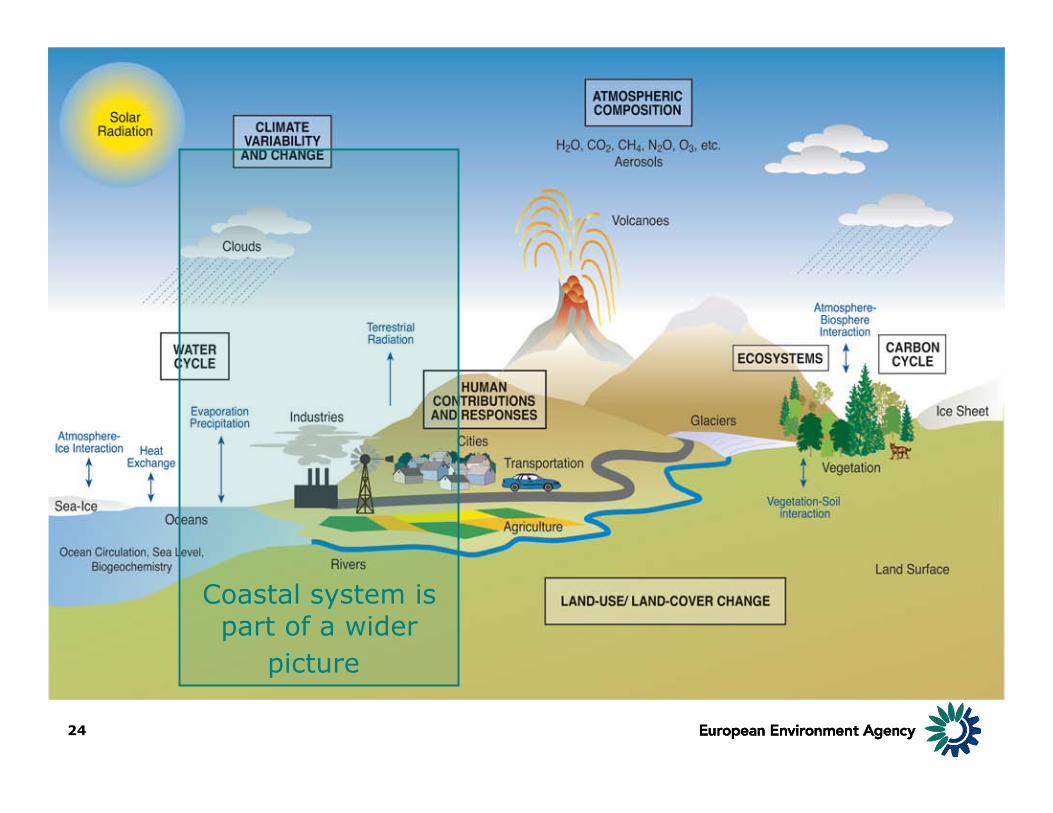
24
Coastal system ispart of a wider
picture

25
Integrated approach toIntegrated approach toanalysis of coastal systemsanalysis of coastal systems
EEA: 12% of all EU coastal zones is lyingbelow 5 m elevation and
are potentially vulnerable for sea level riseand related inundations. JRC: 19% of total EU-25 population (86 million
inhabitants) live in 0-10 km coastal zone,population density twice as big as in whole EU
Globally, the sea level has already risenby about 17 cm during the XX centuryand without abatement a further rise ofabout 20-60 cm is expected by the end
of this century.

26
PROJECTION:HadCM3 model;emissions scenario B2
Linking spatial data setswith spatially distributedmodelling results

27Source: C Net News.comCredit: GeoMapAppVG/Lamont-Doherty Earth Observatory of Columbia University
Seamless representation for land and seabed data

28
Technology existing today allows web-Technology existing today allows web-based analysis based on user interactionbased analysis based on user interaction
Objective of interoperable coastal atlases IS:
Provide possibility to access, view, downloaddata
Aim at interactive, accessible and simplyusable geo-processing tools that enablepeople to create new information
29
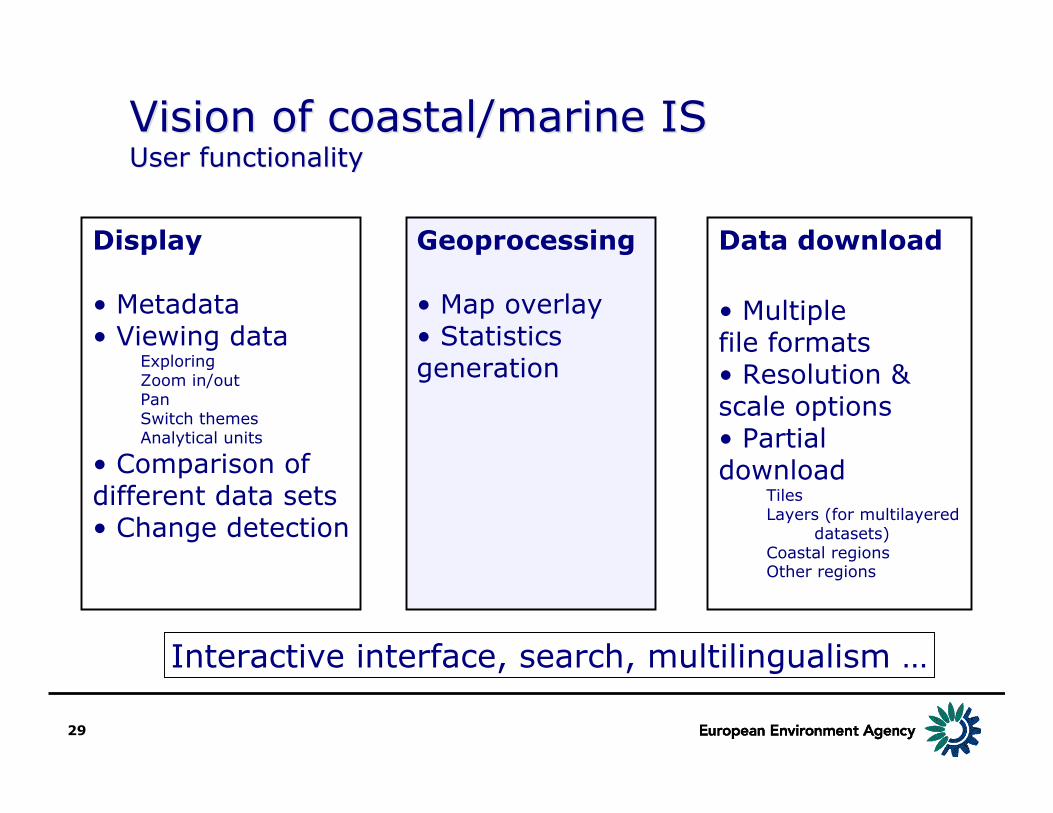
Vision of coastal/marine ISVision of coastal/marine ISUser functionalityUser functionality
Display
• Metadata • Viewing data
ExploringZoom in/outPanSwitch themesAnalytical units
• Comparison of different data sets• Change detection
Geoprocessing
• Map overlay• Statistics generation
Data download
• Multiplefile formats• Resolution &scale options• Partial download
TilesLayers (for multilayered
datasets)Coastal regionsOther regions
Interactive interface, search, multilingualism …

30
Thank you!
“Integration is the key to a sustainable future.” [2007 Environment Policy Review, COM(2008) 409 final ]