eeb corporate
TRANSCRIPT
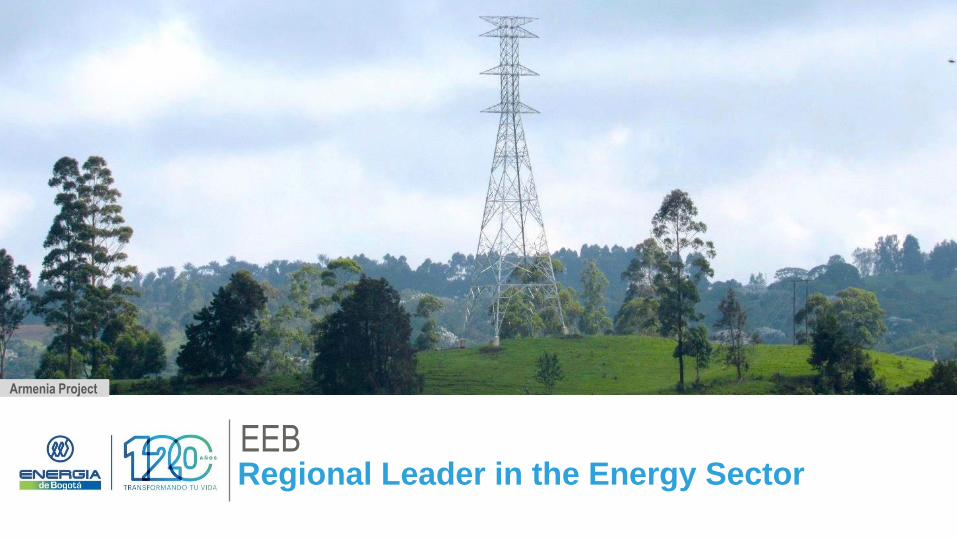
EEB Regional Leader in the Energy Sector
Armenia Project
2
DISCLAIMER
The information provided herein is for informational and illustrative
purposes only and is not, and does not seek to be, a source of legal,
investment or financial advice on any subject. This presentation does
not purport to address any specific investment objectives, financial
situation or particular needs of any recipient. It should not be regarded
by recipients as a substitute for the exercise of their own judgment.
This information does not constitute an offer of any sort and is subject
to change without notice. EEB is no obligation to update or keep
current the information contained herein.
EEB expressly disclaims any responsibility for actions taken or not
taken based on this information. EEB does not accept any
responsibility for losses that might result from the execution of the
proposals or recommendations presented. EEB is not responsible for
any content that may originate with third parties. EEB may have
provided, or might provide in the future, information that is inconsistent
with the information herein presented. No representation or warranty,
either express or implied, is provided in relation to the accuracy,
completeness or reliability of the information contained herein.
This presentation may contain statements that are forward-looking
within the meaning of Section 27A of the Securities Act and Section
21E of the U.S. Securities Exchange Act of 1934. Such forward-looking
statements are based on current expectations, projections and
assumptions about future events and trends that may affect EEB and
are not guarantees of future performance.
The shares have not been and will not be registered under the U.S.
Securities Act of 1933, as amended (the “Securities Act”) or any U.S.
State securities laws. Accordingly, the shares are being offered and
sold in the United States only to qualified institutional buyers as defined
under Rule 144A under the Securities Act, and outside the United
States in accordance with Regulation S of the Securities Act.
We converted some amounts from Colombian pesos into U.S. dollars
solely for the convenience of the reader at the TRM published by the
SFC as of each period. These convenience translations are not in
accordance with U.S. GAAP and have not been audited. These
translations should not be construed as a representation that the
Colombian peso amounts were, have been or could be converted into
U.S. dollars at those or any other rates.
3
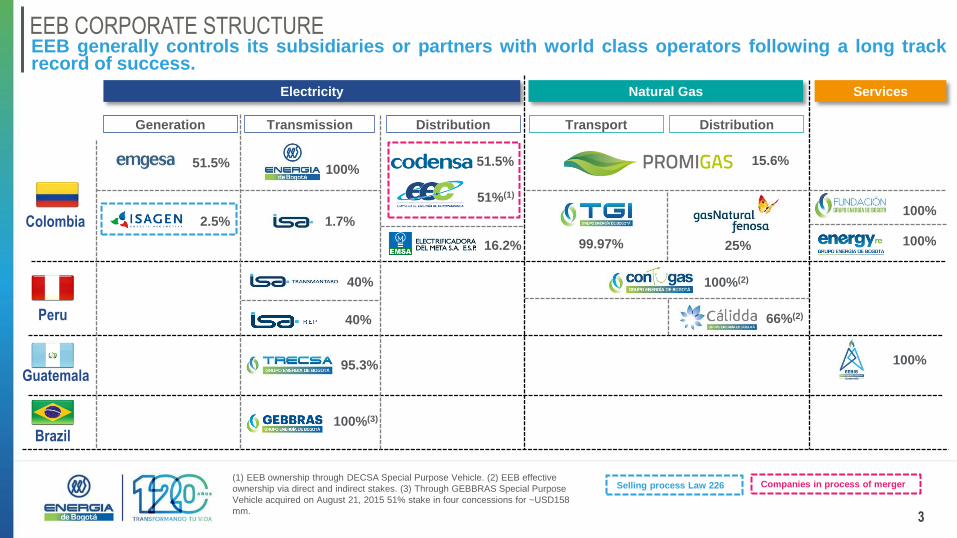
EEB CORPORATE STRUCTURE EEB generally controls its subsidiaries or partners with world class operators following a long track record of success.
Transmission Distribution Distribution
Electricity
Transport
Natural Gas Services
Generation
51.5%
2.5% 1.7%
51%(1)
16.2% 99.97%
15.6%
25%
100%(2)
66%(2)
100% 51.5%
95.3% 100%
100%
100%
40%
40%
100%(3)
Colombia
Peru
Guatemala
Brazil
(1) EEB ownership through DECSA Special Purpose Vehicle. (2) EEB effective
ownership via direct and indirect stakes. (3) Through GEBBRAS Special Purpose
Vehicle acquired on August 21, 2015 51% stake in four concessions for ~USD158
mm.
Selling process Law 226
|
Companies in process of merger
4
INVESTMENTS Highlights
FINANCIAL Highlights
Overview of
MAIN INVESTMENTS
APPENDIX
5
INVESTMENTS Highlights
FINANCIAL Highlights
Overview of
MAIN INVESTMENTS
APPENDIX

6
KEY INVESTMENT HIGHLIGHTS EEB represents an extraordinary opportunity to participate in a leading diversified platform across regional energy markets
EEB’s subsidiaries have market leading participations across the energy chain and are well positioned to benefit from the expected growth in electricity and natural gas markets in the region
Leading Participant in Relevant Energy Markets 1
Sound industry dynamics as well as strong growth outlooks for electricity and natural gas sectors in Colombia, Peru, Brazil and Guatemala provide significant growth opportunities for EEB and its subsidiaries
Strong Footprint in Attractive Energy Markets in LatAm 2
Due to the industry’s regulated framework, EEB’s distribution and transportation businesses provide stable streams of predictable earnings. Carefully selected brownfield projects also provide significant growth opportunities
Growing Revenue Base Propelled by Disciplined Capex Planning 3
EEB receives a stable flow of dividends from its subsidiaries with dividend policies that promote maximum payout ratios. In turn, EEB pays out an attractive and reliable amount of dividends to its shareholders
Track Record of Creating Value for Shareholders 4
EEB has successfully accessed the debt and equity markets in recent years to help finance important investment plans, including the acquisition of a 32% stake in TGI. Several liability management transactions undertaken to reduce EEB’s overall financial costs
Continued Access to Financial Markets to Fund Expansions 5
EEB has strong relationships with its shareholders, including the Government of Bogotá, as well as with its partners (e.g. Grupo Enel, Gas Natural, ISA, Furnas, etc.)
Strong Shareholders and Partners 6
7
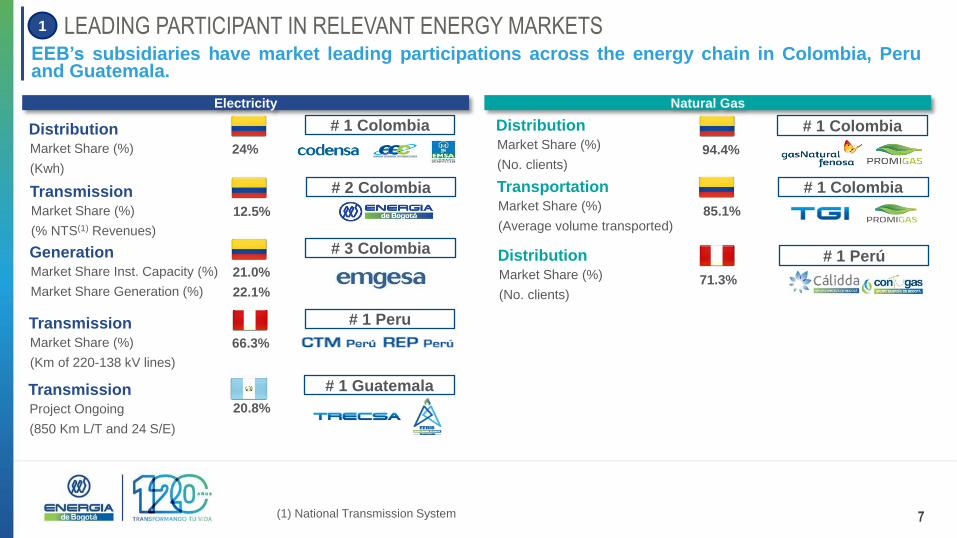
LEADING PARTICIPANT IN RELEVANT ENERGY MARKETS EEB’s subsidiaries have market leading participations across the energy chain in Colombia, Peru and Guatemala.
1
Electricity Natural Gas
Generation Market Share Inst. Capacity (%)
Market Share Generation (%)
# 3 Colombia
21.0%
22.1%
Transmission Market Share (%)
(% NTS(1) Revenues)
# 2 Colombia
12.5%
Distribution Market Share (%)
(Kwh)
# 1 Colombia
24%
Transmission Market Share (%)
(Km of 220-138 kV lines)
# 1 Peru
66.3%
Transmission Project Ongoing
(850 Km L/T and 24 S/E)
# 1 Guatemala
Distribution Market Share (%)
(No. clients)
# 1 Colombia
94.4%
Transportation Market Share (%)
(Average volume transported)
# 1 Colombia
85.1%
Distribution Market Share (%)
(No. clients)
# 1 Perú
71.3%
(1) National Transmission System
20.8%
522 590 658 638 697 635
1.900
2010 2011 2012 2013 2014 2015 … 2025E
8
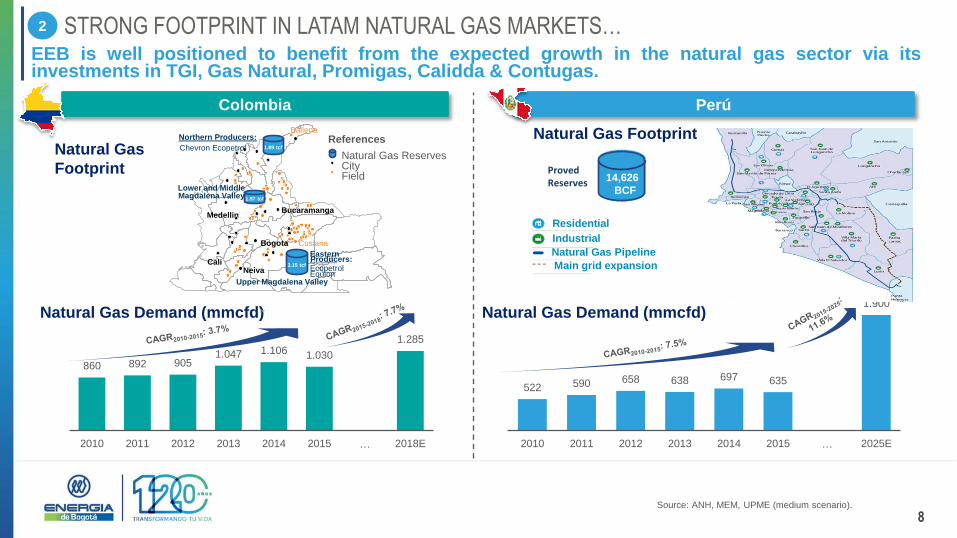
STRONG FOOTPRINT IN LATAM NATURAL GAS MARKETS… EEB is well positioned to benefit from the expected growth in the natural gas sector via its investments in TGI, Gas Natural, Promigas, Calidda & Contugas.
2
Source: ANH, MEM, UPME (medium scenario).
Perú Colombia
Natural Gas
Footprint
Natural Gas Footprint
Natural Gas Demand (mmcfd) Natural Gas Demand (mmcfd)
Proved Reserves 14,626
BCF
Residential
Industrial
Natural Gas Pipeline
Main grid expansion
References
Natural Gas Reserves City Field
Bucaramanga
Bogota
Neiva Cali
Medellin
3.15 tcf
1.97 tcf
Eastern Producers: Ecopetrol Equion
Upper Magdalena Valley
Lower and Middle Magdalena Valley
Northern Producers:
Chevron Ecopetrol 1.89 tcf
Ballena
Cusiana
860 892 905 1.047 1.106 1.030
1.285
2010 2011 2012 2013 2014 2015 … 2018E
9
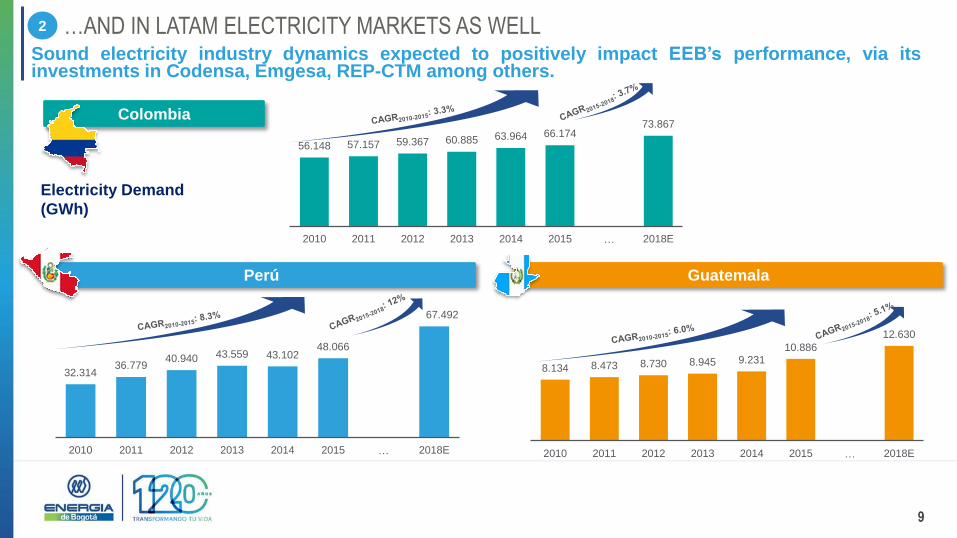
…AND IN LATAM ELECTRICITY MARKETS AS WELL Sound electricity industry dynamics expected to positively impact EEB’s performance, via its
investments in Codensa, Emgesa, REP-CTM among others.
2
Colombia
Electricity Demand
(GWh)
Perú Guatemala
56.148 57.157 59.367 60.885 63.964 66.174 73.867
2010 2011 2012 2013 2014 2015 … 2018E
32.314 36.779
40.940 43.559 43.102 48.066
67.492
2010 2011 2012 2013 2014 2015 … 2018E
8.134 8.473 8.730 8.945 9.231 10.886
12.630
2010 2011 2012 2013 2014 2015 … 2018E
$820.851 $948.514
$1.113.894
$1.365.600 $1.201.635
2011 2012 2013 2014 2015 2016 YTD
$3.513.739 $3.699.245 $3.802.041 $4.092.963
$4.455.857
$2.329.357
2011 2012 2013 2014 2015 2016 YTD
$1.693.167 $1.902.952
$2.183.395
$2.530.768
$3.370.038
$1.971.502
2011 2012 2013 2014 2015 2016 YTD
10
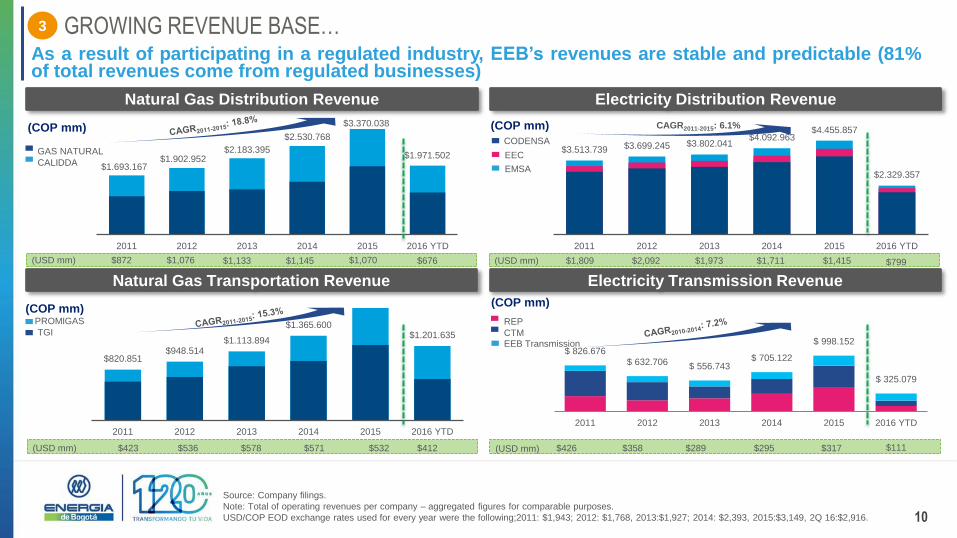
GROWING REVENUE BASE… As a result of participating in a regulated industry, EEB’s revenues are stable and predictable (81% of total revenues come from regulated businesses)
3
Source: Company filings.
Note: Total of operating revenues per company – aggregated figures for comparable purposes.
USD/COP EOD exchange rates used for every year were the following;2011: $1,943; 2012: $1,768, 2013:$1,927; 2014: $2,393, 2015:$3,149, 2Q 16:$2,916.
Natural Gas Distribution Revenue Electricity Distribution Revenue
Natural Gas Transportation Revenue Electricity Transmission Revenue
(COP mm)
(COP mm) (COP mm)
(COP mm)
$676 $872 $1,076 $1,133 $1,145 $1,070 (USD mm) $799 $1,809 $2,092 $1,973 $1,711 $1,415 (USD mm)
CAGR2011-2015: 6.1%
$412 $423 $536 $578 $571 $532 (USD mm) $111 $426 $358 $289 $295 $317 (USD mm)
REP
CTM EEB Transmission
TGI
PROMIGAS
GAS NATURAL
CALIDDA
CODENSA
EEC
EMSA
$ 826.676
$ 632.706 $ 556.743 $ 705.122
$ 998.152
$ 325.079
2011 2012 2013 2014 2015 2016 YTD
1,2
10,7
43,0
18,3
205,0
1,2
34,7
96,0
65,6
22,1
Gas Distribution
Gas Transportation
Electricity Distribution
ElectricityTransmission
Electricity Generation
2Q2016 2Q2015
11
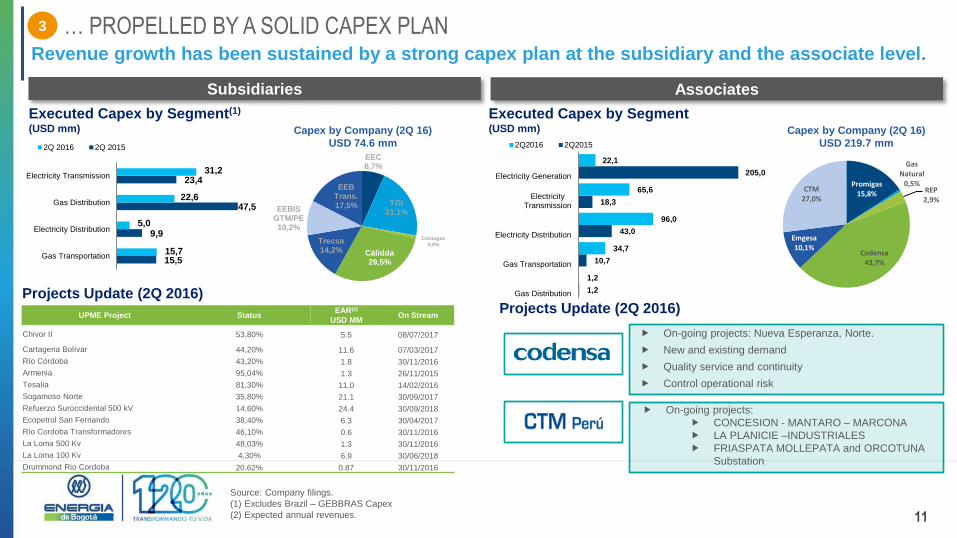
Associates
Source: Company filings.
(1) Excludes Brazil – GEBBRAS Capex
(2) Expected annual revenues.
Executed Capex by Segment(1)
(USD mm)
Executed Capex by Segment (USD mm)
Projects Update (2Q 2016)
UPME Project Status EAR(2)
USD MM On Stream
Chivor II 53,80% 5.5 08/07/2017
Cartagena Bolívar 44,20% 11.6 07/03/2017
Río Córdoba 43,20% 1.8 30/11/2016
Armenia 95,04% 1.3 26/11/2015
Tesalia 81,30% 11.0 14/02/2016
Sogamoso Norte 35,80% 21.1 30/09/2017
Refuerzo Suroccidental 500 kV 14,60% 24.4 30/09/2018
Ecopetrol San Fernando 38,40% 6.3 30/04/2017
Río Cordoba Transformadores 46,10% 0.6 30/11/2016
La Loma 500 Kv 48,03% 1.3 30/11/2016
La Loma 100 Kv 4,30% 6.9 30/06/2018
Drummond Rio Cordoba 20.62% 0.87 30/11/2016
Projects Update (2Q 2016)
On-going projects: Nueva Esperanza, Norte.
New and existing demand
Quality service and continuity
Control operational risk
Subsidiaries
On-going projects:
CONCESION - MANTARO – MARCONA
LA PLANICIE –INDUSTRIALES
FRIASPATA MOLLEPATA and ORCOTUNA
Substation
Capex by Company (2Q 16)
USD 219.7 mm
Capex by Company (2Q 16)
USD 74.6 mm
… PROPELLED BY A SOLID CAPEX PLAN Revenue growth has been sustained by a strong capex plan at the subsidiary and the associate level.
3
Promigas 15,8%
Gas Natural
0,5% REP 2,9%
Codensa 43,7%
Emgesa 10,1%
CTM 27,0%
EEC 6,7%
TGI 21,1%
Contugas
0,8%
Cálidda 29,5%
Trecsa 14,2%
EEBIS GTM/PE 10,2%
EEB Trans. 17,5%
15,5
9,9
47,5
23,4
15,7
5,0
22,6
31,2
Gas Transportation
Electricity Distribution
Gas Distribution
Electricity Transmission
2Q 2016 2Q 2015
-
5.000
10.000
15.000
20.000
25.000
30.000
35.000
0
20
40
60
80
100
120
140
07/2015 08/2015 09/2015 10/2015 11/2015 12/2015 01/2016 02/2016 03/2016 04/2016 05/2016 06/2016
Vo
lum
e (
CO
P m
m)
Pri
ce (
Ind
exe
d 1
00
)
Volume
EEB Equity
Colcap
12
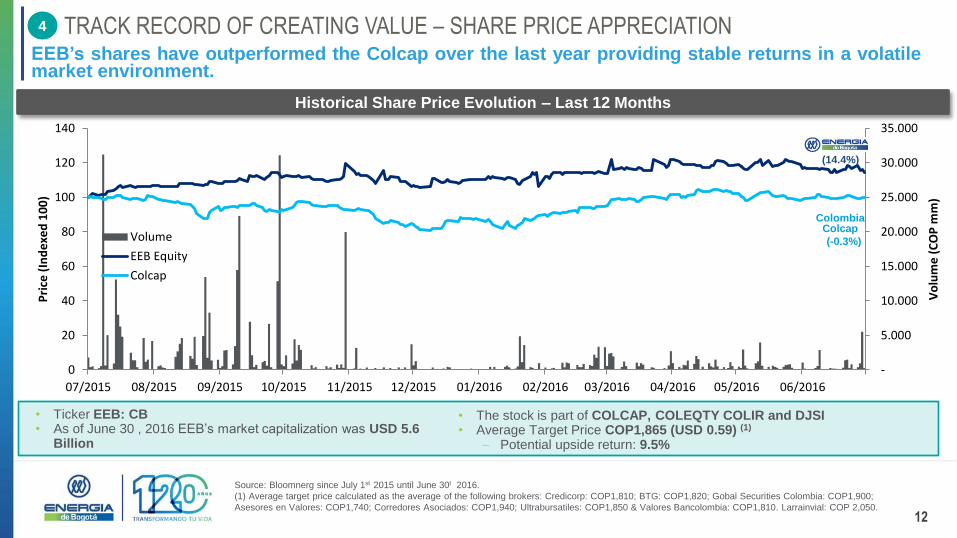
TRACK RECORD OF CREATING VALUE – SHARE PRICE APPRECIATION EEB’s shares have outperformed the Colcap over the last year providing stable returns in a volatile market environment.
4
Historical Share Price Evolution – Last 12 Months
• Ticker EEB: CB • As of June 30 , 2016 EEB’s market capitalization was USD 5.6
Billion
Source: Bloomnerg since July 1st 2015 until June 30t 2016.
(1) Average target price calculated as the average of the following brokers: Credicorp: COP1,810; BTG: COP1,820; Gobal Securities Colombia: COP1,900;
Asesores en Valores: COP1,740; Corredores Asociados: COP1,940; Ultrabursatiles: COP1,850 & Valores Bancolombia: COP1,810. Larrainvial: COP 2,050.
(14.4%)
(-0.3%)
Colombia Colcap
• The stock is part of COLCAP, COLEQTY COLIR and DJSI • Average Target Price COP1,865 (USD 0.59) (1)
Potential upside return: 9.5%
$1.190
$1.745
$1.175 $1.270
$1.535 $1.700 $1.720
$1.476
2,9%
4,7%
3,0% 3,5%
4,2% 7.1%
4,3%
4,2%
$0
$500
$1.000
$1.500
$2.000
0,0%
2,0%
4,0%
6,0%
8,0%
2010 2011 2012 2013 2014 2015 2016 Avg 2010-2015
Closing Share Price at the End of the Previous Year in COP Dividend Yield
$98
$354
$571
$157
$391 $438 $419
$272
$337
$138 $143
$368
$165
$228 $307
$470
$71
$236
141%
40% 64%
105%
58%
70% 112%
26%
77%
$0
$100
$200
$300
$400
$500
$600
0%
50%
100%
150%
2008 2009 2010 2011 2012 2013 2014 2015 Avg 2008-2015Net Profit Dividends Value Dividend Payout + Including Released Reserves
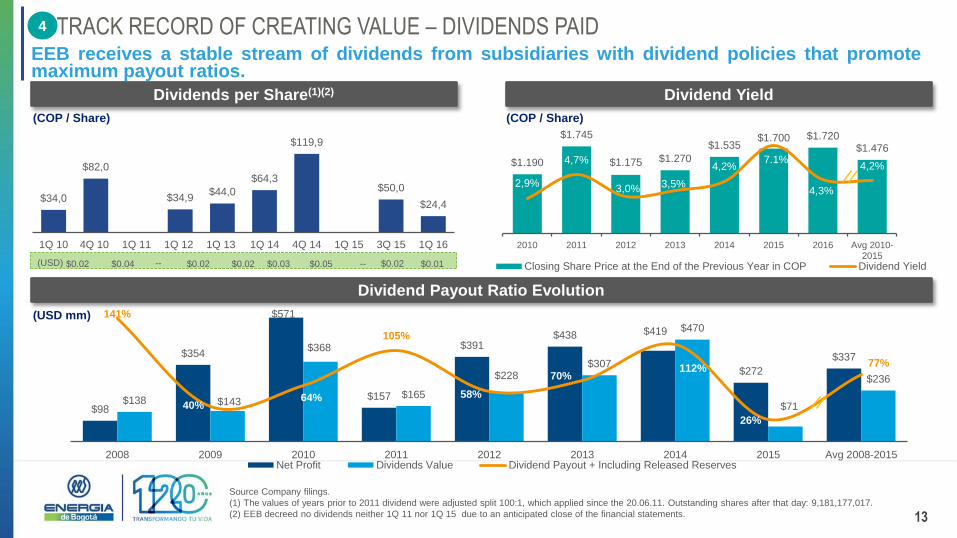
13
TRACK RECORD OF CREATING VALUE – DIVIDENDS PAID EEB receives a stable stream of dividends from subsidiaries with dividend policies that promote maximum payout ratios.
4
(COP / Share)
Source Company filings.
(1) The values of years prior to 2011 dividend were adjusted split 100:1, which applied since the 20.06.11. Outstanding shares after that day: 9,181,177,017.
(2) EEB decreed no dividends neither 1Q 11 nor 1Q 15 due to an anticipated close of the financial statements.
(USD mm)
Dividend Yield Dividends per Share(1)(2)
Dividend Payout Ratio Evolution
(COP / Share)
$34,0
$82,0
$34,9 $44,0
$64,3
$119,9
$50,0
$24,4
1Q 10 4Q 10 1Q 11 1Q 12 1Q 13 1Q 14 4Q 14 1Q 15 3Q 15 1Q 16
$0.04 $0.02 $0.02 $0.03 (USD) $0.02 $0.05 -- -- $0.02 $0.01
14
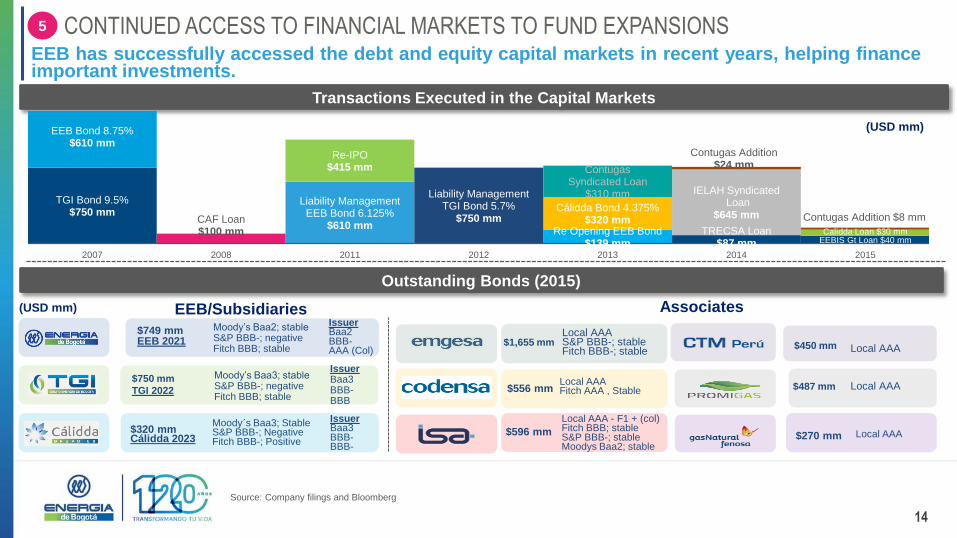
CONTINUED ACCESS TO FINANCIAL MARKETS TO FUND EXPANSIONS EEB has successfully accessed the debt and equity capital markets in recent years, helping finance important investments.
5
Transactions Executed in the Capital Markets
Outstanding Bonds (2015)
Source: Company filings and Bloomberg
(USD mm)
EEB/Subsidiaries Associates Issuer Baa2 BBB- AAA (Col)
Moody’s Baa2; stable S&P BBB-; negative Fitch BBB; stable
$750 mm
TGI 2022
Issuer Baa3 BBB- BBB
Moody´s Baa3; Stable S&P BBB-; Negative Fitch BBB-; Positive
Issuer Baa3 BBB- BBB-
(USD mm)
$749 mm EEB 2021
Moody’s Baa3; stable S&P BBB-; negative Fitch BBB; stable
$320 mm Cálidda 2023
TGI Bond 9.5% $750 mm
Liability Management EEB Bond 6.125%
$610 mm Re Opening EEB Bond
$139 mm TRECSA Loan
$87 mm EEBIS Gt Loan $40 mm
Cálidda Bond 4.375% $320 mm
IELAH Syndicated Loan
$645 mm
Calidda Loan $30 mm
CAF Loan $100 mm
EEB Bond 8.75% $610 mm
Re-IPO $415 mm
Liability Management TGI Bond 5.7%
$750 mm
Contugas Syndicated Loan
$310 mm
Contugas Addition $24 mm
Contugas Addition $8 mm
2007 2008 2011 2012 2013 2014 2015
Local AAA - F1 + (col) Fitch BBB; stable S&P BBB-; stable Moodys Baa2; stable
Local AAA Fitch AAA , Stable
$1,655 mm $450 mm
$487 mm
Local AAA
Local AAA S&P BBB-; stable Fitch BBB-; stable
$556 mm
$596 mm
Local AAA
Local AAA
$270 mm

15
STRONG SHAREHOLDERS AND PARTNERS EEB has strong relationships with its shareholders, including the Government of Bogotá, as well as with its partners (e.g. Endesa, Gas Natural, ISA, Furnas etc)
6
Ownership Structure – June 2016 Key Partners (2015)
2 million clients
4 countries
USD994 mm revenues
61 million clients
40 countries
USD97,266 mm revenues
20 million clients
25 countries
USD32,819 mm revenues
9 countries
USD1,959 mm revenues
12 Brazil States
USD1,519 mm revenues
Bogota D.C. 76,3%
Ecopetrol 0,9%
Corficol 3,6%
AFPs 16,4%
Retail Investors
2,8%

16
INVESTMENTS Highlights
FINANCIAL Highlights
Overview of
MAIN INVESTMENTS
APPENDIX
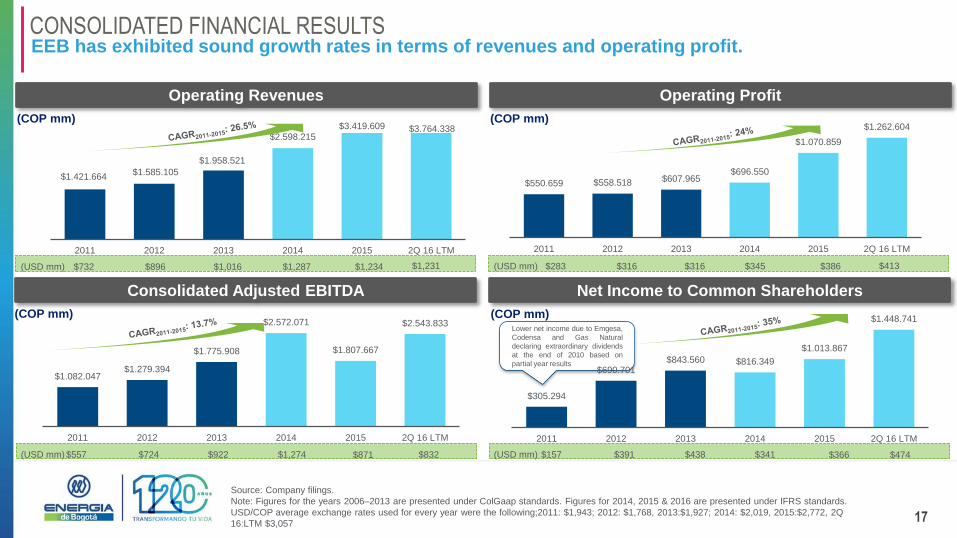
$1.082.047 $1.279.394
$1.775.908
$2.572.071
$1.807.667
$2.543.833
2011 2012 2013 2014 2015 2Q 16 LTM
$1.421.664 $1.585.105
$1.958.521
$2.598.215 $3.419.609 $3.764.338
2011 2012 2013 2014 2015 2Q 16 LTM
Lower net income due to Emgesa,
Codensa and Gas Natural
declaring extraordinary dividends
at the end of 2010 based on
partial year results
17
CONSOLIDATED FINANCIAL RESULTS EEB has exhibited sound growth rates in terms of revenues and operating profit.
Source: Company filings.
Note: Figures for the years 2006–2013 are presented under ColGaap standards. Figures for 2014, 2015 & 2016 are presented under IFRS standards.
USD/COP average exchange rates used for every year were the following;2011: $1,943; 2012: $1,768, 2013:$1,927; 2014: $2,019, 2015:$2,772, 2Q
16:LTM $3,057
Operating Revenues Operating Profit
(COP mm) (COP mm)
Consolidated Adjusted EBITDA Net Income to Common Shareholders
(COP mm) (COP mm)
$283 $316 $316 $345 (USD mm) $386 $732 $896 $1,016 $1,287 $1,234 (USD mm)
$557 $724 $922 $1,274 (USD mm) $832 $871 $157 $391 $438 $341 (USD mm) $474 $366
$1,231 $413
$550.659 $558.518 $607.965 $696.550
$1.070.859
$1.262.604
2011 2012 2013 2014 2015 2Q 16 LTM
$305.294
$690.701 $843.560 $816.349
$1.013.867
$1.448.741
2011 2012 2013 2014 2015 2Q 16 LTM
18
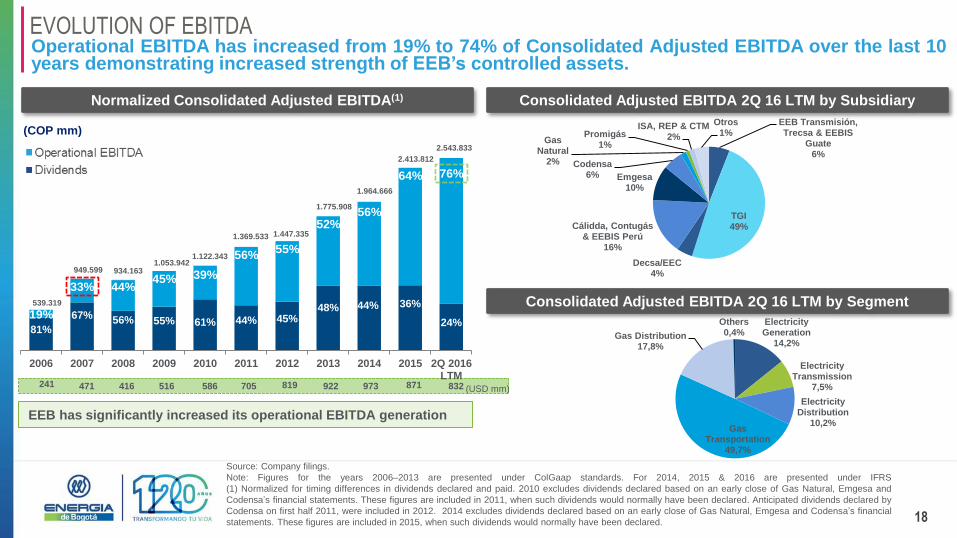
EVOLUTION OF EBITDA Operational EBITDA has increased from 19% to 74% of Consolidated Adjusted EBITDA over the last 10 years demonstrating increased strength of EEB’s controlled assets.
(COP mm)
Source: Company filings.
Note: Figures for the years 2006–2013 are presented under ColGaap standards. For 2014, 2015 & 2016 are presented under IFRS
(1) Normalized for timing differences in dividends declared and paid. 2010 excludes dividends declared based on an early close of Gas Natural, Emgesa and
Codensa’s financial statements. These figures are included in 2011, when such dividends would normally have been declared. Anticipated dividends declared by
Codensa on first half 2011, were included in 2012. 2014 excludes dividends declared based on an early close of Gas Natural, Emgesa and Codensa’s financial
statements. These figures are included in 2015, when such dividends would normally have been declared.
Normalized Consolidated Adjusted EBITDA(1) Consolidated Adjusted EBITDA 2Q 16 LTM by Subsidiary
(USD mm)
Consolidated Adjusted EBITDA 2Q 16 LTM by Segment
EEB has significantly increased its operational EBITDA generation
EEB Transmisión, Trecsa & EEBIS
Guate 6%
TGI 49%
Decsa/EEC 4%
Cálidda, Contugás & EEBIS Perú
16%
Emgesa 10%
Codensa 6%
Gas Natural
2%
Promigás 1%
ISA, REP & CTM 2%
Otros 1%
Electricity Generation
14,2%
Electricity Transmission
7,5%
Electricity Distribution
10,2% Gas
Transportation 49,7%
Gas Distribution 17,8%
Others 0,4%
76% 64%
56% 52%
55% 56%
39% 45% 44% 33%
19% 24%
36% 44% 48% 45% 44% 61% 55% 56% 67%
81%
2.543.833
2.413.812
1.964.666
1.775.908
1.447.335 1.369.533
1.122.343 1.053.942
934.163 949.599
539.319
832 871 973 922 819 705 586 516 416 471 241
2Q 2016LTM
2015201420132012201120102009200820072006

19
FINANCIAL PLAN 2013-2020 Investments and Funding Sources
Source: Company filings.
(1) Mainly concentrated on electricity transmission businesses (COL / Overseas).
(2) 2014 Incliudes M&A transaction IELAH Equity Portion
(3) 2015 Includes M&A transaction Brazil Equity portion
2013 – 2020 Funding Investments EEB Capex Profile – Controlled Companies
(USD mm)
USD mm %
Executed Capex 2013-2015 $1,330 46%
Cash Generation After Dividends 2016-2020 $1,324
Incremental Debt 2016-20 $225
Subtotal 2016-2020(1) $1,549 54%
TOTAL 2013-2019 $2,879
64 80 69
221
398
98
84 74 94
107
178
35 36 29
68
88
60
17 16
202 143
101
47
81
34
30 29
264
55
$386
$597(2)
$347(3)
$443
$745
$192
$83 $86
2013 2014 2015 2016E 2017E 2018E 2019E 2020E
Electricity Colombia Electricity Overseas Natural Gas Colombia
Natural Gas Overseas M&A Natural Gas M&A Electricity

$1.543 $1.737 $1.733
$2.218
$3.009 $2.803 $2.646
3,4% 6,4% 2,9%
2,2%
0,7% 1,2%
3,11%
96,6% 93,6% 97,1%
97,8%
99,3% 98,0%
96,9%
2010 2011 2012 2013 2014 2015 2Q 16
20
DESCRIPTION OF INDEBTEDNESS 2013-2020 Investments and Funding Sources
Net Debt / Consolidated Adjusted EBITDA(1)(2) Consolidated Adjusted EBITDA / Net Interest(1)(2)
Consolidated Debt Composition Debt Maturity Profile(3)
(USD mm) (USD mm)
Source: Company filings.
(1) Covenant associated to this indicator is currently suspended since the bond EEB 2021 has investment grade, granted by two out of three risk rating agencies monitoring the latter. Covenant
established in Offering Memorandum of USD749,000,000 EEB 6.125% Senior Notes due 2021. It includes anticipated dividends.
(2) Increase is mainly explained by increase of foreign exchange (USD/COP movements).
(3) 2019:Syndicated loan acquired by Contugas (USD342 mm) and additional indebtedness incurred by SPV in order to reacquire 31.92% shares of TGI IELAH (USD219 mm outstanding debt)
Debt maturity profile as of 2Q 2016.
COP| PEN USD
2,63x 2,78x 3,20x 3,27x
2,41x
4,50x
2Q 161Q 164Q 153Q 152Q 15
7,55x 8,80x
7,30x
11,12x
15,83x
2,25x
2Q 161Q 164Q 153Q 152Q 15
155,8 149,0
52,6
606,0
14,5
749,5 750,0
320,0
2016 2017 2018 2019 2020 2021 2022 2023
21
INVESTMENTS Highlights
FINANCIAL Highlights
Overview of
MAIN INVESTMENTS
APPENDIX
22
EMGESA COMPANY OVERVIEW EMGESA is one of the largest generators operating in Colombia with 3,459MW of installed capacity and a market share of ~21%, based on total
EMGESA is 51.5% owned by EEB and 48.5% owned by Endesa
Company completed its 400MW “El Quimbo” hydro plant in Huila department in 4Q15
● El Quimbo required a total investment of ~USD1,231 mm with the ability to generate
~2,000 GWh per year
Other projects include 4 hydro plants with a total a installed capacity of ~1,070 MW
which are expected to generate a total of ~5,400 GWh per year
~93% of all energy produced by EMGESA comes from hydro generation facilities
Strong growth in underlying cash flows (EBITDA increasing by a 11.0% CAGR from
2011 – 2014)
Energy Generated (GWh) 13,741
Energy Sales (GWh) 16,886
Installed Capacity (MW) 3,459
Fuel Mix (Based on MW) Hydro – 89% / Thermo – 11%
Contracted Energy Sales(1) 52%
Dispatch Factor 90.8%
Load Factor 51.9%
Company Overview Summary Financials
Key Operational Statistics (2015) Generation Evolution (2015)
(GWh) Lower generation due to lower hydro
generation (-7.2%) caused by low
precipitation in the year
13.741 13.631 12.748
13.294
12.092
20152014201320122011
Summary Income (COP mm) 2012 2013 2014 2015 2Q 16 LTM ´12 - ´15
Revenues $2,144,233 $2,397,428 $2,640,021 $3,268,277 $3,913,471 15.1% % Growth 12.9% 11.8% 10.1% 23.8% 19.7% --
EBITDA $1,380,920 $1,480,177 $1,730,802 $1,725,429 $1,976,799 7.7%
% Growth 9.9% 7.2% 16.9% (0.3%) 14.6% --
% Margin 64.4% 61.7% 65.6% 52.8% 50.5% -- Net Income $783,529 $870,141 $1,015,945 $885,455 $892,642 4.2%
% Growth 17.3% 11.1% 16.8% (12.8%) 0.8% --
% Margin 36.5% 36.3% 38.5% 27.1% 22.8% -- Summary Balance Sheet
Dividends and Reserves Declared to EEB 343,894 405,659 739,668 1,045,672 734,703 44.9% CapEx 646,645 642,787 872,495 752,972 561,182 5.2% Net Debt 1,841,385 2,354,496 3,741,406 3,790,971 4,080,505 27.2% Net Debt / LTM EBITDA 1.3x 1.6x 1.5x 2.2x 2.1x --
Source: Company filings.
(1) Based on 2014 revenues.
15.048 13.667 13.342 12.972 12.424
20152014201320122011
23
CODENSA COMPANY OVERVIEW CODENSA is a leading distribution company in Colombia with a market share of ~23% and approximately 3.2 million customers.
Company Overview Summary Financials
Key Operational Statistics (2015) Energy Sales & Growth
CODENSA is 51.5% owned by EEB and 48.5% owned by Endesa
Serves nearly 3.2(1) million customers as of 2Q 16
Reduced energy losses from over 23% in 1997 to 10.2% in 2003 and 7.2% in 2015, its
lowest level in company history
Demand expected to continue to grow above national GDP during upcoming years
Approved project for an additional 600MW of transformation capacity to meet the
growing demand from the north of Bogota and Cundinamarca
Summary Income (COP mm) 2012 2013 2014 2015 2Q 16 LTM ´12 - ´15
Revenues $3,141,800 $3,212,218 $3,435,157 $3,711,866 $3,946,922 5.7% % Growth 5.2% 2.2% 6.9% 8.1% 6.3% --
EBITDA $1,090,892 $1,108,179 $1,170,377 $1,238,636 $1,318,007 4.3%
% Growth 11.8% 1.6% 5.6% 5.8% 6.4% --
% Margin 34.7% 34.5% 34.1% 33.4% 33.4% -- Net Income $510,993 $535,911 $536,696 $516,935 $416,895 0.4%
% Growth 11.7% 4.9% 0.1% (3.7%) (19.4%) -- % Margin 16.3% 16.7% 15.6% 13.9% 10.6% --
Summary Balance Sheet Dividends and Reserves Declared to EEB 69,624 264,951 463,156 552,744 446,051 99.5%
CapEx 241,801 280,634 373,119 537,343 619,435 30.5% Net Debt 524,517 545,203 587,065 776,801 1,217,942 14.0%
Net Debt / LTM EBITDA 0.5x 0.5x 0.5x 0.6x 0.9x --
Energy Sales (GWh) Residential Other
15,048 33% 67%
Total Customers (‘000s) 2,889
Customer Split: Residential Other
89% 11%
Energy Losses (% of Energy Distributed) 7.2%
(GWh)
Losses
Ratio (%) 7.8% 7.3% 7.0% 7.2% 7.2%
Source: Company filings.
(1) Including EEC Clients
672
647 628
604
560
20152014201320122011
24
TGI COMPANY OVERVIEW TGI is one of the two main natural gas transportation companies operating in Colombia with a ~54% market share based on transported natural gas volumes.
Company Overview Summary Financials(1)
Key Operational Statistics (2015) Contracted Firm Capacity & Availability
EEB holds a 99.9% stake in TGI and consolidates the company for financial reporting
purposes
Largest natural gas transporter in Colombia with ~51% market share
Only natural gas transporter in Colombia connecting main sources of supply (Guajira
and Cusiana) with the main consumption centers
Transports gas through a network of 3,957km of pipeline
~92% of its capacity is contracted, with firm capacity contracts extending to the year
2026, ensuring a stable stream of cash flows
Summary Income (USD mm) 2012 2013 2014 2015 2Q 16 LTM ´12 - ´15
Revenues $391 $465 $468 $439 $449 4.0%
% Growth 15.2% 19.0% 0.6% (6.2%) 2.3% --
EBITDA 293 359 372 361 367 7.2% % Growth 12.4% 22.5% 3.7% (3.0%) 1.6% --
% Margin 75.0% 77.1% 79.5% 82.2% 81.6% --
Net Income 138 70 69 45 101 (31.2%) % Margin 35.3% 15.0% 14.7% 10.2% 22.5% --
Summary Balance Sheet Dividends and Reserves Declared to EEB --- --- --- 140 22 NA CapEx 188 35 36 29 18 (46.3%) Senior Net Debt 717 510 632 612 859 (5.1%) Senior Net Debt / LTM EBITDA 2.4x 1.4x 1.7x 1.7x 2.3x --
Total Nominal Capacity (MMCF/d) 733,8
Contracted Capacity (MMCF/d) 672
Average Volume (MMCF/d) 566
Availability Factor (%) 100%
Annual Load Factor (%) 66.9%
Gas Pipeline Length (Mi) 2,459
(MMCF; %)
Availability (%) 96.1% 82.7% 86% 88.6% 91.6%
Source: Company filings.
(1). TGI’s functional currency is the USD..
25
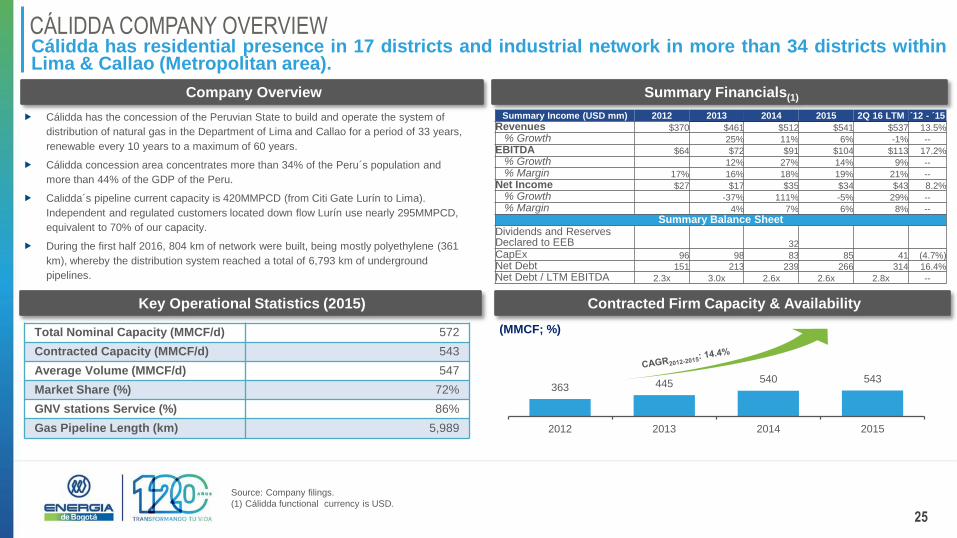
CÁLIDDA COMPANY OVERVIEW Cálidda has residential presence in 17 districts and industrial network in more than 34 districts within Lima & Callao (Metropolitan area).
Company Overview Summary Financials(1)
Key Operational Statistics (2015) Contracted Firm Capacity & Availability
Cálidda has the concession of the Peruvian State to build and operate the system of
distribution of natural gas in the Department of Lima and Callao for a period of 33 years,
renewable every 10 years to a maximum of 60 years.
Cálidda concession area concentrates more than 34% of the Peru´s population and
more than 44% of the GDP of the Peru.
Calidda´s pipeline current capacity is 420MMPCD (from Citi Gate Lurín to Lima).
Independent and regulated customers located down flow Lurín use nearly 295MMPCD,
equivalent to 70% of our capacity.
During the first half 2016, 804 km of network were built, being mostly polyethylene (361
km), whereby the distribution system reached a total of 6,793 km of underground
pipelines.
Total Nominal Capacity (MMCF/d) 572
Contracted Capacity (MMCF/d) 543
Average Volume (MMCF/d) 547
Market Share (%) 72%
GNV stations Service (%) 86%
Gas Pipeline Length (km) 5,989
Source: Company filings.
(1) Cálidda functional currency is USD.
(MMCF; %)
543 540 445 363
2015201420132012
Summary Income (USD mm) 2012 2013 2014 2015 2Q 16 LTM ´12 - ´15
Revenues $370 $461 $512 $541 $537 13.5% % Growth 25% 11% 6% -1% --
EBITDA $64 $72 $91 $104 $113 17.2%
% Growth 12% 27% 14% 9% --
% Margin 17% 16% 18% 19% 21% -- Net Income $27 $17 $35 $34 $43 8.2%
% Growth -37% 111% -5% 29% -- % Margin 4% 7% 6% 8% --
Summary Balance Sheet Dividends and Reserves Declared to EEB 32
CapEx 96 98 83 85 41 (4.7%) Net Debt 151 213 239 266 314 16.4%
Net Debt / LTM EBITDA 2.3x 3.0x 2.6x 2.6x 2.8x --
26
INVESTMENTS Highlights
FINANCIAL Highlights
Overview of
MAIN INVESTMENTS
APPENDIX
27
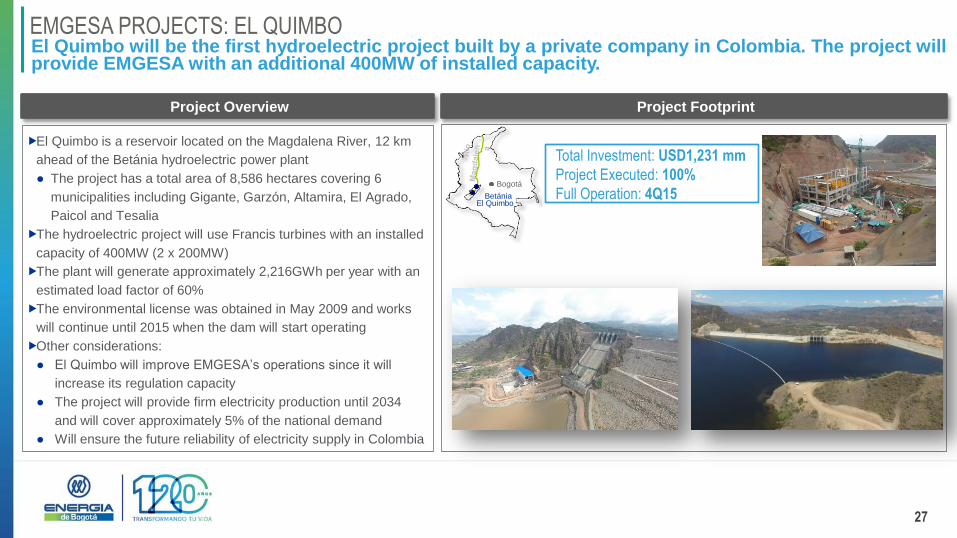
EMGESA PROJECTS: EL QUIMBO El Quimbo will be the first hydroelectric project built by a private company in Colombia. The project will provide EMGESA with an additional 400MW of installed capacity.
Project Overview Project Footprint
El Quimbo is a reservoir located on the Magdalena River, 12 km
ahead of the Betánia hydroelectric power plant
● The project has a total area of 8,586 hectares covering 6
municipalities including Gigante, Garzón, Altamira, El Agrado,
Paicol and Tesalia
The hydroelectric project will use Francis turbines with an installed
capacity of 400MW (2 x 200MW)
The plant will generate approximately 2,216GWh per year with an
estimated load factor of 60%
The environmental license was obtained in May 2009 and works
will continue until 2015 when the dam will start operating
Other considerations:
● El Quimbo will improve EMGESA’s operations since it will
increase its regulation capacity
● The project will provide firm electricity production until 2034
and will cover approximately 5% of the national demand
● Will ensure the future reliability of electricity supply in Colombia
Total Investment: USD1,231 mm
Project Executed: 100%
Full Operation: 4Q15 El Quimbo
Bogotá
Betánia
28
TGI PROJECTS TGI has undertaken an aggressive expansion plan as illustrated by its portfolio of projects.
Project Overview
Increase capacity 20 mmcf/d by upgrading Vasconia, Miraflores, Puente Guillermo compression stations
Project is under execution (72%) with TGI having already signed firm transportation contracts
Operational start-up will occur during 3Q 2016
Total investment is ~USD 31 mm
Cusiana
Phase III
Increase the pipeline’s transportation capacity of Cusiana – Apiay in 32 Mmcfd and the stretch Apiay – Ocoa in 7 Mmcfd
The project will allow supplying the natural gas demand of clients to thermal generation, residential distribution and industrial consumption
Total investment is ~USD48 mm
Project is under execution (22%) Expected operation is expected for the 4Q 2017
Increase capacity 2.2 Mcfd of Armenia –Zarzal line through the construction of a 37.5 km 8” loop parallel to exiting 6” pipeline.
Project is under execution (28.9%) with TGI having already signed firm transportation contracts
Total investment is ~USD18 mm
Expected start of operations in 4Q 2017
Cusiana
Apiay Ocoa
Armenia
Loop
Increase capacity in Cusiana system:i) Cusiana – Vasconia: 43 mmcf/d with 49.6 km of loops (24”); ii) Puente Guillermo – Vasconia: 17
mmcf/d by upgrading Puente Guillermo compression station
Clients already has signed firm transportation contracts:i) Puente Guillermo – Vasconia: 17 mmcf/d; ii) Cusiana – Vasconia : 30 mmcfd ; iii)
For the remaining 13 mmcfd Cusiana – Vasconia there are also clients interested in signing LT contracts
Total investment is ~USD78 mm ; Expected Completion: i) Puente Guillermo – Vasconia 3Q 2017; ii)Cusiana - Vasconia 4Q 2018
Cusiana
Phase IV
10 tranches of TGI´s system end their regulatory life. With the regulatory framework and the analysis of the infrastructure, TGI has decided
to replace four tranches and to continue operating the other six .
Total investment is ~USD49 mm, ~$ 17mm CAPEX (replacement); ~$ 32 mm CAPEX maintenance
Regulatory
compliance life:
First Request
29
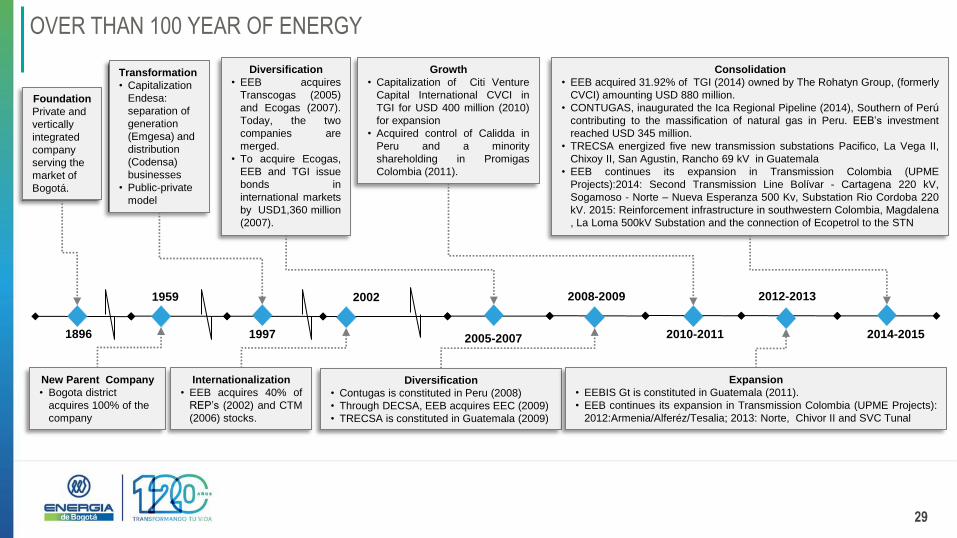
OVER THAN 100 YEAR OF ENERGY
1896
1959
1997
2002
2005-2007
2008-2009
2010-2011
2012-2013
2014-2015
Foundation
Private and
vertically
integrated
company
serving the
market of
Bogotá.
New Parent Company
• Bogota district
acquires 100% of the
company
Transformation
• Capitalization
Endesa:
separation of
generation
(Emgesa) and
distribution
(Codensa)
businesses
• Public-private
model
Internationalization
• EEB acquires 40% of
REP’s (2002) and CTM
(2006) stocks.
Diversification
• EEB acquires
Transcogas (2005)
and Ecogas (2007).
Today, the two
companies are
merged.
• To acquire Ecogas,
EEB and TGI issue
bonds in
international markets
by USD1,360 million
(2007).
Diversification
• Contugas is constituted in Peru (2008)
• Through DECSA, EEB acquires EEC (2009)
• TRECSA is constituted in Guatemala (2009)
Growth
• Capitalization of Citi Venture
Capital International CVCI in
TGI for USD 400 million (2010)
for expansion
• Acquired control of Calidda in
Peru and a minority
shareholding in Promigas
Colombia (2011).
Expansion
• EEBIS Gt is constituted in Guatemala (2011).
• EEB continues its expansion in Transmission Colombia (UPME Projects):
2012:Armenia/Alferéz/Tesalia; 2013: Norte, Chivor II and SVC Tunal
Consolidation
• EEB acquired 31.92% of TGI (2014) owned by The Rohatyn Group, (formerly
CVCI) amounting USD 880 million.
• CONTUGAS, inaugurated the Ica Regional Pipeline (2014), Southern of Perú
contributing to the massification of natural gas in Peru. EEB’s investment
reached USD 345 million.
• TRECSA energized five new transmission substations Pacifico, La Vega II,
Chixoy II, San Agustin, Rancho 69 kV in Guatemala
• EEB continues its expansion in Transmission Colombia (UPME
Projects):2014: Second Transmission Line Bolívar - Cartagena 220 kV,
Sogamoso - Norte – Nueva Esperanza 500 Kv, Substation Rio Cordoba 220
kV. 2015: Reinforcement infrastructure in southwestern Colombia, Magdalena
, La Loma 500kV Substation and the connection of Ecopetrol to the STN
30
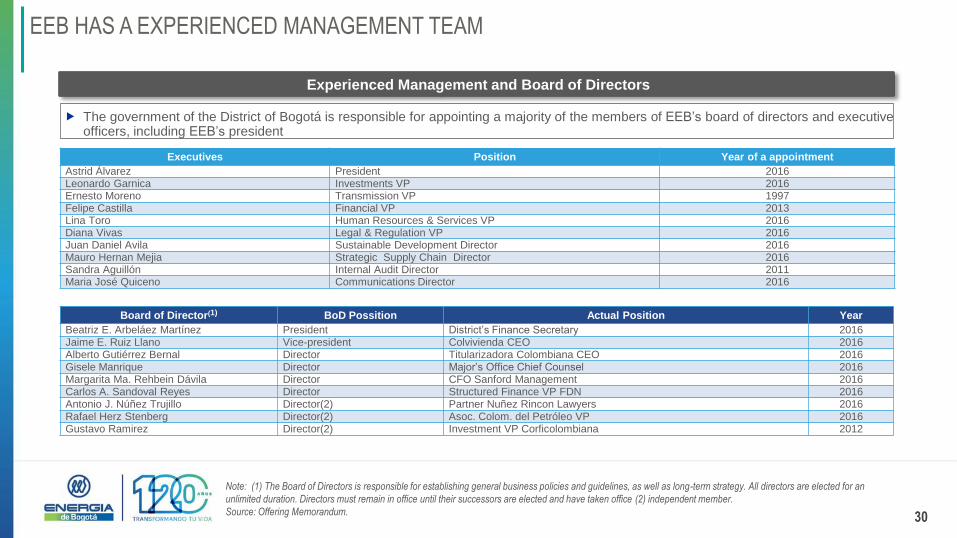
EEB HAS A EXPERIENCED MANAGEMENT TEAM
Experienced Management and Board of Directors
The government of the District of Bogotá is responsible for appointing a majority of the members of EEB’s board of directors and executive officers, including EEB’s president
Note: (1) The Board of Directors is responsible for establishing general business policies and guidelines, as well as long-term strategy. All directors are elected for an
unlimited duration. Directors must remain in office until their successors are elected and have taken office (2) independent member.
Source: Offering Memorandum.
Executives Position Year of a appointment
Astrid Álvarez President 2016 Leonardo Garnica Investments VP 2016 Ernesto Moreno Transmission VP 1997 Felipe Castilla Financial VP 2013 Lina Toro Human Resources & Services VP 2016 Diana Vivas Legal & Regulation VP 2016 Juan Daniel Avila Sustainable Development Director 2016 Mauro Hernan Mejia Strategic Supply Chain Director 2016 Sandra Aguillón Internal Audit Director 2011 Maria José Quiceno Communications Director 2016
Board of Director(1) BoD Possition Actual Position Year
Beatriz E. Arbeláez Martínez President District’s Finance Secretary 2016 Jaime E. Ruiz Llano Vice-president Colvivienda CEO 2016 Alberto Gutiérrez Bernal Director Titularizadora Colombiana CEO 2016 Gisele Manrique Director Major’s Office Chief Counsel 2016 Margarita Ma. Rehbein Dávila Director CFO Sanford Management 2016 Carlos A. Sandoval Reyes Director Structured Finance VP FDN 2016 Antonio J. Núñez Trujillo Director(2) Partner Nuñez Rincon Lawyers 2016 Rafael Herz Stenberg Director(2) Asoc. Colom. del Petróleo VP 2016 Gustavo Ramirez Director(2) Investment VP Corficolombiana 2012
31
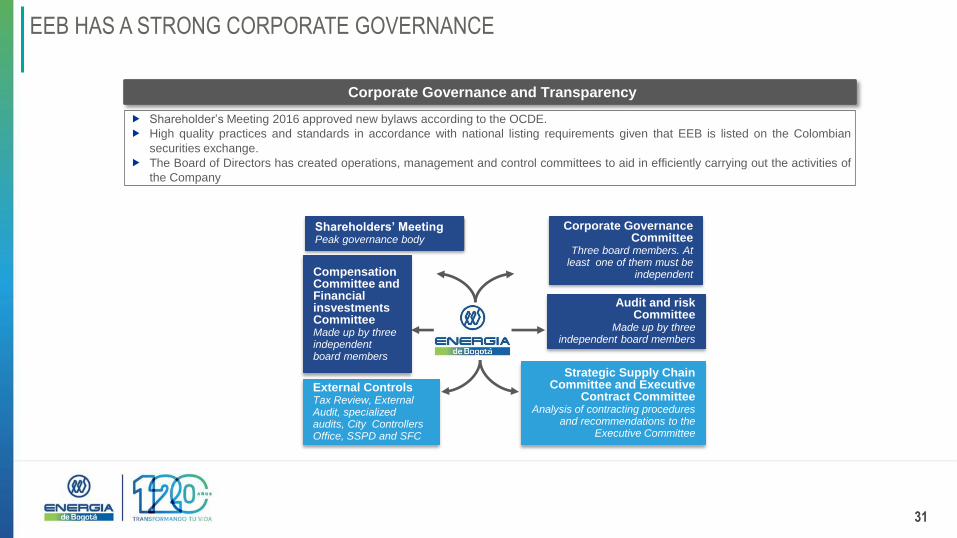
EEB HAS A STRONG CORPORATE GOVERNANCE
Corporate Governance and Transparency
Shareholder’s Meeting 2016 approved new bylaws according to the OCDE.
High quality practices and standards in accordance with national listing requirements given that EEB is listed on the Colombian
securities exchange.
The Board of Directors has created operations, management and control committees to aid in efficiently carrying out the activities of
the Company
Shareholders’ Meeting Peak governance body
Compensation Committee and Financial insvestments Committee Made up by three independent board members
External Controls Tax Review, External Audit, specialized audits, City Controllers Office, SSPD and SFC
Strategic Supply Chain Committee and Executive
Contract Committee Analysis of contracting procedures
and recommendations to the Executive Committee
Audit and risk Committee
Made up by three independent board members
Corporate Governance Committee
Three board members. At least one of them must be
independent
32
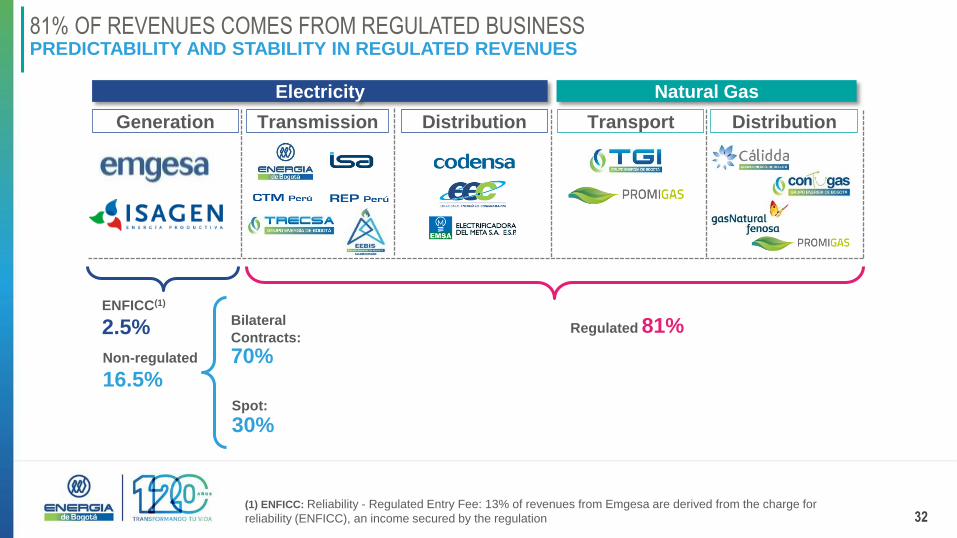
81% OF REVENUES COMES FROM REGULATED BUSINESS PREDICTABILITY AND STABILITY IN REGULATED REVENUES
Transmission Distribution Distribution
Electricity
Transport
Natural Gas
Generation
(1) ENFICC: Reliability - Regulated Entry Fee: 13% of revenues from Emgesa are derived from the charge for
reliability (ENFICC), an income secured by the regulation
Non-regulated
16.5%
ENFICC(1)
2.5% Regulated 81% Bilateral
Contracts:
70%
Spot:
30%
33
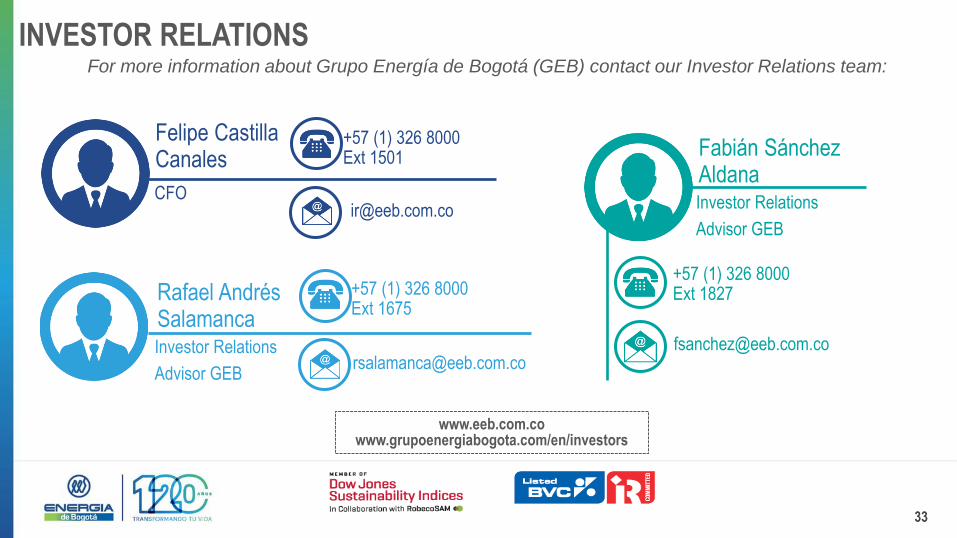
INVESTOR RELATIONS For more information about Grupo Energía de Bogotá (GEB) contact our Investor Relations team:
Felipe Castilla Canales
CFO
www.eeb.com.co www.grupoenergiabogota.com/en/investors
+57 (1) 326 8000 Ext 1501 Fabián Sánchez
Aldana Investor Relations
Advisor GEB
+57 (1) 326 8000 Ext 1827
Rafael Andrés Salamanca Investor Relations
Advisor GEB
+57 (1) 326 8000 Ext 1675