eec 216 lecture #10: power sources
TRANSCRIPT

EEC 216 Lecture #10:Power Sources
Rajeevan AmirtharajahUniversity of California, Davis

R. Amirtharajah, EEC216 Winter 2008 2
Outline
• Announcements• Review: Adiabatic Charging and Energy Recovery• Lecture 9: Dynamic Energy Recovery Logic• Lecture 9: Power and Clock Waveform
Generation• Power Supplies• Batteries and Battery Modeling• Fuel Cells• Power MEMS• Next Time: Energy Harvesting

R. Amirtharajah, EEC216 Winter 2008 3
Announcements
• Design Project 2 due Monday, March 3, at 5 PM in instructor’s office
• Final project proposals also due Monday– Email a brief description (1 paragraph) of what you
plan to evaluate for the final project
– Attach a paper or papers from the literature that describes the circuit/technology/etc. which is the focus of the project

R. Amirtharajah, EEC216 Winter 2008 4
Outline
• Announcements• Review: Adiabatic Charging and Energy Recovery• Lecture 9: Dynamic Energy Recovery Logic• Lecture 9: Power and Clock Waveform
Generation• Power Supplies• Batteries and Battery Modeling• Fuel Cells• Power MEMS• Next Time: Energy Harvesting

R. Amirtharajah, EEC216 Winter 2008 5
Adiabatic Charging Analysis
cc V
dtdVRC +⎟
⎠⎞
⎜⎝⎛=Φ
LC
R
)(tΦ
• Solve differential equation assuming input is voltage ramp with duration T
)(tVc
R. Amirtharajah, EEC216 Winter 2008 6
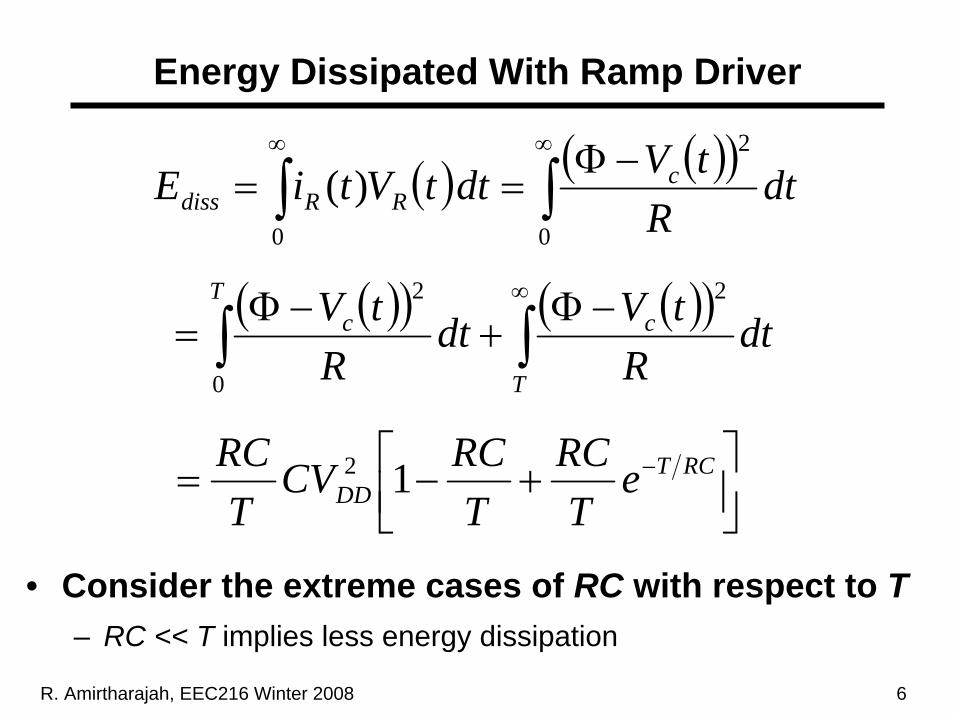
Energy Dissipated With Ramp Driver
• Consider the extreme cases of RC with respect to T– RC << T implies less energy dissipation
( ) ( )( ) dtR
tVdttVtiE cRRdiss ∫∫
∞∞ −Φ==
0
2
0
)(
⎥⎦⎤
⎢⎣⎡ +−= − RCT
DD eT
RCT
RCCVT
RC 12
( )( ) ( )( ) dtR
tVdtR
tV
T
cT
c ∫∫∞ −Φ
+−Φ
=2
0
2
R. Amirtharajah, EEC216 Winter 2008 7
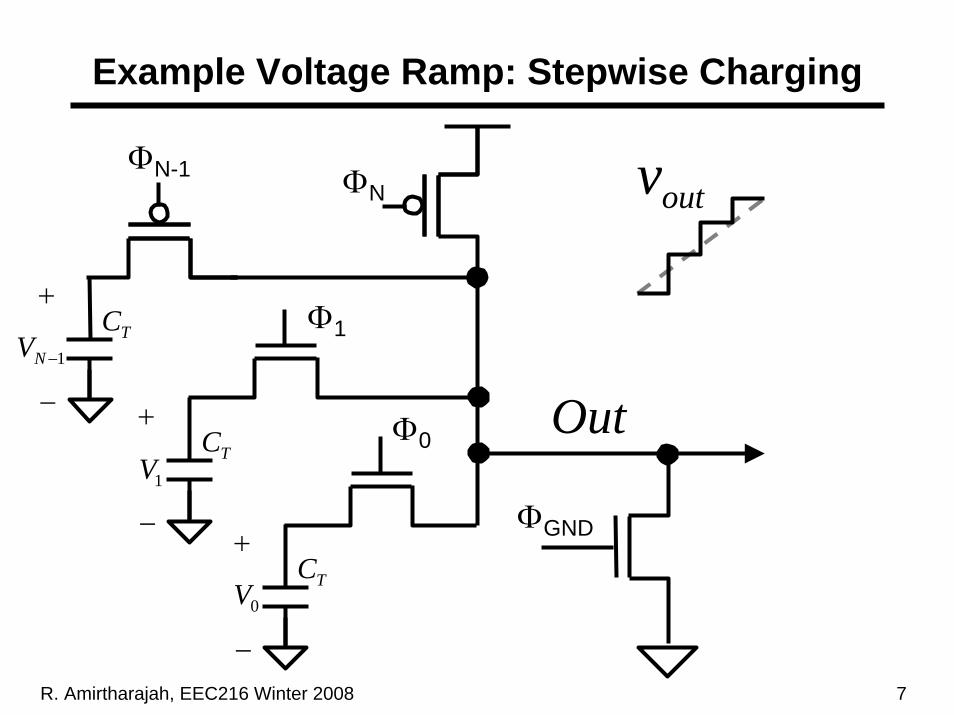
Example Voltage Ramp: Stepwise Charging
TC+
−
1−NV
TC+
−
1V
TC+
−
0V
ΦNΦN-1
Φ1
Φ0
ΦGND
Out
outv

R. Amirtharajah, EEC216 Winter 2008 8
Next Stage Controlled Energy Recovery
0y
0Φ
1y
1Φ
xP0
P0
P1
P1
0F 1F
11−F
1Φ

R. Amirtharajah, EEC216 Winter 2008 9
Cascaded Logic Energy Recovery Timing
• Charge nth stage nodes and then discharge (n-1)th stage nodes
• How do we implement the energy recovery phase?
0y
0Φ
1y
1Φ

R. Amirtharajah, EEC216 Winter 2008 10
Energy Recovery System Block Diagram
• Use circuits to generate power / clock waveforms• Generators must use as little power as possible
– Resonant RLC circuits often used in these applications
– Minimize parasitic losses in power / clock generator
DCAC
CLOCK / POWERDRIVER
ENERGY RECOVERY
LOGIC
NΦΦ K0DDV
R. Amirtharajah, EEC216 Winter 2008 11
Outline
• Announcements• Review: Adiabatic Charging and Energy Recovery• Lecture 9: Dynamic Energy Recovery Logic• Lecture 9: Power and Clock Waveform
Generation• Power Supplies• Batteries and Battery Modeling• Fuel Cells• Power MEMS• Next Time: Energy Harvesting

R. Amirtharajah, EEC216 Winter 2008 12
Outline
• Announcements• Review: Adiabatic Charging and Energy Recovery• Lecture 9: Dynamic Energy Recovery Logic• Lecture 9: Power and Clock Waveform
Generation• Power Supplies• Batteries and Battery Modeling• Fuel Cells• Power MEMS• Next Time: Energy Harvesting

R. Amirtharajah, EEC216 Winter 2008 13
Why worry about power? Power Dissipation
P6Pentium ®
486386
2868086
808580808008
4004
0.1
1
10
100
1971 1974 1978 1985 1992 2000Year
Pow
er (W
atts
)Lead microprocessors power continues to increaseLead microprocessors power continues to increase
Power delivery and dissipation will be prohibitivePower delivery and dissipation will be prohibitiveSource: Borkar, De Intel®
R. Amirtharajah, EEC216 Winter 2008 14
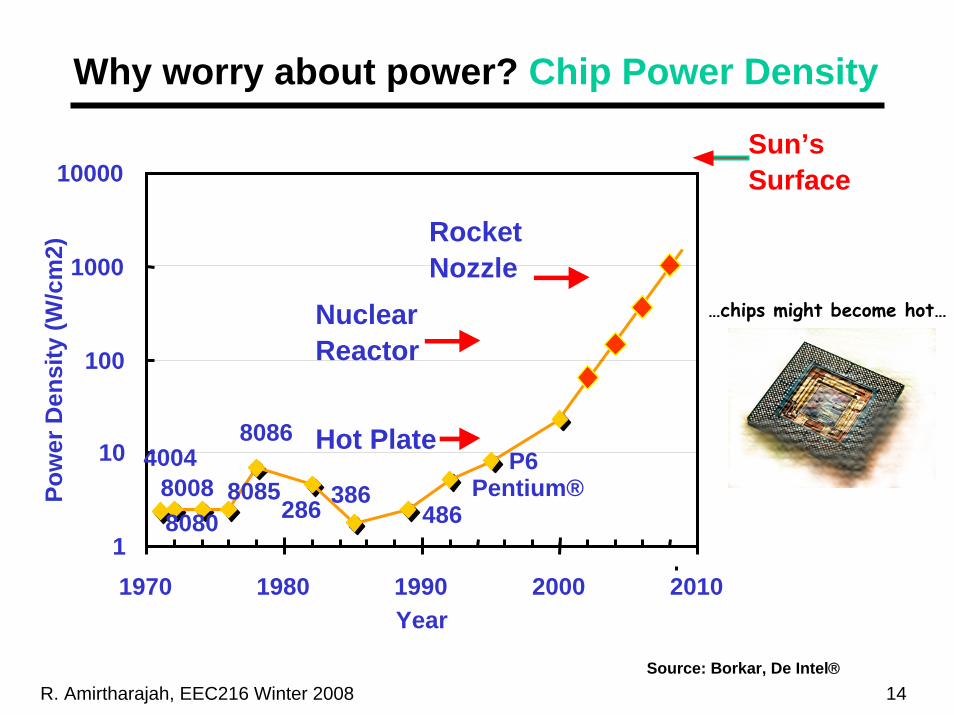
Why worry about power? Chip Power Density
400480088080
8085
8086
286 386486
Pentium®P6
1
10
100
1000
10000
1970 1980 1990 2000 2010Year
Pow
er D
ensi
ty (W
/cm
2)
Hot Plate
NuclearReactor
RocketNozzle
Sun’sSurface
…chips might become hot…
Source: Borkar, De Intel®

R. Amirtharajah, EEC216 Winter 2008 15
State-of-the-Art Processor Power
• Reported at ISSCC 2008– Sun Chip Multithreading SPARC: 65 nm CMOS, 2.3
GHz at 1.2 V, 250 W– Intel Quad Core Itanium: 65nm CMOS, 2.0 GHz, 170 W
• Careful design still keeping power below 100 W– Montecito ISSCC 2005 (dual-core Itanium): 300 W
down to 100 W

R. Amirtharajah, EEC216 Winter 2008 16
Previous Processor Power
• Reported at ISSCC 2004– IBM POWER5: 130 nm SOI, 1.5 GHz at 1.3 V,
incorporates 24 digital temperature sensors distributed over die for hot-spot throttling
– Sun UltraSPARC: 130 nm CMOS, 1.2 GHz at 1.3 V, 23 W typical dissipation
– IBM PowerPC 970: 130 nm SOI, 1.8 GHz at 1.45 V, 57 W typical dissipation
– IBM PowerPC 970+: 90 nm SOI, 2.5 GHz at 1.3 V, 49 W typical dissipation

R. Amirtharajah, EEC216 Winter 2008 17
Intel D865GVHZ Motherboard Example
• Minimum load assumes no applications running and no current draw from USB ports or PCI cards
• Maximum load assumes heavy gaming application and 500 mA drawn from each USB port, but no PCI add-in cards
• Specs for board power delivery system, not specific processor-memory configuration
• From Intel Desktop Board Technical Product Specification, Nov. 2003, p. 78

R. Amirtharajah, EEC216 Winter 2008 18
PC Power Supply Design• Multiple output voltages each with different
current (power) specs– Supports legacy chip i/o standards, displays, disk
drives, speakers, peripherals, modems, etc.– Processor supply voltages generated independently of
silver box (allows separate optimization, variable voltage design, supports last minute system configuration)
• System power variable with workload– 1.5X difference between minimum and maximum power– Variability impacts power electronics design (load
regulation of output voltage)• Always minimize cost!
R. Amirtharajah, EEC216 Winter 2008 19
Outline
• Announcements• Review: Adiabatic Charging and Energy Recovery• Lecture 9: Dynamic Energy Recovery Logic• Lecture 9: Power and Clock Waveform
Generation• Power Supplies• Batteries and Battery Modeling• Fuel Cells• Power MEMS• Next Time: Energy Harvesting

R. Amirtharajah, EEC216 Winter 2008 20
Power Sources for Portable Applications• Portable electronics drives need for low weight,
small volume, stored energy sources– Want high specific energy or energy per unit mass
(Joules / kg)– Maximize energy density or energy per unit volume
(Joules / cm3)– Must meet peak output power demands
• Several stored energy options– Electrochemical cells (batteries) with various
chemistries– Fuel cells possible alternative– Power MEMS which also rely on storing energy
chemically and then converting it to electricity
R. Amirtharajah, EEC216 Winter 2008 21
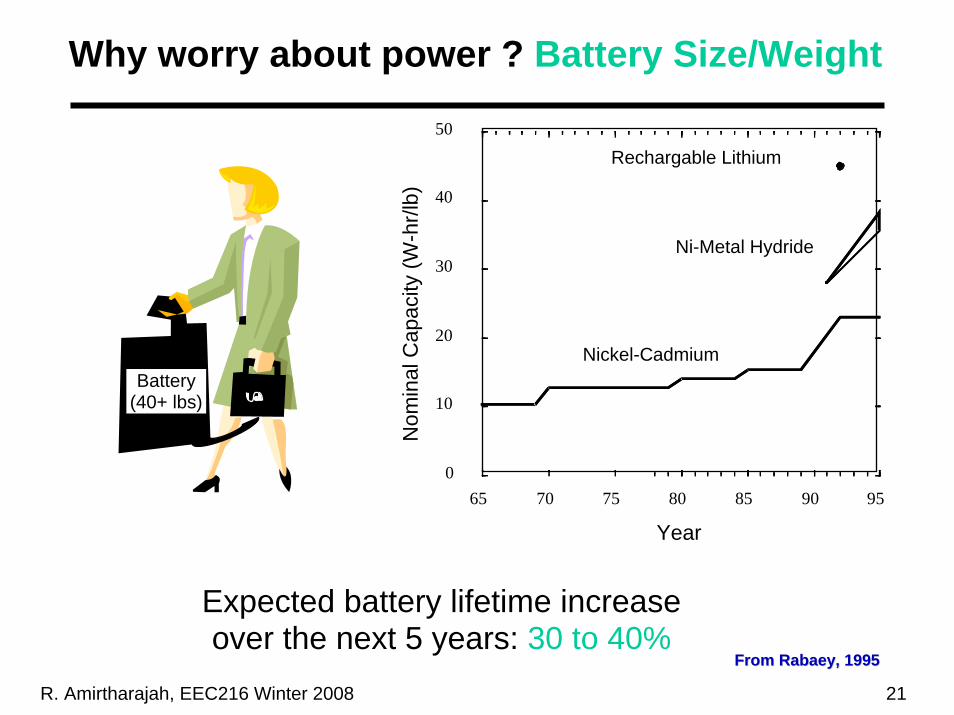
Why worry about power ? Battery Size/Weight
Expected battery lifetime increase over the next 5 years: 30 to 40%
From From RabaeyRabaey, 1995, 1995
65 70 75 80 85 90 95 0
10
20
30
40
50
Rechargable Lithium
Year
Nickel-Cadmium
Ni-Metal Hydride
Nom
inal
Cap
acity
(W-h
r/lb)
Battery(40+ lbs)
R. Amirtharajah, EEC216 Winter 2008 22
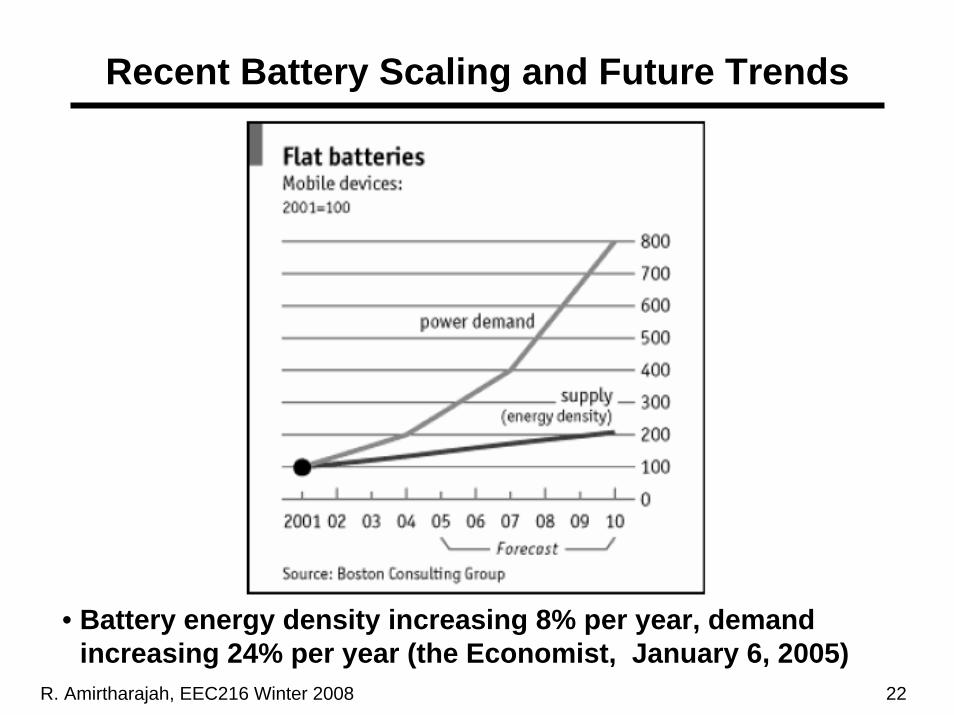
Recent Battery Scaling and Future Trends
• Battery energy density increasing 8% per year, demand increasing 24% per year (the Economist, January 6, 2005)

R. Amirtharajah, EEC216 Winter 2008 23
Battery Basics
• Battery consists of several electrochemical cells– Can be arranged in series (increase output voltage) or
parallel (increase output current) or combination– Each cell consists of two terminals (anode and cathode)
separated by electrolyte– These constitute cell’s active materials
• When cell connected to load, oxidation-reduction reaction occurs– Electrons transferred from anode to cathode– Transfer converts chemical energy stored in active
material to electrical energy– Flows as current through external load
R. Amirtharajah, EEC216 Winter 2008 24
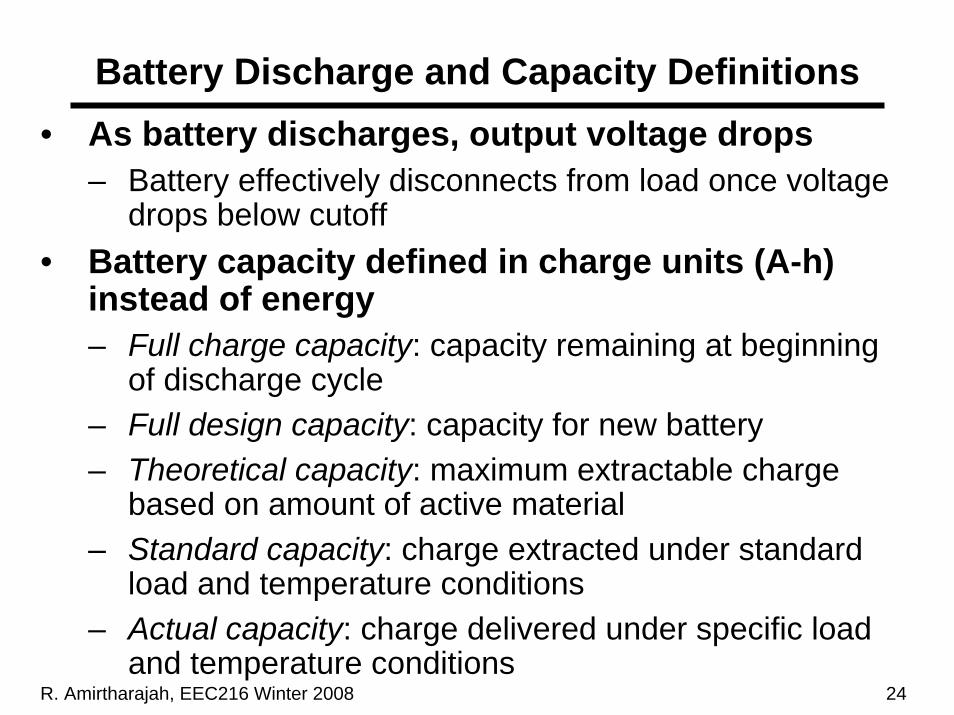
Battery Discharge and Capacity Definitions• As battery discharges, output voltage drops
– Battery effectively disconnects from load once voltage drops below cutoff
• Battery capacity defined in charge units (A-h) instead of energy– Full charge capacity: capacity remaining at beginning
of discharge cycle– Full design capacity: capacity for new battery– Theoretical capacity: maximum extractable charge
based on amount of active material– Standard capacity: charge extracted under standard
load and temperature conditions– Actual capacity: charge delivered under specific load
and temperature conditions

R. Amirtharajah, EEC216 Winter 2008 25
Rate Dependent Capacity• Battery capacity decreases as discharge rate
increases– When fully charged, electrode surface has maximum
concentration of active species– Under loading, active species consumed by reaction at
electrode and replenished by diffusion from electrolyte bulk– Diffusion cannot keep pace with electrochemical reaction, so
concentration gradient builds up in electrolyte– As load increases, active species concentration at electrode
drops below threshold (corresponding to cutoff voltage) and reaction cannot be sustained, eliminating current flow
– Eventually cell recovers (charge recovery) as diffusion flattens concentration gradient
• For sufficiently low discharge rates, operation remains close to ideal

R. Amirtharajah, EEC216 Winter 2008 26
Rate Dependent Capacity Operation
• Rao et al., Computer, Dec. 03

R. Amirtharajah, EEC216 Winter 2008 27
Lithium-Ion Rate Dependent Capacity
• Rao et al., Computer, Dec. 03
R. Amirtharajah, EEC216 Winter 2008 28
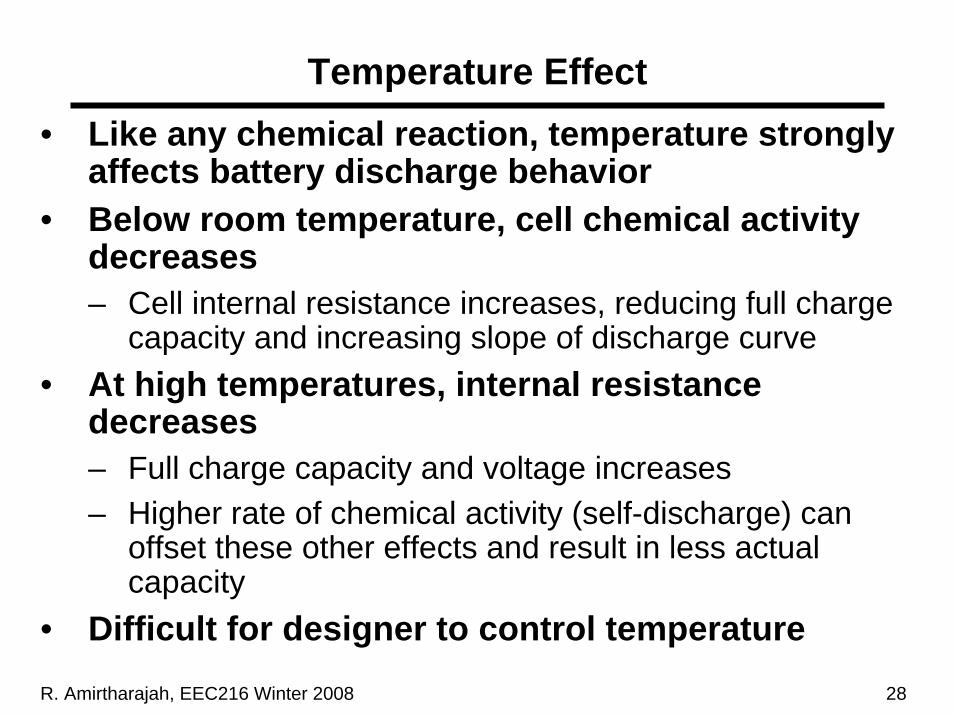
Temperature Effect• Like any chemical reaction, temperature strongly
affects battery discharge behavior• Below room temperature, cell chemical activity
decreases– Cell internal resistance increases, reducing full charge
capacity and increasing slope of discharge curve• At high temperatures, internal resistance
decreases– Full charge capacity and voltage increases– Higher rate of chemical activity (self-discharge) can
offset these other effects and result in less actual capacity
• Difficult for designer to control temperature

R. Amirtharajah, EEC216 Winter 2008 29
Lithium-Ion Temperature Effect
• Rao et al., Computer, Dec. 03

R. Amirtharajah, EEC216 Winter 2008 30
Capacity Fading
• Lithium-ion popular choice for portables– High energy density and capacity
• Li-ion batteries lose fraction of capacity with each charge-discharge cycle– Unwanted side reactions (electrolyte decomposition,
active material dissolution, passive film formation)– Irreversible side reactions increase internal cell
resistance until battery fails– Limit effect by controlling depth of discharge before
recharging (constrain battery to only shallow discharges leaving voltage relatively high for recharge)
– Shallow discharge typically allows battery to undergo more cycles until cutoff voltage finally reached

R. Amirtharajah, EEC216 Winter 2008 31
Lithium-Ion Capacity Fading
• Rao et al., Computer, Dec. 03
R. Amirtharajah, EEC216 Winter 2008 32
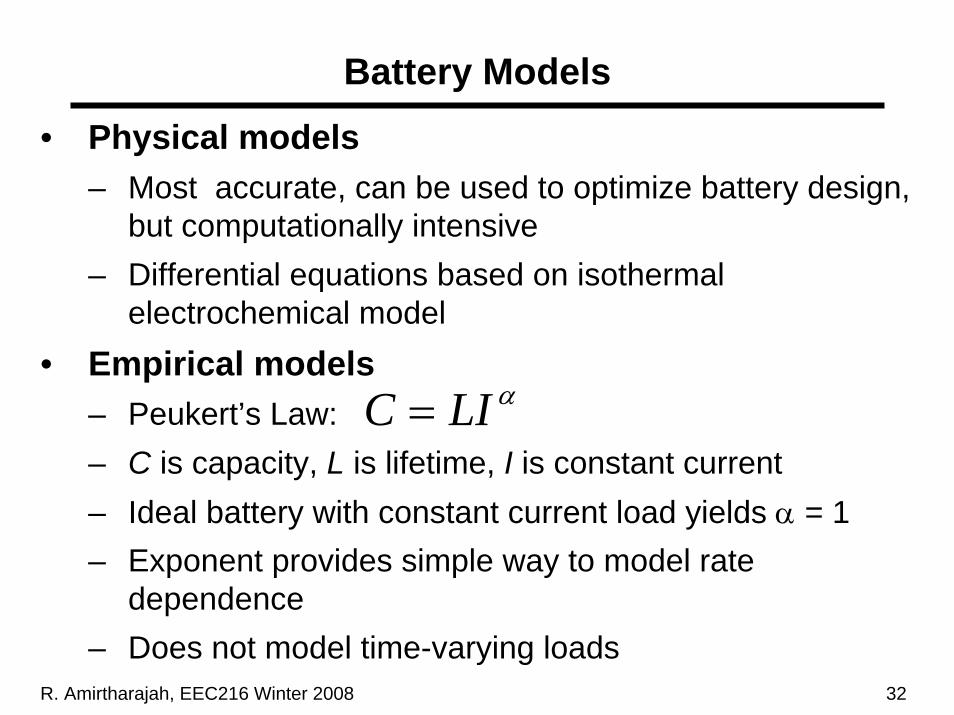
Battery Models
• Physical models– Most accurate, can be used to optimize battery design,
but computationally intensive– Differential equations based on isothermal
electrochemical model • Empirical models
– Peukert’s Law: – C is capacity, L is lifetime, I is constant current– Ideal battery with constant current load yields α = 1– Exponent provides simple way to model rate
dependence– Does not model time-varying loads
αLIC =

R. Amirtharajah, EEC216 Winter 2008 33
Battery Models (cont.)
• Electrical circuit models– Attempt to provide equivalent circuit model for battery– Model using linear passive elements, voltage sources,
and lookup tables– Compatible with HSPICE, Verilog / VHDL
• Add circuit complexity to capture all effects– Model capacity fading with capacitor whose value
decreases linearly with number of charge-discharge cycles
– Temperature effect modeled as RC circuit with temperature-dependent voltage sources
• Discrete-time (state) model in VHDL

R. Amirtharajah, EEC216 Winter 2008 34
Battery Electrical Circuit Models
• Rao et al., Computer, Dec. 03

R. Amirtharajah, EEC216 Winter 2008 35
Outline
• Announcements• Review: Adiabatic Charging and Energy Recovery• Lecture 9: Dynamic Energy Recovery Logic• Lecture 9: Power and Clock Waveform
Generation• Power Supplies• Batteries and Battery Modeling• Fuel Cells• Power MEMS• Next Time: Energy Harvesting
R. Amirtharajah, EEC216 Winter 2008 36
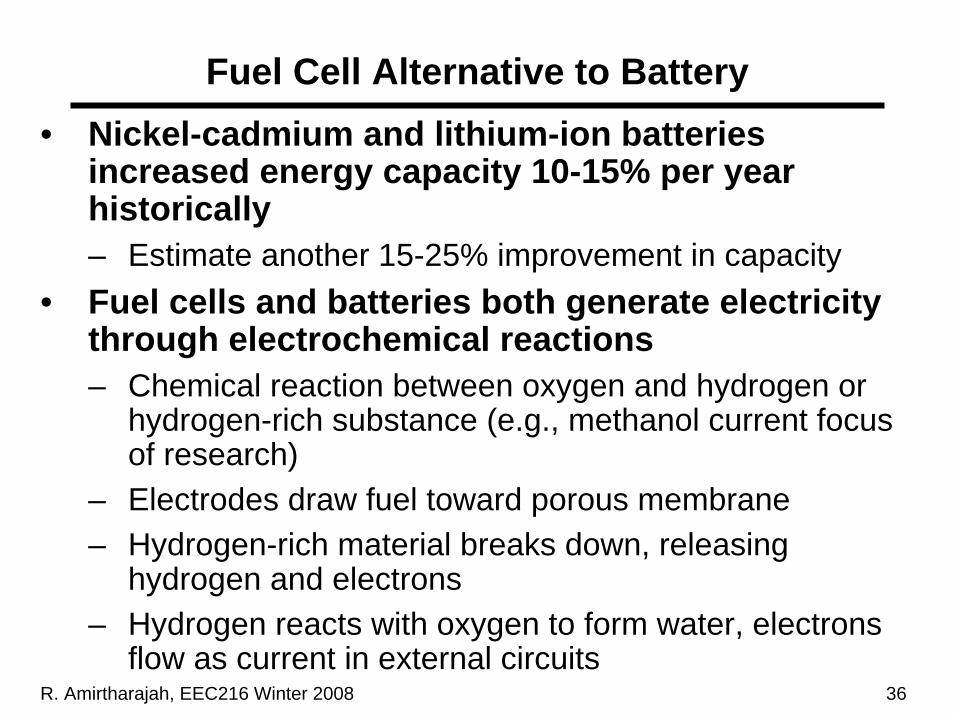
Fuel Cell Alternative to Battery• Nickel-cadmium and lithium-ion batteries
increased energy capacity 10-15% per year historically– Estimate another 15-25% improvement in capacity
• Fuel cells and batteries both generate electricity through electrochemical reactions– Chemical reaction between oxygen and hydrogen or
hydrogen-rich substance (e.g., methanol current focus of research)
– Electrodes draw fuel toward porous membrane– Hydrogen-rich material breaks down, releasing
hydrogen and electrons– Hydrogen reacts with oxygen to form water, electrons
flow as current in external circuits

R. Amirtharajah, EEC216 Winter 2008 37
Fuel Cells for Portable Applications• Users can add more fuel to continue operation• Research on micro fuel cells focused on
membrane– Proton-exchange membrane (PEM) traditional material
but usually too large to be portable– Stacks of porous silicon wafers dramatically increases
number of generated electrons (proportional to membrane surface area)
– Other research ongoing on membranes• Still being investigated as a practical battery
alternative– Challenges include standardization, cost, fuel
flammability– May reach significant market in next 1-2 years
R. Amirtharajah, EEC216 Winter 2008 38
Outline
• Announcements• Review: Adiabatic Charging and Energy Recovery• Lecture 9: Dynamic Energy Recovery Logic• Lecture 9: Power and Clock Waveform
Generation• Power Supplies• Batteries and Battery Modeling• Fuel Cells• Power MEMS• Next Time: Energy Harvesting

R. Amirtharajah, EEC216 Winter 2008 39
Power MEMS Motivation
• Schmidt, ISSCC 03

R. Amirtharajah, EEC216 Winter 2008 40
Power Generation MEMS Options
• Schmidt, ISSCC 03
R. Amirtharajah, EEC216 Winter 2008 41
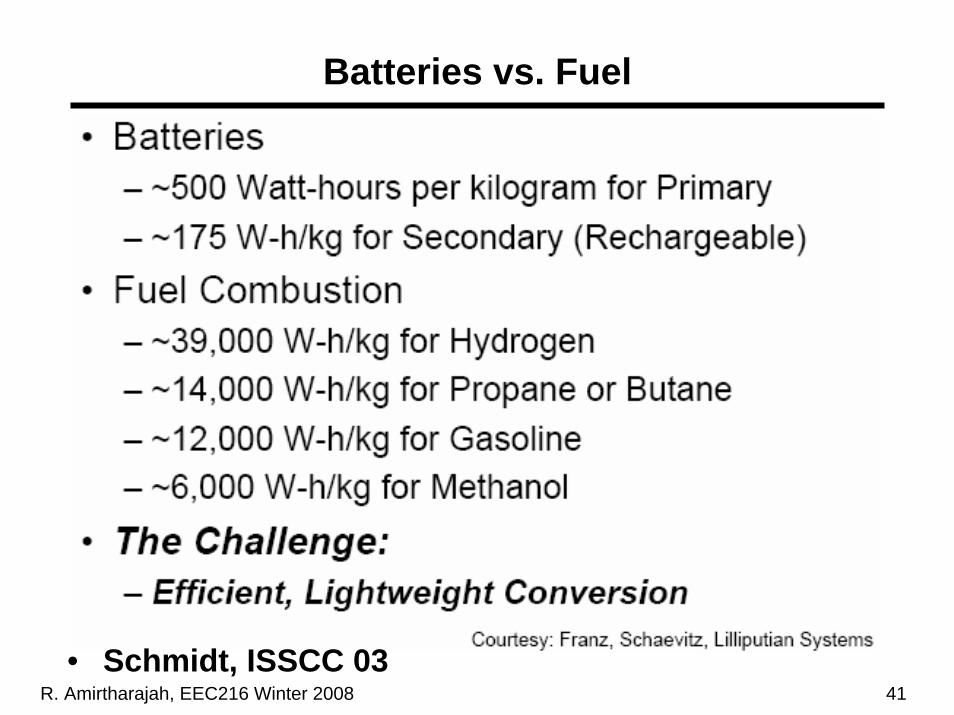
Batteries vs. Fuel
• Schmidt, ISSCC 03

R. Amirtharajah, EEC216 Winter 2008 42
Fuel Burning Advantages vs. Batteries
• Schmidt, ISSCC 03

R. Amirtharajah, EEC216 Winter 2008 43
Thermoelectric Generators
• Schmidt, ISSCC 03

R. Amirtharajah, EEC216 Winter 2008 44
Thermoelectric Generation Materials
• Schmidt, ISSCC 03
R. Amirtharajah, EEC216 Winter 2008 45
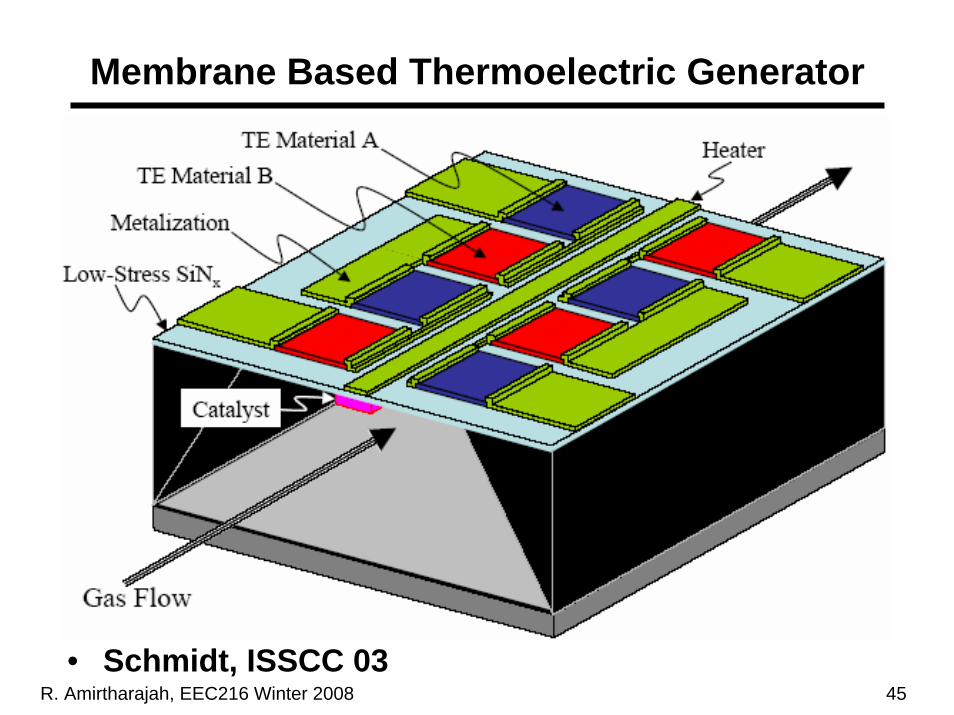
Membrane Based Thermoelectric Generator
• Schmidt, ISSCC 03
R. Amirtharajah, EEC216 Winter 2008 46
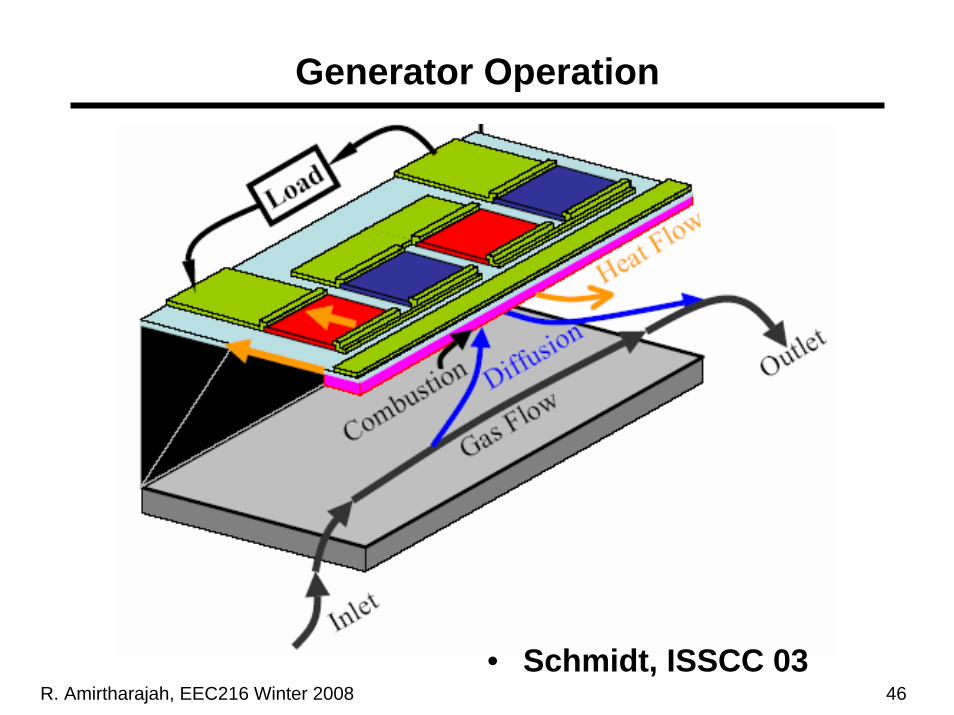
Generator Operation
• Schmidt, ISSCC 03
R. Amirtharajah, EEC216 Winter 2008 47
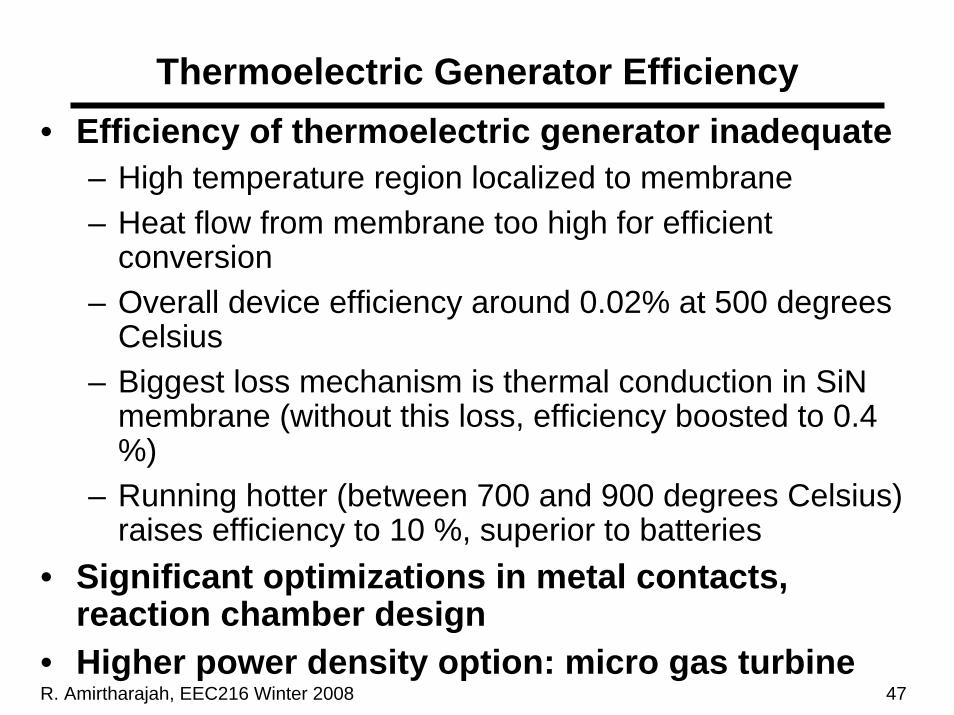
Thermoelectric Generator Efficiency• Efficiency of thermoelectric generator inadequate
– High temperature region localized to membrane– Heat flow from membrane too high for efficient
conversion– Overall device efficiency around 0.02% at 500 degrees
Celsius– Biggest loss mechanism is thermal conduction in SiN
membrane (without this loss, efficiency boosted to 0.4 %)
– Running hotter (between 700 and 900 degrees Celsius) raises efficiency to 10 %, superior to batteries
• Significant optimizations in metal contacts, reaction chamber design
• Higher power density option: micro gas turbine

R. Amirtharajah, EEC216 Winter 2008 48
MIT Micro Gas Turbine Generator
• Schmidt, ISSCC 03

R. Amirtharajah, EEC216 Winter 2008 49
Hydrogen Micro Turbine Demonstration
• Schmidt, ISSCC 03

R. Amirtharajah, EEC216 Winter 2008 50
Micro Turbine Technical Challenges
• Schmidt, ISSCC 03
• High speed rotation (greater than 1 Million RPM)– Constrains fabrication precision
• Combustion using silicon package (instead of SiC)– Constrains conversion efficiency and packaging
• Electrical conversion nontrivial– Electrostatic induction (traditionally used
electromagnetic induction) and new materials– Power electronics for conversion including inductors
• Manufacturing flow complexity (6 wafers, 25 masks)– Controlling etches
R. Amirtharajah, EEC216 Winter 2008 51
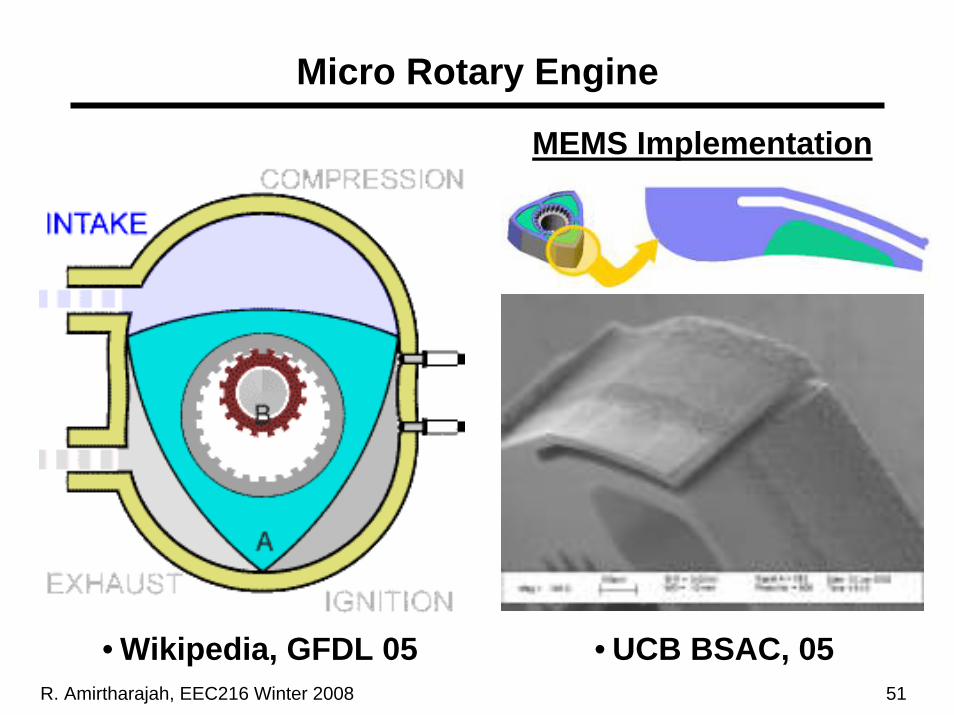
Micro Rotary Engine
• Wikipedia, GFDL 05
MEMS Implementation
• UCB BSAC, 05