eecc551 - shaaban #1 lec # 1 winter 2000 11-30-2000 the von neumann computer model partitioning of...
Post on 21-Dec-2015
218 views
TRANSCRIPT

EECC551 - ShaabanEECC551 - Shaaban#1 Lec # 1 Winter 2000 11-30-2000
The Von Neumann Computer ModelThe Von Neumann Computer Model• Partitioning of the computing engine into components:
– Central Processing Unit (CPU): Control Unit (instruction decode , sequencing of operations), Datapath (registers, arithmetic and logic unit, buses).
– Memory: Instruction and operand storage.– Input/Output (I/O) sub-system: I/O bus, interfaces, devices.– The stored program concept: Instructions from an instruction set are fetched
from a common memory and executed one at a time
-Memory
(instructions, data)
Control
DatapathregistersALU, buses
CPUComputer System
Input
Output
I/O Devices

EECC551 - ShaabanEECC551 - Shaaban#2 Lec # 1 Winter 2000 11-30-2000
Generic CPU Machine Instruction Execution StepsGeneric CPU Machine Instruction Execution Steps
Instruction
Fetch
Instruction
Decode
Operand
Fetch
Execute
Result
Store
Next
Instruction
Obtain instruction from program storage
Determine required actions and instruction size
Locate and obtain operand data
Compute result value or status
Deposit results in storage for later use
Determine successor or next instruction
EECC551 - ShaabanEECC551 - Shaaban#3 Lec # 1 Winter 2000 11-30-2000
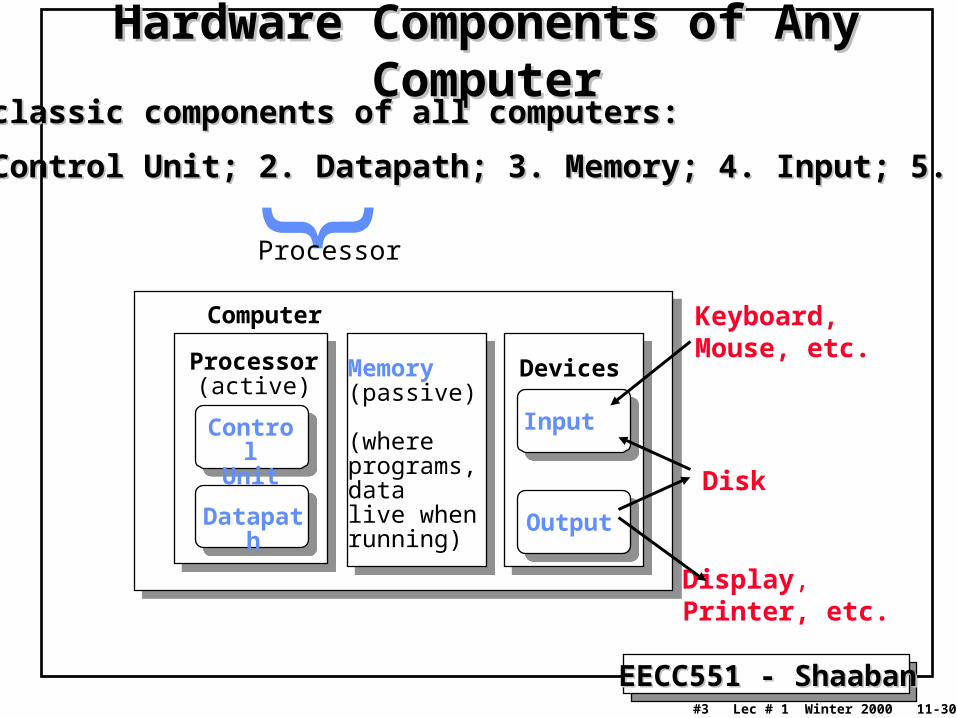
Hardware Components of Any ComputerHardware Components of Any Computer
Processor (active)
Computer
ControlUnit
Datapath
Memory(passive)
(where programs, data live whenrunning)
Devices
Input
Output
Keyboard, Mouse, etc.
Display, Printer, etc.
Disk
Five classic components of all computers:Five classic components of all computers:
1. Control Unit; 2. Datapath; 3. Memory; 4. Input; 5. Output1. Control Unit; 2. Datapath; 3. Memory; 4. Input; 5. Output}
Processor

EECC551 - ShaabanEECC551 - Shaaban#4 Lec # 1 Winter 2000 11-30-2000
CPU OrganizationCPU Organization• Datapath Design:
– Capabilities & performance characteristics of principal Functional Units (FUs):
• (e.g., Registers, ALU, Shifters, Logic Units, ...)
– Ways in which these components are interconnected (buses connections, multiplexors, etc.).
– How information flows between components.
• Control Unit Design:– Logic and means by which such information flow is controlled.
– Control and coordination of FUs operation to realize the targeted Instruction Set Architecture to be implemented (can either be implemented using a finite state machine or a microprogram).
• Hardware description with a suitable language, possibly using Register Transfer Notation (RTN).
EECC551 - ShaabanEECC551 - Shaaban#5 Lec # 1 Winter 2000 11-30-2000
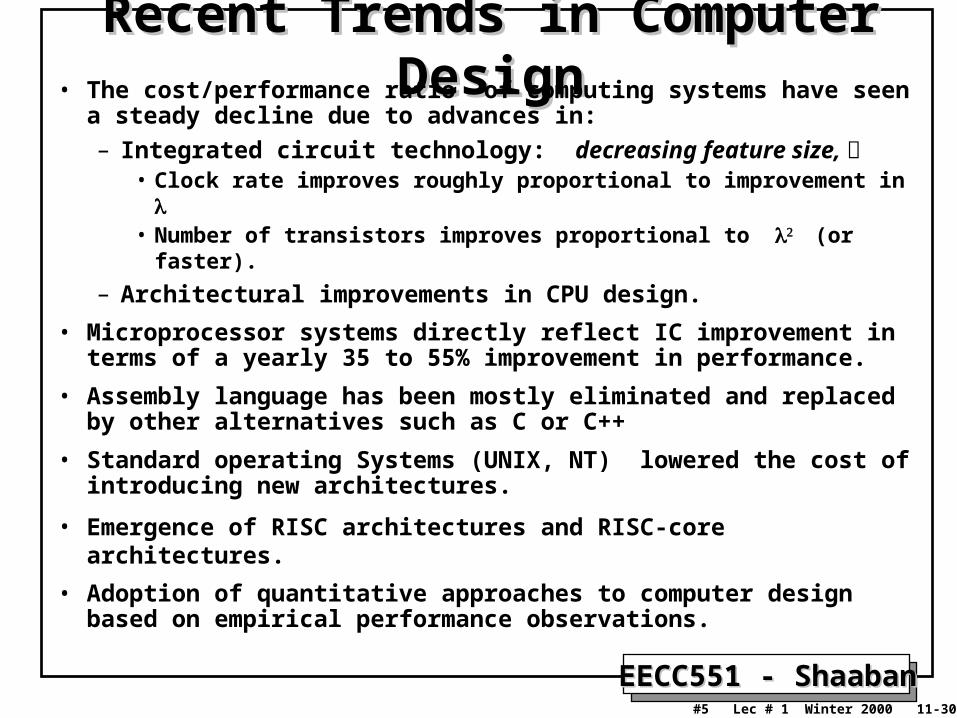
Recent Trends in Computer DesignRecent Trends in Computer Design• The cost/performance ratio of computing systems have seen a
steady decline due to advances in:
– Integrated circuit technology: decreasing feature size, • Clock rate improves roughly proportional to improvement in • Number of transistors improves proportional to (or faster).
– Architectural improvements in CPU design.
• Microprocessor systems directly reflect IC improvement in terms of a yearly 35 to 55% improvement in performance.
• Assembly language has been mostly eliminated and replaced by other alternatives such as C or C++
• Standard operating Systems (UNIX, NT) lowered the cost of introducing new architectures.
• Emergence of RISC architectures and RISC-core architectures.
• Adoption of quantitative approaches to computer design based on empirical performance observations.

EECC551 - ShaabanEECC551 - Shaaban#6 Lec # 1 Winter 2000 11-30-2000
1988 Computer Food Chain1988 Computer Food Chain
PCWork-stationMini-
computer
Mainframe
Mini-supercomputer
Supercomputer
Massively Parallel Processors
EECC551 - ShaabanEECC551 - Shaaban#7 Lec # 1 Winter 2000 11-30-2000
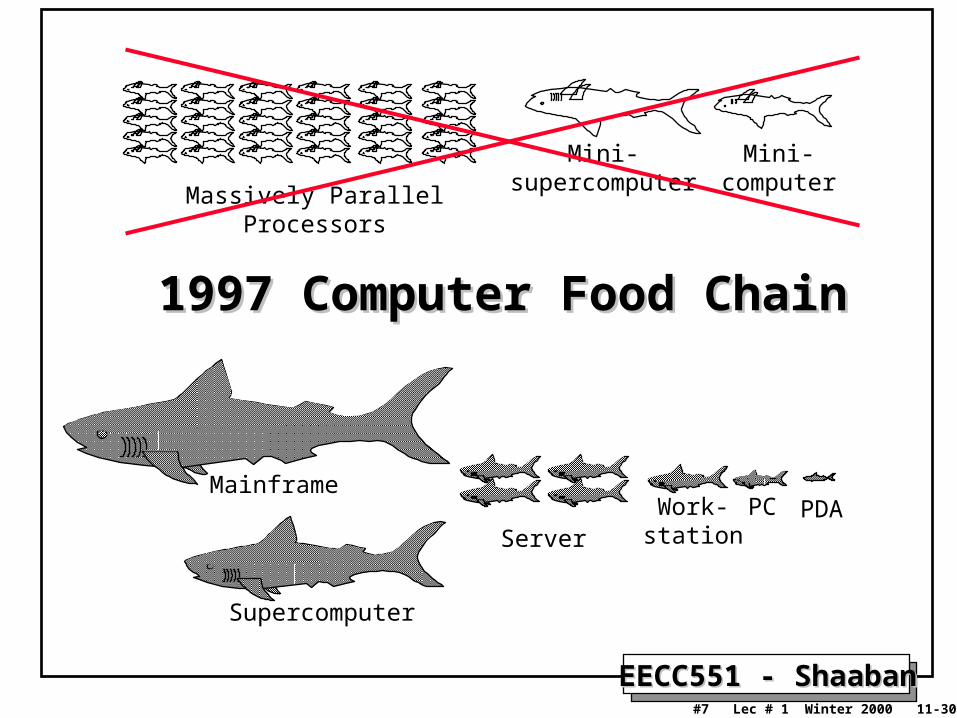
1997 Computer Food Chain1997 Computer Food Chain
PCWork-station
Mainframe
Supercomputer
Mini-supercomputerMassively Parallel Processors
Mini-computer
ServerPDA
EECC551 - ShaabanEECC551 - Shaaban#8 Lec # 1 Winter 2000 11-30-2000
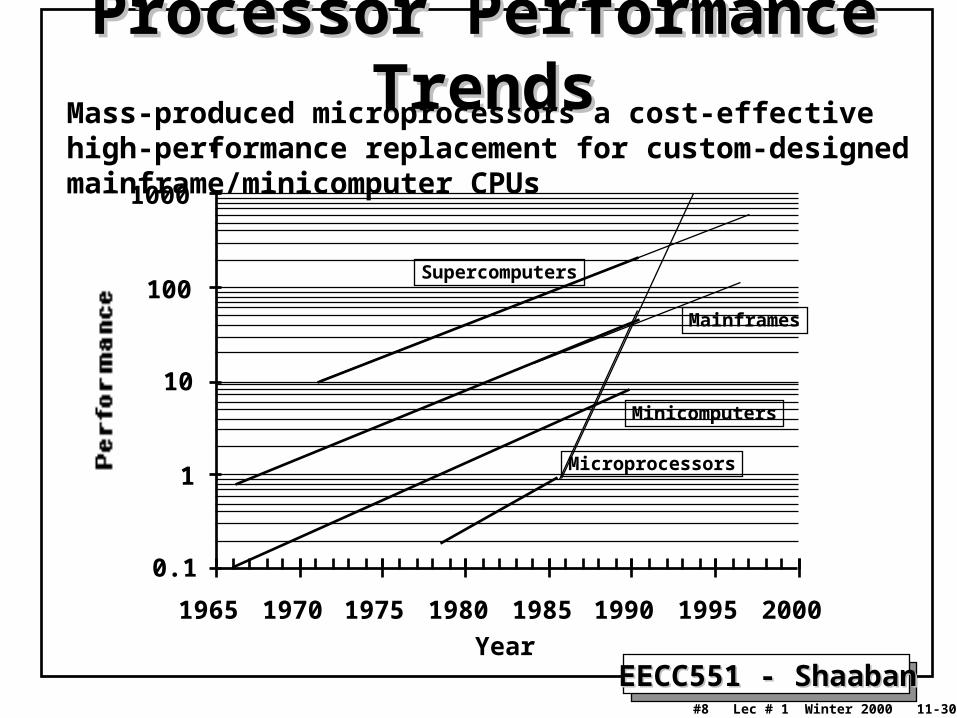
Processor Performance TrendsProcessor Performance Trends
Microprocessors
Minicomputers
Mainframes
Supercomputers
Year
0.1
1
10
100
1000
1965 1970 1975 1980 1985 1990 1995 2000
Mass-produced microprocessors a cost-effective high-performance replacement for custom-designed mainframe/minicomputer CPUs
EECC551 - ShaabanEECC551 - Shaaban#9 Lec # 1 Winter 2000 11-30-2000
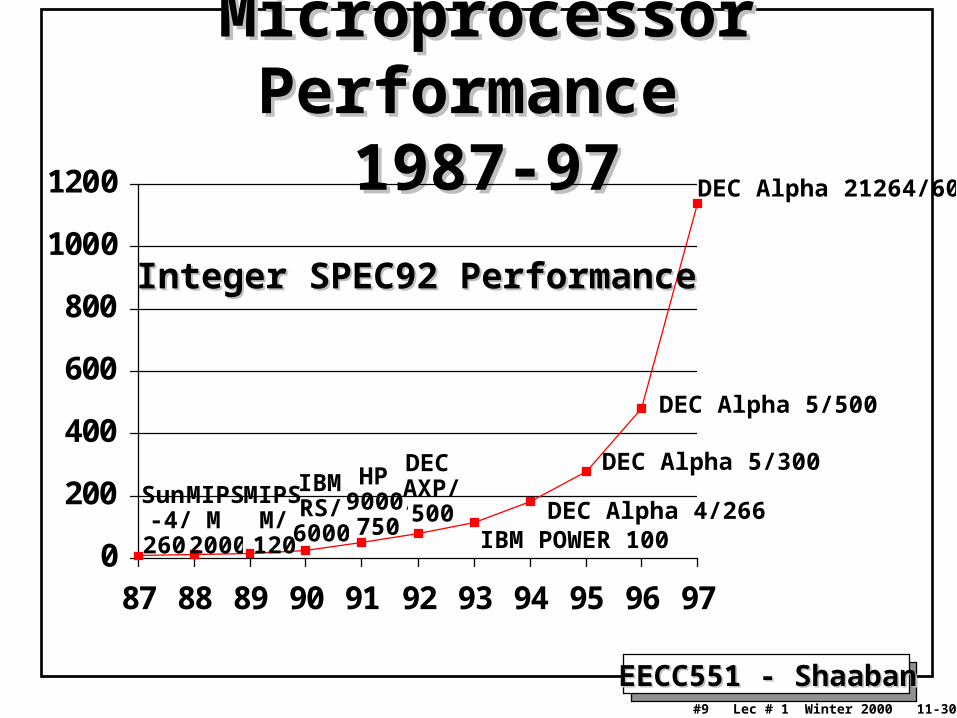
Microprocessor Performance Microprocessor Performance 1987-971987-97
0
200
400
600
800
1000
1200
87 88 89 90 91 92 93 94 95 96 97
DEC Alpha 21264/600
DEC Alpha 5/500
DEC Alpha 5/300
DEC Alpha 4/266IBM POWER 100
DEC AXP/500
HP 9000/750
Sun-4/
260
IBMRS/
6000
MIPS M/
120
MIPS M
2000
Integer SPEC92 PerformanceInteger SPEC92 Performance
EECC551 - ShaabanEECC551 - Shaaban#10 Lec # 1 Winter 2000 11-30-2000
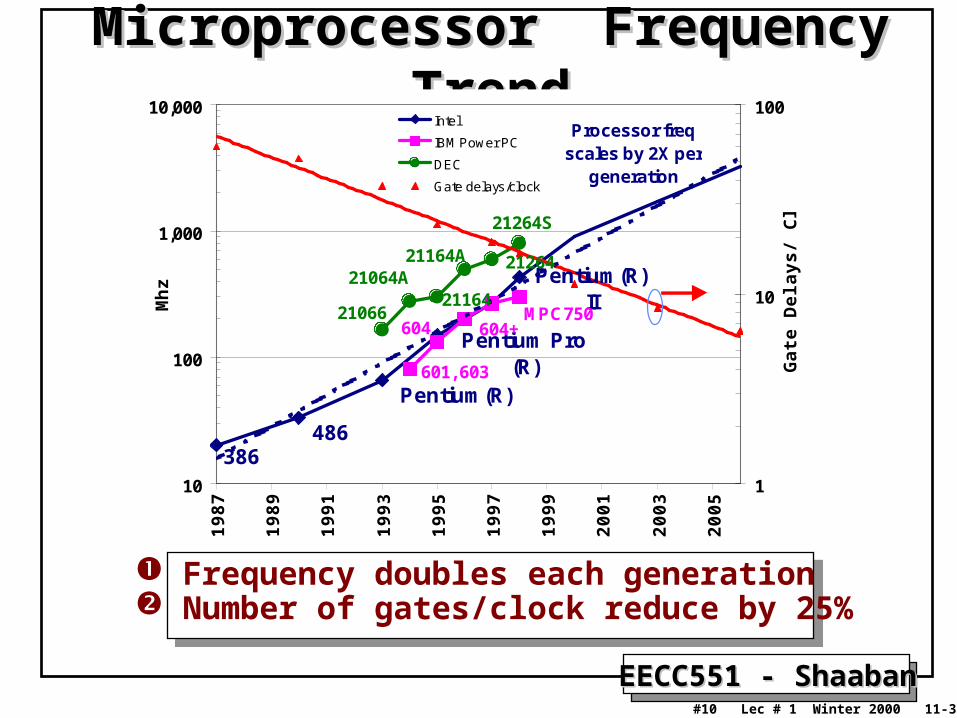
Microprocessor Frequency TrendMicroprocessor Frequency Trend
386486
Pentium(R)
Pentium Pro(R)
Pentium(R) II
MPC750604+604
601, 603
21264S
2126421164A
2116421064A
21066
10
100
1,000
10,000
19
87
19
89
19
91
19
93
19
95
19
97
19
99
20
01
20
03
20
05
Mh
z
1
10
100
Ga
te D
ela
ys
/ Clo
ck
Intel
IBM Power PC
DEC
Gate delays/clock
Processor freq scales by 2X per
generation
Frequency doubles each generation Number of gates/clock reduce by 25%
EECC551 - ShaabanEECC551 - Shaaban#11 Lec # 1 Winter 2000 11-30-2000
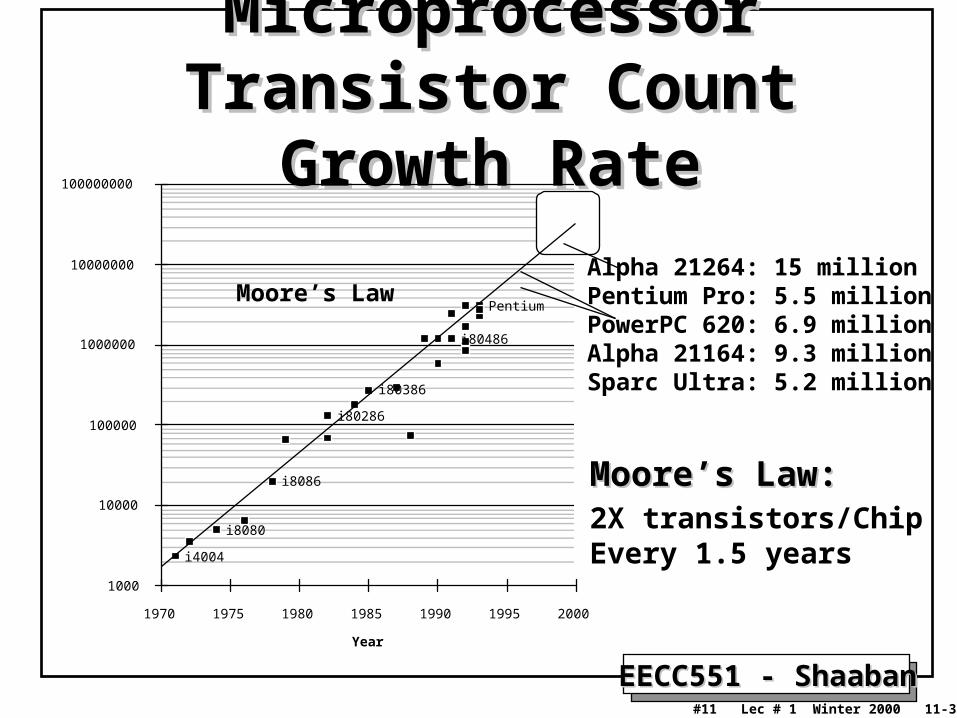
Microprocessor Transistor Microprocessor Transistor Count Growth RateCount Growth Rate
Year
Transistors
1000
10000
100000
1000000
10000000
100000000
1970 1975 1980 1985 1990 1995 2000
i80386
i4004
i8080
Pentium
i80486
i80286
i8086 Moore’s Law:Moore’s Law:2X transistors/ChipEvery 1.5 years
Alpha 21264: 15 millionPentium Pro: 5.5 millionPowerPC 620: 6.9 millionAlpha 21164: 9.3 millionSparc Ultra: 5.2 million
Moore’s Law
EECC551 - ShaabanEECC551 - Shaaban#12 Lec # 1 Winter 2000 11-30-2000
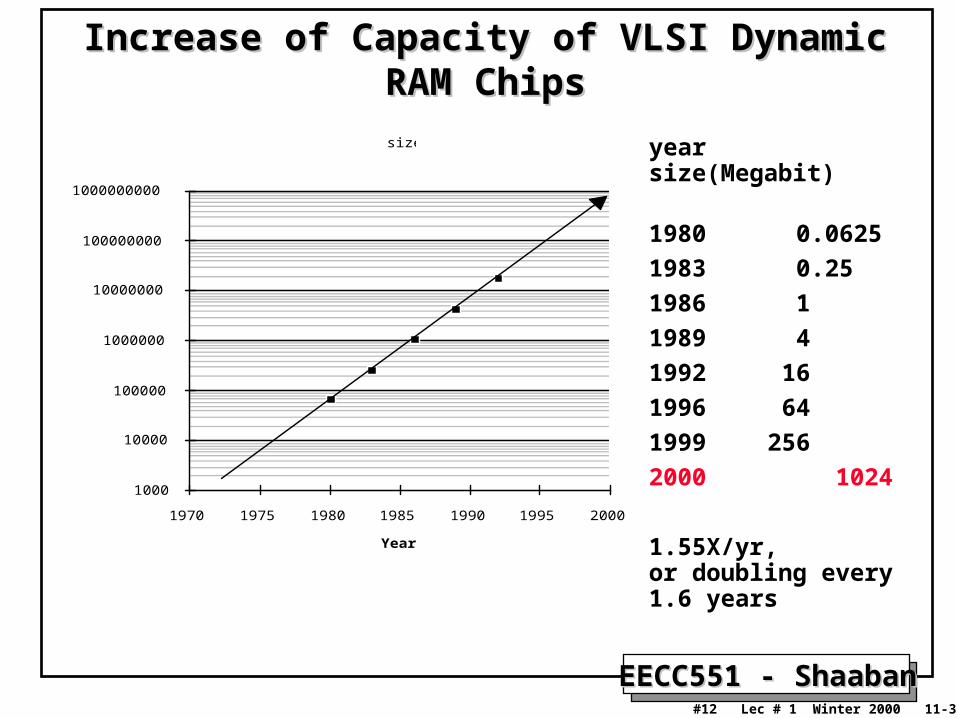
Increase of Capacity of VLSI Dynamic RAM ChipsIncrease of Capacity of VLSI Dynamic RAM Chips
size
Year
Bits
1000
10000
100000
1000000
10000000
100000000
1000000000
1970 1975 1980 1985 1990 1995 2000
year size(Megabit)
1980 0.0625
1983 0.25
1986 1
1989 4
1992 16
1996 64
1999 256
2000 1024
1.55X/yr, or doubling every 1.6 years
EECC551 - ShaabanEECC551 - Shaaban#13 Lec # 1 Winter 2000 11-30-2000
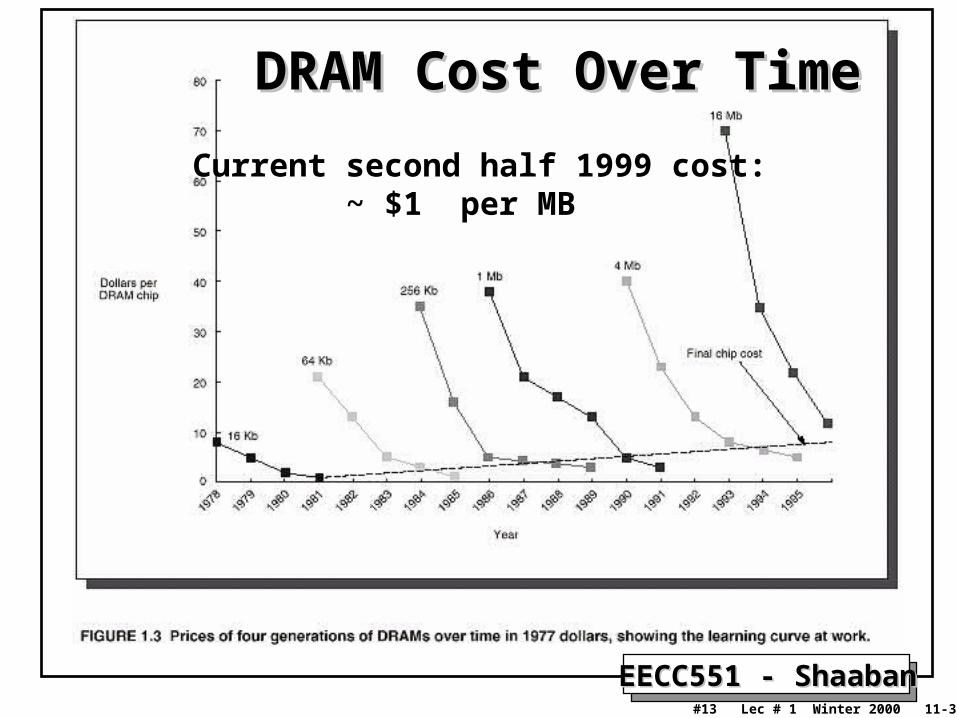
DRAM Cost Over TimeDRAM Cost Over Time
Current second half 1999 cost: ~ $1 per MB
EECC551 - ShaabanEECC551 - Shaaban#14 Lec # 1 Winter 2000 11-30-2000
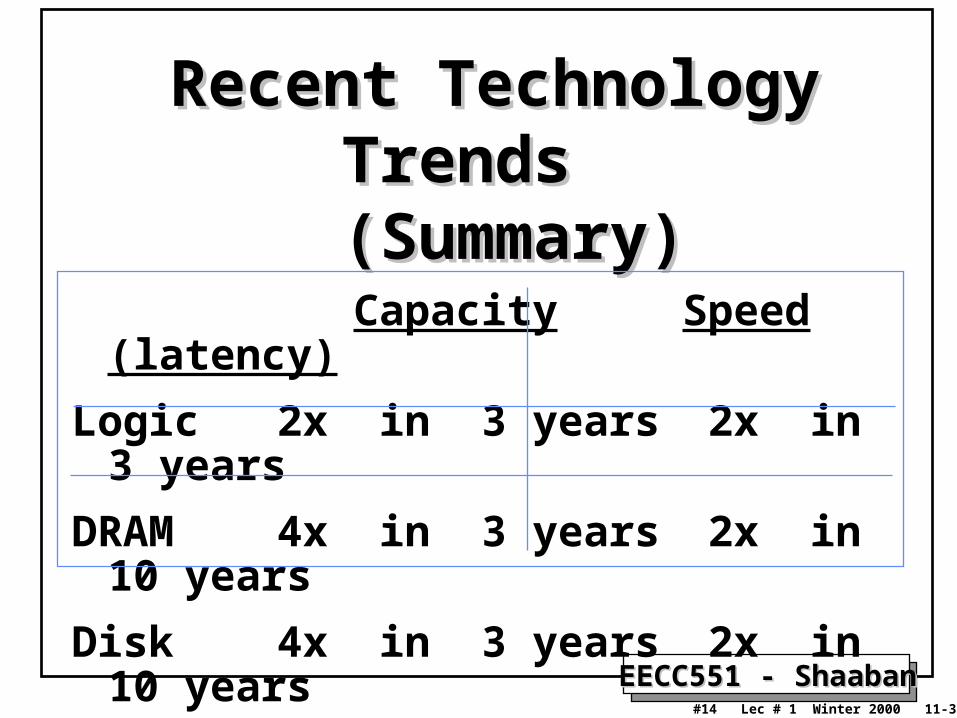
Recent Technology Trends Recent Technology Trends (Summary) (Summary)
Capacity Speed (latency)
Logic 2x in 3 years 2x in 3 years
DRAM 4x in 3 years 2x in 10 years
Disk 4x in 3 years 2x in 10 years
EECC551 - ShaabanEECC551 - Shaaban#15 Lec # 1 Winter 2000 11-30-2000
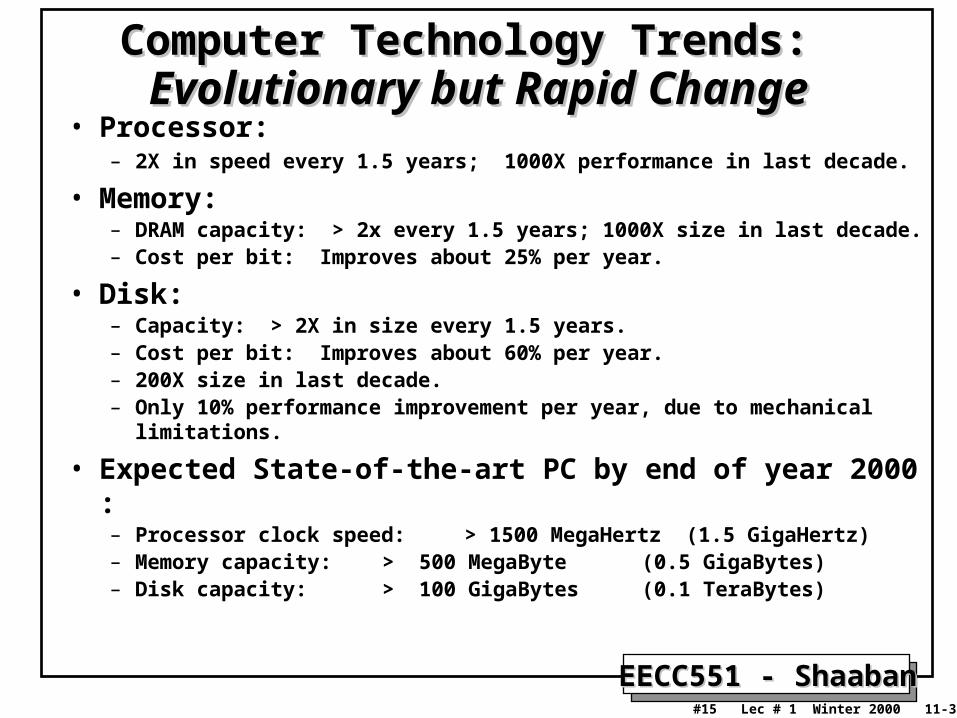
Computer Technology Trends:Computer Technology Trends: Evolutionary but Rapid ChangeEvolutionary but Rapid Change
• Processor:– 2X in speed every 1.5 years; 1000X performance in last decade.
• Memory:– DRAM capacity: > 2x every 1.5 years; 1000X size in last decade.– Cost per bit: Improves about 25% per year.
• Disk:– Capacity: > 2X in size every 1.5 years.– Cost per bit: Improves about 60% per year.– 200X size in last decade.– Only 10% performance improvement per year, due to mechanical limitations.
• Expected State-of-the-art PC by end of year 2000 :– Processor clock speed: > 1500 MegaHertz (1.5 GigaHertz)– Memory capacity: > 500 MegaByte (0.5 GigaBytes)– Disk capacity: > 100 GigaBytes (0.1 TeraBytes)
EECC551 - ShaabanEECC551 - Shaaban#16 Lec # 1 Winter 2000 11-30-2000
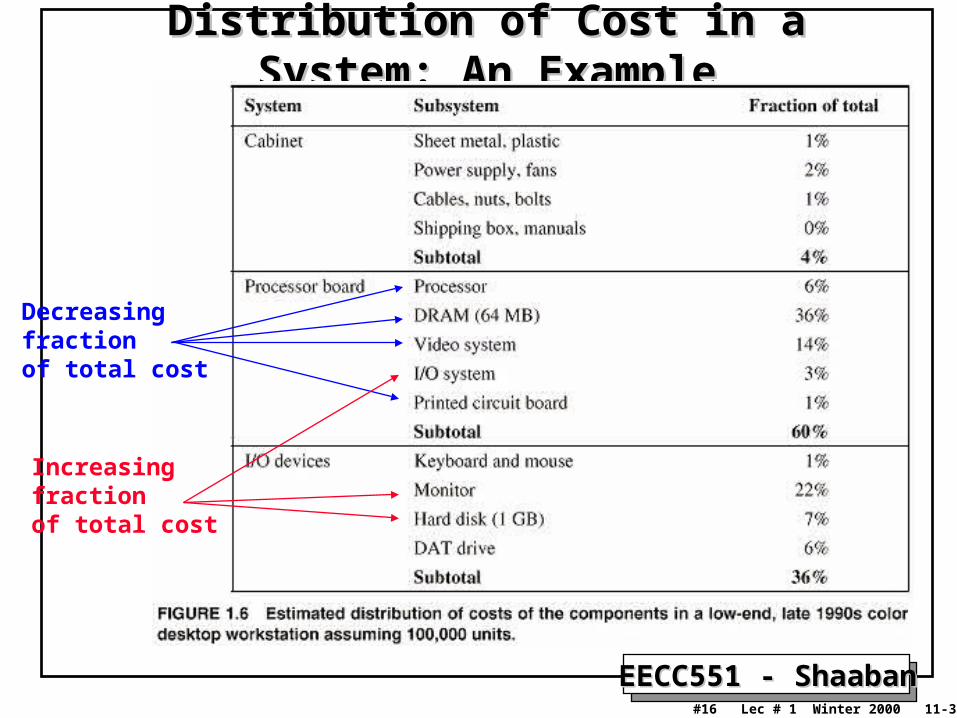
Distribution of Cost in a System: An ExampleDistribution of Cost in a System: An Example
Decreasingfractionof total cost
Increasingfractionof total cost
EECC551 - ShaabanEECC551 - Shaaban#17 Lec # 1 Winter 2000 11-30-2000
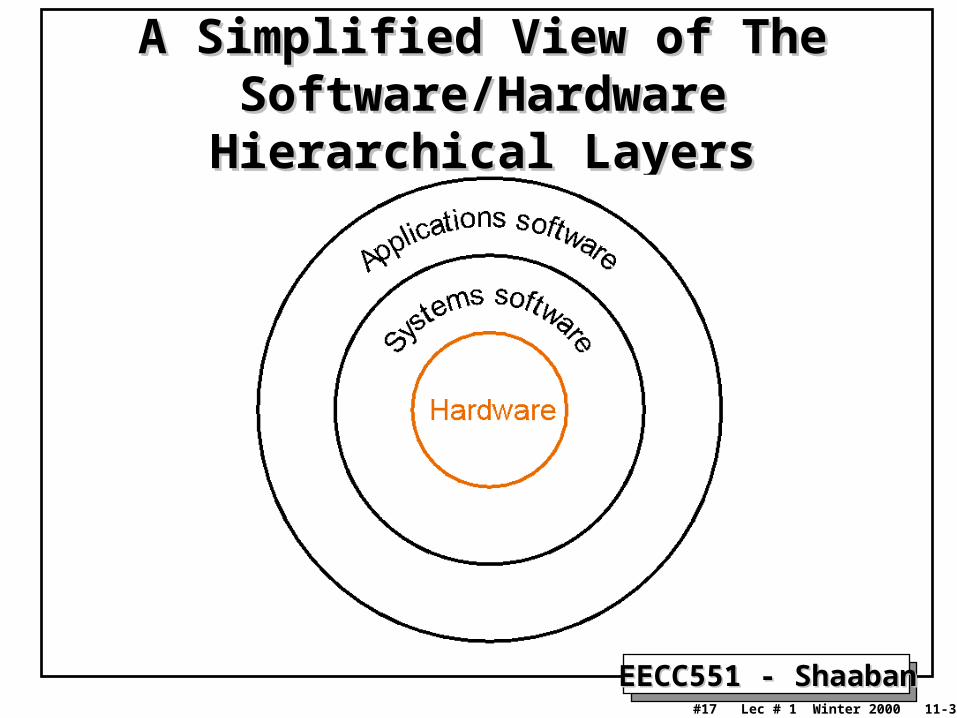
A Simplified View of The A Simplified View of The Software/Hardware Hierarchical LayersSoftware/Hardware Hierarchical Layers

EECC551 - ShaabanEECC551 - Shaaban#18 Lec # 1 Winter 2000 11-30-2000
A Hierarchy of Computer DesignA Hierarchy of Computer DesignLevel Name Modules Primitives Descriptive Media
1 Electronics Gates, FF’s Transistors, Resistors, etc. Circuit Diagrams
2 Logic Registers, ALU’s ... Gates, FF’s …. Logic Diagrams
3 Organization Processors, Memories Registers, ALU’s … Register Transfer
Notation (RTN)
4 Microprogramming Assembly Language Microinstructions Microprogram
5 Assembly language OS Routines Assembly language Assembly Language
programming Instructions Programs
6 Procedural Applications OS Routines High-level Language
Programming Drivers .. High-level Languages Programs
7 Application Systems Procedural Constructs Problem-Oriented
Programs
Low Level - Hardware
Firmware
High Level - Software

EECC551 - ShaabanEECC551 - Shaaban#19 Lec # 1 Winter 2000 11-30-2000
Hierarchy of Computer ArchitectureHierarchy of Computer Architecture
I/O systemInstr. Set Proc.
Compiler
OperatingSystem
Application
Digital DesignCircuit Design
Instruction Set Architecture
Firmware
Datapath & Control
Layout
Software
Hardware
Software/Hardware Boundary
High-Level Language Programs
Assembly LanguagePrograms
Microprogram
Register TransferNotation (RTN)
Logic Diagrams
Circuit Diagrams
Machine Language Program

EECC551 - ShaabanEECC551 - Shaaban#20 Lec # 1 Winter 2000 11-30-2000
Computer Architecture Vs. Computer Organization• The term Computer architecture is sometimes erroneously restricted
to computer instruction set design, with other aspects of computer design called implementation
• More accurate definitions:
– Instruction set architecture (ISA): The actual programmer-visible instruction set and serves as the boundary between the software and hardware.
– Implementation of a machine has two components:• Organization: includes the high-level aspects of a computer’s
design such as: The memory system, the bus structure, the internal CPU unit which includes implementations of arithmetic, logic, branching, and data transfer operations.
• Hardware: Refers to the specifics of the machine such as detailed logic design and packaging technology.
• In general, Computer Architecture refers to the above three aspects:
Instruction set architecture, organization, and hardware.
EECC551 - ShaabanEECC551 - Shaaban#21 Lec # 1 Winter 2000 11-30-2000
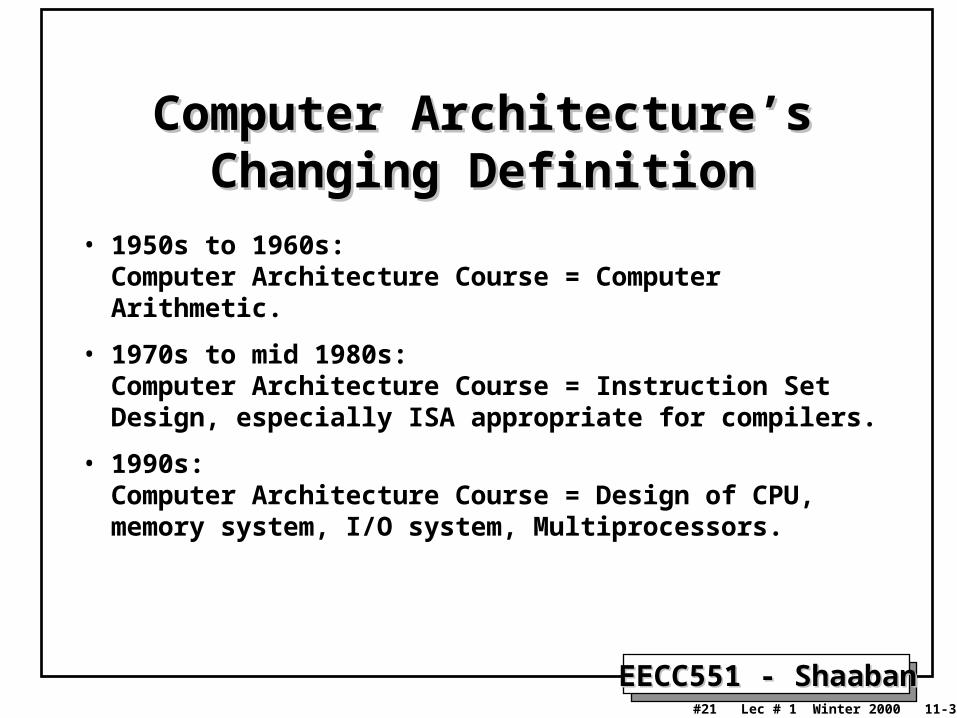
Computer Architecture’s Changing Computer Architecture’s Changing DefinitionDefinition
• 1950s to 1960s: Computer Architecture Course = Computer Arithmetic.
• 1970s to mid 1980s: Computer Architecture Course = Instruction Set Design, especially ISA appropriate for compilers.
• 1990s: Computer Architecture Course = Design of CPU, memory system, I/O system, Multiprocessors.

EECC551 - ShaabanEECC551 - Shaaban#22 Lec # 1 Winter 2000 11-30-2000
The Task of A Computer DesignerThe Task of A Computer Designer• Determine what attributes that are important to the
design of the new machine.
• Design a machine to maximize performance while staying within cost and other constraints and metrics.
• It involves more than instruction set design.– Instruction set architecture.– CPU Micro-Architecture.– Implementation.
• Implementation of a machine has two components:
– Organization.– Hardware.
EECC551 - ShaabanEECC551 - Shaaban#23 Lec # 1 Winter 2000 11-30-2000
Recent Architectural Recent Architectural ImprovementsImprovements
• Increased optimization and utilization of cache systems.
• Memory-latency hiding techniques.
• Optimization of pipelined instruction execution.
• Dynamic hardware-based pipeline scheduling.
• Improved handling of pipeline hazards.
• Improved hardware branch prediction techniques.
• Exploiting Instruction-Level Parallelism (ILP) in terms of multiple-instruction issue and multiple hardware functional units.
• Inclusion of special instructions to handle multimedia applications.
• High-speed bus designs to improve data transfer rates.

EECC551 - ShaabanEECC551 - Shaaban#24 Lec # 1 Winter 2000 11-30-2000
The Concept of Memory HierarchyThe Concept of Memory Hierarchy
Memory I/O dev.
Cache
Registers
CPU
< 4 GB60ns
>2 GB5ms
< 4MB

EECC551 - ShaabanEECC551 - Shaaban#25 Lec # 1 Winter 2000 11-30-2000
Typical Parameters of Memory Hierarchy Levels
EECC551 - ShaabanEECC551 - Shaaban#26 Lec # 1 Winter 2000 11-30-2000
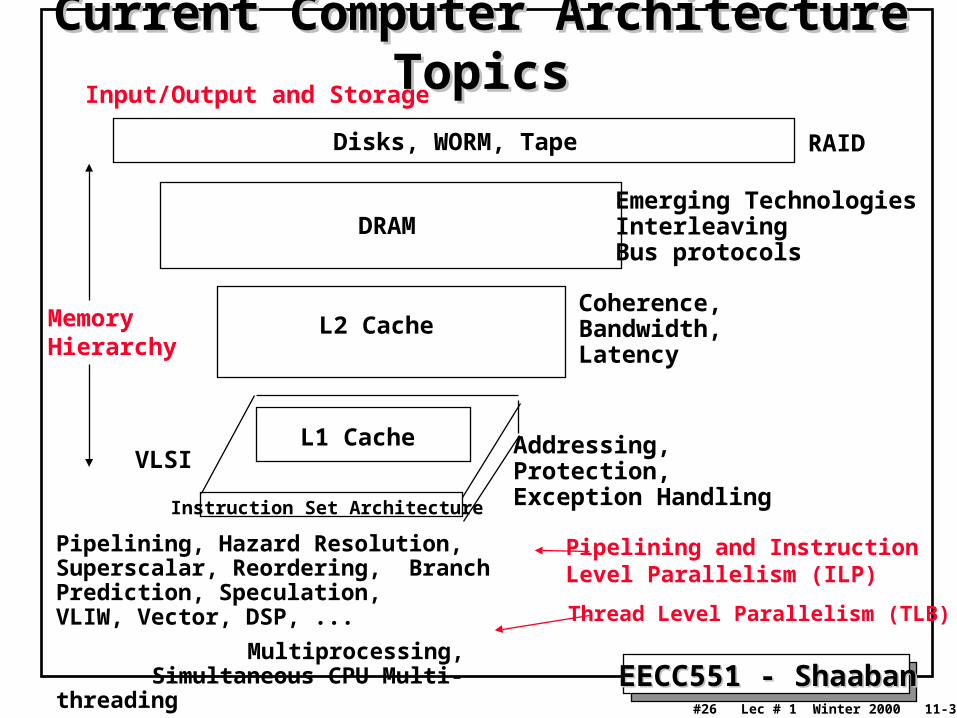
Current Computer Architecture TopicsCurrent Computer Architecture Topics
Instruction Set Architecture
Pipelining, Hazard Resolution, Superscalar, Reordering, Branch Prediction, Speculation,VLIW, Vector, DSP, ...
Multiprocessing,Simultaneous CPU Multi-threading
Addressing,Protection,Exception Handling
L1 Cache
L2 Cache
DRAM
Disks, WORM, Tape
Coherence,Bandwidth,Latency
Emerging TechnologiesInterleavingBus protocols
RAID
VLSI
Input/Output and Storage
MemoryHierarchy
Pipelining and Instruction Level Parallelism (ILP)
Thread Level Parallelism (TLB)

EECC551 - ShaabanEECC551 - Shaaban#27 Lec # 1 Winter 2000 11-30-2000
Computer Performance Evaluation:Computer Performance Evaluation:Cycles Per Instruction (CPI)Cycles Per Instruction (CPI)
• Most computers run synchronously utilizing a CPU clock running at a constant clock rate:
where: Clock rate = 1 / clock cycle
• A computer machine instruction is comprised of a number of elementary or micro operations which vary in number and complexity depending on the instruction and the exact CPU organization and implementation.– A micro operation is an elementary hardware operation that can be
performed during one clock cycle.
– This corresponds to one micro-instruction in microprogrammed CPUs.
– Examples: register operations: shift, load, clear, increment, ALU operations: add , subtract, etc.
• Thus a single machine instruction may take one or more cycles to complete termed as the Cycles Per Instruction (CPI).

EECC551 - ShaabanEECC551 - Shaaban#28 Lec # 1 Winter 2000 11-30-2000
• For a specific program compiled to run on a specific machine “A”, the following parameters are provided:
– The total instruction count of the program.– The average number of cycles per instruction (average CPI).– Clock cycle of machine “A”
• How can one measure the performance of this machine running this program?– Intuitively the machine is said to be faster or has better performance
running this program if the total execution time is shorter. – Thus the inverse of the total measured program execution time is a
possible performance measure or metric:
PerformanceA = 1 / Execution TimeA
How to compare performance of different machines?
What factors affect performance? How to improve performance?
Computer Performance Measures: Computer Performance Measures: Program Execution TimeProgram Execution Time

EECC551 - ShaabanEECC551 - Shaaban#29 Lec # 1 Winter 2000 11-30-2000
Measuring PerformanceMeasuring Performance• For a specific program or benchmark running on machine x:
Performance = 1 / Execution Timex
• To compare the performance of machines X, Y, executing specific code:
n = Executiony / Executionx
= Performance x / Performancey
• System performance refers to the performance and elapsed time measured on an unloaded machine.
• CPU Performance refers to user CPU time on an unloaded system.• Example:
For a given program: Execution time on machine A: ExecutionA = 1 second
Execution time on machine B: ExecutionB = 10 secondsPerformanceA /PerformanceB = Execution TimeB /Execution TimeA = 10 /1 = 10
The performance of machine A is 10 times the performance of machine B when running this program, or: Machine A is said to be 10 times faster than machine B when running this program.

EECC551 - ShaabanEECC551 - Shaaban#30 Lec # 1 Winter 2000 11-30-2000
CPU Performance EquationCPU Performance Equation
CPU time = CPU clock cycles for a program
X Clock cycle time
or:
CPU time = CPU clock cycles for a program / clock rate
CPI (clock cycles per instruction):
CPI = CPU clock cycles for a program / I
where I is the instruction count.

EECC551 - ShaabanEECC551 - Shaaban#31 Lec # 1 Winter 2000 11-30-2000
CPU Execution Time: The CPU EquationCPU Execution Time: The CPU Equation• A program is comprised of a number of instructions, I
– Measured in: instructions/program
• The average instruction takes a number of cycles per instruction (CPI) to be completed. – Measured in: cycles/instruction
• CPU has a fixed clock cycle time C = 1/clock rate – Measured in: seconds/cycle
• CPU execution time is the product of the above three parameters as follows:
CPU Time = I x CPI x C
CPU time = Seconds = Instructions x Cycles x Seconds
Program Program Instruction Cycle
CPU time = Seconds = Instructions x Cycles x Seconds
Program Program Instruction Cycle
EECC551 - ShaabanEECC551 - Shaaban#32 Lec # 1 Winter 2000 11-30-2000
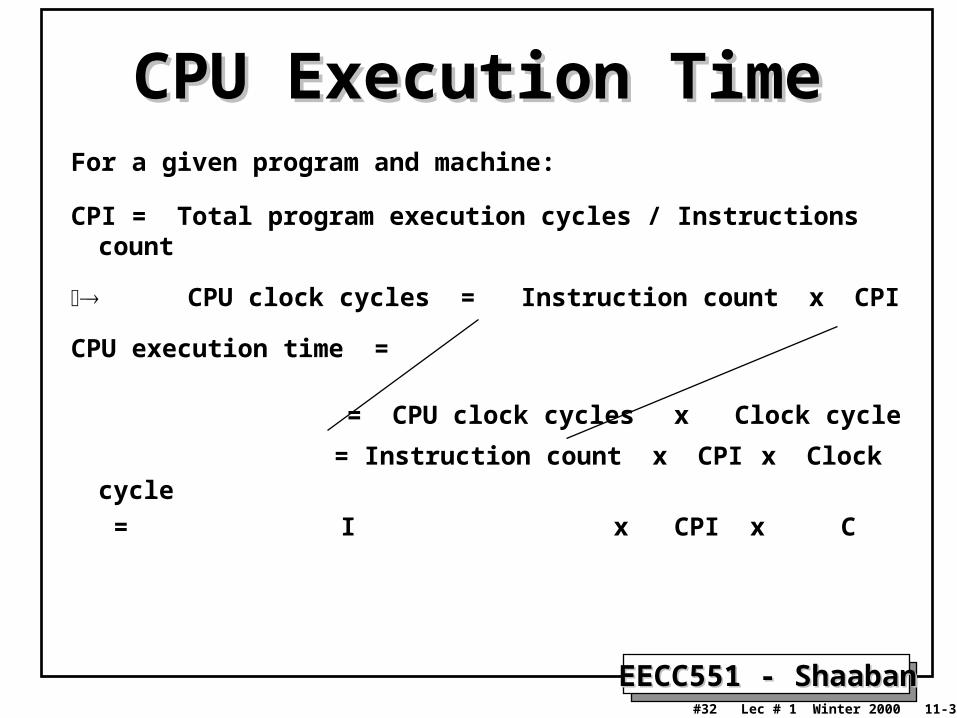
CPU Execution TimeCPU Execution TimeFor a given program and machine:
CPI = Total program execution cycles / Instructions count
CPU clock cycles = Instruction count x CPI
CPU execution time =
= CPU clock cycles x Clock cycle
= Instruction count x CPI x Clock cycle
= I x CPI x C
EECC551 - ShaabanEECC551 - Shaaban#33 Lec # 1 Winter 2000 11-30-2000
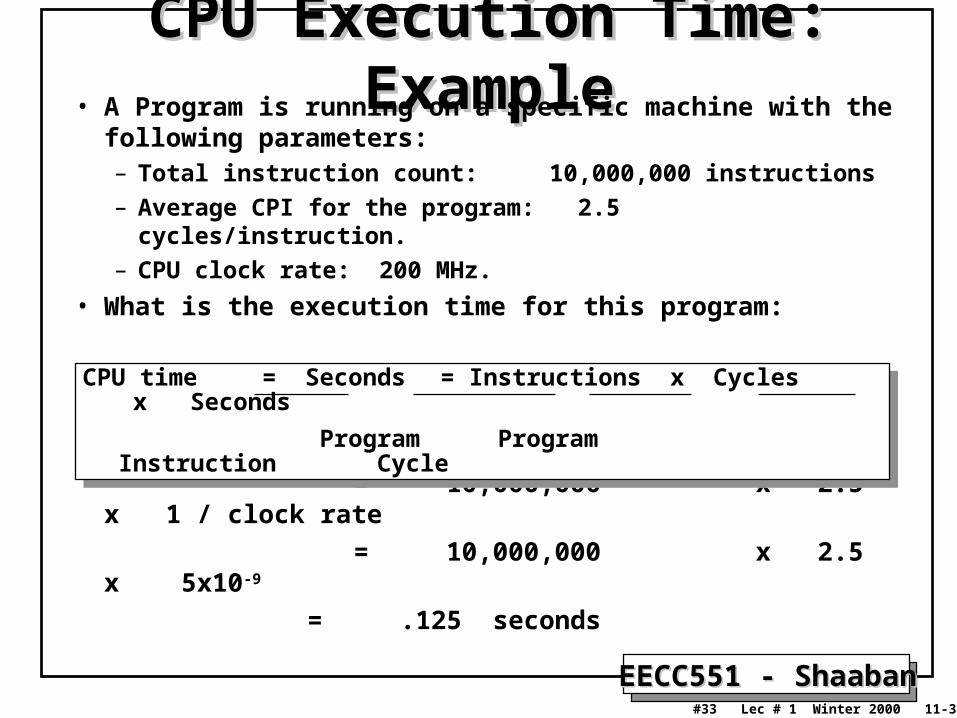
CPU Execution Time: ExampleCPU Execution Time: Example• A Program is running on a specific machine with the
following parameters:– Total instruction count: 10,000,000 instructions
– Average CPI for the program: 2.5 cycles/instruction.
– CPU clock rate: 200 MHz.
• What is the execution time for this program:
CPU time = Instruction count x CPI x Clock cycle
= 10,000,000 x 2.5 x 1 / clock rate
= 10,000,000 x 2.5 x 5x10-9
= .125 seconds
CPU time = Seconds = Instructions x Cycles x Seconds
Program Program Instruction Cycle
CPU time = Seconds = Instructions x Cycles x Seconds
Program Program Instruction Cycle

EECC551 - ShaabanEECC551 - Shaaban#34 Lec # 1 Winter 2000 11-30-2000
Aspects of CPU Execution TimeAspects of CPU Execution TimeCPU Time = Instruction count x CPI x Clock cycle
Instruction Count Instruction Count II
ClockClockCycleCycle CC
CPICPIDepends on:
CPU OrganizationTechnology
Depends on:
Program Used
CompilerISACPU Organization
Depends on:
Program UsedCompilerISA
EECC551 - ShaabanEECC551 - Shaaban#35 Lec # 1 Winter 2000 11-30-2000
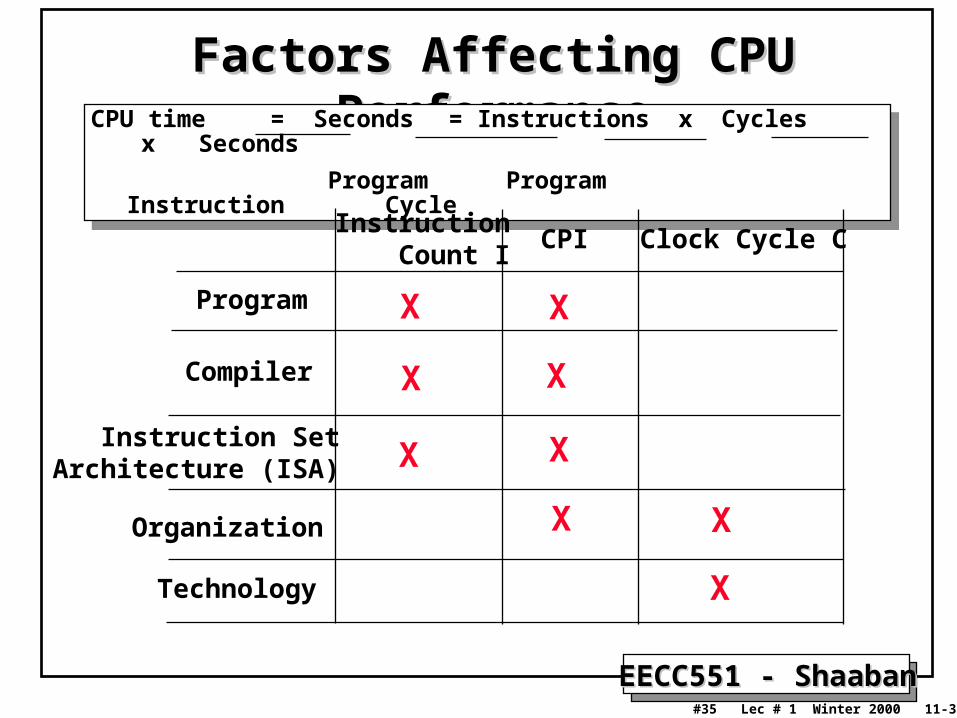
Factors Affecting CPU PerformanceFactors Affecting CPU PerformanceCPU time = Seconds = Instructions x Cycles x
Seconds
Program Program Instruction Cycle
CPU time = Seconds = Instructions x Cycles x Seconds
Program Program Instruction Cycle
CPI Clock Cycle CInstruction Count I
Program
Compiler
Organization
Technology
Instruction SetArchitecture (ISA)
X
X
X
X
X
X
X X
X

EECC551 - ShaabanEECC551 - Shaaban#36 Lec # 1 Winter 2000 11-30-2000
Performance Comparison: ExamplePerformance Comparison: Example• From the previous example: A Program is running on a specific
machine with the following parameters:– Total instruction count: 10,000,000 instructions– Average CPI for the program: 2.5 cycles/instruction.– CPU clock rate: 200 MHz.
• Using the same program with these changes: – A new compiler used: New instruction count 9,500,000
New CPI: 3.0– Faster CPU implementation: New clock rate = 300 MHZ
• What is the speedup with the changes?
Speedup = (10,000,000 x 2.5 x 5x10-9) / (9,500,000 x 3 x 3.33x10-9 ) = .125 / .095 = 1.32
or 32 % faster after changes.
Speedup = Old Execution Time = Iold x CPIold x Clock cycleold
New Execution Time Inew x CPInew x Clock Cyclenew
Speedup = Old Execution Time = Iold x CPIold x Clock cycleold
New Execution Time Inew x CPInew x Clock Cyclenew
EECC551 - ShaabanEECC551 - Shaaban#37 Lec # 1 Winter 2000 11-30-2000
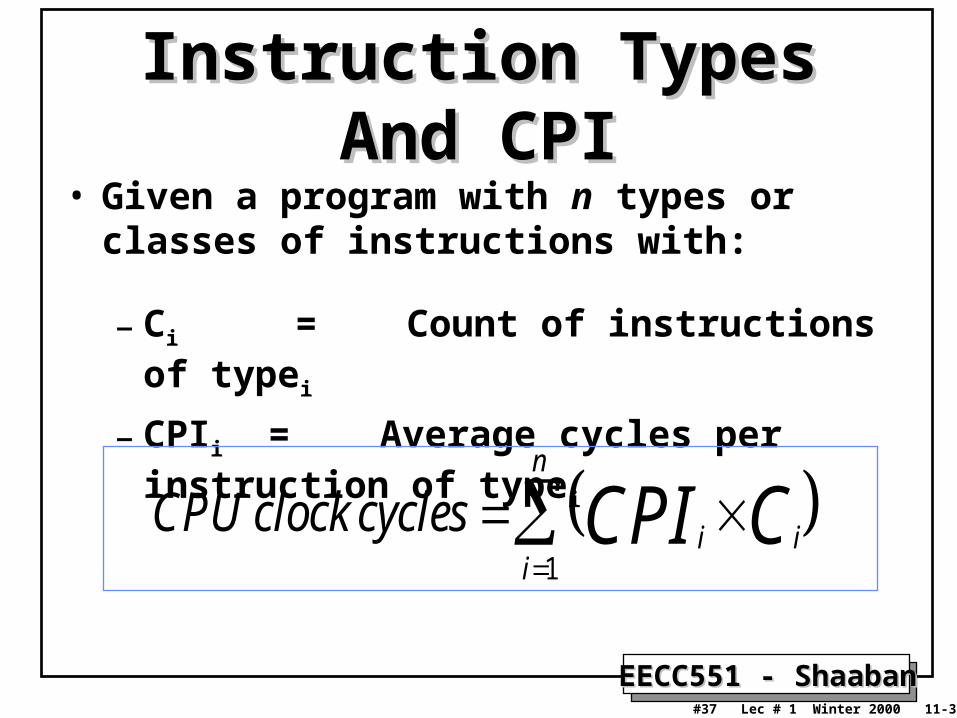
Instruction Types And CPIInstruction Types And CPI• Given a program with n types or classes of
instructions with:
– Ci = Count of instructions of typei
– CPIi = Average cycles per instruction of typei
CPU clock cyclesi i
i
n
CPI C
1

EECC551 - ShaabanEECC551 - Shaaban#38 Lec # 1 Winter 2000 11-30-2000
Instruction Types And CPI: An ExampleInstruction Types And CPI: An Example• An instruction set has three instruction classes:
• Two code sequences have the following instruction counts:
• CPU cycles for sequence 1 = 2 x 1 + 1 x 2 + 2 x 3 = 10 cycles
CPI for sequence 1 = clock cycles / instruction count
= 10 /5 = 2
• CPU cycles for sequence 2 = 4 x 1 + 1 x 2 + 1 x 3 = 9 cycles
CPI for sequence 2 = 9 / 6 = 1.5
Instruction class CPI A 1 B 2 C 3
Instruction counts for instruction classCode Sequence A B C 1 2 1 2 2 4 1 1

EECC551 - ShaabanEECC551 - Shaaban#39 Lec # 1 Winter 2000 11-30-2000
Instruction Frequency & CPIInstruction Frequency & CPI • Given a program with n types or classes of
instructions with the following characteristics:
Ci = Count of instructions of typei
CPIi = Average cycles per instruction of typei
Fi = Frequency of instruction typei
= Ci / total instruction count
Then:
n
iii FCPICPI
1
EECC551 - ShaabanEECC551 - Shaaban#40 Lec # 1 Winter 2000 11-30-2000
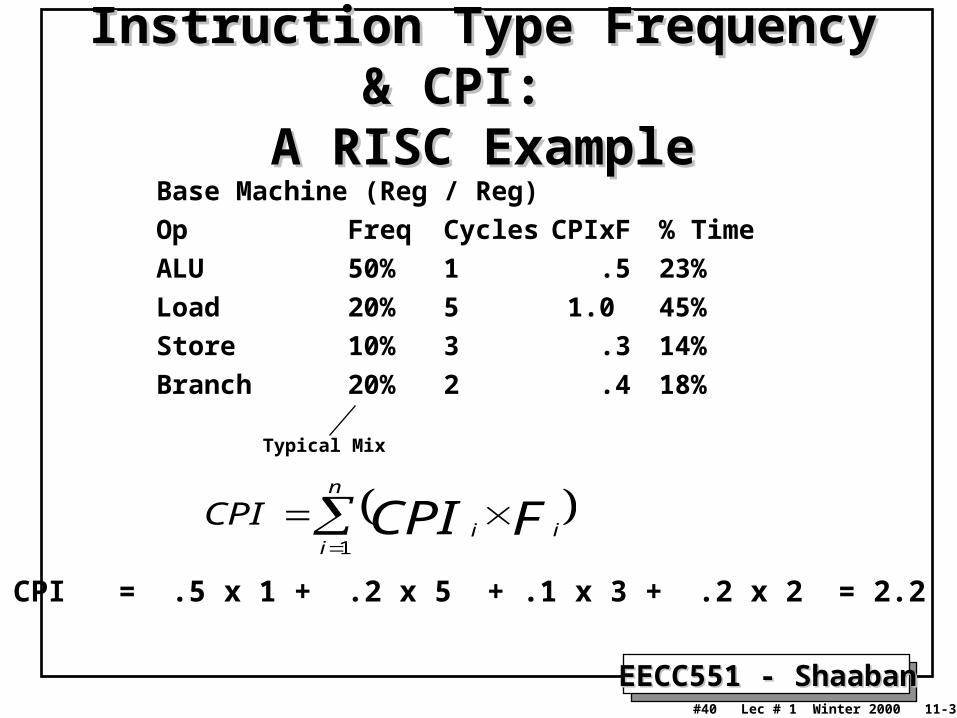
Instruction Type Frequency & CPI: Instruction Type Frequency & CPI: A RISC ExampleA RISC Example
Typical Mix
Base Machine (Reg / Reg)
Op Freq Cycles CPIxF % Time
ALU 50% 1 .5 23%
Load 20% 5 1.0 45%
Store 10% 3 .3 14%
Branch 20% 2 .4 18%
CPI = .5 x 1 + .2 x 5 + .1 x 3 + .2 x 2 = 2.2
n
iii FCPICPI
1

EECC551 - ShaabanEECC551 - Shaaban#41 Lec # 1 Winter 2000 11-30-2000
Metrics of Computer Metrics of Computer PerformancePerformance
Compiler
Programming Language
Application
DatapathControl
Transistors Wires Pins
ISA
Function UnitsCycles per second (clock rate).
Megabytes per second.
Execution time: Target workload,SPEC95, etc.
Each metric has a purpose, and each can be misused.
(millions) of Instructions per second – MIPS(millions) of (F.P.) operations per second – MFLOP/s

EECC551 - ShaabanEECC551 - Shaaban#42 Lec # 1 Winter 2000 11-30-2000
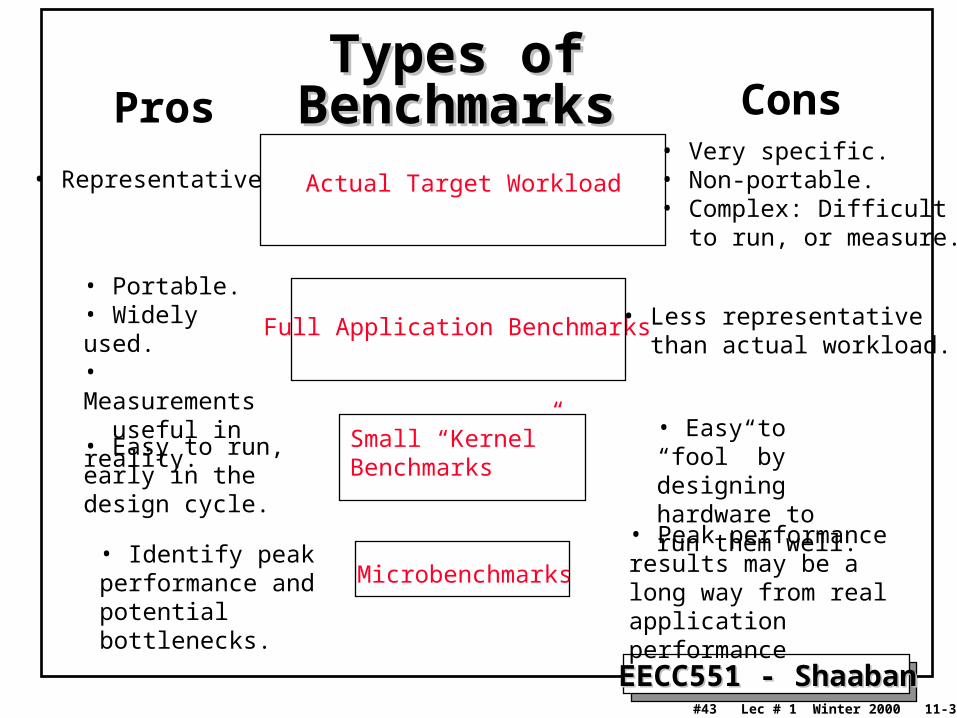
Choosing Programs To Evaluate PerformanceChoosing Programs To Evaluate PerformanceLevels of programs or benchmarks that could be used to evaluate performance:
– Actual Target Workload: Full applications that run on the target machine.
– Real Full Program-based Benchmarks: • Select a specific mix or suite of programs that are typical of
targeted applications or workload (e.g SPEC95).
– Small “Kernel” Benchmarks: • Key computationally-intensive pieces extracted from real
programs.– Examples: Matrix factorization, FFT, tree search, etc.
• Best used to test specific aspects of the machine.
– Microbenchmarks:• Small, specially written programs to isolate a specific aspect of
performance characteristics: Processing: integer, floating point, local memory, input/output, etc.
EECC551 - ShaabanEECC551 - Shaaban#43 Lec # 1 Winter 2000 11-30-2000
Actual Target Workload
Full Application Benchmarks
Small “Kernel” Benchmarks
Microbenchmarks
Pros Cons
• Representative• Very specific.• Non-portable.• Complex: Difficult to run, or measure.
• Portable.• Widely used.• Measurements useful in reality.
• Easy to run, early in the design cycle.
• Identify peak performance and potential bottlenecks.
• Less representative than actual workload.
• Easy to “fool” by designing hardware to run them well.
• Peak performance results may be a long way from real application performance
Types of BenchmarksTypes of Benchmarks
EECC551 - ShaabanEECC551 - Shaaban#44 Lec # 1 Winter 2000 11-30-2000
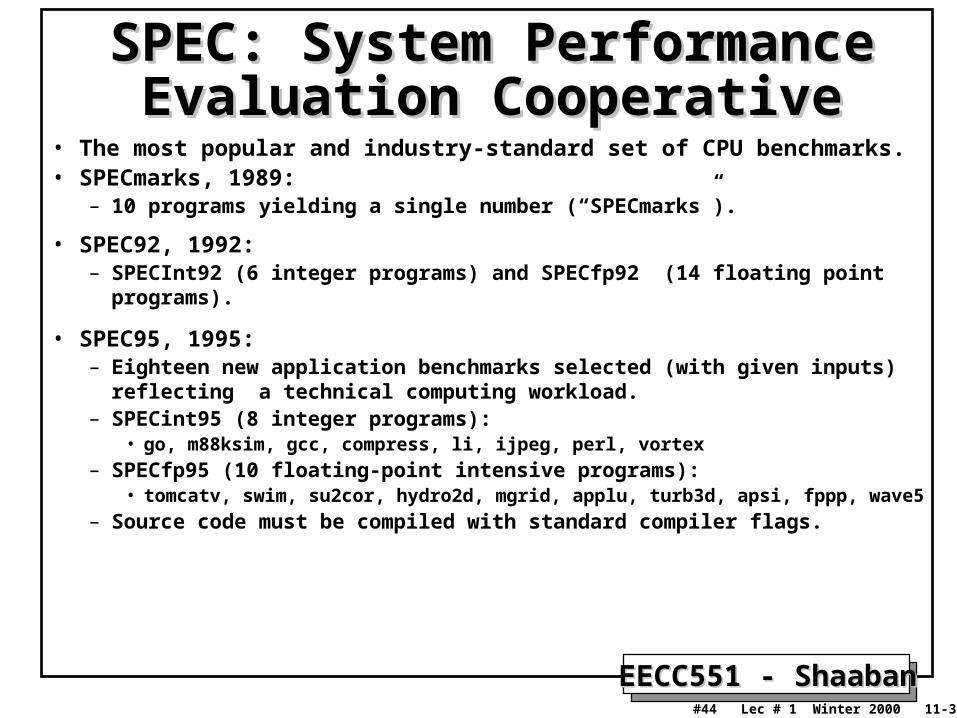
SPEC: System Performance SPEC: System Performance Evaluation CooperativeEvaluation Cooperative
• The most popular and industry-standard set of CPU benchmarks.• SPECmarks, 1989:
– 10 programs yielding a single number (“SPECmarks”).
• SPEC92, 1992:– SPECInt92 (6 integer programs) and SPECfp92 (14 floating point programs).
• SPEC95, 1995:– Eighteen new application benchmarks selected (with given inputs) reflecting a
technical computing workload.– SPECint95 (8 integer programs):
• go, m88ksim, gcc, compress, li, ijpeg, perl, vortex
– SPECfp95 (10 floating-point intensive programs):• tomcatv, swim, su2cor, hydro2d, mgrid, applu, turb3d, apsi, fppp, wave5
– Source code must be compiled with standard compiler flags.

EECC551 - ShaabanEECC551 - Shaaban#45 Lec # 1 Winter 2000 11-30-2000
SPEC95SPEC95Benchmark Description
go Artificial intelligence; plays the game of Gom88ksim Motorola 88k chip simulator; runs test programgcc The Gnu C compiler generating SPARC codecompress Compresses and decompresses file in memoryli Lisp interpreterijpeg Graphic compression and decompressionperl Manipulates strings and prime numbers in the special-purpose programming language Perlvortex A database program
tomcatv A mesh generation programswim Shallow water model with 513 x 513 gridsu2cor quantum physics; Monte Carlo simulationhydro2d Astrophysics; Hydrodynamic Naiver Stokes equationsmgrid Multigrid solver in 3-D potential fieldapplu Parabolic/elliptic partial differential equationstrub3d Simulates isotropic, homogeneous turbulence in a cubeapsi Solves problems regarding temperature, wind velocity, and distribution of pollutantfpppp Quantum chemistrywave5 Plasma physics; electromagnetic particle simulation
Integer
FloatingPoint
EECC551 - ShaabanEECC551 - Shaaban#46 Lec # 1 Winter 2000 11-30-2000
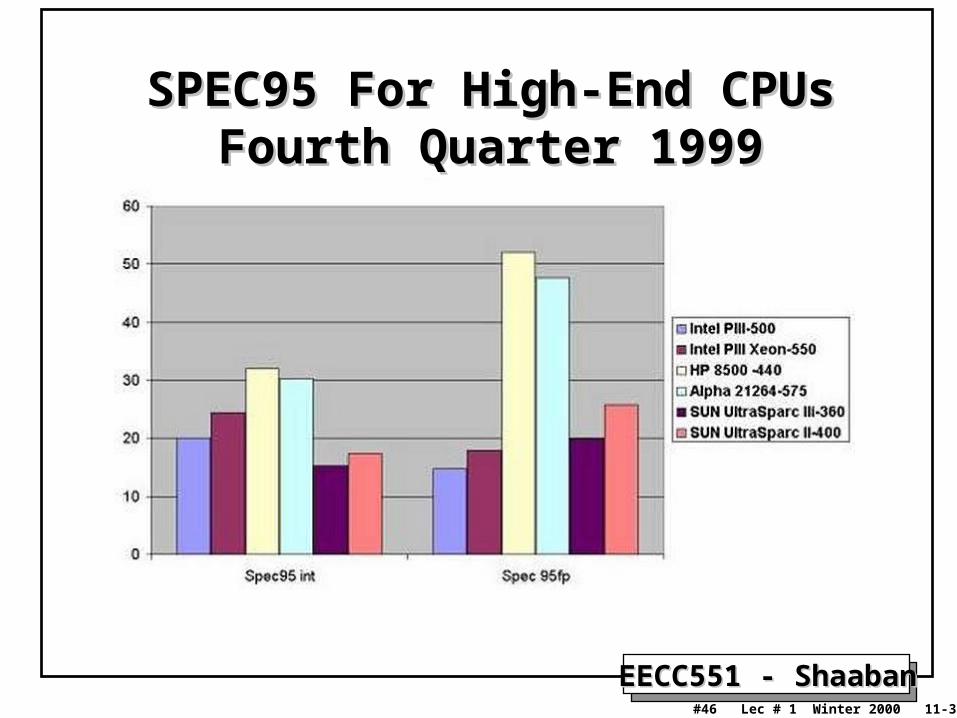
SPEC95 For High-End CPUsSPEC95 For High-End CPUsFourth Quarter 1999Fourth Quarter 1999
EECC551 - ShaabanEECC551 - Shaaban#47 Lec # 1 Winter 2000 11-30-2000
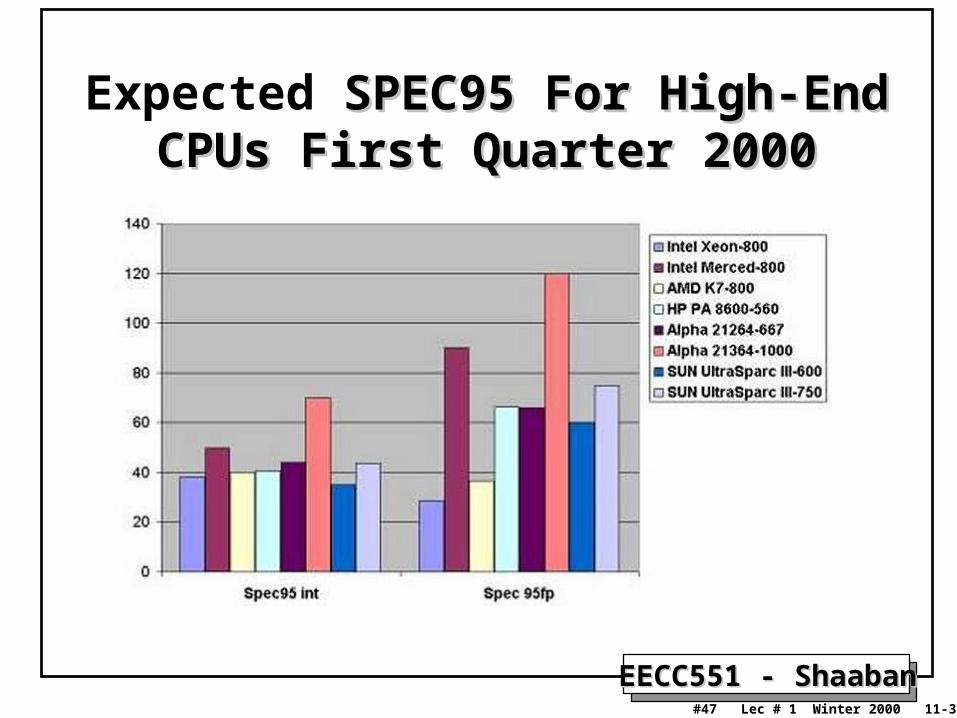
Expected SPEC95 For High-End CPUs SPEC95 For High-End CPUs First Quarter 2000First Quarter 2000
EECC551 - ShaabanEECC551 - Shaaban#48 Lec # 1 Winter 2000 11-30-2000
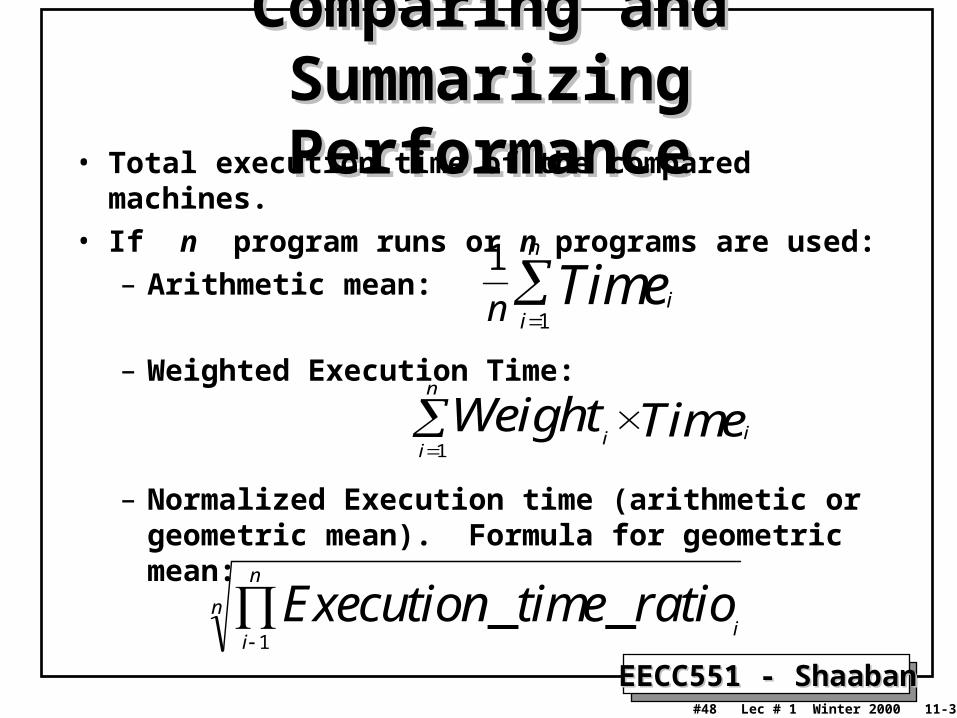
Comparing and Summarizing Comparing and Summarizing PerformancePerformance
• Total execution time of the compared machines.
• If n program runs or n programs are used:
– Arithmetic mean:
– Weighted Execution Time:
– Normalized Execution time (arithmetic or geometric mean). Formula for geometric mean:
ii
n
iWeight Time
1
1
1n ii
n
Time
ii
n
n Execution time ratio_ _
1
EECC551 - ShaabanEECC551 - Shaaban#49 Lec # 1 Winter 2000 11-30-2000
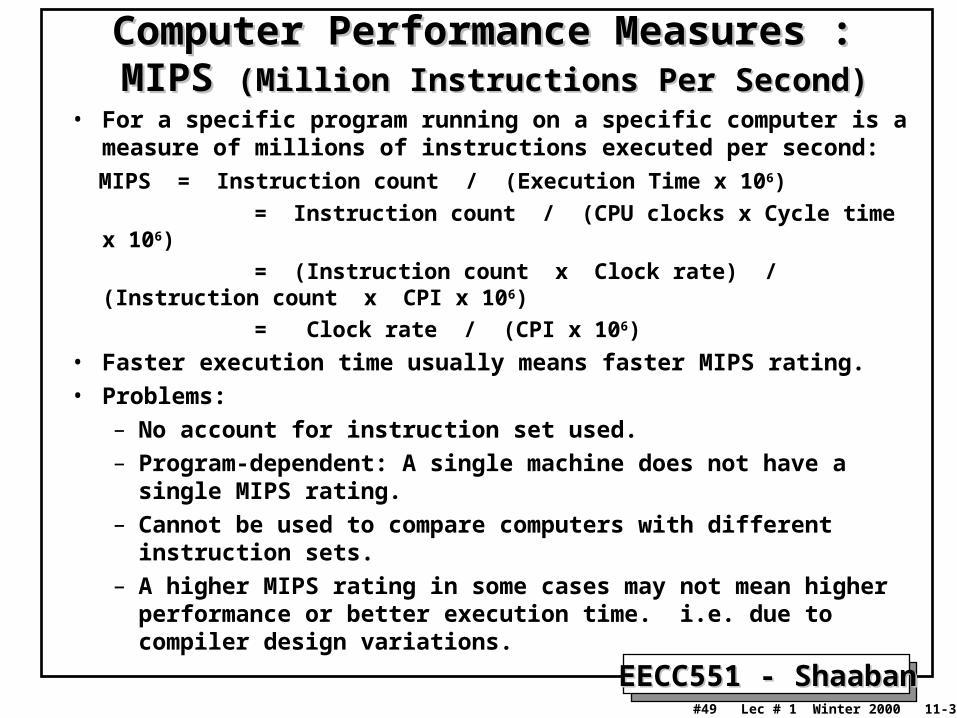
Computer Performance Measures :Computer Performance Measures : MIPS MIPS (Million Instructions Per Second)(Million Instructions Per Second)
• For a specific program running on a specific computer is a measure of millions of instructions executed per second:
MIPS = Instruction count / (Execution Time x 106)
= Instruction count / (CPU clocks x Cycle time x 106)
= (Instruction count x Clock rate) / (Instruction count x CPI x 106)
= Clock rate / (CPI x 106)
• Faster execution time usually means faster MIPS rating.
• Problems:
– No account for instruction set used.
– Program-dependent: A single machine does not have a single MIPS rating.
– Cannot be used to compare computers with different instruction sets.
– A higher MIPS rating in some cases may not mean higher performance or better execution time. i.e. due to compiler design variations.
EECC551 - ShaabanEECC551 - Shaaban#50 Lec # 1 Winter 2000 11-30-2000
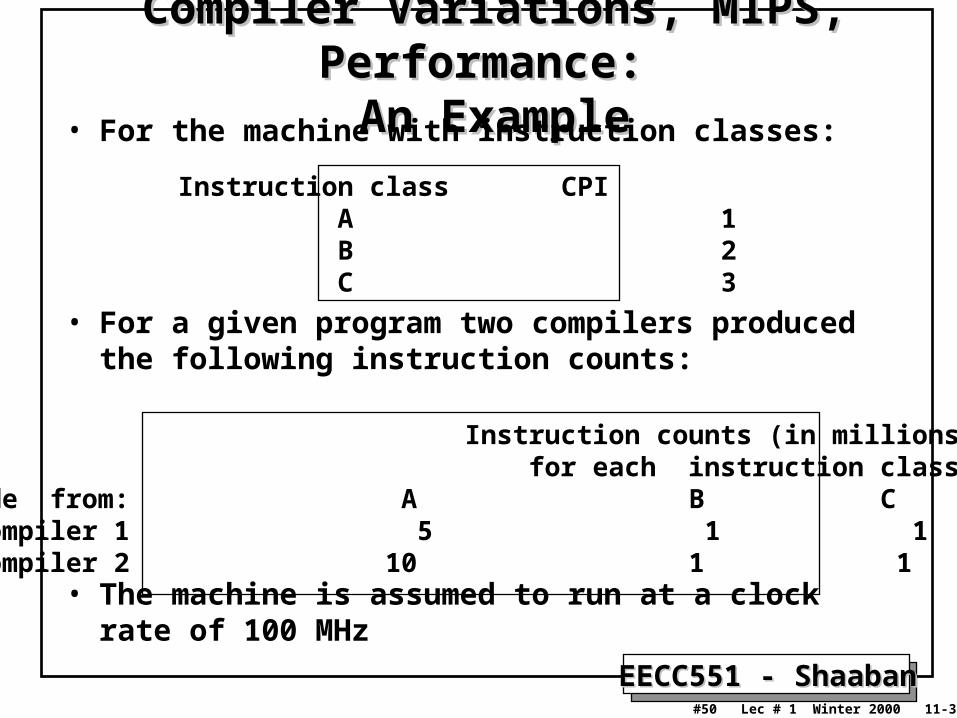
Compiler Variations, MIPS, Performance: Compiler Variations, MIPS, Performance:
An ExampleAn Example• For the machine with instruction classes:
• For a given program two compilers produced the following instruction counts:
• The machine is assumed to run at a clock rate of 100 MHz
Instruction class CPI A 1 B 2 C 3
Instruction counts (in millions) for each instruction class Code from: A B C Compiler 1 5 1 1 Compiler 2 10 1 1

EECC551 - ShaabanEECC551 - Shaaban#51 Lec # 1 Winter 2000 11-30-2000
Compiler Variations, MIPS, Performance: Compiler Variations, MIPS, Performance: An Example (Continued)An Example (Continued)
MIPS = Clock rate / (CPI x 106) = 100 MHz / (CPI x 106)
CPI = CPU execution cycles / Instructions count
CPU time = Instruction count x CPI / Clock rate
• For compiler 1:
– CPI1 = (5 x 1 + 1 x 2 + 1 x 3) / (5 + 1 + 1) = 10 / 7 = 1.43
– MIP1 = 100 / (1.428 x 10⁶) = 70.0
– CPU time1 = ((5 + 1 + 1) x 106 x 1.43) / (100 x 106) = 0.10 seconds
• For compiler 2:
– CPI2 = (10 x 1 + 1 x 2 + 1 x 3) / (10 + 1 + 1) = 15 / 12 = 1.25
– MIP2 = 100 / (1.25 x 10⁶) = 80.0
– CPU time2 = ((10 + 1 + 1) x 106 x 1.25) / (100 x 106) = 0.15 seconds
CPU clock cyclesi i
i
n
CPI C
1

EECC551 - ShaabanEECC551 - Shaaban#52 Lec # 1 Winter 2000 11-30-2000
Computer Performance Measures :Computer Performance Measures : MFOLPS MFOLPS (Million FLOating-Point Operations Per Second)
• A floating-point operation is an addition, subtraction, multiplication, or division operation applied to numbers represented by a single or double precision floating-point representation.
• MFLOPS, for a specific program running on a specific computer, is a measure of millions of floating point-operation (megaflops) per second:
MFLOPS = Number of floating-point operations / (Execution time x 106 )
• A better comparison measure between different machines than MIPS.
• Program-dependent: Different programs have different percentages of floating-point operations present. i.e compilers have no such operations and yield a MFLOPS rating of zero.
• Dependent on the type of floating-point operations present in the program.
EECC551 - ShaabanEECC551 - Shaaban#53 Lec # 1 Winter 2000 11-30-2000
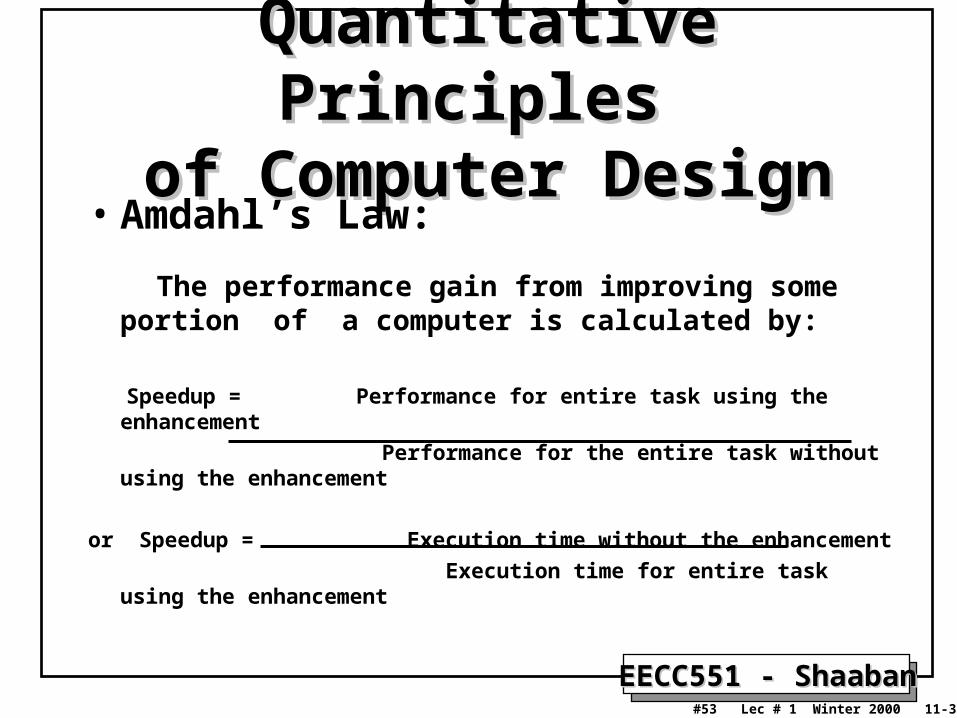
Quantitative Principles Quantitative Principles of Computer Designof Computer Design
• Amdahl’s Law:
The performance gain from improving some portion of a computer is calculated by:
Speedup = Performance for entire task using the enhancement
Performance for the entire task without using the enhancement
or Speedup = Execution time without the enhancement
Execution time for entire task using the enhancement

EECC551 - ShaabanEECC551 - Shaaban#54 Lec # 1 Winter 2000 11-30-2000
Performance Enhancement Calculations:Performance Enhancement Calculations: Amdahl's Law Amdahl's Law
• The performance enhancement possible due to a given design improvement is limited by the amount that the improved feature is used
• Amdahl’s Law:
Performance improvement or speedup due to enhancement E: Execution Time without E Performance with E Speedup(E) = -------------------------------------- = --------------------------------- Execution Time with E Performance without E
– Suppose that enhancement E accelerates a fraction F of the execution time by a factor S and the remainder of the time is unaffected then:
Execution Time with E = ((1-F) + F/S) X Execution Time without E
Hence speedup is given by:
Execution Time without E 1Speedup(E) = --------------------------------------------------------- = --------------------
((1 - F) + F/S) X Execution Time without E (1 - F) + F/S

EECC551 - ShaabanEECC551 - Shaaban#55 Lec # 1 Winter 2000 11-30-2000
Pictorial Depiction of Amdahl’s LawPictorial Depiction of Amdahl’s Law
Before: Execution Time without enhancement E:
Unaffected, fraction: (1- F)
After: Execution Time with enhancement E:
Enhancement E accelerates fraction F of execution time by a factor of S
Affected fraction: F
Unaffected, fraction: (1- F) F/S
Unchanged
Execution Time without enhancement E 1Speedup(E) = ------------------------------------------------------ = ------------------ Execution Time with enhancement E (1 - F) + F/S
EECC551 - ShaabanEECC551 - Shaaban#56 Lec # 1 Winter 2000 11-30-2000
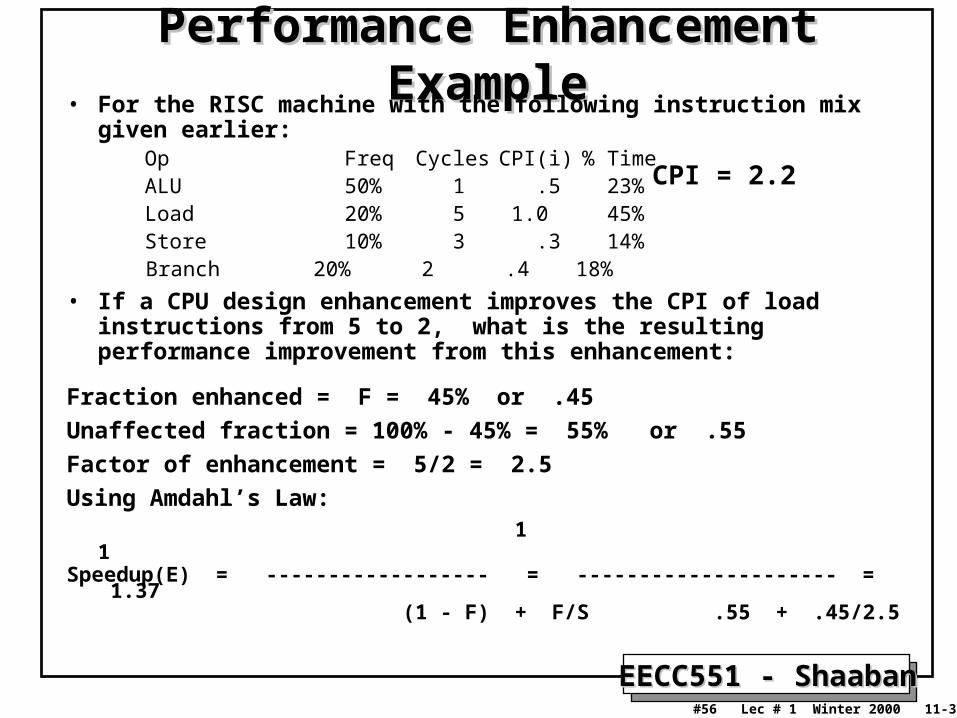
Performance Enhancement ExamplePerformance Enhancement Example• For the RISC machine with the following instruction mix given
earlier:Op Freq Cycles CPI(i) % TimeALU 50% 1 .5 23%Load 20% 5 1.0 45%Store 10% 3 .3 14%
Branch 20% 2 .4 18%
• If a CPU design enhancement improves the CPI of load instructions from 5 to 2, what is the resulting performance improvement from this enhancement:
Fraction enhanced = F = 45% or .45
Unaffected fraction = 100% - 45% = 55% or .55
Factor of enhancement = 5/2 = 2.5
Using Amdahl’s Law: 1 1Speedup(E) = ------------------ = --------------------- = 1.37 (1 - F) + F/S .55 + .45/2.5
CPI = 2.2

EECC551 - ShaabanEECC551 - Shaaban#57 Lec # 1 Winter 2000 11-30-2000
An Alternative Solution Using CPU An Alternative Solution Using CPU EquationEquation
Op Freq Cycles CPI(i) % TimeALU 50% 1 .5 23%Load 20% 5 1.0 45%Store 10% 3 .3 14%
Branch 20% 2 .4 18%
• If a CPU design enhancement improves the CPI of load instructions from 5 to 2, what is the resulting performance improvement from this enhancement:
Old CPI = 2.2
New CPI = .5 x 1 + .2 x 2 + .1 x 3 + .2 x 2 = 1.6
Original Execution Time Instruction count x old CPI x clock cycleSpeedup(E) = ----------------------------------- = ---------------------------------------------------------------- New Execution Time Instruction count x new CPI x clock cycle
old CPI 2.2= ------------ = --------- = 1.37
new CPI 1.6
Which is the same speedup obtained from Amdahl’s Law in the first solution.
CPI = 2.2

EECC551 - ShaabanEECC551 - Shaaban#58 Lec # 1 Winter 2000 11-30-2000
Performance Enhancement ExamplePerformance Enhancement Example• A program runs in 100 seconds on a machine with multiply operations
responsible for 80 seconds of this time. By how much must the speed of multiplication be improved to make the program four times faster?
100 Desired speedup = 4 = ----------------------------------------------------- Execution Time with enhancement
Execution time with enhancement = 25 seconds
25 seconds = (100 - 80 seconds) + 80 seconds / n
25 seconds = 20 seconds + 80 seconds / n
5 = 80 seconds / n
n = 80/5 = 16
Hence multiplication should be 16 times faster to get a speedup of 4.

EECC551 - ShaabanEECC551 - Shaaban#59 Lec # 1 Winter 2000 11-30-2000
Performance Enhancement ExamplePerformance Enhancement Example
• For the previous example with a program running in 100 seconds on a machine with multiply operations responsible for 80 seconds of this time. By how much must the speed of multiplication be improved to make the program five times faster?
100Desired speedup = 5 = ----------------------------------------------------- Execution Time with enhancement
Execution time with enhancement = 20 seconds
20 seconds = (100 - 80 seconds) + 80 seconds / n
20 seconds = 20 seconds + 80 seconds / n
0 = 80 seconds / n
No amount of multiplication speed improvement can achieve this.

EECC551 - ShaabanEECC551 - Shaaban#60 Lec # 1 Winter 2000 11-30-2000
Extending Amdahl's Law To Multiple EnhancementsExtending Amdahl's Law To Multiple Enhancements
• Suppose that enhancement Ei accelerates a fraction Fi of the execution time by a factor Si and the remainder of the time is unaffected then:
i ii
ii
XSFF
Speedup
Time Execution Original)1
Time Execution Original
)((
i ii
ii S
FFSpeedup
)( )1
1
(
Note: All fractions refer to original execution time.

EECC551 - ShaabanEECC551 - Shaaban#61 Lec # 1 Winter 2000 11-30-2000
Amdahl's Law With Multiple Enhancements: Amdahl's Law With Multiple Enhancements: ExampleExample
• Three CPU performance enhancements are proposed with the following speedups and percentage of the code execution time affected:
Speedup1 = S1 = 10 Percentage1 = F1 = 20%
Speedup2 = S2 = 15 Percentage1 = F2 = 15%
Speedup3 = S3 = 30 Percentage1 = F3 = 10%
• While all three enhancements are in place in the new design, each enhancement affects a different portion of the code and only one enhancement can be used at a time.
• What is the resulting overall speedup?
• Speedup = 1 / [(1 - .2 - .15 - .1) + .2/10 + .15/15 + .1/30)] = 1 / [ .55 + .0333 ] = 1 / .5833 = 1.71
i ii
ii S
FFSpeedup
)( )1
1
(
EECC551 - ShaabanEECC551 - Shaaban#62 Lec # 1 Winter 2000 11-30-2000
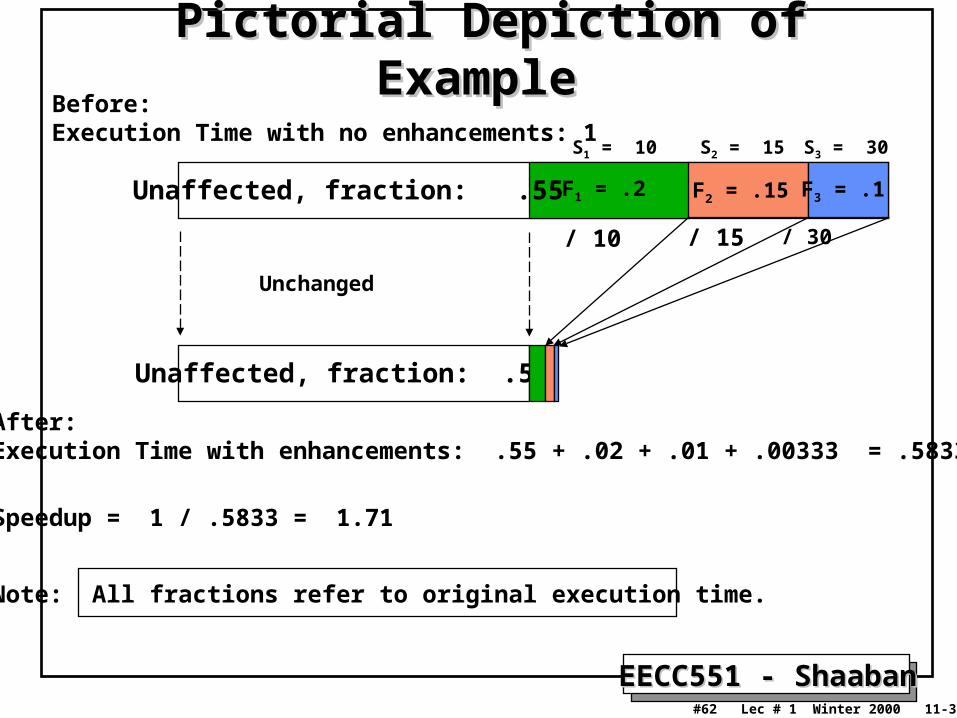
Pictorial Depiction of ExamplePictorial Depiction of Example Before: Execution Time with no enhancements: 1
After: Execution Time with enhancements: .55 + .02 + .01 + .00333 = .5833
Speedup = 1 / .5833 = 1.71
Note: All fractions refer to original execution time.
Unaffected, fraction: .55
Unchanged
Unaffected, fraction: .55 F1 = .2 F2 = .15 F3 = .1
S1 = 10 S2 = 15 S3 = 30
/ 10 / 30/ 15