通貨選択シリーズ<トルコリラコース> (毎月分配型)...2015/12/18 · 品...
TRANSCRIPT

品 名:01_90003_250836_076_04_三菱UFJ 新興国債券ファンド 通貨選択シリーズ<トルコリラコース>(毎月分配型)_607082.docx
日 時:2015/12/2 18:09:00
ページ:1
250836
当ファンドの仕組みは次の通りです。 商品分類 追加型投信/海外/債券
信託期間 2019年4月20日まで(2009年4月28日設定)
運用方針
主として円建ての外国投資信託であるピムコケイマン エマージング ボンド ファンドB - クラス J (TRY)の投資信託証券への投資を通じて、米ドル建ての新興経済国の政府および政府機関等の発行する債券等に実質的な投資を行います。また、当該外国投資信託への投資を通じて、実質的な保有外貨建て資産に対し、米ドル売り、トルコリラ買いの為替取引を行います(このため、基準価額はトルコリラの対円での為替変動の影響を受けます。)。なお、証券投資信託であるマネー・マーケット・マザーファンドの投資信託証券への投資も行います。投資信託証券への運用の指図に関する権限は、ピムコジャパンリミテッドに委託します。
主要運用対象
三菱UFJ 新興国債券ファンド 通貨選択シリーズ <トルコリラコース> ( 毎 月 分 配 型 )
ピムコ ケイマン エマージング ボンド ファンド B -クラス J (TRY)およびマネー・マーケット・マザーファンドの投資信託証券を主要投資対象とします。
ピムコ ケイマン エ マ ー ジ ン グ ボンド ファンド B - クラス J (TRY)
ピムコ ケイマン エマージング ボンド ファンド (M)への投資を通じて、新興経済国の政府、政府機関等が発行もしくは信用保証する米ドル建ての債券およびその派生商品等を主要投資対象とします。
マ ネ ー ・ マ ー ケ ッ ト ・ マザーファンド
わが国の公社債等を主要投資対象とします。 外貨建資産への投資は行いません。
主な組入制限 投資信託証券への投資割合に制限を設けません。外貨建資産への直接投資は行いません。
分配方針
経費等控除後の配当等収益および売買益(評価益を含みます。)等の全額を分配対象額とし、分配金額は、基準価額水準、市況動向等を勘案して委託会社が決定します。ただし、分配対象収益が少額の場合には分配を行わないことがあります。
※ 当ファンドは、課税上、株式投資信託として取り扱われます。 ※ 公募株式投資信託は税法上、少額投資非課税制度「NISA(ニーサ)」
の適用対象です。 詳しくは販売会社にお問い合わせください。
運用報告書(全体版)
三菱UFJ 新興国債券ファンド 通貨選択シリーズ<トルコリラコース>
(毎月分配型)
第71期(決算日:2015年5月20日)
第72期(決算日:2015年6月22日)
第73期(決算日:2015年7月21日)
第74期(決算日:2015年8月20日)
第75期(決算日:2015年9月24日)
第76期(決算日:2015年10月20日)
受益者のみなさまへ
平素は格別のご愛顧を賜り厚く御礼申し上げます。 さて、お手持ちの「三菱UFJ 新興国債券ファン
ド 通貨選択シリーズ<トルコリラコース>(毎月分配型)」は、去る10月20日に第76期の決算を行いましたので、法令に基づいて第71期~第76期の運用状況をまとめてご報告申し上げます。
今後とも引き続きお引き立て賜りますようお願い申し上げます。
三菱UFJ投信株式会社は2015年7月1日に国際投信投資顧問株式会社と合併し、「三菱UFJ国際投信株式会社」となりました。

品 名:01_90003_250836_076_04_三菱UFJ 新興国債券ファンド 通貨選択シリーズ<トルコリラコース>(毎月分配型)_607082.docx
日 時:2015/12/2 18:09:00
ページ:2
◆目 次
三菱UFJ 新興国債券ファンド 通貨選択シリーズ<トルコリラコース>(毎月分配型)のご報告
◇ 近 30期の運用実績 ············································ 1
◇当作成期中の基準価額と市況等の推移······························ 2
◇運用経過 ······················································· 3
◇今後の運用方針 ················································· 7
◇1万口当たりの費用明細 ········································· 8
◇売買及び取引の状況 ············································· 8
◇利害関係人との取引状況等 ······································· 9
◇組入資産の明細 ················································· 9
◇投資信託財産の構成 ············································· 10
◇資産、負債、元本及び基準価額の状況······························ 10
◇損益の状況 ····················································· 11
◇分配金のお知らせ ··············································· 12
◇お知らせ ······················································· 12
投資対象ファンドのご報告
◇ピムコ ケイマン エマージング ボンド ファンド B - クラス J (TRY) ···· 14
◇マネー・マーケット・マザーファンド······························ 29

品 名:01_90003_250836_076_04_三菱UFJ 新興国債券ファンド 通貨選択シリーズ<トルコリラコース>(毎月分配型)_607082.docx
日 時:2015/12/2 18:09:00
ページ:1
― 1 ―
三菱UFJ 新興国債券ファンド 通貨選択シリーズ<トルコリラコース>(毎月分配型)
本資料 の表記にあたって
・原則として、各表の数量、金額の単位未満は切捨て、比率は四捨五入で表記しておりますので、表中の個々の数字の合計が合計欄の値とは一致しないことがあります。ただし、単位未満の数値については小数を表記する場合があります。
・-印は組入れまたは売買がないことを示しています。
○ 近30期の運用実績
決 算 期 基 準 価 額
債 券組 入 比 率
債 券先 物 比 率
投 資 信 託 証 券 組 入 比 率
純 資 産総 額(分配落)
税 込 み分 配 金
期 中騰 落 率
円 円 % % % % 百万円47期(2013年5月20日) 9,455 120 2.3 0.1 - 98.9 40,006
48期(2013年6月20日) 7,951 120 △14.6 0.1 - 99.0 36,08249期(2013年7月22日) 8,083 120 3.2 0.1 - 99.0 34,97450期(2013年8月20日) 7,491 120 △ 5.8 0.1 - 99.0 31,11251期(2013年9月20日) 7,635 120 3.5 0.1 - 99.0 27,29652期(2013年10月21日) 7,478 120 △ 0.5 0.1 - 99.2 24,72653期(2013年11月20日) 7,302 120 △ 0.7 0.1 - 99.6 22,64454期(2013年12月20日) 7,282 120 1.4 0.1 - 99.1 20,08255期(2014年1月20日) 6,774 120 △ 5.3 0.1 - 99.1 17,67256期(2014年2月20日) 6,612 120 △ 0.6 0.1 - 99.2 16,18657期(2014年3月20日) 6,446 120 △ 0.7 0.1 - 99.1 14,66458期(2014年4月21日) 6,880 120 8.6 0.1 - 99.5 14,68859期(2014年5月20日) 6,953 120 2.8 0.1 - 99.3 14,29560期(2014年6月20日) 6,913 120 1.2 0.1 - 98.2 13,86061期(2014年7月22日) 6,851 120 0.8 0.1 - 99.2 13,37762期(2014年8月20日) 6,758 120 0.4 0.1 - 99.5 12,82463期(2014年9月22日) 6,787 120 2.2 0.1 - 99.1 12,46564期(2014年10月20日) 6,532 120 △ 2.0 0.1 - 99.5 11,01265期(2014年11月20日) 7,112 120 10.7 0.1 - 99.2 11,01166期(2014年12月22日) 6,679 120 △ 4.4 0.1 - 99.4 9,85267期(2015年1月20日) 6,435 120 △ 1.9 0.1 - 99.5 9,36368期(2015年2月20日) 6,217 120 △ 1.5 0.1 - 99.2 8,69969期(2015年3月20日) 5,788 120 △ 5.0 0.2 - 99.5 7,56570期(2015年4月20日) 5,646 120 △ 0.4 0.1 - 99.5 7,202
71期(2015年5月20日) 5,858 120 5.9 0.1 - 99.5 7,33872期(2015年6月22日) 5,593 120 △ 2.5 0.1 - 99.2 6,87673期(2015年7月21日) 5,609 120 2.4 0.1 - 99.5 6,74574期(2015年8月20日) 4,993 90 △ 9.4 0.1 - 99.0 5,80175期(2015年9月24日) 4,557 90 △ 6.9 0.1 - 99.5 5,04776期(2015年10月20日) 4,756 90 6.3 0.1 - 99.5 5,071
(注) 当ファンドの基準価額は、投資対象とする投資信託証券については、前営業日の基準価額を基に計算しております。 (注) 基準価額の騰落率は分配金込み。 (注) 三菱UFJ 新興国債券ファンド 通貨選択シリーズは、米ドル建ての新興経済国の政府および政府機関等の発行する債券等に実質的な
投資を行うとともに、米ドルに対し各ファンド(米ドルコースを除く)の対象通貨で為替取引を行うことで、投資信託財産の成長と収益の確保をめざすことを目標としておりますが、特定の指数を上回るまたは連動をめざした運用を行っていないため、また、値動きを表す適切な指数が存在しないため、ベンチマークおよび参考指数はありません。
(注) 当ファンドは親投資信託を組み入れますので、「債券組入比率」、「債券先物比率」は実質比率を記載しております。 (注) 「債券先物比率」は買建比率-売建比率。

品 名:01_90003_250836_076_04_三菱UFJ 新興国債券ファンド 通貨選択シリーズ<トルコリラコース>(毎月分配型)_607082.docx
日 時:2015/12/2 18:09:00
ページ:2
― 2 ―
三菱UFJ 新興国債券ファンド 通貨選択シリーズ<トルコリラコース>(毎月分配型)
○当作成期中の基準価額と市況等の推移
決 算 期 年 月 日 基 準 価 額 債 券
組 入 比 率債 券 先 物 比 率
投 資 信 託証 券組 入 比 率 騰 落 率
第71期
(期 首) 円 % % % %
2015年4月20日 5,646 - 0.1 - 99.5
4月末 5,769 2.2 0.1 - 99.3
(期 末)
2015年5月20日 5,978 5.9 0.1 - 99.5
第72期
(期 首)
2015年5月20日 5,858 - 0.1 - 99.5
5月末 5,899 0.7 0.1 - 99.3
(期 末)
2015年6月22日 5,713 △2.5 0.1 - 99.2
第73期
(期 首)
2015年6月22日 5,593 - 0.1 - 99.2
6月末 5,598 0.1 0.1 - 99.5
(期 末)
2015年7月21日 5,729 2.4 0.1 - 99.5
第74期
(期 首)
2015年7月21日 5,609 - 0.1 - 99.5
7月末 5,416 △3.4 0.1 - 99.3
(期 末)
2015年8月20日 5,083 △9.4 0.1 - 99.0
第75期
(期 首)
2015年8月20日 4,993 - 0.1 - 99.0
8月末 4,890 △2.1 0.1 - 99.1
(期 末)
2015年9月24日 4,647 △6.9 0.1 - 99.5
第76期
(期 首)
2015年9月24日 4,557 - 0.1 - 99.5
9月末 4,438 △2.6 0.1 - 99.5
(期 末)
2015年10月20日 4,846 6.3 0.1 - 99.5
(注) 当ファンドの基準価額は、投資対象とする投資信託証券については、前営業日の基準価額を基に計算しております。
(注) 期末基準価額は分配金込み、騰落率は期首比。
(注) 当ファンドは親投資信託を組み入れますので、「債券組入比率」、「債券先物比率」は実質比率を記載しております。
(注) 「債券先物比率」は買建比率-売建比率。

1
の基準価額等の推移 71 76 2015/ /21 2015/10/20
5.1
ン ンン コ
ン
基準価額の
ン
ト コ
71 5 64676 4 756
6305.1
0
6,000
12,000
18,000
24,000
30,000
4,000
4,500
5,000
5,500
6,000
6,500
2015/ /20 2015/ /19 2015/ /17 2015/10/16
基準価額等の推移
5_15157316_02_ 7 _ ト コ コ _ _ .indd 1 2015/11/25 17:25:00
― 3 ―
02_607082_コメント.indd 3 2015/12/11 13:25:37

4
71 76 2015/ /21 2015/10/20
2015
ン
ン
10
2015
ン
ン
2015ト コ
ト コ
ト コ
ンン
ンン
ンン
94
96
98
100
102
2015/ /17 2015/ /18 2015/ /14 2015/10/15
ン
の推移
85
90
95
100
105
110
2015/ /17 2015/ /18 2015/ /14 2015/10/15
ト ト コ
の推移
5_15157316_02_ 7 _ ト コ コ _ _ .indd 4 2015/11/25 17:25:00
― 4 ―
02_607082_コメント.indd 4 2015/12/11 13:25:37

5
コ ト2015 10 20 コ ト 0.076
の
ン ト コ コン コ ン ン ン
ン ント ン
ント コ
コ ン ン ン ン4.4
ト コ
コ トト コ
ト コト コ
ト ン0.01
コ ン
5_15157316_02_ 7 _ ト コ コ _ _ .indd 5 2015/11/25 17:25:00
― 5 ―
02_607082_コメント.indd 5 2015/12/11 13:25:38

6
の の
ン ン
コ
ン
ン
71 72 73 74 75 76
2015 212015 20
2015 212015 22
2015 232015 21
2015 222015 20
2015 212015 24
2015 252015 10 20
120 120 120 90 90 90
2.007 2.100 2.095 1.771 1.937 1.857
67 60 66 59 50 59
53 60 54 30 40 30
994 934 880 850 810 780
ン
5_15157316_02_ 7 _ ト コ コ _ _ .indd 6 2015/11/25 17:25:00
― 6 ―
02_607082_コメント.indd 6 2015/12/11 13:25:38

7
の
ン ト コ コ
ント ン
コ ン ン ン ン
ン
ン メンン
ン
ンン メン
ンメン ン ン ン
ト コ
ト ン
5_15157316_02_ 7 _ ト コ コ _ _ .indd 7 2015/11/25 17:25:01
― 7 ―
02_607082_コメント.indd 7 2015/12/11 13:25:39

品 名:03_90003_250836_076_04_三菱UFJ 新興国債券ファンド 通貨選択シリーズ<トルコリラコース>(毎月分配型)_607082.docx
日 時:2015/12/2 18:14:00
ページ:8
― 8 ―
三菱UFJ 新興国債券ファンド 通貨選択シリーズ<トルコリラコース>(毎月分配型)
○1万口当たりの費用明細 (2015年4月21日~2015年10月20日)
項 目 第71期~第76期
項 目 の 概 要 金 額 比 率
円 %
(a) 信 託 報 酬 44 0.821 (a)信託報酬=作成期中の平均基準価額×信託報酬率
( 投 信 会 社 ) (27) (0.502) ファンドの運用・調査、受託会社への運用指図、基準価額の算出、目論見書等の作成等の対価
( 販 売 会 社 ) (16) (0.297) 分配金・償還金・換金代金支払等の事務手続き、交付運用報告書等の送付、購入後の説明・情報提供等の対価
( 受 託 会 社 ) ( 1) (0.022) 投資信託財産の保管・管理、運用指図の実行等の対価
(b) そ の 他 費 用 0 0.002 (b)その他費用=作成期中のその他費用÷作成期中の平均受益権口数
( 監 査 費 用 ) ( 0) (0.002) ファンドの決算時等に監査法人から監査を受けるための費用
合 計 44 0.823
作成期中の平均基準価額は、5,335円です。
(注) 作成期間の費用(消費税等のかかるものは消費税等を含む)は、追加・解約により受益権口数に変動があるため、簡便法により算出し
た結果です。
(注) 消費税は報告日の税率を採用しています。
(注) 各金額は項目ごとに円未満は四捨五入してあります。
(注) その他費用は、このファンドが組み入れている親投資信託が支払った金額のうち、当ファンドに対応するものを含みます。
(注) 各項目の費用は、このファンドが組み入れている投資信託証券(マザーファンドを除く。)が支払った費用を含みません。
(注) 各比率は1万口当たりのそれぞれの費用金額(円未満の端数を含む)を作成期間の平均基準価額で除して100を乗じたもので、項目ご
とに小数第3位未満は四捨五入してあります。
○売買及び取引の状況 (2015年4月21日~2015年10月20日)
銘 柄 第71期~第76期
買 付 売 付 口 数 金 額 口 数 金 額
国 内
千口 千円 千口 千円
ピムコ ケイマン エマージング ボンドファンド B - クラス J (TRY)
73 512,056 279 1,916,000
(注) 金額は受渡代金。
投資信託証券

品 名:03_90003_250836_076_04_三菱UFJ 新興国債券ファンド 通貨選択シリーズ<トルコリラコース>(毎月分配型)_607082.docx
日 時:2015/12/2 18:14:00
ページ:9
― 9 ―
三菱UFJ 新興国債券ファンド 通貨選択シリーズ<トルコリラコース>(毎月分配型)
銘 柄 第71期~第76期
設 定 解 約 口 数 金 額 口 数 金 額
千口 千円 千口 千円マネー・マーケット・マザーファンド - - 2,710 2,760
○利害関係人との取引状況等 (2015年4月21日~2015年10月20日)
<三菱UFJ 新興国債券ファンド 通貨選択シリーズ<トルコリラコース>(毎月分配型)>
該当事項はございません。
<マネー・マーケット・マザーファンド>
区 分
第71期~第76期
買付額等 A
売付額等
C
うち利害関係人との取引状況B
BA
うち利害関係人との取引状況D
DC
百万円 百万円 % 百万円 百万円 %公社債 30,856 14,199 46.0 4,100 2,100 51.2
現先取引(公社債) 89,007 11,003 12.4 87,006 11,003 12.6
平均保有割合 0.1% ※平均保有割合とは、親投資信託の残存口数の合計に対する当該ベビーファンドの親投資信託所有口数の割合。
(注) 公社債には現先などによるものを含みません。
利害関係人とは、投資信託及び投資法人に関する法律第11条第1項に規定される利害関係人であり、当ファンドに係る利害関係人とは三菱UFJモルガン・スタンレー証券です。
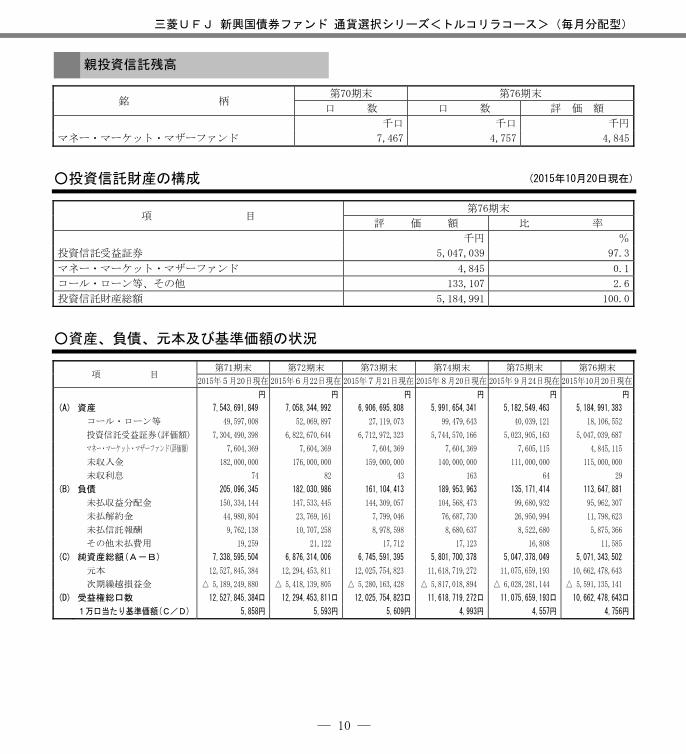
○組入資産の明細 (2015年10月20日現在)
銘 柄 第70期末 第76期末
口 数 口 数 評 価 額 比 率
千口 千口 千円 %
ピムコ ケイマン エマージング ボンド ファンド B - クラス J (TRY)
999 793 5,047,039 99.5
合 計 999 793 5,047,039 99.5
(注) 比率は三菱UFJ 新興国債券ファンド 通貨選択シリーズ<トルコリラコース>(毎月分配型)の純資産総額に対する比率。
ファンド・オブ・ファンズが組入れた邦貨建ファンドの明細
利害関係人との取引状況
親投資信託受益証券の設定、解約状況
品 名:03_90003_250836_076_04_三菱UFJ 新興国債券ファンド 通貨選択シリーズ<トルコリラコース>(毎月分配型)_607082.docx
日 時:2015/12/2 18:14:00
ページ:10
― 10 ―
三菱UFJ 新興国債券ファンド 通貨選択シリーズ<トルコリラコース>(毎月分配型)
銘 柄 第70期末 第76期末
口 数 口 数 評 価 額
千口 千口 千円
マネー・マーケット・マザーファンド 7,467 4,757 4,845
○投資信託財産の構成 (2015年10月20日現在)
項 目 第76期末
評 価 額 比 率
千円 %
投資信託受益証券 5,047,039 97.3
マネー・マーケット・マザーファンド 4,845 0.1
コール・ローン等、その他 133,107 2.6
投資信託財産総額 5,184,991 100.0
○資産、負債、元本及び基準価額の状況
項 目 第71期末 第72期末 第73期末 第74期末 第75期末 第76期末
2015年5月20日現在 2015年6月22日現在 2015年7月21日現在 2015年8月20日現在 2015年9月24日現在 2015年10月20日現在
円 円 円 円 円 円
(A) 資産 7,543,691,849 7,058,344,992 6,906,695,808 5,991,654,341 5,182,549,463 5,184,991,383
コール・ローン等 49,597,008 52,069,897 27,119,073 99,479,643 40,039,121 18,106,552
投資信託受益証券(評価額) 7,304,490,398 6,822,670,644 6,712,972,323 5,744,570,166 5,023,905,163 5,047,039,687
マネー・マーケット・マザーファンド(評価額) 7,604,369 7,604,369 7,604,369 7,604,369 7,605,115 4,845,115
未収入金 182,000,000 176,000,000 159,000,000 140,000,000 111,000,000 115,000,000
未収利息 74 82 43 163 64 29
(B) 負債 205,096,345 182,030,986 161,104,413 189,953,963 135,171,414 113,647,881
未払収益分配金 150,334,144 147,533,445 144,309,057 104,568,473 99,680,932 95,962,307
未払解約金 44,980,804 23,769,161 7,799,046 76,687,730 26,950,994 11,798,623
未払信託報酬 9,762,138 10,707,258 8,978,598 8,680,637 8,522,680 5,875,366
その他未払費用 19,259 21,122 17,712 17,123 16,808 11,585
(C) 純資産総額(A-B) 7,338,595,504 6,876,314,006 6,745,591,395 5,801,700,378 5,047,378,049 5,071,343,502
元本 12,527,845,384 12,294,453,811 12,025,754,823 11,618,719,272 11,075,659,193 10,662,478,643
次期繰越損益金 △ 5,189,249,880 △ 5,418,139,805 △ 5,280,163,428 △ 5,817,018,894 △ 6,028,281,144 △ 5,591,135,141
(D) 受益権総口数 12,527,845,384口 12,294,453,811口 12,025,754,823口 11,618,719,272口 11,075,659,193口 10,662,478,643口
1万口当たり基準価額(C/D) 5,858円 5,593円 5,609円 4,993円 4,557円 4,756円
親投資信託残高

品 名:03_90003_250836_076_04_三菱UFJ 新興国債券ファンド 通貨選択シリーズ<トルコリラコース>(毎月分配型)_607082.docx
日 時:2015/12/2 18:14:00
ページ:11
― 11 ―
三菱UFJ 新興国債券ファンド 通貨選択シリーズ<トルコリラコース>(毎月分配型)
○損益の状況
項 目 第71期 第72期 第73期 第74期 第75期 第76期
2015年4月21日~ 2015年5月20日
2015年5月21日~2015年6月22日
2015年6月23日~2015年7月21日
2015年7月22日~2015年8月20日
2015年8月21日~ 2015年9月24日
2015年9月25日~2015年10月20日
円 円 円 円 円 円
(A) 配当等収益 86,294,890 84,635,155 83,969,786 77,596,383 64,409,013 64,804,188
受取配当金 86,292,715 84,631,811 83,967,675 77,594,259 64,406,520 64,802,735
受取利息 2,175 3,344 2,111 2,124 2,493 1,453
(B) 有価証券売買損益 337,610,229 △ 251,589,441 88,601,346 △ 679,113,981 △ 438,177,218 249,362,436
売買益 342,147,224 7,443,091 92,254,041 11,590,571 13,726,066 254,842,008
売買損 △ 4,536,995 △ 259,032,532 △ 3,652,695 △ 690,704,552 △ 451,903,284 △ 5,479,572
(C) 信託報酬等 △ 9,781,397 △ 10,728,380 △ 8,996,310 △ 8,697,760 △ 8,539,488 △ 5,886,951
(D) 当期損益金(A+B+C) 414,123,722 △ 177,682,666 163,574,822 △ 610,215,358 △ 382,307,693 308,279,673
(E) 前期繰越損益金 △2,761,213,167 △2,334,733,396 △2,504,889,373 △2,319,831,498 △2,835,034,057 △3,138,853,431
(F) 追加信託差損益金 △2,691,826,291 △2,758,190,298 △2,794,539,820 △2,782,403,565 △2,711,258,462 △2,664,599,076
(配当等相当額) ( 1,311,495,007) ( 1,222,094,374) ( 1,123,239,499) ( 1,022,488,317) ( 941,484,609) ( 863,714,948)
(売買損益相当額) (△4,003,321,298) (△3,980,284,672) (△3,917,779,319) (△3,804,891,882) (△3,652,743,071) (△3,528,314,024)
(G) 計(D+E+F) △5,038,915,736 △5,270,606,360 △5,135,854,371 △5,712,450,421 △5,928,600,212 △5,495,172,834
(H) 収益分配金 △ 150,334,144 △ 147,533,445 △ 144,309,057 △ 104,568,473 △ 99,680,932 △ 95,962,307
次期繰越損益金(G+H) △5,189,249,880 △5,418,139,805 △5,280,163,428 △5,817,018,894 △6,028,281,144 △5,591,135,141
追加信託差損益金 △2,758,223,871 △2,831,957,021 △2,859,478,896 △2,817,259,723 △2,755,561,099 △2,696,586,512
(配当等相当額) ( 1,245,097,427) ( 1,148,327,651) ( 1,058,300,423) ( 987,632,159) ( 897,181,972) ( 831,727,512)
(売買損益相当額) (△4,003,321,298) (△3,980,284,672) (△3,917,779,319) (△3,804,891,882) (△3,652,743,071) (△3,528,314,024)
分配準備積立金 809,279 917,442 1,110,893 250,948 728,504 313,634
繰越損益金 △2,431,835,288 △2,587,100,226 △2,421,795,425 △3,000,010,119 △3,273,448,549 △2,894,862,263
(注) (B)有価証券売買損益は各期末の評価換えによるものを含みます。
(注) (C)信託報酬等には信託報酬に対する消費税等相当額を含めて表示しています。
(注) (F)追加信託差損益金とあるのは、信託の追加設定の際、追加設定をした価額から元本を差し引いた差額分をいいます。
<注記事項>
①作成期首(前作成期末)元本額 12,757,449,475円
作成期中追加設定元本額 797,198,643円
作成期中一部解約元本額 2,892,169,475円
また、1口当たり純資産額は、作成期末0.4756円です。
②純資産総額が元本額を下回っており、その差額は5,591,135,141円です。
③分配金の計算過程
項 目 2015年4月21日~ 2015年5月20日
2015年5月21日~2015年6月22日
2015年6月23日~2015年7月21日
2015年7月22日~2015年8月20日
2015年8月21日~ 2015年9月24日
2015年9月25日~2015年10月20日
費用控除後の配当等収益額 84,303,544円 73,906,942円 79,592,268円 68,898,653円 55,869,634円 63,589,799円
費用控除後・繰越欠損金補填後の有価証券売買等損益額 -円 -円 -円 -円 -円 -円
収益調整金額 1,311,495,007円 1,222,094,374円 1,123,239,499円 1,022,488,317円 941,484,609円 863,714,948円
分配準備積立金額 442,299円 777,222円 888,606円 1,064,610円 237,165円 698,706円
当ファンドの分配対象収益額 1,396,240,850円 1,296,778,538円 1,203,720,373円 1,092,451,580円 997,591,408円 928,003,453円
1万口当たり収益分配対象額 1,114円 1,054円 1,000円 940円 900円 870円
1万口当たり分配金額 120円 120円 120円 90円 90円 90円
収益分配金金額 150,334,144円 147,533,445円 144,309,057円 104,568,473円 99,680,932円 95,962,307円
④信託財産の運用の指図に係る権限の全部または一部を委託するために要する費用として、信託財産の純資産総額に対し年10,000分の59以
内の率を乗じて得た額を委託者報酬の中から支弁しております。

品 名:03_90003_250836_076_04_三菱UFJ 新興国債券ファンド 通貨選択シリーズ<トルコリラコース>(毎月分配型)_607082.docx
日 時:2015/12/2 18:14:00
ページ:12
― 12 ―
三菱UFJ 新興国債券ファンド 通貨選択シリーズ<トルコリラコース>(毎月分配型)
○分配金のお知らせ
第71期 第72期 第73期 第74期 第75期 第76期
1万口当たり分配金(税込み) 120円 120円 120円 90円 90円 90円 ◆分配金は各決算日から起算して5営業日までにお支払いを開始しております。
◆分配金を再投資される方のお手取分配金は、各決算日現在の基準価額に基づいて、みなさまの口座に繰り入れて再投資いたしました。
◆課税上の取り扱い
・分配金は、分配後の基準価額と個々の受益者の個別元本との差により、課税扱いとなる「普通分配金」と、非課税扱いとなる「元本払戻
金(特別分配金)」に分かれます。
・分配後の基準価額が個別元本と同額または上回る場合は、全額が普通分配金となります。分配後の基準価額が個別元本を下回る場合には、
下回る部分の額が元本払戻金(特別分配金)となり、残りの額が普通分配金となります。
・元本払戻金(特別分配金)が発生した場合は、分配金発生時に個々の受益者の個別元本から当該元本払戻金(特別分配金)を控除した額
が、その後の個々の受益者の個別元本となります。
・個人受益者が支払いを受ける収益分配金のうち普通分配金については配当所得として課税され、原則として、20.315%(所得税15%、復
興特別所得税0.315%、地方税5%)の税率で源泉徴収(申告不要)されます。確定申告を行い、総合課税・申告分離課税を選択すること
もできます。
※法人受益者に対する課税は異なります。
※課税上の取扱いの詳細については、税務専門家等にご確認されることをお勧めします。
※税法が改正された場合等には、上記内容が変更になることがあります。
※少額投資非課税制度「愛称:NISA(ニーサ)」をご利用の場合、毎年、一定額の範囲で新たに購入した公募株式投資信託などから生じ
る配当所得および譲渡所得が一定期間非課税となります。
*三菱UFJ国際投信では本資料のほかに当ファンドに関する情報等の開示を行っている場合があります。詳しくは、取り扱い販売会社に
お問い合わせいただくか、当社ホームページ(http://www.am.mufg.jp/)をご覧ください。
[ お 知 ら せ ]
①2015年7月1日に国際投信投資顧問株式会社と合併し、商号を三菱UFJ国際投信株式会社へ変更し、信託約款に所要の変更を行いました。
(2015年7月1日)
②2014年1月1日から、2037年12月31日までの間、普通分配金並びに解約時又は償還時の差益に対し、所得税15%に2.1%の率を乗じた復興
特別所得税が付加され、20.315%(所得税15%、復興特別所得税0.315%、地方税5%(法人受益者は15.315%の源泉徴収が行われます。))
の税率が適用されます。
品 名:03_90003_250836_076_04_三菱UFJ 新興国債券ファンド 通貨選択シリーズ<トルコリラコース>(毎月分配型)_607082.docx
日 時:2015/12/2 18:14:00
ページ:13
― 13 ―
三菱UFJ 新興国債券ファンド 通貨選択シリーズ<トルコリラコース>(毎月分配型)
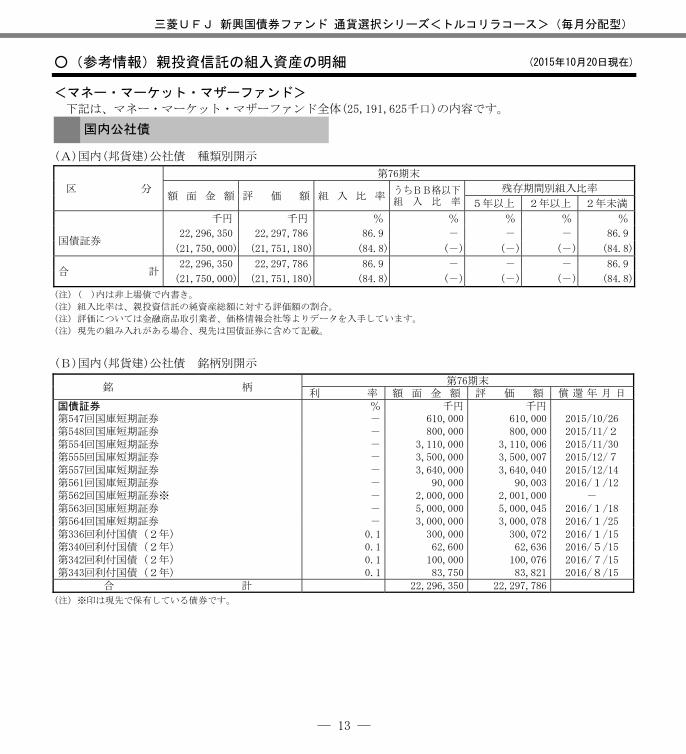
○(参考情報)親投資信託の組入資産の明細 (2015年10月20日現在)
<マネー・マーケット・マザーファンド> 下記は、マネー・マーケット・マザーファンド全体(25,191,625千口)の内容です。
(A)国内(邦貨建)公社債 種類別開示
区 分
第76期末
額 面 金 額 評 価 額 組 入 比 率うちBB格以下組 入 比 率
残存期間別組入比率
5年以上 2年以上 2年未満
千円 千円 % % % % %
国債証券 22,296,350 22,297,786 86.9 - - - 86.9
(21,750,000) (21,751,180) (84.8) (-) (-) (-) (84.8)
合 計 22,296,350 22,297,786 86.9 - - - 86.9
(21,750,000) (21,751,180) (84.8) (-) (-) (-) (84.8)
(注) ( )内は非上場債で内書き。
(注) 組入比率は、親投資信託の純資産総額に対する評価額の割合。
(注) 評価については金融商品取引業者、価格情報会社等よりデータを入手しています。
(注) 現先の組み入れがある場合、現先は国債証券に含めて記載。
(B)国内(邦貨建)公社債 銘柄別開示
銘 柄 第76期末
利 率 額 面 金 額 評 価 額 償 還 年 月 日国債証券 % 千円 千円 第547回国庫短期証券 - 610,000 610,000 2015/10/26 第548回国庫短期証券 - 800,000 800,000 2015/11/2 第554回国庫短期証券 - 3,110,000 3,110,006 2015/11/30 第555回国庫短期証券 - 3,500,000 3,500,007 2015/12/7 第557回国庫短期証券 - 3,640,000 3,640,040 2015/12/14 第561回国庫短期証券 - 90,000 90,003 2016/1/12 第562回国庫短期証券※ - 2,000,000 2,001,000 - 第563回国庫短期証券 - 5,000,000 5,000,045 2016/1/18 第564回国庫短期証券 - 3,000,000 3,000,078 2016/1/25 第336回利付国債(2年) 0.1 300,000 300,072 2016/1/15 第340回利付国債(2年) 0.1 62,600 62,636 2016/5/15 第342回利付国債(2年) 0.1 100,000 100,076 2016/7/15 第343回利付国債(2年) 0.1 83,750 83,821 2016/8/15
合 計 22,296,350 22,297,786
(注) ※印は現先で保有している債券です。
国内公社債

12
ン コ ン ン ン ン ト ン
コ ン ン ン ン
ン ン
ト ン
ト
ト コ
11 20
― 4 ―
04_587300_ .indd 14 2015/06/12 15:45:16
― 4 ―
04_607082_ ン .indd 14 2015/12/11 13:25:45

品 名:02_【外投】ピムコ ケイマン エマージング ボンド ファンド B_610861.docx
日 時:2015/11/5 13:49:00
ページ:1
ピムコ ケイマン エマージング ボンド ファンド B/マネー・マーケット・マザーファンド
運用計算書、純資産変動計算書、投資有価証券明細表はPIMCO Cayman Trust Annual Report February 28.2015版から抜粋して作成しています。 なお、開示情報につきましては、各通貨毎のクラス分けされていないものは、「ピムコ ケイマ
ン エマージング ボンド ファンド B」で掲載しています。また、「ピムコ ケイマン エマージング ボンド ファンド (M)」を「マスターファンド」と表示する場合があります。
(1)運用計算書
(A)ピムコ ケイマン エマージング ボンド ファンド B
(2014年3月1日~2015年2月28日)
ピムコ ケイマン エマージング ボンド
ファンド B
千米ドル 投資収入: 受取利息(外国税額控除後)* 362 マスターファンドからの配当収入 199,517 雑収入 0
収入合計 199,879 費用: 支払利息 398 雑費用 1
費用合計 399 投資純収入 199,480 実現純利益(損失): 投資有価証券(外国税額控除後)* 415 マスターファンド (88,201) 為替取引、中央清算金融派生商品 0 店頭金融派生商品 88,332 外貨 4,245
実現純利益(損失) 4,791 未実現評価益(評価損)の純変動: 投資有価証券(外国税額控除後) (6) マスターファンド 64,838 為替取引、中央清算金融派生商品 0 店頭金融派生商品 (296,599) 外貨建資産および負債の換算に係る外貨 56
未実現評価益(評価損)の純変動 (231,711)
純利益(損失) (226,920) 運用による純資産の純増(減)額 (27,440) *外国源泉課税額 0
(注)データ提供元:ピムコジャパンリミテッド (注)現時点で入手し得る直近の決算期分を掲載しています。 (注)各項目ごとに千米ドル未満は四捨五入してあります。 (B)マネー・マーケット・マザーファンド
〓頁の損益の状況をご参照ください。
― ―
02_90003_ コ ン ン ン ン _610861.indd 1 2015/11/05 13:51:18
33
― 5 ―
04_607082_ ン .indd 15 2015/12/11 13:25:46

品 名:02_【外投】ピムコ ケイマン エマージング ボンド ファンド B_610861.docx
日 時:2015/11/5 13:49:00
ページ:2
ピムコ ケイマン エマージング ボンド ファンド B
(2)純資産変動計算書
ピムコ ケイマン エマージング ボンド ファンド B
(2014年3月1日~2015年2月28日)
ピムコ ケイマン
エマージング ボンド
ファンド B
千米ドル
純資産の増 (減 ):
運用:
投資純収入 199,480
実現純利益(損失) 4,791
未実現評価益(評価損)の純変動 (231,711)
運用による純資産の純増(減)額 (27,440)
分配:
分配額
A(BR ) (7,551)
(BR ) (22,800)
F(A ) (3,414)
F( AR) (5,894)
(A ) (118,099)
(BR ) (436,781)
(C ) (166)
(I R) (2,169)
(TR ) (18,491)
( AR) (721)
分配金額合計 (616,086)
ファンド ット取引:
ファンド ット取引による純資産の純増(減)額 (1,787,442)
純資産の増(減)額合計 (2,430,968)
純資産:
期 4,889,950
期 2,458,982 (注)データ提供元:ピムコジャパンリミテッド
(注)現時点で入手し得る直近の決算期分を掲載しています。
(注)各項目ごとに千米ドル未満は四捨五入してあります。
― ―
02_90003_ コ ン ン ン ン _610861.indd 2 2015/11/05 13:51:18
― 6 ―
04_607082_ ン .indd 16 2015/12/11 13:25:46

Schedule of Investments PIMCO Cayman Emerging Bond Fund B February 28, 2015
See accompanying notes Annual Report | February 28, 2015
PRINCIPAL AMOUNT
(000s) VALUE (000s)
INVESTMENTS IN SECURITIES 16.3% SHORT-TERM INSTRUMENTS 16.3% TIME DEPOSITS 0.0%
ANZ National Bank 0.030% due 03/02/2015 $ 11 $ 11 1.442% due 03/02/2015 AUD 1 1 Bank of Tokyo-Mitsubishi UFJ Ltd. 0.005% due 03/02/2015 ¥ 1 0 0.030% due 03/02/2015 $ 19 19 Citibank N.A. 0.030% due 03/02/2015 120 120 DBS Bank Ltd. 0.030% due 03/02/2015 221 221 DnB NORBank ASA 0.030% due 03/02/2015 74 74 HSBC Bank 4.950% due 03/02/2015 ZAR 2 0 JPMorgan Chase & Co. 0.030% due 03/02/2015 $ 74 74 Nordea Bank AB 0.030% due 03/02/2015 1 1 Wells Fargo Bank 0.030% due 03/02/2015 15 15 536
U.S. TREASURY BILLS 16.3%
0.009% due 04/02/2015 (c) 13,800 13,800 0.013% due 06/04/2015 24,100 24,098 0.014% due 04/23/2015 (c)(a) 21,381 21,381 0.017% due 04/30/2015 (c)(a) 7,500 7,500 0.018% due 06/11/2015 (c)(a) 28,500 28,498 0.028% due 05/14/2015 (c)(a) 59,400 59,398 0.030% due 03/26/2015 (c) 1,422 1,422 0.037% due 05/21/2015 (c)(a) 83,400 83,397 0.042% due 04/09/2015 (c)(a) 863 863 0.043% due 04/16/2015 (c) 9,000 9,000 0.050% due 05/07/2015 (c)(a) 62,781 62,779 0.071% due 05/28/2015 (a) 87,600 87,595 399,731
Total Short-Term Instruments 400,267 (Cost $400,213) Total Investments in Securities 400,267 (Cost $400,213)
UNITS INVESTMENTS IN AFFILIATES 90.5% MUTUAL FUNDS 90.5% PIMCO Cayman Emerging Bond Fund (M) (Cost $2,311,109) 186,976,752 2,225,024
Total Investments in Affiliates 2,225,024 (Cost $2,311,109)
Total Investments 106.8% (Cost $2,711,322)
$ 2,625,291
Financial Derivative Instruments (b) (6.6%) (163,475 )
(Cost or Premiums, net $0)
Other Assets and Liabilities, net (0.2%) (2,834 )
Net Assets 100.0% $ 2,458,982
27
コ ン ン ン ン
3 d n nコ ン ン ン ン
2015 28
― 3 ―
03_90003_ コ ン ン ン ン _610861.indd 3 2015/11/05 13:53:06
― 7 ―
04_607082_ ン .indd 17 2015/12/11 13:25:47

Schedule of Investments PIMCO Cayman Emerging Bond Fund B (Cont.) February 28, 2015
See accompanying notes Annual Report | February 28, 2015
NOTES TO SCHEDULE OF INVESTMENTS (AMOUNTS IN THOUSANDS*): * A zero balance may reflect actual amounts rounding to less than one thousand. (a) Coupon represents a weighted average rate. (b) FINANCIAL DERIVATIVE INSTRUMENTS: OVER THE COUNTER FORWARD FOREIGN CURRENCY CONTRACTS:
Counterparty Settlement
Month Currency to
be Delivered Currency to be Received
Unrealized Appreciation/(Depreciation) Asset Liability
BOA 03/2015 $ 40 AUD 51 $ 0 $ 0 BOA 03/2015 321 412 1 0 BOA 03/2015 1 1 0 0 BOA 03/2015 3,346 JPY 400,000 0 0 BOA 03/2015 63 ZAR 731 0 0 BOA 03/2015 61 698 0 (1 ) BRC 04/2015 683 8,000 0 (4 ) CBK 03/2015 AUD 46 $ 36 0 0 CBK 03/2015 $ 74 AUD 95 0 0 CBK 03/2015 804 JPY 96,000 0 (1 ) CBK 03/2015 4,106 488,000 0 (24 ) CBK 03/2015 59 ZAR 691 0 0 CBK 03/2015 179 2,050 0 (3 ) $ 1 $ (33 )
J (AUD) CLASS FORWARD FOREIGN CURRENCY CONTRACTS:
Counterparty Settlement
Month Currency to
be Delivered Currency to be Received
Unrealized Appreciation/(Depreciation) Asset Liability
BOA 03/2015 AUD 169,587 $ 132,009 $ 0 $ (735 ) BOA 03/2015 $ 70,316 AUD 88,818 0 (793 ) BOA 04/2015 127,834 164,495 668 0 BPS 03/2015 178,127 225,567 0 (1,564 ) BRC 03/2015 178,242 225,567 0 (1,679 ) CBK 03/2015 AUD 176 $ 138 0 0 CBK 03/2015 221,980 172,727 0 (1,028 ) CBK 03/2015 $ 137 AUD 176 0 0 CBK 03/2015 52,112 66,030 76 (503 ) CBK 04/2015 AUD 2,637 $ 2,070 12 (2 ) CBK 04/2015 $ 177,008 AUD 227,877 1,008 0 DUB 03/2015 AUD 63,405 $ 49,416 0 (215 ) DUB 03/2015 $ 178,022 AUD 224,520 0 (2,279 ) DUB 04/2015 49,329 63,405 202 0 FBF 03/2015 AUD 2,291 $ 1,787 0 (6 ) GLM 03/2015 171,616 133,666 0 (667 ) GLM 04/2015 $ 133,432 AUD 171,616 633 0 JPM 03/2015 AUD 21,336 $ 16,620 0 (80 ) MSB 03/2015 $ 34,227 AUD 43,196 0 (415 ) SOG 04/2015 AUD 1,280 $ 1,000 0 0 UAG 03/2015 221,121 172,137 0 (945 ) UAG 04/2015 $ 170,824 AUD 219,804 885 0 $ 3,484 $ (10,911 ) J (BRL) CLASS FORWARD FOREIGN CURRENCY CONTRACTS:
Counterparty Settlement
Month Currency to
be Delivered Currency to be Received
Unrealized Appreciation/(Depreciation) Asset Liability
BOA 03/2015 BRL 391,356 $ 136,086 $ 40 $ (823 ) BOA 03/2015 $ 149,959 BRL 391,356 0 (13,090 ) BOA 04/2015 BRL 7,033 $ 2,624 189 0 BOA 04/2015 $ 6,331 BRL 18,302 4 0 BOA 07/2015 BRL 7,454 $ 2,695 184 0 BPS 03/2015 49,318 17,135 0 (113 ) BPS 03/2015 $ 18,865 BRL 49,318 0 (1,617 ) BRC 03/2015 BRL 7,670 $ 2,676 13 (19 )
BRC 03/2015 $ 2,665 BRL 7,670 18 0 CBK 03/2015 BRL 237,466 $ 82,545 16 (520 ) CBK 03/2015 $ 91,151 BRL 237,466 0 (8,102 ) DUB 03/2015 BRL 7,497 $ 2,605 0 (17 )
28
コ ン ン ン ン
― 4 ―
03_90003_ コ ン ン ン ン _610861.indd 4 2015/11/05 13:53:06
― ―
04_607082_ ン .indd 18 2015/12/11 13:25:47

Schedule of Investments PIMCO Cayman Emerging Bond Fund B (Cont.)
See accompanying notes Annual Report | February 28, 2015
February 28, 2015
J (BRL) CLASS FORWARD FOREIGN CURRENCY CONTRACTS (Cont.):
Counterparty Settlement
Month Currency to
be Delivered Currency to be Received
Unrealized Appreciation/(Depreciation) Asset Liability
DUB 03/2015 $ 2,616 BRL 7,497 $ 6 $ 0 DUB 04/2015 BRL 7,497 $ 2,591 0 (4 ) DUB 04/2015 $ 5,305 BRL 15,318 0 (3 ) DUB 07/2015 199,201 540,432 0 (17,092 ) FBF 03/2015 BRL 587,141 $ 204,048 40 (1,333 ) FBF 03/2015 $ 227,221 BRL 587,141 0 (21,881 ) FBF 07/2015 BRL 6,991 $ 2,491 135 0 FBF 07/2015 $ 49,067 BRL 133,930 0 (3,937 ) GLM 03/2015 BRL 7,017 $ 2,692 237 0 GLM 03/2015 $ 2,438 BRL 7,017 16 0 GLM 07/2015 12,509 34,307 0 (949 ) HUS 03/2015 BRL 1,083,505 $ 377,068 0 (1,866 ) HUS 03/2015 $ 398,090 BRL 1,083,505 1,164 (20,320 ) HUS 04/2015 373,436 1,083,505 1,616 0 JPM 03/2015 BRL 1,529,932 $ 537,980 2,927 (10 ) JPM 03/2015 $ 556,926 BRL 1,529,932 1,533 (23,396 ) JPM 04/2015 BRL 8,101 $ 2,789 0 (15 ) JPM 04/2015 $ 515,025 BRL 1,478,546 0 (3,231 ) JPM 07/2015 BRL 5,349 $ 1,903 101 0 JPM 07/2015 $ 39,188 BRL 106,512 0 (3,296 ) MSB 03/2015 BRL 1,479,467 $ 519,750 2,336 0 MSB 03/2015 $ 532,980 BRL 1,479,467 1,675 (17,241 ) MSB 04/2015 BRL 3,573 $ 1,297 60 0 MSB 04/2015 $ 514,791 BRL 1,479,467 0 (2,678 ) MSB 07/2015 BRL 10,581 $ 3,851 286 0 RBC 03/2015 6,785 2,498 124 0 RBC 03/2015 $ 2,369 BRL 6,785 14 (10 ) UAG 03/2015 BRL 747,728 $ 259,790 0 (1,713 ) UAG 03/2015 $ 282,215 BRL 747,728 0 (20,712 ) $ 12,734 $ (163,988 ) J (CNY) CLASS FORWARD FOREIGN CURRENCY CONTRACTS:
Counterparty Settlement
Month Currency to
be Delivered Currency to be Received
Unrealized Appreciation/(Depreciation) Asset Liability
BRC 04/2015 $ 12 CNY 74 $ 0 $ 0 FBF 04/2015 24 151 0 0 GLM 04/2015 291 1,806 0 0 HUS 04/2015 317 1,968 0 0 JPM 04/2015 15 93 0 0 SCX 04/2015 340 2,108 0 0 SOG 04/2015 1 6 0 0 $ 0 $ 0 J (IDR) CLASS FORWARD FOREIGN CURRENCY CONTRACTS:
Counterparty Settlement
Month Currency to
be Delivered Currency to be Received
Unrealized Appreciation/(Depreciation) Asset Liability
BRC 04/2015 $ 45 IDR 582,350 $ 0 $ (1 ) BRC 05/2015 67 875,784 0 (1 ) GLM 05/2015 1,661 21,396,160 0 (41 ) HUS 05/2015 2,880 37,398,332 0 (49 ) JPM 04/2015 IDR 1,757,915 $ 135 0 0 JPM 04/2015 $ 181 IDR 2,339,915 0 (2 ) JPM 05/2015 102 1,307,828 0 (2 ) SCX 05/2015 3,611 46,437,997 0 (95 ) UAG 05/2015 3,543 45,621,532 0 (90 ) $ 0 $ (281 ) J (TRY) CLASS FORWARD FOREIGN CURRENCY CONTRACTS:
Counterparty Settlement
Month Currency to
be Delivered Currency to be Received
Unrealized Appreciation/(Depreciation) Asset Liability
BOA 03/2015 TRY 4,060 $ 1,654 $ 51 $ 0 BRC 03/2015 $ 649 TRY 1,602 0 (17 ) CBK 03/2015 TRY 9,116 $ 3,675 77 0 DUB 04/2015 $ 13,241 TRY 33,366 0 (180 ) HUS 03/2015 TRY 638 $ 252 0 0
29
コ ン ン ン ン
― 5 ―
03_90003_ コ ン ン ン ン _610861.indd 5 2015/11/05 13:53:07
― ―
04_607082_ ン .indd 19 2015/12/11 13:25:47

Schedule of Investments PIMCO Cayman Emerging Bond Fund B (Cont.)
See accompanying notes Annual Report | February 28, 2015
February 28, 2015
J (TRY) CLASS FORWARD FOREIGN CURRENCY CONTRACTS (Cont.):
Counterparty Settlement
Month Currency to
be Delivered Currency to be Received
Unrealized Appreciation/(Depreciation) Asset Liability
HUS 03/2015 $ 40,899 TRY 96,970 $ 0 $ (2,625 ) JPM 03/2015 17,316 41,145 0 (1,077 ) JPM 04/2015 5,805 14,748 0 (32 ) RBC 03/2015 794 1,869 0 (56 ) $ 128 $ (3,987 ) J (ZAR) CLASS FORWARD FOREIGN CURRENCY CONTRACTS:
Counterparty Settlement
Month Currency to
be Delivered Currency to be Received
Unrealized Appreciation/(Depreciation) Asset Liability
BOA 04/2015 $ 248 ZAR 2,914 $ 0 $ 0 BOA 04/2015 ZAR 9,477 $ 807 2 0 BRC 04/2015 $ 12,497 ZAR 146,340 1 (61 ) BRC 04/2015 ZAR 1,641 $ 139 0 0 CBK 04/2015 $ 689 ZAR 8,010 0 (9 ) CBK 04/2015 ZAR 6,256 $ 537 5 0 DUB 04/2015 $ 10,281 ZAR 119,554 0 (121 ) HUS 04/2015 12,150 140,468 0 (212 ) JPM 04/2015 12,165 140,468 0 (227 ) RBC 04/2015 ZAR 134 $ 12 0 0 $ 8 $ (630 ) Total Forward Foreign Currency Contracts $ 16,355 $ (179,830 )
FINANCIAL DERIVATIVE INSTRUMENTS: OVER THE COUNTER SUMMARY The following is a summary by counterparty of the market value of OTC financial derivative instruments and collateral (received)/pledged as of February 28, 2015: (c) Securities with an aggregate market value of $175,306 have been pledged as collateral for financial derivative instruments as governed by International
Swaps and Derivatives Association, Inc. master agreements as of February 28, 2015. Financial Derivative Assets Financial Derivative Liabilities
Counterparty
Forward Foreign
Currency Contracts
Purchased Options
Swap Agreements
Total Over the Counter
Forward Foreign
Currency Contracts
WrittenOptions
Swap Agreements
Total Over the Counter
Net Market Value of OTC Derivatives
Collateral (Received)/
Pledged Net
Exposures(1)
BOA $ 1,139 $ 0 $ 0 $ 1,139 $ (15,442 ) $ 0 $ 0 $ (15,442 ) $ (14,303 ) $ 14,729 $ 426 BPS 0 0 0 0 (3,294 ) 0 0 (3,294 ) (3,294 ) 2,479 (815 ) BRC 32 0 0 32 (1,782 ) 0 0 (1,782 ) (1,750 ) 1,636 (114 ) CBK 1,194 0 0 1,194 (10,192 ) 0 0 (10,192 ) (8,998 ) 9,262 264 DUB 208 0 0 208 (19,911 ) 0 0 (19,911 ) (19,703 ) 21,719 2,016 FBF 175 0 0 175 (27,157 ) 0 0 (27,157 ) (26,982 ) 27,971 989 GLM 886 0 0 886 (1,657 ) 0 0 (1,657 ) (771 ) 632 (139 ) HUS 2,780 0 0 2,780 (25,072 ) 0 0 (25,072 ) (22,292 ) 24,539 2,247 JPM 4,561 0 0 4,561 (31,368 ) 0 0 (31,368 ) (26,807 ) 29,962 3,155 MSB 4,357 0 0 4,357 (20,334 ) 0 0 (20,334 ) (15,977 ) 19,519 3,542 RBC 138 0 0 138 (66 ) 0 0 (66 ) 72 0 72 SCX 0 0 0 0 (95 ) 0 0 (95 ) (95 ) 0 (95 ) SOG 0 0 0 0 0 0 0 0 0 (10 ) (10 ) UAG 885 0 0 885 (23,460 ) 0 0 (23,460 ) (22,575 ) 22,858 283 Total Over the Counter $ 16,355 $ 0 $ 0 $ 16,355 $ (179,830 ) $ 0 $ 0 $ (179,830 )
(1) Net exposures represent the net receivable/(payable) that would be due from/to the counterparty in the event of default. Exposure from OTC financial derivative instruments can only be netted across transactions governed under the same
master agreement with the same legal entity. See Note 7, Principal Risks, in the Notes to Financial Statements for more information regarding master netting arrangements.
30
コ ン ン ン ン
― 6 ―
03_90003_ コ ン ン ン ン _610861.indd 6 2015/11/05 13:53:07
― ―
04_607082_ ン .indd 20 2015/12/11 13:25:48

Schedule of Investments PIMCO Cayman Emerging Bond Fund (M)
See accompanying notes Annual Report | February 28, 2015
February 28, 2015
*
PRINCIPAL AMOUNT
(000s) VALUE (000s)
INVESTMENTS IN SECURITIES 97.8% AZERBAIJAN 0.6% CORPORATE BONDS & NOTES 0.2%
State Oil Co. of the Azerbaijan Republic 4.750% due 03/13/2023 $ 5,040 $ 4,765
SOVEREIGN ISSUES 0.4%
Republic of Azerbaijan International Bond 4.750% due 03/18/2024 8,700 8,832 Total Azerbaijan 13,597 (Cost $13,583)
BRAZIL 12.9% CORPORATE BONDS & NOTES 11.2%
Banco do Brasil S.A. 3.875% due 10/10/2022 28,550 25,838 6.000% due 01/22/2020 39,700 42,777 Banco do Nordeste do Brasil S.A. 4.375% due 05/03/2019 8,200 8,081 Caixa Economica Federal 3.500% due 11/07/2022 1,700 1,479 4.250% due 05/13/2019 13,900 13,601 4.500% due 10/03/2018 16,700 16,575 Centrais Eletricas Brasileiras S.A. 5.750% due 10/27/2021 11,300 10,226 6.875% due 07/30/2019 33,035 32,463 Petrobras Global Finance BV 2.393% due 01/15/2019 8,700 7,438 5.375% due 01/27/2021 24,275 21,964 5.750% due 01/20/2020 44,042 40,738 6.250% due 03/17/2024 14,900 13,775 7.875% due 03/15/2019 34,820 35,427 270,382
SOVEREIGN ISSUES 1.7%
Banco Nacional de Desenvolvimento Economico e Social
4.125% due 09/15/2017 EUR 700 813 6.369% due 06/16/2018 $ 12,750 13,694 6.500% due 06/10/2019 7,131 7,685 Brazil Government International Bond 5.625% due 01/07/2041 3,880 3,899 Brazil Minas SPE via State of Minas Gerais 5.333% due 02/15/2028 6,600 6,336 Brazil Notas do Tesouro Nacional Series F 10.000% due 01/01/2023 BRL 27,200 8,671 41,098 Total Brazil 311,480 (Cost $337,341)
CAYMAN ISLANDS 0.3% CORPORATE BONDS & NOTES 0.3%
Interoceanica IV Finance Ltd. 0.000% due 11/30/2018 $ 91 83 0.000% due 11/30/2025 1,011 724 Interoceanica V Finance Ltd. 0.000% due 05/15/2030 13,900 7,169 Total Cayman Islands 7,976 (Cost $7,102)
PRINCIPAL AMOUNT
(000s) VALUE(000s)
CHILE 1.7% CORPORATE BONDS & NOTES 1.5%
Banco del Estado de Chile 3.875% due 02/08/2022 $ 900 $ 935 4.125% due 10/07/2020 3,000 3,195 Corp. Nacional del Cobre de Chile 4.250% due 07/17/2042 22,200 21,795 4.875% due 11/04/2044 6,200 6,617 Empresa de Transporte de Pasajeros Metro S.A. 4.750% due 02/04/2024 4,200 4,554 37,096
SOVEREIGN ISSUES 0.2%
Chile Government International Bond 3.625% due 10/30/2042 5,150 5,099 Total Chile 42,195 (Cost $40,916)
CHINA 1.0% CORPORATE BONDS & NOTES 1.0%
CNOOC Curtis Funding No.1 Pty Ltd. 4.500% due 10/03/2023 1,600 1,739 Sinopec Group Overseas Development 2012 Ltd. 4.875% due 05/17/2042 21,330 23,380 Total China 25,119 (Cost $22,901)
COLOMBIA 3.2% CORPORATE BONDS & NOTES 1.1%
Ecopetrol S.A. 5.875% due 09/18/2023 3,100 3,351 5.875% due 05/28/2045 11,500 11,097 7.375% due 09/18/2043 8,000 9,080 7.625% due 07/23/2019 3,525 4,167 27,695
SOVEREIGN ISSUES 2.1%
Colombia Government International Bond 6.125% due 01/18/2041 22,180 27,059 7.375% due 09/18/2037 16,800 23,100 50,159
Total Colombia 77,854 (Cost $73,954)
COSTA RICA 0.5% SOVEREIGN ISSUES 0.5%
Costa Rica Government International Bond 4.250% due 01/26/2023 2,750 2,636 4.375% due 04/30/2025 3,500 3,281 5.625% due 04/30/2043 8,100 7,098 Total Costa Rica 13,015 (Cost $14,350)
CROATIA 0.3% SOVEREIGN ISSUES 0.3%
Croatia Government International Bond 5.500% due 04/04/2023 5,700 6,151 Total Croatia 6,151 (Cost $5,610)
PRINCIPAL AMOUNT
(000s) VALUE(000s)
DOMINICAN REPUBLIC 0.1% SOVEREIGN ISSUES 0.1%
Dominican Republic International Bond 5.500% due 01/27/2025 $ 2,300 $ 2,415 Total Dominican Republic 2,415 (Cost $2,300)
EL SALVADOR 3.0% SOVEREIGN ISSUES 3.0%
El Salvador Government International Bond 5.875% due 01/30/2025 7,570 7,532 6.375% due 01/18/2027 5,300 5,413 7.375% due 12/01/2019 860 946 7.625% due 02/01/2041 26,930 28,734 7.650% due 06/15/2035 19,600 20,972 8.250% due 04/10/2032 7,390 8,526 Total El Salvador 72,123 (Cost $78,363)
ETHIOPIA 0.3% SOVEREIGN ISSUES 0.3%
Federal Democratic Republic of Ethiopia 6.625% due 12/11/2024 6,200 6,231 Total Ethiopia 6,231 (Cost $6,188)
GABON 0.7% SOVEREIGN ISSUES 0.7%
Gabon Government International Bond 6.375% due 12/12/2024 17,002 16,492 Total Gabon 16,492 (Cost $15,849)
GHANA 0.3% SOVEREIGN ISSUES 0.3%
Republic of Ghana International Bond 8.125% due 01/18/2026 8,100 7,881 Total Ghana 7,881 (Cost $8,032)
GUATEMALA 1.4% SOVEREIGN ISSUES 1.4%
Guatemala Government Bond 4.875% due 02/13/2028 10,210 10,720 5.750% due 06/06/2022 21,490 23,854 Total Guatemala 34,574 (Cost $31,819)
HONG KONG 0.6% CORPORATE BONDS & NOTES 0.6%
CNOOC Finance 2013 Ltd. 3.000% due 05/09/2023 1,600 1,564 Nexen Energy ULC 6.400% due 05/15/2037 2,460 3,143 7.500% due 07/30/2039 7,440 10,608 Total Hong Kong 15,315 (Cost $13,976)
INDIA 0.9% CORPORATE BONDS & NOTES 0.9%
Bharat Petroleum Corp. Ltd. 4.625% due 10/25/2022 8,520 9,031
13
コ ン ン ン ン
コ ン ン ン ン2015 28
― 6 ―
03_90003_ コ ン ン ン ン _610574.indd 6 2015/11/05 16:00:30
― ―
04_607082_ ン .indd 21 2015/12/11 13:25:49
Schedule of Investments PIMCO Cayman Emerging Bond Fund (M) (Cont.)
See accompanying notes Annual Report | February 28, 2015
February 28, 2015
PRINCIPAL AMOUNT
(000s) VALUE (000s)
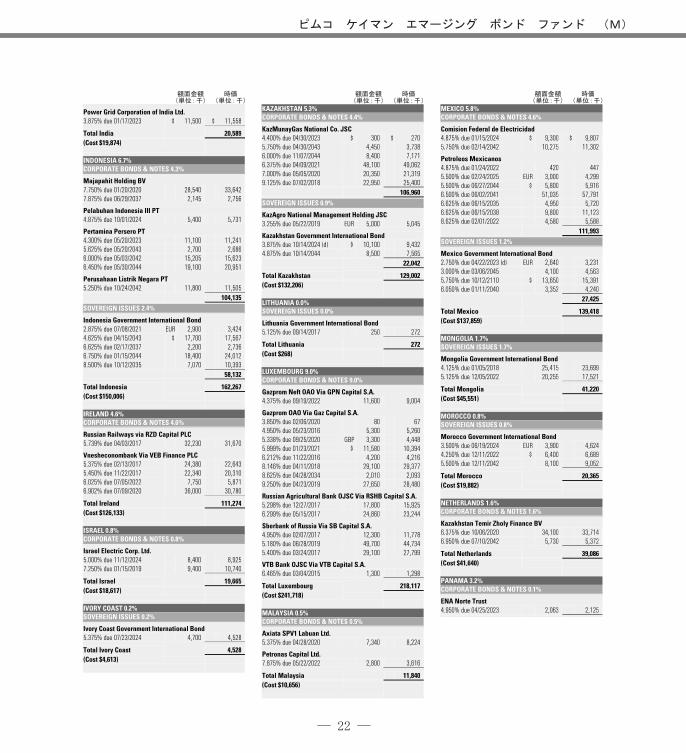
Power Grid Corporation of India Ltd. 3.875% due 01/17/2023 $ 11,500 $ 11,558 Total India 20,589 (Cost $19,874)
INDONESIA 6.7% CORPORATE BONDS & NOTES 4.3%
Majapahit Holding BV 7.750% due 01/20/2020 28,540 33,642 7.875% due 06/29/2037 2,145 2,756 Pelabuhan Indonesia III PT 4.875% due 10/01/2024 5,400 5,731 Pertamina Persero PT 4.300% due 05/20/2023 11,100 11,241 5.625% due 05/20/2043 2,700 2,686 6.000% due 05/03/2042 15,205 15,623 6.450% due 05/30/2044 19,100 20,951 Perusahaan Listrik Negara PT 5.250% due 10/24/2042 11,800 11,505 104,135
SOVEREIGN ISSUES 2.4%
Indonesia Government International Bond 2.875% due 07/08/2021 EUR 2,900 3,424 4.625% due 04/15/2043 $ 17,700 17,567 6.625% due 02/17/2037 2,200 2,736 6.750% due 01/15/2044 18,400 24,012 8.500% due 10/12/2035 7,070 10,393 58,132 Total Indonesia 162,267 (Cost $150,006)
IRELAND 4.6% CORPORATE BONDS & NOTES 4.6%
Russian Railways via RZD Capital PLC 5.739% due 04/03/2017 32,230 31,670 Vnesheconombank Via VEB Finance PLC 5.375% due 02/13/2017 24,380 22,643 5.450% due 11/22/2017 22,340 20,310 6.025% due 07/05/2022 7,750 5,871 6.902% due 07/09/2020 36,000 30,780 Total Ireland 111,274 (Cost $126,133)
ISRAEL 0.8% CORPORATE BONDS & NOTES 0.8%
Israel Electric Corp. Ltd. 5.000% due 11/12/2024 8,400 8,925 7.250% due 01/15/2019 9,400 10,740 Total Israel 19,665 (Cost $18,617)
IVORY COAST 0.2% SOVEREIGN ISSUES 0.2%
Ivory Coast Government International Bond 5.375% due 07/23/2024 4,700 4,528 Total Ivory Coast 4,528 (Cost $4,613)
PRINCIPAL AMOUNT
(000s) VALUE(000s)
KAZAKHSTAN 5.3% CORPORATE BONDS & NOTES 4.4%
KazMunayGas National Co. JSC 4.400% due 04/30/2023 $ 300 $ 270 5.750% due 04/30/2043 4,450 3,738 6.000% due 11/07/2044 8,400 7,171 6.375% due 04/09/2021 48,100 49,062 7.000% due 05/05/2020 20,350 21,319 9.125% due 07/02/2018 22,950 25,400 106,960
SOVEREIGN ISSUES 0.9%
KazAgro National Management Holding JSC 3.255% due 05/22/2019 EUR 5,000 5,045 Kazakhstan Government International Bond 3.875% due 10/14/2024 (d) $ 10,100 9,432 4.875% due 10/14/2044 8,500 7,565 22,042
Total Kazakhstan 129,002 (Cost $132,206)
LITHUANIA 0.0% SOVEREIGN ISSUES 0.0%
Lithuania Government International Bond 5.125% due 09/14/2017 250 272 Total Lithuania 272 (Cost $268)
LUXEMBOURG 9.0% CORPORATE BONDS & NOTES 9.0%
Gazprom Neft OAO Via GPN Capital S.A. 4.375% due 09/19/2022 11,600 9,004 Gazprom OAO Via Gaz Capital S.A. 3.850% due 02/06/2020 80 67 4.950% due 05/23/2016 5,300 5,260 5.338% due 09/25/2020 GBP 3,300 4,448 5.999% due 01/23/2021 $ 11,580 10,394 6.212% due 11/22/2016 4,200 4,216 8.146% due 04/11/2018 29,100 29,377 8.625% due 04/28/2034 2,010 2,093 9.250% due 04/23/2019 27,650 28,480 Russian Agricultural Bank OJSC Via RSHB Capital S.A. 5.298% due 12/27/2017 17,800 15,925 6.299% due 05/15/2017 24,860 23,244 Sberbank of Russia Via SB Capital S.A. 4.950% due 02/07/2017 12,300 11,778 5.180% due 06/28/2019 49,700 44,734 5.400% due 03/24/2017 29,100 27,799 VTB Bank OJSC Via VTB Capital S.A. 6.465% due 03/04/2015 1,300 1,298 Total Luxembourg 218,117 (Cost $241,718)
MALAYSIA 0.5% CORPORATE BONDS & NOTES 0.5%
Axiata SPV1 Labuan Ltd. 5.375% due 04/28/2020 7,340 8,224 Petronas Capital Ltd. 7.875% due 05/22/2022 2,800 3,616 Total Malaysia 11,840 (Cost $10,656)
PRINCIPAL AMOUNT
(000s) VALUE(000s)
MEXICO 5.8% CORPORATE BONDS & NOTES 4.6%
Comision Federal de Electricidad 4.875% due 01/15/2024 $ 9,300 $ 9,807 5.750% due 02/14/2042 10,275 11,302 Petroleos Mexicanos 4.875% due 01/24/2022 420 447 5.500% due 02/24/2025 EUR 3,000 4,299 5.500% due 06/27/2044 $ 5,800 5,916 6.500% due 06/02/2041 51,035 57,791 6.625% due 06/15/2035 4,950 5,720 6.625% due 06/15/2038 9,800 11,123 8.625% due 02/01/2022 4,580 5,588 111,993
SOVEREIGN ISSUES 1.2%
Mexico Government International Bond 2.750% due 04/22/2023 (d) EUR 2,640 3,231 3.000% due 03/06/2045 4,100 4,563 5.750% due 10/12/2110 $ 13,650 15,391 6.050% due 01/11/2040 3,352 4,240 27,425
Total Mexico 139,418 (Cost $137,859)
MONGOLIA 1.7% SOVEREIGN ISSUES 1.7%
Mongolia Government International Bond 4.125% due 01/05/2018 25,415 23,699 5.125% due 12/05/2022 20,255 17,521 Total Mongolia 41,220 (Cost $45,551)
MOROCCO 0.8% SOVEREIGN ISSUES 0.8%
Morocco Government International Bond 3.500% due 06/19/2024 EUR 3,900 4,624 4.250% due 12/11/2022 $ 6,400 6,689 5.500% due 12/11/2042 8,100 9,052 Total Morocco 20,365 (Cost $19,882)
NETHERLANDS 1.6% CORPORATE BONDS & NOTES 1.6%
Kazakhstan Temir Zholy Finance BV 6.375% due 10/06/2020 34,100 33,714 6.950% due 07/10/2042 5,730 5,372 Total Netherlands 39,086 (Cost $41,640)
PANAMA 3.2% CORPORATE BONDS & NOTES 0.1%
ENA Norte Trust 4.950% due 04/25/2023 2,063 2,125
14
コ ン ン ン ン
― 7 ―
03_90003_ コ ン ン ン ン _610574.indd 7 2015/11/05 16:00:31
― ―
04_607082_ ン .indd 22 2015/12/11 13:25:49

Schedule of Investments PIMCO Cayman Emerging Bond Fund (M) (Cont.)
See accompanying notes Annual Report | February 28, 2015
February 28, 2015
PRINCIPAL AMOUNT
(000s) VALUE (000s)
SOVEREIGN ISSUES 3.1%
Panama Government International Bond 4.300% due 04/29/2053 $ 11,300 $ 11,046 5.200% due 01/30/2020 2,700 3,024 6.700% due 01/26/2036 12,921 17,169 7.125% due 01/29/2026 9,057 11,933 8.125% due 04/28/2034 5,400 7,843 8.875% due 09/30/2027 10,440 15,464 9.375% due 01/16/2023 6,200 8,649 75,128 Total Panama 77,253 (Cost $70,424)
PARAGUAY 0.5% SOVEREIGN ISSUES 0.5%
Republic of Paraguay International Bond 6.100% due 08/11/2044 11,800 13,083 Total Paraguay 13,083 (Cost $11,800)
PERU 2.6% CORPORATE BONDS & NOTES 0.0%
Corp. Financiera de Desarrollo S.A. 4.750% due 02/08/2022 800 860
SOVEREIGN ISSUES 2.6%
Fondo MIVIVIENDA S.A. 3.500% due 01/31/2023 13,400 13,266 Peru Government International Bond 6.550% due 03/14/2037 2,505 3,338 8.750% due 11/21/2033 29,158 46,507 63,111 Total Peru 63,971 (Cost $58,484)
PHILIPPINES 2.3% CORPORATE BONDS & NOTES 1.9%
Power Sector Assets & Liabilities Management Corp. 7.390% due 12/02/2024 33,250 44,430
SOVEREIGN ISSUES 0.4%
Philippines Government International Bond 3.950% due 01/20/2040 9,500 10,058 10.625% due 03/16/2025 300 490 10,548 Total Philippines 54,978 (Cost $47,778)
RUSSIA 2.2% CORPORATE BONDS & NOTES 1.9%
ALROSA Finance S.A. 7.750% due 11/03/2020 12,400 12,090 SCF Capital Ltd. 5.375% due 10/27/2017 36,700 32,084 44,174
SOVEREIGN ISSUES 0.3%
Russia Government International Bond 5.625% due 04/04/2042 3,950 3,377 7.500% due 03/31/2030 (d) 4,110 4,413 7,790 Total Russia 51,964 (Cost $58,903)
PRINCIPAL AMOUNT
(000s) VALUE(000s)
SENEGAL 1.0% SOVEREIGN ISSUES 1.0%
Senegal Government International Bond 8.750% due 05/13/2021 $ 20,350 $ 23,514 Total Senegal 23,514 (Cost $21,063)
SLOVENIA 1.3% SOVEREIGN ISSUES 1.3%
Slovenia Government International Bond 4.125% due 01/26/2020 EUR 100 131 5.250% due 02/18/2024 $ 26,600 30,391 Total Slovenia 30,522 (Cost $27,311)
SOUTH AFRICA 4.5% CORPORATE BONDS & NOTES 2.2%
Eskom Holdings SOC Ltd. 5.750% due 01/26/2021 16,900 16,833 6.750% due 08/06/2023 21,400 22,103 Transnet SOC Ltd. 4.000% due 07/26/2022 15,000 14,737 53,673
SOVEREIGN ISSUES 2.3%
South Africa Government International Bond 3.750% due 07/24/2026 EUR 3,000 3,668 4.665% due 01/17/2024 (d) $ 7,700 8,174 5.375% due 07/24/2044 7,500 8,212 5.500% due 03/09/2020 14,800 16,332 5.875% due 09/16/2025 16,000 18,480 54,866
Total South Africa 108,539 (Cost $105,834)
SRI LANKA 1.7% CORPORATE BONDS & NOTES 0.2%
National Savings Bank 5.150% due 09/10/2019 5,400 5,318
SOVEREIGN ISSUES 1.5%
Sri Lanka Government International Bond 5.125% due 04/11/2019 10,000 10,075 6.250% due 10/04/2020 12,700 13,367 6.250% due 07/27/2021 12,515 13,125 36,567
Total Sri Lanka 41,885 (Cost $40,875)
TANZANIA 0.3% SOVEREIGN ISSUES 0.3%
Tanzania Government International Bond 6.329% due 03/09/2020 6,400 6,640 Total Tanzania 6,640 (Cost $6,400)
TRINIDAD AND TOBAGO 0.7% CORPORATE BONDS & NOTES 0.7%
Petroleum Co. of Trinidad & Tobago Ltd. 6.000% due 05/08/2022 11,575 11,749 9.750% due 08/14/2019 3,260 3,863 Total Trinidad and Tobago 15,612 (Cost $15,049)
PRINCIPAL AMOUNT
(000s) VALUE(000s)
TUNISIA 0.4% SOVEREIGN ISSUES 0.4%
Banque Centrale de Tunisie S.A. 3.280% due 08/09/2027 ¥ 1,700,000 $ 10,637 Total Tunisia 10,637 (Cost $14,982)
TURKEY 2.5% CORPORATE BONDS & NOTES 0.7%
Export Credit Bank of Turkey 5.000% due 09/23/2021 $ 900 914 5.875% due 04/24/2019 14,750 15,697 16,611
SOVEREIGN ISSUES 1.8%
Turkey Government International Bond 6.750% due 05/30/2040 26,090 32,449 7.250% due 03/05/2038 8,600 11,202 43,651
Total Turkey 60,262 (Cost $54,547)
UKRAINE 1.1% SOVEREIGN ISSUES 1.1%
Ukraine Government International Bond 6.250% due 06/17/2016 900 396 6.580% due 11/21/2016 3,000 1,309 6.875% due 09/23/2015 (d) 2,950 1,505 7.500% due 04/17/2023 (d) 18,600 7,998 7.750% due 09/23/2020 9,200 3,956 7.800% due 11/28/2022 2,500 1,078 7.950% due 02/23/2021 (d) 5,500 2,394 9.250% due 07/24/2017 (d) 19,970 8,797 Total Ukraine 27,433 (Cost $59,800)
UNITED ARAB EMIRATES 0.4% CORPORATE BONDS & NOTES 0.0%
Dolphin Energy Ltd. 5.500% due 12/15/2021 400 461 DP World Ltd. 6.850% due 07/02/2037 320 374 835
SOVEREIGN ISSUES 0.4%
Dubai Government International Bond 5.250% due 01/30/2043 9,200 8,786 Total United Arab Emirates 9,621 (Cost $9,705)
UNITED STATES 0.2% U.S. GOVERNMENT AGENCIES 0.2%
Federal Home Loan Bank 4.125% due 12/13/2019 3,485 3,883 Total United States 3,883 (Cost $3,669)
URUGUAY 1.4% SOVEREIGN ISSUES 1.4%
Uruguay Government International Bond 7.625% due 03/21/2036 14,690 20,713 7.875% due 01/15/2033 (a) 10,040 14,207
15
コ ン ン ン ン
― ―
03_90003_ コ ン ン ン ン _610574.indd 8 2015/11/05 16:00:32
― 3 ―
04_607082_ ン .indd 23 2015/12/11 13:25:50

Schedule of Investments PIMCO Cayman Emerging Bond Fund (M) (Cont.)
See accompanying notes Annual Report | February 28, 2015
February 28, 2015
PRINCIPAL AMOUNT
(000s) VALUE (000s)
Total Uruguay $ 34,920 (Cost $29,925)
VENEZUELA 1.4% CORPORATE BONDS & NOTES 0.4%
Petroleos de Venezuela S.A. 5.375% due 04/12/2027 $ 3,580 1,175 5.500% due 04/12/2037 22,990 7,309 8.500% due 11/02/2017 35 23 9.750% due 05/17/2035 5,050 1,939 10,446
SOVEREIGN ISSUES 1.0%
Venezuela Government International Bond 7.000% due 03/31/2038 10,900 3,897 7.650% due 04/21/2025 24,600 8,979 7.750% due 10/13/2019 20 7 8.250% due 10/13/2024 16,430 6,161 9.000% due 05/07/2023 60 23 9.375% due 01/13/2034 5,874 2,291 12.750% due 08/23/2022 3,075 1,504 22,862 Total Venezuela 33,308 (Cost $64,804)
ZAMBIA 0.6% SOVEREIGN ISSUES 0.6%
Zambia Government International Bond 5.375% due 09/20/2022 15,050 14,098 Total Zambia 14,098 (Cost $14,927)
SHORT-TERM INSTRUMENTS 4.7%
COMMERCIAL PAPER 3.6%
Fannie Mae 0.060% due 04/06/2015 6,800 6,800 0.080% due 05/01/2015 6,800 6,800 Federal Farm Credit Bank 0.110% due 03/31/2015 600 600 Federal Home Loan Bank 0.060% due 04/06/2015 1,000 1,000 0.066% due 03/27/2015 900 900 0.069% due 04/29/2015 (b) 16,200 16,199 0.080% due 04/17/2015 2,700 2,700 0.080% due 05/01/2015 2,500 2,500 0.090% due 04/24/2015 900 900 0.090% due 05/18/2015 10,700 10,699 0.090% due 05/19/2015 6,100 6,100 0.155% due 07/16/2015 100 100 0.170% due 09/04/2015 1,200 1,199 0.170% due 09/09/2015 7,000 6,997 Freddie Mac 0.070% due 04/09/2015 10,500 10,500 0.080% due 04/27/2015 5,700 5,700 0.120% due 05/27/2015 2,000 2,000 0.130% due 06/09/2015 5,800 5,799 87,493
REPURCHASE AGREEMENTS (c) 0.9% 22,500
PRINCIPAL AMOUNT
(000s) VALUE(000s)
TIME DEPOSITS 0.1%
ANZ National Bank 0.030% due 03/02/2015 $ 41 $ 41 0.086% due 03/02/2015 GBP 51 78 Bank of Tokyo-Mitsubishi UFJ Ltd. 0.005% due 03/02/2015 ¥ 14,523 122 0.030% due 03/02/2015 $ 74 74 Brown Brothers Harriman & Co. 0.005% due 03/02/2015 ¥ 146 1 0.086% due 03/02/2015 GBP 1 1 Citibank N.A. 0.030% due 03/02/2015 $ 465 465 DBS Bank Ltd. 0.030% due 03/02/2015 854 854 DnB NORBank ASA (0.169%) due 03/02/2015 EUR 18 21 0.030% due 03/02/2015 $ 287 287 HSBC Bank 0.005% due 03/02/2015 ¥ 7,134 60 0.086% due 03/02/2015 GBP 126 194 4.950% due 03/02/2015 ZAR 4 0 JPMorgan Chase & Co. 0.030% due 03/02/2015 $ 286 286 Nordea Bank AB (0.169%) due 03/02/2015 EUR 67 75 0.030% due 03/02/2015 $ 4 4 Sumitomo Mitsui Banking Corp. (0.169%) due 03/02/2015 EUR 47 53 0.005% due 03/02/2015 ¥ 6,078 51 Wells Fargo Bank (0.169%) due 03/02/2015 EUR 34 38 0.030% due 03/02/2015 $ 59 59 2,764
U.S. TREASURY BILLS 0.1%
0.035% due 04/02/2015 (h) $ 702 702
Total Short-Term Instruments 113,459 (Cost $113,447)
Total Investments in Securities 97.8% $ 2,365,643 (Cost $2,451,034)
Financial Derivative Instruments (e)(g) (0.0%) (1,190 )
(Cost or Premiums, net $(3,593))
Other Assets and Liabilities, net 2.2% 55,034
Net Assets 100.0% $ 2,419,487
16
コ ン ン ン ン
― ―
03_90003_ コ ン ン ン ン _610574.indd 9 2015/11/05 16:00:32
― 4 ―
04_607082_ ン .indd 24 2015/12/11 13:25:50

Schedule of Investments PIMCO Cayman Emerging Bond Fund (M) (Cont.)
See accompanying notes Annual Report | February 28, 2015
February 28, 2015
NOTES TO SCHEDULE OF INVESTMENTS (AMOUNTS IN THOUSANDS*, EXCEPT NUMBER OF CONTRACTS): * A zero balance may reflect actual amounts rounding to less than one thousand. (a) Payment in-kind bond security. (b) Coupon represents a weighted average rate.
BORROWINGS AND OTHER FINANCING TRANSACTIONS (c) REPURCHASE AGREEMENTS:
Counterparty Lending
Rate Settlement
Date Maturity
Date Principal Amount Collateralized By
Collateral Received, at Value
RepurchaseAgreements,
at Value
Repurchase Agreement Proceeds
to be Received(1)
SAL 0.120% 02/27/2015 03/02/2015 $ 22,500 U.S. Treasury Notes 2.000% due 10/31/2021 $ (23,031) $ 22,500 $ 22,500 Total Repurchase Agreements $ (23,031) $ 22,500 $ 22,500 (1) Includes accrued interest.
REVERSE REPURCHASE AGREEMENTS:
Counterparty Borrowing
rate Borrowing
Date Maturity
Date Amount
Borrowed(3)
Payable for Reverse Repurchase
Agreements BRC (4.500%) 02/20/2015 N/A(2) $ (133) $ (133 ) CFR (0.500%) 12/16/2014 N/A(2) (4,923) (4,918 ) CFR (1.250%) 11/12/2014 N/A(2) (2,905) (2,894 ) CFR (1.250%) 11/19/2014 03/02/2015 (565) (563 ) CFR (1.250%) 03/02/2015 N/A(2) (702) (702 ) CFR (1.500%) 09/16/2014 N/A(2) (1,549) (1,538 ) CFR (1.500%) 10/02/2014 N/A(2) (1,531) (1,522 ) CFR (1.500%) 10/30/2014 N/A(2) (2,006) (1,996 ) CFR (2.000%) 02/20/2015 03/03/2015 (7,212) (7,208 ) CFR (2.000%) 03/03/2015 N/A(2) (4,513) (4,513 ) CFR (2.500%) 02/13/2015 N/A(2) (1,723) (1,721 ) CFR (2.500%) 02/23/2015 N/A(2) (2,691) (2,690 ) JML (1.000%) 02/12/2015 N/A(2) EUR (2,206) (2,473 ) JML (1.500%) 02/26/2015 N/A(2) $ (428) (427 ) JML (1.500%) 02/27/2015 03/02/2015 (1,661) (1,660 ) JML (1.500%) 03/02/2015 N/A(2) (1,499) (1,499 ) Total Reverse Repurchase Agreements $ (36,457 )
(2) Open maturity reverse repurchase agreement. (3) The average amount of borrowings outstanding during the period ended February 28, 2015 was $16,742 at a weighted average interest rate of (1.401%). BORROWINGS AND OTHER FINANCING TRANSACTIONS SUMMARY The following is a summary by counterparty of the market value of Borrowings and Other Financing Transactions and collateral (received)/pledged as of February 28, 2015: (d) Securities with an aggregate market value of $31,340 and cash of $410 have been pledged as collateral under the terms of the following master agreements as of February 28, 2015.
Counterparty
Repurchase Agreement Proceeds
to be Received
Payable for Reverse
Repurchase Agreements
Payable for Sale-Buyback Transactions
Payable for Short Sales
Total Borrowings and Other Financing
Transactions Collateral
(Received)/Pledged Net Exposures(4) Global/Master Repurchase Agreement BRC $ 0 $ (133) $ 0 $ 0 $ (133) $ 128 $ (5) CFR 0 (30,265) 0 0 (30,265) 25,339 (4,926) JML 0 (6,059) 0 0 (6,059) 6,283 224 SAL 22,500 0 0 0 22,500 (23,031) (531) Total Borrowings and Other Financing Transactions $ 22,500 $ (36,457) $ 0 $ 0 (4) Net exposures represent the net receivable/(payable) that would be due from/to the counterparty in the event of default. Exposure from borrowings and other financing transactions can only be netted across transactions governed under the
same master agreement with the same legal entity. See Note 7, Principal Risks, in the Notes to Financial Statements for more information regarding master netting arrangements.
17
コ ン ン ン ン
ト
― ―
03_90003_ コ ン ン ン ン _610574.indd 10 2015/11/05 16:00:33
― 5 ―
04_607082_ ン .indd 25 2015/12/11 13:25:51

Schedule of Investments PIMCO Cayman Emerging Bond Fund (M) (Cont.)
See accompanying notes Annual Report | February 28, 2015
February 28, 2015
(e) FINANCIAL DERIVATIVE INSTRUMENTS: EXCHANGE-TRADED OR CENTRALLY CLEARED 3
FUTURES CONTRACTS:
Description TypeExpiration
Month # of
Contracts Unrealized
(Depreciation) Variation Margin
Asset Liability U.S. Treasury 10-Year Note June Futures Short 06/2015 20 $ (22 ) $ 0 $ (3 ) Total Futures Contracts $ (22 ) $ 0 $ (3 )
SWAP AGREEMENTS:
CREDIT DEFAULT SWAPS ON CREDIT INDICES - SELL PROTECTION(1)
Index/Tranches Fixed Deal
Receive Rate Maturity
Date Notional Amount(2)
Market Value(3)
Unrealized Appreciation
Variation Margin Asset Liability
CDX.EM-22 Index 1.000% 12/20/2019 $ 50,800 $ (5,778) $ 192 $ 97 $ 0 Total Swap Agreements $ (5,778) $ 192 $ 97 $ 0
(1) If the Fund is a seller of protection and a credit event occurs, as defined under the terms of that particular swap agreement, the Fund will either (i) pay to the buyer of protection an amount equal to the notional amount of the swap and take delivery of the referenced obligation or underlying securities comprising the referenced index or (ii) pay a net settlement amount in the form of cash or securities equal to the notional amount of the swap less the recovery value of the referenced obligation or underlying securities comprising the referenced index. (2) The maximum potential amount the Fund could be required to pay as a seller of credit protection or receive as a buyer of credit protection if a credit event occurs as defined under the terms of that particular swap agreement. (3) The prices and resulting values for credit default swap agreements on credit indices serve as an indicator of the current status of the payment/performance risk and represent the likelihood of an expected liability (or profit) for the credit derivative should the notional amount of the swap agreement be closed/sold as of the period end. Increasing market values, in absolute terms when compared to the notional amount of the swap, represent a deterioration of the referenced entity's credit soundness and a greater likelihood or risk of default or other credit event occurring as defined under the terms of the agreement. FINANCIAL DERIVATIVE INSTRUMENTS: EXCHANGE-TRADED OR CENTRALLY CLEARED SUMMARY The following is a summary of the market value and variation margin of Exchange-Traded or Centrally Cleared Financial Derivative Instruments as of February 28, 2015: (f) Cash of $9,412 has been pledged as collateral for exchange-traded and centrally cleared financial derivative instruments as of February 28, 2015. See Note 7, Principal Risks, in the Notes to Financial Statements for more information regarding master netting arrangements. Financial Derivative Assets Financial Derivative Liabilities
Market Value Variation Margin
Asset Market Value Variation Margin
Liability
Purchased
Options Futures Swap
Agreements Total Written Options Futures
Swap Agreements Total
Total Exchange-Traded or Centrally Cleared $ 0 $ 0 $ 97 $ 97 $ 0 $ (3 ) $ 0 $ (3 )
(g) FINANCIAL DERIVATIVE INSTRUMENTS: OVER THE COUNTER FORWARD FOREIGN CURRENCY CONTRACTS:
Counterparty Settlement
Month Currency to
be Delivered Currency to be Received
Unrealized Appreciation/(Depreciation) Asset Liability
BOA 04/2015 GBP 3,362 $ 5,067 $ 0 $ (127 ) DUB 05/2015 BRL 34,146 13,207 1,489 0 FBF 03/2015 JPY 1,315,784 11,151 145 0 GLM 03/2015 $ 17,068 EUR 15,111 0 (119 ) HUS 03/2015 EUR 35,869 $ 40,800 568 0 JPM 07/2015 BRL 71,218 26,203 2,204 0 MSB 04/2015 $ 27,602 BRL 76,046 0 (1,279 ) UAG 03/2015 23,600 EUR 20,758 0 (317 ) UAG 03/2015 11,008 JPY 1,315,784 0 (1 ) UAG 04/2015 EUR 20,758 $ 23,608 316 0 UAG 04/2015 JPY 1,315,784 11,013 1 0 Total Forward Foreign Currency Contracts $ 4,723 $ (1,843 )
18
コ ン ン ン ン
ン ン
― ―
03_90003_ コ ン ン ン ン _610574.indd 11 2015/11/05 16:00:33
― 6 ―
04_607082_ ン .indd 26 2015/12/11 13:25:51

Schedule of Investments PIMCO Cayman Emerging Bond Fund (M) (Cont.)
See accompanying notes Annual Report | February 28, 2015
February 28, 2015
TRANSACTIONS IN WRITTEN CALL AND PUT OPTIONS FOR THE PERIOD ENDED FEBRUARY 28, 2015
Notional Amount in $ Premiums
Balance at 02/28/2014 $ 850,400 $ (2,531 ) Sales 11,000 (77 ) Closing Buys 0 0 Expirations (861,400 ) 2,608 Exercised 0 0 Balance at 02/28/2015 $ 0 $ 0 SWAP AGREEMENTS:
CREDIT DEFAULT SWAPS ON CORPORATE, SOVEREIGN, AND U.S. MUNICIPAL ISSUES - BUY PROTECTION(1)
Counterparty Reference Entity Fixed Deal (Pay) Rate
Maturity Date
Implied Credit Spread at
February 28, 2015(3) Notional Amount(4)
Premiums Paid
Unrealized (Depreciation)
Swap Agreements, at Value Asset Liability
GST Russia Government International Bond (1 .000%) 03/20/2020 4.777% $ 500 $ 91 $ (11 ) $ 80 $ 0 JPM Russia Government International Bond (1 .000%) 03/20/2020 4.777% 2,200 397 (48 ) 349 0 $ 488 $ (59 ) $ 429 $ 0
CREDIT DEFAULT SWAPS ON CORPORATE, SOVEREIGN, AND U.S. MUNICIPAL ISSUES - SELL PROTECTION(2)
Counterparty Reference Entity Fixed Deal
Receive Rate Maturity
Date
Implied Credit Spread at
February 28, 2015(3) Notional Amount(4)
Premiums Paid/(Received)
Unrealized Appreciation/ (Depreciation)
Swap Agreements, at Value Asset Liability
BOA Brazil Government International Bond 1.000 % 12/20/2018 2.077% $ 3,000 $ (94 ) $ (17 ) $ 0 $ (111 ) BOA Brazil Government International Bond 1.000 % 09/20/2019 2.273% 7,100 (104 ) (266 ) 0 (370 ) BOA Gazprom OAO Via Gaz Capital S.A. 1.000 % 12/20/2016 6.347% 1,000 (16 ) (72 ) 0 (88 ) BOA Indonesia Government International Bond 1.000 % 12/20/2019 1.260% 3,800 (112 ) 74 0 (38 ) BOA Panama Government International Bond 1.000 % 12/20/2018 0.973% 11,500 (84 ) 118 34 0 BRC Brazil Government International Bond 1.000 % 12/20/2020 2.525% 1,000 (40 ) (38 ) 0 (78 ) BRC Gazprom OAO Via Gaz Capital S.A. 1.000 % 12/20/2016 6.347% 1,000 (16 ) (73 ) 0 (89 ) BRC Russia Government International Bond 1.000 % 09/20/2015 4.277% 1,000 (36 ) 20 0 (16 ) BRC South Africa Government International Bond 1.000 % 06/20/2019 1.699% 6,400 (238 ) 67 0 (171 ) CBK Brazil Government International Bond 1.000 % 09/20/2019 2.273% 3,600 (53 ) (134 ) 0 (187 ) CBK Brazil Government International Bond 1.000 % 03/20/2021 2.560% 4,700 (208 ) (178 ) 0 (386 ) CBK Colombia Government International Bond 1.000 % 12/20/2018 1.076% 900 (9 ) 8 0 (1 ) CBK Colombia Government International Bond 1.000 % 06/20/2019 1.173% 2,900 13 (28 ) 0 (15 ) CBK Rosneft Oil Co. via Rosneft International
Finance Ltd. 1.000 % 03/20/2015 7.031% 17,500 (455 ) 427 0 (28 ) DUB Brazil Government International Bond 1.000 % 06/20/2021 2.593% 4,000 (177 ) (171 ) 0 (348 ) FBF Panama Government International Bond 1.000 % 12/20/2018 0.973% 4,600 (33 ) 47 14 0 GST Brazil Government International Bond 1.000 % 09/20/2019 2.273% 19,000 (293 ) (698 ) 0 (991 ) GST Colombia Government International Bond 1.000 % 12/20/2018 1.076% 5,700 (47 ) 42 0 (5 ) GST Colombia Government International Bond 1.000 % 06/20/2019 1.173% 2,100 10 (21 ) 0 (11 ) GST Panama Government International Bond 1.000 % 12/20/2018 0.973% 1,000 (7 ) 10 3 0 HUS Brazil Government International Bond 1.000 % 06/20/2021 2.593% 1,100 (46 ) (50 ) 0 (96 ) HUS Mexico Government International Bond 1.000 % 03/20/2021 1.179% 3,300 (152 ) 125 0 (27 ) HUS Panama Government International Bond 1.000 % 12/20/2018 0.973% 8,100 (47 ) 71 24 0 HUS South Africa Government International Bond 1.000 % 06/20/2019 1.699% 3,300 (114 ) 26 0 (88 ) HUS South Africa Government International Bond 1.000 % 03/20/2023 2.322% 7,400 (762 ) 99 0 (663 ) HUS Turkey Government International Bond 1.000 % 03/20/2019 1.705% 9,900 (547 ) 296 0 (251 ) JPM Mexico Government International Bond 1.000 % 06/20/2021 1.212% 2,000 (74 ) 53 0 (21 ) MYC Brazil Government International Bond 1.000 % 09/20/2019 2.273% 10,500 (192 ) (355 ) 0 (547 ) MYC Mexico Government International Bond 1.000 % 06/20/2021 1.212% 4,000 (148 ) 106 0 (42 ) $ (4,081 ) $ (512 ) $ 75 $ (4,668 ) Total Swap Agreements $ (3,593 ) $ (571 ) $ 504 $ (4,668 )
(1) If the Fund is a buyer of protection and a credit event occurs, as defined under the terms of that particular swap agreement, the Fund will either (i) receive from the seller of protection an amount equal to the notional amount of the swap
and deliver the referenced obligation or underlying securities comprising the referenced index or (ii) receive a net settlement amount in the form of cash or securities equal to the notional amount of the swap less the recovery value of the referenced obligation or underlying securities comprising the referenced index.
(2) If the Fund is a seller of protection and a credit event occurs, as defined under the terms of that particular swap agreement, the Fund will either (i) pay to the buyer of protection an amount equal to the notional amount of the swap and take delivery of the referenced obligation or underlying securities comprising the referenced index or (ii) pay a net settlement amount in the form of cash or securities equal to the notional amount of the swap less the recovery value of the referenced obligation or underlying securities comprising the referenced index.
19
コ ン ン ン ン
2015 28ン ト
2015 28ン ト
― ―
03_90003_ コ ン ン ン ン _610574.indd 12 2015/11/05 16:00:33
― 7 ―
04_607082_ ン .indd 27 2015/12/11 13:25:51

Schedule of Investments PIMCO Cayman Emerging Bond Fund (M) (Cont.)
See accompanying notes Annual Report | February 28, 2015
February 28, 2015
(3) Implied credit spreads, represented in absolute terms, utilized in determining the market value of credit default swap agreements on corporate issues, U.S. Municipal issues or sovereign issues as of period end serve as an indicator of the current status of the payment/performance risk and represent the likelihood or risk of default for the credit derivative. The implied credit spread of a particular referenced entity reflects the cost of buying/selling protection and may include upfront payments required to be made to enter into the agreement. Wider credit spreads represent a deterioration of the referenced entity's credit soundness and a greater likelihood or risk of default or other credit event occurring as defined under the terms of the agreement.
(4) The maximum potential amount the Fund could be required to pay as a seller of credit protection or receive as a buyer of credit protection if a credit event occurs as defined under the terms of that particular swap agreement. FINANCIAL DERIVATIVE INSTRUMENTS: OVER THE COUNTER SUMMARY The following is a summary by counterparty of the market value of OTC financial derivative instruments and collateral (received)/pledged as of February 28, 2015: (h) Securities with an aggregate market value of $702 and cash of $4,263 have been pledged as collateral for financial derivative instruments as governed by
International Swaps and Derivatives Association, Inc. master agreements as of February 28, 2015. Financial Derivative Assets Financial Derivative Liabilities
Counterparty
Forward Foreign
Currency Contracts
Purchased Options
Swap Agreements
Total Over the Counter
Forward Foreign
Currency Contracts
WrittenOptions
Swap Agreements
Total Over the Counter
Net Market Value of OTC Derivatives
Collateral (Received)/
Pledged Net
Exposures(5) BOA $ 0 $ 0 $ 34 $ 34 $ (127 ) $ 0 $ (607 ) $ (734 ) $ (700 ) $ 651 $ (49 ) BRC 0 0 0 0 0 0 (354 ) (354 ) (354 ) 451 97 CBK 0 0 0 0 0 0 (617 ) (617 ) (617 ) 432 (185 ) DUB 1,489 0 0 1,489 0 0 (348 ) (348 ) 1,141 (1,100 ) 41 FBF 145 0 14 159 0 0 0 0 159 0 159 GLM 0 0 0 0 (119 ) 0 0 (119 ) (119 ) 0 (119 ) GST 0 0 83 83 0 0 (1,007 ) (1,007 ) (924 ) 815 (109 ) HUS 568 0 24 592 0 0 (1,125 ) (1,125 ) (533 ) 484 (49 ) JPM 2,204 0 349 2,553 0 0 (21 ) (21 ) 2,532 (2,681 ) (149 ) MSB 0 0 0 0 (1,279 ) 0 0 (1,279 ) (1,279 ) 1,480 201 MYC 0 0 0 0 0 0 (589 ) (589 ) (589 ) 462 (127 ) UAG 317 0 0 317 (318 ) 0 0 (318 ) (1 ) 0 (1 ) Total Over the Counter $ 4,723 $ 0 $ 504 $ 5,227 $ (1,843 ) $ 0 $ (4,668 ) $ (6,511 )
(5) Net exposures represent the net receivable/(payable) that would be due from/to the counterparty in the event of default. Exposure from OTC financial derivative instruments can only be netted across transactions governed under the same
master agreement with the same legal entity. See Note 7, Principal Risks, in the Notes to Financial Statements for more information regarding master netting arrangements. FAIR VALUE OF FINANCIAL DERIVATIVE INSTRUMENTS The following is a summary of the fair valuation of the Fund's derivative instruments categorized by risk exposure: Fair Values of Financial Derivative Instruments on the Statements of Assets and Liabilities as of February 28, 2015:
Derivatives not accounted for as hedging instruments
Commodity Contracts
Credit Contracts
Equity Contracts
Foreign Currency Contracts
Interest Rate
Contracts Total Financial Derivative Instruments - Assets Exchange-traded or centrally cleared
Swap Agreements $ 0 $ 97 $ 0 $ 0 $ 0 $ 97
Over the counter Forward Foreign Currency Contracts $ 0 $ 0 $ 0 $ 4,723 $ 0 $ 4,723Swap Agreements 0 504 0 0 0 504
$ 0 $ 504 $ 0 $ 4,723 $ 0 $ 5,227 $ 0 $ 601 $ 0 $ 4,723 $ 0 $ 5,324 Financial Derivative Instruments - Liabilities Exchange-traded or centrally cleared
Futures $ 0 $ 0 $ 0 $ 0 $ (3 ) $ (3 )
Over the counter Forward Foreign Currency Contracts $ 0 $ 0 $ 0 $ (1,843 ) $ 0 $ (1,843 )Swap Agreements 0 (4,668 ) 0 0 0 (4,668 )
$ 0 $ (4,668 ) $ 0 $ (1,843 ) $ 0 $ (6,511 ) $ 0 $ (4,668 ) $ 0 $ (1,843 ) $ (3 ) $ (6,514 )
20
コ ン ン ン ン ト ン
ト ン
― 3 ―
03_90003_ コ ン ン ン ン _610574.indd 13 2015/11/05 16:00:33
32
― ―
04_607082_ ン .indd 28 2015/12/11 13:25:52

w7461_全体_08_コピー.docx
15/7/7 15 時 24 分
ページ:1
マネー・マーケット・マザーファンド
― 1 ―
マネー・マーケット・マザーファンド
《第21期》決算日2015年5月20日
[計算期間:2014年11月21日~2015年5月20日]
「マネー・マーケット・マザーファンド」は、5月20日に第21期の決算を行いました。 以下、法令・諸規則に基づき、当マザーファンドの第21期の運用状況をご報告申し上げます。
運 用 方 針 わが国の短期公社債等を中心に投資し、利子等収益の確保を図ります。なお、市況動向および資金動向等により、上記のような運用が行えない場合があります。
主 要 運 用 対 象 わが国の公社債等を主要投資対象とします。
主 な 組 入 制 限 外貨建資産への投資は行いません。
○最近5期の運用実績
決 算 期 基 準 価 額
債 券組 入 比 率
債 券 先 物 比 率
純 資 産総 額
期 中騰 落 率
円 % % % 百万円
17期(2013年5月20日) 10,174 0.0 84.0 - 2,855
18期(2013年11月20日) 10,178 0.0 87.7 - 2,850
19期(2014年5月20日) 10,180 0.0 84.7 - 2,716
20期(2014年11月20日) 10,183 0.0 84.3 - 2,373
21期(2015年5月20日) 10,183 0.0 89.3 - 1,959 (注)当ファンドは主として短期債券、コール・ローンなどによる運用を行い、安定的な収益の確保をめざすファンドであり、また、値動
きを表す適切な指数が存在しないため、ベンチマークおよび参考指数はありません。 (注)「債券先物比率」は買建比率-売建比率。
○当期中の基準価額と市況等の推移
年 月 日 基 準 価 額 債 券
組 入 比 率 債 券先 物 比 率 騰 落 率
(期 首) 円 % % %
2014年11月20日 10,183 - 84.3 -
11月末 10,183 0.0 90.0 -
12月末 10,183 0.0 85.3 -
2015年1月末 10,183 0.0 92.4 -
2月末 10,183 0.0 82.7 -
3月末 10,183 0.0 93.7 -
4月末 10,183 0.0 94.2 -
(期 末)
2015年5月20日 10,183 0.0 89.3 - (注)騰落率は期首比。 (注)「債券先物比率」は買建比率-売建比率。
968469
― ―
04_607082_ ン .indd 29 2015/12/11 13:25:52

w7461_全体_08_コピー.docx
15/7/7 15 時 24 分
ページ:2
マネー・マーケット・マザーファンド
― 2 ―
○運用 当期中の基準価額等の推移に い 基準価額の動き
投資 に い 国 短期金 市場
当 投資 の ートフ に い
○ の運用方針 運用 の し
の運用方針
― 3 ―
04_607082_ ン .indd 30 2015/12/11 13:25:52

w7461_全体_08_コピー.docx
15/7/7 15 時 24 分
ページ:3
マネー・マーケット・マザーファンド
― 3 ―
○ 当たりの 用 2014年11月21日~2015年5月20日
当 は ざいません。
○ び の状況 2014年11月21日~2015年5月20日
買 額 売 額
円 円 債 券 21,730,623 20,430,686
( 1,550,000) (注) 額は 。( 分は ま ておりません。)
(注)( ) は による 分で、 の数 には ま ておりません。
○利 との 状況等 2014年11月21日~2015年5月20日
分 買 額
売 額
との
との
百万円 百万円 % 百万円 百万円 %債 7,299 2,999 41.1 5,999 700 11.7
先 ( 債) 14,430 5,350 37.1 14,430 5,350 37.1 (注) 債には 先などによる のを ません。
とは、 資 び 資 に する 11 1 に 定 る であり、当ファンドに る とはル ン・ ン ー 券、 ル ン・ ン ー 券です。
公社債
利 との 状況
― 3 ―
04_607082_ ン .indd 31 2015/12/11 13:25:53

w7461_全体_08_コピー.docx
15/7/7 15 時 24 分
ページ:4
マネー・マーケット・マザーファンド
― 4 ―
○組入資産の 2015年5月20日
( ) ( 建) 債
分
当 期 末
額 額 価 額 組 入 比 率組 入 比 率
存期 組入比率
5年 2年 2年
円 円 % % % % %
債 券 1,750,000 1,750,095 89.3 - - - 89.3
(1,400,000) (1,399,994) (71.4) (-) (-) (-) (71.4)
1,750,000 1,750,095 89.3 - - - 89.3
(1,400,000) (1,399,994) (71.4) (-) (-) (-) (71.4) (注)( ) は 債で き。 (注)組入比率は、純資産総額に する 価額の 。 (注) 価に いては 、価 より ー を入 しています。 (注) 先の組 入 がある 、 先は 債 券に めて 。
( ) ( 建) 債
当 期 末
率 額 額 価 額 年 月 日
国債 % 円 円 522 短期 券 - 300,000 300,000 2015/ / 532 短期 券 - 1,100,000 1,099,994 2015/ /17 331 債(2年) 0.1 200,000 200,050 2015/ /15 332 債(2年) 0.1 150,000 150,051 2015/ /15
1,750,000 1,750,095
○投資 産の 2015年5月20日
当 期 末
価 額 比 率
円 %
債 1,750,095 89.3
コール・ローン 、 の 210,300 10.7
資 産総額 1,960,395 100.0
国 公社債
― 3 ―
04_607082_ ン .indd 32 2015/12/11 13:25:53

w7461_全体_08_コピー.docx
15/7/7 15 時 24 分
ページ:5
マネー・マーケット・マザーファンド
― 5 ―
○資産、 債、 び基準価額の状況 2015年5月20日
当 期 末
資産 1 960 95 99
コール・ローン 210,220,805
債( 価額) 1,750,095,800
収 78,794
債 802 2
802,372
資産 額 1 959 59 02
1,924,361,734
期 益 35,231,293
益 1 924 61 4
当たり基準価額 10 18 <注記事項>
○ 益の状況 2014年11月21日~2015年5月20日
当 期
当等収益 414 2 1
414,231
価 益 1 122
売買益 101,626
売買 414,748
当期 益金 101 109
期 益金 42 568 2
益金 189 850 11
益金 19 288 265
計 5 2 1 29
期 益金 5 2 1 29 (注) 価 益は期末の 価 による のを ま
す。 (注) 益金とあるのは、 の 定の 、
定をした価額 を し いた 額分をいいます。 (注) 益金とあるのは、中 の 、 価
額を し いた 額分をいいます。
動 ロ ー ン ン ファンド 288,416,273円 建て債券ファンド( 月決算 ) 5,226,135円 債券ファンド ー 円コー ( 月分 ) 14,525,380円 債券ファンド ー ドルコー ( 月分 ) 2,727,794円 債券ファンド ー ーロコー ( 月分 ) 101,543円 債券ファンド ー ドルコー ( 月分 ) 81,714,442円 債券ファンド ー ジル ルコー ( 月分 ) 152,186,197円 債券ファンド ー フ ンドコー ( 月分 ) 429,650円 債券ファンド ー ルコ コー ( 月分 ) 7,467,710円 債券ファンド ー マ ー ールファンド 485,467,302円 債券ファンド ー 中 コー ( 月分 ) 128,906円 債券ファンド ー ンド ルピ コー ( 月分 ) 1,799,230円
コ ジル ー ン・マ ー ール・ファンド 2,017,437円 ールド債券ファンド ー 円コー ( 月分 ) 248,106円 ールド債券ファンド ー ドルコー ( 月分 ) 712,999円 ールド債券ファンド ー ジル ルコー ( 月分 ) 862,076円 ールド債券ファンド ー コー ( 月分 ) 299,514円 ールド債券ファンド ー マ ー ールファンド 981,935円 債券ファンド ー 資 コー ( 月分 ) 374,779円 ー ールド円 ン ファンド( 月分 ) 42,384,248円 ー ールド ドル ン ファンド( 月分 ) 3,558,532円 ー ールド ン ファンド ドルコー ( 月分 ) 35,941,494円 ー ールド ン ファンド ジル ルコー ( 月分 ) 938,449円
ピク ・ ロー ル・ ン ー ン ー 円コー ( 月分 ) 358,088円 ピク ・ ロー ル・ ン ー ン ー ドルコー ( 月分 ) 2,100,667円 ピク ・ ロー ル・ ン ー ン ー ジル ルコー ( 月分 ) 3,836,590円 ピク ・ ロー ル・ ン ー ン ー 資 コー ( 月分 ) 923,745円 ピク ・ ロー ル・ ン ー ン ー マ ー ールファンド 5,525,461円
り 債ファンド ー 円コー ( 月分 ) 23,152,810円 り 債ファンド ー ドルコー ( 月分 ) 5,011,602円 り 債ファンド ー ドルコー ( 月分 ) 4,071,402円
― 33 ―
04_607082_ ン .indd 33 2015/12/11 13:25:54

w7461_全体_08_コピー.docx
15/7/7 15 時 24 分
ページ:6
マネー・マーケット・マザーファンド
― 6 ―
り 債ファンド ー ジル ルコー ( 月分 ) 43,682,881円 り 債ファンド ー 資 コー ( 月分 ) 389,070円 り 債ファンド ー ジ コー ( 月分 ) 780,306円 り 債ファンド ー マ ー ールファンド 29,100,616円 ールド債券ファンド ー 円コー ( 月分 ) 2,221,253円 ールド債券ファンド ー ーロコー ( 月分 ) 1,784,459円 ールド債券ファンド ー ドルコー ( 月分 ) 2,576,702円 ールド債券ファンド ー ジル ルコー ( 月分 ) 3,148,614円 ールド債券ファンド ー 資 コー ( 月分 ) 67,305円 ールド債券ファンド ー マ ー ールファンド 3,492,620円 ールド債券ファンド ーロ円 ( 月分 ) 78,483,503円 ールド債券ファンド( ジあり) 2,069,498円 ールド債券ファンド( ジなし) 1,726,413円 ールド債券ファンド( ジあり) 1,068円 ールド債券ファンド( ジなし) 20,706円
ー ファンド ジあり ( 月決算 ) 491,836円 ー ファンド ジなし ( 月決算 ) 98,368円
ロー ル ファンド2012 11(円 ジ)( 定 ) 10,816,126円 ー ールド ン ファンド コペ ( 月分 ) 47,835,444円 ー ールド円 ン ファンド(年2 分 ) 168,137円 ー ールド ドル ン ファンド(年2 分 ) 472,643円 ー ールド ン ファンド ドルコー (年2 分 ) 20,660円 ー ールド ン ファンド ジル ルコー (年2 分 ) 20,637円 ー ールド ン ファンド コペ コー (年2 分 ) 2,438,810円 り 債ファンド ー コペ コー ( 月分 ) 4,073,259円 り 債ファンド ー ルコ コー ( 月分 ) 688,506円
ピク ・ ロー ル・ ン ー ン ー ドルコー ( 月分 ) 19,658円 ピク ・ ロー ル・ ン ー ン ー コペ コー ( 月分 ) 19,658円 ピク ・ ロー ル・ ン ー ン ー ルコ コー ( 月分 ) 19,658円
当 ジあり ( 月決算 ) 491,449円 当 ジなし ( 月決算 ) 9,828,976円 ー ールド ン ファンド 分 コー ( 月分 ) 19,255,183円 ー ールド ン ファンド 分 コー (年2 分 ) 554,804円
ー・ ンド・ファンド ク ( 月決算 ) 1,936,118円 ー・ ンド・ファンド ジなし ( 月決算 ) 9,829円 ー・ ンド・ファンド ク (年1 決算 ) 9,829円 ー・ ンド・ファンド ジなし (年1 決算 ) 9,829円
ンクローンファンド ー 円コー ( 月分 ) 15,049,666円 ンクローンファンド ー ドルコー ( 月分 ) 20,551,717円 ンクローンファンド ー ドルコー ( 月分 ) 3,730,759円 ンクローンファンド ー ジル ルコー ( 月分 ) 5,059,469円 ンクローンファンド ー コペ コー ( 月分 ) 5,519,741円 ンクローンファンド ー ルコ コー ( 月分 ) 252,058円 ンクローンファンド ー ロ ルー ルコー ( 月分 ) 6,618,213円 ンクローンファンド ー 円コー (年2 分 ) 3,737,703円 ンクローンファンド ー ドルコー (年2 分 ) 6,435,081円 ンクローンファンド ー ドルコー (年2 分 ) 686,803円 ンクローンファンド ー ジル ルコー (年2 分 ) 627,788円 ンクローンファンド ー コペ コー (年2 分 ) 608,110円 ンクローンファンド ー ルコ コー (年2 分 ) 46,726円 ンクローンファンド ー ロ ルー ルコー (年2 分 ) 895,906円 ンクローンファンド ー マ ー ールファンド 36,583,200円 ンクローンファンド ー マ ー ールファンド 980,075円 ピ コ ー ル・ ーン・ファンド ドル ジ ( 月決算 ) 1,423,307円 ピ コ ー ル・ ーン・ファンド ジなし ( 月決算 ) 3,270,787円 ピ コ ー ル・ ーン・ファンド ドル ジ (年1 決算 ) 1,168,184円 ピ コ ー ル・ ーン・ファンド ジなし (年1 決算 ) 2,065,331円
ピ コ・ マージン ・ ンド・ ー ン コー ( ジなし)(年1 決算 ) 983円
― 34 ―
04_607082_ ン .indd 34 2015/12/11 13:25:54

w7461_全体_08_コピー.docx
15/7/7 15 時 24 分
ページ:7
マネー・マーケット・マザーファンド
― 7 ―
ピ コ・ マージン ・ ンド・ ー ン コー ( ジあり)(年1 決算 ) 983円 ロー ル ファンド2013 11(円 ジ)( 定 ) 982,608円
ピ コ ー ル・ ーン・ファンド2014 256,356円 ンクローンファンド ジあり ( 月分 ) 2,827,156円 ンクローンファンド ジなし ( 月分 ) 9,387,547円 ンクローン・ ー ン ジあり ( 月決算 ) 3,545,187円 ンクローン・ ー ン ジなし ( 月決算 ) 8,124,755円 ンクローン・ ー ン ジあり (年1 決算 ) 2,990,177円 ンクローン・ ー ン ジなし (年1 決算 ) 3,377,211円
ン ファンド 円 ン ( 月分 ) 151,268円 ン ファンド 円 ン (年2 分 ) 168,922円 ン ファンド ドル ン ( 月分 ) 1,674,507円 ン ファンド ドル ン (年2 分 ) 658,018円 ン ファンド 分 コー ( 月分 ) 9,991,470円 ン ファンド 分 コー (年2 分 ) 1,616,484円
ー ・ ン 債券ファンド ドル円 ( 月決算 ) 25,537,767円 ンクローンファンド ドル円 ( 月分 ) 42,906,570円 ンクローンファンド ドル円 (年2 分 ) 8,585,548円 ンド債券ファンド 885,566円 マ ー ールファンド 1,412,300円 ンド債券 ー ン( 月決算 ) 39,351円
ンクローンファンド ( ジあり)2014 08 11,276,260円 マ ー ールファンド( 用)(適 資 定) 116,474円
ピ ク クコン ロール(5%) ン ク ファンド( 用)(適 資 定) 132,261,881円 ピ コ・ マージン ・ ンド・ ー ン コー ( ジなし) 16,982,851円 ピ コ・ マージン ・ ンド・ ー ン コー ( ジあり) 34,396,392円
ン ・ ベー ン(債券 ) 22,527,760円 ー ファンド ( 月決算 ) 11,293,333円
ー 動産 ファンド ( 月決算 ) 6,324,266円 ー 動産 ファンド ドル 資 (3 月決算 ) 3,063,931円 ンクローンファンド ドル ン ( 月分 ) 1,375,824円 ンクローンファンド ドル ン (年2 分 ) 1,071,396円
マルチ ジー・ファンド( ) 491,015円 ンクローンファンド 分 コー ( 月分 ) 348,621円 ンクローンファンド 分 コー (年2 分 ) 59,905円 ンクローンファンド 円 ン (年2 分 ) 10,804円 ンクローンファンド 円 ン ( 月分 ) 10,804円 債券 ン ファンド ジなし (年1 決算 ) 983円 債券 ン ファンド ク (年1 決算 ) 983円 債券 ン ファンド ク ( 月決算 ) 983円 債券 ン ファンド ジなし ( 月決算 ) 983円 ン ・ ベー ン( ) 0円 ン ・ ベー ン( ) 0円
ピ ク クコン ロール(1 %) ン ク ファンド( 用)(適 資 定) 0円 ン ・ ベー ン( 資 ) 0円 ン ・ ベー ン( ) 0円
1,924,361,734円
お せ の ク 算を し、定 的に する を に し、 の を行いました。
(2014年12月1日)
― 35 ―
04_607082_ ン .indd 35 2015/12/11 13:25:55