eeos guidance to authenticate & claim energy credits · { prepare synopsis m&v plan and...
TRANSCRIPT
EEOS Guidance To Authenticate Claim Energy Credits_V2

EEOS Guidance To Authenticate Claim Energy Credits_V2
EEOS Guidance To Authenticate Claim Energy Credits_V2
EEOS Guidance To Authenticate Claim Energy Credits_V2
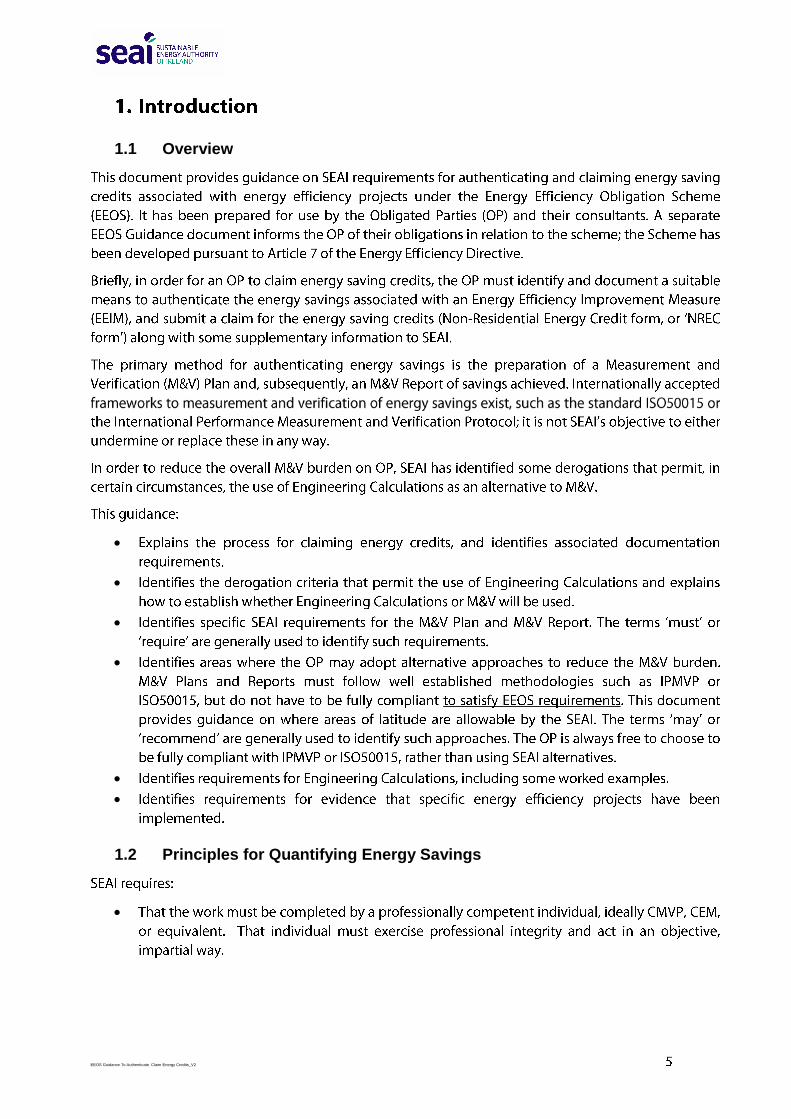
1.1 Overview
1.2 Principles for Quantifying Energy Savings
EEOS Guidance To Authenticate Claim Energy Credits_V2
1.3 SEAI Quality Framework
1.4 Process
1 IPMVP Chapter 3 ‘Principles of M&V’.

EEOS Guidance To Authenticate Claim Energy Credits_V2
1.5 Completing an NREC Application
EEOS Guidance To Authenticate Claim Energy Credits_V2
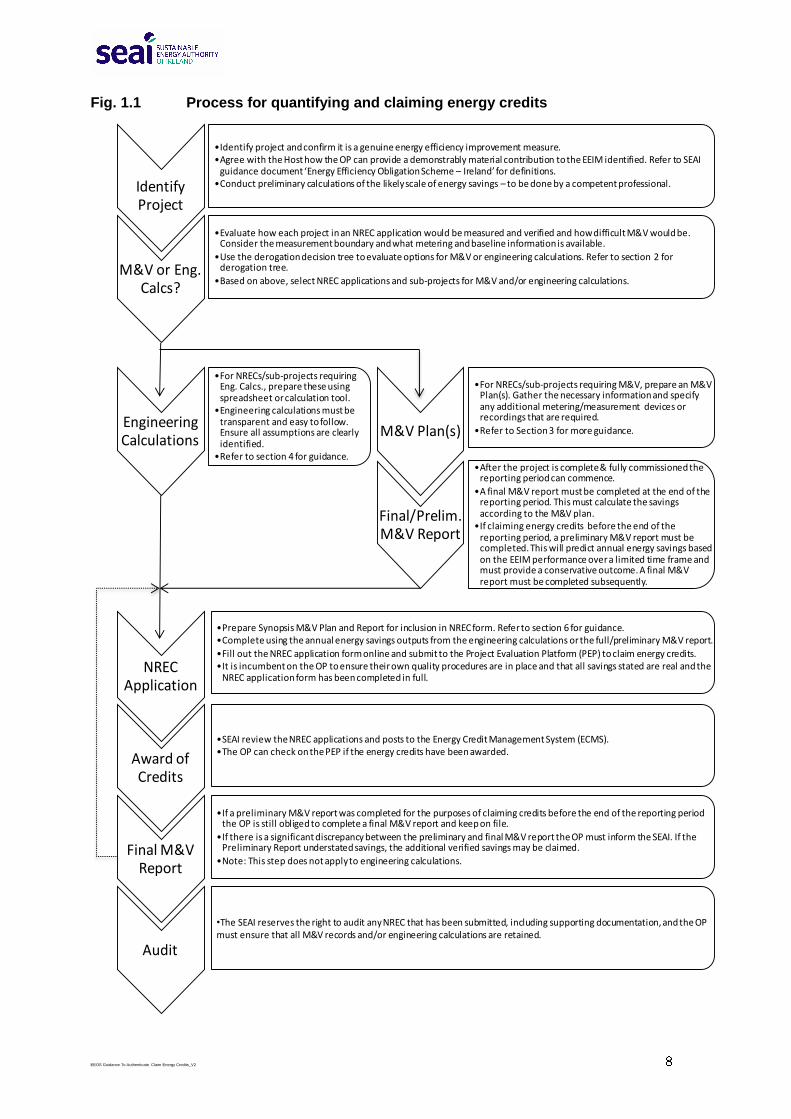
Fig. 1.1 Process for quantifying and claiming energy credits
Identify Project
•Identify project and confirm it is a genuine energy efficiency improvement measure.•Agree with the Host how the OP can provide a demonstrably material contribution to the EEIM identified. Refer to SEAI
guidance document ‘Energy Efficiency Obligation Scheme – Ireland’ for definitions. •Conduct preliminary calculations of the likely scale of energy savings – to be done by a competent professional.
M&V or Eng. Calcs?
•Evaluate how each project in an NREC application would be measured and verified and how difficult M&V would be. Consider the measurement boundary and what metering and baseline information is available.
•Use the derogation decision tree to evaluate options for M&V or engineering calculations. Refer to section 2 for derogation tree.
•Based on above, select NREC applications and sub-projects for M&V and/or engineering calculations.
M&V Plan(s)
Final/Prelim.M&V Report
•For NRECs/sub-projects requiring M&V, prepare an M&V Plan(s). Gather the necessary information and specify any additional metering/measurement devices or recordings that are required.
•Refer to Section 3 for more guidance.
•After the project is complete & fully commissioned the reporting period can commence.
•A final M&V report must be completed at the end of the reporting period. This must calculate the savings according to the M&V plan.
•If claiming energy credits before the end of the reporting period, a preliminary M&V report must be completed. This will predict annual energy savings based on the EEIM performance over a limited time frame and must provide a conservative outcome. A final M&V report must be completed subsequently.
Engineering Calculations
•For NRECs/sub-projects requiring Eng. Calcs., prepare these using spreadsheet or calculation tool.
•Engineering calculations must be transparent and easy to follow. Ensure all assumptions are clearly identified.
•Refer to section 4 for guidance.
NREC Application
•Prepare Synopsis M&V Plan and Report for inclusion in NREC form. Refer to section 6 for guidance.•Complete using the annual energy savings outputs from the engineering calculations or the full/preliminary M&V report.
•Fill out the NREC application form online and submit to the Project Evaluation Platform (PEP) to claim energy credits.•It is incumbent on the OP to ensure their own quality procedures are in place and that all savings stated are real and the
NREC application form has been completed in full.
Award of Credits
•SEAI review the NREC applications and posts to the Energy Credit Management System (ECMS).•The OP can check on the PEP if the energy credits have been awarded.
Final M&V Report
•If a preliminary M&V report was completed for the purposes of claiming credits before the end of the reporting period the OP is still obliged to complete a final M&V report and keep on file.
•If there is a significant discrepancy between the preliminary and final M&V report the OP must inform the SEAI. If the Preliminary Report understated savings, the additional verified savings may be claimed.
•Note: This step does not apply to engineering calculations.
Audit
•The SEAI reserves the right to audit any NREC that has been submitted, including supporting documentation, and the OP must ensure that all M&V records and/or engineering calculations are retained.

EEOS Guidance To Authenticate Claim Energy Credits_V2
2.1 Introduction
2.2 Derogation for Projects Employing Specific Well-Proven Technologies
2.3 Derogation for Smaller Scale NREC Applications and Sub-Projects
2 A PDF version of Figures 2.1 and 2.2 are available in A3 size for download from the SEAI website.

EEOS Guidance To Authenticate Claim Energy Credits_V2
Figure 2.1 - Derogation Decision Tree
EEOS Guidance To Authenticate Claim Energy Credits_V2
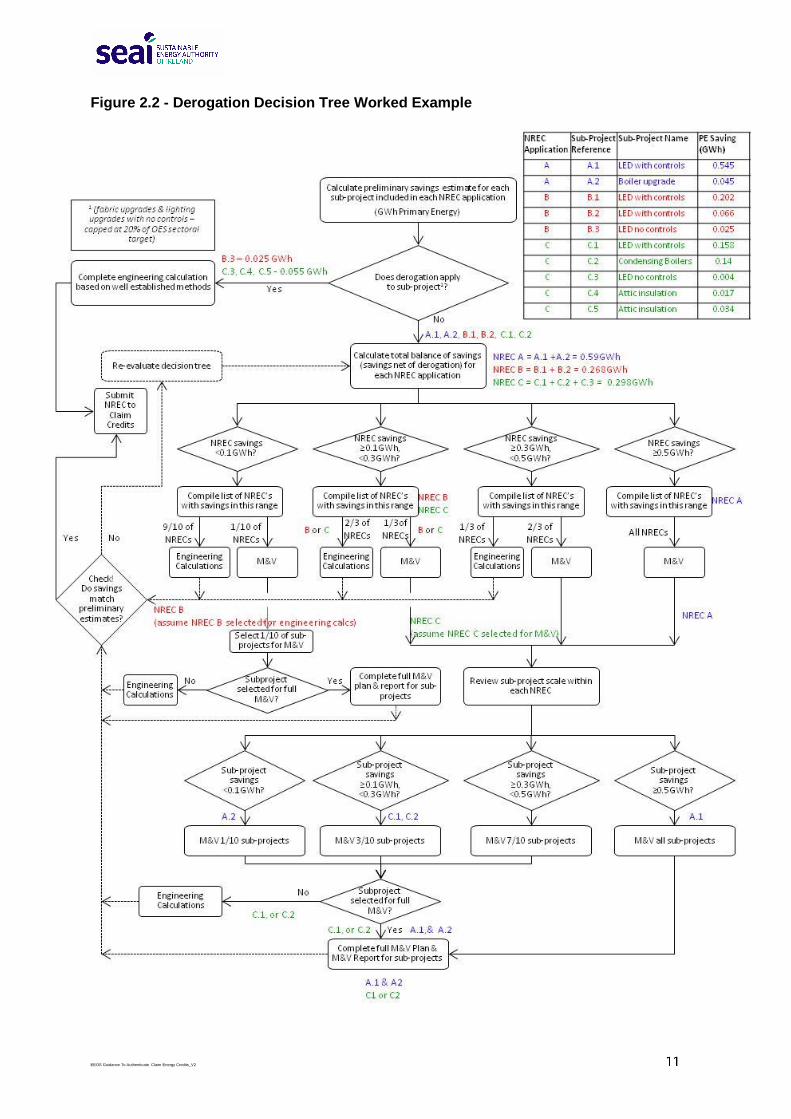
Figure 2.2 - Derogation Decision Tree Worked Example

EEOS Guidance To Authenticate Claim Energy Credits_V2
2.4 Conservative Defaults
Table 2.1 – Conservative Defaults
EEOS Guidance To Authenticate Claim Energy Credits_V2
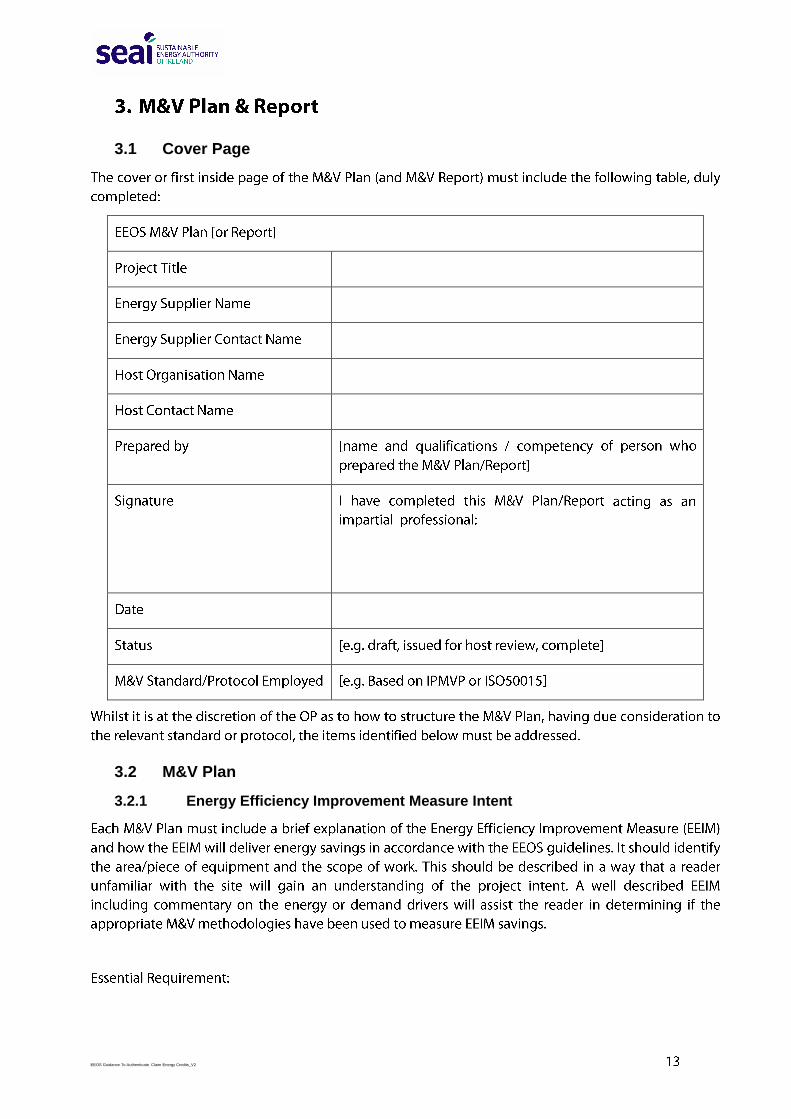
3.1 Cover Page
3.2 M&V Plan
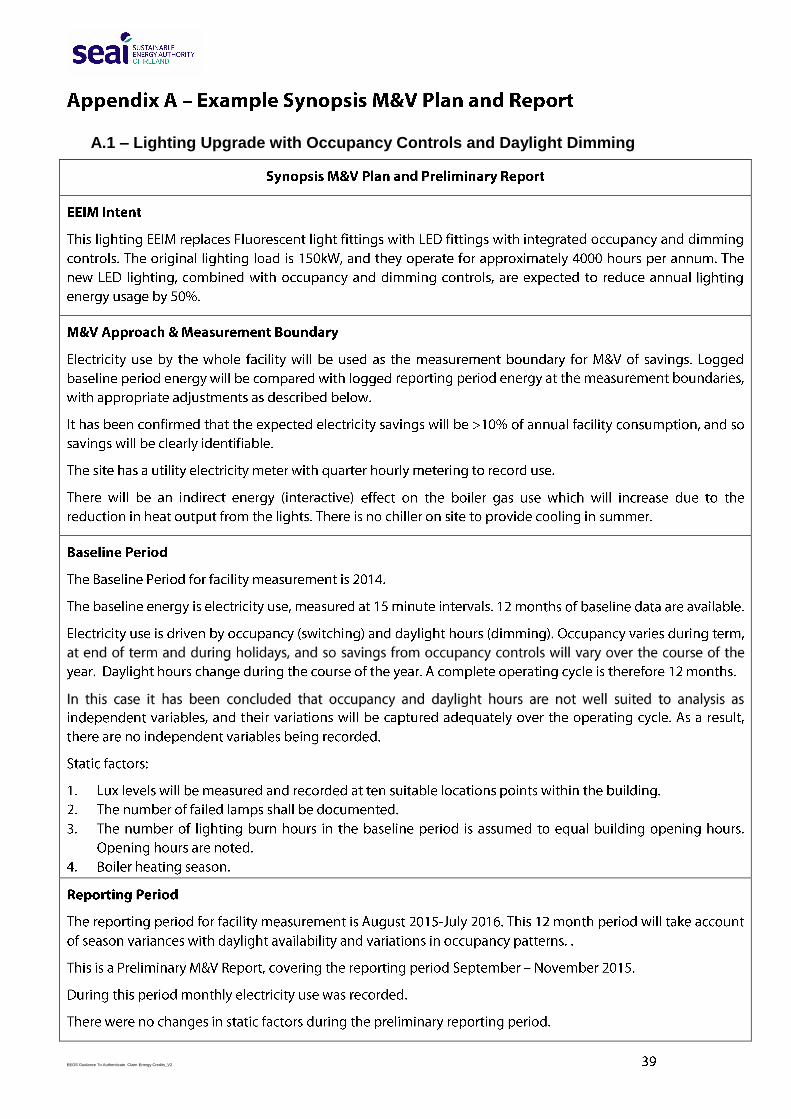
3.2.1 Energy Efficiency Improvement Measure Intent

EEOS Guidance To Authenticate Claim Energy Credits_V2
3.2.2 Selected M&V Approach
3 Referred to in IPMVP as ‘Option A’.
EEOS Guidance To Authenticate Claim Energy Credits_V2
o
o
o
o
o
o
EEOS Guidance To Authenticate Claim Energy Credits_V2
3.2.2.1 M&V Approach by Organisations with ISO50001
EEOS Guidance To Authenticate Claim Energy Credits_V2
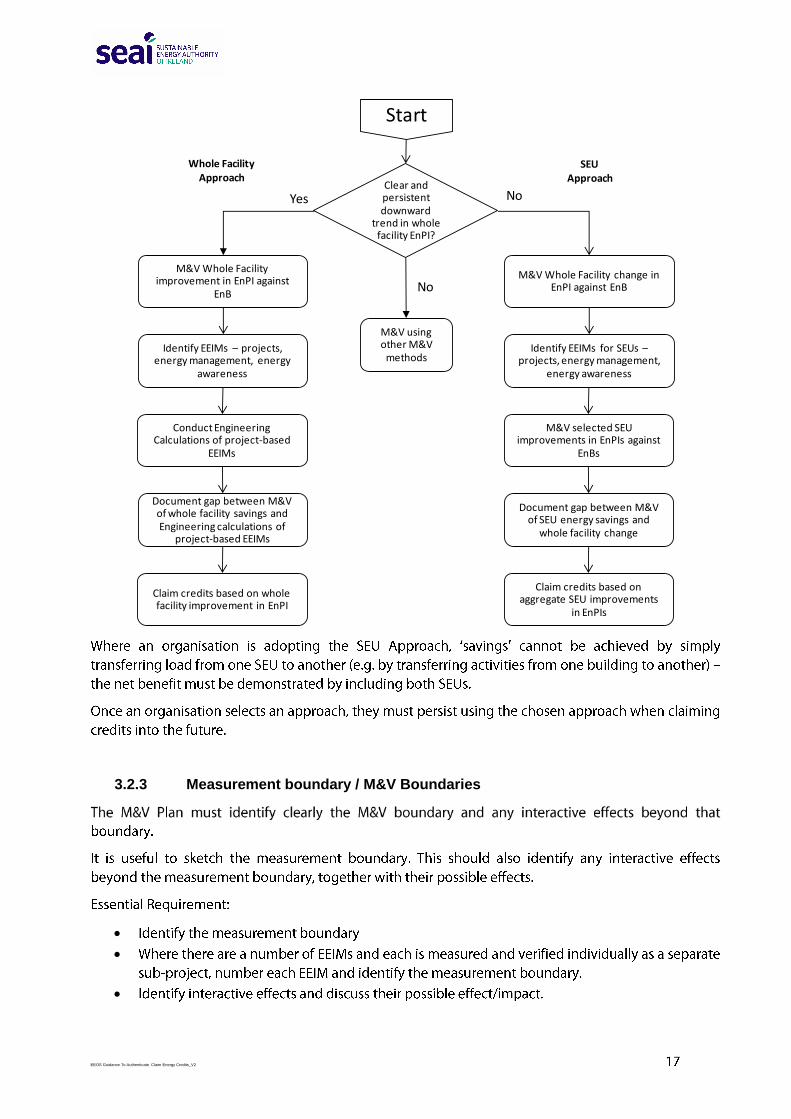
3.2.3 Measurement boundary / M&V Boundaries
Start
Clear and persistent downward
trend in whole facility EnPI?
Whole Facility Approach
NoYes
SEUApproach
M&V Whole Facility improvement in EnPI against
EnB
Identify EEIMs – projects, energy management, energy
awareness
Document gap between M&V of whole facility savings and Engineering calculations of
project-based EEIMs
Conduct Engineering Calculations of project-based
EEIMs
M&V Whole Facility change in EnPI against EnB
Identify EEIMs for SEUs –projects, energy management,
energy awareness
Document gap between M&V of SEU energy savings and
whole facility change
M&V selected SEU improvements in EnPIs against
EnBs
Claim credits based on whole facility improvement in EnPI
Claim credits based on aggregate SEU improvements
in EnPIs
M&V using other M&V
methods
No

EEOS Guidance To Authenticate Claim Energy Credits_V2
3.2.4 Baseline Period
4 IPMVP Vol. 1 -2012 states “The baseline period should be established to represent all operating modes of the facility. This
period should span a full operating cycle from maximum energy use to minimum”. It also provides further guidance on this topic.
EEOS Guidance To Authenticate Claim Energy Credits_V2
3.2.4.1 Dealing with insufficient baseline data
EEOS Guidance To Authenticate Claim Energy Credits_V2
EEOS Guidance To Authenticate Claim Energy Credits_V2
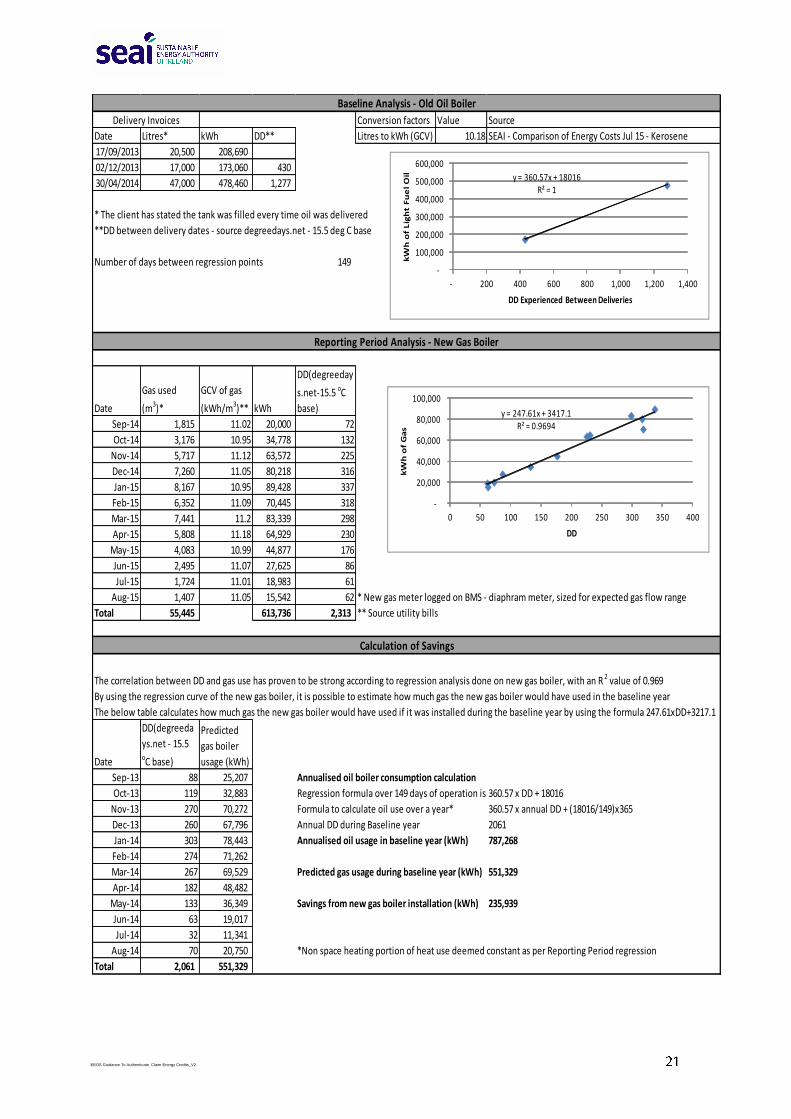
Conversion factors Value Source
Date Litres* kWh DD** Litres to kWh (GCV) 10.18 SEAI - Comparison of Energy Costs Jul 15 - Kerosene
17/09/2013 20,500 208,690
02/12/2013 17,000 173,060 430
30/04/2014 47,000 478,460 1,277
* The client has stated the tank was filled every time oil was delivered
**DD between delivery dates - source degreedays.net - 15.5 deg C base
Number of days between regression points 149
Date
Gas used
(m3)*
GCV of gas
(kWh/m3)** kWh
DD(degreeday
s.net-15.5 oC
base)
Sep-14 1,815 11.02 20,000 72
Oct-14 3,176 10.95 34,778 132
Nov-14 5,717 11.12 63,572 225
Dec-14 7,260 11.05 80,218 316
Jan-15 8,167 10.95 89,428 337
Feb-15 6,352 11.09 70,445 318
Mar-15 7,441 11.2 83,339 298
Apr-15 5,808 11.18 64,929 230
May-15 4,083 10.99 44,877 176
Jun-15 2,495 11.07 27,625 86
Jul-15 1,724 11.01 18,983 61
Aug-15 1,407 11.05 15,542 62 * New gas meter logged on BMS - diaphram meter, sized for expected gas flow range
Total 55,445 613,736 2,313 ** Source utility bills
The correlation between DD and gas use has proven to be strong according to regression analysis done on new gas boiler, with an R 2 value of 0.969
By using the regression curve of the new gas boiler, it is possible to estimate how much gas the new gas boiler would have used in the baseline year
The below table calculates how much gas the new gas boiler would have used if it was installed during the baseline year by using the formula 247.61xDD+3217.1
Date
DD(degreeda
ys.net - 15.5 oC base)
Predicted
gas boiler
usage (kWh)
Sep-13 88 25,207 Annualised oil boiler consumption calculation
Oct-13 119 32,883 Regression formula over 149 days of operation is 360.57 x DD + 18016
Nov-13 270 70,272 Formula to calculate oil use over a year* 360.57 x annual DD + (18016/149)x365
Dec-13 260 67,796 Annual DD during Baseline year 2061
Jan-14 303 78,443 Annualised oil usage in baseline year (kWh) 787,268
Feb-14 274 71,262
Mar-14 267 69,529 Predicted gas usage during baseline year (kWh) 551,329
Apr-14 182 48,482
May-14 133 36,349 Savings from new gas boiler installation (kWh) 235,939
Jun-14 63 19,017
Jul-14 32 11,341
Aug-14 70 20,750 *Non space heating portion of heat use deemed constant as per Reporting Period regression
Total 2,061 551,329
Reporting Period Analysis - New Gas Boiler
Calculation of Savings
Baseline Analysis - Old Oil Boiler
Delivery Invoices
y = 360.57x + 18016R² = 1
-
100,000
200,000
300,000
400,000
500,000
600,000
- 200 400 600 800 1,000 1,200 1,400
kW
h o
f L
igh
t F
ue
l O
il
DD Experienced Between Deliveries
y = 247.61x + 3417.1R² = 0.9694
-
20,000
40,000
60,000
80,000
100,000
0 50 100 150 200 250 300 350 400
kW
h o
f G
as
DD
EEOS Guidance To Authenticate Claim Energy Credits_V2

EEOS Guidance To Authenticate Claim Energy Credits_V2
% fan speed 40% 50% 60% 70% 80% 90% *100% Comments
Fan Power Consumption (kW) 1.0 2.0 3.5 5.5 8.2 11.7 16.1 Measured using RMS power analyser
Measured air volume rate (m3/s) 6.2 7.7 9.2 10.7 12.2 13.7 15.2 Calculated using a matrix of duct velocity readings taken by a hot wire
anemometer
% fan speed 40% 50% 60% 70% 80% 90% *100% Comments
Amount of hrs spend at fan speed 3,800 523 1,080 1,352 600 725 680 Logged on the BMS via a modbus VSD interface
Heat used at different fan speeds (kWh) 50,000 10,000 22,000 18,000 89,000 130,500 172,000 BMS logs delta T of the air across the coil on a 15 min basis. This is
multiplied by air volume recorded at each fan speed x hrs at that
speed x density of air x specific heat capacity of air
% fan speed 40% 50% 60% 70% 80% 90% Total Savings Comments
Electrical fan power savings (kWh) 57,380 7,374 13,608 14,331 4,740 3,190 100,624 Example of savings calculation at 40% speed = [(16.1 - 1) x 3,800]
Thermal savings (kWh) 72,581 9,740 14,348 7,570 21,885 14,288 140,412 Example of savings calculation at 40% speed = [((50,000/6.2) x 15.2) -
50,000]
Gas savings (kWh GCV) 90,726 12,175 17,935 9,463 27,357 17,860 175,515 Gas savings = Thermal Savings / Boiler Efficiency (80%)
* At 100% fan speed the energy use by the AHU is the same as if there was no VSD installed. Savings are measured against this.
Density of air 1.204 kg/m3
Specific heat capacity 1.006 kJ/kgoC
Boiler measured seasonal efficiency 80% Heat out and gas in are measured in the boilerhouse during reporting period (based on GCV)
Measured Parameters Recorded During Commissioning
Calculation of Energy Savings
Assumptions and Notes
Logged and Calculated Parameters During Reporting Period
EEOS Guidance To Authenticate Claim Energy Credits_V2
3.2.5 Reporting Period
3.2.6 Normalised Savings or Avoided Energy Use

EEOS Guidance To Authenticate Claim Energy Credits_V2
3.2.7 Analysis Procedure

EEOS Guidance To Authenticate Claim Energy Credits_V2
3.2.8 Meter Specification

EEOS Guidance To Authenticate Claim Energy Credits_V2
3.2.9 Persistence of Savings
3.2.10 Expected Accuracy
3.3 Preliminary and Final M&V Report
3.3.1 Preliminary M&V Report
EEOS Guidance To Authenticate Claim Energy Credits_V2
3.3.2 M&V Report Format
o
o
o
o
o
o
o
o
o
o
EEOS Guidance To Authenticate Claim Energy Credits_V2
4.1 General
4.2 Standard Calculation Tools
4.2.1 SEAI Calculation Tools
4.2.2 SBEM
4.2.3 Other Calculation Tools
4.3 Bespoke Calculations

EEOS Guidance To Authenticate Claim Energy Credits_V2
o
o
o
o
o
o
o
o

EEOS Guidance To Authenticate Claim Energy Credits_V2
4.4 Examples
4.4.1 Lighting with controls
4.4.2 Example - Boiler Upgrade, No Measured Data
Status Fitting Type Area of Use Electricity Notes
Lamp load
per fitting
Watts
Ballast
losses (ref
App C)
No.
Fittings
Total
Load kW
Annual
Switched
hrs
Control
Factor
Total
Hours
(Total hrs x
Total load)
kWh p.a.
Pre EEIM Twin 58W T8 fitting with
electro-magnetic
control gear
Cellular offices
and meeting
rooms
116 15% 300 40.0 3,120 100% 3120 124,862 Fitting load based on lamp wattage + assumed 15% control gear loss. Fittings on 12 hours/day, 5 days/week,
52 weeks/year
Post EEIM Twin 70W T5 fittings
with electronic control
gear (philips model xyz)
Cellular offices
and meeting
rooms
70 0% 295 20.7 3,120 75% 2340 48,321 Light fitting data sheet attached. 5 fittings in unoccupied spaces manually switched off and 'switch off'
notices put at the switches. Occupancy control factor assumed based on observed activity over a normal
working day. As this is an Eng. Calc. measurement of occupancy patterens is not required.
Saving 76,541
Sample Engineering Calculation - Light fitting replacement and occupancy controls
Load Hours
Boiler characteristics Source / Assumption
Existing
Old Brittania abc Capacity kW 500 Nameplate
Rated efficiency gcv 80% Nameplate
Proposed
Rendamax xyz Capacity kW 450 Datasheet
Rated efficiency gcv @ 80/60 90% Datasheet
Building Energy Use
Option i: Measured use over 12 months, e.g. oil deliveries (Best) No data available
Option ii: Peak load x Equivalent full load hours calculation (OK) Selected
Option ii: Peak load x Equivalent full load hours calculation
Building peak heating load 405 kW Calcs used to size new boiler.
Heating degree days 2063 kWh/m2 p.a. Dublin Airport, 15.5degC, Sep-May
Temperature rise due to internal heat gains 3 degC Faber&Kell's Table 23.5
Factors relating building characteristics to inside and outside design temp 1.22 Faber&Kell's Table 23.6
Factor for intermittent use over 5 days of slow response system in heavy building 0.81 Faber&Kell's Table 23.7
Factor for occupation over 12 hours in heavy building 1.03 Faber&Kell's Table 23.8
Equivalent full load hours 2,100 hrs Calculated
Annual heat load 850,426 kWh Calculated
Savings
Existing fuel use 1,063,032 kWh Annual Heat Load/Exisitng Boiler Eff
Proposed fuel use 944,917 kWh Annual Heat Load/Proposed Boiler Eff
Calculated savings 118,115 kWh By subtraction
Method adapted from Oughton,D.R., and Hodkinson,S. (2002) Faber and Kell's

EEOS Guidance To Authenticate Claim Energy Credits_V2
EEOS Guidance To Authenticate Claim Energy Credits_V2
6.1 General
6.2 Contents of Synopsis M&V Plan and Report

EEOS Guidance To Authenticate Claim Energy Credits_V2
6.3 ISO50001 Synopsis M&V Plan & Report Template
EEOS Guidance To Authenticate Claim Energy Credits_V2

EEOS Guidance To Authenticate Claim Energy Credits_V2
CHP
MMM
Gas in Elec out Heat out
Utility Gas
Utility Elec
M
M
Boilers
Distribution
Board
Measurement Boundary no.1
Measurement Boundary no.2

EEOS Guidance To Authenticate Claim Energy Credits_V2
EEOS Guidance To Authenticate Claim Energy Credits_V2
EEOS Guidance To Authenticate Claim Energy Credits_V2
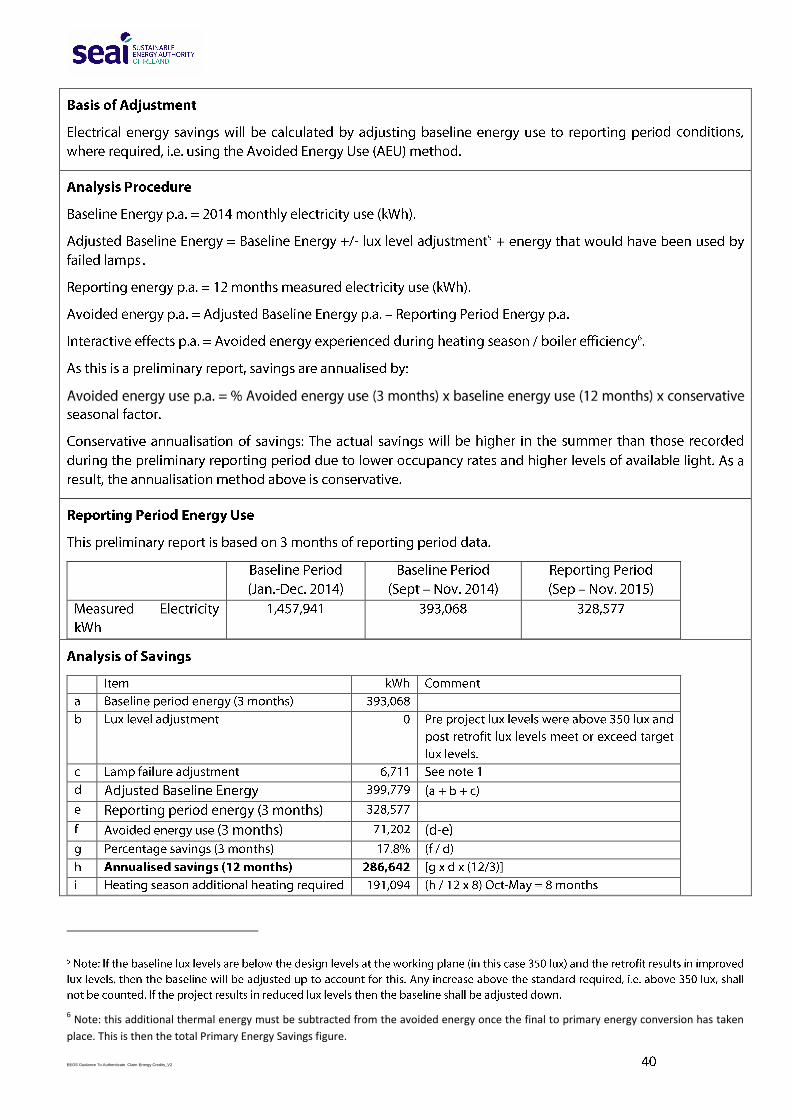
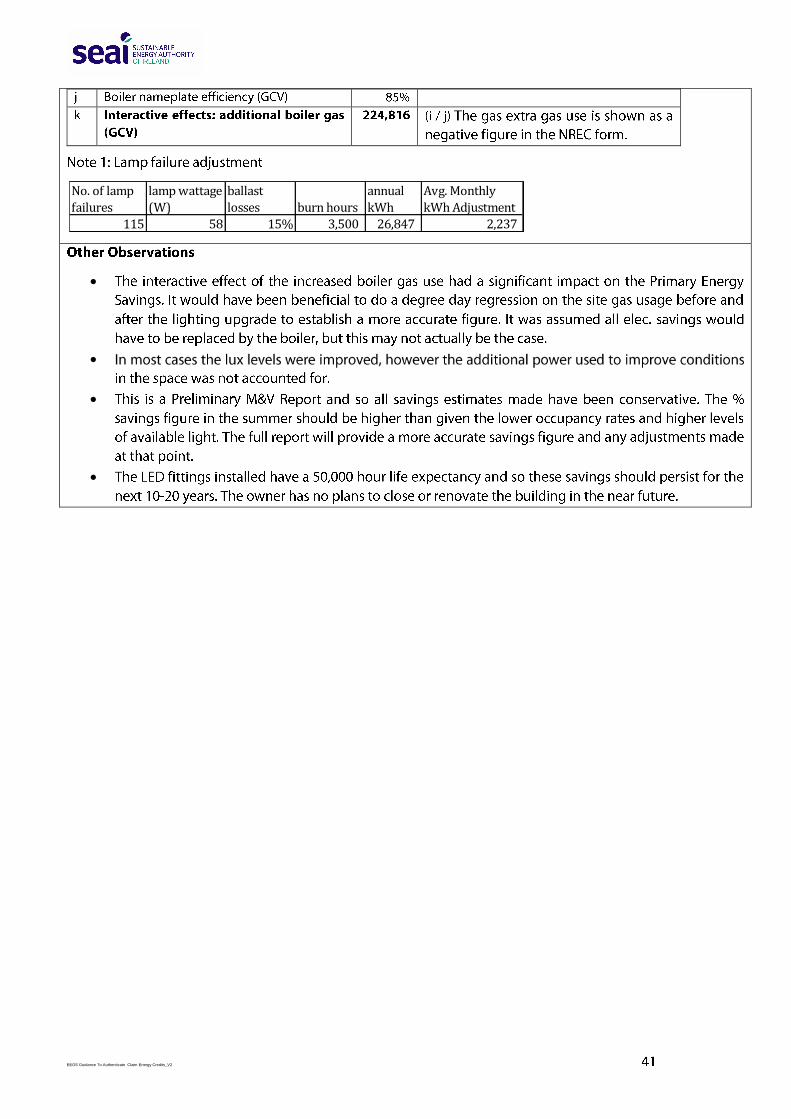
A.1 – Lighting Upgrade with Occupancy Controls and Daylight Dimming
EEOS Guidance To Authenticate Claim Energy Credits_V2
6 Note: this additional thermal energy must be subtracted from the avoided energy once the final to primary energy conversion has taken
place. This is then the total Primary Energy Savings figure.
EEOS Guidance To Authenticate Claim Energy Credits_V2
No. of lamp
failures
lamp wattage
(W)
ballast
losses burn hours
annual
kWh
Avg. Monthly
kWh Adjustment
115 58 15% 3,500 26,847 2,237

EEOS Guidance To Authenticate Claim Energy Credits_V2
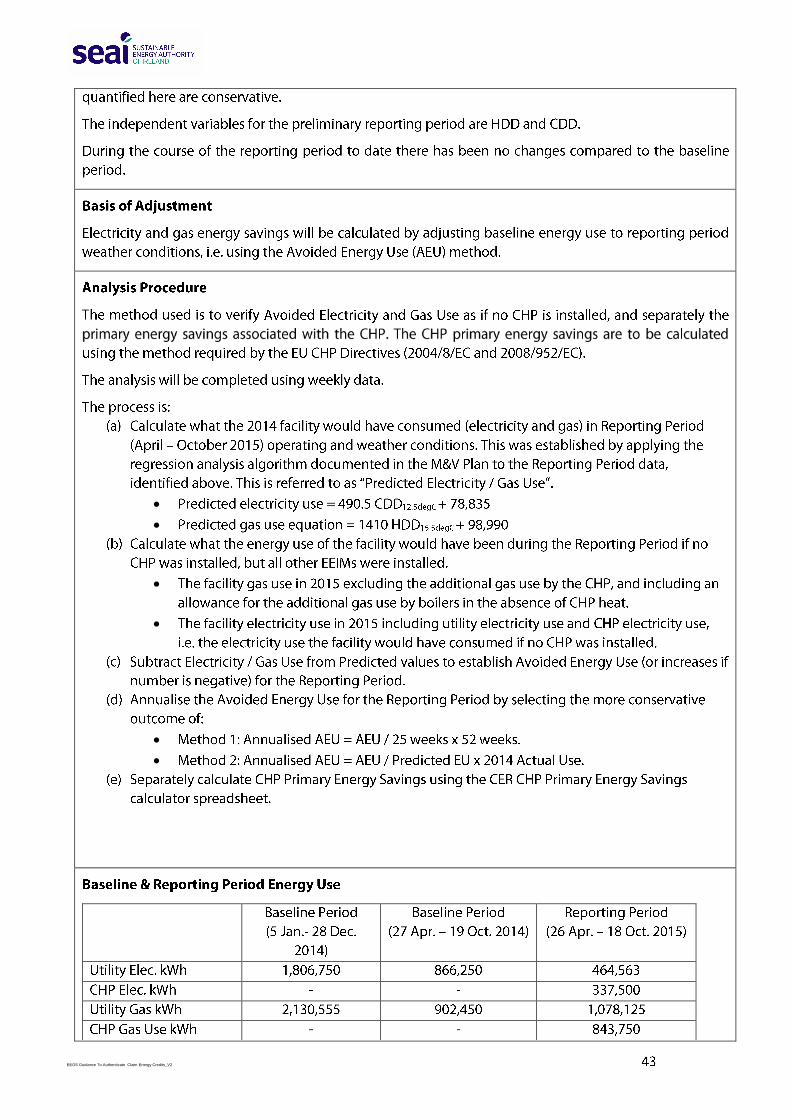
A.2 – Numerous EEIMs conducted within a facility including CHP
3.
EEOS Guidance To Authenticate Claim Energy Credits_V2
EEOS Guidance To Authenticate Claim Energy Credits_V2
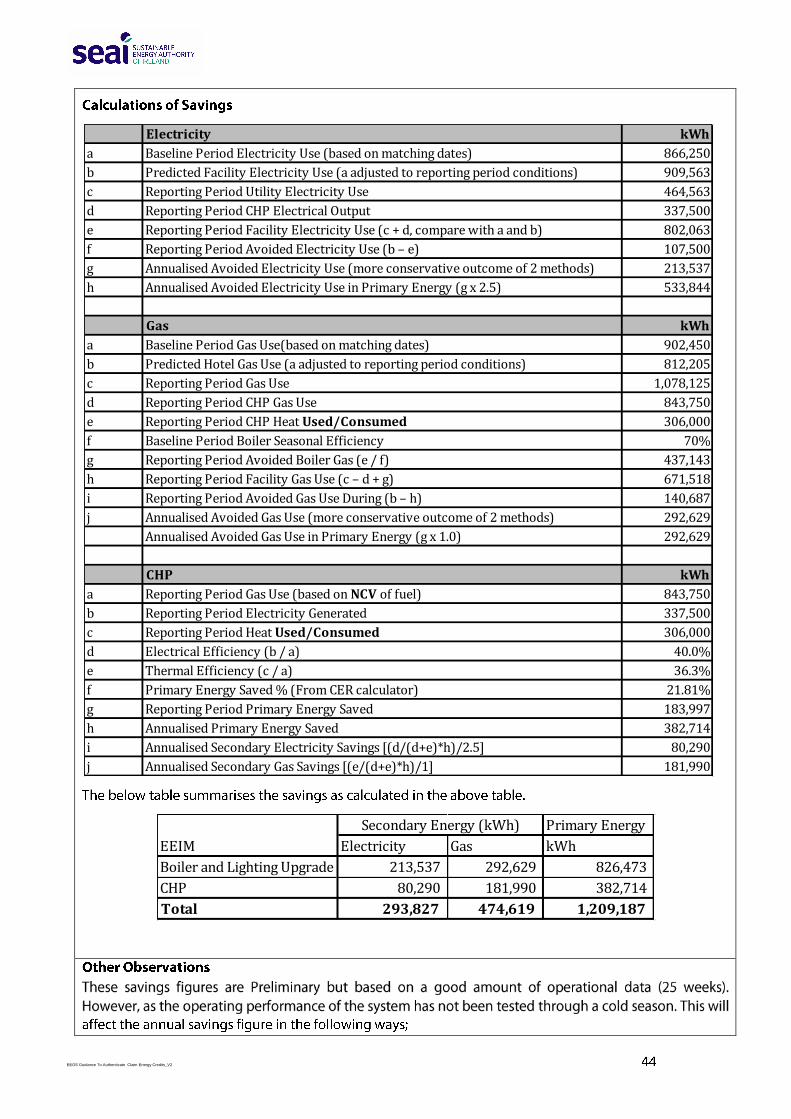
Electricity kWh
a Baseline Period Electricity Use (based on matching dates) 866,250
b Predicted Facility Electricity Use (a adjusted to reporting period conditions) 909,563
c Reporting Period Utility Electricity Use 464,563
d Reporting Period CHP Electrical Output 337,500
e Reporting Period Facility Electricity Use (c + d, compare with a and b) 802,063
f Reporting Period Avoided Electricity Use (b – e) 107,500
g Annualised Avoided Electricity Use (more conservative outcome of 2 methods) 213,537
h Annualised Avoided Electricity Use in Primary Energy (g x 2.5) 533,844
Gas kWh
a Baseline Period Gas Use(based on matching dates) 902,450
b Predicted Hotel Gas Use (a adjusted to reporting period conditions) 812,205
c Reporting Period Gas Use 1,078,125
d Reporting Period CHP Gas Use 843,750
e Reporting Period CHP Heat Used/Consumed 306,000
f Baseline Period Boiler Seasonal Efficiency 70%
g Reporting Period Avoided Boiler Gas (e / f) 437,143
h Reporting Period Facility Gas Use (c – d + g) 671,518
i Reporting Period Avoided Gas Use During (b – h) 140,687
j Annualised Avoided Gas Use (more conservative outcome of 2 methods) 292,629
Annualised Avoided Gas Use in Primary Energy (g x 1.0) 292,629
CHP kWh
a Reporting Period Gas Use (based on NCV of fuel) 843,750
b Reporting Period Electricity Generated 337,500
c Reporting Period Heat Used/Consumed 306,000
d Electrical Efficiency (b / a) 40.0%
e Thermal Efficiency (c / a) 36.3%
f Primary Energy Saved % (From CER calculator) 21.81%
g Reporting Period Primary Energy Saved 183,997
h Annualised Primary Energy Saved 382,714
i Annualised Secondary Electricity Savings [(d/(d+e)*h)/2.5] 80,290
j Annualised Secondary Gas Savings [(e/(d+e)*h)/1] 181,990
Primary Energy
Electricity Gas kWh
Boiler and Lighting Upgrade 213,537 292,629 826,473
CHP 80,290 181,990 382,714
Total 293,827 474,619 1,209,187
Secondary Energy (kWh)
EEIM
EEOS Guidance To Authenticate Claim Energy Credits_V2

EEOS Guidance To Authenticate Claim Energy Credits_V2
Table B.1
Fuel Form
Unit of
Supply
Gross Cv
(kWh/unit)
Industrial Fines Tonne 7,759.2
Standard coal Tonne 7,900
Commercial Cylinders kg 13.96
Bulk L.P.G. Litre 7.09
Networked Natural Gas1
Grid Supply m3
10.42
Gas Oil Litre 10.55
Kerosene Litre 10.18
Light Fuel Oil Litre 11.21
Medium Fuel Oil Litre 11.32
Heavy Fuel Oil Litre 11.45
Peat Briquettes, baled Bale 67
Fuel Chips (35% moisture) kg wet 3.2
Pellets kg 4.8
Coal
Oil
L.P.G.
Wood

EEOS Guidance To Authenticate Claim Energy Credits_V2
Percentage Increase
Multiplier Applicable lamp types
0% 1.00 Electronic control gear T8,T5, PL, 2D =, SOX; Induction; LED
5% 1.05 Electro-magnetic Mercury Vapour; SON and Methal Halide > or = 400W
10% 1.10 Electro-magnetic SON and Metal Halide < 400W
15% 1.15 Electro-magnetic T8 and T12
20% 1.20 Electro-magnetic SOX
25% 1.25 Electro-magnetic PL, 2D
EEOS Guidance To Authenticate Claim Energy Credits_V2
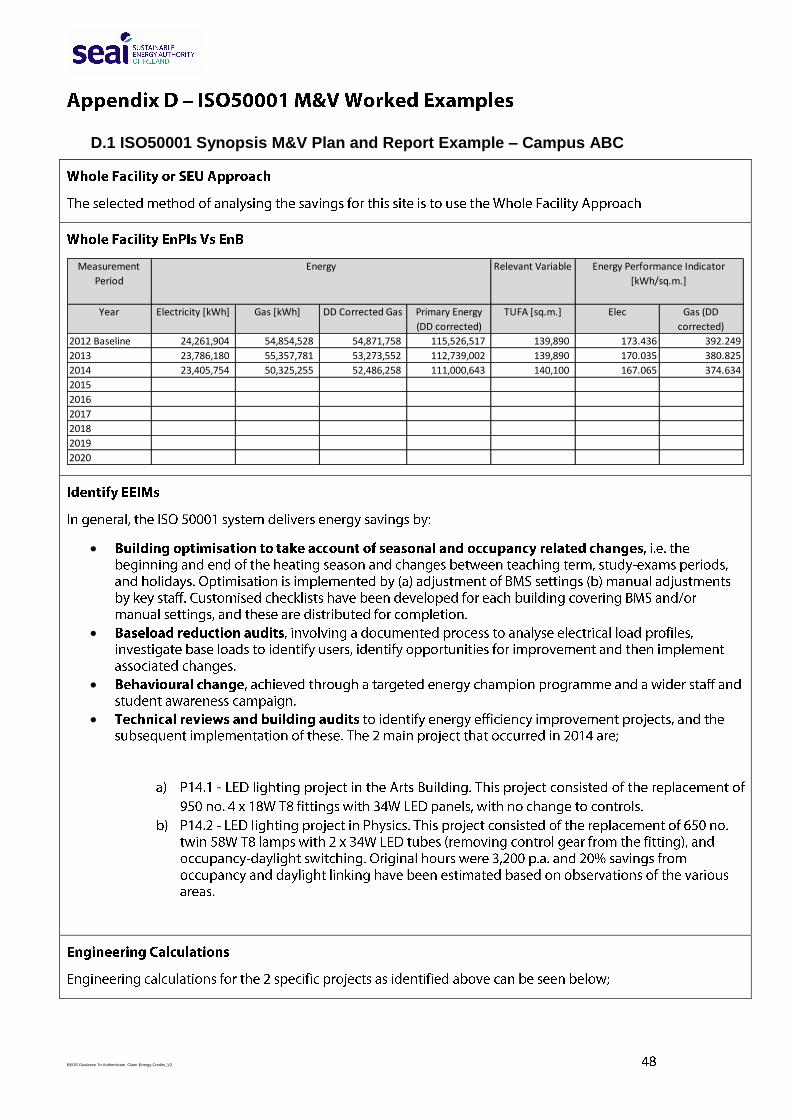
D.1 ISO50001 Synopsis M&V Plan and Report Example – Campus ABC
Measurement
Period
Relevant Variable
Year Electricity [kWh] Gas [kWh] DD Corrected Gas Primary Energy
(DD corrected)
TUFA [sq.m.] Elec Gas (DD
corrected)
2012 Baseline 24,261,904 54,854,528 54,871,758 115,526,517 139,890 173.436 392.249
2013 23,786,180 55,357,781 53,273,552 112,739,002 139,890 170.035 380.825
2014 23,405,754 50,325,255 52,486,258 111,000,643 140,100 167.065 374.634
2015
2016
2017
2018
2019
2020
Energy Energy Performance Indicator
[kWh/sq.m.]
EEOS Guidance To Authenticate Claim Energy Credits_V2
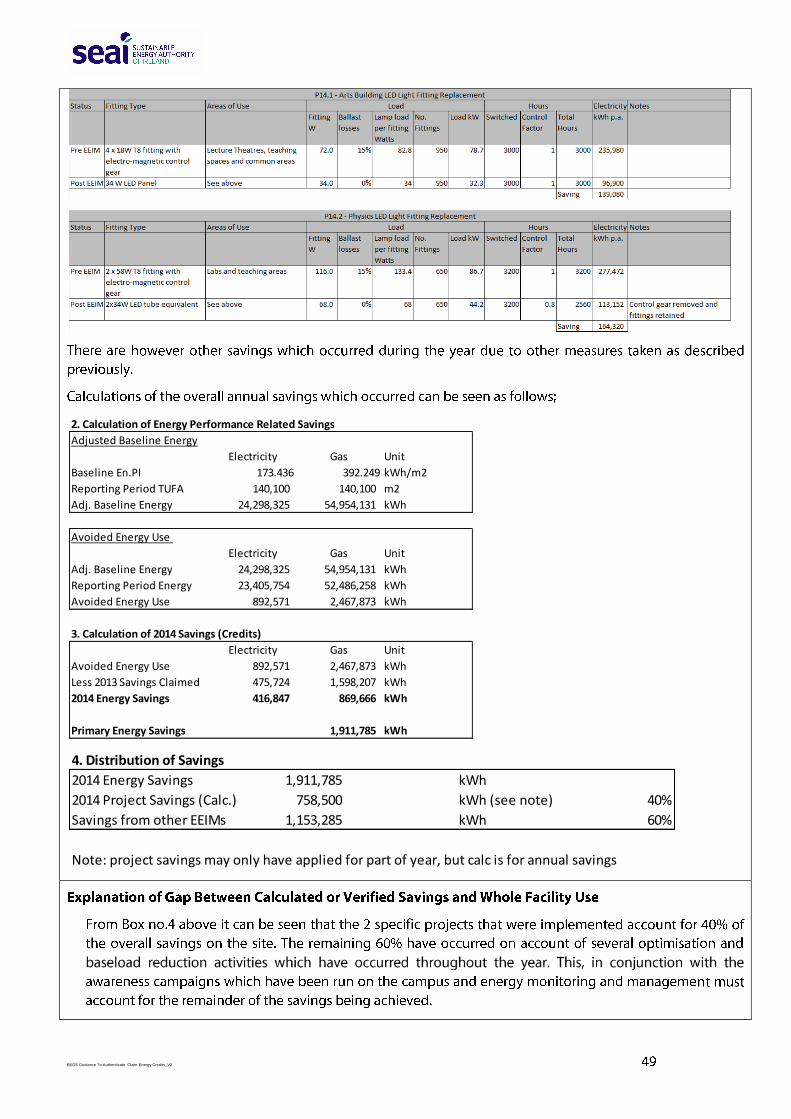
2. Calculation of Energy Performance Related Savings
Adjusted Baseline Energy
Electricity Gas Unit
Baseline En.PI 173.436 392.249 kWh/m2
Reporting Period TUFA 140,100 140,100 m2
Adj. Baseline Energy 24,298,325 54,954,131 kWh
Avoided Energy Use
Electricity Gas Unit
Adj. Baseline Energy 24,298,325 54,954,131 kWh
Reporting Period Energy 23,405,754 52,486,258 kWh
Avoided Energy Use 892,571 2,467,873 kWh
3. Calculation of 2014 Savings (Credits)
Electricity Gas Unit
Avoided Energy Use 892,571 2,467,873 kWh
Less 2013 Savings Claimed 475,724 1,598,207 kWh
2014 Energy Savings 416,847 869,666 kWh
Primary Energy Savings kWh1,911,785
4. Distribution of Savings
2014 Energy Savings 1,911,785 kWh
2014 Project Savings (Calc.) 758,500 kWh (see note) 40%
Savings from other EEIMs 1,153,285 kWh 60%
Note: project savings may only have applied for part of year, but calc is for annual savings
EEOS Guidance To Authenticate Claim Energy Credits_V2
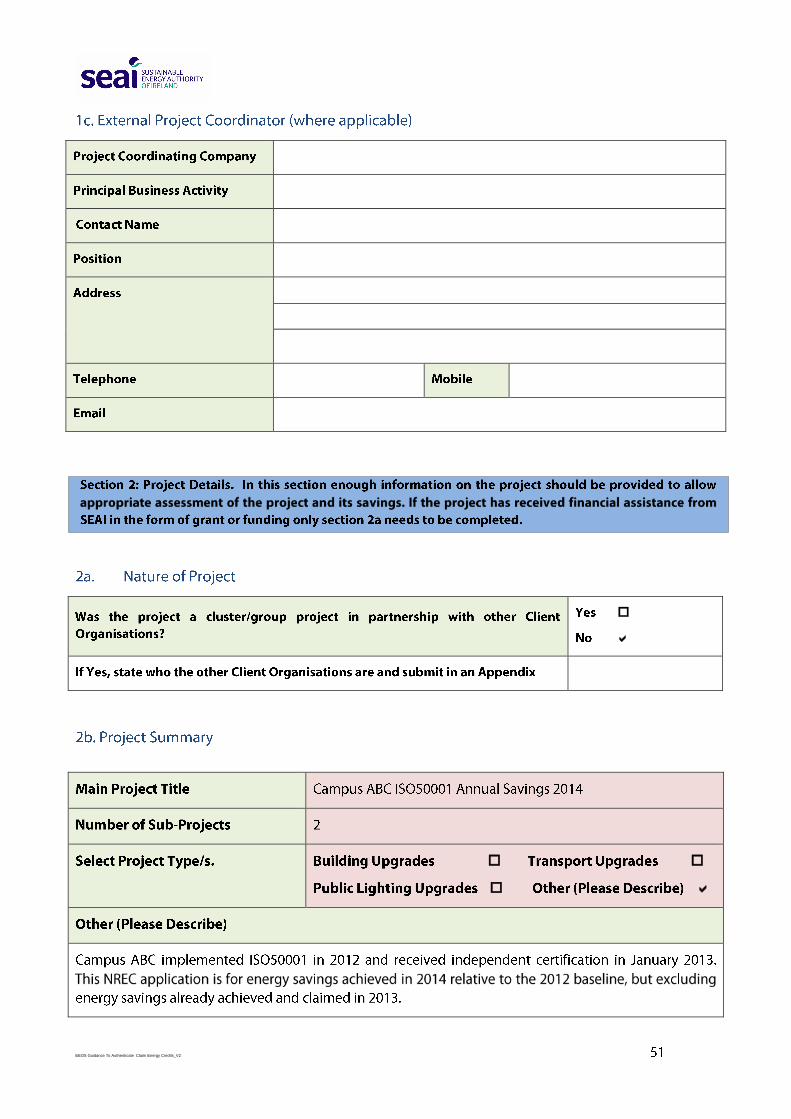
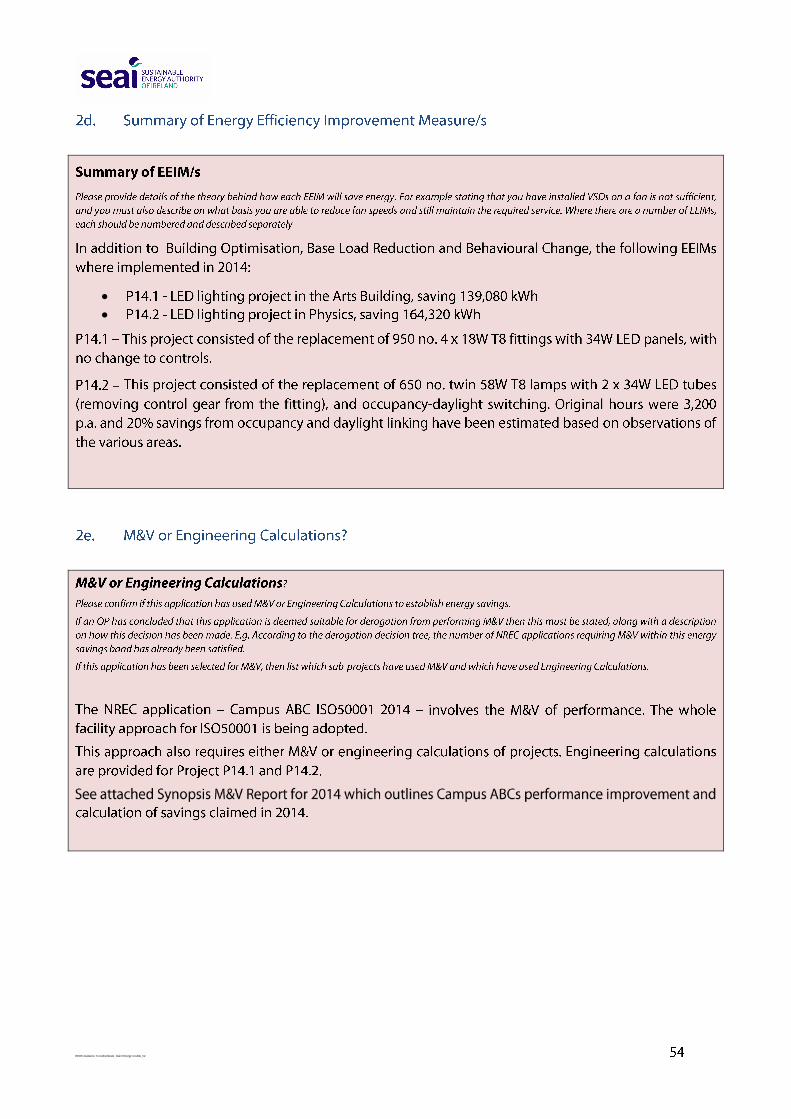
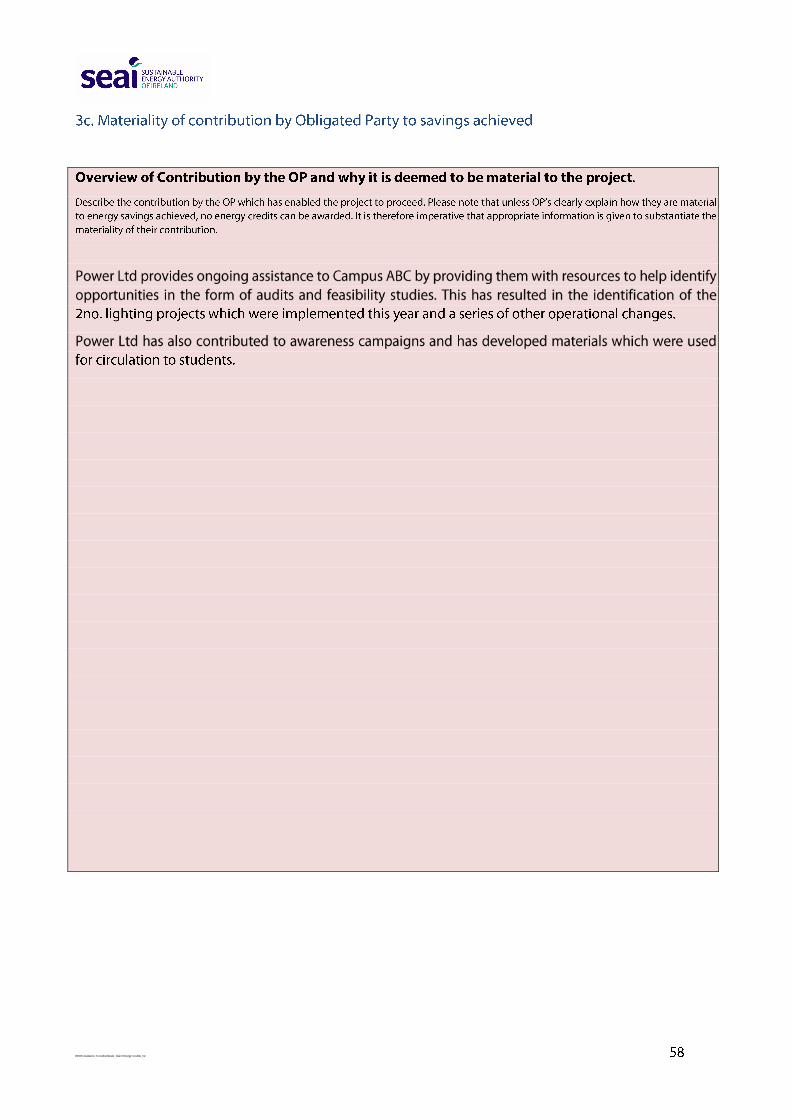
D.2 ISO50001 NREC Application Example
EEOS Guidance To Authenticate Claim Energy Credits_V2

EEOS Guidance To Authenticate Claim Energy Credits_V2
EEOS Guidance To Authenticate Claim Energy Credits_V2
EEOS Guidance To Authenticate Claim Energy Credits_V2

EEOS Guidance To Authenticate Claim Energy Credits_V2

EEOS Guidance To Authenticate Claim Energy Credits_V2

EEOS Guidance To Authenticate Claim Energy Credits_V2
EEOS Guidance To Authenticate Claim Energy Credits_V2

EEOS Guidance To Authenticate Claim Energy Credits_V2