efficient information dissemination of 3d point cloud...
TRANSCRIPT

1
Efficient Information Dissemination of 3D PointCloud Mapping Data for Autonomous Vehicles
Chi-Kin Chau, Ivan W. H. Ho, Elmer Magsino, Chien-Ming Tseng, and Kanghao Jia
Abstract—Information exchanges play a vital role in enabling autonomous driving by overcoming the limitation of perceptionand decision of a single autonomous vehicle. For assuring safety, facilitating regulations, and enhancing intelligent decisions, itis critical to enable a detailed global view of mapping data (that describes the road environments and roadside objects) to besynchronized and exchanged dynamically among autonomous vehicles, roadside infrastructure, and traffic control center. Centralto autonomous driving is the mapping data in form of 3D point cloud that is commonly utilized by LIDAR (laser-based) perceptionsystems, which can accurately represent physical objects in 3D space, but usually takes up a large volume of data. Therefore,the efficiency of 3D point cloud mapping data dissemination is crucial to practical realization of autonomous driving. In this paper,we present 3D-MADS, an efficient information dissemination system of 3D point cloud mapping data for autonomous vehicles,roadside units and a mapping data repository, considering heterogeneous transmission options, such as cellular network unicastand short-range local broadcast transmissions. We provide a system of solutions to optimize the performance of 3D pointcloud mapping data dissemination, including hashing 3D point cloud data by Bloom filters, index coding at roadside units, andopportunistic scheduling of heterogeneous transmissions. We empirically evaluated our system using real-world mobility datatraces of vehicles and 3D point cloud data of city streets. We also implemented our system in a multi-robotic vehicle testbed forpractical evaluation.
Index Terms—Autonomous vehicles, 3D point cloud data, information dissemination, index coding, Bloom filters
F
1 INTRODUCTION
One of the most impactful technologies is the adventof autonomous vehicles that automate driving andnavigation without human assistance. Autonomousvehicles will revolutionize our mobility behavior byenabling safer and reliable transportations. Althoughbeing studied traditionally in artificial intelligenceand robotics for the perception, inference and controlmechanisms, information exchanges and communi-cation networks play an increasing role in practicalrealization of autonomous driving for several reasons:
1) Safety Assurance: A single vehicle always has alimited scope of perception, or potential blindspots. Sharing the perception data among ve-hicles and roadside sensors will substantiallyenhance the anticipation of unseen events andrapid reactions to potential accidents. An ex-tensive view of road environment also allows ahuman driver to take informed intervention onthe automatic driving system, if necessary.
2) Regulation Facilitation: The biggest hurdle forautonomous vehicles is not due to technology,but the associated policies and regulations thatpermit their operations. There are legal andmoral issues of entrusting fully computerized
• C.-K. Chau and C.-M. Tseng are with the Masdar Institute ofScience and Technology. I. W.-H. Ho, E. Magsino and K. Jia arewith the Hong Kong Polytechnic University. E-mail: {ckchau, ct-seng}@masdar.ac.ae, [email protected], {elmer.magsino, kang-hao.jia}@connect.polyu.hk
systems for road safety. A resolution to facili-tate regulations is to provide real-time surveil-lance of autonomous vehicles and proper controlmechanisms to enable the regulatory bodies tointervene in emergency situations.
3) Intelligence Enhancement: Despite the advanceof in-vehicle embedded computing systems forsupporting intelligent decisions, there is a vastamount of real-time information to be analyzedand processed in dynamic road environments.The computationally intense analysis and in-ference tasks will be more efficiently processedby a centralized cloud computing platform, andleveraging sophisticated machine learning capa-bilities of more powerful server clusters.
This paper investigates the information dissemi-nation systems supporting autonomous vehicles. Weaim to provide a detailed global view of mappingdata, describing the road environments and roadsideobjects perceived by autonomous vehicles, which issynchronized and exchanged dynamically among au-tonomous vehicles, roadside infrastructure, and trafficcontrol center. A remarkable analogue can be drawnfrom nowadays telematics, whereby drivers down-load their maps and navigation information from atelematics provider. For future autonomous driving,vehicles will download more sophisticated 3D map-ping data for automatic navigation and control.
We highlight two key elements in the informa-tion dissemination systems supporting autonomous

2
vehicles: (1) 3D point cloud mapping data, and (2)information exchange processes of mapping data.
1.1 3D Point Cloud Mapping DataAlthough there are many possible data types that canbe exchanged among vehicles and roadside infras-tructure to assist autonomous driving, we focus on aprimitive data type, called 3D point cloud data, whichis a set of data points in a 3D coordinate system,representing the surfaces of certain physical objects in3D space. Usually, 3D point cloud is generated by aLIDAR (Light Detection And Ranging) system, whichsweeps the surfaces of nearby objects using an arrayof laser range sensors. 3D point cloud is regarded as afaithful representation of the environment, which hasbeen utilized by many robotic systems in the decisionprocesses for navigation and localization. See an il-lustration of 3D point cloud of the road environmentcaptured by LIDAR in Fig 1, using the dataset in [1].
Fig. 1. An example of 3D point cloud of road environment.
This paper considers the problem of maintaining aglobal view of mapping data (e.g., road environments,roadside objects) around the autonomous vehicles inform of 3D point cloud for a number of reasons:
1) 3D point cloud is a faithful representation of theraw data captured by LIDAR sensors, withoutdistortion, and is independent of high-level dataprocessing and inference mechanisms. The datacan be utilized without knowledge of the inter-nal data processing and inference mechanismsof individual autonomous vehicles.
2) LIDAR has a relatively long range (up to 100m),and can work in most circumstances. Other per-ception methods, such as RADAR, SONAR, andcomputer visions, are strongly affected by theweather conditions and surrounding light inten-sity [2]. Hence, 3D point cloud has an advantageof allowing high accuracy for object recognition.
3) 3D point cloud allows simple data manipula-tion operations, such as merging, sub-sampling,contouring, detection of differences. These dataoperations are important to the integration ofmultiple views to create a global view.
4) A number of landscape/road surveying compa-nies (e.g., Google StreetView) have been collect-ing extensive databases of 3D point cloud formajor cities, which can be made available fordissemination to vehicles.
Like other perception methods, LIDAR is suscepti-ble to have blind spots where the laser sensors fail toreach. Hence, it is important to merge the views fromother sources to obtain a more comprehensive per-spective. 3D point cloud can take up a large volumeof data. For example, commercial LIDAR with 64 lasersensors can generate up to 2.2M points per second forthe 3D representation of its environment [3]. Hence,this calls for an efficient dissemination solution.
1.2 Information Exchange ProcessesIn practice, there can be more than one transmis-sion options between vehicles and infrastructure. Weconsider two main typical transmission options fordisseminating 3D point cloud mapping data:
1) Short-range Broadcast: This can be achieved byDSRC (dedicated short-range communication),which has been proposed to broadcast basicsafety messages (e.g., speed, heading and loca-tion). DSRC suffers from limited available spec-trum and transmission range, which restricts thedata transmission rate.
2) Long-range Unicast: This can be achieved by(4G/Beyond 4G) mobile cellular networks. Newvehicles are likely pre-installed with sim cards,which facilitate the connections to mobile net-works. However, unicast connection may be in-efficient to share common data among nearbytransmitters, such as mapping data for the ve-hicles in the same region. Cellular networks areintended to provide general data transmissions,with connection fees by service operators.
We assume that short-range broadcast has limitedbandwidth capacity at a lower transmission cost,whereas long-range unicast has considerably largebandwidth capacity at a higher transmission cost.
Fig. 2. An illustration of the information exchange processesof mapping data among the three parties.
The information exchange processes of mappingdata are likely to be performed by three major parties:
1) Autonomous Vehicles: These vehicles areequipped with both short-range and cellularnetwork communication systems. They willreceive mapping data for the road segmentsthey are heading to, and possibly transmit theperception data from their on-board LIDARsto a mapping data repository. We considerthe possibility of overhearing other vehicles’transmitted data with single-hop transmissions.

3
2) Roadside Units (RSUs): These are fixed-locationsystems that can transmit and receive short-range communications from vehicles, and canrelay transmissions to a mapping data repos-itory using wireline connections. RSU may beequipped with local LIDAR sensors to monitortraffic or provide blind spot views that cannotbe detected by autonomous vehicles. We assumethat the RSUs are prioritized for their short-range broadcast transmissions.
3) Mapping Data Repository (MDR): This is a cen-tralized database for all mapping data. In reality,there may be multiple mapping data providers,but we refer them collectively as the repository.The MDR is a cloud computing server, storingthe global view of mapping data over time. Itmerges multiple mapping data sources, and con-veys useful information to assist the navigationdecisions at individual vehicles.
See Fig. 2 for an illustration of the information ex-changes of mapping data among the three parties.
1.3 Summary of Contributions
1) We present 3D-MADS (3D-MApping Dissemina-tion System), an efficient 3D point cloud map-ping data dissemination system for autonomousvehicles, roadside units and a mapping datarepository with heterogeneous cellular networkunicast and short-range broadcast transmissions.
2) We provide a system of solutions to optimizethe performance of 3D point cloud mappingdata dissemination, including hashing 3D pointcloud data by Bloom filters, index coding atroadside units, and opportunistic scheduling ofheterogeneous transmissions.
3) We empirically evaluated our system using real-world mobility data traces of vehicles and 3Dpoint cloud data of city streets. We also imple-mented our system in a multi-robotic vehicletestbed for practical evaluation.
2 RELATED WORK
There have been a plenty of vibrant developmentsfor autonomous vehicles recently. In 2011, Googleintroduced a driverless car, the first system to betested in real-world streets. It uses an array of 3DLIDAR sensors to perceive the environment in 3Dview. However, 3D view data requires large mem-ory for storage and transmission. Sharing such hugeamount of data with other vehicles and infrastruc-ture requires large communication bandwidth. Othermanufacturers rely on RADAR and computer visions,for example, Tesla motor “auto-pilot” for enablingsemi-autonomous driving. Note that there was a fatalaccident involving auto-pilot, which highlights theneed for detailed accurate perception data of roadenvironments [4].
To overcome the bandwidth limitation of mappingdata dissemination, communications and cooperationamong vehicles and roadside nodes can be utilizedto extend the sights of vehicles. A content-centriccommunication system designed for sharing sensorinformation in autonomous driving, called CarSpeak,was presented in [5], which is based on CSMA forcommunications. Another way of sharing informationamong vehicles is through a cloud-assisted systemcalled Carcel proposed in [6]. This work differs from[5], [6] in several ways. We consider a scheduledinformation dissemination mechanism utilizing indexcoding, data hashing and heterogeneous transmissionoptions, whereas [5], [6] consider unscheduled com-munications based on CSMA or homogeneous proto-col. We also consider a more sophisticated setting, byseparation of static and dynamic information.
On the other hand, content distribution in wire-less ad hoc networks [7], [8] can be enhanced byrouting and forwarding. For example, [9] discussedhow network coding configurations such as resourceconstraints affect content distribution performance.But these studies did not optimize 3D mapping datadissemination for autonomous vehicles.
Also, there are several studies in robotics aboutmulti-robot coordination [2]. For example, [10], [11]presented real-time cooperative navigation and plan-ning using multiple autonomous robots. However,these studies usually ignore communication systems,and assume unlimited communication bandwidth.
3 PRELIMINARIES3.1 Basics of Autonomous VehiclesThe intelligent tasks of autonomous vehicles [2] are:
1) Perception: Autonomous vehicles first need togather sensor data (e.g., LIDAR, RADAR, cam-eras) and recognize the environments and staticor moving objects surrounding them.
2) Localization: Autonomous vehicles need to in-fer their locations and contexts. The vehiclescan leverage on a-prior information (e.g., 3Dmapping data). Otherwise, simultaneous local-ization and mapping (SLAM) [12] is requiredto generate real-time dynamic maps to enableautonomous navigation.
3) Navigation: Autonomous vehicles are able tocontrol their movements, by avoiding obstacles,maintaining balance safely, and taking into ac-count the complex interactions with human ob-jects and traffic conditions.
These tasks, though can be accomplished at individualvehicles, will be enhanced significantly using the col-lective information from a mapping data repository,other vehicles, and roadside units.3.2 Data for Autonomous VehiclesThere are diverse types of data to be assimilatedby autonomous vehicles. The mapping data for au-tonomous vehicles can be classified as:

4
1) Static Data: Such data does not vary over a longtime interval, for example, road infrastructure.
2) Dynamic Data: Such data is time-sensitive, forexample, temporary street parking.
For efficient dissemination, it is desirable to separatedynamic data from static data in 3D point cloud data.Different encoding and transmission schemes can beapplied to and optimized for different types of data.
In machine learning, there are techniques calledsegmentation [13], [14], which partition 3D pointcloud data into groups of points for object recognitionand labeling. A mapping data repository can applysuitable segmentation to its 3D point cloud data toseparate dynamic data from static data.
3.3 Types of RoadsVehicles are bounded by the road networks. The struc-tures of roads provide the characteristics of contentdelivery networks for vehicles. Although there arediverse road conditions, two major types of road areconsidered as follows:
1) Two-way Roads: There are moving vehicles trav-eling at the opposite directions. This gives rise tothe situation where the opposite vehicles requirethe data of road views from each other.
2) Junctions: The vehicles meet at a junction fromdifferent directions. For a 4-way junction, thereare 12 combinations of traveling directions.
The information dissemination of 3D point cloud datacan be optimized according to different types of roads.
4 SYSTEM DESIGN OF 3D-MADSThis section presents the detailed descriptions of 3D-MADS (3D-MApping Dissemination System). The op-erations of information exchanges among the threeparties are summarized in Fig. 3. Overall, the systemsynchronizes the mapping data among the parties in atimely manner, taking into account the characteristicsof long-range unicast and short-range broadcast.
Fig. 3. An illustration of system design of 3D-MADS.
4.1 Autonomous VehiclesDownloading: Autonomous vehicles are expected
to download the relevant 3D point cloud mappingdata in an a-priori manner, from the mapping datarepository (MDR) or via roadside units (RSUs), byproviding their trip plans in advance. Compressioncan be applied to 3D point cloud data to reduce thevolume of data. We also employ several techniques tooptimize the download operations in Secs. 7-8.
Perception: Autonomous vehicles utilize local per-ception data from their on-board LIDAR sensors, inaddition to the 3D point cloud mapping data fromMDR for recognizing the surroundings and obstacles.The local perception data will be uploaded to MDR tointegrate with the data from other vehicles and RSUs.
Inference & Decision: Based on extensive mappingdata, autonomous vehicles can infer the surround-ing stationary and moving objects, and predict theirmovements for autonomous driving decisions.
Control & Navigation: Given the knowledge ofinference, autonomous vehicles rely on the feedbackfrom control systems to calibrate their movements indynamic road environments.
Uploading: Sharing perception data enables a con-sistent global view among vehicles. We employ sev-eral techniques to optimize the upload operations.
Differentiation: Rather than uploading the whole3D point cloud data from local LIDAR, it is moreefficient to upload the differentiated parts, by compar-ing to a reference 3D point cloud mapping data fromMDR. We will describe a differential coding schemefor 3D point cloud data in Sec. 6.2.
Hashing: When multiple autonomous vehicles up-load their perception data, there may be redundancy.It is more efficient to first upload a hash file associatedwith 3D point cloud data and compare with theuploaded data. We will describe an hashing of 3Dpoint cloud data by Bloom filters in Sec. 6.3.
4.2 Roadside Units (RSUs)Integration: RSUs initiate the upload operations
of autonomous vehicles with short-range broadcast.After gathering the hash files from multiple vehicles,RSUs decide which vehicles will upload further per-ception data. Proper integration with the data fromall vehicles will be pre-processed at RSUs.
Coding: Index coding on 3D point cloud mappingdata will be performed at RSUs to optimize the localshort-range broadcast transmissions. We will describean index coding scheme in Sec. 7.
Perception: RSUs also provide their perception datafrom LIDAR sensors to enable blind spot views thatcannot be detected by autonomous vehicles.
4.3 Mapping Data Repository (MDR)Integration: MDR coordinates the information ex-
changes among autonomous vehicles. It sets the loca-tions and boundaries of each region of mapping data.

5
Since GPS data at the vehicles may be inaccurate dueto drifting, MDR needs to correct and align the 3Dpoint cloud perception data from different vehicles.
Separation: MDR separates static data and dynamicdata from the integrated 3D point cloud mappingdata, based on segmentation [13]–[15]. Additionalannotations can be generated to label the objects inmapping data. Different encoding and transmissionschemes can be applied to different types of data.
Scheduling: Given the options of using cellularnetwork unicast and short-range local broadcast trans-missions, MDR schedules the download and uploadoperations, based on the trip plans from the vehicles.We will describe a scheduling scheme in Sec. 8.
5 FORMULATION AND DEFINITIONS
To facilitate the full descriptions of 3D-MADS, wefirst present some formal definitions of informationdissemination of 3D point cloud mapping data.
For clarity, we consider discrete time slots. Denotea network of roads by G = (N , E), where eachundirected1 edge e ∈ E represents a road segment.There is a set of 3D point cloud mapping data, as-sociated with each e at time t, denoted by me(t). Letme(t) = ms
e ∪mde(t), where ms
e is the static data andmde(t) is the dynamic data. Each ms
e or mde(t) is 3D
point cloud, consisting of a set of points {p1, p2, ...}.MDR separates the dynamic data in 3D point cloud
data by a function Sep[·], such that
mde(t) = Sep
[{me(τ)}τ<t
]The detail of Sep[·] does not affect our system.
There is a set of vehicles V . Each vehicle c ∈ V isassociated with trip plan Pc, which is a path in G.Let the time of entering e ∈ Pc be tc(e). Each c willperceive 3D point cloud xc(t) from its local LIDARsensors at time t, which will be uploaded to MDR.
A subset of nodes are RSUs, denoted by R ⊆ N .Denote the set of edges connecting to RSU r ∈ R byE(r) ⊆ E . Each r ∈ R will perceive 3D point cloudxer(t) from its local LIDAR sensors for each edge e ∈E(r), which will be uploaded to MDR.
MDR integrates the 3D point cloud data based onthe previously uploaded data from vehicles and RSUsby a function Int[·], such that
me(t) = Int[{ ⋃
c∈V:tc(e)=τ
xc(τ) ∪⋃
r∈R:e∈E(r)
xer(τ)}τ<t
]Each vehicle c can upload or download map-
ping data using short-range broadcast transmissions,or unicast transmissions via cellular networks. Weassume that (4G/B4G) cellular network transmis-sions have much larger capacity, whereas short-rangebroadcast is limited by local spectrum allocation. Theshort-range broadcast transmissions incur no or very
1. If a road consists of opposite traveling lanes that are far apart,it can be modeled by two separate edges.
low costs, whereas cellular network transmissionsincur much higher costs, and hence, need to beminimized. For simplicity, we assume that there areseparate channels for short-range broadcast downloadand upload transmissions, with capacities denoted byC↓ and C↑, respectively. This can be implemented byfrequency or time division in the MAC layer.
Our system aims to optimize the upload or down-load operations at vehicles and RSUs in order tosatisfy the following objectives:
1) Each static data mse is downloaded from MDR
to c, for each e ∈ Pc before or at time tc(e).2) Each dynamic data md
e is downloaded fromMDR to c, for each e ∈ Pc at time tc(e).
3) The volume of downloaded data via short-rangebroadcast at each r ∈ R should not exceed C↓.
4) The volume of uploaded data via short-rangebroadcast at each r ∈ R should not exceed C↑.
5) The total volume of downloaded and uploadeddata via cellular networks should be minimized.
3D-MADS optimizes the upload operations byemploying differential coding and hashing at au-tonomous vehicles, and the download operations byutilizing index coding at RSUs and opportunisticscheduling at MDR.
6 REPRESENTATIONS OF 3D POINT CLOUD
This section defines a common representation of 3Dpoint cloud data, called Octree. We present differentialcoding and hashing schemes for 3D point cloud data.
6.1 Octree Representation3D point cloud depicts objects and surfaces as a collec-tion of 3D points in the Cartesian coordinate systemwithin a bounded region [16]. A common approach toencode 3D point cloud is using Octree, by which the3D space is recursively partitioned into 8 cells (voxels)and a binary number is used to indicate the presenceof an object in each cell. See an illustration of Octreerepresentation of 3D point cloud in Fig. 4.
Fig. 4. An illustration of Octree representation of 3D pointcloud.
Octree is a tree-based data structure suitably forsparse 3D point data, where each node represents acell or volume element (voxel). From the root, it is

6
iteratively divided into eight children until a certaindepth or level L is achieved [17] or if there is nomore 3D point cloud to be partitioned. An occupiedvoxel contains a point or a set of points, and is labeledby “1”, otherwise by “0”. A node labeled by “1” canbe further decomposed into eight more child nodes,whereas there is no need to expand a node labeledby “0”. Accordingly, the larger the depth (i.e., highervalue of L), the higher the resolution of the 3D object.
Two reference corners for the boundary of regionof an Octree are denoted by (x1, y1, z1) and (x2, y2, z2)(see Fig. 4). One can represent an Octree by a bit stringrepresentation that encodes its contents by a fixedtraversal order in the voxels of each layer. We canapply further coding schemes on the bit string rep-resentation. Note that different LIDAR sensors mayproduce different sets of 3D point cloud data on thesame objects in the region, because of different sens-ing specifications. But the Octree representations canapproximate closely with each other, under a suitablevalue of L. Hence, it is possible to compare differentsets of 3D point cloud data in Octree representations.
There are several proposals for point cloud com-pression [18], [19]. These techniques can be applied inour system, but note that they are mainly for storageand are not optimized for communication systems.
6.2 Differentiation and Differential Coding
Differentiation is particularly useful for identifyingthe dynamic components in 3D point cloud data. Wedenote the differentiated data between observed pointcloud xc(t) and reference point cloud me(t− 1) by:
Diffc(t) =(xc(t)\me(t− 1)
)∪(me(t− 1)\xc(t)
)where t = tc(e) and e ∈ Pc.
To encode the differentiated data, we employ differ-ential coding on Octree. Octree allows efficient identi-fication of the differences by enumerating the voxelsalong the tree. Once the differences are identified, wecan employ another Octree to encode the differenti-ated parts. However, the meanings of voxels are nowdifferent: “0” means no difference with respect to thereference 3D point cloud data, whereas “1” meansthe binary content in the respective voxel should beflipped. See an illustration in Fig. 5.
Fig. 5. An illustration of differential coding on 3D point cloud.
6.3 Hashing by Bloom FiltersComparison by the hash files associated with 3Dpoint cloud data is more efficient than using thewhole data set. The hash files should have certaindesirable properties. For example, one can comparetwo hash files to identify which point cloud dataconsists of more contents (e.g., more observed objects).Second, one can check if the point cloud data containscertain known objects, without looking at the wholedata set. A simple solution is to use a Bloom filter[20], a compact lossy data structure representing themembership of a set of elements. In our system, eachvehicle first communicates with RSUs and MDR usingBloom filters before uploading perception data.
Recall that xc(t) = {p1, p2, ...} is a set of 3D points.Note that each pi has a unique octary representation,such that each digit in the octary representation rep-resents the order of the respective occupied voxel ateach layer in Octree. We denote digit “0” to representthe first voxel. For example, the four 3D points in theOctree of Fig. 4 can be represented in octary repre-sentation as {101, 105, 150, 155}. Next, we map eachpoint in octary representation by a set of K binaryhash functions: fk(pi) 7→ {0, 1}, where k = 1, ...,K.Let fk(xc(t)) = fk(p1) ∨ fk(p2) ∨ ... be the bitwisedisjunction of all the points in xc(t) = {p1, p2, ...}. TheK output bits
(fk(xc(t))
)Kk=1
will be a Bloom filter forxc(t), denoted by BF(xc(t)).
Bloom filters have some desirable properties. If a 3Dpoint cloud has more contents, then its Bloom filtercontains more 1’s. One can check if a 3D point cloudcontains a set of known 3D points, by checking if itsBloom filter contains the corresponding hash values.
7 INDEX CODING AT ROADSIDE UNITS
Index coding is a variant of network coding [21], [22],and is widely applied in wireless communications.
7.1 Motivating Examples
Fig. 6. An example of index coding for mapping datadissemination with 2 opposite traveling vehicles.
We illustrate a simple example using index cod-ing for mapping data dissemination in Fig. 6. Thereare 2 vehicles traveling at opposite directions. Bothvehicles are now within the transmission range ofa common RSU. Consider the static mapping datafor two road segments, denoted by m1 and m2 inbit string representation. Since the vehicles had map-ping data m1 and m2 correspondingly, before theyentered the respective road segments. The common

7
RSU can broadcast a coded packet m1⊕m2, where⊕ is a bitwise XOR operator. To obtain the requiredmapping data, the vehicles can decode using thereceived data as follows: m1⊕(m1⊕m2) = m2 andm2⊕(m1⊕m2) = m1. Hence, this can reduce thenumber of transmissions. If m1 and m2 have differentlengths, padding will be used.
Fig. 7. A 4-way junction with 3 vehicles: c1 at direc-tion m1→m3, c2 at direction m2→m1, and c3 at directionm3→m1.
We next consider an example of index coding fora 4-way junction in Fig. 7. There are 3 vehicles: c1moving from m1 to m3, c2 moving from m2 to m1,and c3 moving from m3 to m1. In this case, the RSUonly needs to broadcast two packets: m1 ⊕ m3 andm2 ⊕ m1. c1 can obtain m3 = m1⊕(m1⊕m3), c2 canobtain m1 = m2⊕(m2⊕m1), and c3 can obtain m2 =m3⊕(m2⊕m1)⊕ (m1⊕m3).
7.2 Optimal Index Coding for Single Junction
To construct a good index coding scheme, we considera particular RSU at a single n-way junction, labeledby r ∈ R. We represent the demands of mappingdata by a directed graph Dr with a set of n nodesrepresenting the set of connected road segments to r.Denote the mapping data for the k-th road segmentby mk. There is a directed edge (mk1→mk2) in Dr, ifthere is a vehicle moving from the k1-th road segmentto the k2-th road segment, which needs to obtainmk2 , given mk1 as a-prior (side) information. The non-source nodes in Dr (i.e., those have at least one in-coming edge) are called the demanded packets. See twoexamples of Dr for a 4-way junction in Fig. 8.
For convenience of analysis, we assume that eachpacket of mapping data has a uniform size. We aimto construct an optimal index coding scheme usingminimal number of transmitted packets to covey therequired information (i.e., non-source nodes in Dr).
The uncoded packets {m1, ...,mn} are called sourcepackets. A packet consists of K source packets com-bined by bitwise XOR operator is called a K-ary codedpackets. For example, m2⊕m1 is a binary coded packet.An index coding scheme, denoted by I, is a set ofcoded or source packets.
Theorem 1: Given demand graph Dr, an optimalindex coding scheme I can be constructed using onlysource packets and binary coded packets.
In particular, each demand (mk1→mk2) in Dr canbe decoded by one of the following ways:
1) A source packet (i.e., mk2 ∈ I).2) Or a sequence of connected binary coded pack-
ets, say {mk1⊕mkr ,mkr⊕mkr−1 , ...,mk3⊕mk2} ⊆I, such that the required packet can be decodedby mk1 and a chain of binary coded packets.
See two examples of optimal index coding schemesin Fig. 8, where an arrow represents a demand, and adashed enclosure represents a coded or source packet.
Fig. 8. Examples of Dr and their optimal index codingschemes for a 4-way junction. (a) Four vehicles with di-rections: (m1→m3), (m3→m2), (m2→m1), (m2→m4), andan optimal index coding scheme is {m1⊕m2, m1⊕m3,m4}.(b) Four vehicles with directions: (m1→m3), (m3→m1),(m2→m4), (m4→m2), and an optimal index coding schemeis {m1⊕m3,m2⊕m4}.
By Theorem 1, it suffices to consider binary codedpackets. We next present a polynomial-time algorithmOptIdxCd to find an optimal index coding scheme,which first adds any demand (mk1→mk2) as a codedpacket, and then removes redundant packets in anycycles of coded packets, while ensuring the demandedpackets are decodable.
Algorithm 1 OptIdxCd[Dr]
1: I ← ∅2: for (mk1
→mk2) ∈ Dr do
3: I ← I ∪ {mk1⊕mk2
}. lockk1,k2
prevents mk1⊕mk2
to be removed from I4: lockk1,k2
← False5: end for6: while there exists cycle {mk1
⊕mk2,mk2
⊕mk3...,mkr⊕mk1
} ⊆ Ido
7: if lockkt,kt+1= False then
8: I ← I\{mkt⊕mkt+1}
9: for (mk′1→mk′2
) ∈ Dr do10: if there exists no path {mk′1
⊕mk′r, ...,mk′3
⊕mk′2}
11: ⊆ I\{mk′1⊕mk′2
} then12: lockk′1,k′2
← True
13: end if14: end for15: end if16: end while17: return I
Theorem 2: Algorithm OptIdxCd produces an opti-mal index coding scheme.
The proofs of Theorems 1-2 are in the Appendix.
Note that Algorithm OptIdxCd produces an in-dex coding scheme with only coded packets only.OptIdxCd can be improved by replacing some coded

8
packets by source packets, because the source pack-ets are immediately decodable. One can replace anybinary coded packet that is only used to produce justone demanded packet by the corresponding sourcepacket, although the size of I will remain the same.
8 OPPORTUNISTIC SCHEDULINGA scheduling scheme decides which transmissionmethod of mapping data dissemination from theMDR to autonomous vehicles will be employed.8.1 UploadingAutonomous vehicles can identify and upload thenecessary dynamic mapping data to MDR using dif-ferentiation. Since dynamic mapping data is onlydetectable at the moment of departing from a roadsegment, the upload transmissions take place im-mediately through the nearby RSU (in short-rangebroadcast), whenever possible. Otherwise, long-rangecellular network transmissions are employed. Further-more, hashing is likely to reduce the upload transmis-sion bandwidth.8.2 DownloadingLet tsc and tdc be the starting and ending time of vehiclec’s trip. There are two modes of scheduling:
1) Offline Mode: All the trip plans of autonomousvehicles {Pc}c∈V are known in advance. Weassume that there are at most T time slots.
2) Online Mode: Only the trip plans of the au-tonomous vehicles started at the current timetnow or before ({Pc | tsc ≤ tnow}c∈V ) are known.
MDR schedules the downloads of mapping data toindividual autonomous vehicles according to the GPSlocations and trip plans. The mapping data will befirst downloaded via nearby RSUs (via short-rangebroadcast). In case of insufficient capacity, long-rangecellular network transmissions will be used.
Recall static mapping data denoted by mse and
dynamic data by mde(t) for road segment e ∈ E . ms
e
should be downloaded to vehicle c before or at timetc(e), and md
e should be downloaded to c at time tc(e).For each RSU r ∈ R, let Vr(t) = {c ∈ V | t = tc(r)}
be the set of vehicles meet at the junction r at time t,and Dr(t) be the demand graph considering the set ofvehicles Vr(t). Let Idr (t) be the index coding schemeat time t. Denote by OptIdxCds[Dr(t)] the optimalindex coding scheme for static mapping data, and byOptIdxCdd[Dr(t)] the one for dynamic mapping data.
For simplicity, we assume uniform packet size. Letxsc(e, r) ∈ {0, 1} be an indicator variable if ms
e has beendownloaded to vehicle c at RSU r (via short-rangebroadcast). Similarly, define xdc(e, r) ∈ {0, 1} for md
e. Ifthe mapping data is not downloaded via short-rangebroadcast, it will be downloaded via cellular networksat the moment it is needed. We aim to minimize thenumber of cellular transmissions:
min∑
c∈V,e∈Pc,r∈R(1− xsc(e, r)) + (1− xdc(e, r))
subject to the constraints of delivering the requireddata to intended vehicles before the data is needed.
A greedy offline opportunistic scheduling schemeis presented in Algorithm OFLSchd. At each RSU,optimal single-junction index coding is employed,considering all autonomous vehicles that approachthe junction at the current time. The residual down-load capacity at each RSU will be used for the trans-missions via cellular networks without coding, givenall future trips of autonomous vehicles. Since dynamicmapping data is only needed when the vehicles enterthe corresponding road segments, the disseminationof static mapping data is performed after deliveringthe dynamic mapping data.
A greedy online opportunistic scheduling scheme ispresented in Algorithm ONLSchd, which schedules thetransmissions at RSU based on arrival vehicles in anonline manner. Static mapping data will be scheduledbefore dynamic mapping data, unlike OFLSchd. It isbecause that dynamic mapping data, after differen-tiation, has relatively smaller data volume, which ismore efficient to be downloaded via cellular networks.
Algorithm 2 OFLSchd[Dr(t)t∈{1,...,T},r∈R]
. Download dynamic mapping data by index coding1: for t ∈ {1, ..., T}, r ∈ R do2: Idr(t)← OptIdxCdd[Dr(t)]3: if C↓ > |Idr(t)| then4: C↓r(t)← C↓ − |Idr(t)|5: xd
c(e, r)← 1 if mde ∈ I
dr(t)
6: end if7: end for. Download static mapping data by index coding
8: for t ∈ {1, ..., T}, r ∈ R do9: Isr(t)← OptIdxCds[Dr(t)]
10: if C↓r(t) > |Isr(t)| then
11: C↓r(t)← C↓r(t)− |Isr(t)|
12: xsc(e, r)← 1 if ms
e ∈ Idr(t)
13: end if14: end for
. Download static mapping data by uncoded packets15: for t ∈ {1, ..., T}, c ∈ V do16: for e ∈ Pc such that xs
c(e, r) = 0 ∀r do17: xs
c(e, r)← 1 if C↓r(t) > 0 and tc(e) < t18: C↓r(t)← C↓r(t)− 119: end for20: end for
Algorithm 3 ONLSchd[Dr(tnow)r∈R]
. Download static mapping data by index coding1: for r ∈ R do2: Isr(tnow)← OptIdxCds[Dr(tnow)]3: if C↓ > |Isr(tnow) then4: C↓r(tnow)← C↓ − |Isr(tnow)|5: xs
c(e, r)← 1 if mse ∈ I
dr(tnow)
6: end if7: end for. Download dynamic mapping data by index coding
8: for r ∈ R do9: Idr(tnow)← OptIdxCdd[Dr(tnow)]
10: if C↓r(tnow) > |Idr(tnow)| then
11: C↓r(tnow)← C↓r(tnow)− |Idr(tnow)|
12: xdc(e, r)← 1 if md
e ∈ Idr(tnow)
13: end if14: end for
9 SIMULATION STUDIES
This section presents evaluation studies via simula-tions using real-world mobility data traces of vehicles

9
Fig. 9. (a) Partitioned 3D point cloud mapping data of the junction in Fig 1. Empirical taxi GPS traces for (b) a single junction,and (c) multiple junctions.
and 3D point cloud data of city streets.
9.1 Hashing by Bloom Filters
This section evaluates the usefulness of hashing 3Dpoint cloud data by Bloom filters. We use Ford cam-pus 3D point cloud dataset [1], [23], and selecteda particular junction (depicted in Fig 1), which ispartitioned into four partially overlapped road seg-ments {m1,m2,m3,m4} in the same manner as inFig. 7. The partitioned mapping data {m1,m2,m3,m4}is depicted in Fig. 9 (a).
A Bloom filter is a probabilistic data structure,which can give false positives but not false negatives.Two essential factors for evaluating a Bloom filter arefalse positive rate and the number of hash functions.The lower false positive rate the more memory Bloomfilters need. The required size of bit string (b) fora Bloom filter can be calculated according to thedesirable false positive rate p by b = −n×ln(p)
ln(2)2[20],
where n is the expected number of points in 3D pointcloud. The required number of hash functions (k) canbe determined according to the size of Bloom filterand the expected number of points by k = ln(2)× b
n .The following case studies are evaluated:1) Comparison of Bloom filters between different
sets of 3D point cloud data: Road segments m1
and m3 are used, with no overlapped area. (SeeFig.10(a)(c))
2) Comparison of Bloom filters between similarsets of 3D point cloud data: Road segments m1
and m2 are used, with an overlapped area. (SeeFig.10(b)(d))
We denote the bit string of the Bloom filter for thepoint cloud mi by bim where i ∈
{1, 2, 3, 4
}. We define
a metric of difference Rji as the ratio between thenumber of bits where the bit in mi is 1 and mj is0 and the size of bit string can be computed usingsimple logical operations:
Rji ,(bim ∧ bjm)⊕ bim
b, (1)
where ∧ is the bitwise conjunction operator. Rji isa useful metric for measuring if a set of Bloomfilters capture different contents. Fig. 10 shows thecomparison results of Bloom filters for different road
segment data. Since road segments m1 and m3 haveno overlapped area, it is observed that the metrics (R3
1,R13) are substantially larger (R2
1, R12), for a given depth
of Octree. Moreover, increasing the size of Bloom filterdoes not increase the metrics (Rji ), although this cansubstantially reduce the false positive rate. Hence,Bloom filters are an effective way of hashing andcomparisons of 3D point cloud data.
10 6 4 2 1 .5 .1 .05False Positive Rate (%)
(d)
10 6 4 2 1 .5 .1 .05(b)
10 6 4 2 1 .5 .1 .05False Positive Rate (%)
(c)
10 6 4 2 1 .5 .1 .05(a)
50 100 150 2000
0.1
0.2
0.3
0.4
R13
50 100 150 2000
0.05
0.1
0.15
0.2
R31
Bloom Filter Size (kb)
50 100 150 2000
0.1
0.2
0.3
0.4
R12
Depth of Octree
1
2
3
4
5
6
7
8
9
10
50 100 150 2000
0.05
0.1
0.15
0.2R
21
Bloom Filter Size (kb)
Fig. 10. Comparisons of Bloom filters for different roadsegment data of Fig. 9 (left).
9.2 Optimal Index Coding for Single Junction
In the following, we present various simulation re-sults to verify the optimal index coding performancefor a single n-way junction and compare it to thetraditional random broadcasting scheme.
As a benchmark, we consider random transmissionscheme (RT), in which the RSU first transmits thehighly demanded packets, while performing uniformrandom transmission for equally demanded packets.For the case of optimal index coding transmissionscheme (OptIdxCd), Algorithm 1 is implemented todetermine which encoded messages to be sent in theair while adding source packets for transmission ifneeded. We further investigate the effect of havingprior road segment information in optimal index cod-ing (OptIdxCd-PI).

10
Simulations are performed by using practical cityenvironment data and empirical Beijing taxi GPStraces [24]. The road segment data in the 4-wayjunction are represented by the corresponding Octree-compressed point cloud data shown in Fig. 9 (a),obtained from [1], including those of the index-codedmapping data, are given in Table 1.
The taxi dataset contains GPS traces of 28,590 taxisplying the whole of the Beijing City. The City of Bei-jing resembles a grid type map, where most junctionscan be approximated to have n = 4 road segments.Given a 7-day observation period, the intersectionsituated at the East 3rd Ring Rd Middle has a dailyaverage of 9,351 taxis passing from 00:00h to 24:00h.The GPS traces of 12 of these taxis passing thisintersection is shown in Fig. 9 (b).
TABLE 1Octree-compressed point cloud data attributes for the
mapping data shown in Fig. 9 (left).Mapping Data Number of Points Data Size (MB)
m1 104,255 5.838m2 95,537 5.254m3 69,200 2.763m4 73,168 3.184
m1⊕m2 63,607 2.126m1⊕m3 65,920 2.812m1⊕m4 61,738 2.630m2⊕m3 67,806 2.631m2⊕m4 66,072 2.363m3⊕m4 64,025 2.126
We assume that the RSU is situated at the junction’scenter and has a transmission range of 200 m. Itchecks its surrounding for nearby vehicles every TS =5 min and determines the vehicles’ data demand andavailability, as represented by the DDA matrix as:
DDAt=kTS=
0 δ12α12 δ13α13 δ14α14
δ21α21 0 δ23α23 δ24α24
δ31α31 δ32α32 0 δ34α34
δ41α41 δ42α42 δ43α43 0
(2)
where k = 0,1,2,... and δij , αij ∈ {0,1}. When δij =1, the vehicle on road segment i wants to proceedto road segment j, otherwise δij = 0. When αij =1, the vehicle on road segment i does not have themapping data of road segment j, otherwise αij = 0.The main diagonal is zero since U-turning vehiclesdo not require the mapping data where it is currentlyon. DDA represents the adjacency matrix of a simpledirected graph such as the one shown in Fig. 8.
Fig. 11 illustrates the daily total number of trans-missions and transmitted mapping data size over aweek using the three transmission schemes. In theresults shown, when there is mapping data demand(δij = 1), αij = 1 automatically for the RT and Op-tIdxCd schemes imposing that vehicles do not carryany mapping data regarding their desired road seg-ment destinations. OptIdxCd reduces the total numberof transmissions by approximately 200 transmissions
when compared to the benchmark (random trans-mission). On the average per sampling time, thebenchmark requires 3.11 transmissions to satisfy allvehicles’ mapping data demands as compared to theoptimal index coding scheme that needs 2.37 numberof transmissions only.
0
500
1000
Tot
al N
umbe
r of
Tra
nsm
issi
ons
Random OptIdxCd OptIdxCd−PI
1 2 3 4 5 6 70
2000
4000
6000
Day
Tot
al T
rans
mitt
edD
ata
Siz
e (M
B)
Fig. 11. Total number of transmissions and transmitted datasize for a week.
The average daily transmitted data size for randomtransmission is 4.89 GB while that for the optimal in-dex coding scheme is only 4.1 GB. The optimal indexcoding scheme on average sends out 6.00 MB within atransmission period while random transmission sendsout 5.46 MB on average. By employing index codingeffectively, more data are delivered to the requestingvehicles with the fewest number of transmissions.
The third scheme, OptIdxCd-PI, investigates whathappens when vehicles within RSU range are prob-ably carrying a prior information (PI) about roadsegment 2. We observe that prior information furtherreduces the number of transmissions needed whencoupled with the optimal index coding scheme, thusconserving bandwidth. Per sampling time, an averageof 5.77 MB of data were transmitted by using only 1.76average number of transmissions.9.3 Optimal Index Coding for Multiple JunctionsThe optimal index coding scheme for a single 4-way junction is extended to multiple 4-way junctionsimplementing both the online (ONLSchd) and offline(OFLSchd) opportunistic scheduling algorithms. Fig.9 (c) shows the sample empirical taxi GPS traces form-ing the four 4-way junctions. The RSUs are still placedin the center of each intersection and is numbered byfollowing the bottom-top, left-right convention. Roadsegment mapping data used in the simulation is alsoobtained from [1].
For a period of seven days, the GPS traces of taxispassing through each junction is observed. We usedthe traces of taxis to generate their respective tripplans, evaluate opportunistic scheduling, and com-pare it to the benchmark.
The short-range broadcast download capacity limitfor RSU C↓ is varied. If the RSU capacity limit is
11
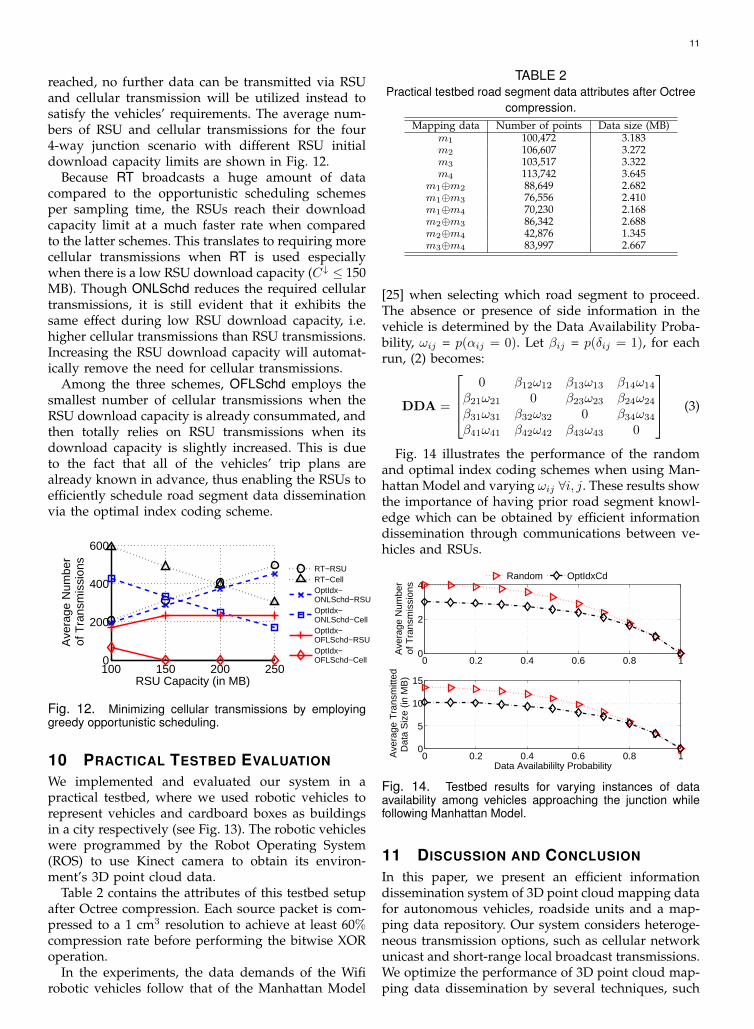
reached, no further data can be transmitted via RSUand cellular transmission will be utilized instead tosatisfy the vehicles’ requirements. The average num-bers of RSU and cellular transmissions for the four4-way junction scenario with different RSU initialdownload capacity limits are shown in Fig. 12.
Because RT broadcasts a huge amount of datacompared to the opportunistic scheduling schemesper sampling time, the RSUs reach their downloadcapacity limit at a much faster rate when comparedto the latter schemes. This translates to requiring morecellular transmissions when RT is used especiallywhen there is a low RSU download capacity (C↓ ≤ 150MB). Though ONLSchd reduces the required cellulartransmissions, it is still evident that it exhibits thesame effect during low RSU download capacity, i.e.higher cellular transmissions than RSU transmissions.Increasing the RSU download capacity will automat-ically remove the need for cellular transmissions.
Among the three schemes, OFLSchd employs thesmallest number of cellular transmissions when theRSU download capacity is already consummated, andthen totally relies on RSU transmissions when itsdownload capacity is slightly increased. This is dueto the fact that all of the vehicles’ trip plans arealready known in advance, thus enabling the RSUs toefficiently schedule road segment data disseminationvia the optimal index coding scheme.
100 150 200 2500
200
400
600
RSU Capacity (in MB)
Ave
rage
Num
ber
of T
rans
mis
sion
s
RT−RSURT−CellOptIdx−ONLSchd−RSUOptIdx−ONLSchd−CellOptIdx−OFLSchd−RSUOptIdx−OFLSchd−Cell
Fig. 12. Minimizing cellular transmissions by employinggreedy opportunistic scheduling.
10 PRACTICAL TESTBED EVALUATION
We implemented and evaluated our system in apractical testbed, where we used robotic vehicles torepresent vehicles and cardboard boxes as buildingsin a city respectively (see Fig. 13). The robotic vehicleswere programmed by the Robot Operating System(ROS) to use Kinect camera to obtain its environ-ment’s 3D point cloud data.
Table 2 contains the attributes of this testbed setupafter Octree compression. Each source packet is com-pressed to a 1 cm3 resolution to achieve at least 60%compression rate before performing the bitwise XORoperation.
In the experiments, the data demands of the Wifirobotic vehicles follow that of the Manhattan Model
TABLE 2Practical testbed road segment data attributes after Octree
compression.Mapping data Number of points Data size (MB)
m1 100,472 3.183m2 106,607 3.272m3 103,517 3.322m4 113,742 3.645
m1⊕m2 88,649 2.682m1⊕m3 76,556 2.410m1⊕m4 70,230 2.168m2⊕m3 86,342 2.688m2⊕m4 42,876 1.345m3⊕m4 83,997 2.667
[25] when selecting which road segment to proceed.The absence or presence of side information in thevehicle is determined by the Data Availability Proba-bility, ωij = p(αij = 0). Let βij = p(δij = 1), for eachrun, (2) becomes:
DDA =
0 β12ω12 β13ω13 β14ω14
β21ω21 0 β23ω23 β24ω24
β31ω31 β32ω32 0 β34ω34
β41ω41 β42ω42 β43ω43 0
(3)
Fig. 14 illustrates the performance of the randomand optimal index coding schemes when using Man-hattan Model and varying ωij ∀i, j. These results showthe importance of having prior road segment knowl-edge which can be obtained by efficient informationdissemination through communications between ve-hicles and RSUs.
0 0.2 0.4 0.6 0.8 10
2
4
Ave
rage
Num
ber
of T
rans
mis
sion
s
0 0.2 0.4 0.6 0.8 10
5
10
15
Ave
rage
Tra
nsm
itted
Dat
a S
ize
(in M
B)
Data Availabililty Probability
Random OptIdxCd
Fig. 14. Testbed results for varying instances of dataavailability among vehicles approaching the junction whilefollowing Manhattan Model.
11 DISCUSSION AND CONCLUSION
In this paper, we present an efficient informationdissemination system of 3D point cloud mapping datafor autonomous vehicles, roadside units and a map-ping data repository. Our system considers heteroge-neous transmission options, such as cellular networkunicast and short-range local broadcast transmissions.We optimize the performance of 3D point cloud map-ping data dissemination by several techniques, such

12
Fig. 13. (a) A robotic vehicle used in (b) experimental testbed and (c) its 3D point cloud representation.
as hashing 3D point cloud data by Bloom filters,index coding at roadside units, and opportunisticscheduling of heterogeneous transmissions.
We next discuss practical issues and extensionsof information dissemination systems for supportingautonomous vehicles.
Unknown Trip Plans: If the trip plan of each vehicleis not known in advance, RSU may broadcast indexcoding according to the observed traffic matrix of eachjunction, which is a probability distribution of vehiclemovement at the junction. This is studied in [26].
Multi-Junction Optimization: This paper only con-siders greedy coding and scheduling for each junc-tion. In general, one can consider multi-junction op-timization. However, we note that index coding ingeneral can be NP-hard [21]. Hence, identifying anoptimal coding scheme is unlikely to be feasible.
Other Data Types: Other than raw measurementdata as 3D point cloud, autonomous vehicles canexchange other data types, such as the inferred knowl-edge from measurement (i.e., the probability of ob-ject movements and classifications of obstacles). Suchknowledge can be shared to enable distributed pro-cessing among autonomous vehicles (e.g., SLAM). Butthis requires that the autonomous vehicles are awareof the decision mechanisms of each other, such thatthey can share knowledge with one another.
REFERENCES
[1] “Ford campus vision and LIDAR data set,” retrieved on Aug1, 2016. [Online]. Available: http://robots.engin.umich.edu/SoftwareData/Ford
[2] R. Siegwart, I. Nourbakhsh, and D. Scaramuzza, Introductionto Autonomous Mobile Robots. MIT Press, 2015.
[3] “Velodyne LIDAR HDL-64E,” retrieved on August 28, 2016.[Online]. Available: http://velodynelidar.com/hdl-64e.html
[4] New York Times, “Inside the self-driving tesla fatalaccident,” Jul 2016, retrieved on August 28, 2016.[Online]. Available: www.nytimes.com/interactive/2016/07/01/business/inside-tesla-accident.html/
[5] S. Kumar, L. Shi, N. Ahmed, S. Gil, D. Katabi, andD. Rus, “Carspeak: a content-centric network for autonomousdriving,” ACM SIGCOMM Computer Communication Review,vol. 42, no. 4, pp. 259–270, 2012.
[6] S. Kumar, S. Gollakota, and D. Katabi, “A cloud-assisted de-sign for autonomous driving,” in SIGCOMM Workshop, 2012.
[7] S. Guha, P. Basu, C.-K. Chau, and R. Gibbens, “Green wavesleep scheduling: Optimizing latency and throughput in dutycycling wireless networks,” IEEE Journal on Selected Areas inCommunications, vol. 29, no. 8, pp. 1595–1604, 2011.
[8] C.-K. Chau, R. Gibbens, and D. T. Robert Hancock, “Robustmultipath routing in large wireless networks,” in IEEE INFO-COM, 2011.
[9] S.-H. Lee, U. Lee, K.-W. Lee, and M. Gerla, “Content distri-bution in vanets using network coding: the effect of disk i/oand processing o/h,” in IEEE SECON, 2008.
[10] R. Madhavan, K. Fregene, and L. E. Parker, “Distributedcooperative outdoor multirobot localization and mapping,”Autonomous Robots, vol. 17, no. 1, pp. 23–39, 2004.
[11] R. Reid, A. Cann, C. Meiklejohn, L. Poli, A. Boeing, andT. Braunl, “Cooperative multi-robot navigation, exploration,mapping and object detection with ros,” in IEEE IntelligentVehicles Symp. (IV), 2013.
[12] C.-C. Wang, C. Thorpe, S. Thrun, M. Hebert, and H. Durrant-Whyte, “Simultaneous localization, mapping and moving ob-ject tracking,” Intl. J. of Robotics Research, vol. 26, no. 9, Sep2007.
[13] F. Ferri, M. Gianni, M. Menna, and F. Pirri, “Point cloudsegmentation and 3d path planning for tracked vehicles incluttered and dynamic environments,” in IROS Workshop onRobots in Clutter, 2014.
[14] B. Douillard, J. Underwood, N. Kuntz, V. Vlaskine,A. Quadros, P. Morton, and A. Frenkel, “On the segmentationof 3d lidar point clouds,” in IEEE Intl. Conf. on Robotics andAutomation, 2011.
[15] M. Himmelsbach, F. v. Hundelshausen, and H.-J. Wuensche,“Fast segmentation of 3d point clouds for ground vehicles,”in IEEE Intelligent Vehicles Symp., 2010.
[16] R. B. Rusu, Z. C. Marton, N. Blodow, M. Dolha, and M. Beetz,“Towards 3d point cloud based object maps for household en-vironments,” Robotics and Autonomous Systems, vol. 56, no. 11,pp. 927–941, 2008.
[17] J. Kammerl, N. Blodow, R. B. Rusu, S. Gedikli, M. Beetz, andE. Steinbach, “Real-time compression of point cloud streams,”in IEEE Intl. Conf. on Robotics and Automation (ICRA), 2012, pp.778–785.
[18] R. Schnabel and R. Klein, “Octree-based point-cloud compres-sion,” in Symp. on Point-Based Graphics (SPBG), 2006.
[19] Y. Huang, J. Peng, C. C. Kuo, and M. Gopi, “A genericscheme for progressive point cloud coding,” IEEE Transactionon Visualization and Computer Graphics, vol. 14, no. 2, pp. 440–453, 2008.
[20] M. Mitzenmacher and E. Upfal, Probability and computing.Cambridge University Press, 2005.
[21] S. El Rouayheb, A. Sprintson, and C. Georghiades, “On theindex coding problem and its relation to network coding andmatroid theory,” IEEE Trans. on Information Theory, vol. 56,no. 7, pp. 3187–3195, 2010.
[22] Z. Bar-Yossef, Y. Birk, T. Jayram, and T. Kol, “Index codingwith side information,” IEEE Trans. on Information Theory,vol. 57, no. 3, pp. 1479–1494, 2011.
[23] G. Pandey, J. R. McBride, and R. M. Eustice, “Ford campusvision and lidar data set,” International Journal of RoboticsResearch, vol. 30, no. 13, pp. 1543–1552, 2011.
[24] Y. Li, D. Jin, Z. Wang, L. Zeng, and S. Chen, “Exponential andpower law distribution of contact duration in urban vehicularad hoc networks,” IEEE Signal Processing Letters, vol. 20, no. 1,pp. 110–113, 2013.
[25] F. Bai, N. Sadagopan, and A. Helmy, “Important: A frame-work to systematically analyze the impact of mobility onperformance of routing protocols for adhoc networks,” inINFOCOM, vol. 2, 2003, pp. 825–835.
[26] K. F. Chu, E. Magsino, I. W.-H. Ho, and C.-K. Chau, “Indexcoding of point cloud-based road map data for autonomousdriving,” Tech. Rep., 2016.

13
APPENDIX
This section presents the full proofs of theorems.
Theorem 1: Given demand graph Dr, an optimalindex coding scheme I can be constructed using onlysource packets and binary coded packets.
In particular, each demand (mk1→mk2) in Dr canbe decoded by one of the following ways:
1) A source packet (i.e., mk2 ∈ I).2) A sequence of connected binary coded packets,
say {mk1⊕mkr ,mkr⊕mkr−1, ...,mk3⊕mk2} ⊆ I,
such that the required packet can be decodedby mk1 and a chain of binary coded packets.
Proof: The basic idea is to show that K-ary codedpackets (where K > 2) cannot reduce the size of anindex coding scheme.
Suppose that there exists a K-ary coded packet,denoted by m, in an optimal index coding scheme I,where K > 2. Let the number of demanded packetsthat can be decoded from m be h. For each of the hdemanded packets, it requires a (K − 1)-ary codedpacket, which cannot be a source packet becauseK > 2. See examples in Fig. 15.
Therefore, there requires at least h+1 coded packets,which is not optimal. Because one can simply replacethem by the h source packets, which strictly reducesthe number of transmitted packets in I.
Fig. 15. Examples showing that in order to decode an r-arycoded packet from a given K-ary coded packet, an (K − r)-ary coded packet is required.
Theorem 2: Algorithm OptIdxCd produces an opti-mal index coding scheme.
Proof: The basic idea is to show that if thereexists another better index coding scheme, then thiscannot have a smaller size than the one produced byOptIdxCd.
Let I be the index coding scheme produced byOptIdxCd. Suppose that there is another index codingscheme I ′, which consists of only coded packets. ByTheorem 1, I ′ only consists of binary coded packets.
Let S1 = I\I ′ and S2 = I ′\I. We next show thatthere is a one-to-one mapping from S1 to S2. Supposemk1⊕mk2 ∈ S1. Then there exists a path, say
{mk1⊕mkr ,mkr⊕mkr−1, ...,mk3⊕mk2} ⊆ I ′
Otherwise, mk1 or mk2 cannot be decoded.Since mk1⊕mk2 ∈ I, by the definition ofAlgorithm OptIdxCd, one of mk1 or mk2 must
be decodable. Note that there exists a coded packetmkt⊕mkt+1 ∈ {mk1⊕mkr ,mkr⊕mkr−1 , ...,mk3⊕mk2},such that mkt⊕mkt+1 /∈ I. Otherwise, there exists acycle in I. But Algorithm OptIdxCd rules out anycycle in I. Hence, mk1⊕mk2 ∈ S1 can be mapped tomkt⊕mkt+1
∈ S2. See Fig. 16 for an illustration.
Fig. 16. A path {mk1⊕mkr ,mkr⊕mkr−1 , ...,mk3⊕mk2}with mkt⊕mkt+1 ∈ S2.
Note that another mk′1⊕mk′2
∈ S1 cannot be mappedto the same mkt⊕mkt+1
∈ S2. Otherwise, it will createa cycle in I. For example, if mk1⊕mk2 ,mk′1
⊕mk′2∈ S1.
And there exist paths
{mk1⊕mkr , ...,m`1⊕m`2 , ...,mk3⊕mk2} ⊆ I ′,
{mk′1⊕mk′r
, ...,m`1⊕m`2 , ...,mk′3⊕mk′2
} ⊆ I ′,
where m`1⊕m`2 is the only common edge in S2. Then,there is a cycle:
{mk1⊕mkr , ...,mks⊕m`1 ,m`1⊕mk′s′, ...,mk′
r′⊕mk′1
,
mk′1⊕mk′2
, ...,mk′t′⊕m`2 ,m`2⊕mkt , ...,mk2⊕mk1}
See Fig. 17 for an illustration.
Fig. 17. If m`1⊕m`2 is the only common edge inS2 for paths {mk1⊕mkr , ...,m`1⊕m`2 , ...,mk3⊕mk2} and{mk′1
⊕mk′r , ...,m`1⊕m`2 , ...,mk′3⊕mk′2
}, then there is a cy-cle in I.
Since every member in S1 corresponds to a uniquemember in S2. Therefore, |S1| ≤ |S2|.
Remark: Note that in our setting of a single junc-tion, the prior information and required informationhas a uniform packet size. Hence, it is intuitive thatbinary coded packets will suffice for informationdissemination. However, in the general occasion ofnetwork coding, ternary or K-ary coded packets maybe advantageous.