efficiently delivering online services over integrated
TRANSCRIPT
Efficiently Delivering Online Services over Integrated Infrastructure
Hongqiang Harry Liu Raajay Viswanathan Matt Calder Aditya Akella
Ratul Mahajan Jitendra Padhye Ming Zhang
Microsoft University of WisconsinndashMadison USC
Abstractmdash We present Footprint a system for deliver-ing online services in the ldquointegratedrdquo setting where thesame provider operates multiple elements of the infras-tructure (eg proxies data centers and the wide areanetwork) Such integration can boost system efficiencyand performance by finely modulating how traffic entersand traverses the infrastructure But fully realizing itsbenefits requires managing complex dynamics of serviceworkloads For instance when a group of users are di-rected to a new proxy their ongoing sessions continueto arrive at the old proxy and this load at the old proxydeclines gradually Footprint harnesses such dynamicsusing a high-fidelity model that is also efficient to solveSimulations based on a partial deployment of Footprintin Microsoftrsquos infrastructure show that compared to thecurrent method it can carry at least 50 more traffic andreduce user delays by at least 30
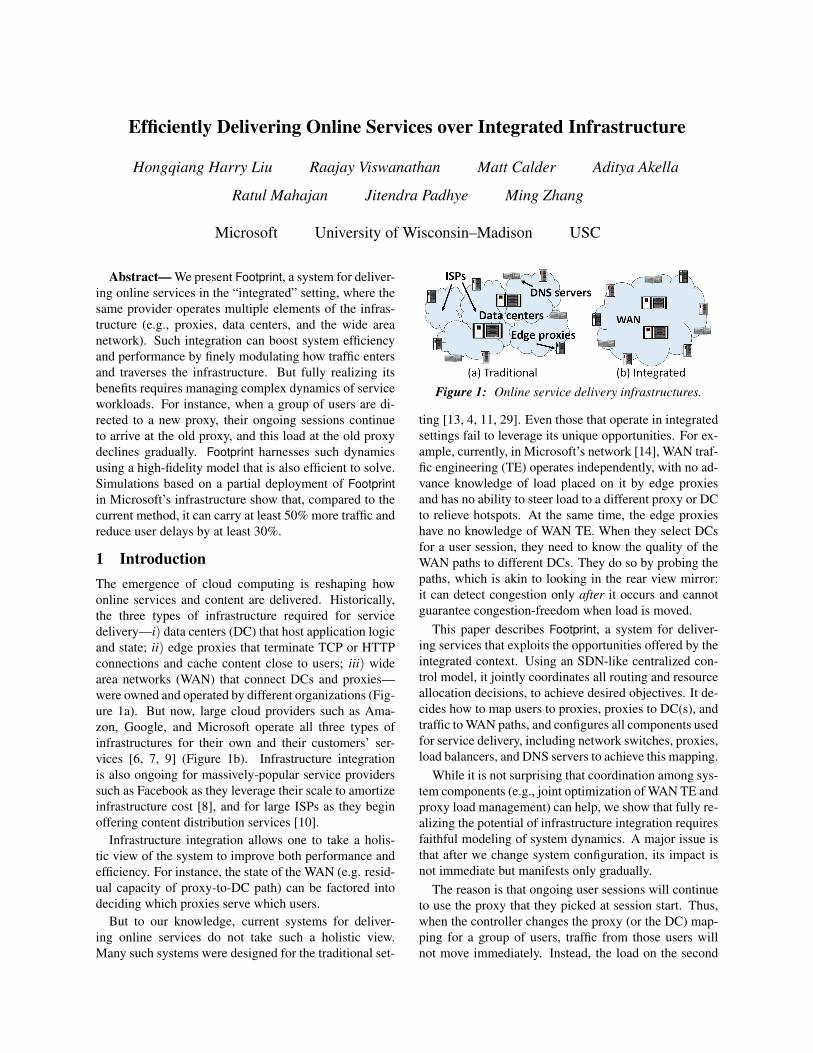
1 IntroductionThe emergence of cloud computing is reshaping howonline services and content are delivered Historicallythe three types of infrastructure required for servicedeliverymdashi) data centers (DC) that host application logicand state ii) edge proxies that terminate TCP or HTTPconnections and cache content close to users iii) widearea networks (WAN) that connect DCs and proxiesmdashwere owned and operated by different organizations (Fig-ure 1a) But now large cloud providers such as Ama-zon Google and Microsoft operate all three types ofinfrastructures for their own and their customersrsquo ser-vices [6 7 9] (Figure 1b) Infrastructure integrationis also ongoing for massively-popular service providerssuch as Facebook as they leverage their scale to amortizeinfrastructure cost [8] and for large ISPs as they beginoffering content distribution services [10]
Infrastructure integration allows one to take a holis-tic view of the system to improve both performance andefficiency For instance the state of the WAN (eg resid-ual capacity of proxy-to-DC path) can be factored intodeciding which proxies serve which users
But to our knowledge current systems for deliver-ing online services do not take such a holistic viewMany such systems were designed for the traditional set-
Figure 1 Online service delivery infrastructures
ting [13 4 11 29] Even those that operate in integratedsettings fail to leverage its unique opportunities For ex-ample currently in Microsoftrsquos network [14] WAN traf-fic engineering (TE) operates independently with no ad-vance knowledge of load placed on it by edge proxiesand has no ability to steer load to a different proxy or DCto relieve hotspots At the same time the edge proxieshave no knowledge of WAN TE When they select DCsfor a user session they need to know the quality of theWAN paths to different DCs They do so by probing thepaths which is akin to looking in the rear view mirrorit can detect congestion only after it occurs and cannotguarantee congestion-freedom when load is moved
This paper describes Footprint a system for deliver-ing services that exploits the opportunities offered by theintegrated context Using an SDN-like centralized con-trol model it jointly coordinates all routing and resourceallocation decisions to achieve desired objectives It de-cides how to map users to proxies proxies to DC(s) andtraffic to WAN paths and configures all components usedfor service delivery including network switches proxiesload balancers and DNS servers to achieve this mapping
While it is not surprising that coordination among sys-tem components (eg joint optimization of WAN TE andproxy load management) can help we show that fully re-alizing the potential of infrastructure integration requiresfaithful modeling of system dynamics A major issue isthat after we change system configuration its impact isnot immediate but manifests only gradually
The reason is that ongoing user sessions will continueto use the proxy that they picked at session start Thuswhen the controller changes the proxy (or the DC) map-ping for a group of users traffic from those users willnot move immediately Instead the load on the second
proxy (or the second DC) will increase as new sessionsarrive and that on the first proxy (or DC) will decreaseas old sessions depart The system model and controlalgorithms must correctly account for this lag Tradi-tional network TE controllers such as SWAN [18] andB4 [19] do not have to deal with this lag since they op-erate at packet granularity and the impact of a configu-ration change is immediate
In this paper we illustrate the modeling challenge us-ing data from Microsoftrsquos service-delivery infrastructureand we devise techniques to address it To capture tem-poral variations we model system load and performanceas a function of time Solving time-based models can beintractable (eg time is continuous) but we show howall load and performance constraints can be met by con-sidering a small number of time points The basic issuetackled by our modelmdashgradual impact of configurationchangesmdasharises in many other systems as well such assession-based load balancers middleboxes and even tra-ditional CDNs Our model is flexible and can be adaptedto improve the efficiency of these systems too
In addition to the modeling challenge we address anumber of practical issues to design a scalable and robustsystem For example we need to estimate the latencyto various edge proxies from different user groups in ascalable manner We will discuss these issues and oursolutions for them in more detail later in the paper
We implement our model and other techniques in aFootprint prototype This prototype is deployed fully in amodest-sized testbed and its monitoring aspects are de-ployed in Microsoftrsquos infrastructure We evaluate Foot-print using these deployments and trace-driven simula-tions We find that it enables the infrastructure to carry atleast 50 more traffic compared to Microsoftrsquos currentmethod that does not coordinate the selection of proxiesDCs and WAN paths At the same it improves user per-formance by at least 30 We also show that Footprintrsquossystem model is key to achieving these gains
2 Background and MotivationFigure 1 shows a high-level view of online service de-livery infrastructure DCs which usually number O(10)host application logic and hard state Users connect toDCs via edge proxies The proxies help boost perfor-mance by terminating TCP and HTTP connections (com-ing over possibly lossy last mile paths) close to the userand by caching some content (so it does not need to befetched from a distant DC)
In the traditional architecture the DCs the edge prox-ies and the WAN that connects them are operated by dif-ferent entities For example the DCs may be owned bya hosting service the edge proxies may be owned bya company like Akamai and various ISPs may provideconnectivity between the DCs and to the edge proxies
Figure 2 Spatial modulation via joint coordination (a)Path between P2 and DC2 is congested (b) WAN TEalone cannot resolve this congestion because other pathsbetween P2 and DC2 have low available capacity (c)Congestion is resolved when user-to-proxy mapping andWAN TE are done jointly moving users to other proxieswith uncongested paths to DCs
As discussed earlier large cloud providers like Microsoftand Google are moving toward a more integrated archi-tecture where a single entity owns and operates the DCsthe WAN connecting the DCs and the edge proxies
Regardless of the architecture any online service de-livery system makes three decisions for user requests(i) selecting the proxy for the request (ii) selecting theDC(s) for user sessions at a proxy and (iii) selectingWAN path(s) for traffic between proxies and DCs
In the traditional setting the three decisions are madelargely independently of one another and typically with-out the benefit of global knowledge A third-party likeAkamai makes a decision about which proxy the userselects and which DC the request will be served fromVarious ISP routing policies decide how the traffic flowsbetween the DCs and the proxies
Even in an integrated online service provider (OSP)these decisions are often made independently For exam-ple in Microsoftrsquos FastRoute system anycast routing isused to direct clients to nearby proxies [14] The proxiesindependently decide which DCs to route the request toand the WAN TE is performed independently as well
In this paper we argue for making service-delivery de-cisions jointly Joint decisions can significantly improveefficiency not only because of global information butalso by offering new knobs that were previously unavail-able For example consider Figure 2 where congestionappears between P2 and DC2 In the traditional settingWAN TE cannot change how traffic enters and exits thenetwork as that is determined by proxy and DC selectionTo relieve congestion it must rearrange how traffic flowswithin the network However sometimes that may notbe sufficient (Figure 2b) Joint decisions can ldquospatiallymodulaterdquo the traffic (ie change where it enters or exitsthe WAN) by simultaneously controlling the proxy andDC selection As shown in Figure 2c such spatial mod-ulation can help relieve congestion
Spatial modulation is especially helpful when a largefraction of WAN traffic is for user-facing services Thissituation holds for large cloud providers they have aseparate WAN for non-user-facing traffic [18 19]) To
2
Figure 3 Overview of Footprint
evaluate the benefit of spatial modulation in practicewe analyze traces from Microsoftrsquos infrastructure whichruns WAN TE and service delivery controller indepen-dently [14] We identified congestion events in the WANas those where the utilization of at least one link is over80 during a 5 minute window We find that all ofthese events could be resolved using spatial modulationof service traffic We also repeated the study by artifi-cially scaling traffic by 50 the number of congestionevents went up by 1200 (because our WAN is heav-ily utilized) but all of them could still be resolved Thisadvantage of spatial modulation underlies the efficiencyand performance improvements of Footprint (sect7)
While joint decisions can help we will see that accu-rate modeling of system dynamics is necessary to realizeits benefits Next we provide an overview of the Foot-print architecture and outline key challenges
3 Overview of Design and ChallengesFigure 3 shows an overview of Footprint The controlleris bootstrapped with infrastructure and service profilesInfrastructure profile describes the topology capacity interms of multiple resources (eg CPU memory band-width) and latency of each component A servicersquos pro-file describes which proxies and DCs host itmdashnot all ser-vices may be hosted everywheremdashand any constraintson mapping users to proxies and DCs (eg Chineseusers must be served from China) When running thecontroller gets up-to-date information on system healthworkload and user-to-proxy delays Periodically or af-ter a failure the controller computes and deploys newsystem configuration based on this information Thisconfiguration determines for the next period how userrequests map to proxies which DCs are used by proxiesand which WAN paths are used
Our design must address three categories of chal-lenges obtaining the necessary inputs computing thedesired configuration and implementing the computedconfiguration We provide a brief overview of these chal-lenges in this section Future sections provide more de-tail with a focus on the system model
Obtaining dynamic inputs In addition to static in-puts such as WAN topology the controller needs up-to-date information about user-to-proxy delays the load onthe system (ie load on WAN links data center andproxy utilization) and information about system health
Figure 4 Session affinity results in gradual loadchanges in session routing on top of server overlays
(eg which links or proxies have failed) We have scal-able infrastructure in place to collect the needed informa-tion about WAN and proxy load and health [30]
A key challenge lies in scalably collecting informationabout user-to-proxy delays We address it in two waysFirst we group users into groupsmdasha user group (UG) isa set of users that are expected to have similar relativelatencies to edge proxies (eg because they are proxi-mate in Internet topology) Second we measure delaysbetween UGs and proxies in a probabilistic manner sect5describes these aspects in more detail
Computing the configuration We initially believedthat we could compute system configurations using alinear program (LP) similar to TE controllers such asSWAN [18] However we realized that the Footprint con-troller faces qualitatively different problems The keyissue is that service sessions last longer than individualpackets and these sessions stick to their originally cho-sen proxies and DCs during their lifetime
More specifically online services rely on DNS to di-rect different users to different proxiesmdashIP addresses ofthe desired proxies are returned when the user looks upthe name of the service The mapping of name to IPaddresses is changed to move load from one proxy to an-other The problem is that DNS changes cannot changetraffic distribution instantaneously In addition to DNSmappings being cached at the LDNS servers for the TTLduration there are two other problems First DNS map-pings may be cached at the client well beyond the TTLvalue (eg many browsers will not look up the samehostname again within a tab as long as the tab is open)Second persistent TCP connections used by HTTP 11and 20 can last well beyond DNS TTL as well
This caching means that even after the Footprint con-troller updates a DNS mapping to point a UG to a newproxy the traffic from ongoing sessions from that UGcontinues to arrive at the old proxy The proxy must con-tinue to send traffic from ongoing sessions to the sameDC Otherwise those sessions may be abruptly termi-nated whenever system configuration is changed (egevery 5 minutes)
Session stickiness makes it harder to compute robustsystem configurations compared to traditional TE Forinstance in Figure 4(a) traffic from R1 to R4 is ini-
3
0 02 04 06 08
1
0 100 200 300
CD
F
Session Life Time (Second) (a)
0 02 04 06 08
1
0 1 2 3 4 5Fra
ctio
n o
f P
re-
exis
tin
g s
essi
on
s
Time (Minute) (b)
Figure 5 Session life time
tially routed via R2 When the link R2-R4 is congestedTE controller configures R1 to forward the traffic viaR3 This change is near instantaneous and more impor-tantly largely transparent to the applications Howeverthe Footprint controller does not have this luxury Fig-ure 4(b) shows an example Initially a group of users(UG) use proxy P1 to access the service S hosted in thedata center (DC) When the path P1-DC is congestedwe need to reroute the traffic via P2 This can be doneby changing the DNS mapping ie the name for serviceS resolves to the IP address of proxy P2 However thischange only affects new user sessions and traffic fromold sessions continues to arrive at P1
The severity of the problem is illustrated in Fig-ure 5(a) Using data logged across all our proxies itshows the CDF of the lifetime of TCP connections forthe Bing search service We see that 5 of the connec-tions last longer than 100 seconds In our current imple-mentation Footprint adjusts DNS mappings every 5 min-utes Since new HTTP sessions arrive roughly uniformlyin a five minute interval a large fraction TCP connec-tions continue to send data to the ldquooldrdquo proxy after themapping is updated Figure 5(b) shows that the num-ber of sessions that are still active as a function of timeEven if the DNS mapping is changed at the end of the5 minute period over 20 of the sessions will continueto send data to the previous proxy The previous proxymust continue to handle this ldquooldrdquo traffic and send it tothe same DC as before
We deal with this challenge by incorporating sessionlifetime and workload migration dynamics into our sys-tem model as described in the next section The readermay wonder why we simply do not kill the old connec-tions which would obviate the need for modeling tem-poral behavior But as shown above a large numberof ldquooldrdquo connections are active on each epoch bound-ary It is unacceptable to kill so many connections everyfive minutes We may alleviate the problem by updatingsystem configuration less frequently (eg an hour) Butwe need our system to be responsive and react quicklyto demand bursts (eg flash crowds) and faster updateslead to greater efficiency [18] We may also alleviate theproblem by updating the client code to gracefully handlechanges to proxy mappings But Footprint must accom-modate a large number of already-deployed applications
Implementing the computed configuration Thecomputed configuration is implemented by updatingDNS mappings proxy-to-DC mappings and weights onWAN paths One issue that we face here is that changingUG-to-proxy mappings (eg in response to WAN con-gestion) can force user traffic onto paths with unknowncapacities While we monitor UG-to-proxy path delayswe are not reliably aware of path capacities We thus pre-fer that UGs continue to use current paths to the extentpossible To ensure this Footprint uses load balancers atnetwork edge that can forward user requests to remoteproxies These load balancers allow us to decouple howusers reach our infrastructure and how their traffic flowsinternally We omit details due to lack of space
4 System ModelThe Footprint controller periodically decides how re-quests and responses from each UG are going to traversethe infrastructure For example in Figure 3 suppose itmakes a fraction of sessions from UG2 go through edgeproxy P2 and data center DC1 it also simultaneouslycomputes how to route request traffic in network fromP2 to DC1 and response traffic from DC1 to P2
The controller computes how to assign new sessionsfrom each UG to a collection of end-to-end paths (or e2e-paths) which includes two ldquoserversrdquomdashan edge proxy yand datacenter cmdashand two WAN pathsmdashrequest and re-sponse paths between y and c
Each network path is a pre-configured tunnel ie a se-ries of links from the source to destination switch thereare usually multiple tunnels between a source-destinationpair Once a session is assigned to an e2e-path it willstick to the assigned proxy and DC the WAN paths takenby the traffic may change
The assignments from sessions to e2e-path impactssystem efficiency as well as the latency experienced byusers The controller must enable the infrastructure to ac-commodate as much workload as possible while ensur-ing that the proxies DCs and network paths are not over-loaded and that traffic prefers low-latency paths The keyto meeting these goals is to model the load on resourceswith high fidelity which we do as described below
41 PreliminariesTable 1 shows key notations in our model including itsinputs and outputs The outputs contain routing decisionsfor two types of traffic The first type is unsettled edgetraffic due to new user sessions for services hosted on theedge proxies Here the routing decision wθ g denotes thefraction of new sessions from UG g assigned to e2e-pathθ The second type is settled traffic due to existing edgesessions that stick to their servers and all non-edge traf-fic carried by the WAN Here the routing decision ωpsddenotes the fraction of non-edge (ie non-service) traffic
4
Inputsg A user group (UG)a j
g Session arrival rate of g in jth epochq(t) CDF of session lifetimeθ An e2e-path
Θg E2e-paths that can selected by UG g
e A ldquoserverrdquo on an e2e pathie an edge proxy or a datacenter
p l p network path l a network linkbwl Bandwidth of link l
PsdAll network paths that starts from server sand ends with server d
ξ primesd Non-edge traffic demand from s to dhθ g Latency experienced by g when going through θ
αA resource (eg CPU memory etc)at an edge proxy or a datacenter
Mαe Capacity of resource α at (e)creq crsp Bandwidth consumption of a request response
T Length of an epochIntermediate variables
microαz(t) Resource αrsquos utilization on znθ g(t) Number of sessions on θ from gneg(t) Number of sessions on e from g sumforallθ eisinθ nθ g(t)aθ g(t) Session arrival rate on θ from gaeg(t) Session arrival rate on e from g sumforallθ eisinθ aθ g(t)ξsd(t) Traffic of settled sessions s to d
f (t) CCDF of session lifetimeOutputs
wθ g Weight of new sessions of UG g on θ
ωpsd Weight of traffic from s to d on network path p
Table 1 Key notations in Footprint model
from source s to destination d assigned to network pathp Note that s and d represent WAN endpoints connectedto datacenters edge proxies or neighboring ISPs For in-stance for non-edge traffic s and d may be a neighboringISP and a datacenter for service request traffic generatedfrom UGs s is the proxy while d is the datacenter
Constraints Because the sessions from g can only beassigned to a subset of e2e-paths Θg whose proxies areclose enough to g and similarly traffic from s to d canonly traverse a subset of network paths Psd that connects and d we have the following constraints on routing
forallg sumforallθ wθ g = 1 if θ isinΘg then wθ g = 0 (1)
forallsd sumforallp ωpsd = 1 if p isin Psd then ωpsd = 0 (2)
Before describing the system model based on whichwe compute these routing decisions we list the assump-tions made in our modeling
Assumptions We assume that a DC is involved inserving each user request This assumption does not im-ply that there is no caching or local logic at the proxyit just means that the request cannot be completely ful-filled by the proxy All our services require personalizedresponses based on state that is only maintained in DCsIt is straightforward to modify our model when used withservices where this behavior does not hold
We assume that the session arrival rate for a user groupg in j-th epoch a j
g is known and fixed In sect5 we describe
how arrival rate is estimated We have empirically veri-fied that the arrival rate is fixed during each epoch as theepoch length that we use (5 minutes) is short Our modelcan be extended to account for errors in the estimated ar-rival rate [22] Similarly we assume that the distributionof session lifetimes denoted by q(t) is known
We model proxies and datacenters as monolithic enti-ties ignoring their internal structure (and hence we referto them as ldquoserversrdquo) Without this simplifying assump-tion the model will become intractable as there will betoo many individual servers
For ease of exposition we assume that the infrastruc-ture supports only one type of service This servicegenerates request-response traffic and the average band-widths consumed by requests and responses is known(creq cresp) We define the capacity Mαe of resource α
(eg CPU memory) of server e in terms of number ofsessions That is we say that the CPU on a proxy canhandle a certain number of sessions We assume that thisnumber is known and fixed for a given α and a givene Since links can be viewed as a ldquoserverrdquo with a sin-gle resourcemdashbandwidthmdashwe will occasionally lever-age this view to simplify notation We can extend ourmodel to multiple services and a more detailed view ofresource and bandwidth consumption [22]
Finally we assume the systemrsquos objective is to findend-to-end paths that minimize user delays We do notconsider properties such as throughput or loss rate butwe model the impact of high utilized resources on delay
42 Temporal system dynamicsTo model resource utilization we first model the numberof active sessions consuming that resource Let z denoteany element of an end-to-end path - a ldquoserverrdquo or a linkThe number of active sessions on z is
nz(t) = sumforallg
sumforallθ eisinθ
nθ g(t) (3)
where nθ g(t) is the number of active sessions from UG gon e2e-path θ at time t and thus nz(t) is the total numberof active sessions on element z nθ g(t) evolves with timeas new sessions arrive and old ones depart
Consider epoch k which lasts from time t isin [kT(k+1)T ] where T is the epoch length At the beginning ofthe epoch (t = kT ) there are nold
θ g(kT) pre-existing ses-sions that will terminate per the pattern defined by thedistribution of session life time Simultaneously newsessions will continuously arrive some of which termi-nate inside the current epoch and others will last beyondthe epoch At any given time the total number of ses-sions in the epoch is
nθ g(t) = nnewθ g (t)+nold
θ g(t) (4)
We must faithfully model how nnewθ g (t) and nold
θ g(t) evolvewith time to provide high performance and efficiency
5
0 02 04 06 08
1
0 100 200 300
Pro
bab
ilit
y o
f S
essi
on A
liv
enes
s
Time (Second) (a)
0 10 20 30 40 50
0 100 200 300
F(t
)
Time (Second) (b)
OriAppxrsquo
0 10 20 30 40 50
0 100 200 300
G(t
- T
)
Time (Second) (c)
0 10 20 30 40 50
0 100 200 300
G(t
- 2
T)
Time (Second) (d)
Figure 6 The pattern functions derived from the session life time distribution of Bing in an epoch The time (x-axis)on each graph is relative to the start of the epoch
New sessions The new session arrival rate on θ fromUG g is
forallθ g aθ g = agtimeswθ g (5)
Recall that ag is the total arrival rate of sessions from UGg and we assume it to be fixed within an epoch
At any given time t within the epoch k nnewθ g (t) is the
sum of the number of sessions which arrived in interval[kT t] and are still alive at t From the session life timeCDF distribution q(t prime) we can easily derive f (t prime) = 1minusq(t prime) which is probability that a session is still alive afterduration t prime since it started Figures 5(a) and 6(a) showexamples of q(t prime) and f (t prime) respectively
Therefore at any given time τ isin [kT t] the numberof new sessions that arrived in the interval [τ τ +∆τ]is aθ gtimes∆τ Among these sessions there will be f (tminusτ)aθ gtimes∆τ sessions left at time t When ∆τ rarr 0
nnewθ g (t) =
int t
kTf (tminus τ)timesaθ gdτ = aθ gtimes
int tminuskT
0f (τ)dτ (6)
= aθ gtimesF(tminus kT )
where F(t) =int t
0 f (τ)dτ which represents the number ofsessions alive at t assuming unit arrival rate Figure 6(b)shows F(t) obtained from Figure 6(a)Pre-existing sessions At time t in epoch k the numberof pre-existing sessions that arrived in epoch j ( j lt k) is
nold jθ g (t) =
int ( j+1)T
jTf (tminus τ)timesa j
θ gdτ (7)
= a jθ gtimes
int tminus jT
tminus( j+1)Tf (τ)dτ = a j
θ gtimesG(tminus jT )
where a jθ g is the observed arrival rate in epoch j and
G(t) = F(t)minusF(tminusT ) Therefore the total number ofpre-existing sessions is
noldθ g(t) =
kminus1
sumj=0
a jθ gtimesG(tminus jT ) (8)
Figures 6(c) and (d) show examples of G(tminus jT ) in twoepochs prior to current one ie j = (kminus 1)T and j =(kminus2)T respectively when T = 300 seconds
Server utilization Given the number of active ses-sions the utilization of resource α on server e is
microαe(t) =ne(t)Mαe
(9)
Combining Eqns 3 4 6 8 and 9 the utilization of aresource α on server e is
0 05 07509 1 11
Utilization micro
020
50
100
200
Penalt
y P(micro)
(ms)
p=80microminus40
p=200microminus130
p=500microminus400
p=1000microminus900
Figure 7 Penalty function
microαe(t) =F(tminus kT )timesaeg +sum
kminus1j=0 G(tminus jT )timesa j
eg
Mαe(10)
Link utilization To model link utilization we accountfor non-edge traffic and the fact that requests and re-sponses consume different amounts of bandwidth creqand crsp respectively
An e2e-path θ contains a request path θreq from UGto DC and a response path θrsp from DC to UG Thusthe total edge traffic load generated by new sessions on anetwork link l is
microprimebwl(t) =
sumforallθ lisinθreq nnewθ
(t)creq +sumforallθ lisinθrsp nnewθ
(t)crsp
bwl(11)
Pre-existing sessions stick to their originally assignedservers but the WAN paths they use can be adjusted Allsuch sessions from site s to site d generates traffic de-mand ξsd
ξsd(t) = sumforallg[ sumforallθ sdisinθreq
noldθ g(t)creq + sum
forallθ sdisinθrsp
noldθ g(t)crsp] (12)
Links are shared by edge and non-edge traffic Let ξ primesdbe the traffic demand from source router s to destinationrouter d the link load by non-edge traffic on link l is
microprimeprimebwl(t) =
sumforallsd sumforallplisinp[ξsd(t)+ξ primesd ]timesωpsd
bwl(13)
Thus the total utilization of network link l should bemicrobwl(t) = micro
primebwl(t)+micro
primeprimebwl(t) (14)
43 Optimization objectiveEquations 10 and 14 model the impact of routing deci-sions on resource utilization For computing the finaldecisions resource utilization is only half of the storyOur goal is not to exclusively minimize utilization asthat can come at the cost of poor performance if user ses-sions start traversing long paths Similarly the goal is
6
not to exclusively select shortest paths as that may causeoverly high utilization that induces delays for users
To balance the two concerns as is common in TEsystems we penalize high utilization in proportion toexpected delay it imposes [1] Figure 7 shows thepiece-wise linear approximation of the penalty functionP(microαe) we use The results are not sensitive to the exactshapemdashwhich can differ across resource typesmdashas longas the function has monotonically non-decreasing slope
Thus our objective function is
min sumforallαe
int T
0P(microαe(t))dt + sum
forallgθ
int T
0hgθ ngθ (t)dt (15)
The first term integrates utilization penalty over theepoch and the second term captures path delay Thevariable hgθ represents the total latency when sessionsof UG g traverse e2e-path θ It is the sum of UG-to-proxy and WAN path delays
44 Solving the modelMinimizing the objective under the constraints abovewill assign values to our output variables However ourmodel uses continuous time and we must ensure that theobjective is limited at all possible times To tractablyguarantee that we make two observations First nnew
θ g (t)monotonically increases with time and is also concaveThe concavity is valid if only dF(t)
dt = f (t) is monotoni-cally non-increasing with t which is always true becausef (t) is a CCDF (complementary cumulative distributionfunction) Hence we can use a piecewise linear con-cave function F prime(t) that closely upper-bounds F(t) Forinstance the red dashed line in Figure 6b shows a two-segment F prime(t) we use for Bing
The second observation is that noldθ g(t) is monotoni-
cally decreasing and convex eg Figure 5(b) The con-vexity depends on both the shape of f (t) and the lengthof epoch T we choose We found the convexity of nold
θ g(t)is valid for all the services in our infrastructure This inthis paper we assume for simplicity that nold
θ g(t) is alwaysconvex Otherwise one can may use a piecewise linearfunction to upper-bound nold
θ g(t)Therefore when we use F prime(t) instead of F(t) from
Eqn 10 we derive
microαe(t)le microαe(t) =F prime(tminus kT )aeg +sum
kminus1j=0 G(tminus jT )a j
eg
Mαe(16)
where microαe(t) is upper-bounding microαe(t) all the time sothat we can limit microαe(t) by limiting microαe(t)
Since sumkminus1j=0 G(tminus jT ) is also convex with time t and
let τ1 τm where τ1 = 0τm = T be the conjunc-tion points of linear segments in F prime(t) microαe(t) becomesa piecewise convex function and each convex piece i(1 le i le mminus 1) has boundary τi and τi+1 Becausethe maximum value of a convex function must be on
the boundary the maximum value of convex piece i inmicroαe(t) happens on either t = τi or t = τi+1 Hence over-all the maximum value of microαe(t) always happens at acollection of particular moments which are τ1 τmFormally we have
micromaxαe = maxmicroαe(τi)|i = 1 m (17)
Similarly for link utilizations and number of sessionswe also have
micromaxbwl = maxmicrobwl(τi)|i = 1 m (18)
nmaxθ g = maxnθ g(τi)|i = 1 m (19)
where microbwl(t) and nθ g(t) similar to microαe(t) is also de-rived from replacing F(t) with F prime(t) in Eqns 14 and 3
Therefore we can transfer our original objective func-tion Eqn 15 into following formulation
min sumforallαe
P(micromaxαe )timesT + sum
forallgθhgθ nmax
gθ timesT (20)
We can now obtain an efficiently-solvable LP com-bining the new objective in Eqn 20 with constraints inEqns 1ndash5 and 16ndash19 The penalty function P(micro) canalso be encoded using linear constraints [15]
5 Footprint DesignWe now describe the design of Footprint in more detail
Defining UGs We start with each 24 IP address prefixas a UG because we find experimentally that such usershave similar performance In the presence of eDNSwhere LDNS resolvers report usersrsquo IP addresses whenquerying our (authoritative) DNS servers this defini-tion of UGs suffices However eDNS is not widely de-ployed and our DNS servers tend to see only resolversrsquo(not usersrsquo) addresses This lack of visibility meansthat we cannot map 24 prefixes that share LDNS re-solvers to entry point(s) independently Thus we mergenon-eDNS UGs that share LDNS resolvers using IP-to-LDNS mapping from our entry point performance mon-itoring method (described below) We find that suchmergers hurt a small minority of users 90 of the timewhen two 24 prefixes have the same LDNS their rela-tive performance to top-3 entry points is similar
Entry point performance monitoring We leverageclient-side application code to monitor performance ofUGs to different entry points Our measurement methodborrows ideas from prior work [24 5] After a queryfinishes the user requests a URL from current and alter-native entry points It then reports all response times toa measurement server which allows us to compare entrypoints head-to-head without worrying about differencesacross users (eg home network performance)
However because there can be O(100) entry pointsrequesting that many URLs will take a long time and
7
place undue burden on users We thus perform measure-ments with a small probability and limit each to three re-quests Each URL has the form httpltguidgttryltkgt
servicefootprintcommonitor where guid is aglobally unique identifier and k isin (13)
What sits behind monitor is a service-specific transac-tion For a browsing-type service (eg search or socialnetworking) it may correspond to downloading its typi-cal Web page for a video streaming service large objectsmay be downloaded This way the response time reflectswhat users of the service experience
The measurement mechanics are as follows Becauseof the GUID the URL hostname does not exist in DNScaches and each request triggers a lookup at our DNSserver We resolve the name based on the userrsquos UG andk For k=1 we resolve to the current-best entry pointfor k=2 to a randomly selected entry point from the tennext best and for k=3 to a random selection from theremaining entry points Each response-time triplet yieldsthe relative performance of the best and two other entrypoints Aggregating across triplets and users provides aview of each entry pointrsquos performance for each UG
This view is more up-to-date for better entry pointsfor a UG as they are sampled from a smaller set (of 10)When a UGrsquos entry point is changed it is likely mappedto another nearby entry point up-to-date view of suchentry points is important which would be hard to obtainwith unbiased sampling of all entry points
Finally we learn the mapping from usersrsquo IP addressesto LDNS resolvers by using GUIDs to join the logs atHTTP transaction servers (which see usersrsquo addresses)and DNS servers (which see resolver addresses)
Clustering UGs After LDNS-based grouping we getO(100K) UGs which poses a scaling problem for our LPsolver To reduce the number of UGs we aggregate UGsat the start of each epoch For each UG we rank all entrypoints in decreasing order of performance and then com-bine into virtual UGs (VUG) all UGs that have the sameentry points in the top-three positions in the same orderWe formulate the model in terms of VUGs The perfor-mance of a VUG to an entry point is the average of theaggregate weighted by UGsrsquo number of sessions Forour infrastructure this clustering creates O(1K) VUGsand we observe only a marginal decline in efficiency(asymp3) due to our inability to map individual UGs
System workload The controller estimates the work-load for the next epoch using workload information fromprevious epochs DNS servers report the arrival rates ofnew sessions for each UG and each service proxies re-port on resource usage and departure rate of sessions andnetwork switches that face the external world report onnon-edge traffic matrix (in bytessecond) Edge work-load is captured in terms of all resource(s) that are rel-
evant for allocation (eg memory CPU traffic) Weuse exponentially weighted moving average (EWMA)to estimate workload for the next epoch We also uselinear regression to infer per-session resource consump-tion (eg CPU cycles) for each service using overall re-source usage and number of active sessions per service
System health When failures occur health monitor-ing services at proxy sites and DCs inform the controllerhow much total site capacity is lost (not which servers)This information granularity suffices because the con-troller does not allocate sessions to individual servers ata site and relies on local load balancers for that In con-trast network failures are exposed at link-level so thatthe controller can determine network paths
Because it may take a few seconds for the controller toreact to server or link failures (sect74) instead of waitingfor the controller to update the configuration load bal-ancers and routers react to failures immediately by mov-ing traffic away from failed components Such move-ments can cause transient congestion in our current de-sign which we plan to address in the future using for-ward fault correction (FFC) [23]
Robustness to controller failures To make the sys-tem robust to controller or hosting-DC failures we runmultiple controllers in three different DCs in different ge-ographic regions All dynamic information required forthe optimization (eg system workload) is reported toall controllers in parallel The controllers elect a uniqueleader using ZooKeeper [33] Only the leader computesthe new system configuration and updates the infrastruc-ture which ensures that updated system state is not in-consistent even if different controllers happen to havedifferent views of the current workload (eg due to de-lays in updating information at a given controller) Whenthe leader fails a new leader is elected The new leadercan immediately start computing new system configura-tions as it already has all the requisite inputs
6 Footprint PrototypeWe have implemented the Footprint design outlinedabove The client-side functionality for entry point per-formance monitoring is a JavaScript library that can beused with any Web service This library is invoked af-ter page load completes so that it does not interfere withuser experience When fetching a URL in JavaScriptwe cannot separate DNS lookup and object downloadtimes To circumvent this limitation before fetching theURL we fetch a small object from the same hostnameThen because of DNS caching the response time of theURL does not include DNS lookup time In cases wherethe browser supports the W3C Resource Timing API weuse the precise object fetch time We implemented theDNS server-side functionality by modifying BIND [3]
8
and proxy functionality using Application Request Rout-ing [2] which works with unmodified Web servers Weuse Mosek [26] to solve the LP
Timely processing of monitoring data is critical Aparticularly onerous task is the real-time join betweenHTTP and DNS data to know which endpoints ourJavaScript has measured and to attach detailed networkand geographic information to each measurement Tohelp scale we build our processing pipeline on top ofMicrosoft Azure Event Hub and Stream Analytics
To scale the computation of new configurations welimit the number of e2e-paths that a VUG can useSpecifically we limit each VUG to its best three en-try pointsmdashthe ones on which VUG was clusteredmdasheach load balancer to three proxies and each source-destination switch pair to six paths (tunnels) in the WANIn our benchmarks these limits speed computation bymultiple orders of magnitude without noticeably impact-ing system efficiency or performance
We deployed a prototype of Footprint in a modest-sized testbed This environment emulates a WAN witheight switches and 14 links three proxy sites and twoDCs Proxy sites and DCs have one server each Wehave 32 PCs that act as UGs and repeatedly query a ser-vice hosted in the DC UG to entry point delays are con-trolled using a network emulator
The monitoring aspects of Footprint but not the con-trol functionality are also deployed in Microsoftrsquos ser-vice delivery infrastructure This allow us to collect datafrom O(100) routers O(50) edge sites and O(10) DCsworldwide The JavaScript library is randomly includedin 20 of Bing user requests We use the data from thisdeployment to drive simulations to evaluate Footprint
7 Experimental EvaluationWe evaluate Footprint along several dimensions of in-terest First we use the testbed to show the viabilityand value of jointly controlling all types of infrastructurecomponents It is not intended to shed light on efficiencyand performance of Footprint in a real deployment Toassess those aspects we conduct large-scale simulationsbased on data gathered using the monitoring deploymentof Footprint in our production environment
71 Testbed resultsWe use a simple experiment on our testbed to demon-strate the value of spatial traffic modulation In this ex-periment we recreate the example in Figure 2 Recallthat in this example the WAN gets congested such that nopath between the entry point P2 and DC2 is congestion-free We create such congestion by injecting non-edgetraffic that uses those paths
Figure 8 shows the results It plots the response timefor UGs that are originally mapped to P2 and DC2
Figure 8 Testbed experiment WAN congestion
with Footprint and with WAN TE alone WAN TE es-timates the WAN traffic matrix based on recent historyand routes traffic to minimize link utilization while us-ing short paths [18] We see that soon after congestionoccurs Footprint spatially modulates the traffic such thatUGsrsquo performance is restored But WAN TE is unable toresolve congestion and performance issues as it cannotchange UGsrsquo proxy and DC selections
72 Efficiency and performanceTo understand the efficiency and performance of Foot-print at scale we conduct detailed simulations using datafrom Microsoftrsquos service delivery infrastructure Oursimulations use a custom fluid-level simulator
721 Methodology and data
To understand the benefit of Footprintrsquos joint optimiza-tion we compare it to a system similar to Microsoftrsquoscurrent approach where i) anycast routing is used to mapUGs to their best proxy ii) each edge proxy indepen-dently chooses the closest DC for its user sessions basedon up-to-date delay measurements and iii) WAN TE pe-riodically configures network paths based on observedtraffic to minimize maximum link utilization [18] Inour simulations the control loops for DC selection ateach proxy and for WAN TE run independently every5 minutes To mimic anycast routing we use our moni-toring data to map UGs to the best proxy which enablesa fair comparison by factoring out any anycast subop-timality [5] We also assume that proxies are not thebottleneck to remove the impact of anycast routingrsquos in-ability to evenly balance load across proxies which adifferent user-to-proxy mapping system may be able toachieve Abusing terminology we call this system Fas-tRoute even though the FastRoute paper [14] discussesonly user-to-proxy mapping and not WAN TE
We drive simulations using the following data i)timestamps of new sessions obtained from system logsii) distribution of session lifetimes iii) UG to entry pointperformance data from our monitoring deployment iv)propagation latencies and capacities of all links in theWAN v) server capacities at the edge proxies and datacenters vi) non-edge traffic carried by the WAN and vii)
9
Aggregate Sessions Outgoing Bandwidth
002040608
1
Proxy
CD
F
002040608
1
Proxy
CD
F
(a) NA (b) EU
Figure 9 Distribution of bandwidth and sessions acrossproxies User sessions are mapped to the closest proxyBandwidth per proxy is measured as aggregate band-width of all directly attached links
1 50
1
2
3
4
1156
194232
Nor
mal
ized
Traf
ficSc
ale FastRoute
Footprint
1 50
1
2
3
4
115
218255
Nor
mal
ized
Traf
ficSc
ale FastRoute
Footprint
(a) NA (b) EU
Figure 10 Efficiency of FastRoute and Footprint forSLO1 (excess traffic on overloaded components)
per-session resource consumption (eg CPU) estimatedusing linear regression over the number active sessions
We show results for North America (NA) and Europe(EU) separately The infrastructure in the two continentsdiffers in the numbers of proxies DCs and the richnessof network connectivity The NA infrastructure is biggerby about a factor of two The results below are basedon one weekrsquos worth of data from August 2015 Resultsfrom other weeks are qualitatively similar
To provide a sense of system workload Figure 9shows the distribution of closest user sessions and net-work bandwidth across proxies Since proxies are notbottlenecks in our experiments network congestion is akey determiner of performance While it can occur inthe middle of the network as well congestion occursmore often on links close to the proxies because fewerrouting alternatives are available in those cases We seethat in aggregate network bandwidth and user sessionsof proxies are balanced more bandwidth is available be-hind proxies that receive more sessions
722 Efficiency
We quantify efficiency of a service-delivery system us-ing congestion-free scalemdashmaximum demand that it cancarry without causing unacceptable congestion that vio-lates service-level objectives (SLOs) We consider twodefinitions of unacceptable congestion i) SLO1 acrossall epochs the amount of traffic in excess of compo-
1 50
1
2
3
4
0661
178 199
Nor
mal
ized
Traf
ficSc
ale
FastRouteFootprint
1 50
1
2
3
4
082 091
199 211
Nor
mal
ized
Traf
ficSc
ale
FastRouteFootprint
(a) NA (b) EU
Figure 11 Efficiency of FastRoute and Footprint forSLO2 (total traffic on overloaded components)
nent capacities should be less than a threshold ii) SLO2across all epochs the total traffic traversing overloaded(ie load greater than capacity) components should beless than a threshold The difference in the two SLOsis that when traffic traverses an overloaded componentSLO1 considers only the fraction in excess of the ca-pacity but SLO2 considers all traffic passing throughit We study multiple congestion thresholds and computecongestion-free scale by iterating over demands that areproportionally scaled versions of the original demand
Figure 10 shows the congestion-free scale for Fas-tRoute and Footprint with SLO1 for two different conges-tion thresholds For confidentiality we report all trafficscales relative to the congestion-free scale of FastRoutewith SLO1 at 1 threshold We see that Footprint carriesat least 93 more traffic when the congestion thresholdis 1 and 50 more traffic when the threshold is 5
These efficiency gains can be understood with respectto the spatial modulation enabled by joint coordinationin Footprint While on average the load on the proxy isproportional to its network bandwidth (Figure 9) at dif-ferent times of the day different regions are active andget congested By making joint decisions Footprint canmore easily divert traffic from currently active proxies tothose in other regions
Figure 11 shows that Footprintrsquos efficiency gains holdfor SLO2 as well which considers total traffic travers-ing overloaded components For 1 and 5 congestionthresholds Footprint can carry respectively 170 and99 more traffic than FastRoute
723 Performance
We quantify performance of user sessions using end-to-end path delays We study its contributing factors ex-ternal (UG-to-proxy) delay propagation delay inside theWAN and queuing-induced delays Queuing delay isquantified using utilization per the curve in Figure 7Figure 12 shows the performance of the two system fortraffic scales that correspond to 35 and 70 of thecongestion-free scale of FastRoute for SLO1 Each barstacks from bottom three factors in the order listed above
We see that even when the traffic demand is low(35) Footprint has 46 (for NA) lower delay At this
10
Queuing WAN External
FastRoute Footprint0
20
40
60
80
Del
ay[m
s]
FastRoute Footprint0
20
40
60
80
Del
ay[m
s]
(a) NA (035times) (b) NA (07times)
FastRoute Footprint0
10
20
30
Del
ay[m
s]
FastRoute Footprint0
10
20
30D
elay
[ms]
(c) EU (035times) (d) EU (07times)
Figure 12 Delays in the two systems
scale the infrastructure is largely under-utilized The de-lay reduction of Footprint stems from its end-to-end per-spective In contrast FastRoute picks the best proxy fora UG and the best DC for the proxy The combinationof the two might not represent the best e2e path Sucha path may be composed of a suboptimal UG-to-proxypath but a much shorter WAN path This effect can beseen in the graph where the external delays are slightlyhigher but the sum of external and WAN delay is lower
When the traffic demand is high (70) both systemshave higher delay For FastRoute most of the additionaldelay stems from queuing as traffic experiences highlyutilized resources Footprint is able to reduce queuingdelay by being better able to find uncongested (albeitlonger) paths Overall the end-to-end delay of Footprintis at least 30 lower than FastRoute
73 Impact of system modelTo isolate the impact of the system model of Footprintwe compare it to two alternatives that also do jointoptimization but without the detailed temporal model-ing of workload The efficiency of these alternativesalso represents a bound on what existing coordinationschemes [16 20 28 12] can achieve when extended toour setting of jointly determining the proxy WAN pathand DC mappings for user sessionsbull JointAverage Instead of modeling temporal dynam-
ics based on session lifetimes JointAverage uses Littlersquoslaw [21] to estimate the number of active sessions as afunction of session arrival rate If the session arrival rateat a proxy is A per second and the average session life-time is 10 seconds on average the proxy will have 10timesAactive sessions These estimates are plugged into an LPthat determines how new sessions are mapped to proxiesand DCs and how traffic is forwarded in the WANbull JointWorst To account for session dynamics Joint-
Worst makes a conservative worst-case assumption
JointAverageJointWorst
Footprint0
1
2
3
148118
23
Nor
mal
ized
Traf
ficSc
ale
JointAverageJointWorst
Footprint0
02040608
1
016035 037
Nor
mal
ized
Traf
ficSc
ale
(a) Unscaled (b) 10times scaled
Figure 13 Efficiency of different system models for dif-ferent average session lifetimes on NA infrastructure
minus200 minus100 0 100 2000
02
0406
081
Estimated - Actual Link Utilization []
Frac
tion
oflin
ks JointAverageJointWorstFootprint
Figure 14 Fidelity of modeling CDF of modeled andobserved link utilization
about load on infrastructure components Specificallyit assumes that new sessions arrive before any old ses-sions depart in an epoch Since we do not do admissioncontrol it is not the case that traffic that is estimatedper this model to overload the infrastructure is rejectedInstead the optimization spreads traffic to minimize uti-lization that is predicted by this model This model willdo well if it overestimates the traffic on each componentby a similar amount
For NA infrastructure figure 13(a) compares thesetwo models with Footprint using SLO1 at 5 conges-tion thresholdmdashthe configuration for which Footprint hadleast gain over FastRoute We see that Footprint is sub-stantially more efficient It carries 56 and 96 moretraffic than JointAverage and JointWorst
We find that the gains of Footprint actually stem fromits ability to better model load that will be placed on dif-ferent infrastructure components To demonstrate it Fig-ure 14 plots the distribution of estimated minus actualutilization for WAN links for each model We see thatJointAverage tends to underestimate utilization and Joint-Worst tends to overestimate it With respect to appropri-ately spreading load through the infrastructure neitherover- nor under-estimation is helpful
We also find that if sessions were much longer Joint-Worst performs better because its conservative assump-tion about existing sessions continuing to load the infras-tructure becomes truer On the other hand JointAver-age gets worse because it ignores the impact of existingsessions altogether which hurts more when sessions arelonger This is illustrated in Figure 13(b) which shows
11
0 2 4 6 8 100
20406080
100
Churn []
CD
Fov
erep
ochs
Figure 15 Churn in UG to proxy performance
the impact on efficiency with average session lifetimemultiplied by 10 Because of its modeling fidelity thebenefit of Footprint is not dependent on session lifetimehowever and it is able to provide gains even for theseabnormally long sessions
74 Computation timeWe measured the time Footprint controller takes to com-pute system configurations which includes convertinginputs to an LP solving it and converting the outputto system variables On an Intel Xeon CPU (E5-1620370GHz) with 16 GB RAM and using Mosek v7 thistime for NA and EU infrastructure is 5 and 06 secondsrespectively This level of performance is acceptablegiven that epochs are much longer (5 minutes) With-out clustering of UGs the running time was greater than20 minutes for both NA and EU
75 Preliminary experienceWe make two observations based on the deployment ofFootprintrsquos monitoring components in Microsoftrsquos infras-tructure First we quantify the fraction of UGs for whichthe best proxy changes across epochs If this fraction issubstantial optimal user-to-proxy mapping would movelarge amounts of WAN traffic which is better done incoordination with WAN-TE rather than independently
Figure 15 shows the fraction of UGs weighed by theirdemand for which the best proxy changes across epochsOn average this fraction is 5 It means that a user-to-proxy mapping control loop operating independentlycould move this high a fraction of traffic on the WANJoint coordination helps make such movements safely(In Footprint since we consider WAN-internal capacityand performance as well the traffic moved is lower un-der 1 in our simulations)
Second an unexpected advantage of Footprintrsquos con-tinuous monitoring is that we can discover and circum-vent issues in Internet routing that hurt user performanceWe have found several such events In one case users inthe middle of the NA started experiencing over 130 msround trip delay to a proxy on the west coast whilethe historical delay was under 50 ms In another casethe difference in the delay to reach two nearby prox-ies in Australia was over 80 ms Debugging and fixingsuch issues requires manual effort but Footprint can au-tomatically restore user performance in the meanwhile
Anycast-based systems such as FastRoute cannot do that
8 Related WorkOur work builds on two themes of prior work
Content distribution systems Content and servicedelivery has been an important problem in the Internetfor almost two decades Akamai [25] developed the firstlarge-scale solution and we borrow several of its con-cepts such as using edge proxies to accelerate perfor-mance and mapping users to proxies based on path per-formance and proxy load Since then researchers havedeveloped sophisticated techniques to tackle this generalproblem known as replica selection [13 4 11 29] So-lutions tailored to specific workloads (eg video) havealso been developed [27 17]
Most of these works target the traditional context inwhich the WAN is operated separately from the proxyinfrastructure We target the increasingly common inte-grated infrastructure context which provides a new op-portunity to jointly coordinate routing and resource allo-cation decisions
Coordinating decisions Other researchers have notedthe downside of independent decisions for network rout-ing and content distribution Several works [16 20 2812] consider coordinating ISP routing and DC selectionthrough limited information sharing PECAN developstechniques to coordinate proxy selection and external(not WAN) paths between users and proxies [31] EN-TACT balances performance and the cost of transit trafficfor an online service provide [32]
Our work differs from these efforts in two ways Firstit includes the full complement of jointly selecting prox-ies DCs and network paths But more importantly priorworks ignore workload dynamics that arise from ses-sion stickiness Consequently the best case result of ap-plying their techniques to our setting will approach theJointWorst or JointAverage scheme (sect73) because mod-ulo session stickiness these two schemes optimally mapworkload to infrastructure elements We showed that be-cause it accounts for workload dynamics Footprint out-performs these schemes Extending information-sharingtechniques to account for such workload dynamics is aninteresting avenue for future work
9 ConclusionsOur work pushes SDN-style centralized control to in-frastructure elements beyond networking devices In do-ing so we found that to maximize efficiency and per-formance we must handle complex workload dynamicsthat stem from application behaviors This challenge willlikely emerge in other systems that similarly push thelimits of SDN and the approach we take in Footprint mayinform the design of those systems as well
12
Acknowledgments We thank the Microsoft engineerswho helped with data acquisition and prototype deploy-ment including Sreenivas Addagatla Sorabh GandhiDaniel Gicklhorn Nick Holt Jon Mitchell DavidSchmidt Prasad Tammana and Ed Thayer We alsothank the NSDI reviewers and our shepherd LaurentVanbever for feedback that helped improve the pa-per Raajay and Aditya were supported in part by Na-tional Science Foundation (grants CNS-1302041 CNS-1330308 and CNS-1345249) and the Wisconsin Institueof Software-Defined Datacenters of Madison
References[1] G Appenzeller I Keslassy and N McKeown Siz-
ing router buffers In SIGCOMM 2004
[2] Application request routing httpenwikipediaorgwikiApplication_Request_Routing
[3] BIND httpswwwiscorgdownloadsbind
[4] S Buchholz and T Buchholz Replica placementin adaptive content distribution networks In ACMsymposium on Applied computing 2004
[5] M Calder E Katz-Bassett R Mahajan and J Pad-hye Analyzing the Performance of an AnycastCDN In IMC 2015
[6] Amazon CloudFront httpawsamazoncomcloudfront
[7] Windows Azure CDN httpazuremicrosoftcomen-usservicescdn
[8] Facebook CDN httpsgigaomcom20120621like-netflix-facebook-is-planning-its-own-cdn
[9] Google CDN httpscloudgooglecomstorage
[10] Level3 CDN httpwwwlevel3comenproductscontent-delivery-network
[11] Y Chen R H Katz and J D Kubiatowicz Dy-namic replica placement for scalable content deliv-ery In Peer-to-peer systems 2002
[12] D DiPalantino and R Johari Traffic engineeringvs content distribution A game theoretic perspec-tive In INFOCOM 2009
[13] J Elzinga and D W Hearn Geometrical solutionsfor some minimax location problems Transporta-tion Science 6(4)379ndash394 1972
[14] A Flavel P Mani D Maltz N Holt J LiuY Chen and O Surmachev Fastroute A scalableload-aware anycast routing architecture for moderncdns In NSDI 2015
[15] B Fortz J Rexford and M Thorup Trafficengineering with traditional IP routing protocolsComm Mag 40(10) 2002
[16] B Frank I Poese Y Lin G Smaragdakis A Feld-mann B Maggs J Rake S Uhlig and R WeberPushing CDN-ISP collaboration to the limit SIG-COMM CCR 43(3) 2013
[17] A Ganjam F Siddiqui J Zhan X Liu I StoicaJ Jiang V Sekar and H Zhang C3 Internet-scale control plane for video quality optimizationIn NSDI 2015
[18] C-Y Hong S Kandula R Mahajan M ZhangV Gill M Nanduri and R Wattenhofer Achiev-ing high utilization with software-driven WAN InSIGCOMM 2013
[19] S Jain A Kumar S Mandal J Ong L PoutievskiA Singh S Venkata J Wanderer J Zhou M ZhuJ Zolla U Holzle S Stuart and A Vahdat B4Experience with a globally-deployed software de-fined wan In SIGCOMM 2013
[20] W Jiang R Zhang-Shen J Rexford and M Chi-ang Cooperative content distribution and trafficengineering in an ISP network In SIGMETRICS2009
[21] Littlersquos law httpsenwikipediaorgwikiLittlersquos_law
[22] H Liu R Viswanathan M Calder A AkellaR Mahajan J Padhye and M Zhang Effi-ciently delivering online services over integratedinfrastructure Technical Report MSR-TR-2015-73 2015
[23] H H Liu S Kandula R Mahajan M Zhangand D Gelernter Traffic engineering with forwardfault correction In Proceedings of the 2014 ACMConference on SIGCOMM SIGCOMM rsquo14 pages527ndash538 New York NY USA 2014 ACM
[24] R Maheshwari How LinkedIn used PoPs andRUM to make dynamic content download 25faster httpsengineeringlinkedincomperformancehow-linkedin-used-pops-and-rum-make-dynamic-content-download-25-faster June2014
13
[25] Cloud computing services and content distributionnetwork (CDN) provider mdash akamai httpswwwakamaicom
[26] Mosek ApS httpsmosekcom
[27] M K Mukerjee D Naylor J Jiang D Han S Se-shan and H Zhang Practical real-time centralizedcontrol for cdn-based live video delivery In SIG-COMM 2015
[28] S Narayana J W Jiang J Rexford and M Chi-ang To coordinate or not to coordinate wide-areatraffic management for data centers In CoNEXT2012
[29] L Qiu V N Padmanabhan and G M VoelkerOn the placement of web server replicas In IN-FOCOM 2001
[30] P Sun R Mahajan J Rexford L Yuan M Zhangand A Arefin A network-state management ser-vice In SIGCOMM 2014
[31] V Valancius B Ravi N Feamster and A C Sno-eren Quantifying the benefits of joint content andnetwork routing In SIGMETRICS 2013
[32] Z Zhang M Zhang A Greenberg Y C HuR Mahajan and B Christian Optimizing cost andperformance in online service provider networksIn NSDI 2010
[33] Apache zookeeper httpszookeeperapacheorg
14
- Introduction
- Background and Motivation
- Overview of Design and Challenges
- System Model
-
- Preliminaries
- Temporal system dynamics
- Optimization objective
- Solving the model
-
- Footprint Design
- Footprint Prototype
- Experimental Evaluation
-
- Testbed results
- Efficiency and performance
-
- Methodology and data
- Efficiency
- Performance
-
- Impact of system model
- Computation time
- Preliminary experience
-
- Related Work
- Conclusions
-
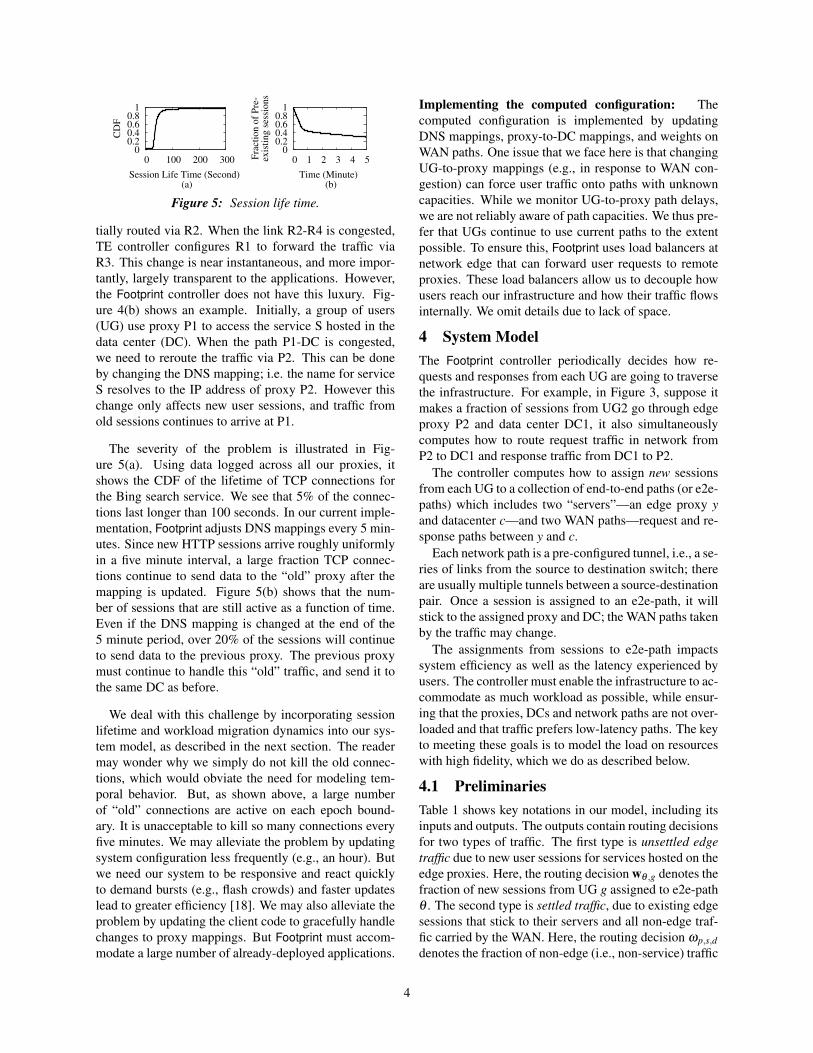
0 02 04 06 08
1
0 100 200 300
CD
F
Session Life Time (Second) (a)
0 02 04 06 08
1
0 1 2 3 4 5Fra
ctio
n o
f P
re-
exis
tin
g s
essi
on
s
Time (Minute) (b)
Figure 5 Session life time
tially routed via R2 When the link R2-R4 is congestedTE controller configures R1 to forward the traffic viaR3 This change is near instantaneous and more impor-tantly largely transparent to the applications Howeverthe Footprint controller does not have this luxury Fig-ure 4(b) shows an example Initially a group of users(UG) use proxy P1 to access the service S hosted in thedata center (DC) When the path P1-DC is congestedwe need to reroute the traffic via P2 This can be doneby changing the DNS mapping ie the name for serviceS resolves to the IP address of proxy P2 However thischange only affects new user sessions and traffic fromold sessions continues to arrive at P1
The severity of the problem is illustrated in Fig-ure 5(a) Using data logged across all our proxies itshows the CDF of the lifetime of TCP connections forthe Bing search service We see that 5 of the connec-tions last longer than 100 seconds In our current imple-mentation Footprint adjusts DNS mappings every 5 min-utes Since new HTTP sessions arrive roughly uniformlyin a five minute interval a large fraction TCP connec-tions continue to send data to the ldquooldrdquo proxy after themapping is updated Figure 5(b) shows that the num-ber of sessions that are still active as a function of timeEven if the DNS mapping is changed at the end of the5 minute period over 20 of the sessions will continueto send data to the previous proxy The previous proxymust continue to handle this ldquooldrdquo traffic and send it tothe same DC as before
We deal with this challenge by incorporating sessionlifetime and workload migration dynamics into our sys-tem model as described in the next section The readermay wonder why we simply do not kill the old connec-tions which would obviate the need for modeling tem-poral behavior But as shown above a large numberof ldquooldrdquo connections are active on each epoch bound-ary It is unacceptable to kill so many connections everyfive minutes We may alleviate the problem by updatingsystem configuration less frequently (eg an hour) Butwe need our system to be responsive and react quicklyto demand bursts (eg flash crowds) and faster updateslead to greater efficiency [18] We may also alleviate theproblem by updating the client code to gracefully handlechanges to proxy mappings But Footprint must accom-modate a large number of already-deployed applications
Implementing the computed configuration Thecomputed configuration is implemented by updatingDNS mappings proxy-to-DC mappings and weights onWAN paths One issue that we face here is that changingUG-to-proxy mappings (eg in response to WAN con-gestion) can force user traffic onto paths with unknowncapacities While we monitor UG-to-proxy path delayswe are not reliably aware of path capacities We thus pre-fer that UGs continue to use current paths to the extentpossible To ensure this Footprint uses load balancers atnetwork edge that can forward user requests to remoteproxies These load balancers allow us to decouple howusers reach our infrastructure and how their traffic flowsinternally We omit details due to lack of space
4 System ModelThe Footprint controller periodically decides how re-quests and responses from each UG are going to traversethe infrastructure For example in Figure 3 suppose itmakes a fraction of sessions from UG2 go through edgeproxy P2 and data center DC1 it also simultaneouslycomputes how to route request traffic in network fromP2 to DC1 and response traffic from DC1 to P2
The controller computes how to assign new sessionsfrom each UG to a collection of end-to-end paths (or e2e-paths) which includes two ldquoserversrdquomdashan edge proxy yand datacenter cmdashand two WAN pathsmdashrequest and re-sponse paths between y and c
Each network path is a pre-configured tunnel ie a se-ries of links from the source to destination switch thereare usually multiple tunnels between a source-destinationpair Once a session is assigned to an e2e-path it willstick to the assigned proxy and DC the WAN paths takenby the traffic may change
The assignments from sessions to e2e-path impactssystem efficiency as well as the latency experienced byusers The controller must enable the infrastructure to ac-commodate as much workload as possible while ensur-ing that the proxies DCs and network paths are not over-loaded and that traffic prefers low-latency paths The keyto meeting these goals is to model the load on resourceswith high fidelity which we do as described below
41 PreliminariesTable 1 shows key notations in our model including itsinputs and outputs The outputs contain routing decisionsfor two types of traffic The first type is unsettled edgetraffic due to new user sessions for services hosted on theedge proxies Here the routing decision wθ g denotes thefraction of new sessions from UG g assigned to e2e-pathθ The second type is settled traffic due to existing edgesessions that stick to their servers and all non-edge traf-fic carried by the WAN Here the routing decision ωpsddenotes the fraction of non-edge (ie non-service) traffic
4
Inputsg A user group (UG)a j
g Session arrival rate of g in jth epochq(t) CDF of session lifetimeθ An e2e-path
Θg E2e-paths that can selected by UG g
e A ldquoserverrdquo on an e2e pathie an edge proxy or a datacenter
p l p network path l a network linkbwl Bandwidth of link l
PsdAll network paths that starts from server sand ends with server d
ξ primesd Non-edge traffic demand from s to dhθ g Latency experienced by g when going through θ
αA resource (eg CPU memory etc)at an edge proxy or a datacenter
Mαe Capacity of resource α at (e)creq crsp Bandwidth consumption of a request response
T Length of an epochIntermediate variables
microαz(t) Resource αrsquos utilization on znθ g(t) Number of sessions on θ from gneg(t) Number of sessions on e from g sumforallθ eisinθ nθ g(t)aθ g(t) Session arrival rate on θ from gaeg(t) Session arrival rate on e from g sumforallθ eisinθ aθ g(t)ξsd(t) Traffic of settled sessions s to d
f (t) CCDF of session lifetimeOutputs
wθ g Weight of new sessions of UG g on θ
ωpsd Weight of traffic from s to d on network path p
Table 1 Key notations in Footprint model
from source s to destination d assigned to network pathp Note that s and d represent WAN endpoints connectedto datacenters edge proxies or neighboring ISPs For in-stance for non-edge traffic s and d may be a neighboringISP and a datacenter for service request traffic generatedfrom UGs s is the proxy while d is the datacenter
Constraints Because the sessions from g can only beassigned to a subset of e2e-paths Θg whose proxies areclose enough to g and similarly traffic from s to d canonly traverse a subset of network paths Psd that connects and d we have the following constraints on routing
forallg sumforallθ wθ g = 1 if θ isinΘg then wθ g = 0 (1)
forallsd sumforallp ωpsd = 1 if p isin Psd then ωpsd = 0 (2)
Before describing the system model based on whichwe compute these routing decisions we list the assump-tions made in our modeling
Assumptions We assume that a DC is involved inserving each user request This assumption does not im-ply that there is no caching or local logic at the proxyit just means that the request cannot be completely ful-filled by the proxy All our services require personalizedresponses based on state that is only maintained in DCsIt is straightforward to modify our model when used withservices where this behavior does not hold
We assume that the session arrival rate for a user groupg in j-th epoch a j
g is known and fixed In sect5 we describe
how arrival rate is estimated We have empirically veri-fied that the arrival rate is fixed during each epoch as theepoch length that we use (5 minutes) is short Our modelcan be extended to account for errors in the estimated ar-rival rate [22] Similarly we assume that the distributionof session lifetimes denoted by q(t) is known
We model proxies and datacenters as monolithic enti-ties ignoring their internal structure (and hence we referto them as ldquoserversrdquo) Without this simplifying assump-tion the model will become intractable as there will betoo many individual servers
For ease of exposition we assume that the infrastruc-ture supports only one type of service This servicegenerates request-response traffic and the average band-widths consumed by requests and responses is known(creq cresp) We define the capacity Mαe of resource α
(eg CPU memory) of server e in terms of number ofsessions That is we say that the CPU on a proxy canhandle a certain number of sessions We assume that thisnumber is known and fixed for a given α and a givene Since links can be viewed as a ldquoserverrdquo with a sin-gle resourcemdashbandwidthmdashwe will occasionally lever-age this view to simplify notation We can extend ourmodel to multiple services and a more detailed view ofresource and bandwidth consumption [22]
Finally we assume the systemrsquos objective is to findend-to-end paths that minimize user delays We do notconsider properties such as throughput or loss rate butwe model the impact of high utilized resources on delay
42 Temporal system dynamicsTo model resource utilization we first model the numberof active sessions consuming that resource Let z denoteany element of an end-to-end path - a ldquoserverrdquo or a linkThe number of active sessions on z is
nz(t) = sumforallg
sumforallθ eisinθ
nθ g(t) (3)
where nθ g(t) is the number of active sessions from UG gon e2e-path θ at time t and thus nz(t) is the total numberof active sessions on element z nθ g(t) evolves with timeas new sessions arrive and old ones depart
Consider epoch k which lasts from time t isin [kT(k+1)T ] where T is the epoch length At the beginning ofthe epoch (t = kT ) there are nold
θ g(kT) pre-existing ses-sions that will terminate per the pattern defined by thedistribution of session life time Simultaneously newsessions will continuously arrive some of which termi-nate inside the current epoch and others will last beyondthe epoch At any given time the total number of ses-sions in the epoch is
nθ g(t) = nnewθ g (t)+nold
θ g(t) (4)
We must faithfully model how nnewθ g (t) and nold
θ g(t) evolvewith time to provide high performance and efficiency
5
0 02 04 06 08
1
0 100 200 300
Pro
bab
ilit
y o
f S
essi
on A
liv
enes
s
Time (Second) (a)
0 10 20 30 40 50
0 100 200 300
F(t
)
Time (Second) (b)
OriAppxrsquo
0 10 20 30 40 50
0 100 200 300
G(t
- T
)
Time (Second) (c)
0 10 20 30 40 50
0 100 200 300
G(t
- 2
T)
Time (Second) (d)
Figure 6 The pattern functions derived from the session life time distribution of Bing in an epoch The time (x-axis)on each graph is relative to the start of the epoch
New sessions The new session arrival rate on θ fromUG g is
forallθ g aθ g = agtimeswθ g (5)
Recall that ag is the total arrival rate of sessions from UGg and we assume it to be fixed within an epoch
At any given time t within the epoch k nnewθ g (t) is the
sum of the number of sessions which arrived in interval[kT t] and are still alive at t From the session life timeCDF distribution q(t prime) we can easily derive f (t prime) = 1minusq(t prime) which is probability that a session is still alive afterduration t prime since it started Figures 5(a) and 6(a) showexamples of q(t prime) and f (t prime) respectively
Therefore at any given time τ isin [kT t] the numberof new sessions that arrived in the interval [τ τ +∆τ]is aθ gtimes∆τ Among these sessions there will be f (tminusτ)aθ gtimes∆τ sessions left at time t When ∆τ rarr 0
nnewθ g (t) =
int t
kTf (tminus τ)timesaθ gdτ = aθ gtimes
int tminuskT
0f (τ)dτ (6)
= aθ gtimesF(tminus kT )
where F(t) =int t
0 f (τ)dτ which represents the number ofsessions alive at t assuming unit arrival rate Figure 6(b)shows F(t) obtained from Figure 6(a)Pre-existing sessions At time t in epoch k the numberof pre-existing sessions that arrived in epoch j ( j lt k) is
nold jθ g (t) =
int ( j+1)T
jTf (tminus τ)timesa j
θ gdτ (7)
= a jθ gtimes
int tminus jT
tminus( j+1)Tf (τ)dτ = a j
θ gtimesG(tminus jT )
where a jθ g is the observed arrival rate in epoch j and
G(t) = F(t)minusF(tminusT ) Therefore the total number ofpre-existing sessions is
noldθ g(t) =
kminus1
sumj=0
a jθ gtimesG(tminus jT ) (8)
Figures 6(c) and (d) show examples of G(tminus jT ) in twoepochs prior to current one ie j = (kminus 1)T and j =(kminus2)T respectively when T = 300 seconds
Server utilization Given the number of active ses-sions the utilization of resource α on server e is
microαe(t) =ne(t)Mαe
(9)
Combining Eqns 3 4 6 8 and 9 the utilization of aresource α on server e is
0 05 07509 1 11
Utilization micro
020
50
100
200
Penalt
y P(micro)
(ms)
p=80microminus40
p=200microminus130
p=500microminus400
p=1000microminus900
Figure 7 Penalty function
microαe(t) =F(tminus kT )timesaeg +sum
kminus1j=0 G(tminus jT )timesa j
eg
Mαe(10)
Link utilization To model link utilization we accountfor non-edge traffic and the fact that requests and re-sponses consume different amounts of bandwidth creqand crsp respectively
An e2e-path θ contains a request path θreq from UGto DC and a response path θrsp from DC to UG Thusthe total edge traffic load generated by new sessions on anetwork link l is
microprimebwl(t) =
sumforallθ lisinθreq nnewθ
(t)creq +sumforallθ lisinθrsp nnewθ
(t)crsp
bwl(11)
Pre-existing sessions stick to their originally assignedservers but the WAN paths they use can be adjusted Allsuch sessions from site s to site d generates traffic de-mand ξsd
ξsd(t) = sumforallg[ sumforallθ sdisinθreq
noldθ g(t)creq + sum
forallθ sdisinθrsp
noldθ g(t)crsp] (12)
Links are shared by edge and non-edge traffic Let ξ primesdbe the traffic demand from source router s to destinationrouter d the link load by non-edge traffic on link l is
microprimeprimebwl(t) =
sumforallsd sumforallplisinp[ξsd(t)+ξ primesd ]timesωpsd
bwl(13)
Thus the total utilization of network link l should bemicrobwl(t) = micro
primebwl(t)+micro
primeprimebwl(t) (14)
43 Optimization objectiveEquations 10 and 14 model the impact of routing deci-sions on resource utilization For computing the finaldecisions resource utilization is only half of the storyOur goal is not to exclusively minimize utilization asthat can come at the cost of poor performance if user ses-sions start traversing long paths Similarly the goal is
6
not to exclusively select shortest paths as that may causeoverly high utilization that induces delays for users
To balance the two concerns as is common in TEsystems we penalize high utilization in proportion toexpected delay it imposes [1] Figure 7 shows thepiece-wise linear approximation of the penalty functionP(microαe) we use The results are not sensitive to the exactshapemdashwhich can differ across resource typesmdashas longas the function has monotonically non-decreasing slope
Thus our objective function is
min sumforallαe
int T
0P(microαe(t))dt + sum
forallgθ
int T
0hgθ ngθ (t)dt (15)
The first term integrates utilization penalty over theepoch and the second term captures path delay Thevariable hgθ represents the total latency when sessionsof UG g traverse e2e-path θ It is the sum of UG-to-proxy and WAN path delays
44 Solving the modelMinimizing the objective under the constraints abovewill assign values to our output variables However ourmodel uses continuous time and we must ensure that theobjective is limited at all possible times To tractablyguarantee that we make two observations First nnew
θ g (t)monotonically increases with time and is also concaveThe concavity is valid if only dF(t)
dt = f (t) is monotoni-cally non-increasing with t which is always true becausef (t) is a CCDF (complementary cumulative distributionfunction) Hence we can use a piecewise linear con-cave function F prime(t) that closely upper-bounds F(t) Forinstance the red dashed line in Figure 6b shows a two-segment F prime(t) we use for Bing
The second observation is that noldθ g(t) is monotoni-
cally decreasing and convex eg Figure 5(b) The con-vexity depends on both the shape of f (t) and the lengthof epoch T we choose We found the convexity of nold
θ g(t)is valid for all the services in our infrastructure This inthis paper we assume for simplicity that nold
θ g(t) is alwaysconvex Otherwise one can may use a piecewise linearfunction to upper-bound nold
θ g(t)Therefore when we use F prime(t) instead of F(t) from
Eqn 10 we derive
microαe(t)le microαe(t) =F prime(tminus kT )aeg +sum
kminus1j=0 G(tminus jT )a j
eg
Mαe(16)
where microαe(t) is upper-bounding microαe(t) all the time sothat we can limit microαe(t) by limiting microαe(t)
Since sumkminus1j=0 G(tminus jT ) is also convex with time t and
let τ1 τm where τ1 = 0τm = T be the conjunc-tion points of linear segments in F prime(t) microαe(t) becomesa piecewise convex function and each convex piece i(1 le i le mminus 1) has boundary τi and τi+1 Becausethe maximum value of a convex function must be on
the boundary the maximum value of convex piece i inmicroαe(t) happens on either t = τi or t = τi+1 Hence over-all the maximum value of microαe(t) always happens at acollection of particular moments which are τ1 τmFormally we have
micromaxαe = maxmicroαe(τi)|i = 1 m (17)
Similarly for link utilizations and number of sessionswe also have
micromaxbwl = maxmicrobwl(τi)|i = 1 m (18)
nmaxθ g = maxnθ g(τi)|i = 1 m (19)
where microbwl(t) and nθ g(t) similar to microαe(t) is also de-rived from replacing F(t) with F prime(t) in Eqns 14 and 3
Therefore we can transfer our original objective func-tion Eqn 15 into following formulation
min sumforallαe
P(micromaxαe )timesT + sum
forallgθhgθ nmax
gθ timesT (20)
We can now obtain an efficiently-solvable LP com-bining the new objective in Eqn 20 with constraints inEqns 1ndash5 and 16ndash19 The penalty function P(micro) canalso be encoded using linear constraints [15]
5 Footprint DesignWe now describe the design of Footprint in more detail
Defining UGs We start with each 24 IP address prefixas a UG because we find experimentally that such usershave similar performance In the presence of eDNSwhere LDNS resolvers report usersrsquo IP addresses whenquerying our (authoritative) DNS servers this defini-tion of UGs suffices However eDNS is not widely de-ployed and our DNS servers tend to see only resolversrsquo(not usersrsquo) addresses This lack of visibility meansthat we cannot map 24 prefixes that share LDNS re-solvers to entry point(s) independently Thus we mergenon-eDNS UGs that share LDNS resolvers using IP-to-LDNS mapping from our entry point performance mon-itoring method (described below) We find that suchmergers hurt a small minority of users 90 of the timewhen two 24 prefixes have the same LDNS their rela-tive performance to top-3 entry points is similar
Entry point performance monitoring We leverageclient-side application code to monitor performance ofUGs to different entry points Our measurement methodborrows ideas from prior work [24 5] After a queryfinishes the user requests a URL from current and alter-native entry points It then reports all response times toa measurement server which allows us to compare entrypoints head-to-head without worrying about differencesacross users (eg home network performance)
However because there can be O(100) entry pointsrequesting that many URLs will take a long time and
7
place undue burden on users We thus perform measure-ments with a small probability and limit each to three re-quests Each URL has the form httpltguidgttryltkgt
servicefootprintcommonitor where guid is aglobally unique identifier and k isin (13)
What sits behind monitor is a service-specific transac-tion For a browsing-type service (eg search or socialnetworking) it may correspond to downloading its typi-cal Web page for a video streaming service large objectsmay be downloaded This way the response time reflectswhat users of the service experience
The measurement mechanics are as follows Becauseof the GUID the URL hostname does not exist in DNScaches and each request triggers a lookup at our DNSserver We resolve the name based on the userrsquos UG andk For k=1 we resolve to the current-best entry pointfor k=2 to a randomly selected entry point from the tennext best and for k=3 to a random selection from theremaining entry points Each response-time triplet yieldsthe relative performance of the best and two other entrypoints Aggregating across triplets and users provides aview of each entry pointrsquos performance for each UG
This view is more up-to-date for better entry pointsfor a UG as they are sampled from a smaller set (of 10)When a UGrsquos entry point is changed it is likely mappedto another nearby entry point up-to-date view of suchentry points is important which would be hard to obtainwith unbiased sampling of all entry points
Finally we learn the mapping from usersrsquo IP addressesto LDNS resolvers by using GUIDs to join the logs atHTTP transaction servers (which see usersrsquo addresses)and DNS servers (which see resolver addresses)
Clustering UGs After LDNS-based grouping we getO(100K) UGs which poses a scaling problem for our LPsolver To reduce the number of UGs we aggregate UGsat the start of each epoch For each UG we rank all entrypoints in decreasing order of performance and then com-bine into virtual UGs (VUG) all UGs that have the sameentry points in the top-three positions in the same orderWe formulate the model in terms of VUGs The perfor-mance of a VUG to an entry point is the average of theaggregate weighted by UGsrsquo number of sessions Forour infrastructure this clustering creates O(1K) VUGsand we observe only a marginal decline in efficiency(asymp3) due to our inability to map individual UGs
System workload The controller estimates the work-load for the next epoch using workload information fromprevious epochs DNS servers report the arrival rates ofnew sessions for each UG and each service proxies re-port on resource usage and departure rate of sessions andnetwork switches that face the external world report onnon-edge traffic matrix (in bytessecond) Edge work-load is captured in terms of all resource(s) that are rel-
evant for allocation (eg memory CPU traffic) Weuse exponentially weighted moving average (EWMA)to estimate workload for the next epoch We also uselinear regression to infer per-session resource consump-tion (eg CPU cycles) for each service using overall re-source usage and number of active sessions per service
System health When failures occur health monitor-ing services at proxy sites and DCs inform the controllerhow much total site capacity is lost (not which servers)This information granularity suffices because the con-troller does not allocate sessions to individual servers ata site and relies on local load balancers for that In con-trast network failures are exposed at link-level so thatthe controller can determine network paths
Because it may take a few seconds for the controller toreact to server or link failures (sect74) instead of waitingfor the controller to update the configuration load bal-ancers and routers react to failures immediately by mov-ing traffic away from failed components Such move-ments can cause transient congestion in our current de-sign which we plan to address in the future using for-ward fault correction (FFC) [23]
Robustness to controller failures To make the sys-tem robust to controller or hosting-DC failures we runmultiple controllers in three different DCs in different ge-ographic regions All dynamic information required forthe optimization (eg system workload) is reported toall controllers in parallel The controllers elect a uniqueleader using ZooKeeper [33] Only the leader computesthe new system configuration and updates the infrastruc-ture which ensures that updated system state is not in-consistent even if different controllers happen to havedifferent views of the current workload (eg due to de-lays in updating information at a given controller) Whenthe leader fails a new leader is elected The new leadercan immediately start computing new system configura-tions as it already has all the requisite inputs
6 Footprint PrototypeWe have implemented the Footprint design outlinedabove The client-side functionality for entry point per-formance monitoring is a JavaScript library that can beused with any Web service This library is invoked af-ter page load completes so that it does not interfere withuser experience When fetching a URL in JavaScriptwe cannot separate DNS lookup and object downloadtimes To circumvent this limitation before fetching theURL we fetch a small object from the same hostnameThen because of DNS caching the response time of theURL does not include DNS lookup time In cases wherethe browser supports the W3C Resource Timing API weuse the precise object fetch time We implemented theDNS server-side functionality by modifying BIND [3]
8
and proxy functionality using Application Request Rout-ing [2] which works with unmodified Web servers Weuse Mosek [26] to solve the LP
Timely processing of monitoring data is critical Aparticularly onerous task is the real-time join betweenHTTP and DNS data to know which endpoints ourJavaScript has measured and to attach detailed networkand geographic information to each measurement Tohelp scale we build our processing pipeline on top ofMicrosoft Azure Event Hub and Stream Analytics
To scale the computation of new configurations welimit the number of e2e-paths that a VUG can useSpecifically we limit each VUG to its best three en-try pointsmdashthe ones on which VUG was clusteredmdasheach load balancer to three proxies and each source-destination switch pair to six paths (tunnels) in the WANIn our benchmarks these limits speed computation bymultiple orders of magnitude without noticeably impact-ing system efficiency or performance
We deployed a prototype of Footprint in a modest-sized testbed This environment emulates a WAN witheight switches and 14 links three proxy sites and twoDCs Proxy sites and DCs have one server each Wehave 32 PCs that act as UGs and repeatedly query a ser-vice hosted in the DC UG to entry point delays are con-trolled using a network emulator
The monitoring aspects of Footprint but not the con-trol functionality are also deployed in Microsoftrsquos ser-vice delivery infrastructure This allow us to collect datafrom O(100) routers O(50) edge sites and O(10) DCsworldwide The JavaScript library is randomly includedin 20 of Bing user requests We use the data from thisdeployment to drive simulations to evaluate Footprint
7 Experimental EvaluationWe evaluate Footprint along several dimensions of in-terest First we use the testbed to show the viabilityand value of jointly controlling all types of infrastructurecomponents It is not intended to shed light on efficiencyand performance of Footprint in a real deployment Toassess those aspects we conduct large-scale simulationsbased on data gathered using the monitoring deploymentof Footprint in our production environment
71 Testbed resultsWe use a simple experiment on our testbed to demon-strate the value of spatial traffic modulation In this ex-periment we recreate the example in Figure 2 Recallthat in this example the WAN gets congested such that nopath between the entry point P2 and DC2 is congestion-free We create such congestion by injecting non-edgetraffic that uses those paths
Figure 8 shows the results It plots the response timefor UGs that are originally mapped to P2 and DC2
Figure 8 Testbed experiment WAN congestion
with Footprint and with WAN TE alone WAN TE es-timates the WAN traffic matrix based on recent historyand routes traffic to minimize link utilization while us-ing short paths [18] We see that soon after congestionoccurs Footprint spatially modulates the traffic such thatUGsrsquo performance is restored But WAN TE is unable toresolve congestion and performance issues as it cannotchange UGsrsquo proxy and DC selections
72 Efficiency and performanceTo understand the efficiency and performance of Foot-print at scale we conduct detailed simulations using datafrom Microsoftrsquos service delivery infrastructure Oursimulations use a custom fluid-level simulator
721 Methodology and data
To understand the benefit of Footprintrsquos joint optimiza-tion we compare it to a system similar to Microsoftrsquoscurrent approach where i) anycast routing is used to mapUGs to their best proxy ii) each edge proxy indepen-dently chooses the closest DC for its user sessions basedon up-to-date delay measurements and iii) WAN TE pe-riodically configures network paths based on observedtraffic to minimize maximum link utilization [18] Inour simulations the control loops for DC selection ateach proxy and for WAN TE run independently every5 minutes To mimic anycast routing we use our moni-toring data to map UGs to the best proxy which enablesa fair comparison by factoring out any anycast subop-timality [5] We also assume that proxies are not thebottleneck to remove the impact of anycast routingrsquos in-ability to evenly balance load across proxies which adifferent user-to-proxy mapping system may be able toachieve Abusing terminology we call this system Fas-tRoute even though the FastRoute paper [14] discussesonly user-to-proxy mapping and not WAN TE
We drive simulations using the following data i)timestamps of new sessions obtained from system logsii) distribution of session lifetimes iii) UG to entry pointperformance data from our monitoring deployment iv)propagation latencies and capacities of all links in theWAN v) server capacities at the edge proxies and datacenters vi) non-edge traffic carried by the WAN and vii)
9
Aggregate Sessions Outgoing Bandwidth
002040608
1
Proxy
CD
F
002040608
1
Proxy
CD
F
(a) NA (b) EU
Figure 9 Distribution of bandwidth and sessions acrossproxies User sessions are mapped to the closest proxyBandwidth per proxy is measured as aggregate band-width of all directly attached links
1 50
1
2
3
4
1156
194232
Nor
mal
ized
Traf
ficSc
ale FastRoute
Footprint
1 50
1
2
3
4
115
218255
Nor
mal
ized
Traf
ficSc
ale FastRoute
Footprint
(a) NA (b) EU
Figure 10 Efficiency of FastRoute and Footprint forSLO1 (excess traffic on overloaded components)
per-session resource consumption (eg CPU) estimatedusing linear regression over the number active sessions
We show results for North America (NA) and Europe(EU) separately The infrastructure in the two continentsdiffers in the numbers of proxies DCs and the richnessof network connectivity The NA infrastructure is biggerby about a factor of two The results below are basedon one weekrsquos worth of data from August 2015 Resultsfrom other weeks are qualitatively similar
To provide a sense of system workload Figure 9shows the distribution of closest user sessions and net-work bandwidth across proxies Since proxies are notbottlenecks in our experiments network congestion is akey determiner of performance While it can occur inthe middle of the network as well congestion occursmore often on links close to the proxies because fewerrouting alternatives are available in those cases We seethat in aggregate network bandwidth and user sessionsof proxies are balanced more bandwidth is available be-hind proxies that receive more sessions
722 Efficiency
We quantify efficiency of a service-delivery system us-ing congestion-free scalemdashmaximum demand that it cancarry without causing unacceptable congestion that vio-lates service-level objectives (SLOs) We consider twodefinitions of unacceptable congestion i) SLO1 acrossall epochs the amount of traffic in excess of compo-
1 50
1
2
3
4
0661
178 199
Nor
mal
ized
Traf
ficSc
ale
FastRouteFootprint
1 50
1
2
3
4
082 091
199 211
Nor
mal
ized
Traf
ficSc
ale
FastRouteFootprint
(a) NA (b) EU
Figure 11 Efficiency of FastRoute and Footprint forSLO2 (total traffic on overloaded components)
nent capacities should be less than a threshold ii) SLO2across all epochs the total traffic traversing overloaded(ie load greater than capacity) components should beless than a threshold The difference in the two SLOsis that when traffic traverses an overloaded componentSLO1 considers only the fraction in excess of the ca-pacity but SLO2 considers all traffic passing throughit We study multiple congestion thresholds and computecongestion-free scale by iterating over demands that areproportionally scaled versions of the original demand
Figure 10 shows the congestion-free scale for Fas-tRoute and Footprint with SLO1 for two different conges-tion thresholds For confidentiality we report all trafficscales relative to the congestion-free scale of FastRoutewith SLO1 at 1 threshold We see that Footprint carriesat least 93 more traffic when the congestion thresholdis 1 and 50 more traffic when the threshold is 5
These efficiency gains can be understood with respectto the spatial modulation enabled by joint coordinationin Footprint While on average the load on the proxy isproportional to its network bandwidth (Figure 9) at dif-ferent times of the day different regions are active andget congested By making joint decisions Footprint canmore easily divert traffic from currently active proxies tothose in other regions
Figure 11 shows that Footprintrsquos efficiency gains holdfor SLO2 as well which considers total traffic travers-ing overloaded components For 1 and 5 congestionthresholds Footprint can carry respectively 170 and99 more traffic than FastRoute
723 Performance
We quantify performance of user sessions using end-to-end path delays We study its contributing factors ex-ternal (UG-to-proxy) delay propagation delay inside theWAN and queuing-induced delays Queuing delay isquantified using utilization per the curve in Figure 7Figure 12 shows the performance of the two system fortraffic scales that correspond to 35 and 70 of thecongestion-free scale of FastRoute for SLO1 Each barstacks from bottom three factors in the order listed above
We see that even when the traffic demand is low(35) Footprint has 46 (for NA) lower delay At this
10
Queuing WAN External
FastRoute Footprint0
20
40
60
80
Del
ay[m
s]
FastRoute Footprint0
20
40
60
80
Del
ay[m
s]
(a) NA (035times) (b) NA (07times)
FastRoute Footprint0
10
20
30
Del
ay[m
s]
FastRoute Footprint0
10
20
30D
elay
[ms]
(c) EU (035times) (d) EU (07times)
Figure 12 Delays in the two systems
scale the infrastructure is largely under-utilized The de-lay reduction of Footprint stems from its end-to-end per-spective In contrast FastRoute picks the best proxy fora UG and the best DC for the proxy The combinationof the two might not represent the best e2e path Sucha path may be composed of a suboptimal UG-to-proxypath but a much shorter WAN path This effect can beseen in the graph where the external delays are slightlyhigher but the sum of external and WAN delay is lower
When the traffic demand is high (70) both systemshave higher delay For FastRoute most of the additionaldelay stems from queuing as traffic experiences highlyutilized resources Footprint is able to reduce queuingdelay by being better able to find uncongested (albeitlonger) paths Overall the end-to-end delay of Footprintis at least 30 lower than FastRoute
73 Impact of system modelTo isolate the impact of the system model of Footprintwe compare it to two alternatives that also do jointoptimization but without the detailed temporal model-ing of workload The efficiency of these alternativesalso represents a bound on what existing coordinationschemes [16 20 28 12] can achieve when extended toour setting of jointly determining the proxy WAN pathand DC mappings for user sessionsbull JointAverage Instead of modeling temporal dynam-
ics based on session lifetimes JointAverage uses Littlersquoslaw [21] to estimate the number of active sessions as afunction of session arrival rate If the session arrival rateat a proxy is A per second and the average session life-time is 10 seconds on average the proxy will have 10timesAactive sessions These estimates are plugged into an LPthat determines how new sessions are mapped to proxiesand DCs and how traffic is forwarded in the WANbull JointWorst To account for session dynamics Joint-
Worst makes a conservative worst-case assumption
JointAverageJointWorst
Footprint0
1
2
3
148118
23
Nor
mal
ized
Traf
ficSc
ale
JointAverageJointWorst
Footprint0
02040608
1
016035 037
Nor
mal
ized
Traf
ficSc
ale
(a) Unscaled (b) 10times scaled
Figure 13 Efficiency of different system models for dif-ferent average session lifetimes on NA infrastructure
minus200 minus100 0 100 2000
02
0406
081
Estimated - Actual Link Utilization []
Frac
tion
oflin
ks JointAverageJointWorstFootprint
Figure 14 Fidelity of modeling CDF of modeled andobserved link utilization
about load on infrastructure components Specificallyit assumes that new sessions arrive before any old ses-sions depart in an epoch Since we do not do admissioncontrol it is not the case that traffic that is estimatedper this model to overload the infrastructure is rejectedInstead the optimization spreads traffic to minimize uti-lization that is predicted by this model This model willdo well if it overestimates the traffic on each componentby a similar amount
For NA infrastructure figure 13(a) compares thesetwo models with Footprint using SLO1 at 5 conges-tion thresholdmdashthe configuration for which Footprint hadleast gain over FastRoute We see that Footprint is sub-stantially more efficient It carries 56 and 96 moretraffic than JointAverage and JointWorst
We find that the gains of Footprint actually stem fromits ability to better model load that will be placed on dif-ferent infrastructure components To demonstrate it Fig-ure 14 plots the distribution of estimated minus actualutilization for WAN links for each model We see thatJointAverage tends to underestimate utilization and Joint-Worst tends to overestimate it With respect to appropri-ately spreading load through the infrastructure neitherover- nor under-estimation is helpful
We also find that if sessions were much longer Joint-Worst performs better because its conservative assump-tion about existing sessions continuing to load the infras-tructure becomes truer On the other hand JointAver-age gets worse because it ignores the impact of existingsessions altogether which hurts more when sessions arelonger This is illustrated in Figure 13(b) which shows
11
0 2 4 6 8 100
20406080
100
Churn []
CD
Fov
erep
ochs
Figure 15 Churn in UG to proxy performance
the impact on efficiency with average session lifetimemultiplied by 10 Because of its modeling fidelity thebenefit of Footprint is not dependent on session lifetimehowever and it is able to provide gains even for theseabnormally long sessions
74 Computation timeWe measured the time Footprint controller takes to com-pute system configurations which includes convertinginputs to an LP solving it and converting the outputto system variables On an Intel Xeon CPU (E5-1620370GHz) with 16 GB RAM and using Mosek v7 thistime for NA and EU infrastructure is 5 and 06 secondsrespectively This level of performance is acceptablegiven that epochs are much longer (5 minutes) With-out clustering of UGs the running time was greater than20 minutes for both NA and EU
75 Preliminary experienceWe make two observations based on the deployment ofFootprintrsquos monitoring components in Microsoftrsquos infras-tructure First we quantify the fraction of UGs for whichthe best proxy changes across epochs If this fraction issubstantial optimal user-to-proxy mapping would movelarge amounts of WAN traffic which is better done incoordination with WAN-TE rather than independently
Figure 15 shows the fraction of UGs weighed by theirdemand for which the best proxy changes across epochsOn average this fraction is 5 It means that a user-to-proxy mapping control loop operating independentlycould move this high a fraction of traffic on the WANJoint coordination helps make such movements safely(In Footprint since we consider WAN-internal capacityand performance as well the traffic moved is lower un-der 1 in our simulations)
Second an unexpected advantage of Footprintrsquos con-tinuous monitoring is that we can discover and circum-vent issues in Internet routing that hurt user performanceWe have found several such events In one case users inthe middle of the NA started experiencing over 130 msround trip delay to a proxy on the west coast whilethe historical delay was under 50 ms In another casethe difference in the delay to reach two nearby prox-ies in Australia was over 80 ms Debugging and fixingsuch issues requires manual effort but Footprint can au-tomatically restore user performance in the meanwhile
Anycast-based systems such as FastRoute cannot do that
8 Related WorkOur work builds on two themes of prior work
Content distribution systems Content and servicedelivery has been an important problem in the Internetfor almost two decades Akamai [25] developed the firstlarge-scale solution and we borrow several of its con-cepts such as using edge proxies to accelerate perfor-mance and mapping users to proxies based on path per-formance and proxy load Since then researchers havedeveloped sophisticated techniques to tackle this generalproblem known as replica selection [13 4 11 29] So-lutions tailored to specific workloads (eg video) havealso been developed [27 17]
Most of these works target the traditional context inwhich the WAN is operated separately from the proxyinfrastructure We target the increasingly common inte-grated infrastructure context which provides a new op-portunity to jointly coordinate routing and resource allo-cation decisions
Coordinating decisions Other researchers have notedthe downside of independent decisions for network rout-ing and content distribution Several works [16 20 2812] consider coordinating ISP routing and DC selectionthrough limited information sharing PECAN developstechniques to coordinate proxy selection and external(not WAN) paths between users and proxies [31] EN-TACT balances performance and the cost of transit trafficfor an online service provide [32]
Our work differs from these efforts in two ways Firstit includes the full complement of jointly selecting prox-ies DCs and network paths But more importantly priorworks ignore workload dynamics that arise from ses-sion stickiness Consequently the best case result of ap-plying their techniques to our setting will approach theJointWorst or JointAverage scheme (sect73) because mod-ulo session stickiness these two schemes optimally mapworkload to infrastructure elements We showed that be-cause it accounts for workload dynamics Footprint out-performs these schemes Extending information-sharingtechniques to account for such workload dynamics is aninteresting avenue for future work
9 ConclusionsOur work pushes SDN-style centralized control to in-frastructure elements beyond networking devices In do-ing so we found that to maximize efficiency and per-formance we must handle complex workload dynamicsthat stem from application behaviors This challenge willlikely emerge in other systems that similarly push thelimits of SDN and the approach we take in Footprint mayinform the design of those systems as well
12
Acknowledgments We thank the Microsoft engineerswho helped with data acquisition and prototype deploy-ment including Sreenivas Addagatla Sorabh GandhiDaniel Gicklhorn Nick Holt Jon Mitchell DavidSchmidt Prasad Tammana and Ed Thayer We alsothank the NSDI reviewers and our shepherd LaurentVanbever for feedback that helped improve the pa-per Raajay and Aditya were supported in part by Na-tional Science Foundation (grants CNS-1302041 CNS-1330308 and CNS-1345249) and the Wisconsin Institueof Software-Defined Datacenters of Madison
References[1] G Appenzeller I Keslassy and N McKeown Siz-
ing router buffers In SIGCOMM 2004
[2] Application request routing httpenwikipediaorgwikiApplication_Request_Routing
[3] BIND httpswwwiscorgdownloadsbind
[4] S Buchholz and T Buchholz Replica placementin adaptive content distribution networks In ACMsymposium on Applied computing 2004
[5] M Calder E Katz-Bassett R Mahajan and J Pad-hye Analyzing the Performance of an AnycastCDN In IMC 2015
[6] Amazon CloudFront httpawsamazoncomcloudfront
[7] Windows Azure CDN httpazuremicrosoftcomen-usservicescdn
[8] Facebook CDN httpsgigaomcom20120621like-netflix-facebook-is-planning-its-own-cdn
[9] Google CDN httpscloudgooglecomstorage
[10] Level3 CDN httpwwwlevel3comenproductscontent-delivery-network
[11] Y Chen R H Katz and J D Kubiatowicz Dy-namic replica placement for scalable content deliv-ery In Peer-to-peer systems 2002
[12] D DiPalantino and R Johari Traffic engineeringvs content distribution A game theoretic perspec-tive In INFOCOM 2009
[13] J Elzinga and D W Hearn Geometrical solutionsfor some minimax location problems Transporta-tion Science 6(4)379ndash394 1972
[14] A Flavel P Mani D Maltz N Holt J LiuY Chen and O Surmachev Fastroute A scalableload-aware anycast routing architecture for moderncdns In NSDI 2015
[15] B Fortz J Rexford and M Thorup Trafficengineering with traditional IP routing protocolsComm Mag 40(10) 2002
[16] B Frank I Poese Y Lin G Smaragdakis A Feld-mann B Maggs J Rake S Uhlig and R WeberPushing CDN-ISP collaboration to the limit SIG-COMM CCR 43(3) 2013
[17] A Ganjam F Siddiqui J Zhan X Liu I StoicaJ Jiang V Sekar and H Zhang C3 Internet-scale control plane for video quality optimizationIn NSDI 2015
[18] C-Y Hong S Kandula R Mahajan M ZhangV Gill M Nanduri and R Wattenhofer Achiev-ing high utilization with software-driven WAN InSIGCOMM 2013
[19] S Jain A Kumar S Mandal J Ong L PoutievskiA Singh S Venkata J Wanderer J Zhou M ZhuJ Zolla U Holzle S Stuart and A Vahdat B4Experience with a globally-deployed software de-fined wan In SIGCOMM 2013
[20] W Jiang R Zhang-Shen J Rexford and M Chi-ang Cooperative content distribution and trafficengineering in an ISP network In SIGMETRICS2009
[21] Littlersquos law httpsenwikipediaorgwikiLittlersquos_law
[22] H Liu R Viswanathan M Calder A AkellaR Mahajan J Padhye and M Zhang Effi-ciently delivering online services over integratedinfrastructure Technical Report MSR-TR-2015-73 2015
[23] H H Liu S Kandula R Mahajan M Zhangand D Gelernter Traffic engineering with forwardfault correction In Proceedings of the 2014 ACMConference on SIGCOMM SIGCOMM rsquo14 pages527ndash538 New York NY USA 2014 ACM
[24] R Maheshwari How LinkedIn used PoPs andRUM to make dynamic content download 25faster httpsengineeringlinkedincomperformancehow-linkedin-used-pops-and-rum-make-dynamic-content-download-25-faster June2014
13
[25] Cloud computing services and content distributionnetwork (CDN) provider mdash akamai httpswwwakamaicom
[26] Mosek ApS httpsmosekcom
[27] M K Mukerjee D Naylor J Jiang D Han S Se-shan and H Zhang Practical real-time centralizedcontrol for cdn-based live video delivery In SIG-COMM 2015
[28] S Narayana J W Jiang J Rexford and M Chi-ang To coordinate or not to coordinate wide-areatraffic management for data centers In CoNEXT2012
[29] L Qiu V N Padmanabhan and G M VoelkerOn the placement of web server replicas In IN-FOCOM 2001
[30] P Sun R Mahajan J Rexford L Yuan M Zhangand A Arefin A network-state management ser-vice In SIGCOMM 2014
[31] V Valancius B Ravi N Feamster and A C Sno-eren Quantifying the benefits of joint content andnetwork routing In SIGMETRICS 2013
[32] Z Zhang M Zhang A Greenberg Y C HuR Mahajan and B Christian Optimizing cost andperformance in online service provider networksIn NSDI 2010
[33] Apache zookeeper httpszookeeperapacheorg
14
- Introduction
- Background and Motivation
- Overview of Design and Challenges
- System Model
-
- Preliminaries
- Temporal system dynamics
- Optimization objective
- Solving the model
-
- Footprint Design
- Footprint Prototype
- Experimental Evaluation
-
- Testbed results
- Efficiency and performance
-
- Methodology and data
- Efficiency
- Performance
-
- Impact of system model
- Computation time
- Preliminary experience
-
- Related Work
- Conclusions
-
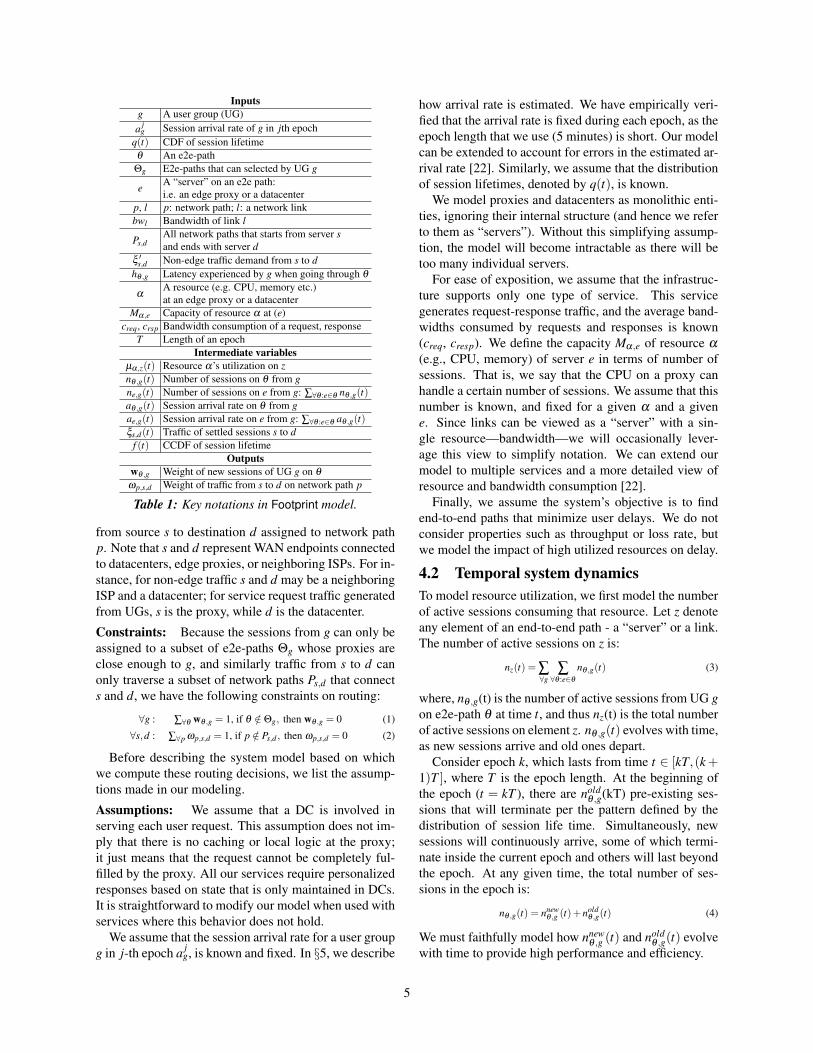
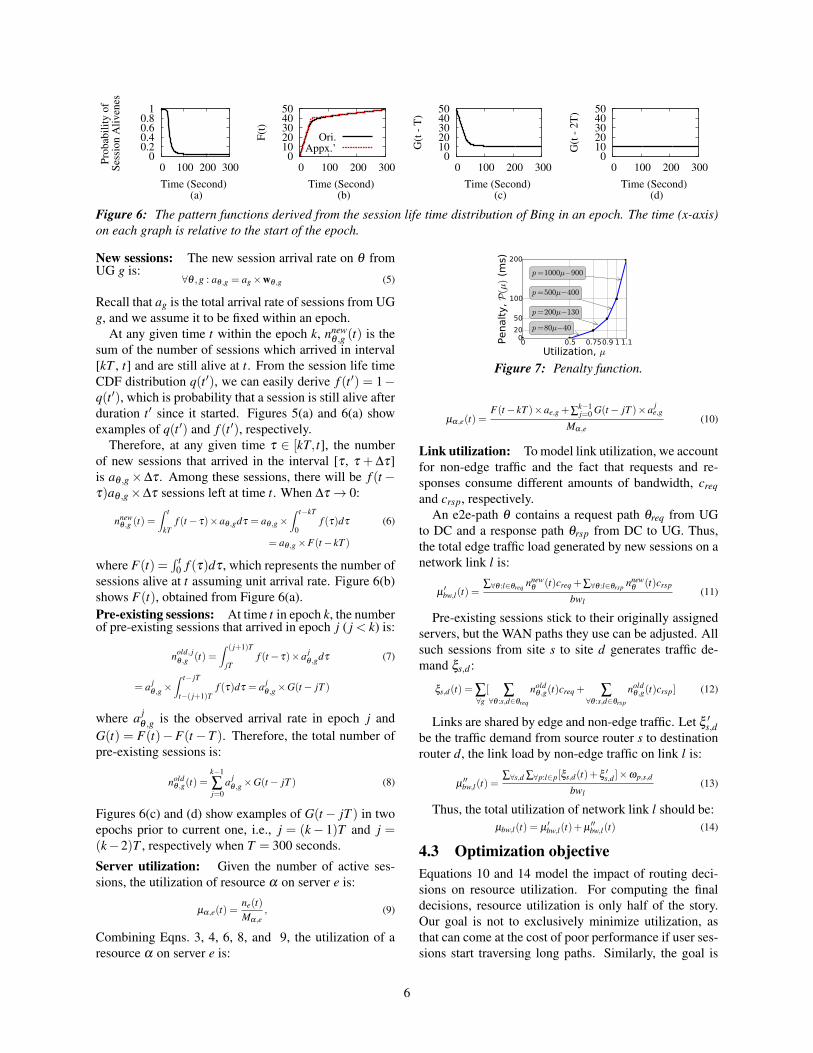
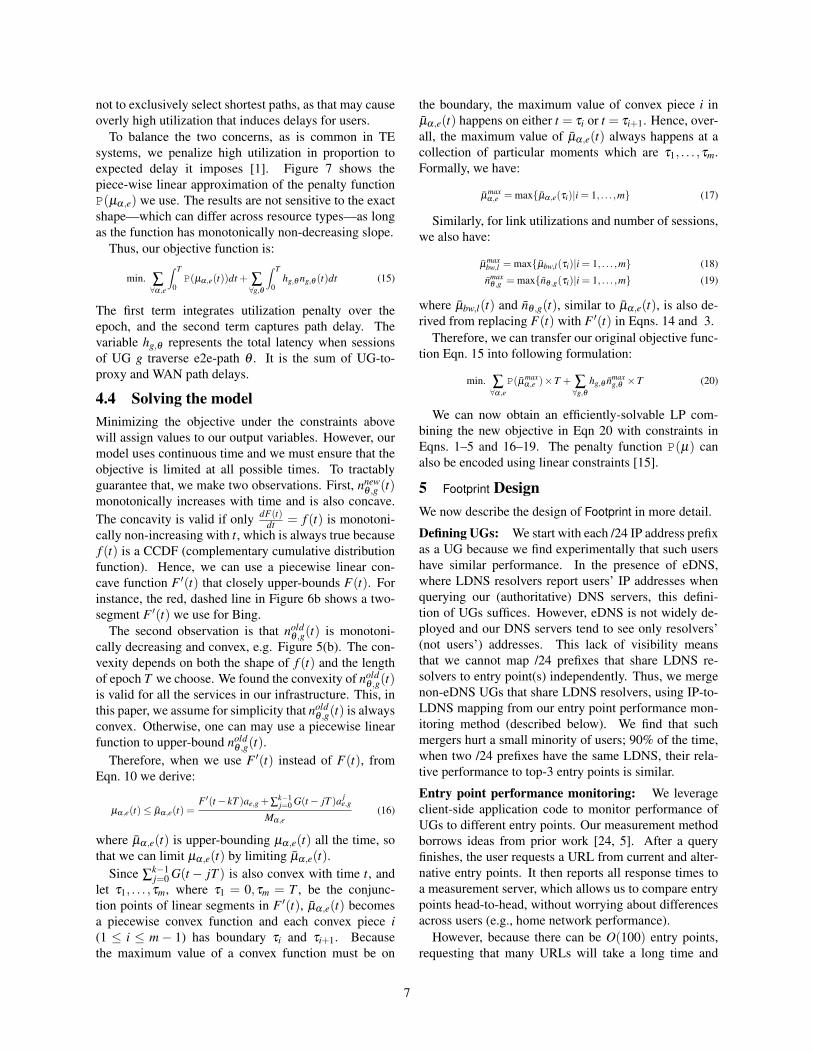