efcog guidance document: development and use of leading
TRANSCRIPT
EFCOG Guidance Document: Development of Leading Indicators
October 15, 2010
EFCOG Guidance Document: Development and Use of Leading Indicators
EFCOG Guidance Document: Development of Leading Indicators
October 15, 2010
1
Comments from EFCOG meeting 14 October 2010
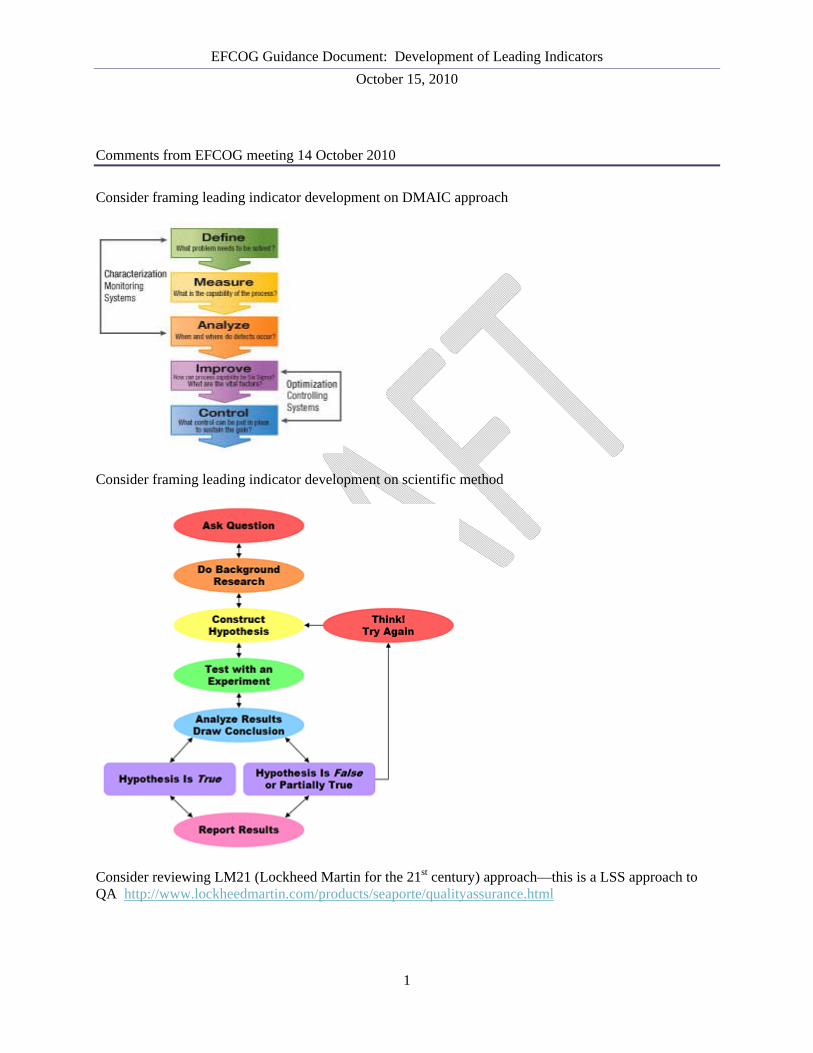
Consider framing leading indicator development on DMAIC approach
Consider framing leading indicator development on scientific method
Consider reviewing LM21 (Lockheed Martin for the 21st century) approach—this is a LSS approach to QA http://www.lockheedmartin.com/products/seaporte/qualityassurance.html
EFCOG Guidance Document: Development of Leading Indicators
October 15, 2010
2
Table of Contents
Table of Contents ............................................................................................................................ 2
Overview ......................................................................................................................................... 4
Leading Indicator Discussion .................................................................................................................... 4
Process Introduction .................................................................................................................................. 5
Setting the Stage ............................................................................................................................. 6
Reviewing the Metric Hierarchy ............................................................................................................... 6
Interviewing Decision Makers about What Keeps Them Awake at Night ............................................... 6
Sample Approach “Setting the Stage” ...................................................................................................... 7
Selecting Indicators ......................................................................................................................... 8
Selecting Lagging Indicators .................................................................................................................... 8
Selecting Leading Indicators ..................................................................................................................... 9
Quad Chart Analysis ............................................................................................................................. 9
Process Analysis ................................................................................................................................. 10
Brainstorming ..................................................................................................................................... 10
Sample Approach “Selecting Indicators” ............................................................................................... 11
Conducting a Qualitative Review ................................................................................................. 12
Sample Approach “Conducting a Qualitative Review” .......................................................................... 13
Conducting a Quantitative/Structured Review ............................................................................. 14
Correlation .......................................................................................................................................... 14
Statistical process control ................................................................................................................... 14
Causal Analysis ................................................................................................................................... 15
Using and Refining ....................................................................................................................... 16
Using the Selected Leading Indicator ..................................................................................................... 16
Collecting Data on Leading Indicator Usage/Management .................................................................... 17
Refining Family of Leading Indicators ................................................................................................... 18
Conclusion .................................................................................................................................... 18
Bibliography ................................................................................................................................. 20
Appendices .................................................................................................................................... 20
Figure 1: A Familiar Data Source................................................................................................. 4 Figure 2: Process Flow for Developing Leading Indicators ......................................................... 5

EFCOG Guidance Document: Development of Leading Indicators
October 15, 2010
3
Figure 3: Critical Success Factors ................................................................................................ 6 Figure 4: The Gut Check ............................................................................................................... 6 Figure 5: Sample Approach – Partial List of R&D Occurrences ................................................. 7 Figure 6: Quad Chart Template .................................................................................................... 9 Figure 7: Analysis of Inputs and Outputs .................................................................................... 10 Figure 8: Brainstorming Activity ................................................................................................. 10 Figure 9: Sample Approach - Risk Area Identification ............................................................... 11 Figure 10: Qualitative Review of Metrics ................................................................................... 12 Figure 11: Sample Approach – Qualitative Review .................................................................... 13 Figure 12: Control Chart............................................................................................................. 14 Figure 13: Using the Leading Indicator to Influence Outcome .................................................. 16 Figure 14: Evaluation of Indicator Commentary ........................................................................ 18
EFCOG Guidance Document: Development of Leading Indicators
October 15, 2010
4
Overview
This document provides guidance in developing and using leading indicators for the Energy Facility Contractors Group (EFCOG). The initiative originated in March 2010 as collaboration between Los Alamos National Laboratory (LANL), Sandia National Laboratory (SNL), and Lawrence Livermore National Laboratory (LLNL). Since that time, the wider EFCOG community has provided feedback, leading indicator examples, and other guidance to improve the document. The purpose of this guidance is to describe an approach for developing leading indicators that is broadly applicable across sites and helps managers to more effectively and efficiently manage their operations. Note this is intended to be a living document. Appendix 1 provides a template for EFCOG facilities to develop or submit examples of leading indicators.
Leading Indicator Discussion
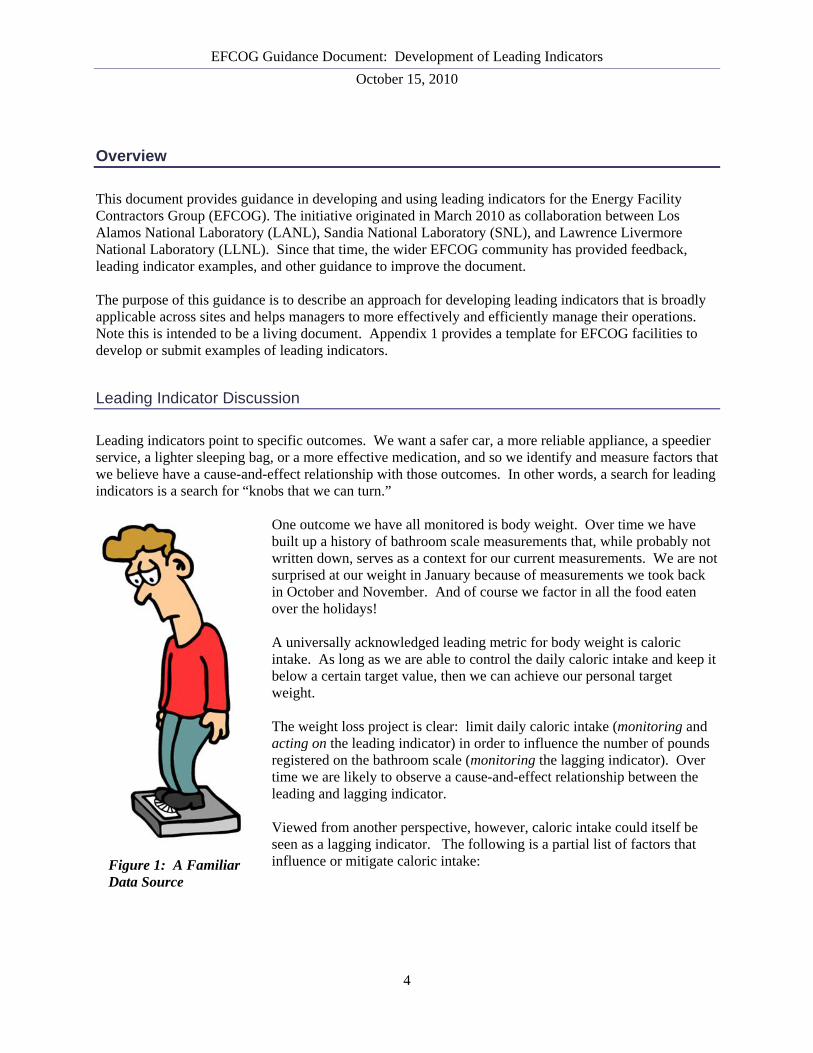
Leading indicators point to specific outcomes. We want a safer car, a more reliable appliance, a speedier service, a lighter sleeping bag, or a more effective medication, and so we identify and measure factors that we believe have a cause-and-effect relationship with those outcomes. In other words, a search for leading indicators is a search for “knobs that we can turn.”
One outcome we have all monitored is body weight. Over time we have built up a history of bathroom scale measurements that, while probably not written down, serves as a context for our current measurements. We are not surprised at our weight in January because of measurements we took back in October and November. And of course we factor in all the food eaten over the holidays! A universally acknowledged leading metric for body weight is caloric intake. As long as we are able to control the daily caloric intake and keep it below a certain target value, then we can achieve our personal target weight. The weight loss project is clear: limit daily caloric intake (monitoring and acting on the leading indicator) in order to influence the number of pounds registered on the bathroom scale (monitoring the lagging indicator). Over time we are likely to observe a cause-and-effect relationship between the leading and lagging indicator. Viewed from another perspective, however, caloric intake could itself be seen as a lagging indicator. The following is a partial list of factors that influence or mitigate caloric intake:
Figure 1: A Familiar Data Source
EFCOG Guidance Document: Development of Leading Indicators
October 15, 2010
5
Daily consumption of fast food Daily exercise level Number of hours worked per week Frequency of family stress events (e.g., deaths, births, job changes)
These examples point to a few peculiarities about leading indicators: they may serve as lagging indicators in other cause-and-effect relationships. And they must be actionable in order to be effective. It does nobody any good to record measurements without taking further action. To sum up, here are a few basic principles of leading indicators:
• Predictive of and able to influence future performance • May themselves be lagging indicators in other contexts • Demonstrate a cause-and-effect relationship with a particular outcome: “knobs” that we can turn • Can’t exist in isolation – decision makers need to use them in order to influence an outcome • Often attached to process elements • Leading indicators need only be developed for measures that truly matter
Process Introduction
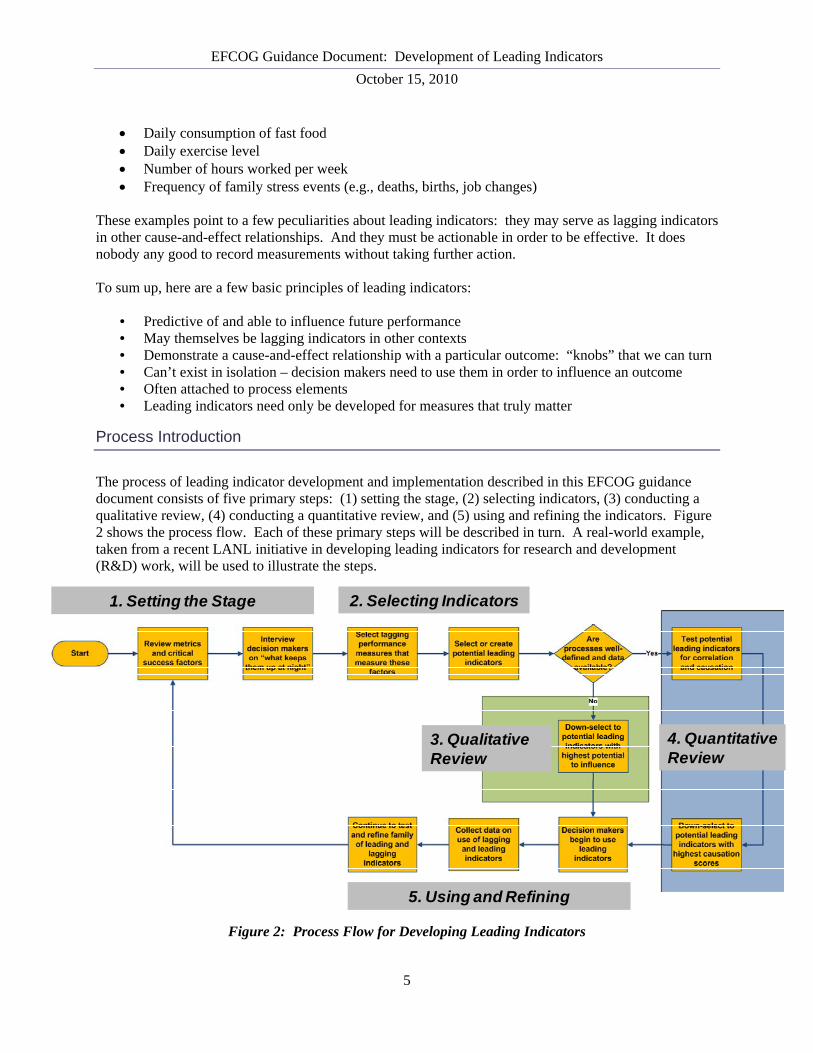
The process of leading indicator development and implementation described in this EFCOG guidance document consists of five primary steps: (1) setting the stage, (2) selecting indicators, (3) conducting a qualitative review, (4) conducting a quantitative review, and (5) using and refining the indicators. Figure 2 shows the process flow. Each of these primary steps will be described in turn. A real-world example, taken from a recent LANL initiative in developing leading indicators for research and development (R&D) work, will be used to illustrate the steps.
Figure 2: Process Flow for Developing Leading Indicators
1. Setting the Stage 2. Selecting Indicators
5. Using and Refining
3. Qualitative Review
4. Quantitative Review

EFCOG Guidance Document: Development of Leading Indicators
October 15, 2010
6
Setting the Stage
The process of developing leading indicators starts with two complementary steps: reviewing the site hierarchy of measures and interviewing decision makers on “what keeps them awake at night.” The first step is a logic check; the second is a gut check. Together, these two steps provide a basis for the search for leading indicators and help to ensure that they are relevant for the organization. Figures 3 and 4 illustrate the steps.
Reviewing the Metric Hierarchy
There are a variety of measurement frameworks: balanced scorecards, dashboards, enterprise models, status panels, strategy maps, etc. Whatever the framework, developers should place the search for leading indicators within the existing measure structure. The following questions may be asked: What are the key success factors for the organization? Have goals, key deliverables, multiyear strategy, customer input, etc. been incorporated? How well do these success factors translate into the family of metrics? Are risk factors (those elements that could harm the key success factors) represented? Does each tier contain what is necessary and sufficient for the tier above? Where do any potential leading indicators fit into this family
of metrics? The reasons for this exercise are as follows: it is pointless to identify leading indicators for insignificant outcomes, and it is crucial to identify what management considers important. Fitting the search for indicators within the overall set of critical success factors serves as a kind of insurance for an effective search. Also, the existing structure may be a timesaver and provide candidates for leading or lagging indicators.
Interviewing Decision Makers about What Keeps Them Awake at Night
In addition to testing the dashboard structure, developers should directly solicit from the line manager key work, goals, and risk areas and answers to the question “what
keeps you awake at night?” Some of this information may be more topical than what is represented in the metric dashboard. For example, the manager may be concerned about recent staff turnover or funding
Figure 3: Critical Success Factors
Figure 4: The Gut Check
EFCOG Guidance Document: Development of Leading Indicators
October 15, 2010
7
shortfalls that could have an adverse impact on deliverables. Or a new set of environmental requirements may test the ability of the manager and workforce to complete work within regulations. This emerging information may lead to a revised understanding of the critical success factors represented in the metric hierarchy and influence the search for lagging and leading indicators.
Sample Approach “Setting the Stage”
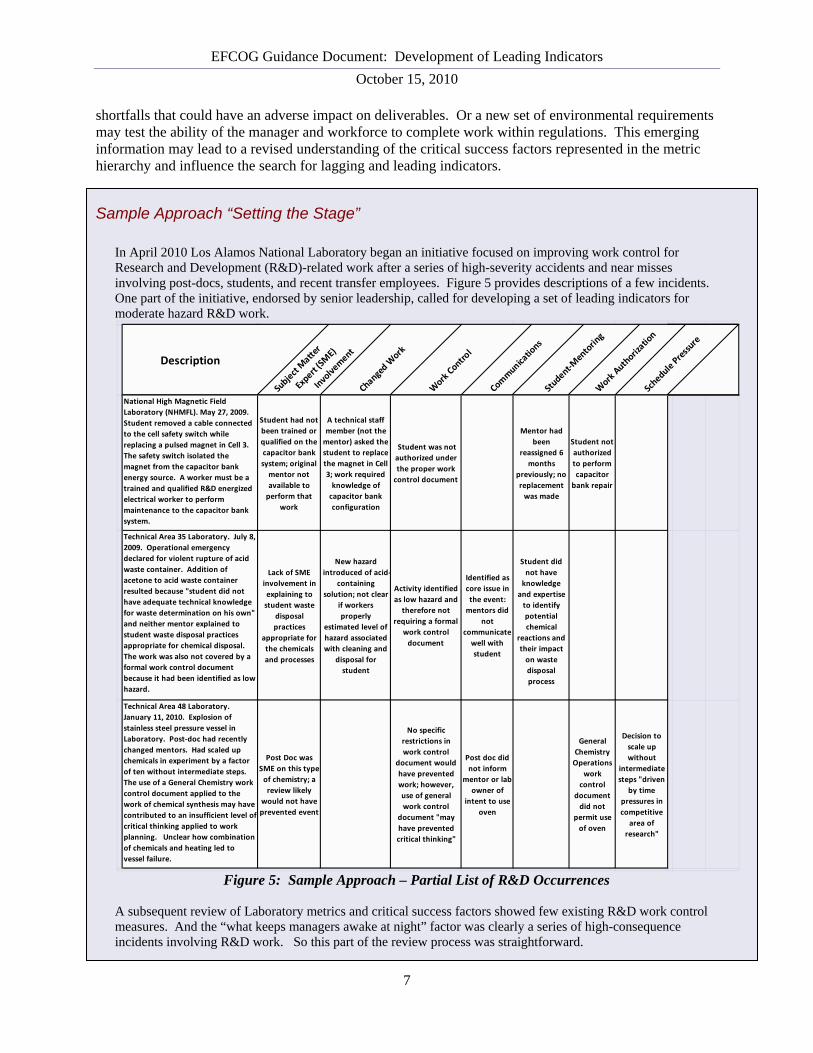
In April 2010 Los Alamos National Laboratory began an initiative focused on improving work control for Research and Development (R&D)-related work after a series of high-severity accidents and near misses involving post-docs, students, and recent transfer employees. Figure 5 provides descriptions of a few incidents. One part of the initiative, endorsed by senior leadership, called for developing a set of leading indicators for moderate hazard R&D work.
Figure 5: Sample Approach – Partial List of R&D Occurrences
A subsequent review of Laboratory metrics and critical success factors showed few existing R&D work control measures. And the “what keeps managers awake at night” factor was clearly a series of high-consequence incidents involving R&D work. So this part of the review process was straightforward.
Description
Subject Matter
Expert (SME)
Involvement
Changed Work
Work Control
Communications
Student‐M
entoring
Work Authorization
Schedule Pressure
National High Magnetic Field
Laboratory (NHMFL). May 27, 2009.
Student removed a cable connected
to the cell safety switch while
replacing a pulsed magnet in Cell 3.
The safety switch isolated the
magnet from the capacitor bank
energy source. A worker must be a
trained and qualified R&D energized
electrical worker to perform
maintenance to the capacitor bank
system.
Student had not
been trained or
qualified on the
capacitor bank
system; original
mentor not
available to
perform that
work
A technical staff
member (not the
mentor) asked the
student to replace
the magnet in Cell
3; work required
knowledge of
capacitor bank
configuration
Student was not
authorized under
the proper work
control document
Mentor had
been
reassigned 6
months
previously; no
replacement
was made
Student not
authorized
to perform
capacitor
bank repair
Technical Area 35 Laboratory. July 8,
2009. Operational emergency
declared for violent rupture of acid
waste container. Addition of
acetone to acid waste container
resulted because "student did not
have adequate technical knowledge
for waste determination on his own"
and neither mentor explained to
student waste disposal practices
appropriate for chemical disposal.
The work was also not covered by a
formal work control document
because it had been identified as low
hazard.
Lack of SME
involvement in
explaining to
student waste
disposal
practices
appropriate for
the chemicals
and processes
New hazard
introduced of acid‐
containing
solution; not clear
if workers
properly
estimated level of
hazard associated
with cleaning and
disposal for
student
Activity identified
as low hazard and
therefore not
requiring a formal
work control
document
Identified as
core issue in
the event:
mentors did
not
communicate
well with
student
Student did
not have
knowledge
and expertise
to identify
potential
chemical
reactions and
their impact
on waste
disposal
process
Technical Area 48 Laboratory.
January 11, 2010. Explosion of
stainless steel pressure vessel in
Laboratory. Post‐doc had recently
changed mentors. Had scaled up
chemicals in experiment by a factor
of ten without intermediate steps.
The use of a General Chemistry work
control document applied to the
work of chemical synthesis may have
contributed to an insufficient level of
critical thinking applied to work
planning. Unclear how combination
of chemicals and heating led to
vessel failure.
Post Doc was
SME on this type
of chemistry; a
review likely
would not have
prevented event
No specific
restrictions in
work control
document would
have prevented
work; however,
use of general
work control
document "may
have prevented
critical thinking"
Post doc did
not inform
mentor or lab
owner of
intent to use
oven
General
Chemistry
Operations
work
control
document
did not
permit use
of oven
Decision to
scale up
without
intermediate
steps "driven
by time
pressures in
competitive
area of
research"

EFCOG Guidance Document: Development of Leading Indicators
October 15, 2010
8
Selecting Indicators
The process of indicator selection falls naturally into two groups, lagging and leading. Lagging metrics characterize the important outcomes we are monitoring for the organization: for example, key product deliverables, vital services, strategic targets, staffing targets, and core capabilities. Leading indicators are those actionable metrics that are expected to influence and predict those outcomes.
Selecting Lagging Indicators
One characteristic of lagging indicators is they are often easy to select. They are frequently part of our corporate Dashboards, since the outcomes are obvious and are present in the minds of decision makers. As noted before, the selection of lagging indicators should emerge from the critical success factors and decision-maker interviews about “what keeps you up night.” Here are a few pitfalls to avoid:
Because-we-have-the-data metrics. Many lagging metrics are longstanding and use well-established data sources. However, they may no longer fit the latest set of critical success factors and should be modified to meet the current needs of decision makers.
Spread-the-love metrics. Some indicators are in dashboards only because they reliably display a positive aspect of organizational performance, i.e., showing perpetual green status. Be wary of these metrics; they may have too much slop in performance ranges or may not truly represent critical success factors.
No-benchmark-in-sight metrics. Metrics sometimes fail because not enough work or research
has been done in benchmarking targets. Identifying useful external benchmarks or industry standards set by outside organizations may help in developing a more realistic target or set of performance ranges. Care should be exercised in identifying similar activities or operations for the benchmarks.
Too-many-metrics problem. Decision makers may be swamped by a dashboard with too many
metrics. Organizations should spend as much effort in prioritizing and deselecting as they do in compiling metrics. Otherwise significant performance may be masked by metric clutter. It may be possible to scale the number of metrics, too, by the judicious use of index metrics.
Everything-and-the-kitchen-sink index. This is the flawed counterpart to the too-many-metrics
problem. Indexes that combine too many data metrics into a single index can mask performance at lower levels. As much as possible, keep the underlying data metrics to an intelligible set; a good rule of thumb is five or less data metrics for a given index.
The bottom-line question that a lagging indicator should answer is “Is this metric measuring an outcome that my decision makers believe is important?” If the answer is yes, it should be kept. If not, it should be eliminated.
EFCOG Guidance Document: Development of Leading Indicators
October 15, 2010
9
Selecting Leading Indicators
Selecting leading indicators can be a thorny process. It is often hard to identify leading indicators that will have a true cause-and-effect relationship with a particular lagging indicator. Multiple reasons may underlie these difficulties: causes of lagging-indicator performance are poorly understood, underlying processes are not well defined, it is too costly to collect the needed data, or measure ownership is shared across organizational or functional boundaries. This section describes a series of analytical and brainstorming activities that can be performed in selecting leading indicators. Note that even after analyses have been performed and metrics selected, the cause-and-effect relationship between the leading and lagging indicators is only assumed. It needs to be tested by acting on the leading indicators and monitoring their effect on the lagging indicators.
Quad Chart Analysis
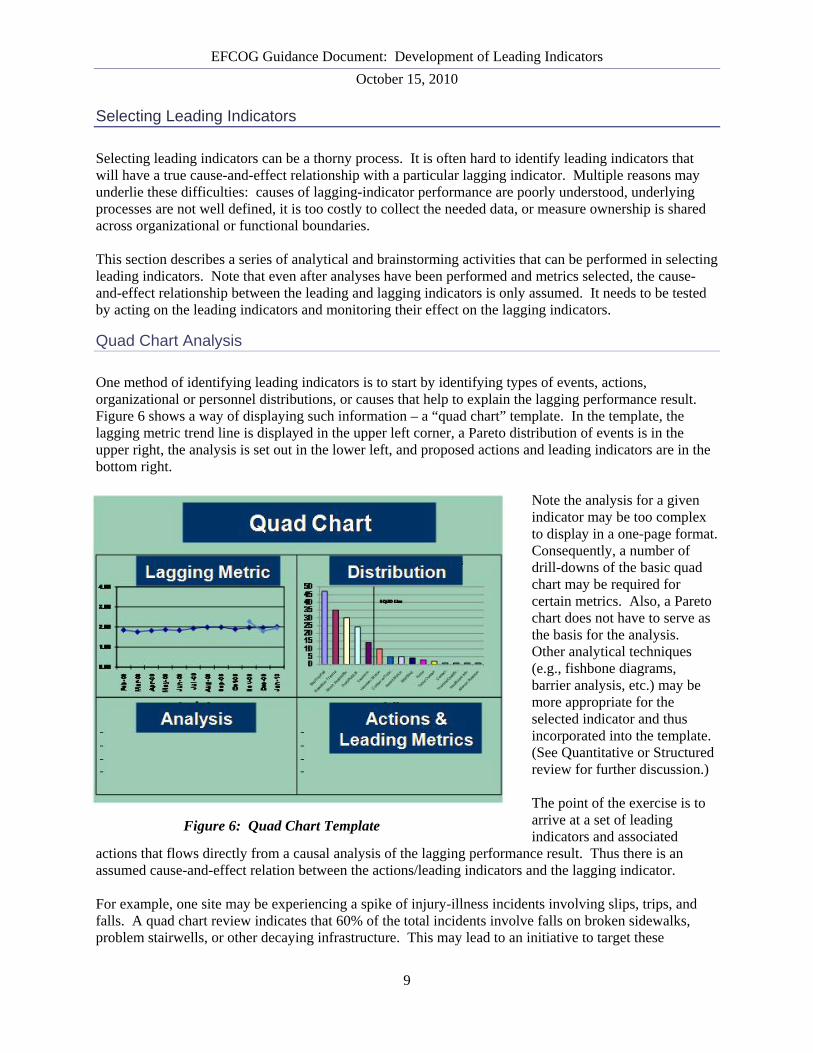
One method of identifying leading indicators is to start by identifying types of events, actions, organizational or personnel distributions, or causes that help to explain the lagging performance result. Figure 6 shows a way of displaying such information – a “quad chart” template. In the template, the lagging metric trend line is displayed in the upper left corner, a Pareto distribution of events is in the upper right, the analysis is set out in the lower left, and proposed actions and leading indicators are in the bottom right.
Note the analysis for a given indicator may be too complex to display in a one-page format. Consequently, a number of drill-downs of the basic quad chart may be required for certain metrics. Also, a Pareto chart does not have to serve as the basis for the analysis. Other analytical techniques (e.g., fishbone diagrams, barrier analysis, etc.) may be more appropriate for the selected indicator and thus incorporated into the template. (See Quantitative or Structured review for further discussion.) The point of the exercise is to arrive at a set of leading indicators and associated
actions that flows directly from a causal analysis of the lagging performance result. Thus there is an assumed cause-and-effect relation between the actions/leading indicators and the lagging indicator. For example, one site may be experiencing a spike of injury-illness incidents involving slips, trips, and falls. A quad chart review indicates that 60% of the total incidents involve falls on broken sidewalks, problem stairwells, or other decaying infrastructure. This may lead to an initiative to target these
Figure 6: Quad Chart Template

EFCOG Guidance Document: Development of Leading Indicators
October 15, 2010
10
particular infrastructure items for repair or replacement; decision-makers then develop metrics that monitor the completion of the improvement process across the site. In this way, a quad chart review (or similar causal or analytical process) can be helpful in developing actionable leading indicators.
Process Analysis
Another method for identifying potential leading indicators is to conduct a process analysis by examining key inputs and outputs. An output is a desired set of deliverables or outcomes. Inputs are those resources that are necessary to achieve the target outcomes. As shown in Figure 7, the outputs may be important products, service results, or regulatory compliance results. Inputs may be related to workforce elements, facilities or equipment, and programs or other key resources. For example, although it has no current problem producing ten widgets per year, an organization realizes that it must invest significant additional resources to recruit, train, and qualify new staff to continue to meet this goal. Decision-makers therefore develop leading indicators that target this workforce element that puts future deliverables at risk. Resources thus become drivers of the correct products and are a natural source of leading indicators. In this way, a process-oriented analysis is useful because the inputs become a source of leading indicators for the outputs, the lagging indicators.
Brainstorming
Brainstorming is a key tool for identifying leading indicators. The most obvious rule for successful brainstorming is to enlist the right set of people: invite those subject-matter experts, line managers, and other stakeholders who are knowledgeable of the target activity, process, or organization. The following are additional suggestions:
Advertise the session as a brainstorming activity
Send out any quad charts, process analysis, benchmarking, or other analytical products before the meeting so that participants can “do their homework”
Ground the session in identified critical success factors, i.e., what management considers important
Figure 7: Analysis of Inputs and Outputs
Leading indicators Lagging Indicators
ProcessInput Output
Resources
Conduct operations and research to achieve mission objectives
Deliverables
•Workforce •Right product
•Facilities and equipment
•On-time and Efficient
•Programs •Compliant
Figure 8: Brainstorming Activity
KEY
EFCOG Guidance Document: Development of Leading Indicators
October 15, 2010
11
Use both a facilitator and a recorder during the meeting Write down suggested indicators on a whiteboard, index cards, or flipchart (shown in Figure 8) Ask participants “What sorts of resources are necessary to achieve this target . . .” Keep the brainstorming separate from metric down-selection
If the session loses momentum, it may be helpful to review the previously developed analytical products and use them as a springboard for discussion. Don’t be overly concerned about grounding the discussion in a review of effectiveness, cost, data collection, or other difficulties at this point. The goal of the exercise is to identify possible metrics without too much “editorial mind” being present.
Sample Approach “Selecting Indicators”
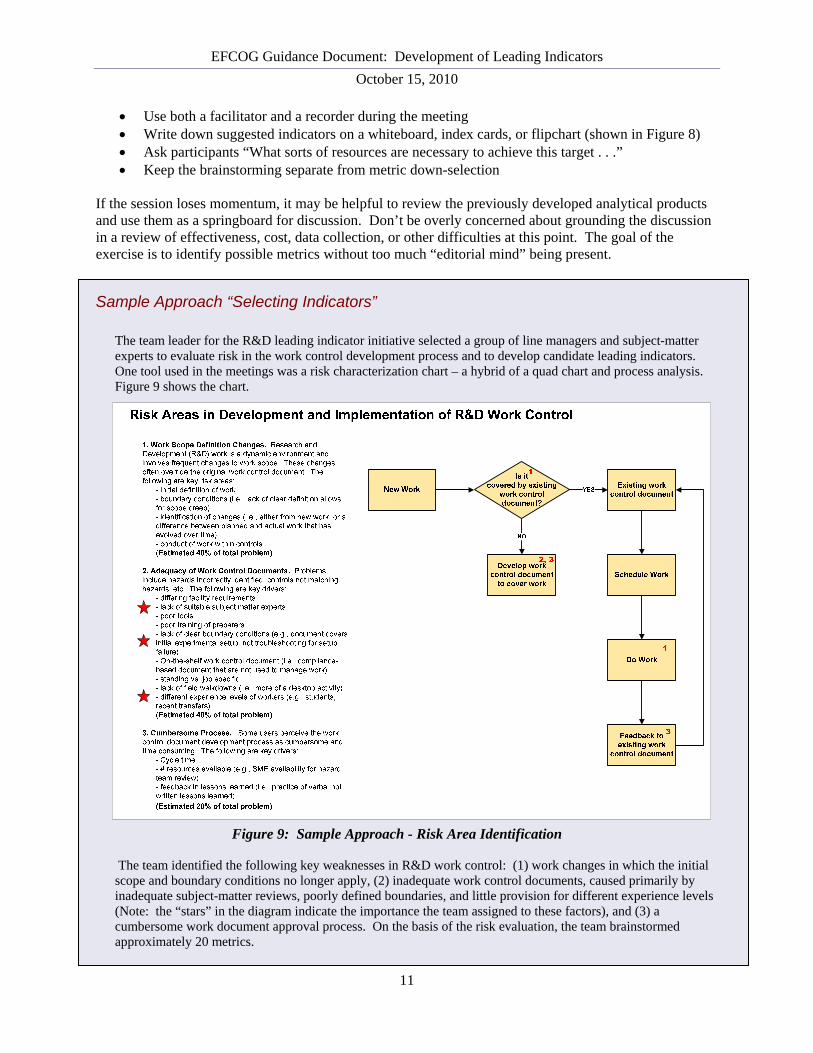
The team leader for the R&D leading indicator initiative selected a group of line managers and subject-matter experts to evaluate risk in the work control development process and to develop candidate leading indicators. One tool used in the meetings was a risk characterization chart – a hybrid of a quad chart and process analysis. Figure 9 shows the chart.
The team identified the following key weaknesses in R&D work control: (1) work changes in which the initial scope and boundary conditions no longer apply, (2) inadequate work control documents, caused primarily by inadequate subject-matter reviews, poorly defined boundaries, and little provision for different experience levels (Note: the “stars” in the diagram indicate the importance the team assigned to these factors), and (3) a cumbersome work document approval process. On the basis of the risk evaluation, the team brainstormed approximately 20 metrics.
Figure 9: Sample Approach - Risk Area Identification
EFCOG Guidance Document: Development of Leading Indicators
October 15, 2010
12
Conducting a Qualitative Review
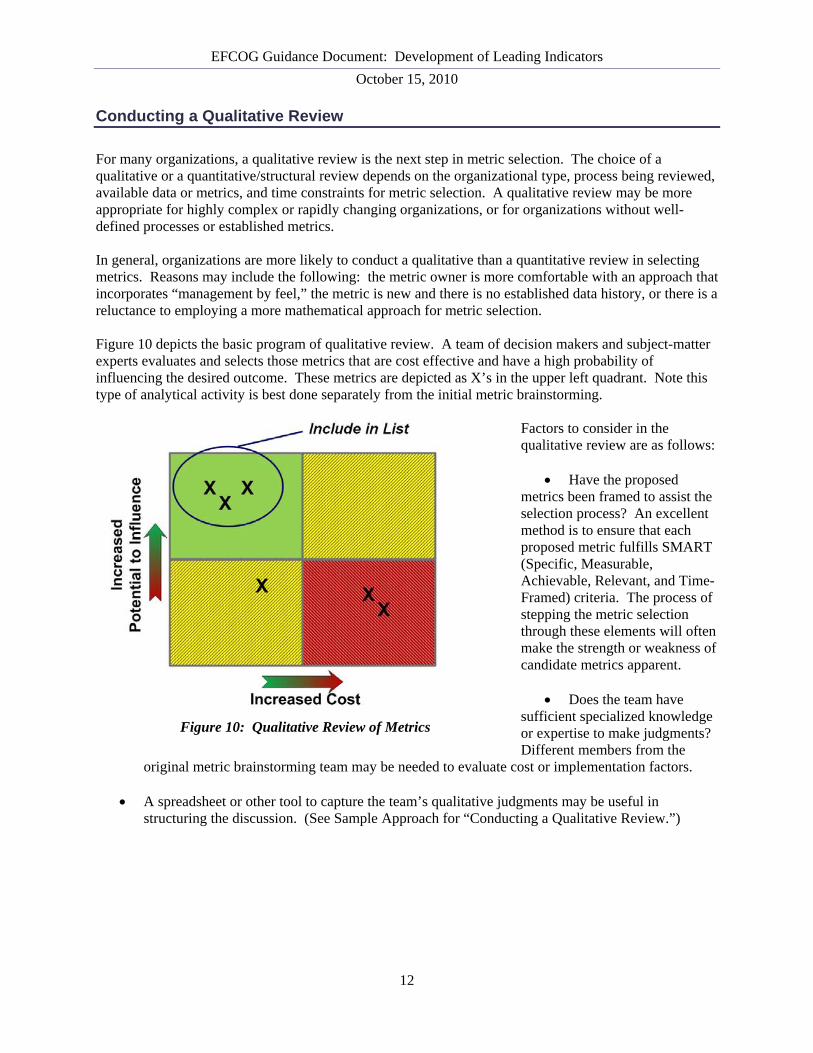
For many organizations, a qualitative review is the next step in metric selection. The choice of a qualitative or a quantitative/structural review depends on the organizational type, process being reviewed, available data or metrics, and time constraints for metric selection. A qualitative review may be more appropriate for highly complex or rapidly changing organizations, or for organizations without well-defined processes or established metrics. In general, organizations are more likely to conduct a qualitative than a quantitative review in selecting metrics. Reasons may include the following: the metric owner is more comfortable with an approach that incorporates “management by feel,” the metric is new and there is no established data history, or there is a reluctance to employing a more mathematical approach for metric selection. Figure 10 depicts the basic program of qualitative review. A team of decision makers and subject-matter experts evaluates and selects those metrics that are cost effective and have a high probability of influencing the desired outcome. These metrics are depicted as X’s in the upper left quadrant. Note this type of analytical activity is best done separately from the initial metric brainstorming.
Factors to consider in the qualitative review are as follows:
Have the proposed metrics been framed to assist the selection process? An excellent method is to ensure that each proposed metric fulfills SMART (Specific, Measurable, Achievable, Relevant, and Time-Framed) criteria. The process of stepping the metric selection through these elements will often make the strength or weakness of candidate metrics apparent.
Does the team have sufficient specialized knowledge or expertise to make judgments? Different members from the
original metric brainstorming team may be needed to evaluate cost or implementation factors.
A spreadsheet or other tool to capture the team’s qualitative judgments may be useful in structuring the discussion. (See Sample Approach for “Conducting a Qualitative Review.”)
Figure 10: Qualitative Review of Metrics
EFCOG Guidance Document: Development of Leading Indicators
October 15, 2010
13
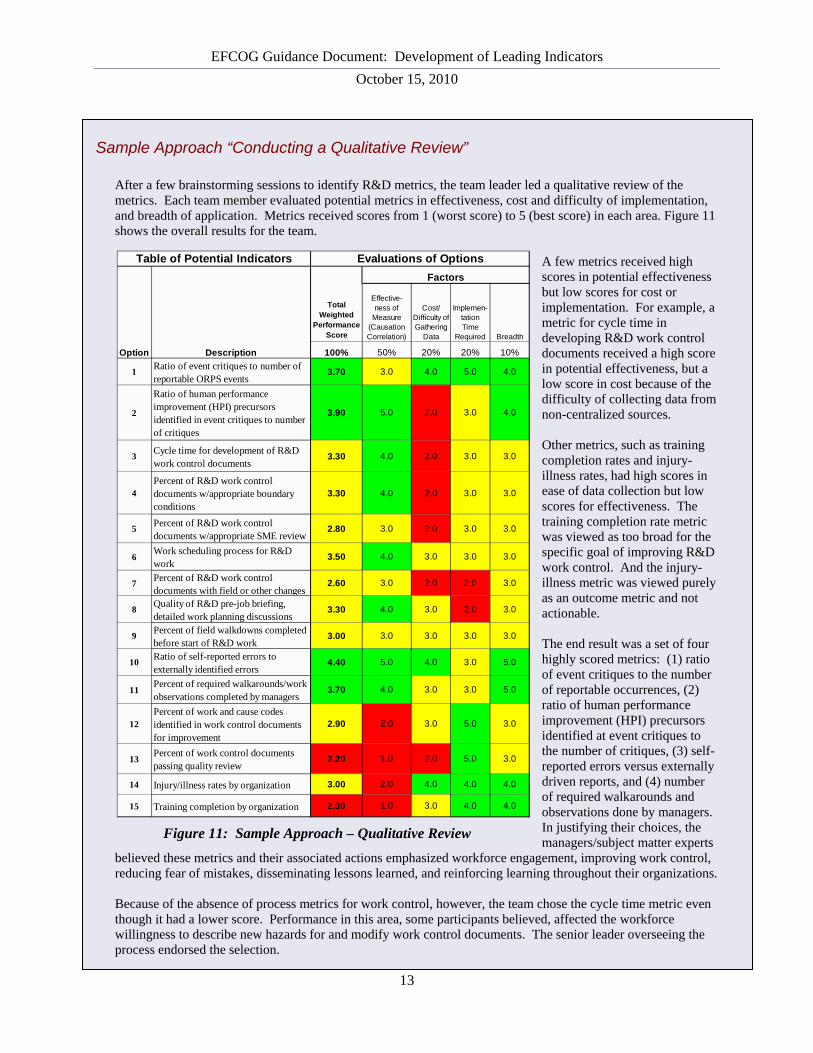
Sample Approach “Conducting a Qualitative Review” After a few brainstorming sessions to identify R&D metrics, the team leader led a qualitative review of the metrics. Each team member evaluated potential metrics in effectiveness, cost and difficulty of implementation, and breadth of application. Metrics received scores from 1 (worst score) to 5 (best score) in each area. Figure 11 shows the overall results for the team.
A few metrics received high scores in potential effectiveness but low scores for cost or implementation. For example, a metric for cycle time in developing R&D work control documents received a high score in potential effectiveness, but a low score in cost because of the difficulty of collecting data from non-centralized sources. Other metrics, such as training completion rates and injury-illness rates, had high scores in ease of data collection but low scores for effectiveness. The training completion rate metric was viewed as too broad for the specific goal of improving R&D work control. And the injury-illness metric was viewed purely as an outcome metric and not actionable. The end result was a set of four highly scored metrics: (1) ratio of event critiques to the number of reportable occurrences, (2) ratio of human performance improvement (HPI) precursors identified at event critiques to the number of critiques, (3) self-reported errors versus externally driven reports, and (4) number of required walkarounds and observations done by managers. In justifying their choices, the managers/subject matter experts
believed these metrics and their associated actions emphasized workforce engagement, improving work control, reducing fear of mistakes, disseminating lessons learned, and reinforcing learning throughout their organizations.
Because of the absence of process metrics for work control, however, the team chose the cycle time metric even though it had a lower score. Performance in this area, some participants believed, affected the workforce willingness to describe new hazards for and modify work control documents. The senior leader overseeing the process endorsed the selection.
Figure 11: Sample Approach – Qualitative Review
Effective-ness of
Measure (Causation Correlation)
Cost/ Difficulty of Gathering
Data
Implemen-tation Time
Required Breadth
Option Description 100% 50% 20% 20% 10%
1Ratio of event critiques to number of reportable ORPS events
3.70 3.0 4.0 5.0 4.0
2
Ratio of human performance improvement (HPI) precursors identified in event critiques to number of critiques
3.90 5.0 2.0 3.0 4.0
3Cycle time for development of R&D work control documents
3.30 4.0 2.0 3.0 3.0
4Percent of R&D work control documents w/appropriate boundary conditions
3.30 4.0 2.0 3.0 3.0
5Percent of R&D work control documents w/appropriate SME review
2.80 3.0 2.0 3.0 3.0
6Work scheduling process for R&D work
3.50 4.0 3.0 3.0 3.0
7Percent of R&D work control documents with field or other changes
2.60 3.0 2.0 2.0 3.0
8Quality of R&D pre-job briefing, detailed work planning discussions
3.30 4.0 3.0 2.0 3.0
9Percent of field walkdowns completed before start of R&D work
3.00 3.0 3.0 3.0 3.0
10Ratio of self-reported errors to externally identified errors
4.40 5.0 4.0 3.0 5.0
11Percent of required walkarounds/work observations completed by managers
3.70 4.0 3.0 3.0 5.0
12Percent of work and cause codes identified in work control documents for improvement
2.90 2.0 3.0 5.0 3.0
13Percent of work control documents passing quality review
2.20 1.0 2.0 5.0 3.0
14 Injury/illness rates by organization 3.00 2.0 4.0 4.0 4.0
15 Training completion by organization 2.30 1.0 3.0 4.0 4.0
Total Weighted
Performance Score
Table of Potential Indicators Evaluations of Options
Factors
EFCOG Guidance Document: Development of Leading Indicators
October 15, 2010
14
Conducting a Quantitative/Structured Review
Quantitative/structured reviews of metrics may be more applicable to organizations that have well-established data histories and well-defined processes, e.g., manufacturing processes. Such formal reviews may be used to identify mathematical correlation or special types of causation between lagging and leading indicators. A complete discussion of mathematical and causal analyses is beyond the scope of this document. However, the following brief, non-exhaustive survey is offered.
Correlation
Correlation measures the degree of association between two variables. It is not a true measurement of causality: two variables can be highly correlated without being causally linked. An everyday example is alarm clocks ringing and roosters crowing. There is a high degree of correlation between the two data sets, but no causal relationship. One correlation test, called Pearson’s, is the most common measure of correlation and is expressed as a number between -1 and +1. The closer the value is to +1, the more an increase in one variable is associated with an increase in the other variable; the closer the value is to -1, the more an increase in one is associated with a decrease in the other. For the metric developer, a correlation test provides an indication of whether a leading indicator is even associated with the lagging indicator. Although it doesn’t describe causality, the test can provide confidence that the leading and lagging indicator may have a causal connection, or provide a justification for further analysis. They may be connected by an undiscovered third variable. The test could lead to a further causal exploration, experiments, or tests of causes for indicator performance. Aside from the Pearson’s test, there are a series of tests that encompass non-linear relationships: Spearman’s rank correlation, Kendall’s rank correlation, and multi-moment correlation.
Statistical process control
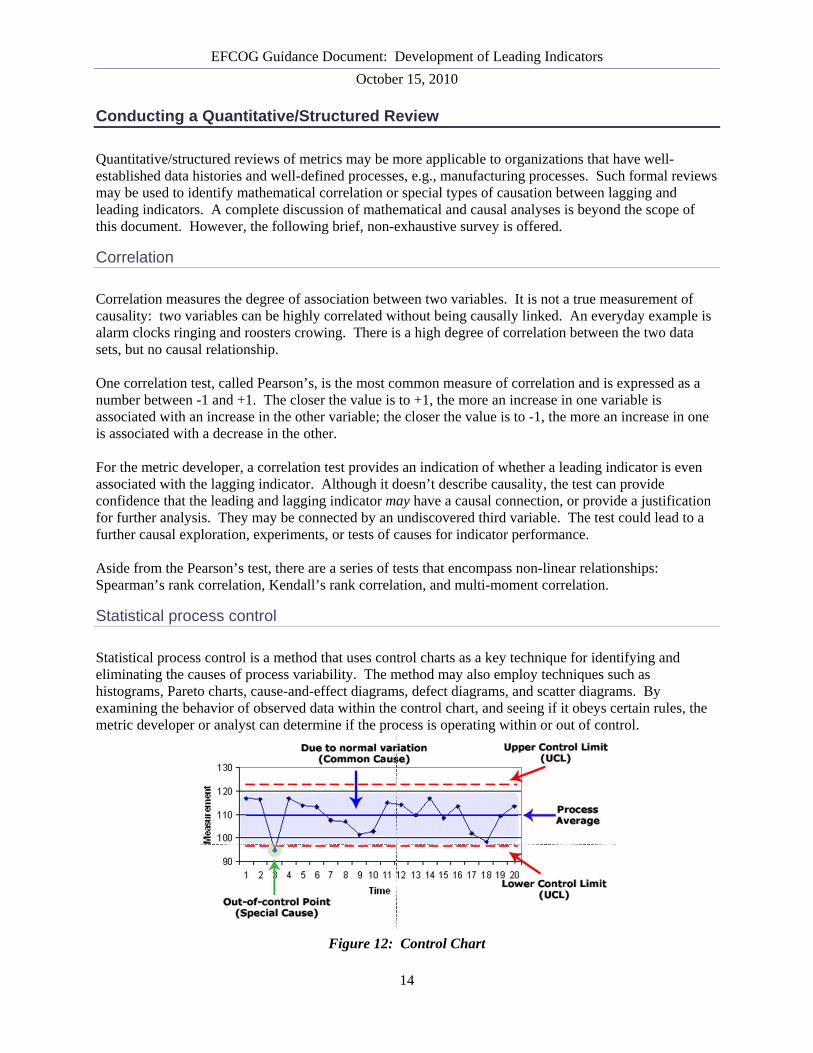
Statistical process control is a method that uses control charts as a key technique for identifying and eliminating the causes of process variability. The method may also employ techniques such as histograms, Pareto charts, cause-and-effect diagrams, defect diagrams, and scatter diagrams. By examining the behavior of observed data within the control chart, and seeing if it obeys certain rules, the metric developer or analyst can determine if the process is operating within or out of control.
Figure 12: Control Chart
EFCOG Guidance Document: Development of Leading Indicators
October 15, 2010
15
A typical control chart has upper and lower boundaries, called control limits, formed by lines two or three standard deviations on either side of the data average. Different sets of rules involving trends, collections of points, and points outside the control limit boundaries have evolved for control-chart applications. By applying the rules, an analyst can determine if the process is in or out of control and assign special causes for variation. As a causal discovery technique, statistical process control is applicable to both leading and lagging indicators and useful for finding performance drivers and data sets. It is most useful in organizational applications in which there are well-defined processes and established data histories such as production or zero-defect applications. There are a couple of reasons why statistical process control is more challenging for a nonmanufacturing setting: (1) many non-manufacturing operations do not have a natural measurement system, and (2) the system that needs improvement is not as obvious in a non-manufacturing setting. 7
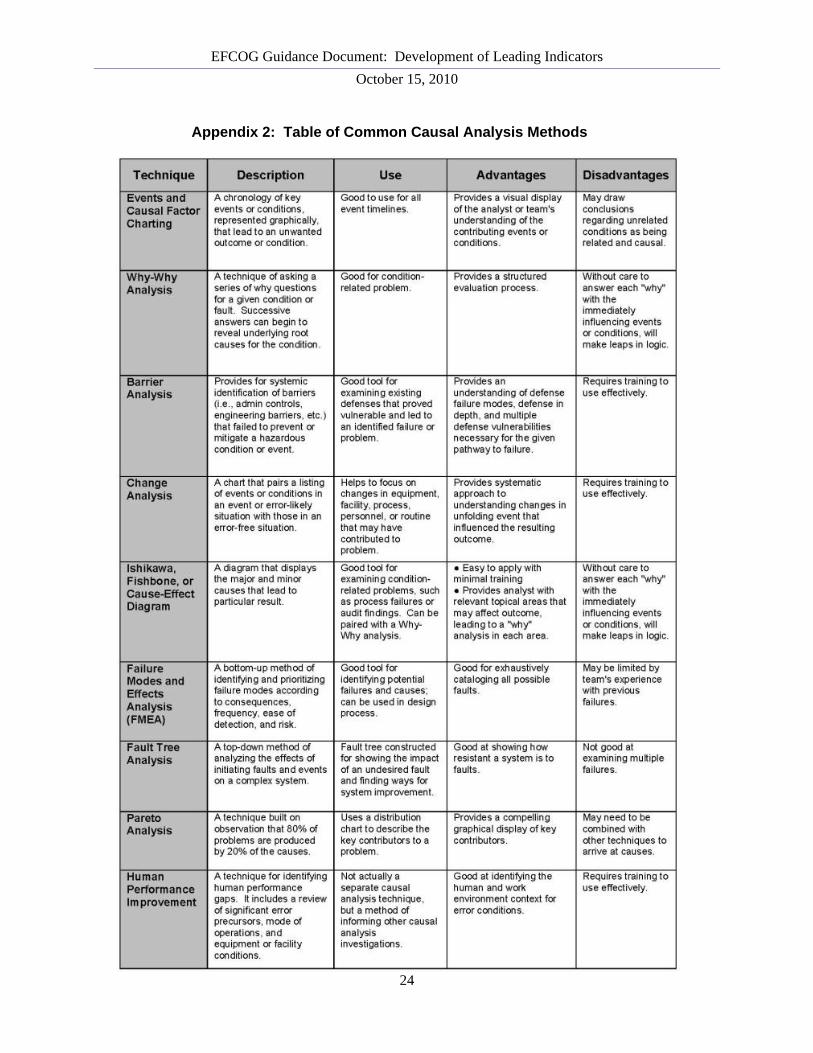
Causal Analysis
Causality is the relationship between two events. The first event is known as the cause and the second event is known as the effect and is presumed to be the consequence of the first event. Causality is not limited to events but can incorporate objects, processes, facts, properties and variables. There are numerous common methods for identifying causes of events and conditions: See Appendix 2 for a table of common methods and applications. In addition to these techniques, there are a few causal methods that have more of a quantitative orientation. The following is a brief discussion of five such models: directed acyclic graphs, causal loop diagrams, the Rubin causal model, design of experiments, and Granger analysis. Directed acyclic graphs (DAG), while not necessarily implying causation, have been used extensively in statistical and artificial intelligence applications in structuring time and causation variables. DAGs are not only appealing in that they can be constructed from judgment and knowledge of causal relationships, but they also permit response to external or spontaneous changes.
A causal loop diagram (CLD) is a diagram that aids in visualizing how interrelated variables affect one another. The diagram consists of a set of nodes representing the variables connected together. The relationships between these variables, represented by arrows, can be labeled as positive or negative. The Rubin Causal Model (RCM) is an approach to the statistical analysis of cause and effect based on the framework of potential outcomes. In general usage, design of experiments (DoE) or experimental design is the design of any information-gathering exercises where variation is present, whether under the full control of the experimenter or not. In the design of experiments, the experimenter is often interested in the effect of some process or intervention (the "treatment") on some objects (the "experimental units"), which may be people, parts of people, groups of people, plants, animals, etc. Design of experiments is thus a discipline that has very broad application across all the natural and social sciences.
The Granger causality test is a technique for determining whether one time series is useful in forecasting another. Ordinarily, regressions reflect "mere" correlations, but Clive Granger, who won a Nobel Prize in Economics, argued that there is an interpretation of a set of tests as revealing something about causality.

EFCOG Guidance Document: Development of Leading Indicators
October 15, 2010
16
A time series X is said to Granger-cause Y if it can be shown, usually through a series of F-tests on lagged values of X (and with lagged values of Y also known), that those X values provide statistically significant information about future values of Y. Granger testing is commonly used to look for causality in comparing economic data. There is a problem, however, in doing causal analysis of the relationships of leading to lagging indicators in a Performance Measurement Model (PMM). If decision makers use performance indicators as part of the decision making process, then those decisions will affect the future states of both leading and lagging indicators. This problem was described in one of the reference papers as “managers adapt the firm’s actions and the underlying production function to PMM and other feedback (hence, statistics are unstable)”15. In other words, products of management decisions introduce variability that affects the future measurement outcomes. As with the need to “control variability” in the design and implementation of experiments, it is important to do the same in the analysis of data for management decision making, lest the statistics become “unstable.” Causal analysis is still useful for understanding the individual states and trends of leading and lagging indicators in order to provide information useful to decision makers.
Using and Refining
Using and refining the selected indicators is the final stage of the leading indicator development process. In many ways, this stage is the most important because it indicates the degree to which an organization is invested in using the select metrics to monitor operations, develop actions, and improve processes.
Using the Selected Leading Indicator
Once the metric has been selected, the manager monitors the performance and selects actions to influence the desired outcome. If the metric produces the desired outcome, then the metric is retained and the data continues to be monitored. If the metric does not produce the desired outcome, then the metric is eliminated and a new search for leading indicators begins.
Figure 13: Using the Leading Indicator to Influence Outcome
0123456789
Leader Action Lagging Trend

EFCOG Guidance Document: Development of Leading Indicators
October 15, 2010
17
Figure 13 shows an instance of a leading indicator’s associated action that provides a distinct improvement in the trend line of the lagging indicator. In reality it can be more difficult to discern the impact of actions associated with a set of leading indicators.
Collecting Data on Leading Indicator Usage/Management
Managers and by extension the workforce should actively use the set of leading and lagging indicators to manage their activities. Data collected on the use of the leading indicators can be important in tracking this engagement. The following are a few suggestions for this type of data collection:
1. Dashboard population data. A metric showing that indicators are being populated on time is one indication that the metric is being used at a basic level. It answers the question: “Is the metric being used in a timely manner?” If not, then it indicates the selected metric is no longer relevant or a true critical success factor.
2. Commentary or action data. The end-game for a leading indicator is its association with organizational actions. Some dashboards provide mechanisms for tracking actions, or for providing commentary on the status of actions. Figure 14 provides one template for evaluating actions. Included are (1) a description of problem status, (2) identification of trends, (3) planned actions and timeline for completions, and (4) a general impact statement.
3. Metric review data. Annual quality reviews of metrics can identify whether metric descriptions,
weights, and other characteristics are current and being maintained. Such reviews can become a springboard for metric refinement and process improvement.
4. User data. Data on individual users, user organizations, and other data on usage of online
dashboards can be useful in determining how deep metric engagement is within a given organization.

EFCOG Guidance Document: Development of Leading Indicators
October 15, 2010
18
Figure 14: Evaluation of Indicator Commentary
Refining Family of Leading Indicators
Over time, the selected leading indicators should be reevaluated and revised, especially if there have been systemic changes to the working environment where they have been used. The achievement of major organizational or enterprise goals is an example of this type of change. These same changes should motivate decision makers to consider adding new leading indicators to help support future decision making, or eliminating those that no longer add value. While leading indicators remain in use, targets should also be adjusted periodically to reflect improvement goals. Using and refining the family of leading indicators maximizes their effectiveness as elements of a system that supports decision makers.
Conclusion
To be effective, organizational metrics need sustained care and feeding. Metrics that are not reviewed, that do not consider potential outcomes, that do not represent success factors, or that dry up from user neglect—are not worth having. So this paper ends with an idea. The idea is that an organization’s metrics, whether they are lagging or leading, should become part of routine thought experiments. Does this metric represent what management considers important? Are there better ways of representing success or risk? What type of causal analysis, logic evaluation, or thought process produced the metric? Has the organization brought together those stakeholders who can analyze performance and provide the best insights? These types of
Statement of Status & Problem.Provide a brief description of the status of the metric and the problem.
Action and Follow-up. Provide a description of any actions taken in response to the problem. Include dates, schedules, etc. when available.
Impact Statement. Include a statement about the general impact on the activity being measured.
Analysis. Analyze the problem and provide enough context so that the reader can understand the issues involved. Include any relevant trending information, numbers of events, duration of problem, etc.
This metric is red for this period due to a resource issue concerning instructor availability. The training center was heavily loaded during this past reporting period, and this impacted the training for XYZ tests. To make up for this deficiency, LANL has prioritized work for instructors and will make up this shortfall (esp. with respect to XYZ training) in the next reporting period. Training personnel are now reviewing schedules, scheduling methods, etc. to ensure this problem does not recur. An action report is due March 2007. The red performance for this period is an aberration in resource scheduling that will not have a long-term impact on the completion of XYZ tests.

EFCOG Guidance Document: Development of Leading Indicators
October 15, 2010
19
considerations can improve the leading and lagging indicators in our metric hierarchies and lead to process improvements.

EFCOG Guidance Document: Development of Leading Indicators
October 15, 2010
20
Bibliography
1. Bob Frost. Measuring Performance. Dallas: Measurement International, 2000. 2. Bob Frost. Designing Metrics. Dallas: Measurement International, 2007. 3. Mark Graham Brown. Keeping Score: Using the Right Metrics to Drive World-Class
Performance. New York: Quality Resources, 1996. 4. Robert Kaplan and David Norton. The Strategy-Focused Organization: How Balanced
Scorecard Companies Thrive in the New Business Environment. Boston: Harvard Business School Press, 2001.
5. Robert Kaplan and David Norton. The Balanced Scorecard: Translating Strategy into Action. Boston: Harvard Business School Press, 1996.
6. James Reason. Managing the Risks of Organizational Accidents. Hampshire: Ashgate, 1997. 7. Douglas Montgomery. Introduction to Statistical Quality Control. New York: John Wiley &
Sons, 2001. 8. David Freedman, Robert Pisani, Roger Purves, and Ani Adhikari. Statistics. New York: W.W.
Norton & Company, 1991. 9. Fred Manuele. Leading & Lagging Indicators. Professional Safety, 2009. 10. Los Alamos National Laboratory. Causal Analysis and Corrective Action Development.
Management Systems Procedures, 2010. 11. Paul Niven. Balanced Scorecard Step by Step: Maximizing Performance and Maintaining
Results. New York: John Wiley & Sons, 2002. 12. Dean Spitzer. Transforming Performance Measurement. New York: AMACOM, 2007. 13. Massachusetts Institute of Technology, INCOSE, and PSM. Systems Engineering Leading
Indicators Guide, Version 2.0. 2010. 14. Dave Olson. SRR Approach to Safety Management via Leading Indicators. 2010. 15. Mary A. Malina, Hanne S. O. Nørreklit and Frank H. Selto. Relations among Measures, Climate
of Control and Performance Measurement Models. Contemporary Accounting Research, 2006.
Appendices
Appendix 1: Template for Site Development of Leading Indicators Appendix 2: Table of Common Causal Analysis Methods Appendix 3: Leading Indicator Template
‘

EFCOG Guidance Document: Development of Leading Indicators
October 15, 2010
21
Appendix 1: Template for Site Development of Leading Indicators
Setting the Stage Metric Hierarchy
Area or Function (e.g. program/operation, supporting operations; assurance function)
What are the key success factors for the organization?
Have goals, key deliverables, multiyear strategy, customer input, etc. been incorporated?
How well do these success factors translate into the family of metrics?
Are risk factors (those elements that could harm the key success factors) represented?
Does each tier contain what is necessary and sufficient for the tier above?
Where do any potential leading indicators fit into this family of metrics?
Interview managers Name or role
What keeps you up at night?
Event or condition?
Contributors or causes?
Expected performance or behavior?
Priority?

EFCOG Guidance Document: Development of Leading Indicators
October 15, 2010
22
Appendix 1: Template for Site Development of Leading Indicators (cont.)
Selecting Indicators Potential lagging Indicators
Indicator for condition? Measurable (units)? Time frame (periodicity)?
Owner? Data Source? Dimensions (customer, organizations, objective, strategies)
Potential Leading Indicators Indicator for lagging indicator?
Measurable (units)? Time frame (periodicity)?
Owner? Data Source? Dimensions (customer, organizations, objective, strategies)
Qualitative Review
Down Select Potential leading Indicators Base evaluations available? (causal or process factors, type distributions, fishbone diagrams, Pareto charts)
Effectiveness?
Cost to gather data?
Time to implement?
Breadth or Scope?
EFCOG Guidance Document: Development of Leading Indicators
October 15, 2010
23
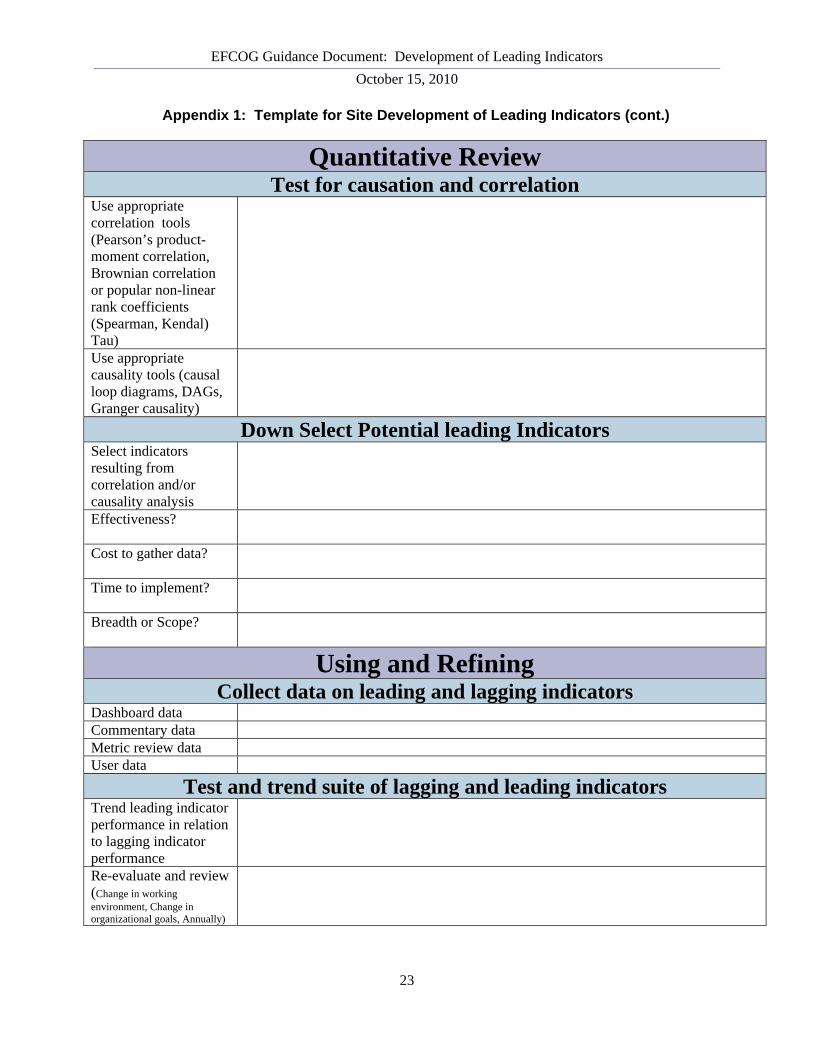
Appendix 1: Template for Site Development of Leading Indicators (cont.)
Quantitative Review
Test for causation and correlation Use appropriate correlation tools (Pearson’s product-moment correlation, Brownian correlation or popular non-linear rank coefficients (Spearman, Kendal) Tau)
Use appropriate causality tools (causal loop diagrams, DAGs, Granger causality)
Down Select Potential leading Indicators Select indicators resulting from correlation and/or causality analysis
Effectiveness?
Cost to gather data?
Time to implement?
Breadth or Scope?
Using and Refining
Collect data on leading and lagging indicators Dashboard data Commentary data Metric review data User data
Test and trend suite of lagging and leading indicators Trend leading indicator performance in relation to lagging indicator performance
Re-evaluate and review (Change in working environment, Change in organizational goals, Annually)
EFCOG Guidance Document: Development of Leading Indicators
October 15, 2010
24
Appendix 2: Table of Common Causal Analysis Methods
EFCOG Guidance Document: Development of Leading Indicators
October 15, 2010
25
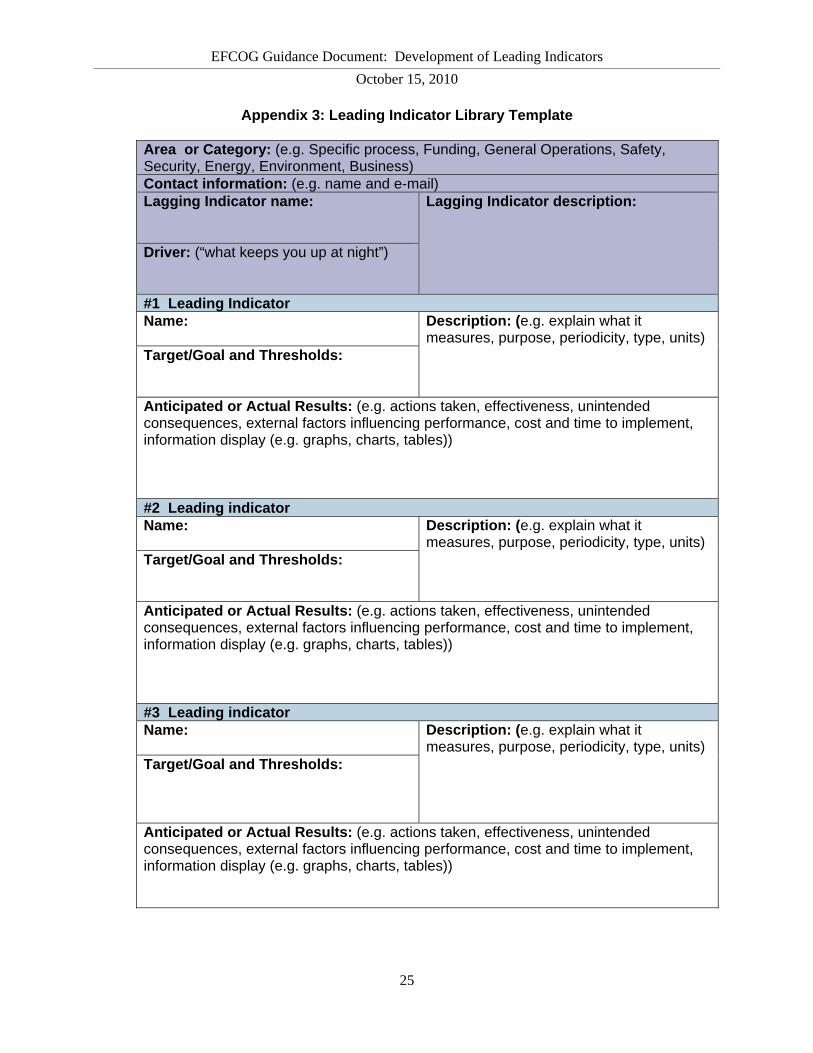
Appendix 3: Leading Indicator Library Template
Area or Category: (e.g. Specific process, Funding, General Operations, Safety, Security, Energy, Environment, Business) Contact information: (e.g. name and e-mail) Lagging Indicator name: Lagging Indicator description:
Driver: (“what keeps you up at night”)
#1 Leading Indicator Name:
Description: (e.g. explain what it measures, purpose, periodicity, type, units)
Target/Goal and Thresholds: Anticipated or Actual Results: (e.g. actions taken, effectiveness, unintended consequences, external factors influencing performance, cost and time to implement, information display (e.g. graphs, charts, tables)) #2 Leading indicator Name:
Description: (e.g. explain what it measures, purpose, periodicity, type, units)
Target/Goal and Thresholds: Anticipated or Actual Results: (e.g. actions taken, effectiveness, unintended consequences, external factors influencing performance, cost and time to implement, information display (e.g. graphs, charts, tables)) #3 Leading indicator Name:
Description: (e.g. explain what it measures, purpose, periodicity, type, units)
Target/Goal and Thresholds: Anticipated or Actual Results: (e.g. actions taken, effectiveness, unintended consequences, external factors influencing performance, cost and time to implement, information display (e.g. graphs, charts, tables))