effect of addition of plastic waste on engineering ... · key words: soil, plastic waste, direct...
TRANSCRIPT
International Research Journal of Engineering and Technology (IRJET) e-ISSN: 2395 -0056
Volume: 03 Issue: 11 | Nov -2016 www.irjet.net p-ISSN: 2395-0072
© 2016, IRJET | Impact Factor value: 4.45 | ISO 9001:2008 Certified Journal | Page 1085
Effect of addition of plastic waste on engineering properties of soil
Dr.S.Gangadhara1, Vivek.S 2, Ranganath3
1Associate Professor, Department of Civil Engineering, UVCE, Bangalore, India 2Assistant Professor, Department of Civil Engineering, JSSATE, Bangalore, India
3Post Graduate student, Department of Civil Engineering, UVCE, Bangalore, India ---------------------------------------------------------------------***---------------------------------------------------------------------
Abstract - This paper presents aspects on the improvements in the engineering properties of the soils by the use of plastic waste which is in the form of used plastic water bottles that are easily available, economical and a waste substance which has posed a problem for safe disposal.
Key Words: Soil, Plastic waste, Direct shear test, Static load 1. INTRODUCTION
Plastic and materials made with plastic have become the integral part of our day to day life in various stages and also in various forms, but then, the disposal and dumping of the used and unwanted plastic has become a major threat for the civilized society, as the production and usage of new plastic and plastic associated materials are not in balance with its recycling recycled plastic products status.
Despite the ban in some Indian states, the use of plastic products, such as polythene bags, bottles, containers, and packaging strips, is increasing by leaps and bounds. As a result, open waste dumps are continuously filling up with this valuable resource. In many areas waste plastic is collected for recycling and reuse; however, the success of any recycling program will depend on the secondary market for waste plastic. At present, only a fraction of all waste plastic is used for recycling purposes. The recycled plastics today are commercially available now a days in various forms and states, which actually can be very effectively used up for various purposes. One of the best ways to handle the increasing pressure of waste plastic on open dumps will be to utilize it for ground improvement after shredding.
As it is known beverage industry is one of the fastest growing industries in the world and with in which the Bottled water is one of the major key player. According to the international bottled water association (IBWA), sales of bottled water have increased by 500 percent over the last decade and 1.5 million tons of plastic are used to bottle water every year. Plastic bottle recycling has not kept pace with the dramatic increase in virgin resin polyethylene terephthalate (PET) sales and the aspect of reduce / reuse / recycle, has emerged as the one that needs to be given prominence. The general survey shows that 1500 bottles are dumped as garbage every second. PET is reported as one of the most abundant plastics in solid urban waste whose effective reuse/recycling is one of the critical issue which needs immediate attention.
After the concept of reinforced soil was first given by Vidal of France in 1966. Since then significant advances have been made in the design and construction of geotechnical structures such as retaining walls, foundations, embankments, pavements, etc. In compaction with systematically reinforced soil, randomly distributed fibre reinforced soils exhibit some advantages. Randomly reinforcing the soil by using plastic strips obtained from waste plastic bottles may provide an easy and an economical means to improve the engineering performance of existing soil.
With the growth of cities and industrial areas the availability of land for construction with sufficient bearing capacity and settlement within permissible limit becomes depleted. The geotechnical engineers have been forced to construct at given site with given soil condition. Among the various alternatives, for strengthening the existing weak soil, reinforcing the soils with some additive elements is one such successful alternative.
In this present study, attempt has been made to use waste plastic bottle strips as a reinforcing element to improve the engineering properties of the soil, especially with respect to shear strength and load carrying capacity.
2. Materials
In today’s rapid growth of infrastructural facilities and construction industry, we are running with absolute scarcity for construction space and this scarcity has forced up to make use of each and every small stretch of land area that is available for construction and due to this changed scenario, there is a need to upgrade the construction activities as areas even with poor subsoil conditions can’t be abandoned and alternate measures for fruitfull usage of the space had to be planned up. So when sites with soils possessing lower Bearing capacities are encountered and when the loose sand in the site is having very low and whose settlement is high. Instead of using other costly alternatives like pile foundations, shallow foundation can be effectively provided by improving the properties of sand by strengthening it with shredded plastic strips around the footing.
In the present investigation poorly graded sand added with shredded plastic strips are used for the experimental procedures. This chapter presents the details about the material characteristics and the procedures adopted for carrying out direct shear tests and static load tests.
The materials used for the present study are uniformly graded sand or poorly graded sand, plastic strips
International Research Journal of Engineering and Technology (IRJET) e-ISSN: 2395 -0056
Volume: 03 Issue: 11 | Nov -2016 www.irjet.net p-ISSN: 2395-0072
© 2016, IRJET | Impact Factor value: 4.45 | ISO 9001:2008 Certified Journal | Page 1086
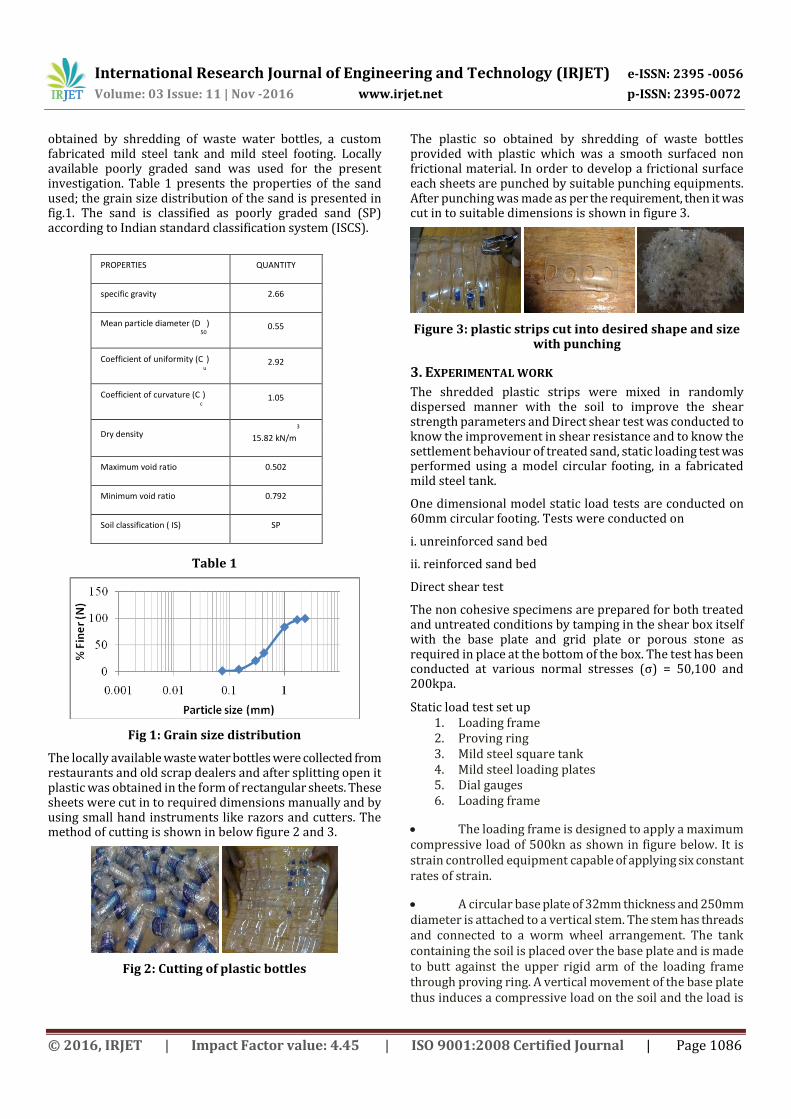
obtained by shredding of waste water bottles, a custom fabricated mild steel tank and mild steel footing. Locally available poorly graded sand was used for the present investigation. Table 1 presents the properties of the sand used; the grain size distribution of the sand is presented in fig.1. The sand is classified as poorly graded sand (SP) according to Indian standard classification system (ISCS).
Table 1
Fig 1: Grain size distribution
The locally available waste water bottles were collected from restaurants and old scrap dealers and after splitting open it plastic was obtained in the form of rectangular sheets. These sheets were cut in to required dimensions manually and by using small hand instruments like razors and cutters. The method of cutting is shown in below figure 2 and 3.
Fig 2: Cutting of plastic bottles
The plastic so obtained by shredding of waste bottles provided with plastic which was a smooth surfaced non frictional material. In order to develop a frictional surface each sheets are punched by suitable punching equipments. After punching was made as per the requirement, then it was cut in to suitable dimensions is shown in figure 3.
Figure 3: plastic strips cut into desired shape and size with punching
3. EXPERIMENTAL WORK
The shredded plastic strips were mixed in randomly dispersed manner with the soil to improve the shear strength parameters and Direct shear test was conducted to know the improvement in shear resistance and to know the settlement behaviour of treated sand, static loading test was performed using a model circular footing, in a fabricated mild steel tank.
One dimensional model static load tests are conducted on 60mm circular footing. Tests were conducted on
i. unreinforced sand bed
ii. reinforced sand bed
Direct shear test
The non cohesive specimens are prepared for both treated and untreated conditions by tamping in the shear box itself with the base plate and grid plate or porous stone as required in place at the bottom of the box. The test has been conducted at various normal stresses (σ) = 50,100 and 200kpa.
Static load test set up 1. Loading frame 2. Proving ring 3. Mild steel square tank 4. Mild steel loading plates 5. Dial gauges 6. Loading frame
The loading frame is designed to apply a maximum compressive load of 500kn as shown in figure below. It is strain controlled equipment capable of applying six constant rates of strain.
A circular base plate of 32mm thickness and 250mm diameter is attached to a vertical stem. The stem has threads and connected to a worm wheel arrangement. The tank containing the soil is placed over the base plate and is made to butt against the upper rigid arm of the loading frame through proving ring. A vertical movement of the base plate thus induces a compressive load on the soil and the load is
PROPERTIES QUANTITY
specific gravity 2.66
Mean particle diameter (D50
) 0.55
Coefficient of uniformity (Cu
) 2.92
Coefficient of curvature (Cc
) 1.05
Dry density 15.82 kN/m
3
Maximum void ratio 0.502
Minimum void ratio 0.792
Soil classification ( IS) SP
International Research Journal of Engineering and Technology (IRJET) e-ISSN: 2395 -0056
Volume: 03 Issue: 11 | Nov -2016 www.irjet.net p-ISSN: 2395-0072
© 2016, IRJET | Impact Factor value: 4.45 | ISO 9001:2008 Certified Journal | Page 1087
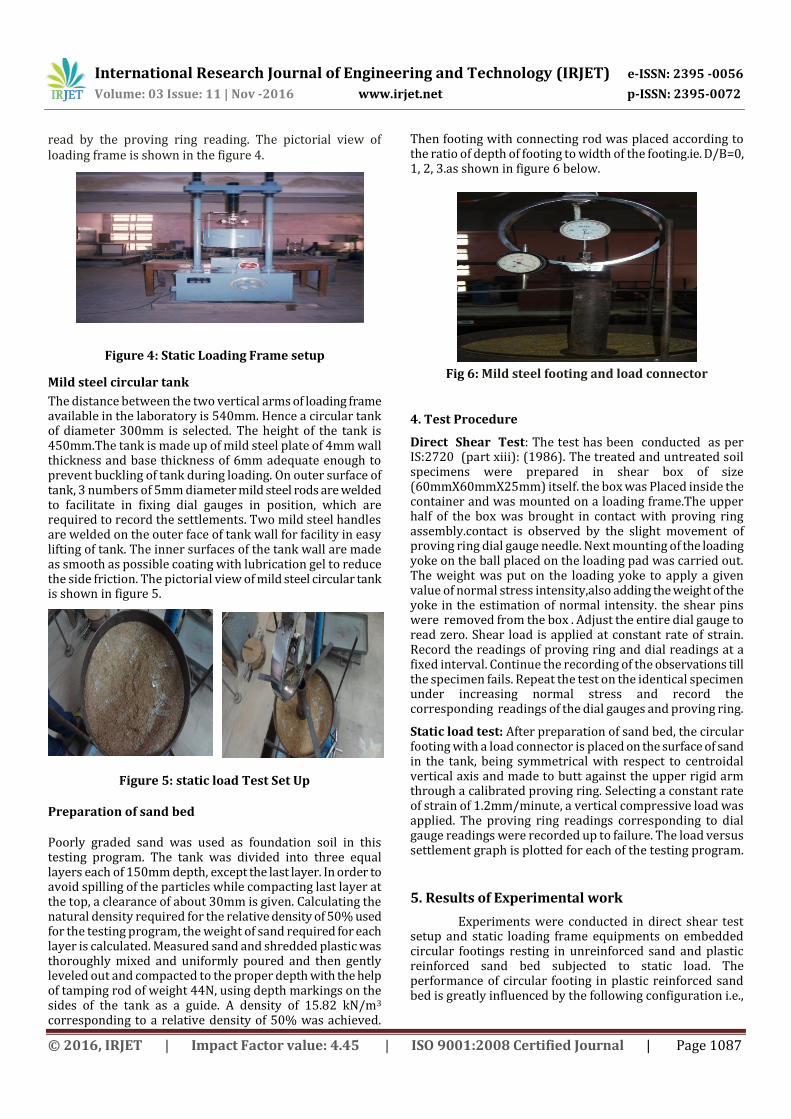
read by the proving ring reading. The pictorial view of loading frame is shown in the figure 4.
Figure 4: Static Loading Frame setup
Mild steel circular tank
The distance between the two vertical arms of loading frame available in the laboratory is 540mm. Hence a circular tank of diameter 300mm is selected. The height of the tank is 450mm.The tank is made up of mild steel plate of 4mm wall thickness and base thickness of 6mm adequate enough to prevent buckling of tank during loading. On outer surface of tank, 3 numbers of 5mm diameter mild steel rods are welded to facilitate in fixing dial gauges in position, which are required to record the settlements. Two mild steel handles are welded on the outer face of tank wall for facility in easy lifting of tank. The inner surfaces of the tank wall are made as smooth as possible coating with lubrication gel to reduce the side friction. The pictorial view of mild steel circular tank is shown in figure 5.
Figure 5: static load Test Set Up
Preparation of sand bed
Poorly graded sand was used as foundation soil in this testing program. The tank was divided into three equal layers each of 150mm depth, except the last layer. In order to avoid spilling of the particles while compacting last layer at the top, a clearance of about 30mm is given. Calculating the natural density required for the relative density of 50% used for the testing program, the weight of sand required for each layer is calculated. Measured sand and shredded plastic was thoroughly mixed and uniformly poured and then gently leveled out and compacted to the proper depth with the help of tamping rod of weight 44N, using depth markings on the sides of the tank as a guide. A density of 15.82 kN/m3
corresponding to a relative density of 50% was achieved.
Then footing with connecting rod was placed according to the ratio of depth of footing to width of the footing.ie. D/B=0, 1, 2, 3.as shown in figure 6 below.
Fig 6: Mild steel footing and load connector
4. Test Procedure
Direct Shear Test: The test has been conducted as per IS:2720 (part xiii): (1986). The treated and untreated soil specimens were prepared in shear box of size (60mmX60mmX25mm) itself. the box was Placed inside the container and was mounted on a loading frame.The upper half of the box was brought in contact with proving ring assembly.contact is observed by the slight movement of proving ring dial gauge needle. Next mounting of the loading yoke on the ball placed on the loading pad was carried out. The weight was put on the loading yoke to apply a given value of normal stress intensity,also adding the weight of the yoke in the estimation of normal intensity. the shear pins were removed from the box . Adjust the entire dial gauge to read zero. Shear load is applied at constant rate of strain. Record the readings of proving ring and dial readings at a fixed interval. Continue the recording of the observations till the specimen fails. Repeat the test on the identical specimen under increasing normal stress and record the corresponding readings of the dial gauges and proving ring.
Static load test: After preparation of sand bed, the circular footing with a load connector is placed on the surface of sand in the tank, being symmetrical with respect to centroidal vertical axis and made to butt against the upper rigid arm through a calibrated proving ring. Selecting a constant rate of strain of 1.2mm/minute, a vertical compressive load was applied. The proving ring readings corresponding to dial gauge readings were recorded up to failure. The load versus settlement graph is plotted for each of the testing program.
5. Results of Experimental work
Experiments were conducted in direct shear test setup and static loading frame equipments on embedded circular footings resting in unreinforced sand and plastic reinforced sand bed subjected to static load. The performance of circular footing in plastic reinforced sand bed is greatly influenced by the following configuration i.e.,

International Research Journal of Engineering and Technology (IRJET) e-ISSN: 2395 -0056
Volume: 03 Issue: 11 | Nov -2016 www.irjet.net p-ISSN: 2395-0072
© 2016, IRJET | Impact Factor value: 4.45 | ISO 9001:2008 Certified Journal | Page 1088
embedded depth of footing (D/B) and plastic content (%) in sand bed (PRS).
SHEAR STRENGTH PROPERTIES OF PLASTIC REINFORCED SAND
The shearing strength in sand may be said to consists of two parts, the internal frictional resistance between grains, which is a combination of rolling and sliding friction and another part known as ‘interlocking’. Interlocking, which means locking of one particle by the adjacent ones, resisting movements, contributes a large portion of the shearing strength in dense sands, while it does not occur in loose sands. The Mohr strength theory is not invalidated by the occurrence of interlocking. The Mohr envelopes merely show large ordinates and steeper slopes for dense soils than for loose ones.
The angle of internal friction is a measure of the resistance of the soil to sliding along a plane. This varies with the density of packing, characterized by density index, particle shape and roughness and particle size distribution. Its value increases with density index, with the angularity and roughness of particles and also with better gradation. This is influenced to some extent by the normal pressure on the plane of shear and also the rate of application of shear.
Some clean sands exhibit slight cohesion under certain conditions of moisture content, owing to capillary tension in the water contained in the voids. Since this is small and may disappear with change in water content, it should not be relied upon for shear strength.
The laboratory direct shear tests were conducted for various plastic contents mixed with sand at different normal stresses to know the shear strength parameters such as angle of internal friction and cohesion. From the obtained test results the graph was plot normal stress versus shearing stress. The slope of the straight line so obtained would give the angle of internal friction and the vertical intercept of the line will give the cohesion. In case the plot is not a straight line, shear parameters are obtained by drawing a tangent to the normal stress-maximum shear stress curve at the points of maximum normal stress expected in the field.
ANGLE OF INTERNAL FRICTION
As the plastic content increases the angle of internal friction decreases up to certain extent beyond that increases. Results from the test the graph was plotted Plastic (%) versus angle of internal friction (Φ) shown in figure 7. from this plot we can observe that the angle of internal friction for unreinforced sand is 45̊ it decreases to 35̊ for 0.7% plastic then it is increases to 45̊ for 1% plastic beyond that angle of internal friction (Φ) decreases to 23̊ for 2% of plastic. The values of angle of internal friction for various % of plastic are shown in table 2
Figure 7 shows the percentage change in angle of internal friction with various plastic contents. It is seen from the figure that percentage change in angle of internal friction increases with increase in plastic content, from the figure it is observed that change in angle of internal friction for 0.3%
plastic is -4.44% is decreases to -22.22% for 0.7% plastic and again increases to 0% for 1% plastic.
Effect of plastic on Angle of internal friction (ɸ)
To study the effect of plastic on Angle of internal friction, the percentage change in angle of internal friction is calculated as fallows From fig 7 and table 2:
Angle of internal friction for Unreinforced condition=45̊
Angle of internal friction for 0.3% plastic of Reinforced
condition = 43 ̊
Angle of internal friction for 0.7% plastic of Reinforced
condition = 35 ̊
Angle of internal friction for 1% plastic of Reinforced
condition = 45 ̊
Angle of internal friction for 2% plastic of Reinforced
condition = 23 ̊
Percentage change in Angle of internal friction between 0.3%
plastic of Reinforced sand to unreinforced sand
= × 100 = - 4.44%
Similarly,
Percentage change in Angle of internal friction between 0.7%
plastic of Reinforced sand to Unreinforced sand
= × 100 = -22.22%
Percentage change in Angle of internal friction between 1%
plastic of Reinforced sand to Unreinforced sand
= × 100 = 0 %
Percentage change in Angle of internal friction between 2%
plastic of Reinforced to Unreinforced sand
= × 100 = -48.88%
Table 2: Angle of internal friction for plastic reinforced sand
Fig 7 Angle of internal friction for various plastic content
Condition Angle of internal friction( Φ)
0 % plastic 45̊
0.3% plastic 43̊
0.7%plastic 35̊
1%plastic 45̊
2%plastic 23̊

International Research Journal of Engineering and Technology (IRJET) e-ISSN: 2395 -0056
Volume: 03 Issue: 11 | Nov -2016 www.irjet.net p-ISSN: 2395-0072
© 2016, IRJET | Impact Factor value: 4.45 | ISO 9001:2008 Certified Journal | Page 1089
Fig 8 Percentage change in Angle of internal friction
COHESION
The laboratory direct shear tests were conducted for various plastic contents mixed with sand at different normal stresses to know the cohesion of reinforced sand. As the plastic content increases cohesion increases upto certain extent beyond that decreases. Figure 9 shows the plastic (%) versus cohesion. From figure 9 we can see that as the plastic (%) increases the cohesion increases linearly to 39 kPa for 0.7% plastic is decreases to 12 kPa for 1% plastic and again increases to 22kpa for 2% plastic. The cohesion corresponding to respective plastic contents is shown in table 3.
Condition Cohesion (kPa)
0% plastic 0
0.3% plastic 19
0.7% plastic 39
1% plastic 12
2% plastic 22
Table 3: Cohesion for various plastic content
Fig 9 Cohesion for various plastic content
SHEAR STRENGTH
As the plastic content increases shear strength increases upto certain extent beyond that decreases. From figure 4 we can observe that the shear strength of the sand increases linearly to 52.3 kPa with the increase in plastic content up to 0.7% plastic in sand beyond that it decreases to 30.06 kPa for 2% plastic. Shear strength for various % of plastic is shown in table 4.
Figure 10 shows the variation of percentage increase in shear strength with varying percentage of plastics. It is seen from the figure that there is linear increase in shear strength with increase in plastic content. Percentage (%) change in shear strength for 0.3% plastic is 93.5% which increases to 175% for 0.7 plastic then it is decreases to 58.2% for 2% plastic. it is seen that 0.7% plastic shows a higher percentage improvement in shear strength compared to other plastic contents.
From fig 10,
Shear strength for Unreinforced condition=19kpa Shear strength for 0.3% plastic Reinforcement=36.7kpa Shear strength for 0.7% plastic Reinforcement=52.30kpa Shear strength for 1% plastic of Reinforcement = 31kpa Shear strength for 2% plastic of Reinforcement= 31.06kPa
Fig 10: shear strength for various plastic contents
Table 4: shear strength for various plastic contents
Table 5: Percentage change in shear strength (τ) for various plastic contents
The percentage change in shear strength is calculated taking into account the shear strength value that was obtained, when the soil was tested alone, without the addition of any plastic content, to that of the shear strength values obtained for addition of various plastic percentages. The percentage increase is as shown in the table 5 and figure 11.
Condition Shear strength (kPa)
0% plastic 19
0.3% plastic 36.7
0.7% plastic 52.3
1% plastic 31
2% plastic 30.06
Condition Percentage change in shear
strength (τ)
0.3 % plastic 93.15
0.7 % plastic 175.26
1 % plastic 63.15
2 % plastic 58.21

International Research Journal of Engineering and Technology (IRJET) e-ISSN: 2395 -0056
Volume: 03 Issue: 11 | Nov -2016 www.irjet.net p-ISSN: 2395-0072
© 2016, IRJET | Impact Factor value: 4.45 | ISO 9001:2008 Certified Journal | Page 1090
Figure 11 percentage changes in shear strength for various plastic contents
STRESS- STRAIN CHARACTERSTICS
The stress-strain behaviour of sands is dependent to a large extent on the initial density of packing, as characterised by the density index. The shear stress builds up gradually for an initially loose sand. While for an initially dense sand, it reaches a peak value and decreases at greater values of shear to an ultimate value comparable to that for an initially loose specimen. The behaviour of medium-dense sand is intermediate to that of a loose sand and a dense sand.
The laboratory direct shear tests were conducted for various plastic content mixed with sand at different normal stresses to know the shear strength parameters such as angle of internal friction and cohesion. From the obtained test results the graph was plotted stress against strain.
Figure 12 to 14 shows the collection of stress- strain charts for various percentage of plastics at different normal stresses (σ = 50,100,200 kPa). Fig 4 shows the stress-strain chart for various percentage of plastics at normal stress 50kPa.From the figure it can be inferred that, sand attaining a linearity with increase in percentage of plastic. At 0% plastic, sand exhibited elastic failure undergoing considerably higher deformation of 5% strain before failure by receiving a lesser peak stress of 47kPa at 3% strain.
With increase in percentage of plastic, the reinforced sand of 0.3% plastic attained 65kPa of maximum peak stress at a considerably lower strain of 3.7%. same trend continued up to 2% plastic of reinforced sand. At 2% plastic sand attained a peak stress of 58kPa at 5% strain exhibiting a more linearity in the stress-strain behavior.
Fig 12 stress-strain behaviour of reinforced sand at normal stress 50kPa
Fig 13 stress-strain behaviour of reinforced sand at normal stress 100kPa
Fig 14 stress-strain behaviour of reinforced sand at normal stress 200kPa
With increase in percentage of plastic, the reinforced sand of 0.7% plastic attained around 230kPa of maximum peak stress at a considerably lower strain of less than 4%. same trend continued up to 2% plastic addition. At 2% plastic, Reinforced sand exhibit a elastic failure undergoing considerably higher deformation of less than 10% strain before failure by receiving lesser peak stress of 175kPa at 9% strain.
LOAD–SETTLEMENT BEHAVIOR OF PLASTIC REINFORCED SAND
To bring out the effect of plastic reinforcement on the performance of surface and embedded circular footing resting in sand beds, experiments were conducted for circular footing resting in unreinforced sand beds and reinforced sand beds with different D/B ratios. From the experimental results it was observed that circular footing resting in reinforced sand beds perform much better than circular footing resting in unreinforced sand beds. Table 6 to 9 shows the experimental results for different embedded depths (D/B=0,1,2,3).

International Research Journal of Engineering and Technology (IRJET) e-ISSN: 2395 -0056
Volume: 03 Issue: 11 | Nov -2016 www.irjet.net p-ISSN: 2395-0072
© 2016, IRJET | Impact Factor value: 4.45 | ISO 9001:2008 Certified Journal | Page 1091
Table 6: load settlements results of various plastic content at D/B = 0
Table 7: load settlements results of various plastic content at D/B = 1
Table 8: load settlements results of various plastic content at D/B =2
Table 9: load settlements results of various plastic content at D/B =3
Effect of Plastic Reinforcement On Load-Settlement Behavior
Figure 13 to 16 shows the load settlement curves of various percentages of plastics corresponding to D/B = 0,1,2,3 respectively.
From all these figures it can be observed that, as plastic (%) content increases in sand bed the load carrying capacity of the footing increases up to certain extent beyond that it decreases. This is because of plastic strips having holes offer more interfacial frictional resistance and thereby increases the load carrying capacity. Also it can be observed that reinforced sand of 0.7% plastic is more efficient compared to other plastic contents.
For example from the figure 13, it is observed that as the plastic increases the load carrying capacity of the footing increases from 0.88kN for unreinforced sand to 2.46kN for 0.7% plastic of reinforced sand and then decreases to 1.6kN for 1% plastic. Same trends of results observed in figures 14 to 16.
As the plastic strips having holes, more number of soil particles comes in contact with the plastic reinforcement and that may leads to increase the frictional interaction between soil and plastic. This interlocking of the soil through holes of the strips mobilizes the high tensile strength of the plastic strips as loads are applied and an efficient anchoring effect achieved and therefore the plastic reinforcement becomes stiff and that results in taking up in the higher load bearing capacity.
Settlement (mm)
0%
plastic
0.3%
plastic
0.7%
plastic
1%
plastic
0 0 0 0 0
5 0.2 0.45 0.68 0.45
10 0.3 0.78 1 0.6
15 0.43 1.08 1.25 0.7
20 0.49 1.3 1.5 0.8
25 0.58 1.52 1.77 1
30 0.7 1.64 2 1.2
35 0.8 1.78 2.31 1.4
40 0.88 1.9 2.46 1.6
Settlement (mm)
0%
plastic
0.3%
plastic
0.7%
plastic
1%
plastic
0 0 0 0 0
5 0.4 0.6 1.5 1
10 0.6 1 2.4 2
15 1 1.5 3 2.3
20 1.5 2 3.6 2.7
25 2 2.5 3.8 3
30 2.3 2.8 4 3.3
35 2.6 3.2 4.2 3.7
40 2.8 3.3 4.5 4
Settlement (mm)
0%
plastic
0.3%
plastic
0.7%
plastic
1%
plastic
0 0 0 0 0
5 3.5 5 7.76 3.3
10 5.4 7.65 10 4.5
15 6.2 8.87 10.6 5
20 7 10 11 5.5
25 7.2 10.45 11.6 5.6
30 7.6 11 12 5.8
35 7.9 11.09 12.3 6
40 7.98 11.3 12.5 6.2
Settlement (mm)
0%
plastic
0.3%
plastic
0.7%
plastic
1%
plastic
0 0 0 0 0
5 2.83 5 5.86 3
10 3.78 7 9.45 4.34
15 4.28 8 10.83 5.23
20 4.47 8.3 11.5 6.12
25 4.72 9 12 6.4
30 4.97 9.5 12.66 6.9
35 5.16 10 13.42 7.23
40 5.35 10.5 13.48 7.83

International Research Journal of Engineering and Technology (IRJET) e-ISSN: 2395 -0056
Volume: 03 Issue: 11 | Nov -2016 www.irjet.net p-ISSN: 2395-0072
© 2016, IRJET | Impact Factor value: 4.45 | ISO 9001:2008 Certified Journal | Page 1092
Figure 15: load-settlement curves for reinforced sand at D/B=0
Figure 16: load-settlement curves for reinforced sand at D/B=1
Figure 17: load-settlement curves for reinforced sand at D/B=2
Figure 18: load-settlement curves for reinforced sand at D/B=3
Effect of Embedded Depth of Footing On Load Settlement Behavior
According to experimental programme the various number of static load tests were conducted to study the effect
of embedded depth on performance of footing resting in plastic reinforced sand bed under static loading. As results shown in table 6 to 9 the graph was plotted between load v/s settlement. Figure 16 to 19 shows the load–settlement curves for different D/B ratios at various plastic percentages 0, 0.3, 0.7, 1 respectively. From these figures it can be inferred that, for any plastic content as the depth of the embedment increases the load carrying capacity of footing increased up to d/b=2 whereas causing less settlement, beyond that it decreases at d/b=3
For example, figure 16 shows the load-settlement curves of different d/b ratios for 0% plastic. From figure it is observed that footing resting in 0% plastic of reinforced sand carries a lesser load of about 1kN at d/b=0, is increases to approximately 8kN at d/b=2 beyond that it decreases to around 5kN at d/b=3. Also it can be seen that, for any plastic content footing resting in embedded depth (d/b=2) shows a better load carrying capacity compared to other embedded depths. Same trend results are observed in figure 17 to 19
Fig 19: Load-settlement curves for 0% plastic at different d/b ratios
Fig 20: Load-settlement curves for 0.3% plastic at different d/b ratios
Fig 21: Load-settlement curves for 0.7% plastic at different d/b ratios

International Research Journal of Engineering and Technology (IRJET) e-ISSN: 2395 -0056
Volume: 03 Issue: 11 | Nov -2016 www.irjet.net p-ISSN: 2395-0072
© 2016, IRJET | Impact Factor value: 4.45 | ISO 9001:2008 Certified Journal | Page 1093
Fig 22: Load-settlement curves for 1% plastic at different d/b ratios
Effect of Plastic on Bearing Capacity Ratio (BCR)
In order to get a quantitative assessment of extent of soil improvement, the improvement due to the addition of plastic reinforcement can be shown in non-dimensional bearing capacity ratio which is defined as “the ratio of the bearing capacity of reinforced sand to the bearing capacity of un-reinforced sand”.
The Bearing Capacity Ratio is calculated for different plastic contents to understand the effect of plastic reinforcement on the performance of circular footing. Fig 20 shows the BCR for various plastic contents at different embedded depths.
It can be observed from figure that at any embedded depth, the Bearing Capacity Ratio increases with increase in plastic content upto certain extent beyond that decreases and the reinforced sand with 0.7% plastic exhibit highest value of Bearing Capacity Ratio compared to 0.3% and 1% plastic content mixed in sand. For example embedded depth D/B=1, for 0.3%plastic BCR is 1.17 is increases to 1.60 for 0.7% plastic and then decreases to 1.43 for 1% plastic. Similar trends of results observed in rest of embedded depths.
Figure 23: BCR for various embedded depths
Effect of Plastic on Settlement Ratio (SR)
To bring out the effect of plastic reinforcement on the settlement behaviour of reinforced sand bed, settlement ratio is calculated for results obtained from static load test. Settlement ratio is defined as, “the ratio of settlement of reinforced sand bed at failure to settlement of unreinforced sand bed at failure.”
The Settlement Ratio is calculated to understand the effect of plastic reinforcement on the performance of circular footing. Fig 21 shows the relationship between SR and embedded depths for various plastic content.
It is observed from this figure that at any embedded depth, the settlement ratio decreases as the plastic content increases only upto certain extent beyond that it increases and it is minimum for 0.7% plastic reinforcement. It is also observed that the settlement ratio at d/b=3 is very less compared to rest of embedded depths (D/B=0, 1, 2).
For example footing resting in surface (D/B=0), as plastic content increases the SR for 0.3% plastic is 0.23 and is decreases to 0.2 for 0.7%plastic and is increases to 0.5 for 1% plastic. At embedded depth D/B=3, the SR for 0.3% plastic is 0.175 and it is decreases to 0.07 for 0.7% plastic then it is increases to 0.375 for 1% plastic. Also it is observed that for any embedded depth, 0.7% plastic shows lesser SR values compared to other plastic contents.
Figure 24: SR for various embedded depths
6. CONCLUSIONS
Following conclusions can be drawn on the basis of major two test results i.e., direct shear test and static load test.
Due to pseudo-cohesion, As the plastic content increases the shear strength parameters such as cohesion and angle of internal friction increases upto certain extent beyond that decreases whereas in angle of internal friction visa-versa.
Reinforced sand of 0.7%plastic shows a better shear strength of about 72kPa compared to other or unreinforced sands.
For any normal stresses, as the plastic content increases the shear stress-strain behavior shows linearity in the beginning by attain a maximum peak stress at considerably lower strains.
As plastic (%) content increases in sand bed the load carrying capacity of the footing increases up to certain extent beyond that it decreases. This is because of plastic strips having holes offer more interfacial frictional resistance and thereby increases the load carrying capacity.
International Research Journal of Engineering and Technology (IRJET) e-ISSN: 2395 -0056
Volume: 03 Issue: 11 | Nov -2016 www.irjet.net p-ISSN: 2395-0072
© 2016, IRJET | Impact Factor value: 4.45 | ISO 9001:2008 Certified Journal | Page 1094
For any embedded depths, 0.7%plastic of reinforced sand shows a better load carrying capacity with lesser settlements compared to other plastic contents.
For any plastic contents, footing resting in embedded depth of D/B=2 shows a better load carrying capacity compared to its counterpart.
As plastic (%) content increases in sand bed the bearing capacity ratio (BCR) increases up to certain extent beyond that it decreases. For any embedded depths 0.7%plastic shows a higher values of BCR compared to 0.3 and 1% plastic contents. Footing resting in D/B=0 shows a higher values of BCR compared to its counterpart.
As plastic (%) content increases in sand bed the settlement ratio decreases up to certain extent beyond that it decreases. For any embedded depths 0.7%plastic shows a lesser values of SR compared to 0.3 and 1% plastic contents. Footing resting in D/B=2 and D/B=3 shows a lesser values of SR compared to its counterpart.
REFERENCES
[1] A.K. Choudhary, J.N. Jha and K.S. Gill. A Study on CBR behavior of waste plastic strip reinforced soil”, Emirates Journal for Engineering Research, 15 (1), 51-57 (2010)
[2] Binquet, J., Lee, K.L., (1975a). Bearing capacity tests on reinforced earthslabs. Journal of Geotechnical Engineering ASCE 101 (12), 1241–1255.
[3] Binquet, J., Lee, K.L., (1975b). Bearing capacity analysis of reinforced earthslabs. Journal of Geotechnical Engineering ASCE 101 (12), 1257–1276.
[4] Forsyth, R.A.(1978) Alternative earth reinforcement, ASCE Symp. Earth Reinforcement, Pittsburgh.
[5] Gulhati, k. Shashi and datta, manoj (2005) Geotechnical Engineering, Tata McGraw-Hill Publishing Company Limited, New Delhi.
[6] Haider Mohammed Mekkiyah (2013), Improvement of Soil by Using Polymer Fiber Materials Underneath Square Footing submitted to Journal of Engineering Volume 19.
[7] IS: 2720 (Part III/Sec2) (1980) Indian Standard Methods of test for soils Determination of Specific Gravity, Indian Standards Institution, New Delhi.
[8] IS: 2720 (Part V). (1985) Indian Standard Methods of test for soils Grain Size Analysis, Indian Standard Institution, New Delhi.
[9] IS: 2720 (Part XIII). (1986) Indian Standard Methods of tests for soils- Direct Shear Test, Indian Standards Institution, New Delhi.
[10] IS: 2720 (Part1VX). (1983) Indian Standard Methods of test for soils Determination of Density Index of Cohesion less soils, Indian Standards Institution, New Delhi.
[11] Megnath Neopaney (2012) Stabilization of Soil by Using Plastic Wastes, International Journal of Emerging trends in Engineering and Development, Issue 2, Vol.2
[12] Mercy Joseph Poweth (2013) study on use of plastic waste in road construction submitted to IJIRSET vol.2, issue 3.
[13] Rao,G.V. and Dutta, R.K. (2001) Potential of waste plastic in soil Reinforcement International conference on Civil Engineering, Bangalore.
[14] Sujith kumar paul, Effects of Waste Plastic Fibres on Compaction and Consolidation Behavior of Reinforced soils Vol. 18 [2013],1548-1558.