effect of biomass generated producer -...
TRANSCRIPT

EFFECT OF BIOMASS GENERATED PRODUCER
GAS, METHANE AND PHYSICAL PARAMETERS ON
PRODUCER GAS FERMENTATIONS BY
CLOSTRIDIUM STRAIN P11
By
KARTHIKEYAN DHARMAN RAMACHANDRIYA
Bachelor of Technology in Biotechnology
Bharathidasan University
Tiruchirapalli, Tamilnadu
2006
Submitted to the Faculty of the Graduate College of the
Oklahoma State University in partial fulfillment of the requirements for
the Degree of MASTER OF SCIENCE
December, 2009
ii
EFFECT OF BIOMASS GENERATED PRODUCER
GAS, METHANE AND PHYSICAL PARAMETERS ON
PRODUCER GAS FERMENTATIONS BY
CLOSTRIDIUM STRAIN P11
Thesis Approved:
Dr. MARK R. WILKINS
Thesis Adviser
Dr. RAYMOND L. HUHNKE
Dr. DANIELLE BELLMER
Dr. BABU FATHEPURE
Dr. A. GORDON EMSLIE
Dean of the Graduate College

iii
ACKNOWLEDGMENTS
William Ward said “The mediocre teacher tells. The good teacher explains. The
superior teacher demonstrates. The great teacher inspires.” My advisor, Dr. Mark
Wilkins has been the source of inspiration for this research. Thus, I would first like to
express my express my gratitude towards Dr. Wilkins for showing enormous trust in
myself. Without his financial support, my stay in the US would have been quite
impossible. His guidance towards the project and constant encouragement towards
developing new techniques has been the driving force of my energy. His unique
management skills helped me realize my dreams by allowing me to work on experiments
that interested me.
I am grateful to my committee members, Dr. Raymond Huhnke, Dr. Danielle
Bellmer and Dr. Babu Fathepure who not only guided me, but were a source of
inspiration. I am also grateful to Dr. Hasan Atiyeh for his time and support with
meaningful discussions about the project. My special thanks to Dr. Marthah DeLorme for
the guidance she showed through long discussions about different microbiological
principles and her contributions in improving various techniques in the lab. I would also
like to thank Dr. Krushna Patil and his students for their timely help with producing the
syngas whenever it was needed for the project.
The help of Mr. Robert Ingraham is greatly appreciated. Without his help and
assistance, it would have been impossible to develop GC methods. I would like to thank

iv
Mr. Major Jarrod for his help with refilling the producer gas tanks from the Annex.
Without him, ordering daily lab supplies would have been very difficult. My special
thanks to Dimple and Prasanth for teaching me different techniques involved in the
project.
This piece of work would have been impossible without the help and many
friends like Anusha, Akshata, Balaji, Shashi, Brian, Jenny, Michael Matousek, Michael
Mueller and Naveen. Without these friends, work would have been less enjoyable. Big
thanks to Jenny for her help with fixing the glove box and helping me installing the mass
flow controllers.
I am deeply grateful to my parents for their love, prayers, support and
encouragement throughout my life. My success in each and every step of life would have
been impossible without you. Very special thanks to my fiancée, Deepa, who was the
actual source of inspiration for pursuing graduate studies in the US. She has been very
patient, understanding and was with me whenever I needed any kind of help.

v
TABLE OF CONTENTS Chapter Page
1. INTRODUCTION ..................................................................................................... 1 1.1 References ......................................................................................................... 8
2. OBJECTIVES .......................................................................................................... 12
3. REVIEW OF LITERATURE .................................................................................. 13 3.1 Gasification process ........................................................................................ 13 3.2 Fermentation process ...................................................................................... 21
3.2.1 Stoichiometry of acetogenic bacteria .................................................. 25 3.2.2 Acetogens, their metabolism and energetics ....................................... 28 3.2.3 Biphasic fermentation pattern in solvent producing acetogens .......... 33 3.2.4 Sporulation and degeneration in clostridia ......................................... 38 3.2.5 Effect of syngas contaminants in the fermentation process ................ 42 3.2.6 Bioreactor designs and latest developments in producer gas
fermentation technology ..................................................................... 46 3.3 References ....................................................................................................... 51
4. EFFECT OF BIOMASS GENERATED PRODUCER GAS AND ITS CONTAMINANTS IN FERMENTATIONS USING CLOSTRIDIUM STRAIN P11.................................................................................................................................. 65 4.1 Introduction ..................................................................................................... 65 4.2 Materials and Methods .................................................................................... 69
4.2.1 Biomass and producer gas .................................................................. 69 4.2.2 Microbial catalyst and culture medium............................................... 70 4.2.3 Preparation of the culture medium and batch studies ......................... 70 4.2.4 Analytical methods ............................................................................. 75
4.3 Results and discussion .................................................................................... 78 4.3.1 Batch studies – Effect of switchgrass producer gas ............................ 78 4.3.2 Batch studies – Effect of 5% methane in P11 fermentations ............. 97
4.4 Conclusion .................................................................................................... 108 4.5 References ..................................................................................................... 110

vi
5. EFFECT OF PHYSICAL PARAMETERS AND EVALUATION OF KINETIC PARAMETERS IN PRODUCER GAS FERMENTATIONS USING CLOSTRIDIUM STRAIN P11 ............................................................................... 116 5.1 Introduction ................................................................................................... 116 5.2 Materials and methods .................................................................................. 121
5.2.1 Producer gas ...................................................................................... 121 5.2.2 Microbial catalyst and culture medium............................................. 121 5.2.3 Preparation of culture medium and batch studies ............................. 123 5.2.4 Analytical methods ........................................................................... 125
5.3 Results and Discussion ................................................................................. 125 5.3.1 Batch studies – Effect of heat shock treatments ............................... 125 5.3.2 Batch studies – Effect of inceased agitation speed ........................... 140 5.3.3 Batch studies – Effect of increased headspace ................................. 151
5.4 Conclusion .................................................................................................... 166 5.5 References ..................................................................................................... 168
6. FUTURE WORK ................................................................................................... 175
APPENDIX ............................................................................................................ 178

vii
LIST OF TABLES
Table Page
Table 3.1 Common reactions during gasification. ............................................................ 18
Table 3.2 Stoichiometry of product formation from gaseous substrates .......................... 26
Table 4.1 Composition of stock mineral solutions ........................................................... 71
Table 4.2 Composition of trace metal stock solution ....................................................... 72
Table 4.3 Composition of vitamin stock solution ............................................................. 73
Table 4.4 Producer gas compositions from a fluidized bed reactor with switchgrass as
feedstock ........................................................................................................... 79
Table 4.5 Theoretical conversions of acetic acid to ethanol ............................................. 93
Table 5.1 Composition of mineral stock solution, trace metal stock solution and vitamin
stock solution .................................................................................................. 122
Table 5.2 Kinetic parameters of P11 fermentation during heat shock experiment ......... 138
Table 5.3 Kinetic parameters of P11 fermentation during agitation experiments .......... 152
Table 5.4 Kinetic parameters of P11 fermentation during headspace experiments ........ 165
Table B.1 Producer gas compositions from on a on a downdraft reactor with corn gluten
feed (CGF) as feedstock ................................................................................. 184

viii
LIST OF FIGURES
Figure Page
Figure 1.1 Historic US fuel ethanol production .................................................................. 3
Figure 1.2 Fossil energy ratio (FER) of different processes ............................................... 5
Figure 3.1 Syngas conversion process .............................................................................. 15
Figure 3.2 Overall flow diagram of a biomass- gasification process ............................... 17
Figure 3.3 Gasification reactors ........................................................................................ 20
Figure 3.4 Block flow diagram of a gasification- fermentation process .......................... 22
Figure 3.5 Overall picture acetyl-CoA pathway ............................................................... 30
Figure 3.6 Production of different acids and alcohols from acetyl-CoA… …………...32
Figure 4.1 Experimental outline for switchgrass producer gas experiment ..................... 80
Figure 4.2 Cell growth in different treatments ................................................................. 82
Figure 4.3 pH profile in different treatments .................................................................... 83
Figure 4.4 Ethanol production in different treatments ...................................................... 84
Figure 4.5 Acetic acid production in different treatments ................................................ 85
Figure 4.6 ATP generation from proton gradient ............................................................. 88
Figure 4.7 Isopropanol production in different treatments ............................................... 89
Figure 4.8 Mole percentage of products formed in different treatments .......................... 96
Figure 4.9 Experimental outline for contaminant experiment .......................................... 98
Figure 4.10 Cell growth in different treatments .............................................................. 99
Figure 4.11 pH profiles in different treatments .............................................................. 100
Figure 4.12 Ethanol production in different treatments .................................................. 102

ix
Figure 4.13 Acetic acid production in different treatments ............................................ 103
Figure 4.14 CO consumption in different treatments ..................................................... 104
Figure 4.15 H2 consumption in different treatments ....................................................... 105
Figure 4.16 CO2 consumption in different treatments .................................................... 106
Figure 4.17 CH4 consumption in different treatments .................................................... 107
Figure 5.1 Experimental outline for heat shock experiment ........................................... 126
Figure 5.2 Cell growth in different treatments ............................................................... 127
Figure 5.3 pH profile in different treatments .................................................................. 128
Figure 5.4 Ethanol production in different treatments .................................................... 130
Figure 5.5 Acetic acid production in different treatments .............................................. 131
Figure 5.6 Molar percentages of products formed in different treatments ..................... 132
Figure 5.7 CO consumption profile in different treatments ............................................ 134
Figure 5.8 H2 consumption profile in different treatments ............................................. 135
Figure 5.9 CO2 consumption profile in different treatments .......................................... 136
Figure 5.10 Experimental outline of agitation speed experiment ................................... 141
Figure 5.11 Cell growth in different treatments ............................................................. 142
Figure 5.12 pH in different treatments ............................................................................ 143
Figure 5.13 Ethanol concentrations in different treatments ............................................ 145
Figure 5.14 Acetic acid concentrations in different treatments ...................................... 146
Figure 5.15 CO consumption profile in different treatments .......................................... 148
Figure 5.16 H2 consumption profile in different treatments ........................................... 149
Figure 5.17 CO2 consumption in different treatments .................................................... 150
Figure 5.18 Experimental outline of headspace experiments ......................................... 153

x
Figure 5.19 Cell growth in different treatments ............................................................. 155
Figure 5.20 pH in different treatments ............................................................................ 156
Figure 5.21 Ethanol production in different treatments .................................................. 157
Figure 5.22 Acetic acid production in different treatments ............................................ 158
Figure 5.23 Molar percentages of products formed in different treatments ................... 159
Figure 5.24 CO consumption in different treatments ..................................................... 162
Figure 5.25 H2 consumption in different treatments ....................................................... 163
Figure 5.26 CO2 consumption in different treatments .................................................... 164
Figure B.1 Experimental outline for CGF producer gas experiment .............................. 186
Figure B.2 Cell growth in different treatments ............................................................... 187
Figure B.3 pH profile in different treatments ................................................................. 188
Figure B.4 Ethanol production in different treatments ................................................... 191
Figure B.5 Acetic acid production in different treatments ............................................. 192
Figure B.6 Acetone production in different treatments .................................................. 193
Figure B.7 CO consumption in different treatments ....................................................... 196
Figure B.8 H2 consumption in different treatments ........................................................ 197
Figure B.9 CO2 consumption in different treatments ..................................................... 198
1
CHAPTER 1
INTRODUCTION
Fossil derived chemicals were the main source of feedstock for the manufacture of
numerous products during the industrial era (Rogers et al. 2006), but the amounts of
petroleum, natural gas and coal are decreasing at an alarming rate (Huber et al. 2006).
Coupled with this are many factors like global warming, political instability of oil
producing countries, and concerns over national security, which has resulted in the
increased effort to look for renewable and biological methods of production of chemicals
and fuels (Lashof and Ahuja 1990; Rogers et al. 2006). The Energy Information
Administration (EIA) has indicated that in the United States about two-thirds of the oil
imported is consumed by the transportation sector (Anonymous 2009a). Putsche and
Sandor (1996) indicated that in 1990, 97% of transportation fuel was petroleum based,
showing the strong dependence of the US economy on oil. Thus, there is a necessity to
increase the energy options for transportation sector (Wyman 1996). This is the reason
for the search of alternative fuels such as ethanol, biodiesel and butanol from renewable
sources. Among the many options of alternative fuel, ethanol has numerous desirable
properties of a good fuel such as high heat of vaporization, low flame temperature,
greater gas volume change, high specific energy and high octane content, and in
optimized spark ignition engines, ethanol can achieve 15% higher efficiency compared to
2
gasoline (Wyman 1996).
Biomass derived feedstocks are not only renewable but also carbon neutral and
have the potential to replace significant amounts of fossil fuel consumption (Khanal
2008). Primary agricultural crops such as sugarcane and corn are the most important
feedstocks for bioethanol production (Tsai et al. 2009b). Industrial production of
bioethanol has been successfully demonstrated in the past using these feedstock’s in
Brazil (sugarcane) and the United States (Reddy et al.). As shown in Fig. 1.1, ethanol
production increased drastically after 2005 and reached 9 billion gallons in 2008
(Anonymous 2009b) during which most of the ethanol production was from corn
(Urbanchuk 2007). This tremendous growth in the use of corn is underscored by the aid
of tax credits for the biofuel producers (Anonymous 2009c). Consequently, corn based
ethanol production is projected to saturate over the next decade (Anonymous 2009c;
Urbanchuk 2007). Besides all this, the use of corn for bio-ethanol production has raised
numerous problems like the food versus fuel debate, availability of land to grow corn
dedicated to biofuel production and the amounts of water needed for growing corn
(Anderson et al. 2008). Thus, the new renewable fuel standard requires production of 0.1
billion gallons of cellulosic ethanol by 2010 and 16 billion gallons of cellulosic ethanol
by 2022. Towards this effort companies such as Abengoa, Mascoma, Bluefire, and ICM
Inc. have facilities under construction and have proposed to use feedstocks such as corn
stover, wheat straw, barley straw, rice straw, switchgrass, wood waste, and urban waste
(Anonymous 2009b).
Fossil Energy Ratio (FER) is one of the important metrics to compare the
efficiency of different energy systems. It relates the energy in the fuel to the fossil

3
Figure 1.1 Historic US fuel ethanol production (Anonymous, 2009b).
0123456789
10
19801981198219831984198519861987198819891990199119921993199419951996199719981999200020012002200320042005200620072008
Eth
anol
, Bill
ions
of g
allo
ns
Year

4
energy utilized for its production (Wang 2005). FER of various energy systems are
shown in Fig. 1.2. It is lucid from the graph that cellulosic ethanol can produce almost 10
times more energy compared to corn ethanol. The reason is that the energy inputs for
irrigation, machinery and pesticide application are high for corn ethanol production.
Besides this, a study at Argonne National Laboratory shows that the use of an 85% blend
of cellulosic ethanol with gasoline (E85) will reduce the petroleum consumption by 70-
71% and reduce the emissions of green house gases (GHG) by 68-102% (Wang et al.
1999). The automobile industry has released 7 million flex fuel vehicles that can use E85,
but this is only 3% of the total number of vehicles on the road (Anonymous 2009b).
The conversion of lignocellulosic feedstocks into ethanol can be biologically
achieved by two methods: hydrolysis-fermentation and syngas fermentation (Huber et al.
2006). In hydrolysis-fermentation, the complex structure of the plant is broken down by a
pretreatment followed by an acid or enzymatic hydrolysis to release sugars which are
then converted into ethanol by yeast or bacteria (Olofsson et al. 2008). Besides being an
uneconomical, multistep-multiconversion process, it also suffers from the major
drawback of not utilizing 25-30 % of the plant material, i.e. lignin (Tsai et al. 2009b).
Syngas fermentation is a two step process which combines gasification and fermentation.
In the first step, lignocellulosic feedstocks (switchgrass, miscanthus, corn stover, wheat
straw, wood waste and urban waste) can be gasified to produce a combination of carbon
monoxide, carbon dioxide and hydrogen gas (with other gases such as nitrogen, methane,
ammonia, hydrogen sulfide) that is called synthesis gas, producer gas or syngas. This gas
can then be fermented by anaerobic microbes such as Clostridium ljundahlii, Clostridium
autoethanogenum, Butyribacterium methylotrophicum, Clostridium carboxidivorans and

5
Figure 1.2 Fossil energy ratio (FER) of different processes (Wang 2005).
0
2
4
6
8
10
12
Electricity Gasoline Coal Corn EtOH Cell EtOH
FE
R=
Ene
rgy
in fu
el/ f
ossi
l ene
rgy
inpu
t

6
Clostridium strain P11 to form biofuels such as ethanol, isopropanol, butanol, hexanol
and specialty chemicals such as acetic acid, butyric acid and hexanoic acid (Abrini et al.
1994; Grethlein et al. 1990). The gasification-fermentation process can utilize all the
components of the biomass, which results in better conversion efficiency (McKendry
2002a). Furthermore, this process has the advantage of using different feedstocks (energy
crops, agricultural wastes, industrial wastes and forest waste) depending on their
availability and also using municipal waste, coal, natural gas, reformed gas, thus, making
gasification-fermentation a flexible technology (Tsai et al. 2009a).
Almost all the studies on syngas fermentation that have been performed on topics
such as design of novel reactors, optimization of media components and improving yields
of ethanol employ synthetic gas (gases are mixed from commercially available gases)
(Girbal et al. 1995a; Tsai et al. 2009b; Ungerman and Heindel 2008). However, the
biomass generated producer gas contains many other components such as methane,
acetylene, ethylene, ethane, nitric oxide, ammonia, hydrogen sulfide, benzene and toluene
that could affect the overall fermentation process (Ahmed 2006). A study by Ahmed et al.
(2006) on Clostridium carboxidivorans observed that nitric oxide in syngas can enhance
ethanol formation, but tars present in syngas inhibit cell growth. However, there were no
studies performed on biomass generated producer gas with P11. Thus, one of the
objectives of this study was to observe the effect of producer gas made from switchgrass
on P11 fermentations. It was hypothesized that the producer gas will affect P11 in a
similar way as it did for C. carboxidivorans. This study will help understand the nuances
of the fermentation problems that could be expected while using a biomass generated
producer gas.

7
Producer gas fermentation is a relatively new technology and most of the
transfer limited and the product (ethanol) is non-growth associated, it takes 15 to 45 days
to complete a batch study in bottle reactors. Thus, an attempt to improve the efficiency of
the process was performed by studying physical parameters such as agitation,
temperature and amount of headspace gas. The amount of headspace (or available gas)
was found as an important parameter by Frankman (2009). An experiment was conducted
to further increase the headspace to improve the productivity of the process. In addition
to headspace, agitation is an important parameter that affects mass transfer of gases. It
was hypothesized that increasing agitation of bottles would increase ethanol yields.
Finally, Clostridium bacteria are usually known to form spores by heat shock (Gapes et
al. 2000). Jones et al. (1982) observed a positive correlation between sporulation and
solventogenesis. This strategy of improving ethanol yields has not been conducted on
P11. Thus, the hypothesis was that inducing heat shock would induce solventogenesis,
which would eventually improve ethanol production. Hence, the study of the effect of
physical parameters would help to improve solvent yields and productivities of bottle
studies.
8
1.1 References
Abrini J, Naveau H, Nyns E. 1994. Clostridium autoethanogenum, sp. nov., an anaerobic
bacterium that produces ethanol from carbon monoxide. Archives of
Microbiology 161(4):345-351.
Ahmed A. 2006. Effect of biomass-generated syngas on cell growth, product distribution
and enzyme activities of Clostridium caboxidivorans P7T [Ph.D. Dissertation].
Stillwater: Oklahoma State University. 227 p.
Ahmed A, Cateni B, Huhnke R, Lewis R. 2006. Effects of biomass-generated producer
gas constituents on cell growth, product distribution and hydrogenase activity of
Clostridium carboxidivorans P7T. Biomass and Bioenergy 30(7):665-672.
Anderson DP, Outlaw JL, Bryant HL, Richardson JW, Ernstes DP, J. Marc Raulston,
Welch JM, Knapek GM, Herbst BK, Allison MS. 2008. The effects of ethanol on
Texas food and feed. College Station: Texas A&M Universtity. 39 p.
Anonymous. 2009a. Oil market basics Demand. Washington, DC: Energy Information
Adminstration.
Anonymous. 2009b. Growing innovation America’s energy future starts at home.
Washington, DC: Renewable Fuel Association.
Anonymous. 2009c. USDA feed grains baseline, 2009-2018. Washington, DC: US
Department of Agriculture Economic Research Service..
Frankman AW. 2009. Redox, pressure and mass transfer effects on syngas fermentation
[M.S Thesis]. Provo: Brigham Young University. 106 p.

9
Gapes J, Swoboda H, Haslinger A, Nimcevic D. 2000. The effect of heat-shocking on
batch fermentation by Clostridium beijerinckii NRRL B592. Applied
Microbiology and Biotechnology 54(1):118-120.
Girbal L, Croux C, Vasconcelos I, Soucaille P. 1995. Regulation of metabolic shifts in
Clostridium acetobutylicum ATCC 824. FEMS Microbiology Reviews 17(3):287-
297.
Grethlein A, Worden R, Jain M, Datta R. 1990. Continuous production of mixed alcohols
and acids from carbon monoxide. Applied Biochemistry and Biotechnology
24(1):875-884.
Huber GW, Iborra S, Corma A. 2006. Synthesis of transportation fuels from biomass:
Chemistry, catalysts, and engineering. Chemical Reviews 106:4044-4098.
Jones D, Van der Westhuizen A, Long S, Allcock E, Reid S, Woods D. 1982. Solvent
production and morphological changes in Clostridium acetobutylicum. Applied
and Environmental Microbiology 43(6):1434-1439.
Khanal SK. 2008. Anaerobic biotechnology for bioenergy production: Principles and
applications. Ames: Wiley-Blackwell. p 301.
Lashof D, Ahuja D. 1990. Relative contributions of greenhouse gas emissions to global
warming. Nature 344:529-531.
McKendry P. 2002. Energy production from biomass (part 1): Overview of biomass.
Bioresource Technology 83(1):37-46.
Olofsson K, Bertilsson M, Lidén G. 2008. A short review on SSF–an interesting process
option for ethanol production from lignocellulosic feedstocks. Biotechnology for
Biofuels 1:7.

10
Putsche V, Sandor D. 1996. Strategic, economic and environmental issues for
tranportation fuels. In: Wyman CE, editor. Handbook on bioethanol: Production
and utilization. Washington, DC: Taylor and Francis. p 19-35.
Rogers P, Chen J-S, Zidwick MJ. 2006. Organic acid and solvent production Part I:
Acetic, lactic, gluconic, succinic and polyhydroxyalkanoic ccids. In: Dworkin M,
editor. Prokaryotes.
Tsai S-P, Datta R, Basu R, Yoon S-H. 2009a. Syngas conversion system using
asymmetric membrane and anaerobic microorganism [Patent application]. USA.
Tsai S-P, Datta R, Basu R, Yoon S-H, Tobey RE. 2009b. Modular membrane supported
bioreactor for conversion of synags components to liquid products [Patent
application]. USA.
Ungerman A, Heindel T. 2008. Carbon monoxide mass transfer for syngas fermentation
in a stirred tank reactor with dual impeller configurations. Biotechnology Progress
23(3):613-620.
Urbanchuk JM. 2007. Contribution of the ethanol industry to the economy of the United
States. http://www.ethanolrfa.org/objects/documents/576/economic_contribution_
2006.pdf. Renewable Fuels Association. 10 p. accessed 12/2/2009.
Wang M. 2005. Energy and greenhouse gas emissions impacts of fuel ethanol
http://www.transportation.anl.gov/pdfs/TA/349.pdf. Argonne National
Laboratory. accessed 12/2/2009.
Wang M, Saricks C, Santini D. 1999. Effects of fuel ethanol use on fuel-cycle energy and
greenhouse gas emissions. Argonne: Argonne National Laboratory. 32 p.

11
Wyman CE. 1996. Ethanol production from lignocellulosic biomass: An overview. In:
Wyman CE, editor. Handbook on bioethanol: Production and utilization.
Washington, DC: Taylor and Francis. p 1-18.

12
CHAPTER 2
OBJECTIVES
The objectives of this research were as follows:
1. To study the effect of producer gas made from feedstocks such as switchgrass and
corn gluten feed in P11 fermentations. To observe the effect of 5% methane in
P11 fermentations.
2. To enhance solvent yields and productivities of producer gas fermentation bottle
studies by evaluating the physical parameters such as headspace gas, agitation and
temperature.
13
CHAPTER 3
REVIEW OF LITERATURE
3.1 Gasification process
Gasification is a very old technology. Producer gas was used to drive internal
combustion engines as early as 1791 (Foley et al. 1983). Back in the 1940’s, Sweden had
over 70,000 “GENGAS” trucks (Klass 1998). The first commercial gasification plant (in
England) used coal to produce a gas that was named “town gas” for street lighting
purposes (Klass 1998). The first gasification plant in North America was situated at
Baltimore (in 1816). By the end of the 19th century and first half of the 20th century, there
were more than 1500 operational gas plants, but after the discovery of natural gas, the use
of producer gas declined (Klass 1998). Interest in this technology grew again after the oil
crisis in the 1970’s and the increasing awareness on climate change and pollution caused
by the use of fossil fuels (Klass 1998; Milne et al. 1998).
Gasification is a thermo-chemical conversion process in which carbonaceous
materials (such as natural gas, naphtha, residual oil petroleum coke, coal or biomass)
reacts with a gasification medium (such as air, oxygen and/or steam) at high temperatures
(~600-1000 °C) to produce a mixture of gases called synthesis gas (syngas) or producer
gas (El-Rub et al. 2004; Huber et al. 2006; Kumar et al. 2009; McKendry 2002b; Spath
and Dayton 2003). The terms “syngas” and “producer gas” are used interchangeably, but

14
there is a difference between them based on the nitrogen content of the gas. Producer gas
is generally obtained when air is used as a gasification medium and hence it has
predominant levels of nitrogen and relatively smaller amounts of carbon monoxide,
carbon dioxide, hydrogen and methane unlike syngas that is predominantly made up of
carbon monoxide, hydrogen and carbon dioxide (Huber et al. 2006). The presence of
nitrogen significantly decreases the heating value of the producer gas (Belgiorno et al.
2003). On the other hand, syngas is made predominantly of carbon monoxide (CO),
carbon dioxide (CO2) and hydrogen (H2). The major components of producer gas are
carbon monoxide, carbon dioxide, nitrogen and hydrogen, but it also contains methane,
water, some higher hydrocarbons (acetylene, ethylene, ethane) and various contaminants
like inorganic impurities (ammonia, HCN, hydrogen sulfide, ash), char particles (that is
pure carbon and inert materials present in the feedstock) and organic impurities like tars
(Belgiorno et al. 2003; Bridgewater 1994; El-Rub et al. 2004). Gasification can be used
to convert low value feedstock’s into heat, electricity, transportation fuels (hydrogen,
Fisher-Tropsch diesel, synthetic gasoline) and chemicals like methanol and urea (El-Rub
et al. 2004; Huber et al. 2006). An outline of the syngas conversion process (after
gasification) with their end products is shown in Fig. 3.1.
Biomass such as energy crops, agricultural residues, food waste and forestry
residues can be used to make producer gas. The advantage of biomass compared to coal
is that biomass has highly oxygenated cellulose and hemicelluloses which makes it more
reactive (Huber et al. 2006; Klass 1998; Kumar et al. 2009). Furthermore, there is more
volatile content (2 to 2.3 times greater than coal) which in turn decreases the gasification
temperature (Huber et al. 2006; Klass 1998; Kumar et al. 2009). The major disadvantage

15
Figure 3.1 Syngas conversion process - Adapted from Spath and Dayton (2003).
Fermentation

16
of using biomass for gasification is the presence of alkali metals such as sodium,
potassium, calcium, magnesium and others which cause problems such as slagging and
fouling in gasification equipment (Huber et al. 2006).
The overall process of biomass gasification shown in Fig. 3.2, involves
preprocessing of biomass, gasification and gas clean up. Preprocessing of the biomass is
an upstream process that involves size reduction and drying. Size reduction increases the
surface area of the biomass and facilitates better heat transfer. General size reduction
equipment used for agricultural residues are hammer mills, knife mills and tub grinders.
The drying equipment includes perforated bin dryers, band conveyor dryers and rotary
cascade dryers (Kumar et al. 2009).
There are many of parameters that play an important role in this process, namely
design of a gasifier, gasification temperature, biomass flow rates, flow rates of oxidizing
agent, type and amount of catalyst present and biomass properties (Kumar et al. 2009).
The overall reaction of biomass gasification using air and/or steam can be represented by
the equation 3.1 (Kumar et al. 2009). The formation of char and tar is usually because of
the incomplete conversion of biomass (Kumar et al. 2009).
CHxOyNzSs (biomass) + air + H2O (steam) CH4+ CO + H2 + H2O (unreacted
steam) + C (char) + ash + tar (3.1)
There are a many complex equilibrium reactions that occur in the solid, liquid and
gaseous phase during biomass gasification (Huber et al. 2006). They are shown in Table
3.1. The ∆H value (Table 3.2) is the heat of the reaction; it is negative for exothermic
reactions and positive for endothermic reactions. It can be observed that the oxidation
reactions provide heat to the process and hence very little or no external heat needs to be

17
Figure 3.2 Overall flow diagram of a biomass- gasification process - Adapted from
Kumar et al (2009).
Preprocessing Gasification Gas clean-up Gas utilization
Size reduction, Drying
Heating, Chemical reactions, Catalysis
Cleaning of tar from syngas,
Reforming of the syngas, Catalysis
Gas turbine, Gas burner, Fuel cell,
Combined heat and power
(CHP), Fermentation Gasification process

18
Name of reaction Reaction ∆H
(kJ/mol)
Equation
number
Partial oxidation C + ½ O2 CO -268 (3.2)
Complete oxidation C + O2 CO2 -406 (3.3)
Methane formation CO + 3 H2 CH4 + H2O -206 (3.4)
Water gas shift CO + H2O CO2 + H2 -42 (3.5)
Steam reforming CH4 + H2O CO + 3 H2 -158 (3.6)
Water gas reaction C + H2O CO + H2 +118 (3.7)
Boudouard reaction C + CO2 2 CO +165 (3.8)
Table 3.1 Common reactions during gasification (Kasteren et al. 2005; McKendry
2002b).

19
supplied (Belgiorno et al. 2003). Thus, based on the availability of oxidizing agents,
gasification can be classified as direct or indirect gasification. Direct gasification is
provided with an oxidizing agent (such as air or pure oxygen) and in indirect
gasification, no oxidation agent is provided (Belgiorno et al. 2003; Huber et al. 2006).
Equations 3.4 to 3.7 occur in the presence of steam during gasification. Besides
stoichiometry, the product gas composition from a gasifier depends on biomass
composition, gasification process and gasifying agent (Narvaez et al. 1996).
Gasifiers are classified based on the type of bed: fixed bed (updraft and downdraft) and
fluidized bed. An updraft gasifier (Fig. 3.3a) is a counter flow set up where the biomass
in introduced from the top and air is introduced from the bottom. It is named updraft as
the product gas moves upward. Most of the combustion takes place in the bottom of the
bed and this process produces a lot of tars (Klass 1998; Kumar et al. 2009; Reed 1981).
On the other hand, downdraft gasifiers use concurrent flow. Both the biomass and the air
are fed from the top and the producer gas is collected from the bottom part of the gasifier.
Downward draft gasifiers (Fig. 3.3b) have more char and very low tars (Klass 1998;
Kumar et al. 2009; Reed 1981). Fluidized bed reactors (Fig. 3.3c) consist of a fluidizing
medium such as silica or alumina. The gasification agent (air, oxygen or steam) is
allowed to pass through a bed of fluidizing medium, which at a certain velocity results in
bed behaving like a fluid. The feed is introduced at the bottom with the gasification
agent. These reactors have better conversion efficiencies, high heat transfer and uniform
quality of the product gas and low levels of tars and char. The disadvantage of fluidized
bed reactor is that they are more prone to attrition and poisoning (Cateni 2007; Klass
1998; Kumar et al. 2009; Reed 1981).

20
Figure 3.3 Gasification reactors - Adapted from (Huber et al. 2006).
21
Gas clean up and reforming (also called gas conditioning) is a major downstream
process that is essential for effective utilization of producer gas by different processes
(Huber et al. 2006; Kumar et al. 2009). The producer gas consists of many particulates,
char, ash, tars, inorganic impurities (such as ammonia, hydrogen sulfide and many more)
and hydrocarbons that can profoundly affect the gas utilization technology (Belgiorno et
al. 2003; Bridgewater 1994; El-Rub et al. 2004). Among all these, tars has been the major
problem in the scale up of processes (Kasteren et al. 2005). Tars can be destroyed at high
temperatures, but generally the gasification temperature is below 1000°C (Huber et al.
2006; Kasteren et al. 2005). General methods of cleaning tars are wet scrubbing, dry
scrubbing, dry-wet scrubbing and hot gas conditioning, catalytic conversion or a
combination of these techniques (Huber et al. 2006). All these techniques involve
reduction of tars or conversion of tars into CO and H2, thereby, improving the overall
yield of the gasification process (Bridgewater 1994). In some cases, reforming of syngas
(process of changing the gas composition of a product gas to a desired composition) is
done for a particular gas utilization process such as fuel cells applications (Kumar et al.
2009).
3.2 Fermentation process
The fermentation of producer gas is a more recently studied technology. It is carried out
by acetogenic biological catalysts that convert producer gas into ethanol, acetic acid and
biomass. The overall schematic diagram of the gasification-fermentation process is
shown in Fig. 3.4. The conditioned gas from the gasifier is fed into a reactor that contains
all necessary nutrients for anaerobic growth of the microbe. The microbe produces
products such as acetic acid and ethanol, which could be recovered by distillation. There

22
Figure 3.4 Block flow diagram of a gasification- fermentation process - Adapted from
Spath and Dayton (2003).
Biomass Gasification,
Gas conditioning
Syngas or Producer gas fermentation
Product recovery by distillation
Tail gas
Water and nutrients
Ethanol, Acetic acid
Water and solubles

23
are numerous advantages and several disadvantages of this process that are listed below.
Advantages:
1. Fermentation of producer gas by biological catalysts takes place at lower
temperature and pressure than chemical catalytic processes, which drastically
reduces the energy requirements thereby decreasing the operating costs. Because
fermentations are carried out at atmospheric pressure, a specially designed reactor
is unnecessary, which in turn will decrease the capital cost involved in the process
(Heiskanen et al. 2007; Kasteren et al. 2005; Vega et al. 1988b; Worden et al.
1991).
2. Microbial processes have higher specificities, higher yields and better
productivity, thus, the amount of by products is very low (Kasteren et al. 2005;
Vega et al. 1988b; Worden et al. 1991).
3. Biological catalysts are not poisoned by trace contaminants like tars, hydrogen
sulfide, sulfur dioxide and carbonyl sulfide that could reduce the cost of syngas
clean up (Ahmed et al. 2006; Barik et al. 1988; Kasteren et al. 2005; Vega et al.
1990b; Worden et al. 1991)
4. Unlike other processes of syngas conversion, acetogens are very flexible with the
CO/H2 ratios and CO/H2/CO2 ratios (Huber et al. 2006; Kasteren et al. 2005). This
would negate the use of gas-shift reactions (Heiskanen et al. 2007).
5. Gaseous substrates such as CO and H2 allows uncoupling of hydraulic retention
time with the supply of substrate that eventually would offer a better control of
substrate and product inhibition (Henstra et al. 2007).
24
6. During anaerobic processes like syngas fermentation, the chemical energy in the
gas is conserved in the products as no electron is lost to oxygen (Worden et al.
1991).
7. No hazardous or xenobiotic product is formed in the process (Worden et al.
1991).
8. The tail gas (unconsumed gas) is also rich in energy content, which can be either
recycled or fed into another process.
9. The risk of contamination during producer gas fermentation is low because
operating temperatures are either mesophilic or thermophilic, carbohydrate levels
in the media are low, low operating pH and high CO levels that are inhibitory to
many classes of microorganisms like methanogens (Spath and Dayton 2003).
10. Gasification- fermentation processes circumvent the problem of disposal of lignin
(which are common in hydrolysis-fermentation process) as lignin can be gasified
(Lewis et al. 2008).
Disadvantages:
1. The acetogens involved in bioconversions of syngas produce very little metabolic
energy. This leads to slow growth and solvent production occurs only during non-
growth phase (Tsai et al. 2009b).
2. Due to the slow reactions, the residence time and reactor volume is high (Vega et
al. 1988b). In some cases, it may need special reactor design considerations
(Barik et al. 1988).

25
3. Gas solubility is another major issue. Carbon monoxide and hydrogen in the gas
must cross the gas-liquid interface and diffuse through the medium to reach the
cell surface (Vega et al. 1988b).
4. The product stream is dilute, which increases the product recovery costs
associated in the process (Vega et al. 1988b).
3.2.1 Stoichiometry of acetogenic bacteria
Bacterial conversion of CO, CO2 and H2 into ethanol, acetic acid and butanol
takes place using the stoichiometric equations shown in Table 3.2. Also shown are the
free energy of the reaction (∆Gº), which is a thermodynamic measure of the possibility of
a reaction. The reactions with highly negative free energies are more likely to occur.
Formation of butanol and butyric acid is listed in this table as there are a few organisms
such as Clostridium carboxidivorans and Butyribacterium methylotrophicum, that
produce them (Datar 2003; Worden et al. 1991).
Rates of reaction(s) and yields of acids and/ or solvents depend on the type of
species and/or strain, fermentation substrate, culture conditions and kind of products
formed (Zeikus 1980). However, from the reactions listed above in Table 3.2, it is evident
that formation of ethanol from CO is more favorable than acetic acid because the ∆Gº of
the reaction 3.9 is greater than 3.13. But the ∆Gº of ethanol and acetic acid from CO2 and
H2 (Eq. 3.10 and 3.14) are close to each other. Moreover, it can be observed that the
formation of both acetic acid and ethanol from CO (Eq. 3.9 and 3.13) is more favorable
than from CO2 and H2 (Eq. 3.10 and 3.14), clearly indicating that CO is a preferred
substrate for carbon and energy. This supports the observations in our laboratory from
gas analysis data of Clostridium strain P11 (that are presented in later chapters),

26
Reaction ∆Gº (KJ/mole) Equation number
6CO + 3H2O → C2H5OH + 4CO2 -225 (3.9)
6H2 + 2CO2 → C2H5OH + 3H2O -105 (3.10)
2CO + 4H2 → C2H5OH + H2O -137 (3.11)
6CO + 6H2 → 2C2H5OH + 2CO2 -315 (3.9) + (3.10) = (3.12)
4CO + 2H2O → CH3COOH + 2CO2 -175 (3.13)
4H2 + 2CO2 → CH3COOH + 2H2O -95 (3.14)
4CO + 4H2 � 2CH3COOH -159 (3.13) + (3.14) = (3.15)
10CO + 10H2 → 2C2H5OH + 2CH3COOH + 2CO2 -570 (3.12) + (3.15) = (3.16)
CH3COOH + 2H2 → C2H5OH + H2O -9.6 (3.17)
10 CO + 12H2 → 3C2H5OH + CH3COOH + 2CO2 + 2H2O -824 (3.16) + (3.17) = (3.18)
12CO + 5H2O → C4H9OH + 8CO2 -486 (3.19)
12H2 + 4CO2 → C4H9OH + 7H2O NA (3.20)
12CO + 12H2 → 2C4H9OH + 4CO2 NA (3.19) + (3.20) = (3.21)
Table 3.2 Stoichiometry of product formation from gaseous substrates; Adapted from (Barik et al. 1988; Phillips et al. 1994; Ragsdale
1991; Rajagopalan et al. 2002); NA- Not available.

27
Peptostreptococcus productus (Vega et al. 1988a) and Clostridium carboxidivorans
(Shenkman 2003) that these microbes preferentially consume CO when a mixture of CO,
CO2 and H2 is provided.
Different acetogens show preference to different gaseous substrates or mixture of
gases for acid and/or solvent production. For example, Acetoanaerobium noterae can
produce acetate, propionate and butyrate (Gaddy 1998). Other organisms such as A. kivui,
P. productus and Acetobacterium woodii have shown the ability to carry over the
reactions 3.13 and 3.14 (Gaddy 1998). P. productus has shown preference to equation
3.13 over 3.14 and demonstrates higher tolerance to CO (Vega et al. 1988a). However,
Clostridium ljundahlii showed ability to carry out reactions 3.13 and 3.14 (acetic acid
production) at faster rates that reactions 3.9 and 3.10 (ethanol production) (Gaddy 1998).
Besides this, C. ljundahlii showed reactions 3.13 and 3.14 (production of acetic acid) at
higher pH and reactions 3.9 and 3.10 (production of ethanol) at lower pH (Gaddy 1998).
C. carboxidivorans shows ability to carry out ethanol production using equations 3.12
(with a yield of 0.33 moles of ethanol/ mole of CO consumed) and acetic acid production
using 3.13 and 3.14 (Lewis et al. 2007). Moreover, Lewis et al. (2007) also observed that
CO2 was essential for the growth of this microorganism.
The yield of a fermentation process depends on the molar concentration of gases
available (Datar et al. 2004). From the stoichiometric equations, it can be seen that one-
third of the carbon in CO is converted into ethanol (Eq. 3.9), thereby, making theoretical
conversion of CO to ethanol as 0.33 when CO is the only source of carbon (Rajagopalan
et al. 2002). However, this theoretical conversion cannot be achieved practically because
the acetyl-CoA pathway requires reducing equivalents which is provided from oxidation
28
of CO into CO2 using the enzyme CODH (carbon monoxide dehydrogenase) (Datar et al.
2004). The fermentation process can take place in the absence of CO as well. When CO2
and H2 are available in the ratio 1:3, all the carbon in CO2 can be converted into ethanol
(through Eq. 3.10) (Datar et al. 2004). However, this stoichiometric molar concentration
is difficult to achieve through gasification. Also, if we have an equimolar concentrations
of CO and H2, a theoretical yield of 0.667 can be achieved (sum of Eq. 3.12), or in other
words, two thirds of the carbon in CO can be converted into ethanol (Datar et al. 2004).
But, production of ethanol from CO and H2 from equation 3.11 was also listed by Barik
et al. (1988) and the possibility of its occurrence cannot be ruled out in Clostridium strain
P11. However, acetic acid is an important growth related product in syngas
fermentations. Thus, the actual overall equation of the fermentation process in the
presence of CO, CO2 and H2 is shown in equation 3.16. According to this equation, four
tenths of carbon in CO would go towards ethanol formation and four tenths would go
towards acetic acid production, thus making the theoretical yield of both acetic acid and
ethanol as 0.40.
3.2.2 Acetogens, their metabolism and energetics
Syngas conversion into acetic acid and ethanol is carried out by a special group of
bacteria called acetogens. Acetogenic bacteria belong to one of the two metabolic groups
of bacteria (other being methanogenic archae) that can grow autotrophically or can obtain
virtually all of their carbon by reducing CO2 (using acetyl-CoA pathway) with electrons
derived from H2 (Imkamp and Muller 2007; Ragsdale 1991). “Acetogens can be defined
as obligately anaerobic bacteria that can use acetyl-CoA pathway as their predominant a)
mechanism for reductive synthesis of acetyl-CoA from CO2, b) terminal electron

29
accepting, energy conserving process and c) mechanism for the synthesis of cell carbon
from CO2” (Drake 1992). Acetogenic bacteria are one of the most versatile groups of
organisms. They are found in a wide variety of habitats such as gastro-intestinal,
terrestrial, subsurface and aquatic ecosystems and have ability to grow both
chemoorganoheterotrophically (like sugars, C1 compounds, methoxylated aromatic
compounds, acids and alcohols) and chemoautotrophically (on H2 and CO2) (Imkamp and
Muller 2007).
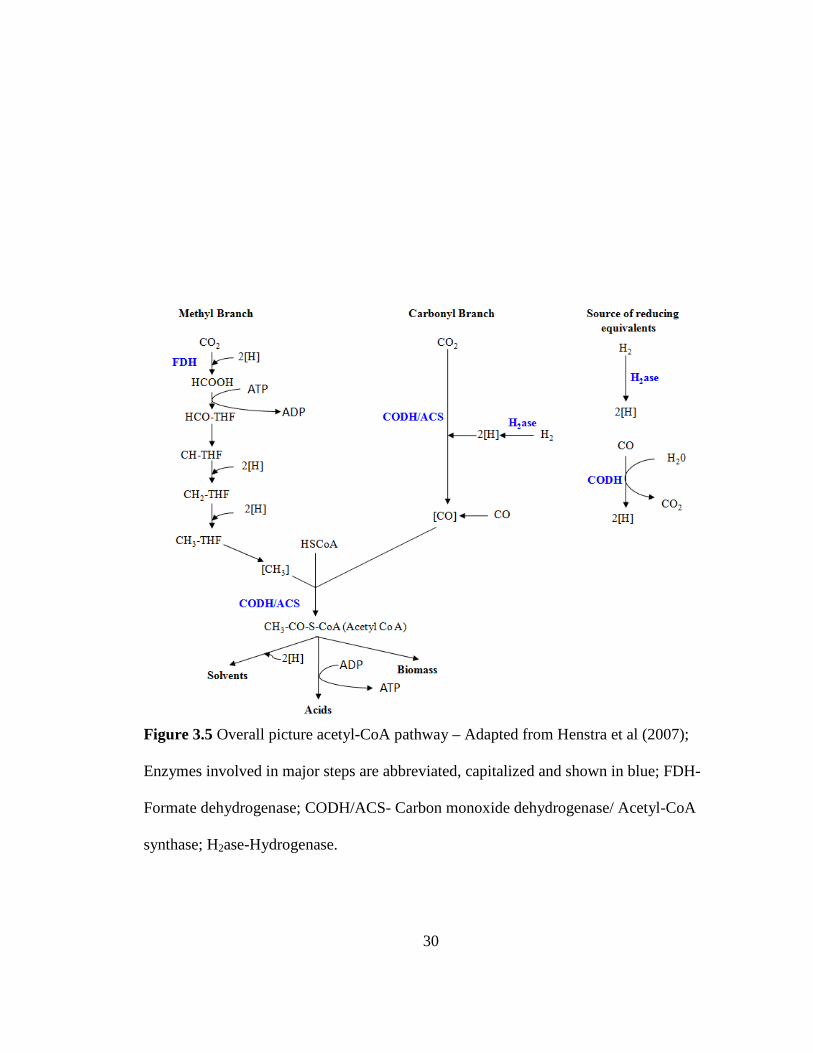
The reduction of CO2 for the formation of acetyl-CoA (the major metabolic
intermediate in acetogens) occurs through the metabolic pathway called the acetyl-CoA
pathway/ Wood pathway/ Wood-Ljundahl pathway (Ljundahl 1986; Ragsdale 1991).
Acetogens cannot use the autotrophic Calvin cycle that is employed by many
photosynthetic and chemosynthetic autotrophs as it lacks the enzyme ribulose
diphosphate carboxylase (Rogers et al. 2006; Wood et al. 1986). Acetyl-CoA pathway is
a non cyclic, irreversible pathway consisting of two reductive branches: the methyl
branch and carbonyl branch as shown in Fig. 3.5 (Henstra et al. 2007; Ragsdale 1991).
On the methyl branch, CO2 is first reduced to formate using a NADP-dependant formate
dehydrogenase enzyme. Formate is then converted into a formyl group bound to pterin
hydrofolate with an expense of one ATP (energy). Formyl is further reduced (using four
reducing equivalents/electrons) to a methyl group of a protein via methenyl, methylene
and methyl intermediates via several tetrahydrofolate-dependant reactions (Drake and
Kusel 2005; Henstra et al. 2007). There are numerous cofactors and enzymes that play an
important role in the methyl branch. On the other hand, the carbonyl branch is dominated
by only one enzyme: carbon monoxide dehydrogenase (CODH). This enzyme is also
30
Figure 3.5 Overall picture acetyl-CoA pathway – Adapted from Henstra et al (2007);
Enzymes involved in major steps are abbreviated, capitalized and shown in blue; FDH-
Formate dehydrogenase; CODH/ACS- Carbon monoxide dehydrogenase/ Acetyl-CoA
synthase; H2ase-Hydrogenase.

31
called as CO: methylated corrinoid iron sulfur protein: CoA lyase or acetyl-CoA synthase
(ACS) as it helps in the synthesis of the energy rich compound acetyl-CoA (Brock et al.
1994; Ljundahl 1986; Ragsdale 2004). If CO is readily available, it can be directly bound
to the CODH-ACS enzyme. Otherwise, CO2 is reduced to CO with the help of two
reducing equivalents/electrons that then bind to the enzyme CODH-ACS. CODH and
ACS is denoted as CODH/ACS to show their bi-functional character of both oxidation
and reduction of CO and CO2, respectively (Imkamp and Muller 2007). Finally, ACS
assembles the two precursors (methyl and carbonyl moieties) with CoA to form acetyl-
CoA. This energy rich molecule now serves as both a catabolic precursor (for acetate
synthesis) and an anabolic precursor (for biomass synthesis) (Drake and Kusel 2005).
The formation of acetyl-CoA needs the investment of energy (Henstra et al.
2007). To recover the energy invested, an acetate molecule is formed by the enzymes
phophotransacetylase and acetate kinase by the mechanism of substrate level
phosphorylation (Henstra et al. 2007; Imkamp and Muller 2007). ATP is also obtained
while producing other acids like butyric acid (shown in Fig. 3.6). The formation of
solvents (like ethanol and butanol) requires reducing equivalents/ electrons as shown in
Fig. 3.5. Fig. 3.6 describes the production of acids (acetic acid and butyric acid) and
solvents (ethanol, butanol and isopropanol) in detail with the names of enzymes
associated with the process. The production of butyric acid, butanol, acetone and
isopropanol occurs when two molecules of acetyl-CoA are combined to form acetoacetyl-
CoA. Conversion of acetoacetyl-CoA to butyryl-CoA requires more reducing power.
Additional reducing power is need to produce solvents like isopropanol and butanol, but
butyric acid production is associated with a release of ATP through substrate level

32
Figure 3.6 Production of different acids and alcohols from acetyl-CoA – Adapted from
Brock et al (1994), Phillips et al (1994) and Vasconcelos et al (1994); Enzymes involved
in major steps are abbreviated, capitalized and shown in blue; FDH- Formate
dehydrogenase; CODH/ACS- Carbon monoxide dehydrogenase/ Acetyl-CoA synthase;
H2ase- Hydrogenase; ADH- Acetaldehyde dehydrogenase; EDH- Ethanol
dehydrogenase; PTA- Phosphotransacetylase; AK- Acetate kinase; CoAT- CoA-
transferase; ADC- Acetoacetate decarboxylase; IDH- Isopropanol dehydrogenase;
HBDH- 3-Hydroxybutyryl-CoA dehydrogenase; BDH- Butyraldehyde dehydrogenase
and Butanol dehydrogenase in the formation of butyraldeyde and butanol respectively;
PTB- Phosphotransbutyrylase; BK- Butyrate kinase.
Acidogenesis Solventogenesis

33
phosphorylation.
The reducing equivalents required for both the branches of the acetyl-CoA
pathway and/or for the production of solvents are obtained by either oxidation of
hydrogen by the enzyme hydrogenase or by oxidation of CO by the enzyme CODH
(These reactions are also shown in Fig. 3.5 under the title source of reducing equivalents)
(Ragsdale 2004). Enzymes such as hydrogenase and CODH are located near the
cytoplasmic membrane and play an important role in electron transfer mechanisms
(Ljundahl 1986). Besides hydrogenase and CODH, other electron donors like NADH
dehydrogenase and electron acceptors, such as methylene-H4F reductase, are also
associated with the cytoplasmic membrane (Imkamp and Muller 2007).
Besides substrate level phosphorylation, acetogens can conserve energy through
the chemiosmotic mechanism (otherwise called electron transport phosphorylation) and
in some conditions both processes can occur simultaneously (Drake et al. 2006; Imkamp
and Muller 2007). Chemiosmotic mechanism involves generation of ATP through a
transmembrane gradient using the enzyme F1-F0 ATP synthase (Imkamp and Muller
2007). It could be either proton (H+) dependant (as in Moorella thermoautotrophicum) or
sodium (Na+) dependant (as in A. woodii and Ruminococcus productus) (Drake et al.
2006; Imkamp and Muller 2007). Besides these two systems, there are also sodium-
proton antiporters (as present in T. kivui) that help to conserve energy in acetogens
(Drake et al. 2006).
3.2.3 Biphasic fermentation pattern in solvent producing acetogens
Most acetogens such as Clostridium acetobutylicum, Clostridium carboxidivorans
(formerly known as P7) and Clostridium strain P11 show a distinct pattern. They produce
34
acids (such as acetic acid and butyric acid) while in exponential growth phase, which
leads to a decrease of pH from near neutral (around 6) to as low as 4 (Girbal et al. 1995b;
Maddox et al. 2000). This phase of rapid decrease in pH and increase in acid
concentrations is called acetogenesis (or acidogenesis). Formation of acids is growth
related due to the concomitant production of ATP. The second phase, solventogenesis, is
observed to be non-growth associated and leads to formation of reduced products such as
ethanol, isopropanol and butanol; sometimes accompanied with a pH increase (Ahmed et
al. 1988; Maddox et al. 2000).
The solventogenesis can be strongly influenced by the regulation of electron flow
(Rao et al. 1987). This has been exhaustively studied on the microbe C. acetobutylicum
for optimizing solvent yields. Studies on inducing solventogenesis in C. acetobutylicum
and other microorganisms are discussed below:
1. Increasing the partial pressure of CO
It has been observed that CO inhibits clostridial hydrogenase, which plays an
important role in hydrogen production to balance the excess reducing power generated by
glycolysis (Girbal et al. 1995a). Thus, the electrons are directed towards reduction of
NAD to NADH (instead of reducing ferredoxin) (Rao and Mutharasan 1986).
Consequently, there is more reducing power available for solvent production which
results in increase of butanol to acetone ratio (Bahl et al. 1986). However, this
phenomenon of hydrogen production is not observed in Clostridium strain P11 as
hydrogen is used as an electron donor in P11 fermentations.
2. Addition of reducing agents (or external electron mediators):
Many acetogens have a branched metabolism (as shown in Fig. 3.6) and the

35
product distribution changes with the redox potential (Mariotto et al. 1989). A number of
reducing agents (like sodium thioglycolate, cysteine, ascorbic acid, sodium sulfide,
titanium citrate, methyl viologen and others) have been added to fermentation media
which has increased solvent formation (Mariotto et al. 1989; Rao et al. 1987). Rao and
Mutharsan (1986) employed methyl viologen that decreased the hydrogen production and
altered the electron flow towards NADH dependant alcohol formation in the microbe C.
acetobutylicum. Besides C. acetobutylicum, positive effect on solventogenesis was also
observed by the addition of methyl viologen on a strict anaerobic bacteria
Thermoanaerobacter ethanolicus (Rao et al. 1987). Similar results were also obtained
with benzyl viologen that showed the induction of solventogenesis at neutral pH contrary
to the belief that solvent formation occurs only at low pH (Rao and Mutharasan 1987).
Recent studies by Pannerselvam (2009) in our lab showed a two fold increase in ethanol
concentrations when methyl viologen was used as a reducing agent in P11 fermentations
when compared to cells that were not reduced with methyl viologen. Similar observations
were also reported by Ahmed (2006) on C. carboxidivorans with neutral red as an
electron mediator. There was an increase in ethanol, decrease in acetic acid and increase
in forward alcohol dehydrogenase (ADH) activity, clearly indicating the regulation of
electron and carbon flow towards ethanol formation.
3. Elevated ATP and NADH levels
ATP limitation by limiting glucose in continuous cultures enhanced acid
production in C. acetobutylicum (Meyer and Papoutsakis 1988). Meyer and Papoutsakis
(1988) experimentally showed that increase in ATP and NADH through CO gassing.
Once ATP and NADH are readily available, the cells would produce reduced products

36
such as ethanol and butanol (Meyer and Papoutsakis 1988). Lower ATP demands and
larger availability of reducing power leads to solvent production (Girbal et al. 1995b).
4. pH
pH is an important parameter in acetogens because it gives the first indication of
the change in metabolism from acidogenesis to solventogenesis (Girbal et al. 1995b;
Maddox et al. 2000). In batch cultures, solventogenesis has been correlated with pH and
concentration of intracellular acids. Increasing the concentration of undissociated butyric
acids by decreasing the intracellular pH increased acetone and butanol production in C.
acetobutylicum (Monot et al. 1984). Higher intracellular acid concentrations was related
to shift in metabolism of acetogens (Grupe and Gottschalk 1992) and the intracellular
concentration of acids can be increased by addition of butyrate, propionate, valerate and
4-hydroxybutyrate at neutral pH (Jewell et al. 1986; Martin et al. 1983)
5. Nutrient limitation or addition
In general, the limitation of an essential nutrient responsible for the formation of a
product that is undesirable (like acids) switches the mechanism towards solventogenesis.
Junelles et al. (1988) showed that iron limitation affected the carbon and electron flow in
the microbe C. acetobutylicum. The activity of hydrogenase decreased by 40% and the
butanol-acetone ratio increased from 3.7 to 11.8. Decrease in the activity of hydrogenase
was observed because iron is an important component of hydrogenase. Additionally, it
has been reported that simultaneous addition of methyl viologen and depletion of iron
from the media had an additive effect on butanol production using C. acetobutylicum
(Peguin and Soucaille 1995). Contrary to these findings, a recent patent application by
Lewis et al (2007) reported that an increase in ethanol production by a factor of two was

37
obtained when the concentration of iron was increased from 20 µM to 200 µM in the
microbe C. carboxidivorans. This increase could be due to the reason that iron is an
important constituent of the enzymes such as FDH, CODH and hydrogenase (Andreesen
and Ljungdahl 1973; Drennan et al. 2004; Ragsdale et al. 1983; Vignais et al. 2001;
Yamamoto et al. 1983).
Bahl et al. (1986) found that the butanol to acetate ratio increased by 1.9 times in
a low phosphate synthetic medium with co-fermentation of lactate using C.
acetobutylicum. The butanol to acetone ratio further increased from 2:1 to 8:1 in a media
with low phosphate and iron limitation.
Yeast extract acts as a nitrogen source in syngas fermentations. Klasson et al.
(1992) decreased the yeast extract concentration from 2 g/l to 0.05 g/l, which increased
the ethanol-acetate ratio by two times. Another study showed that yeast extract was
necessary for autotrophic growth (H2, CO2) of the microbes Clostridium strain F5a15,
Streptococcus strain S5a2 and Ruminococcus strain S5a33; the biomass increased with
the increasing concentrations of yeast extract (Leclerc et al. 1998). They found out that
the vitamins in yeast extract played a crucial role in acetate synthesis. Barik et al. (1988)
have mentioned that a 300% increase in ethanol to acetate ratio was obtained using a
Clostridium species when yeast extract was completely removed from the media.
Ammonium (nitrogen source) limitation studies conducted by Roos et al. (1985) on the
microbe C. acetobutylicum also showed increased concentration of butanol with lower
ammonium-glucose ratio in a pH uncontrolled fermentation.
Other important components of media for acetogens are trace metals, minerals
and vitamin solution (Wiegel et al. 2006). A report from Bioengineering Resources Inc.
38
(Anonymous 1995) describes that the limitation of trace metals and minerals had little
effect on ethanol/acetate ratio in the microbe C. ljundahlii. However, decreasing the
concentrations of B-vitamins such as biotin and thiamine stimulated both growth and
ethanol concentrations and eliminated the production of acetic acid. Contrarily, acetic
acid concentrations were increased by decreasing the concentrations of calcium
pantothenate (Anonymous 1995).
Glycerol is a more reduced substrate than glucose. C. acetobutylicum cultures
grown on a mixture of glucose and glycerol had a seven fold increase in NADH and 2.5
fold increase in ATP concentrations when compared to cultures grown on glucose
(Vasconcelos et al. 1994). They also observed decreased hydrogenase activity and
increased alcohol dehydrogenase activity, thus, leading to increased concentrations of
ethanol and butanol and decreased concentrations of acetic acid, butyric acid and
hydrogen.
3.2.4 Sporulation and degeneration in clostridia
Sporulation is a defense strategy developed in certain kind of bacteria (such as
Bacillus and Clostridium species) to overcome unfavorable environmental conditions
such as heat, nutrient limitation, loss of water, irradiation etc (Durre 2005). During
unfavorable conditions, the metabolism of bacteria reduces to a minimum and numerous
distinct morphological and cytological changes take place such as elongation of the cells,
formation of cigar shaped structures and more (Durre 2005; Jones et al. 1982). Clostridia
generally form endospores, but other structures like exospores and cysts have also been
reported (Durre 2005). Jones et al. (1982) carried out an exhaustive study on solvent
production and morphological changes in C. acetobutylicum. They found a positive
39
correlation between sporulation and solventogenesis. The cells showed granulose
accumulation 1-2 hours prior to the pH breakpoint (a point where acidogenesis ends and
solventogenesis is induce and within 1-2 hours of this point, 90% of the cells attained
swollen, phase bright, gram positive clostridial form. The culture that was sporulating
produced almost 56 times more ethanol than the non sporulating mutants. Moreover,
these clostridial forms (swollen, phase-bright presporulation-stage cells were involved in
further conversion of acetate and butyrate into acetone and butanol. An explanation for
the increased solvent production comes from studies conducted on Clostridium
thermosaccharolyticum that sporulation was associated with up-regulation of enzymes
such as ethanol dehydrogenase and glucose-6-phosphate dehydrogenase that are
important for ethanol production (Jones et al. 1982).
Sporulation genetics has been widely studied in C. acetobutylicum and C.
beijerinckii (Rogers et al. 2006). It has been found that solventogenesis and sporulation
are activated by a common regulatory element (Spo0A protein) and thus all the cells
starting to form solvents will also form spores. Furthermore, Spo0A protein, a regulatory
protein responsible for the induction of sporulation formed by the expression of Spo0A
genes, has been found to control the shift from acidogenesis to solventogenesis in the
microbes C. acetobutylicum and C. beijerinckii (Dürre and Hollergschwandner 2004;
Harris et al. 2002; Ravagnani et al. 2000). Besides sporulation, some reports also
suggests the presence of heat shock proteins (hsp74) induced by heat stress are
responsible for solvent production (Terracciano et al. 1988). Popoutsakis (2005) reported
that over expression of heat shock proteins (GroESL) resulted in an increased production
and tolerance of butanol in the microbe C. acetobutylicum.

40
Long et al. (1983) developed a defined media for sporulation of C.
acetobutylicum P262 and five other strains. Although, C. acetobutylicum P262 showed
sporulation and solvent production with the defined media, other strains produced 7.5-11
times lesser solvents. This clearly indicates that different microorganisms have different
optimum conditions for spore formation and no generalizations can be made based on the
result of one study.
Contrary to the finding of Jones et al. (1982) and Long et al. (1983), Tracy et al.
(2008) found an inverse correlation between butanol production and sporulation in C.
acetobutylicum ATCC 824. They observed that this strain carried out multiple levels of
sporulation, but the amount of vegetative cells was directly proportional to butanol
concentrations. It was proposed that the clostridial form cell precursor was responsible
for solvent production rather than clostridial form cells. Advanced technology such as
flow cytometry and fluorescence assisted cell-sorting techniques were used to precisely
study the endospore formation.
The process of inducing sporulation has been a common practice for inoculum
development. Sporulation can be induced by heat shock treatment. This process of heat
shocking has widely been used to overcome the degeneration issue observed in many
clostridial species such as C. butylicum (now called as C. beijerinkii), C. pasteurianum,
C. acetobutylicum and others (Calam 1980; Gapes et al. 2000; Gapes et al. 1983;
Kutzenok and Aschner 1952; Martin et al. 1983; Spivey 1978).
Clostridial strain degeneration is a widely observed, irreversible phenomenon by
which solvent producing clostridia lose their ability to produce solvents when they are
kept in vegetative state for a long time, which is a result of transferring actively growing

41
cells into fresh media (Kashket and Cao 1995; Rogers et al. 2006). For example, Gapes
et al (1983) found that lactose utilization and butanol concentrations in C. butylicum
increased for the first 3 subcultures, but after that degeneration was rapid. After the sixth
subculture, the microbe did not produce any solvents. These observations are also noted
in both repeated culturing of batch as well as continuous cultures (Finn and Nowrey
1959; Gapes et al. 1983; Kutzenok and Aschner 1952; Stephens et al. 1985). Strain
degeneration is found to be a slow process and failure to induce solventogenesis is found
to be associated with loss of important genes responsible for encoding the key enzymes
for solvent production such as aldehyde/alcohol dehydrogenase, acetoacetate
decarboxylase and acetoacetyl coenzyme A transferase (Stim-Herndon et al. 1996).
Assobhei et al (1998) also observed an increase in enzymatic activities of acetate kinase
and butyrate kinase that are responsible for the production of acetic acid and butyric acid
in degenerated cells. Such culture degenerations have challenged the industrial
production of solvents by the use of these microorganisms. To overcome this issue,
cultures are maintained by repeated heat shocking (Kashket and Cao 1995).
The effect of heat shocking was carried on the microbe C. beijerinkii B592 over a
wide range of temperatures (from 45 ºC to 95 ºC) and time (2.5 min to 10 min) (Gapes et
al. 2000). They found that 95 ºC heat shocks for 2.5 minutes gave the highest butanol to
acetone yield.
There are other observations that are very similar to degeneration phenomena
noted during a particular fermentation run. These are called acid crash and acidogenic
fermentation, which also leads to failure in the induction of solventogenesis. Previously,
both these phenomena were confused with culture degeneration. Maddox et al. (2000)

42
defined acid crash as an early cessation of sugar uptake and solvent production when the
culture pH is below 5 (for culture C. beijerinkii NRRLB592). This happened due to
excess concentrations (about 57-60 mM or 3.6 g/l) of undissociated acids such as acetate
and butyrate (Maddox et al. 2000). They suggested that acid crash could be prevented by
having some pH control (to minimize the concentration of undissociated acids) or
decreasing the metabolic rate of fermentation by decreasing temperature. On the other
hand, acidogenic fermentation is characterized by high sugar utilization leading to fast
growth and high acid production (total concentrations of 240-250 mM), but slow solvent
production when the pH is controlled near neutrality and yeast extract is present in large
amounts (Maddox et al. 2000). This phenomena can be prevented and solvent production
can be regained by slowing down the glucose uptake rate or acid production rate by
increasing the initial glucose concentrations and lowering the yeast extract concentrations
(Maddox et al. 2000).
3.2.5 Effect of syngas contaminants in the fermentation process
Besides CO, CO2, H2 and N2, producer gas has numerous contaminants like char,
ash, tars (benzene, toluene, xylene and many more), inorganic impurities (such as
ammonia, hydrogen sulfide, nitric oxide etc) and hydrocarbons (acetylene, ethylene, and
methane) that can profoundly affect the scale up processes in fermentation process
(Ahmed 2006; Belgiorno et al. 2003; Bridgewater 1994; El-Rub et al. 2004). Most of the
studies to date in the area of gasification-fermentation employ the use of simulated or
synthetic gas mixes (Girbal et al. 1995a; Tsai et al. 2009b). There is a belief that
microbial catalysts can tolerate sulfides (such as carbonyl sulfide, hydrogen sulfide and
sulfur dioxide), chlorine compounds and tars, but the effect of contaminants has never

43
been studied exhaustively (Barik et al. 1988; Spath and Dayton 2003). The cost of the
overall process can be reduced drastically if the microorganisms are found to tolerate the
contaminants (Spath and Dayton 2003). The limited literature on effect of contaminants
have both shown positive and negative effects of syngas contaminants on growth and
product distribution of a microbial catalyst. Most of the contaminants affect by the
metabolism of the microbe by deactivating the enzymes such as CODH, hydrogenase and
others.
Sulfur compounds such as hydrogen sulfide (H2S), carbonyl sulfide (Gerhardt et
al.) and sulfur dioxide (SO2) are usually found in gas from coal gasification and they
adversely affect chemical catalysts (Anonymous 1995). A report from Bioengineering
Resources Inc. (BRI) shows that the presence of H2S up to 2.5 % did not affect the uptake
of CO and H2 uptake rate and the growth of C. ljundahlii (Anonymous 1995). However, a
strong inhibition to growth and gas uptake rate were observed when the concentrations
were increased to 10%. However, the culture acclimated to sulfur gases showed an
improved tolerance up to 20% (Smith et al. 1991; Vega et al. 1990b). Another CO
utilizing microbe, Rhodospirillum rubrum was also found to degrade 5% carbonyl sulfide
(Gerhardt et al.) within 20 h (Smith et al. 1991).
Effect of other contaminants like nitric oxide (NO) and acetylene (C2H2) has been
studied on closely related species like nitrogen fixing bacteria and methanogens. Tibelius
and Knowles (1984) observed the inhibition of oxygen dependant hydrogenase in a
nitrogen fixing microorganism with nitrite, NO, CO, C2H2. Of the four, NO and nitrite
was found to inhibit the hydrogenase irreversibly, but CO and C2H2 was found to have a
reversible effect. Nitric oxide is formed due to some combustion effects during

44
gasification (West et al. 2005) and is known to be an inhibitor of hydrogenase (Hyman
and Arp 1988; Krasna and Rittenberg 1954; Tibelius and Knowles 1984). It was found
that nitric oxide deactivated hydrogenase activity in Proteus vulgaris at concentrations
above 1%, but the inhibition was reversible at lower concentrations (Hyman and Arp
1988; Krasna and Rittenberg 1954). A slow, time dependant, reversible inhibition in the
presence of NO was found in the NAD linked hydrogenases (in the microbe Alcaligenes
eutrophus) which are responsible for oxidation of hydrogen (Hyman and Arp 1988).
Tibelius and Knowles (1984) have also found NO to be a strong irreversible inhibitor to
oxygen dependant hydrogenase. Reddy et al. (1983) suggested NO inhibited hydrogenase
because it destroyed the four iron-sulfur centers which are important for the proper
functioning of hydrogenases. Hyman and Arp (1991) explained the mechanism of
reversible inhibition of NO in membrane associated hydrogenase in a nitrogen fixing
bacteria, Azobacter vinelandii. They suggested that NO does not react at the nickel-
hydrogen binding site. Rather, it is involved in interactions with iron sulfur centers which
play crucial roles in enzyme catalysis and interaction. Effect of NO on C.
carboxidivorans was studied closely by Ahmed and Lewis (2007). They observed that
concentrations above 40 ppm NO acted as a non competitive, reversible inhibitor to
hydrogenase. At the same time, they also observed increase in ethanol production by 5-7
times at all concentrations of NO. The reason for this increase was found due to increased
activity of alcohol dehydrogenase enzyme.
Tars such as benzene, toluene, ethyl benzene, p-xylene, o- xylene and napthalene
have been detected in producer gas produced from switchgrass gasification (Ahmed
2006; Ahmed et al. 2006). In batch experiments, it was observed that tars increased the

45
lag phase but also promoted ethanol concentration (by a factor of two) and decreased
acetic acid concentration (by a factor of 2.5). The removal of tars using 0.025 µm filters
prevented growth inhibition.
Besides tars, hydrocarbons such as methane (CH4), acetylene (C2H2) , ethylene
(C2H4) and ethane (C2H6) are generally found in biomass derived producer gases (Ahmed
2006). The concentrations of these contaminants are in the range of 1-7% CH4, 0.1-0.5%
C2H2, 0.5-2% C2H4 and 0.3-1% C2H6. C2H2 was found to be a slow binding, active site
directed reversible inhibitor for nickel-ferrous hydrogenase present in nitrogen fixing
bacteria that catalyze the oxidation of hydrogen (Sun et al. 2002). Ethane was found not
to affect cell growth in C. carboxidivorans but acetylene and ethylene were found to
increase cell mass by 33% and 55%, respectively (Ahmed 2006). The concentrations of
products were not reported by Ahmed (2006), but it is definitely clear that cell growth
was promoted by these contaminants. Although methane is believed to be an inert gas
and has been used as a pressure indicator for gas analysis calculations (Vega et al.
1988a), effect of 4.5 % methane was carried out by Datar (2003) in C. carboxidivorans.
He observed that concentrations of 4.5% methane did not affect gas utilization or growth,
which confirmed the inert nature of methane to C. carboxidivorans.
It is difficult to make an atmosphere oxygen free during gasification, gas clean up
and storage; quite often the presence of oxygen in producer gas has been reported (Datar
2003). Oxygen is one of the most toxic gases to acetogens because many of the enzymes
present in the acetyl-CoA pathway are extremely sensitive to oxygen (Drake et al. 2006).
However, there are some acetogens like A. woodii, C. magnum, C. glycolicum RD-1 and
M. thermoacetica that can tolerate and consume oxygen at concentrations of 0.5%-6%
46
(Drake et al. 2006; Karnholz et al. 2002). C. glycolicum RD-1 is one the most interesting
acetogens because it can withstand up to 6% oxygen (Kusel et al. 2001). It can
simultaneously carry out acidogenesis and ethanol fermentation under anoxic conditions.
In the presence of oxygen, it produces more ethanol, lactate and hydrogen. It is concluded
that under oxic conditions, the metabolism of acetogens shift towards the catabolic
pathway where the enzymes are less sensitive to oxygen (Drake et al. 2006; Kusel et al.
2001). Furthermore, a few acetogens such as A. woodii, C. magnum, S. silvatica, M.
thermoacetica, C. glycolicum RD-1 contain enzymes involved in the removal of oxygen
or its toxic products such as NADH-oxidase, peroxidsase, superoxide dismutase,
rubredoxin oxidoreductase and rubrerythrin (Drake et al. 2006; Karnholz et al. 2002;
Kusel et al. 2001). Datar (2003) studied the effect of oxygen on C. carboxidivorans and
found that oxygen concentrations up to 1900 ppm (or 0.19%) did not affect CO and H2
utilization, growth and product formation, which is indicative that C. carboxidivorans
have mechanisms to remove the toxic products of oxygen.
3.2.6 Bioreactor designs and latest developments in producer gas fermentation
technology
Gas liquid mass transfer is a major issue for syngas fermentations because of the
low solubilities of H2 and CO (Anonymous 1995; Klasson et al. 1992). The reaction rate
(or gas transport rate), d���/dt is given by (Anonymous 1995):
����
���
�
���
� (3.19)
Where, d��� is the number of moles of gas transported from the gas phase
�� is the liquid volume of the reactor
47
t is time
��a is the mass transfer coefficient
H is Henry’s law constant
��� is partial pressure of substrate in gas phase
From equation 3.19 it can be observed that the rate of reaction is proportional to
the partial pressure of the gaseous substrates, which will in turn depend on the total
pressure of the reactor (Anonymous 1995). Thus, increasing the pressure would increase
gas solubilities (Henstra et al. 2007; Vega et al. 1990a). Also, from equation 3.19, the
reaction rate is also proportional to the mass transfer coefficient of the gas, which will
increase by providing large gas-liquid interfacial areas (Henstra et al. 2007; Vega et al.
1990a).
Continuous stirred tank reactors (CSTR) are the most widely used conventional
reactors (Vega et al. 1990a). While using gaseous substrates, higher mass transfer
coefficient (��a) can be obtained by increasing the impeller speed (Henstra et al. 2007).
Increasing the impeller speed breaks the larger bubbles into smaller bubbles. These
smaller bubbles now have more surface area and lower rise velocities that eventually
increase the gas-liquid contact time (Henstra et al. 2007). The disadvantage of using
CSTRs is that the cost of the process increases drastically when the agitation speed is
increased (Henstra et al. 2007). However this cost can be kept low by developing more
efficient ways of sparging. A multi-orifice ring sparger (MORS) is one of the designs that
can increase gas holdup distribution and reduce poorly mixed zones without increasing
power input (Varma and Al-Dahhan 2007). Increasing the pressure in the CSTR could

48
also enhance the mass transfer coefficient, which in turn increases the reactor
productivities (Vega et al. 1990a).
Bubble column reactors, on the other hand, provide large liquid retention times
and/or large liquid hold up (Vega et al. 1990a). They can thus provide high interfacial
area and high mass transfer coefficient with decreased cost associated in the process due
to fewer moving parts and less maintenance (Charpentier 1981). Bubble column reactors
are better for the use of fermentations using gaseous substrates than CSTRs because of
these advantages and Vega et al. (1990a) showed that for a same retention time and mass
transfer rate, bubble column reactors can give a 95% CO conversion while the CSTR can
provide only 80% conversions.
However, the major challenge in producer gas fermentations is the need to
increase cell yields in reactors. This can be achieved by cell recycle or cell retention (Tsai
et al. 2009b). Cell retention could be achieved by fixing cells on inert solid support
through adsorption, entrapment or covalent bond formation (Qureshi et al. 2005). Klasson
et al. (1992) carried out immobilizing cells in a column reactor which resulted in very
high cell densities and CO conversions. In fact, these conversions were better than bubble
column and CSTR, which was mainly attributed to the fact that the operational
parameters mimicked plug flow (Klasson et al. 1992). Cell retention can also be achieved
through biofilm formation without the help of chemicals (Qureshi et al. 2005). This
happens when the cells adhere naturally to an inert support over time. Cell densities as
high as 74 g/l have been produced using this technique (Qureshi et al. 1988). Recently,
Qureshi et al. (2005) reviewed the production of ethanol, butanol, lactic acid, acetic acid,
succinic acid and fumaric acid production using biofilm reactors. But, these type of

49
reactors suffer from drawbacks such as low gas dissolution rates and very large reactor
sizes (Tsai et al. 2009b).
Hydrophobic hollow fiber membrane (HFM) reactors can also improve mass
transfer of producer gas to the biofilm (Khanal 2008). This technology offers an
advantage of no loss of gas in the form of bubbles, which is commonly seen in CSTR and
bubble column reactors (Khanal 2008). It also offers flexibility of controlling partial
pressure of gas in the membrane lumen. Moreover, the surface area for efficient gas
transfer can be changed without affecting other process parameters (Lee and Rittmann
2002). A hollow fiber bioreactor for nitrate removal from drinking water was developed
was developed by Nerenberg and Rittman (2004). This HFM bioreactor allowed 100%
transfer of H2 to the biofilm for the reduction of nitrate into nitrogen as well as effective
removal of other contaminants such as perchlorate, bromated, chlorate, chromate,
selenate, selenite and dichloromethane. The major disadvantage of hydrophobic HFM
reactors is that the gas transfer rates would be decreased if water condenses/deposits on
the hydrophobic porous membrane (Tsai et al. 2009b).
The latest development in the area of producer gas fermentations is the
development of hydrophilic asymmetric membrane bioreactors (Tsai et al. 2009a; Tsai et
al. 2009b). Assymetric membranes are widely used in microfiltration and nanofiltration
units. This set up has a gas contacting side and a liquid contacting side. The liquid
contacting is supported in a porous spongy layer that promotes and controls the growth of
microbes as it is in contact with nutrients for the microbes and removes the metabolic
products of fermentation like ethanol, butanol, acetic acid and butyric acid. The gas is in
direct contact with the microbes through the semipermeable micropores which maximizes
50
the gas utilization rates and dissolution rates up to 100% (Tsai et al. 2009c). The
semipermeable micropores allow the transfer of gas into the liquid but do not allow the
reverse. Concentrations of products as high as high as 6.4 g/l of ethanol, 4.8 g/l of
butanol, 2.5 g/l of acetic acid and 1.5 g/l of butyric acid has been achieved using the
hydrophilic asymmetric membranes using C. carboxidivorans in 20 days using a gas mix
of 40% CO, 30% H2 and 30% CO2 (Tsai et al. 2009b).
Industrialization of gasification-fermentation technology will be possible by
thoroughly understanding the metabolism of the acetogens, engineering the product
yields and by employing bioreactor systems with efficient mass transfer of gases into
liquids.

51
3.3 References
Ahmed A. 2006. Effect of biomass-generated syngas on cell growth, product distribution
and enzyme activities of Clostridium caboxidivorans P7T [Ph.D. Dissertation].
Stillwater: Oklahoma State University. 227 p.
Ahmed A, Cateni B, Huhnke R, Lewis R. 2006. Effects of biomass-generated producer
gas constituents on cell growth, product distribution and hydrogenase activity of
Clostridium carboxidivorans P7T. Biomass and Bioenergy 30(7):665-672.
Ahmed A, Lewis RS. 2007. Fermentation of biomass-generated synthesis gas: Effects of
nitric oxide. Biotechnology and Bioengineering 97(5):1080-1086.
Ahmed I, Ross R, Mathur V, Chesbro W. 1988. Growth rate dependence of
solventogenesis and solvents produced by Clostridium beijerinckii. Applied
Microbiology and Biotechnology 28(2):182-187.
Andreesen J, Ljungdahl L. 1973. Formate dehydrogenase of Clostridium
thermoaceticum: incorporation of selenium-75, and the effects of selenite,
molybdate, and tungstate on the enzyme. Journal of Bacteriology 116(2):867.
Anonymous. 1995. Bench-scale demonstration of biological production of ethanol from
coal synthesis gas. Fayetteville: Bioengineering Resources, Inc. Report nr
DOE/PC/92118--T14. 19 p.
Assobhei O, Kanouni A, Ismaili M, Loutfi M, Petitdemange H. 1998. Effect of acetic and
butyric acids on the stability of solvent and spore formation by Clostridium
acetobutylicum ATCC 824 during repeated subculturing. Journal of Fermentation
and Bioengineering 85(2):209-212.

52
Bahl H, Gottwald M, Kuhn A, Rale V, Andersch W, Gottschalk G. 1986. Nutritional
factors affecting the ratio of solvents produced by Clostridium acetobutylicum.
Applied and Environmental Microbiology 52(1):169-172.
Barik S, Prieto S, Harrison SB, Clausen EC, Gaddy JL. 1988. Biological production of
alcohols from coal through indirect liquefaction. Applied Biochemistry and
Biotechnology 18(1):363-378.
Belgiorno V, Feo GD, Rocca CD, Napoli RMA. 2003. Energy from gasification of solid
wastes. Waste management 23(1):1-15.
Bridgewater AV. 1994. Catalysis in thermal biomass conversion. Applied Catalysis A:
General 116(1-2):5-47.
Brock TD, Madigan MT, Martinko JM, Parker J. 1994. Biology of microorganisms.
Englewood Cliffs: Prentice-Hall. 909 p.
Calam C. 1980. Isolation of Clostridium acetobutylicum strains producing butanol and
acetone. Biotechnology Letters 2(3):111-116.
Cateni BG. 2007. Effects of feed composition and gasification parameters on product gas
from a pilot scale fuidized bed gasifier [Ph.D. Dissertation]. Stillwater: Oklahoma
State University. 359 p.
Charpentier J. 1981. Mass transfer rates in gas liquid absorbers and reactors. In: Drew
TB, editor. Advances in chemical engineering. New York: Academic Press, Inc. p
1-135.
Datar RP. 2003. Anaerobic fermentation of biomass generated producer gase to ethanol
[Ph.D. Dissertation]. Stillwater: Oklahoma State University. 229 p.

53
Datar RP, Shenkman RM, Cateni BG, Huhnke RL, Lewis RS. 2004. Fermentation of
biomass-generated producer gas to ethanol. Biotechnology and Bioengineering
86(5):587-594.
Drake HL. 1992. Acetogenesis and acetogenic bacteria. In: Lederberg J, editor.
Encyclopedia of microbiology. San Diego: Academic Press. p 1-15.
Drake HL, Kusel K. 2005. Acetogenic bacteria. In: Durre P, editor. Handbook of
clostridia. Boca Rayton: Taylor and Francis. p 719-746.
Drake HL, Kusel K, Matthies C. 2006. Acetogenic prokaryotes. In: Dworkin M, Falkow
S, Rosenberg E, Schleifer K-H, Stackebrandt E, editors. The prokaryotes. New
York: Springer. p 354-420.
Drennan C, Doukov T, Ragsdale S. 2004. The metalloclusters of carbon monoxide
dehydrogenase/acetyl-CoA synthase: A story in pictures. Journal of Biological
Inorganic Chemistry 9(5):511-515.
Dürre P, Hollergschwandner C. 2004. Initiation of endospore formation in Clostridium
acetobutylicum. Anaerobe 10(2):69.
Durre P. 2005. Sporulation in clostridia (Genetics). In: Durre P, editor. Hanbook on
clostridia. Baco Raton: Taylor and Francis. p 659-670.
El-Rub ZA, Bramer EA, Brem. G. 2004. Review of catalysts for tar elimination in
biomass gasification processes. Industrial & Engineering Chemistry Research
43(22):6911-6919.
Finn R, Nowrey J. 1959. A note on the stability of clostridia when held in continuous
culture. Applied and Environmental Microbiology 7(1):29.

54
Foley G, Barnard G, Timberlake L. 1983. Gasifiers: fuel for siege economics. London:
International Institute for Environment and Development. 58 p.
Gaddy JL; Bioengineering Resources, Inc., assignee. 1998. Biological production of
products from waste gases [Patent]. USA.
Gapes J, Swoboda H, Haslinger A, Nimcevic D. 2000. The effect of heat-shocking on
batch fermentation by Clostridium beijerinckii NRRL B592. Applied
Microbiology and Biotechnology 54(1):118-120.
Gapes JR, Larsen VF, Maddox IS. 1983. A note on procedures for inoculum development
for the production of solvents by a strain of Clostridium butylicum. Journal of
Applied Microbiology 55(2):363-365.
Girbal L, Croux C, Vasconcelos I, Soucaille P. 1995a. Regulation of metabolic shifts in
Clostridium acetobutylicum ATCC 824. FEMS Microbiology Reviews 17(3):287-
297.
Girbal L, Vasconcelos I, Saint-Amans S, Soucaille P. 1995b. How neutral red modified
carbon and electron flow in Clostridium acetobutylicum grown in chemostat
culture at neutral pH. FEMS Microbiology Reviews 16(2-3):151-162.
Grupe H, Gottschalk G. 1992. Physiological events in Clostridium acetobutylicum during
the shift from acidogenesis to solventogenesis in continuous culture and
presentation of a model for shift induction. Applied and Environmental
Microbiology 58(12):3896-3902.
Harris L, Welker N, Papoutsakis E. 2002. Northern, morphological, and fermentation
analysis of spo0A inactivation and overexpression in Clostridium acetobutylicum
ATCC 824. Journal of Bacteriology 184(13):3586.
55
Heiskanen H, Virkajärvi I, Viikari L. 2007. The effect of syngas composition on the
growth and product formation of Butyribacterium methylotrophicum. Enzyme and
Microbial Technology 41(3):362-367.
Henstra AM, Sipma J, Rinzema A, Stams AJ. 2007. Microbiology of synthesis gas
fermentation for biofuel production. Current Opinion in Biotechnology 18:200-
206.
Huber GW, Iborra S, Corma A. 2006. Synthesis of transportation fuels from biomass:
Chemistry, catalysts, and engineering. Chemical Reviews 106:4044-4098.
Hyman M, Arp D. 1988. Reversible and irreversible effects of nitric oxide on the soluble
hydrogenase from Alcaligenes eutrophus H 16. Biochemical Journal 254(2):469-
475.
Hyman M, Arp D. 1991. Kinetic analysis of the interaction of nitric oxide with the
membrane-associated, nickel and iron-sulfur-containing hydrogenase from
Azotobacter vinelandii. Biochimica et Biophysica Acta 1076(2):165.
Imkamp F, Muller V. 2007. Acetogenic bacteria. Encyclopedia of life sciences. Malden:
John Wiley & Sons, Inc. p 1-8.
Jewell J, Coutinho J, Kropinski A. 1986. Bioconversion of propionic, valeric, and 4-
hydroxybutyric acids into the corresponding alcohols by Clostridium
acetobutylicum NRRL 527. Current Microbiology 13(4):215-219.
Jones D, Van der Westhuizen A, Long S, Allcock E, Reid S, Woods D. 1982. Solvent
production and morphological changes in Clostridium acetobutylicum. Applied
and Environmental Microbiology 43(6):1434-1439.
56
Junelles A, Janati-Idrissi R, Petitdemange H, Gay R. 1988. Iron effect on acetone-butanol
fermentation. Current Microbiology 17(5):299-303.
Karnholz A, Kusel K, Gossner A, Schramm A, Drake H. 2002. Tolerance and metabolic
response of acetogenic bacteria toward oxygen. Applied and Environmental
Microbiology 68(2):1005-1009.
Kashket E, Cao Z. 1995. Clostridial strain degeneration. FEMS Microbiology Reviews
17(3):307-315.
Kasteren JMN, Dizdarevic D, Waall WR, Guo J, Verberne R. 2005. Bio-ethanol from
bio-syngas Eindhoven: Eindhoven University of Technology. 53 p.
Khanal SK. 2008. Anaerobic reactor configurations for bioenergy production. In: Khanal
SK, editor. Anaerobic biotechnology for bioenergy production: Principles and
applicaions. Ames: Wiley-Blackwell. p 93-114.
Klass DL. 1998. Biomass for renewable energy, fuels, and chemicals. San Diego:
Academic Press. 651 p.
Klasson K, Ackerson M, Clausen E, Gaddy J. 1992. Bioconversion of synthesis gas into
liquid or gaseous fuels. Enzyme and Microbial Technology 14(8):602-608.
Krasna A, Rittenberg D. 1954. The inhibition of hydrogenase by nitric oxide.
Proceedings of the National Academy of Sciences 40(4):225-227.
Kumar A, Jones DD, Hanna MA. 2009. Thermochemical biomass gasification: A review
of the current status of the technology. Energies 2(3):556-581.

57
Kusel K, Karnholz A, Trinkwalter T, Devereux R, Acker G, Drake H. 2001.
Physiological ecology of Clostridium glycolicum RD-1, an aerotolerant acetogen
isolated from sea grass roots. Applied and Environmental Microbiology
67(10):4734-4741.
Kutzenok A, Aschner M. 1952. Degenerative processes in a strain of Clostridium
butylicum. Journal of Bacteriology 64(6):829-836.
Leclerc M, Elfoul-Bensaid L, Bernalier A. 1998. Effect of yeast extract on growth and
metabolism of H2-utilizing acetogenic bacteria from the human colon. Current
Microbiology 37(3):166-171.
Lee K, Rittmann B. 2002. Applying a novel autohydrogenotrophic hollow-fiber
membrane biofilm reactor for denitrification of drinking water. Water Research
36(8):2040-2052.
Lewis RS, Frankman A, Tanner RS, Ahmed A, Huhnke RL. 2008. Ethanol via biomass-
generated syngas. International Sugar Journal 110(1311):150-155.
Lewis RS, Tanner RS, Huhnke RL; 2007. Indirect or direct fermentation of biomass to
fuel alcohol [Patent application]. USA.
Ljundahl LG. 1986. The autotrophic pathway of acetate synthesis in acetogenic bacteria.
Annual Review of Microbiology 40:415-450.
Long S, Jones D, Woods D. 1983. Sporulation of Clostridium acetobutylicum P262 in a
defined medium. Applied and Environmental Microbiology 45(4):1389-1393.
58
Maddox I, Steiner E, Hirsch S, Wessner S, Gutierrez N, Gapes J, Schuster K. 2000. The
cause of "acid crash" and" acidogenic fermentations" during the batch acetone-
butanol-ethanol (Girbal et al.) fermentation process. Journal of Molecular
Microbiology and Biotechnology 2(1):95-100.
Mariotto C, Loubière P, Goma G, Lindley N. 1989. Influence of various reducing agents
on methylotrophic growth and organic acid production of Eubacterium limosum.
Applied Microbiology and Biotechnology 32(2):193-198.
Martin J, Petitdemange H, Ballongue J, Gay R. 1983. Effects of acetic and butyric acids
on solvents production by Clostridium acetobutylicum. Biotechnology Letters
5(2):89-94.
McKendry P. 2002a. Energy production from biomass (part 2): Conversion technologies.
Bioresource Technology 83(1):47-54.
McKendry P. 2002b. Energy production from biomass (part 3): Gasification technologies.
Bioresource Technology 83(1):55–63.
Meyer CL, Papoutsakis ET. 1988. Increased levels of ATP and NADH are associated
with increased solvent production in continuous cultures of Clostridium
acetobutylicum. Applied Microbiology and Biotechnology 30(5):450-459.
Milne TA, Evans RJ, Abatzaglou N. 1998. Biomass gasifier “Tars”: Their nature,
formation and conversion. http://media.godashboard.com/gti/IEA/
TomandNicolasreport.pdf. Golden and Quebec: National Renewable Energy
Laboratory and Kemestrie, Inc. 68 p. accessed 12/2/09.

59
Monot F, Engasser J, Petitdemange H. 1984. Influence of pH and undissociated butyric
acid on the production of acetone and butanol in batch cultures of Clostridium
acetobutylicum. Applied Microbiology and Biotechnology 19(6):422-426.
Narvaez I, Orio A, Aznar M, Corella J. 1996. Biomass gasification with air in an
atmospheric bubbling fluidized bed: Effect of six operational variables on the
quality of the produced raw gas. Industrial & Engineering Chemistry Research
35(7):2110-2120.
Nerenberg R, Rittmann B. 2004. Hydrogen-based, hollow-fiber membrane biofilm
reactor for reduction of perchlorate and other oxidized contaminants. Water
Science & Technology 49(11):223-230.
Pannerselvam A. 2009. Effect of glucose and reducing agents on syngas fermentation by
clostridia species P11 [M.S Thesis]. Stillwater: Oklahoma State University. 82 p.
Papoutsakis ET. 2005. Genomic and genetic approaches to solvent tolerance.
http://www.osti.gov/energycitations/product.biblio.jsp?osti_id=840821. Evanston:
Northwestern University. 10 p. accessed 12/2/09.
Peguin S, Soucaille P. 1995. Modulation of carbon and electron flow in Clostridium
acetobutylicum by iron limitation and methyl viologen addition. Applied and
Environmental Microbiology 61(1):403-405.
Phillips JR, Clausen EC, Gaddy JL. 1994. Synthesis gas as substrate for the biological
produciton of fuels and chemicals. Applied Biochemistry and Biotechnology
45/46:145-157.
60
Qureshi N, Annous B, Ezeji T, Karcher P, Maddox I. 2005. Biofilm reactors for industrial
bioconversion processes: Employing potential of enhanced reaction rates.
Microbial Cell Factories 4(1):24.
Qureshi N, Paterson A, Maddox I. 1988. Model for continuous production of solvents
from whey permeate in a packed bed reactor using cells of Clostridium
acetobutylicum immobilized by adsorption onto bonechar. Applied Microbiology
and Biotechnology 29(4):323-328.
Ragsdale S, Clark J, Ljungdahl L, Lundie L, Drake H. 1983. Properties of purified carbon
monoxide dehydrogenase from Clostridium thermoaceticum, a nickel, iron-sulfur
protein. Journal of Biological Chemistry 258(4):2364.
Ragsdale SW. 1991. Enzymology of the acetyl-CoA pathway of CO2 fixation. Critical
Reviews in Biochemistry and Molecular Biology 26(3/4):261-300.
Ragsdale SW. 2004. Life with carbon monoxide. Critical Reviews in Biochemistry and
Molecular Biology 39(3):165-195.
Rajagopalan S, Datar RP, Lewis RS. 2002. Formation of ethanol from carbon monoxide
via a new microbial catalyst. Biomass and Bioenergy 23:487-493.
Rao G, Mutharasan R. 1986. Alcohol production by Clotridium acetobutylicum induced
by methyl viologen. Biotechnology Letters 8(12):893-896.
Rao G, Mutharasan R. 1987. Altered electron flow in continuous cultures of Clostridium
acetobutylicum induced by viologen dyes. Applied and Environmental
Microbiology 53(6):1232-1235.
Rao G, Ward PJ, Mutharasan R. 1987. Manipulation of end-product distribution in strict
anaerobes. Annals of the New York Academy of Sciences 506(1):76-83.

61
Ravagnani A, Jennert K, Steiner E, Grunberg R, Jefferies J, Wilkinson S, Young D,
Tidswell E, Brown D, Youngman P. 2000. Spo0A directly controls the switch
from acid to solvent production in solvent-forming clostridia. Molecular
Microbiology 37(5):1172-1185.
Reddy D, Lancaster J, Cornforth D. 1983. Nitrite inhibition of Clostridium botulinum:
Electron spin resonance detection of iron-nitric oxide complexes. Science
221(4612):769.
Reed TB. 1981. Biomass gasification: Principles and technology. Park Ridge: Nova Data
Cooperation. 401 p.
Roos JW, McLaughlin JK, Papoutsakis ET. 1985. The effect of pH on nitrogen supply,
cell lysis, and solvent production in fermentations of Clostridium acetobutylicum.
Biotechnology and Bioengineering 27(5):681-694.
Shenkman RM. 2003. C. carboxidivorans culture advances and the effect of pH,
temperature and producer gas on key enzymes [M.S Thesis]. Stillwater:
Oklahoma State University. 180 p.
Smith K, Klasson K, Clausen A, Gaddy J. 1991. COS degradation by selected CO-
utilizing bacteria. Applied Biochemistry and Biotechnology 28(1):787-796.
Spath PL, Dayton DC. 2003. Preliminary screening - Technical and economic assessment
of synthesis gas to fuels and chemicals with emphasis on the potential for
biomass-derived syngas. Golden: National Renewable Energy Laboratory 142 p.
Spivey M. 1978. The acetone/butanol/ethanol fermentation. Process Biochemistry
13(11):2-4.

62
Stephens GM, Holt RA, Gottschal JC, Morris JG. 1985. Studies on the stability of solvent
production by Clostridium acetobutylicum in continuous culture. Journal of
Applied Microbiology 58(6):597-605.
Stim-Herndon K, Nair R, Papoutsakis E, Bennett G. 1996. Analysis of degenerate
variants of Clostridium acetobutylicum ATCC 824. Anaerobe 2:11-18.
Sun JH, Hyman MR, Arp DJ. 2002. Acetylene inhibition of Azotobacter vinelandii
hydrogenase: acetylene binds tightly to the large subunit. Biochemistry
31(12):3158-3165.
Terracciano J, Rapaport E, Kashket E. 1988. Stress-and growth phase-associated proteins
of Clostridium acetobutylicum. Applied and Environmental Microbiology
54(8):1989.
Tibelius K, Knowles R. 1984. Hydrogenase activity in Azospirillum brasilense is
inhibited by nitrite, nitric oxide, carbon monoxide, and acetylene. Journal of
Bacteriology 160(1):103-106.
Tracy B, Gaida S, Papoutsakis E. 2008. Development and application of flow-cytometric
techniques for analyzing and sorting endospore-forming clostridia. Applied and
Environmental Microbiology 74(24):7497.
Tsai S-P, Datta R, Basu R, Yoon S-H; 2009a. Stacked array bioreactors for conversion of
synags components to liquid products [Patent application]. USA.
Tsai S-P, Datta R, Basu R, Yoon S-H; 2009b. Syngas conversion system using
asymmetric membrane and anaerobic microorganism [Patent application]. USA.

63
Tsai S-P, Datta R, Basu R, Yoon S-H, Tobey RE; 2009c. Modular membrane supported
bioreactor for conversion of synags components to liquid products [Patent
application]. USA.
Varma R, Al-Dahhan M. 2007. Effect of sparger design on hydrodynamics of a gas
recirculation anaerobic bioreactor. Biotechnology and Bioengineering
98(6):1146-1160.
Vasconcelos I, Girbal L, Soucaille P. 1994. Regulation of carbon and electron flow in
Clostridium acetobutylicum grown in chemostat culture at neutral pH on mixtures
of glucose and glycerol. Journal of Bacteriology 176(5):1443-1450.
Vega J, Clausen E, Gaddy J. 1990a. Design of bioreactors for coal synthesis gas
fermentations. Resources, Conservation and Recycling 3(2):149-160.
Vega J, Holmberg V, Clausen E, Gaddy J. 1988a. Fermentation parameters of
Peptostreptococcus productus on gaseous substrates (CO, H2/CO2). Archives of
Microbiology 151(1):65-70.
Vega J, Klasson K, Kimmel D, Clausen E, Gaddy J. 1990b. Sulfur gas tolerance and
toxicity of CO-utilizing and methanogenic bacteria. Applied Biochemistry and
Biotechnology 24(1):329-340.
Vega JL, Clausen EC, Gaddy JL. 1988b. Study of gaseous substrate fermentations:
Carbon monoxide conversion to acetate. 1. Batch culture. Biotechnology and
Bioengineering 34:774-784.
Vignais P, Billoud B, Meyer J. 2001. Classification and phylogeny of hydrogenases.
FEMS Microbiology Reviews 25(4):455-501.

64
West D, Montgomery F, Armstrong T. 2005. “NO-selective” NOx sensing elements for
combustion exhausts. Sensors & Actuators B: Chemical 111-112:84-90.
Wiegel J, Tanner RS, Rainey FA. 2006. An Introduction to the Family Clostridiaceae. In:
Dworkin M, editor. The Prokaryotes. New York: Springer. p 654-678.
Wood HG, Ragsdale SW, Pezacka E. 1986. The acetyl-CoA pathway of autotrophic
growth. FEMS Microbiology Reviews 39:345-362.
Worden RM, Grethlein AJ, Jain MK, Datta R. 1991. Production of butanol and ethanol
from synthesis gas via fermentation. Fuel 70(5):615-619.
Yamamoto I, Saiki T, Liu S, Ljungdahl L. 1983. Purification and properties of NADP-
dependent formate dehydrogenase from Clostridium thermoaceticum, a tungsten-
selenium-iron protein. Journal of Biological Chemistry 258(3):1826.
Zeikus J. 1980. Chemical and fuel production by anaerobic bacteria. Annual Reviews in
Microbiology 34(1):423-464.

65
CHAPTER 4
EFFECT OF BIOMASS GENERATED PRODUCER GAS AND ITS
CONTAMINANTS IN FERMENTATIONS USING CLOSTRIDIUM STRAIN P11
4.1 Introduction
The need to reduce dependency on foreign oil coupled with other factors like
global warming, political instability of oil producing countries and concerns over national
security has led to research in the production of liquid fuels such as ethanol, biodiesel and
butanol from renewable biomass (Ananymous 2009a; Lashof and Ahuja 1990; Rogers et
al. 2006). Ethanol production from primary agricultural feedstocks, i.e. sugarcane and
corn, is a well demonstrated technology in countries like Brazil and the USA. These
feedstocks are primarily a source of food, which has given rise to many ethical questions
for instance whether corn should be used for food or fuel and availability of land to grow
corn (Anderson et al. 2008). While the conversion of corn to ethanol will continue in the
near future, other technologies using cellulosic feedstocks, such as corn stover, wheat
straw, barley straw, rice straw, switchgrass, wood waste, urban waste and others, are
currently being developed (Ananymous 2009b).
Two biological conversion processes exist for the conversion of cellulose to
ethanol, namely, hydrolysis-fermentation and syngas fermentation (Huber et al. 2006).

66
In hydrolysis-fermentation, the complex structure of the plant is broken down by a
pretreatment followed by an acid or enzymatic hydrolysis to release sugars which are
then converted into ethanol by yeast or bacteria (Olofsson et al. 2008). Besides being an
uneconomical, multistep-multiconversion process, it also suffers from the major
drawback of not utilizing 25-30 % of the plant material that is lignin (Tsai et al. 2009b).
On the other hand, syngas fermentation is a two step process which combines gasification
and fermentation. In the first step, cellulosic feedstocks can be gasified to produce a
combination of carbon monoxide (CO), carbon dioxide (CO2) and hydrogen (H2) gas
(with other gases such as nitrogen, methane, ammonia, hydrogen sulfide and other trace
gases) that is called synthesis gas, producer gas or syngas. This gas can then be fermented
by anaerobic microbes (also called acetogens), such as Clostridium ljundahlii,
Clostridium autoethanogenum, Butyribacterium methylotrophicum, Clostridium
carboxidivorans and Clostridium strain P11, to form ethanol, isopropanol, butanol,
hexanol and specialty chemicals, such as acetic acid, butyric acid and hexanoic acid
(Abrini et al. 1994; Grethlein et al. 1990). The gasification-fermentation process can
utilize all the carbonaceous components of the biomass, which results in better
conversion efficiency (McKendry 2002a). Furthermore, this process has the advantage of
using different feedstocks (energy crops, agricultural wastes, industrial wastes and forest
waste) depending on their availability and also using municipal waste, coal, natural gas
and reformed gas, thus, making gasification-fermentation a flexible technology (Tsai et
al. 2009a).
Some acetogens can convert gases such as CO, CO2 and hydrogen H2 into
products such as ethanol, butanol, acetic acid and butyric acid using a non-cyclic,

67
irreversible, reductive pathway called the Wood-Ljungdahl pathway (Henstra et al. 2007;
Ljundahl 1986; Ragsdale 1991). Different acetogens have preference to different gaseous
substrates and produce a combination of products (Gaddy 1998; Lewis et al. 2007; Vega
et al. 1988a). Most of the studies in the area of producer gas fermentation employ the use
of simulated or synthetic gas mixes (Girbal et al. 1995a; Rajagopalan et al. 2002; Tsai et
al. 2009b; Ungerman and Heindel 2008). Very few studies have used producer gas
obtained from biomass gasification (Datar et al. 2004, Kundiyana et al. 2009). Research
into integrating gasification and fermentation to enhance ethanol production is necessary
to improve the economics of the process. One challenge in the utilization of producer gas
using acetogens is that producer gas that is generated from gasifiers has numerous
contaminants like char particles, ash particles, tars (benzene, toluene, xylene, etc),
inorganic impurities (ammonia, hydrogen sulfide, sulfur dioxide, carbonyl sulfide, nitric
oxide etc) and hydrocarbons (acetylene, ethylene, and methane), that can profoundly
affect the fermentation process (Ahmed 2006; Ahmed and Lewis 2007; Anonymous
1995; Belgiorno et al. 2003; Bridgewater 1994; El-Rub et al. 2004; Smith et al. 1991).
The first research using contaminants was studied on C. ljundahlii by
Bioengineering Resources Inc. (Anonymous 1995), which showed no inhibition of CO
and H2 uptake when concentrations of hydrogen sulfide (H2S) were 2.5%, but strong
inhibition of CO and H2 uptake were observed at concentrations of 10%. However, C.
ljundahlii culture adapted to sulfide gases showed tolerance up to 20% of sulfides (Smith
et al. 1991; Vega et al. 1990b). Another CO utilizing microbe, Rhodospirillum rubrum
was also found to degrade 5% carbonyl sulfide (Gerhardt et al.) within 20 h (Smith et al.
1991). Both C. ljundahlii and R. rubrum are CO and H2 consuming acetogens similar to
68
Clostridium strain P11 that is under investigation in this research. Studies on sulfide
gases (H2S and COS) were more prevalent because coal gasification released 1-2%
sulfide gases and these sulfides were toxic to chemical catalysts involved in the Fisher-
Tropsch process (Vega et al. 1990b). Thus, C. ljundahlii and R. rubrum were found to be
more tolerant of sulfides than chemical catalysts.
In a recent study, tars present in syngas were found to inhibit the growth of C.
carboxidivorans for the first 8-10 days but, after this period of inactivity, the bacteria
produced more ethanol (by a factor of 2 times) and less acetic acid (by a factor of 2.5
times) when compared to cells that were not exposed to producer gas containing tars
(Ahmed 2006; Ahmed et al. 2006). Among the hydrocarbons, methane is usually the
most abundant found at concentrations in the range of 1.85-5% (Datar 2003). Methane at
4.5% was not found to affect the metabolism of C. carboxidivorans (Datar 2003). Ethane
also was found not to affect growth of C. carboxidivorans, but acetylene and ethylene
were found to increase cell mass by 33% and 55%, respectively (Ahmed 2006). Nitric
oxide increased ethanol concentrations by 5 to 7 times, increased the activity of alcohol
dehydrogenase and acted as a non competitive, reversible inhibitor to hydrogenase above
40 ppm (Ahmed and Lewis 2007). Besides acetogens, the effect of NO has been tested on
few microorganisms (such as nitrogen fixing bacteria and methanogens) and
experimental results have shown both reversible and irreversible inhibition to a wide
variety of hydrogenase enzymes in Proteus vulgaris, Alcaligenes eutrophus and
Azobacter vinelandii by interacting with iron sulfur centers that play crucial roles in
enzyme catalysis and interaction (Hyman and Arp 1988; Hyman and Arp 1991; Krasna
and Rittenberg 1954; Tibelius and Knowles 1984).

69
This research uses a syngas utilizing acetogen, Clostridium strain P11 (hereafter
referred as P11), to ferment producer gas produced by the gasification of Kanlow switch
grass to form ethanol and acetic acid. The main objective of this research was to study the
effects of biomass generated producer gas with acclimated and unacclimated P11 cells in
a lab scale using 250 ml bottle reactors. In addition, a contaminant study with 5%
methane in synthetic gas was also performed to observe its effects on P11 fermentations
as methane was the biggest contaminant of biomass generated producer gas.
4.2 Materials and Methods
4.2.1 Biomass and producer gas
Biomass generated producer gas was obtained by gasification of switchgrass
(Panicum virgatum var. Kanlow). A fluidized bed gasifier was used to gasify
switchgrass. The gas was cleaned using two cyclone separators to remove particulates
such as ash, char and fine particles. It was then was passed through a scrubbing system
with a mixture of 20% acetone and 80% water (maintained at 0°C) to condense tar in the
gas that escaped cyclone separation. Producer gas was then compressed and stored in 77
gallon storage tanks at 860 KPa (125 psia). Nine gallon transportation tanks were filled
using downward displacement of water and are stored at the laboratory at 586 KPa (85
psia) where bottle reactor studies were carried out. In this study, the producer gas
generated from biomass was compared to a bottled gas mix which had a composition of
20% CO, 15% CO2, 5% H2 and remaining 60% N2 (Superior Specialty Gas Inc., Tulsa,
OK). This composition was used because the producer gas generated by the fluidized bed
gasifier using switchgrass as a feedstock had these compositions in the past (Datar et al.
2004). For the contaminant study, 5% methane was included in the bottled gas mix by the

70
manufacturer, thus, the composition was 20% CO, 15% CO2, 5% H2, 5% CH4 and
remaining 55% N2 and was compared to the control gas mix without methane (20% CO,
15% CO2, 5% H2 and remaining 60% N2).
4.2.2 Microbial catalyst and culture medium
The microbial catalyst, Clostridium strain P11, was provided by Dr. Ralph
Tanner, University of Oklahoma. This strain was originally isolated from a duck pond at
the University of Oklahoma (Huhnke et al. 2006). For all the experiments, the bacteria
was grown on a defined media containing per L: 30 ml of mineral stock solution (Table
4.1), 10 ml of trace metal solution (Table 4.2), 10 ml of vitamin stock solution (Table
4.3), 1 g of yeast extract, 10 g of N-morpholinoethanesulfonic acid (MES) buffer, 10 ml
of 4% cysteine sulfide solution and 1 ml of 0.1% resazurin solution. There are changes in
the composition of the mineral and trace metal stock solutions (that are shown in Table
4.1 and 4.2) because of the advice from Dr. Tanner that addition or omission of some
media components was good for higher solvent production in P11 fermentations. The
media compositions were updated to be at par with our research collaborators. All the
chemicals were purchased from Sigma Chemical Company, St. Louis, Missouri except
the yeast extract that was purchased from Difco laboratories, Detroit, Michigan.
4.2.3 Preparation of the culture medium and batch studies
All the batch fermentation studies were performed in 250 ml serum bottles with
100 ml of culture media. The culture media was prepared by mixing all its components
(mineral stock solution, trace metal solution, vitamin solution, MES, yeast extract and
resazurin) in an appropriate amount of deionized water in a round bottomed flask. The
pH of the culture medium was then adjusted to 6.1 using 2 N potassium hydroxide

71
Component
Amount (g/l)
(for switchgrass syngas
experiment)
Amount (g/l)
(for methane
experiments)
Ammonium chloride 100 100
Calcium chloride 4 4
Magnesium sulfate 20 20
Potassium chloride 10 10
Potassium phosphate monobasic 10 10
Sodium chloride 80 0
Table 4.1 Composition of stock mineral solutions. Sodium chloride was deleted in the
methane experiment because of the advice from Dr. Ralph Tanner, University of
Oklahoma that removal of sodium chloride increased ethanol production.

72
Component
Amount (g/l)
(for switchgrass syngas
experiment)
Amount (g/l)
(for methane experiments)
Cobalt chloride 0.2 0.2
Cupric chloride 0 0
Ferrous ammonium sulfate 0.8 0.8
Manganese sulfate 0.8 1
Nickel chloride 0.2 0.2
Nitrilotriacetic acid 2 2
Sodium molybdate 0.02 0.02
Sodium selenate 0.1 0.1
Sodium tungstate 0.2 0.2
Zinc sulfate 1 1
Table 4.2 Composition of trace metal stock solution. A different composition of
manganese sulfate was used for the methane experiments because of the advice from Dr.
Ralph Tanner, University of Oklahoma as per the fermentation optimization studies
carried by them.

73
Component Amount (g/l)
(for all experiments)
p-(4)-aminobenzoic acid 0.005
d-biotin 0.002
Calcium pantothenate 0.005
Folic acid 0.002
MESNA 0.01
Nicotinic acid 0.005
Pyridoxine 0.01
Riboflavin 0.005
Thiamine 0.005
Thioctic acid 0.005
Vitamin B12 0.005
Table 4.3 Composition of vitamin stock solution

74
solution. The culture media was then made anaerobic by boiling it in a microwave and
then briskly passing nitrogen to remove all the dissolved oxygen from the media. The
flask was sealed with a rubber stopper and transferred to an anaerobic glove box (Coy
Laboratory Products Inc., Grasslake, MI) where the media was dispensed into bottles and
sealed. The bottles were then sterilized in an autoclave (Primus Sterilizer Co. Inc,
Omaha, NE) at 121ºC for 20 min. After autoclaving, the serum bottles were left to cool to
room temperature and 1 ml of 4% sterile cysteine sulfide solution was added to 100 ml of
media in the serum bottle. The bottles were then purged with producer gas (synthetic or
biomass based) depending on the experiment and inoculated with a 10 ml of inoculum
containing actively growing cells. The actively growing cells were obtained by sub-
culturing the cells twice. Each stage of subculturing is referred to as a passage. All
inoculum transfers between passages were conducted when the microbes were in the mid-
exponential phase. The bottle reactor in which the microbes grew faster (as determined
by optical density measurements) was chosen for inoculum transfers into the next stage,
as it was expected to have more healthy cells than the bottle reactor that grew slower. All
inoculum transfers from one passage to another were conducted from the same reactors,
thereby, minimizing the culture variation from reactor to reactor and from one treatment
to another. The method of preparation and composition of the culture medium in
subculture stages remained the same as that of the experimental procedure. After
inoculation the batch reactors were kept in a walk in room which was maintained at 37ºC
on an orbital shaker (Innova 2100, New Brunswick Scientific, Edison, NJ) at 150 rpm.
Cell concentration, pH, product concentrations and producer gas concentrations were
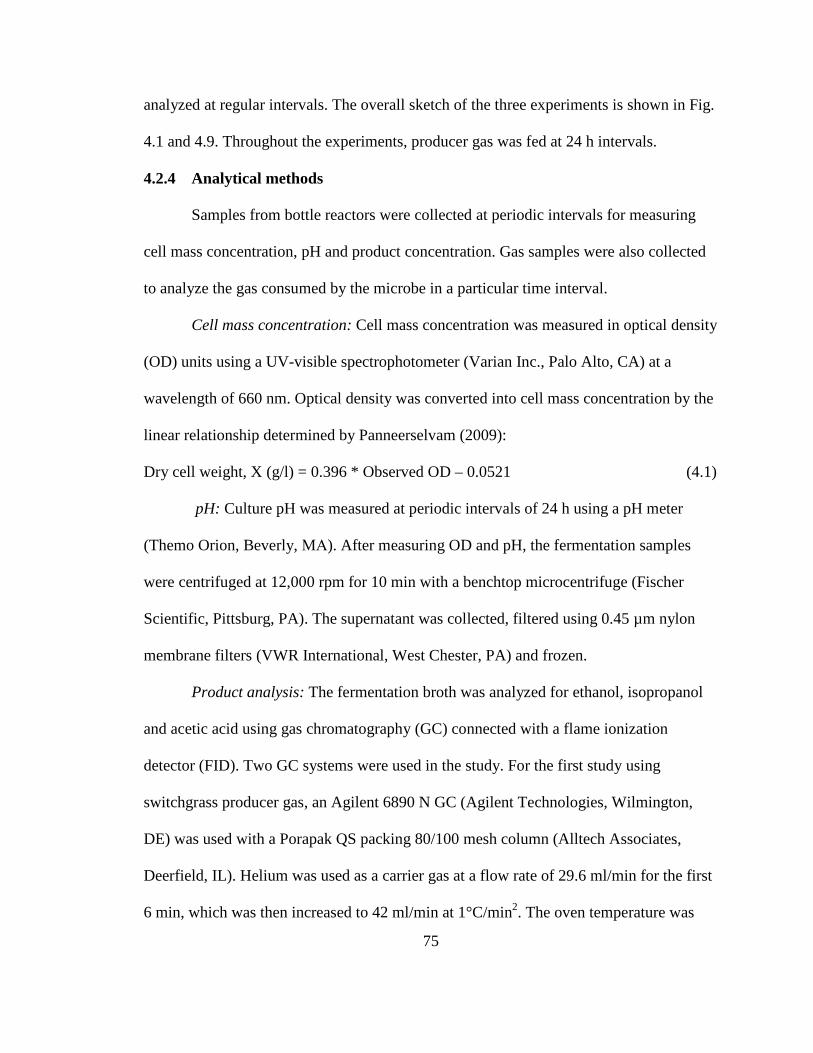
75
analyzed at regular intervals. The overall sketch of the three experiments is shown in Fig.
4.1 and 4.9. Throughout the experiments, producer gas was fed at 24 h intervals.
4.2.4 Analytical methods
Samples from bottle reactors were collected at periodic intervals for measuring
cell mass concentration, pH and product concentration. Gas samples were also collected
to analyze the gas consumed by the microbe in a particular time interval.
Cell mass concentration: Cell mass concentration was measured in optical density
(OD) units using a UV-visible spectrophotometer (Varian Inc., Palo Alto, CA) at a
wavelength of 660 nm. Optical density was converted into cell mass concentration by the
linear relationship determined by Panneerselvam (2009):
Dry cell weight, X (g/l) = 0.396 * Observed OD – 0.0521 (4.1)
pH: Culture pH was measured at periodic intervals of 24 h using a pH meter
(Themo Orion, Beverly, MA ). After measuring OD and pH, the fermentation samples
were centrifuged at 12,000 rpm for 10 min with a benchtop microcentrifuge (Fischer
Scientific, Pittsburg, PA). The supernatant was collected, filtered using 0.45 µm nylon
membrane filters (VWR International, West Chester, PA) and frozen.
Product analysis: The fermentation broth was analyzed for ethanol, isopropanol
and acetic acid using gas chromatography (GC) connected with a flame ionization
detector (FID). Two GC systems were used in the study. For the first study using
switchgrass producer gas, an Agilent 6890 N GC (Agilent Technologies, Wilmington,
DE) was used with a Porapak QS packing 80/100 mesh column (Alltech Associates,
Deerfield, IL). Helium was used as a carrier gas at a flow rate of 29.6 ml/min for the first
6 min, which was then increased to 42 ml/min at 1°C/min2. The oven temperature was

76
maintained at 160 °C for the first 6 min, which was then increased to 220°C at a rate of
5°C/min. The injector and detector temperatures were held at 175°C and 250°C,
respectively. The total run time for the analysis of a sample was 18 min. Methanol at 2.5
g/l was used as an internal standard. The GC was calibrated at 5 levels using known
concentrations of compounds and Chemstation software (Agilent Technologies,
Wilmington, DE) was used to quantify the concentration of compounds in the unknown
samples.
The Porapak column described above had the disadvantage of lower efficiency to
separate compounds. For example, compounds like acetaldehyde, acetone and
isopropanol eluted close to each other and other compounds like butanol and butyric acid
almost co-eluted. Although these were not primary products, this became a major concern
when acetone was observed in fermentations using CGF. To solve this issue, another
column was purchased from J&W Scientific named DB-FFAP column (Catalog NO. 100-
2000) that was custom made for our purposes, and it was installed in the GC (Agilent
6890 N GC, Agilent Technologies, Wilmington, DE). The capillary column was 25 m
long with a film thickness of 0.33 µm. Hydrogen was used as a carrier gas at a flow rate
of 2.3 ml/min for 1.5 min and then ramped at till 4 ml/min. Inlet temperature was 200°C
and a split ratio of 50:1 was used. A FID was used at 250ºC with hydrogen and air at 40
ml/min and 450 ml/min. The oven was also ramped at multiple rates for the best
separation. Initially, the oven was at 40°C for 1.5 minutes, after which the oven was
ramped at 25ºC /min until 60ºC was reached and then ramped at 40 °C/min until the oven
reached 235ºC. The total run time using this column was 10 min and it could separate the
compounds like acetaldehyde, acetone, methanol, isopropanol, ethanol, butanol, hexanol,

77
acetic acid, propionic acid, isobutyric acid, butyric acid and hexanoic acid with a very
high resolution. 2-butanol was used as an internal standard in this system at
concentrations of 2 g/l. The GC was calibrated at 7 levels using known concentrations of
compounds and Chemstation software (Agilent Technologies, Wilmington, DE) was used
to quantify the concentration of compounds in the unknown samples.
Headspace gas analysis: The composition of headspace gases was measured by
withdrawing 100 µl of gas samples manually in 100 µl sample lock gas tight syringes
(Hamilton Company, Reno, Nevada) and injecting them in a Agilent 6890N GC system
(Agilent Technologies, Wilmington, DE) which was equipped with a Carboxen-1010
PLOT (Porous layer open tubular) capillary column with a dimension of 30 m (length) X
320 µm (inner diameter) X 15 µm nominal diameter (Supelco, Bellefonte, PA). To ensure
oxygen did not interfere with the sampling techniques, all gas samples were taken in an
anaerobic glove box (Coy Laboratory Products Inc., Grasslake, MI). The GC inlet was
run in a “split” mode with a split ratio of 30:1 (meaning 30 parts of the injected sample is
vented and 1 part enters the column for sample detection) and at a temperature of 200°C.
Argon gas was used as a carrier gas with initial flow rate of 0.4 ml/min for the first 12
min then ramped at 0.1 ml/min2 until it reached 0.8 ml/min. The initial oven temperature
was 32ºC for 12 min and was then increased at 30ºC/min until the oven reached 236°C
and was held at that temperature for 1.2 min. A thermal conductivity detector (TCD) was
used for detection and its temperature was maintained at 230°C. This method detected
CO, CO2, H2, N2, O2, CH4, C2H2, C2H4 and C2H6. TCD detected CO, CO2, H2 and CO2
with great sensitivity but the sensitivity for hydrocarbons such as CH4, C2H2, C2H4 and
C2H6 was low. Thus, the sensitivity to hydrocarbons was increased by attaching TCD in
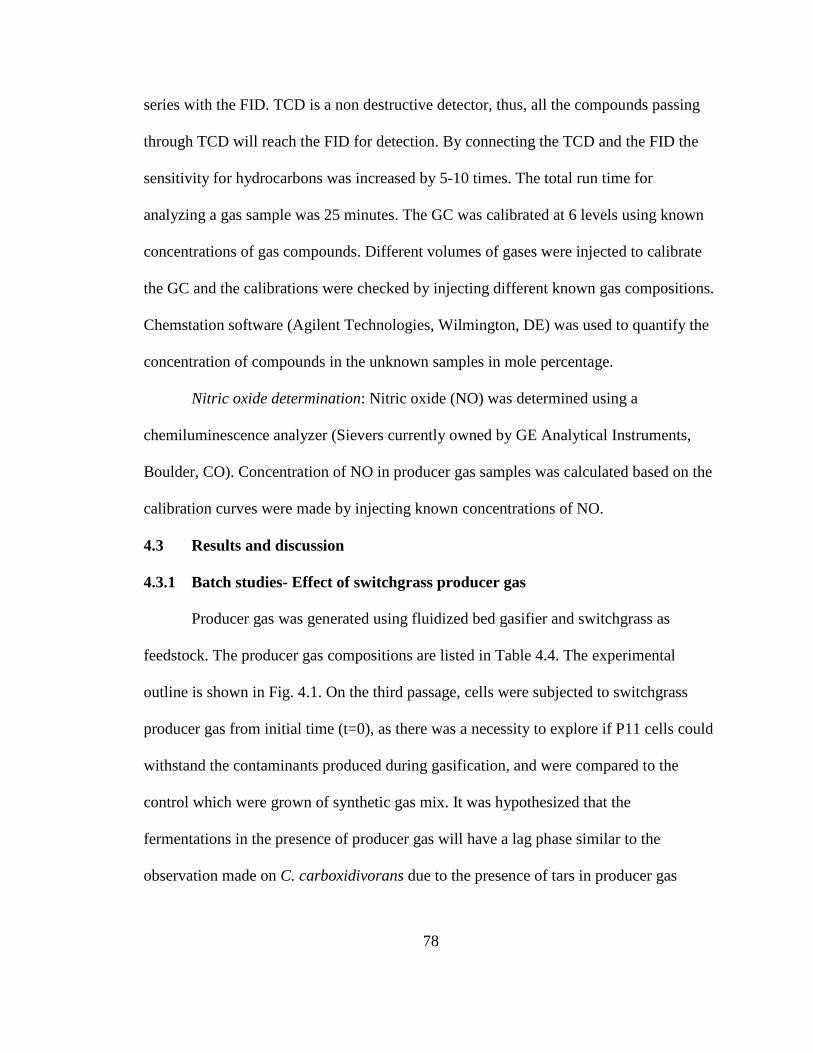
78
series with the FID. TCD is a non destructive detector, thus, all the compounds passing
through TCD will reach the FID for detection. By connecting the TCD and the FID the
sensitivity for hydrocarbons was increased by 5-10 times. The total run time for
analyzing a gas sample was 25 minutes. The GC was calibrated at 6 levels using known
concentrations of gas compounds. Different volumes of gases were injected to calibrate
the GC and the calibrations were checked by injecting different known gas compositions.
Chemstation software (Agilent Technologies, Wilmington, DE) was used to quantify the
concentration of compounds in the unknown samples in mole percentage.
Nitric oxide determination: Nitric oxide (NO) was determined using a
chemiluminescence analyzer (Sievers currently owned by GE Analytical Instruments,
Boulder, CO). Concentration of NO in producer gas samples was calculated based on the
calibration curves were made by injecting known concentrations of NO.
4.3 Results and discussion
4.3.1 Batch studies- Effect of switchgrass producer gas
Producer gas was generated using fluidized bed gasifier and switchgrass as
feedstock. The producer gas compositions are listed in Table 4.4. The experimental
outline is shown in Fig. 4.1. On the third passage, cells were subjected to switchgrass
producer gas from initial time (t=0), as there was a necessity to explore if P11 cells could
withstand the contaminants produced during gasification, and were compared to the
control which were grown of synthetic gas mix. It was hypothesized that the
fermentations in the presence of producer gas will have a lag phase similar to the
observation made on C. carboxidivorans due to the presence of tars in producer gas

79
Gas Type Producer gas composition
(%)
Carbon monoxide (CO) 15.87
Carbon dioxide (CO2) 14.22
Hydrogen (H2) 6.33
Methane (CH4) 2.32
Acetylene (C2H2) 0.12
Ethylene (C2H4) 0.53
Ethane (C2H6) 0.28
Nitric oxide (NO) 44.5 ppm
Oxygen (O2) 0
Nitrogen (N2) (Balance gas) 60.33
Table 4.4 Producer gas compositions from a fluidized bed reactor with
switchgrass as feedstocks; The gas composition is the average of triplicate injections on
Gas chromatography (GC) with a Thermal conductivity detector (TCD).

80
Figure 4.1 Experimental outline for switchgrass producer gas experiment; Control:
Synthetic gas mix of composition 20% CO, 15% CO2, 5% H2 and 60% N2 serves as
substrate; Biomass syngas or syngas: Switchgrass producer gas of gas composition
shown in Table 4.4 serves as substrate; Control � Control: Cultures grown on control
gas mix throughout the experiment (Passage 1, 2 and 3). This serves as a control for the
whole experiment; Control � Syngas: Cells that were grown in synthetic gas mix (in
Passage 1 and 2) are transferred and grown on producer gas (in passage 3); Syngas�
Syngas: Cultures that were grown in producer gas throughout the experiment (Passage 1,
2 and 3) where cells are grown again on producer gas.
Passage 1 Passage 2 Passage 3
Control Control
Control
Biomass syngas
Biomass syngas Biomass syngas
Biomasssyngas
Control �Control
Control �Syngas
Syngas �Syngas
Inoculum: P11 Pure culture
Inoculum: P11 Pure culture

81
generated by the gasifiers (Ahmed et al. 2006). Another reason for using switchgrass
generated producer gas from initial time (t=0) was that, industrial scale fermentations
cannot afford the costly synthetic gas or simulated gas as it increases the operational cost
of the process. Thus, the robustness of the microbe was tested by challenging it to grow
on producer gas from initial time. Also, a parallel experiment was conducted by growing
cells on producer gas during passaging to adapt the cells to the impurities of biomass
generated producer gas. From the observations made from C. carboxidivorans
fermentations (Ahmed 2006), it was hypothesized that the cells that are adapted to
impurities would produce higher solvents than the cells which were not exposed to such
an environment with impurities.
Cell growth and pH: Fig. 4.2 shows cell mass concentrations in different
treatment levels. A vertical solid line shown in Fig. 4.2 at time 250 h is a demarcation
line that will help understand the metabolic shifts during the fermentation that are
explained during the discussion of results. At first, the two phases of cell growth can
easily be noticed which are common to many fermentations, namely, growth phase for
the first 200 h (approximately) and stationary phase after 200 h. Acetic acid was
produced during the first 250 h (Fig. 4.5), after which ethanol was produced (Fig. 4.4).
The two phases are called acidogenesis and solventogenesis respectively (Ahmed et al.
1988; Girbal et al. 1995b; Maddox et al. 2000). Acetic acid is growth associated because
it is coupled with an energy (ATP) generation step (Henstra et al. 2007; Imkamp and
Muller 2007). Media pH data (Fig. 4.3) was in accordance with the product data as acetic
acid production was observed while pH decreased. After acidogenesis, the pH increased
from 4.5 to 5.9 at the end of solventogenic phase. These observations of acidogenesis,
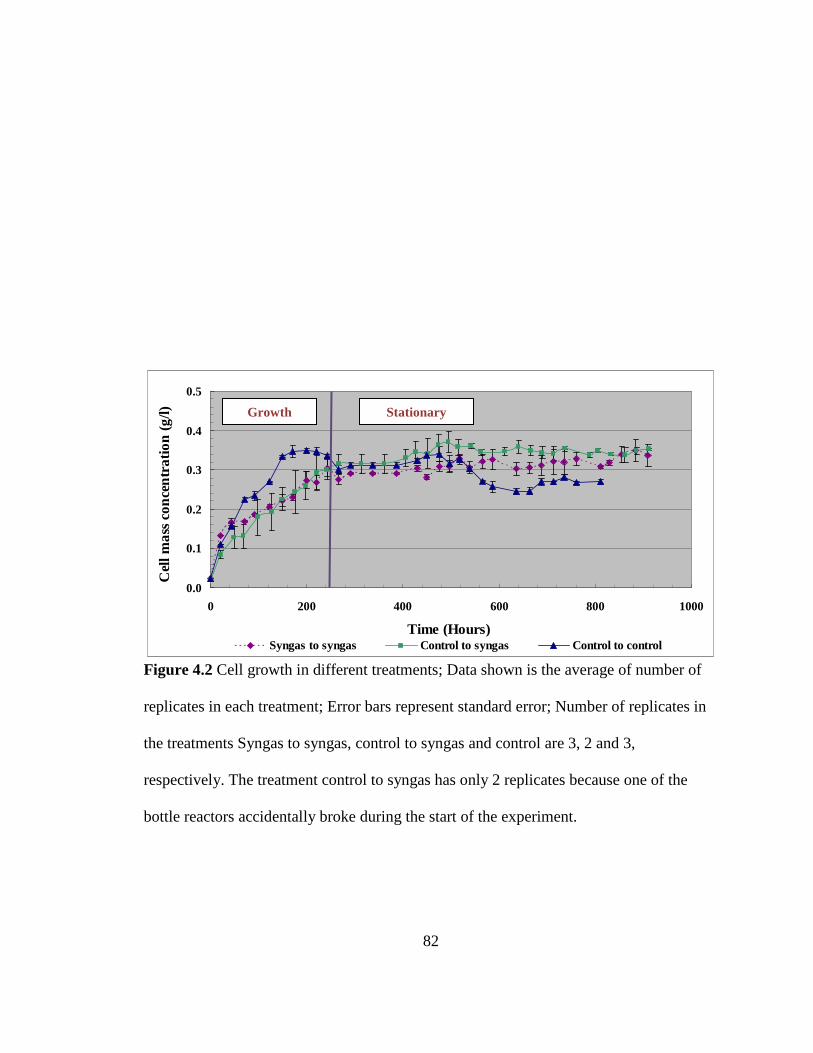
82
Figure 4.2 Cell growth in different treatments; Data shown is the average of number of
replicates in each treatment; Error bars represent standard error; Number of replicates in
the treatments Syngas to syngas, control to syngas and control are 3, 2 and 3,
respectively. The treatment control to syngas has only 2 replicates because one of the
bottle reactors accidentally broke during the start of the experiment.
0.0
0.1
0.2
0.3
0.4
0.5
0 200 400 600 800 1000
Time (Hours)
Cel
l ma
ss c
once
ntra
tion
(g/l)
Syngas to syngas Control to syngas Control to control
Stationary Growth

83
Figure 4.3 pH profile in different treatments. Data shown is the average of number of
replicates in each treatment; Error bars represent standard error; Number of replicates in
Syngas to syngas, control to syngas and control are 3, 2 and 3, respectively.
4.0
4.5
5.0
5.5
6.0
6.5
0 200 400 600 800 1000Time (Hours)
pH
Syngas to syngas Control to syngas Control to control
Acidogenesis Solventogenesis
pH increase could be due to the
disappearance of acids
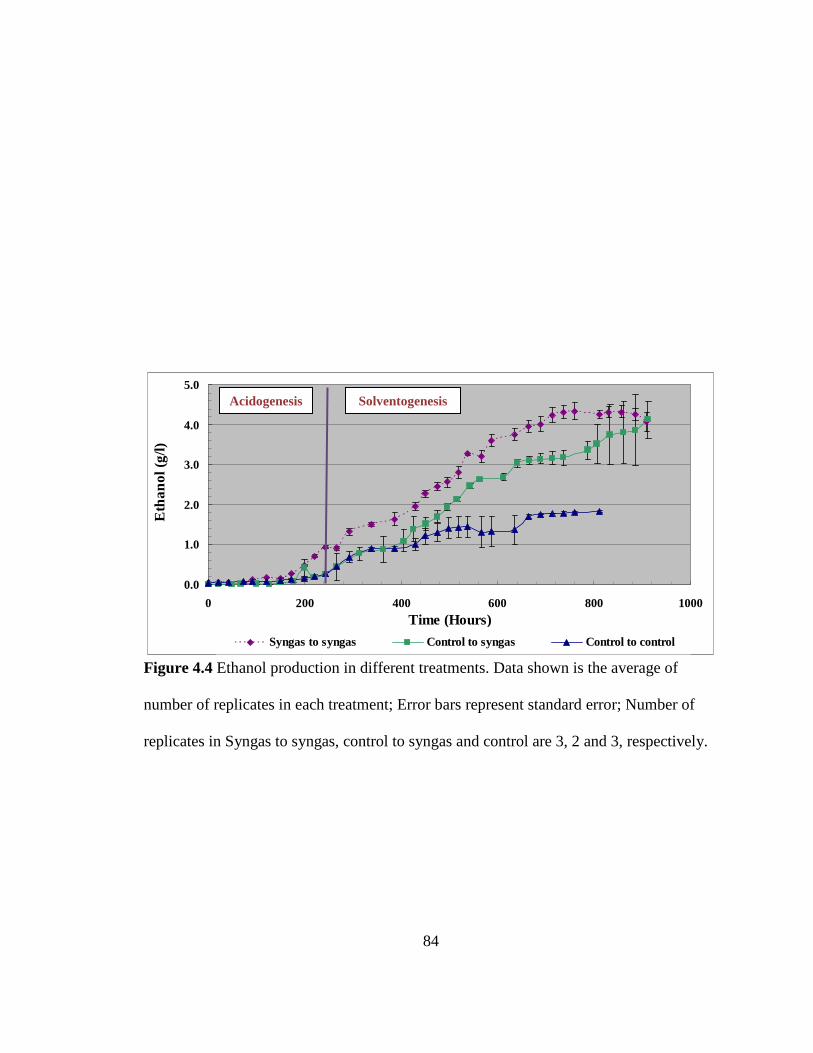
84
Figure 4.4 Ethanol production in different treatments. Data shown is the average of
number of replicates in each treatment; Error bars represent standard error; Number of
replicates in Syngas to syngas, control to syngas and control are 3, 2 and 3, respectively.
0.0
1.0
2.0
3.0
4.0
5.0
0 200 400 600 800 1000Time (Hours)
Eth
anol
(g/
l)
Syngas to syngas Control to syngas Control to control
Acidogenesis Solventogenesis

85
Figure 4.5 Acetic acid production in different treatments. Data shown is the average of
number of replicates in each treatment; Error bars represent standard error; Number of
replicates in Syngas to syngas, control to syngas and control are 3, 2 and 3, respectively
0.0
1.0
2.0
3.0
4.0
0 200 400 600 800 1000Time (Hours)
Ace
tic a
cid
(g
/l)
Syngas to syngas Control to syngas Control to control
Possible conversion of acetic acid into
ethanol Acidogenesis Solventogenesis

86
solventogenesis and pH shifts are in accordance with previous studies (Ahmed et al.
1988; Maddox et al. 2000). However, the pH of the control did not increase as much as
the fermentations with producer gas. The reason for the pH increase could be due to the
reduction of acetic acid into ethanol, which has been confirmed by research at University
of Oklahoma by Dr. Ralph Tanner using C13 isotopes of acetic acid (Ralph Tanner,
personal communication).
From Fig. 4.2, it can be observed that the control had the fastest growth as cell
concentration reached 0.35 g/l in 170 h, whereas, the other treatments took longer to
reach this cell mass concentration. This is because the cells were accustomed to the
synthetic gas mix during passaging. The treatment in which cells were acclimated to
switchgrass producer gas showed a faster rate of growth, during the first 50 h when
compared to cells that were grown in synthetic gas mix and then transferred to
switchgrass generated producer gas. This shows that P11 cells took some time to adjust to
components in the producer gas, but over the full period of fermentation, there was not
much delay to reach maximum cell densities. This is contrary to the observation by
Ahmed et al. (2006) which showed a lag in growth for C. carboxidivorans for a period of
8-10 days when using producer gas. Furthermore, Ahmed et al. (2006) reported that this
lag period was due to the presence of tars such as benzene, toluene, ethyl benzene, p-
xylene, o- xylene and naphthalene. Besides the cyclone separator and acetone scrubbing,
no further cleaning of producer gas was carried out and hence small concentrations of tars
were expected in the producer gas. Although, the presence of tars in producer gas has to
be confirmed but from the data on cell growth it can be easily noted that P11 cells may

87
have more tolerance to tars than C. carboxidivorans, thus making P11 a more robust
organism in producer gas fermentations.
It was also observed that the control had a gradual decrease in cell mass
concentration from 220 h until the end of the fermentation (Fig. 4.2). Unlike the control,
the treatments which were exposed to switchgrass producer gas had steady cell mass
concentrations. It can be observed that the pH increases and acetic acid concentrations
decrease after 250 h. It could be possible that P11 has an alternative energy system for its
energy conservation such as the chemiosmotic mechanism, otherwise called electron
transport phosphorylation, which are common to some acetogens (Imkamp and Muller
2007). It is possible that the proton gradient which is formed due to the release of acetic
acid helps the microbe with energy production (Fig. 4.6) for metabolic activities in the
stationary phase as that does not allow the cell mass concentrations to decrease.
Product profiles: The products of P11 fermentations are primarily ethanol and
acetic acid, however, isopropanol production was observed when switchgrass producer
gas was used in this experiment. Ethanol, acetic acid and isopropanol production graphs
are shown in Figs. 4.4, 4.5 and 4.7 respectively. There was an indication that some
components of biomass producer gas not present in the synthetic gas mix were
responsible for increased solvent production. When switchgrass producer gas was the
substrate, a 123% increase in ethanol concentration was observed over when the synthetic
gas mix was used (~ 4.1 g/l vs. 1.83 g/l). Also, isopropanol was produced, and acetic acid
concentration was decreased by 41% when producer gas was the substrate as compared to
the synthetic gas mix (1.69 g/l with switchgrass producer gas vs. 2.88 g/l with synthetic
gas). The effect of compositional variation could have caused the difference in product
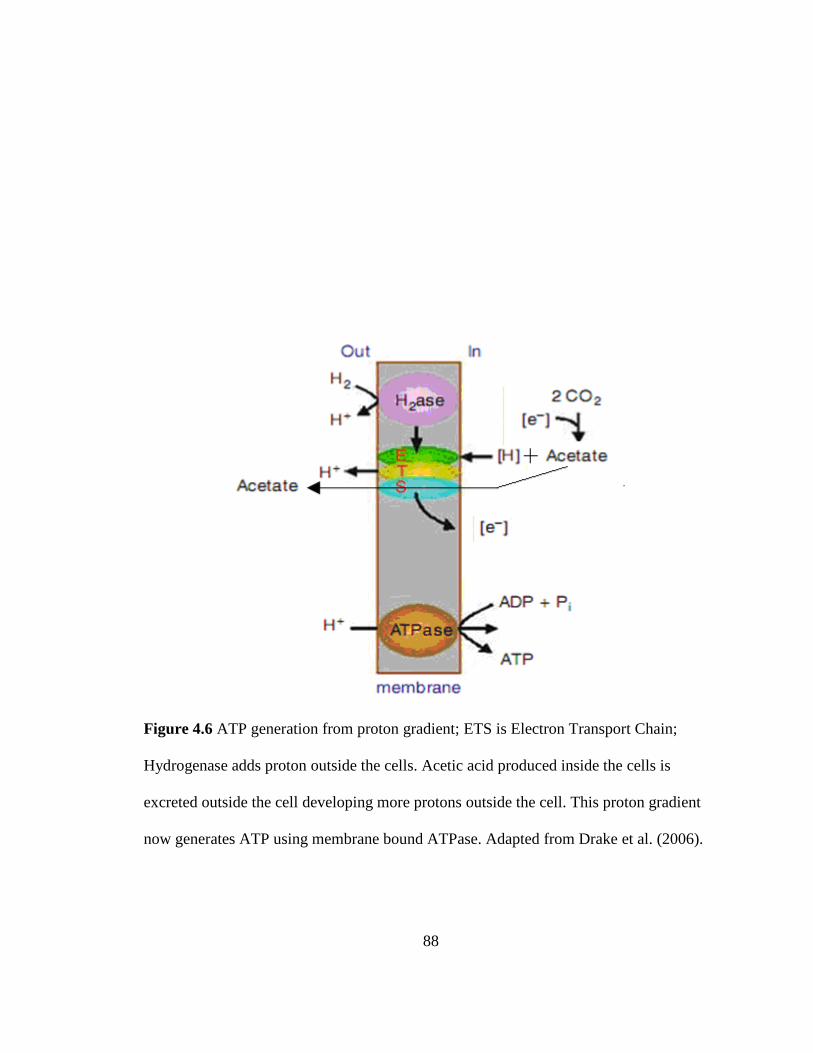
88
Figure 4.6 ATP generation from proton gradient; ETS is Electron Transport Chain;
Hydrogenase adds proton outside the cells. Acetic acid produced inside the cells is
excreted outside the cell developing more protons outside the cell. This proton gradient
now generates ATP using membrane bound ATPase. Adapted from Drake et al. (2006).

89
Figure 4.7 Isopropanol production in different treatments; Data shown is the average of
number of replicates in each treatment; Error bars represent standard error; Number of
replicates in Syngas to syngas, control to syngas and control are 3, 2 and 3 respectively.
0.0
1.0
2.0
3.0
4.0
5.0
0 200 400 600 800 1000
Time (Hours)
Iso
pro
pano
l (g/
l)
Syngas to syngas Control to syngas Control to control
Isopropanol production
starts exponentially after 550 h

90
concentration because CO, which is both a carbon and electron source, was 20.65% less
in switchgrass generated producer gas (20% in synthetic gas mix and 15.87% in
switchgrass generated producer gas) and H2, which is an electron source, was 26.6%
higher in switchgrass generated producer gas (5% in synthetic gas mix and 6.33% in
switchgrass generated producer gas). If compositional variation had been the only reason
for the observed metabolic shifts, then both adapted and unadapted cells should have
performed similarly, with respect to product productivities. The exact effect of
compositional changes of the gas needs to be determined by blending the gases with the
help of mass flow controllers similar to composition achieved with producer gas
generated from biomass by gasification.
Microbial growth requires enormous amounts of energy for synthesizing the
building blocks of the microbe. Energy in the form of ATP is generated during acetic acid
production by substrate level phosphorylation, and hence it is a growth related product.
In all the treatments, acetic acid was observed as a growth related product, however, the
amounts of acetic acid produced differed from one treatment to other (Fig. 4.5). In the
first 250 h of fermentation, acetic acid concentration was found to be the highest with the
treatment where cells were previously grown on synthetic gas mix and were transferred
into next passage where switchgrass producer gas served as the substrate (Control to
syngas). It is important to note that the number of cells in the treatment control to syngas
was less than the control and hence acetic acid concentrations were compared based on g
of acetic acid/ g of cell. It was observed that the treatment control to syngas had acetic
acid yields 39.75% higher than the control (7.98 g of acetic acid/g of cells in control to
syngas compared to 5.71 g acetic acid/g of cell in control). This indicates that
91
components of producer gas could be up-regulating the enzymes in the pathway for acetic
acid production. Since the production of acetic acid for syngas to control is higher than
the control, it can be deduced that the contaminants did not have any negative effect of
acetic acid production, which demonstrates robustness of the microbe. The treatment
syngas to syngas had 1.59 times lesser acetic acid than the control (1.69 g/l of acetic acid
in the treatment syngas to syngas compared to 2.88 g/l in control). A culture which is
adapted (or acclimated) to the contaminants of switchgrass producer gas showed that it
could attain the same cell mass concentrations while producing less acetic acid (which is
a growth related product). The energy derived for growth and metabolic activities could
be coming from alternative ways, for instance, the energy conservation mechanisms in
acetogens such as the chemiosmotic mechanism (Imkamp and Muller 2007). Since acetic
acid is not the product of interest, reduced amounts of acetic acid is desired in the
fermentations. Furthermore, the presence of biomass generated producer gas resulted in a
decline in acetic acid concentration after 400 h with a concomitant increase in pH,
increase in ethanol concentration and was associated with stable cell mass concentration.
The standard error bars are larger during the decrease in acetic acid concentrations in the
treatment control to syngas, which could be due to the culture heterogeneity as described
in the past by Tracy et al. (2008) and Avery (2006). Also, it could be due to a lower
number of replicates than the other treatments since one of the bottles was broken while
conducting the experiments.
The theoretical conversion of acetic acid to ethanol can take place from the
following reduction reaction:
CH3COOH + 2H2 → C2H5OH + H2O (4.2)
92
Thus, the formation of ethanol from acetic acid can have a theoretical value of
0.77 g of ethanol/g of acetic acid (46 g of ethanol formed from 60 g of acetic acid). This
raises the question of whether the observed higher amount of ethanol with switchgrass
producer gas could be attributed to conversion of acetic acid into ethanol. To answer this
question, an assumption was made that all the hydrogen responsible for the theoretical
conversion of reaction 4.2 is available. This assumption was supported by some studies in
our laboratory that showed consumption of CO during the stationary phases that could be
a possible source of reducing equivalents necessary for the reduction of acetic acid to
take place (data not shown). Calculations were made based on the theoretical amount of
ethanol that can be produced from acetic acid to remove the effect of ethanol production
from acetic acid in order to see if the producer gas contaminants enhanced ethanol from
the acetyl-CoA pathway (Table 4.5). From the table, it could be deduced that acetic acid
conversion to ethanol facilitated increase in ethanol concentrations (by 1.32 g/l in control
to syngas and 1.11 g/l in syngas to syngas treatments). Despite the contribution of acetic
acid, ethanol concentrations were still 53% and 63% higher in the treatments control to
syngas and syngas to syngas than in the control, respectively (Table 4.5). This could be
due to contaminants in producer gas that may have contributed in the up-regulation of the
methyl and carbonyl branches of acetyl-CoA pathway (from CO and CO2) to form
ethanol.
Ethanol formation was induced earliest, 170 h, in the treatment syngas to syngas
compared to 220 h in the control and control to syngas treatments (Fig. 4.4). The
productivity of ethanol was also the highest in the treatment syngas to syngas (4 g/l was
ethanol concentrations was achieved in 680 h) compared to control to syngas (909 h to

93
Treatment Total
ethanol
(g/l)
Highest
acetic acid
(g/l)
Final acetic
acid (g/l)
Total acetic
acid
consumed
(g/l)
Theoretical
ethanol from
acetic acid
(g/l)
Net ethanol not
from acetic acid
( i.e. from CO
and H2) (g/l)
Control to control 1.83 2.88 2.88 0 0 1.83
Control to syngas 4.12 2.75 1.03 1.72 1.32 2.8
Syngas to syngas 4.09 1.69 0.25 1.44 1.11 2.98
Table 4.5 Theoretical conversions of acetic acid to ethanol.

94
achieve 4 g/l). Thus, the culture that was adapted to producer gas had better solvent
productivities.
Surprisingly, isopropanol production was observed with switchgrass producer gas
at concentrations as high as 3.9 g/l (Fig. 4.7). While only 0.12 g/l of isopropanol was
produced in the control, 3.55 g/l of isopropanol was produced in the treatment control to
syngas and 3.9 g/l of isopropanol was produced in the treatment syngas to syngas.
Isopropanol production was induced 100 h earlier with adapted culture (in the treatment
syngas to syngas at 500 h) when compared to unadapted culture (treatment with control
to syngas at 600 h). Exponential increase in isopropanol production occurred only after
550 h approximately, and during that time the rate of ethanol production slowed down
(Fig. 4.4). It could be possible that enzymes responsible for ethanol production were
inactivated due to the long experiment time, but the cells still had reducing energy
(electrons) to produce isopropanol from acetone (Fig. 3.6). The production of isopropanol
has been confirmed with producer gas fermentations carried by other colleagues in our
group in pilot scale reactors (Kundiyana et al. 2009). Preliminary experiments in our
laboratory have indicated that P11 has the ability to reduce acetone into isopropanol (data
not shown). Further investigations are necessary to confirm the biological production of
isopropanol in the presence of syngas, but this study showed that P11 has an enzyme that
can reduce acetone to isopropanol.
The distribution of products for P11 is similar to observations made by Datar
(2004) and Ahmed (2006) on C. carboxidivorans. Besides tars, nitric oxide (NO) was one
of the contaminants that was found responsible for the metabolic shifts that increased
ethanol concentrations by 5 to 7 times, increased the activity of alcohol dehydrogenase

95
and acted as a non competitive, reversible inhibitor to hydrogenase above 40 ppm
(Ahmed and Lewis 2007). The concentration of NO in the switchgrass producer gas was
found to be 44.5 ppm and it could be affecting the metabolic shifts in P11 similar to C.
carboxidivorans. However, the effect of NO on P11 was not included in this study and
needs to be researched further to understand the effect of NO on product formation in
P11 fermentations. The treatment in which cells were adapted to syngas (syngas to
syngas) had the highest mole percentages of solvents (ethanol and isopropanol = 94.5
mole %) and only 4.5 mole% acetic acid (Fig. 4.8). Treatment control to syngas equally
performed well with 89.3 % solvents and 10.7% acetic acid while the control produced
46 % (mole) solvents and 54 % (mole) acetic acid. Molar percentages obtained with
treatment syngas to syngas is desired at industrial scale although the concentrations of
solvents were low for industrial production. Higher concentrations of ethanol (27.6 g/l)
and isopropanol (9.3 g/l) have been reported by Kundiyana et al (2009) during a
switchgrass producer gas fermentation over 45 days in a 75 L CSTR reactor while
retaining the similar molar concentrations of solvent and acids (90.3% solvents and 9.7%
acid). A deeper knowledge of the metabolism of the microbe and effect of individual
components of producer gas will help favor higher concentrations of products with molar
ratios similar to what has been achieved in bottle reactors. Also, the mass transfer of
producer gas components, which is very low in bottle reactors, could be increased by
using CSTR, bubble column and/or membrane reactors that will eventually increase the
concentrations of ethanol (Kundiyana et al. 2009; Rajagopalan et al. 2002). This study
has clearly showed that P11 produced more solvent using producer gas than using
synthetic bottled gases with a similar CO and H2 composition. Further

96
Figure 4.8 Mole percentage of products formed in different treatments. Error bars
represent standard error.
0
10
20
30
40
50
60
Syngas to syngas Control to syngas Control to control
Mo
le %
Ethanol Isopropanol Acetic acid

97
investigations with the minor components of producer gas will help in understanding the
role of these components in inducing metabolic shifts in producer gas fermentations.
4.3.2 Batch studies – Effect of 5% methane in P11 fermentations
Methane (CH4), a major component of producer gas obtained by gasification
of agricultural feedstocks was found to vary from 1.85% (in our studies) to as high as 5%
(Datar et al. 2004). Although methane is considered as an inert component of producer
gas in many studies using other microbes like P. productus (Vega et al. 1988a) and C.
carboxidivorans (Datar 2003), it is still necessary to find the effect of methane because it
constitutes the single largest hydrocarbon contaminant of producer gas. It was
hypothesized that methane could have a major effect on producer gas fermentations as
the experiment using switchgrass syngas showed a major product distribution. To test this
hypothesis, an experiment was conducted with synthetic gas having 5% CH4. The
synthetic producer gas composition used to study the effect of methane was 20% CO,
15% CO2, 5% H2, 5% CH4 and 55% N2 whereas the control gas composition was 20%
CO, 15% CO2, 5% H2 and 60% N2. The overall experimental outline of this experiment is
shown in Fig. 4.9. Two negative controls were also used in this experiment, one for each
gas treatment. Negative controls were used to confirm whether apparent gas consumption
was due to the microbe or by abiotic mechanisms such as the solubility of methane was in
the media. Methane could be a potential contributor to the shift in metabolic activities
observed in the switchgrass producer gas studies.
Growth and pH: The growth and pH profiles are shown in Figs. 4.10 and 4.11. In
both treatments, exponential increase in growth was seen after a lag phase of 24 h which
lasted from 24 h up to 70 h. The cells were in stationary phase until 200 h (in both

98
Figure 4.9 Experimental outline for contaminant experiment; Control-Synthetic gas mix
of composition 20% CO, 15% CO2, 5% H2 and 60% N2 as substrate; Treatment with 5%
methane- Synthetic gas mix with 5% methane (Gas composition had a composition of
20% CO, 15% CO2, 5% H2, 5% CH4 and 55% N2); Negative control: Control-
Uninoculated bottle reactor with synthetic (or control) gas; Negative control with 5%
methane- Uninoculated bottle reactor with 5% methane included in the synthetic gas.
Passage 1 Passage 2 Passage 3
Control Control
Control
Treatment with 5% methane
Inoculum: P11 Pure culture
Negative control: Control
Negative control with 5% methane

99
Figure 4.10 Cell growth in different treatments; Each data point is the average of 3
replicates except the negative controls where the number of replicates is 2; Error bars
represent standard error.
0.00
0.10
0.20
0.30
0.40
0 100 200 300 400
Time (Hours)
Cel
l ma
ss c
onc
entra
tion
(g/l)
Control 5% methane Neg control Neg cont w methane

100
Figure 4.11 pH profiles in different treatments; Each data point is the average of 3
replicates except the negative controls where the number of replicates is 2; Error bars
represent standard error.
4.50
5.00
5.50
6.00
6.50
0 100 200 300 400
Time (Hours)
pH
Control 5% methane Neg control Neg control w methane

101
treatments), which was followed by a secondary growth phase. The pH data is in
accordance with the growth as there was a decrease in pH from 6.1 to 4.65 due to acetic
acid production during the growth phase. The negative controls, showed no change in cell
mass concentration and pH as expected. Similar cyclic behavior of growth and solvent
production has been reported in C. acetobutylicum (Tracy et al. 2008). Other experiments
with P11 have also shown similar behavior (data not shown). The growth and pH profiles
in the presence of 5% methane are very similar to that of the control, which shows that
5% methane did not have any effect on P11 growth.
Product profiles: Ethanol and acetic acid production profiles are shown in Figs.
4.12 and 4.13. In the presence of 5% methane, ethanol production was only 15% higher
(0.23 g/l in the presence of 5% methane compared to 0.2 g/l in control). This increase
could be due to culture heterogeneity (Avery 2006; Tracy et al. 2008). Ethanol
concentration at 190 h is unusually higher and could be an outlier. Also, only 6.93%
variation between the control and 5% methane treatment in the acetic acid profiles (Fig.
4.13) indicate that methane did not affect the metabolic activities of the microbe which
supports studies in the past. Vega et al. (1988a) used methane as a pressure indicator for
gas analysis calculations in P. productus. Also, Datar (2003) observed that concentrations
of 4.5% methane did not affect gas utilization or growth, which confirmed the inert
nature of methane to C. carboxidivorans.
Gas consumption profiles: Consumption of the gaseous substrates CO, H2, CO2
and CH4 are shown in Figs. 4.14, 4.15, 4.16 and 4.17, respectively. Gas analysis was
performed only for 190 h of fermentation because of equipment failure. CO and H2
consumption occurred throughout the growth phase of the fermentations and similar

102
Figure 4.12 Ethanol production in different treatments; Each data point is the average of
3 replicates except the negative controls where the number of replicates is 2; Error bars
represent standard error.
0.000
0.075
0.150
0.225
0.300
0 100 200 300 400
Time (Hours)
Eth
ano
l (g
/l)
Control Treatment: 5% Methane Neg control Neg Cont w methane

103
Figure 4.13 Acetic acid production in different treatments; Each data point is the average
of 3 replicates except the negative controls where the number of replicates is 2; Error bars
represent standard error.
0.0
1.0
2.0
3.0
4.0
0 100 200 300 400
Time (Hours)
Ace
tic a
cid(
g/l)
Control 5% Methane Neg control Neg control w methane

104
Figure 4.14 CO consumption in different treatments; Each data point is the average of 2
replicates except the negative controls where no replicates was used; Error bars represent
standard error.
0
4
8
12
16
20
0 50 100 150 200 250
CO
co
nsu
mp
tion
(mM
)
Time (Hours)
Control Treatment- 5% methane Neg control Neg cont w methane

105
Figure 4.15 H2 consumption in different treatments; Each data point is the average of 2
replicates except the negative controls where no replicates was used; Error bars represent
standard error.
-1
0
1
2
3
4
5
0 50 100 150 200 250
H2
co
nsu
mp
tion
(mM
)
Time (Hours)
Control Treatment- 5% methane Neg control Neg cont w methane

106
Figure 4.16 CO2 consumption in different treatments; Each data point is the average of 2
replicates except the negative controls where no replicates was used; Error bars represent
standard error. The negative trend shows CO2 production during P11 fermentations.
-6
-4
-2
0
2
4
6
0 50 100 150 200 250
CO
2 c
on
sum
ptio
n (m
M)
Time (Hours)
Contol Treatment- 5% methane Neg control Neg cont w methane
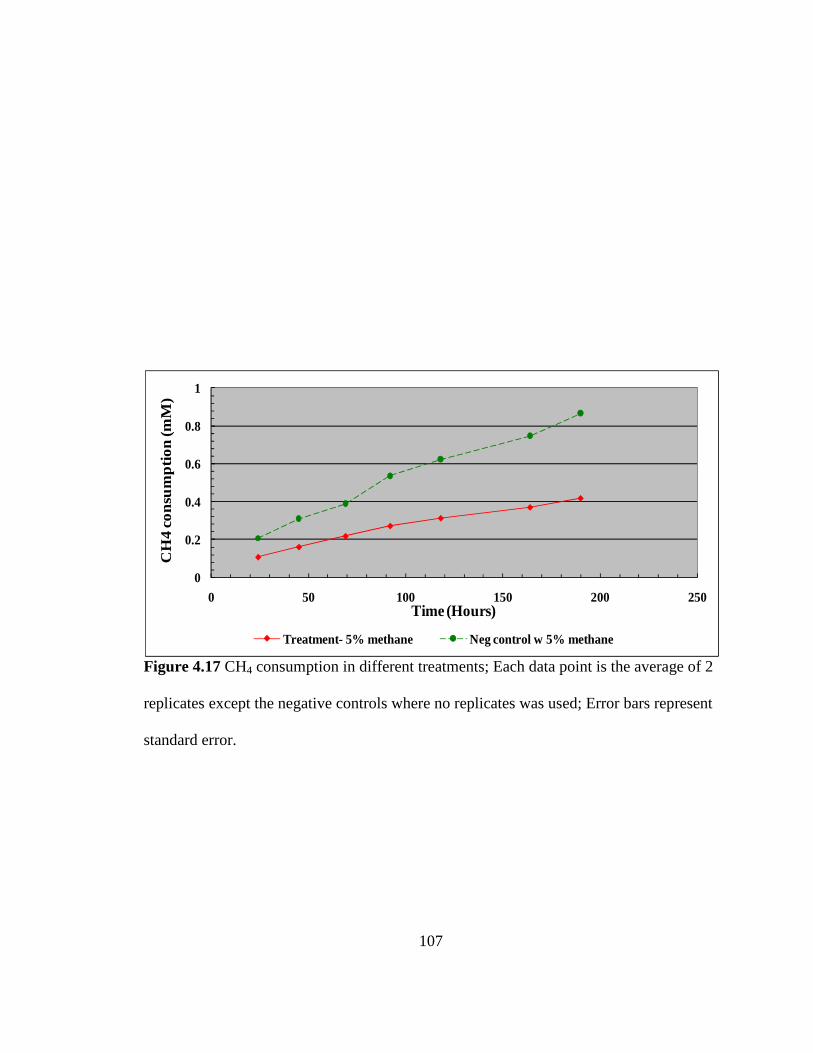
107
Figure 4.17 CH4 consumption in different treatments; Each data point is the average of 2
replicates except the negative controls where no replicates was used; Error bars represent
standard error.
0
0.2
0.4
0.6
0.8
1
0 50 100 150 200 250
CH
4 c
on
sum
ptio
n (m
M)
Time (Hours)
Treatment- 5% methane Neg control w 5% methane

108
consumption of these gases were found in both the control and methane treatment, which
indicates that methane did not affect the enzymes that are responsible for gas utilization
such as carbon monoxide dehydrogenase (CODH) and hydrogenase. CO2 was produced
in P11 fermentations as previously observed, which is evident with a negative trend. An
increasing trend of CO2 and CH4 apparent consumption for the negative controls is likely
due to the solubility of these gases in the media. Furthermore, the small difference in the
methane consumption between negative control and the treatment which employed 5%
methane indicate that the apparent consumption was due to methane be absorbed by the
media not the utilization of methane by the microbes. Similar results in the product
formation graphs and gas utilization patterns show that 5% methane did not affect the
metabolism of the microbe.
4.3.4 Conclusions
Successful integration of biomass gasification for anaerobic conversion of
biomass generated producer gas into ethanol and acetic acid has been demonstrated in lab
scale batch reactors. Studies were conducted to investigate the effect of contaminants in
switchgrass producer gas and the effect of 5% methane in P11 fermentations. P11 was
found to withstand the contaminants of biomass generated producer gas without any loss
of cell mass productivity and solvent productivity, which demonstrates the robustness of
the microbe. The constituents of producer gas obtained from gasifiers increased ethanol
to acetate ratios and produced isopropanol as an additional product. Gas clean up is a
critical issue for the successful large scale integration of gasification and fermentation
system. The cost of cleaning the producer gas could be reduced if the microbes are found
to tolerate and produce more solvents in the presence of contaminants as identified by our

109
research. Further investigations at molecular level are necessary to assess the reasons
behind these metabolic shifts. Besides this, the tolerance limit of each contaminant
would help to find the extent of producer gas clean up necessary when different gasifiers
and biomass feedstocks are used. Furthermore, this research has also shown that the
presence of up to 5% methane in biomass generated producer gas will not affect the
fermentation by P11. This is evident from our research as there was no variation in cell
growth, product formation and substrate consumption. Thus, the product re-distribution
obtained when switchgrass producer gas was employed could not have been due to the
presence of methane.
Acknowledgements
This research was supported by the South Central Sun Grant Initiative. We appreciate the
Dr. Ralph Tanner for isolating and providing us with P11 bacteria. Special thanks to
Robert Ingraham for helping with setting up the Gas Chromatography methods and to Dr.
Krushna Patil for providing us with the biomass producer gas.

110
4.3.4 References
Abrini J, Naveau H, Nyns E. 1994. Clostridium autoethanogenum, sp. nov., an anaerobic
bacterium that produces ethanol from carbon monoxide. Archives of
Microbiology 161(4):345-351.
Ahmed A. 2006. Effect of biomass-generated syngas on cell growth, product distribution
and enzyme activities of Clostridium caboxidivorans P7T [Ph.D. Dissertation].
Stillwater: Oklahoma State University. 227 p.
Ahmed A, Cateni B, Huhnke R, Lewis R. 2006. Effects of biomass-generated producer
gas constituents on cell growth, product distribution and hydrogenase activity of
Clostridium carboxidivorans P7T. Biomass and Bioenergy 30(7):665-672.
Ahmed A, Lewis RS. 2007. Fermentation of biomass-generated synthesis gas: Effects of
nitric oxide. Biotechnology and Bioengineering 97(5):1080-1086.
Ahmed I, Ross R, Mathur V, Chesbro W. 1988. Growth rate dependence of
solventogenesis and solvents produced by Clostridium beijerinckii. Applied
Microbiology and Biotechnology 28(2):182-187.
Anderson DP, Outlaw JL, Bryant HL, Richardson JW, Ernstes DP, J. Marc Raulston,
Welch JM, Knapek GM, Herbst BK, Allison MS. 2008. The effects of ethanol on
Texas food and feed. College Station: Texas A&M Universtity. 39 p.
Anonymous. 2009a. Oil market basics demand. Washington, DC: Energy Information
Adminstration.
Anonymous. 2009b. Growing innovation America’s energy future starts at home.
Washington, DC: Renewable Fuel Association.

111
Anonymous. 1995. Bench-scale demonstration of biological production of ethanol from
coal synthesis gas. Fayettville: Bioengineering Resources, Inc. Report nr
DOE/PC/92118--T14. 19 p.
Avery S. 2006. Microbial cell individuality and the underlying sources of heterogeneity.
Nature Reviews Microbiology 4(8):577-587.
Belgiorno V, Feo GD, Rocca CD, Napoli RMA. 2003. Energy from gasification of solid
wastes. Waste Management 23(1):1-15.
Bridgewater AV. 1994. Catalysis in thermal biomass conversion. Applied Catalysis A:
General 116(1-2):5-47.
Datar RP. 2003. Anaerobic fermentation of biomass generated producer gase to ethanol
[Ph.D. Dissertation]. Stillwater: Oklahoma State University. 229 p.
Datar RP, Shenkman RM, Cateni BG, Huhnke RL, Lewis RS. 2004. Fermentation of
biomass-generated producer gas to ethanol. Biotechnology and Bioengineering
86(5):587-594.
Drake HL, Kusel K, Matthies C. 2006. Acetogenic prokaryotes. In: Dworkin M, Falkow
S, Rosenberg E, Schleifer K-H, Stackebrandt E, editors. The prokaryotes. New
York: Springer. p 354-420.
El-Rub ZA, Bramer EA, Brem. G. 2004. Review of catalysts for tar elimination in
biomass gasification processes. Industrial & Engineering Chemistry Research
43(22):6911-6919.
Gaddy JL; Bioengineering Resources, Inc., assignee. 1998. Biological production of
products from waste gases [Patent]. USA.
112
Gerhardt PR, Murray GE, Costilow RN, Nester EW, Wood WA, Krieg NR, Phillips GB.
1981. Manual of methods for general microbiology. Washington, DC: ASM
Press. 1106 p.
Girbal L, Croux C, Vasconcelos I, Soucaille P. 1995a. Regulation of metabolic shifts in
Clostridium acetobutylicum ATCC 824. FEMS Microbiology Reviews 17(3):287-
297.
Girbal L, Vasconcelos I, Saint-Amans S, Soucaille P. 1995b. How neutral red modified
carbon and electron flow in Clostridium acetobutylicum grown in chemostat
culture at neutral pH. FEMS Microbiology Reviews 16(2-3):151-162.
Grethlein A, Worden R, Jain M, Datta R. 1990. Continuous production of mixed alcohols
and acids from carbon monoxide. Applied Biochemistry and Biotechnology
24(1):875-884.
Henstra AM, Sipma J, Rinzema A, Stams AJ. 2007. Microbiology of synthesis gas
fermentation for biofuel production. Current Opinion in Biotechnology 18:200-
206.
Huber GW, Iborra S, Corma A. 2006. Synthesis of transportation fuels from biomass:
Chemistry, catalysts, and engineering. Chemical Reviews 106:4044-4098.
Huhnke RL, Lewis RS, Tanner RS; 2006. Isolation and characterization of novel
clostridial species [Patent application]. USA.
Hyman M, Arp D. 1988. Reversible and irreversible effects of nitric oxide on the soluble
hydrogenase from Alcaligenes eutrophus H16. Biochemical Journal 254(2):469-
475.

113
Hyman M, Arp D. 1991. Kinetic analysis of the interaction of nitric oxide with the
membrane-associated, nickel and iron-sulfur-containing hydrogenase from
Azotobacter vinelandii. Biochimica et Biophysica Acta 1076(2):165.
Imkamp F, Muller V. 2007. Acetogenic bacteria. Encyclopedia of life sciences. Malden:
John Wiley & Sons, Inc. p 1-8.
Krasna A, Rittenberg D. 1954. The inhibition of hydrogenase by nitric oxide.
Proceedings of the National Academy of Sciences 40(4):225-227.
Kundiyana DK, Huhnke RL, Wilkins MR. 2009. Syngas fermentation in a 100 L pilot
scale fermentor: design and process considerations. Journal of Bioscience and
Bioengineering. [Online]. Available:
http://dx.doi.org/10.1016/j.jbiosc.2009.10.022
Lashof D, Ahuja D. 1990. Relative contributions of greenhouse gas emissions to global
warming. Nature 344:529-531.
Lewis RS, Tanner RS, Huhnke RL; 2007. Indirect or direct fermenattion of biomass to
fuel alcohol [Patent application]. USA.
Ljundahl LG. 1986. The autotrophic pathway of acetate synthesis in acetogenic bacteria.
Annual Review of Microbiology 40:415-450.
Maddox I, Steiner E, Hirsch S, Wessner S, Gutierrez N, Gapes J, Schuster K. 2000. The
cause of "acid crash" and "acidogenic fermentations" during the batch acetone-
butanol-ethanol (Girbal et al.) fermentation process. Journal of Molecular
Microbiology and Biotechnology 2(1):95-100.
McKendry P. 2002. Energy production from biomass (part 1): overview of biomass.
Bioresource Technology 83(1):37-46.
114
Olofsson K, Bertilsson M, Lidén G. 2008. A short review on SSF–an interesting process
option for ethanol production from lignocellulosic feedstocks. Biotechnology for
Biofuels 1:7.
Pannerselvam A. 2009. Effect of glucose and reducing agents on syngas fermentation by
clostridia species P11 [M.S Thesis]. Stillwater: Oklahoma State University. 82 p.
Ragsdale SW. 1991. Enzymology of the acetyl-CoA pathway of CO2 fixation. Critical
Reviews in Biochemistry and Molecular Biology 26(3/4):261-300.
Rajagopalan S, Datar RP, Lewis RS. 2002. Formation of ethanol from carbon monoxide
via a new microbial catalyst. Biomass and Bioenergy 23:487-493.
Rogers P, Chen J-S, Zidwick MJ. 2006. Organic acid and solvent production Part I:
Acetic, lactic, gluconic, succinic and polyhydroxyalkanoic acids. In: Dworkin M,
Falkow S, Rosenberg E, Schleifer K-H, Stackebrandt E, editors. The Prokaryotes.
New York: Springer. p 511-755.
Smith K, Klasson K, Clausen A, Gaddy J. 1991. COS degradation by selected CO-
utilizing bacteria. Applied Biochemistry and Biotechnology 28(1):787-796.
Tibelius K, Knowles R. 1984. Hydrogenase activity in Azospirillum brasilense is
inhibited by nitrite, nitric oxide, carbon monoxide, and acetylene. Journal of
Bacteriology 160(1):103-106.
Tracy B, Gaida S, Papoutsakis E. 2008. Development and application of flow-cytometric
techniques for analyzing and sorting endospore-forming clostridia. Applied and
Environmental Microbiology 74(24):7497.
Tsai S-P, Datta R, Basu R, Yoon S-H; 2009a. Syngas conversion system using
asymmetric membrane and anaerobic microorganism [Patent application]. USA.
115
Tsai S-P, Datta R, Basu R, Yoon S-H, Tobey RE; 2009b. Modular membrane supported
bioreactor for conversion of synags components to liquid products [Patent
application]. USA.
Ungerman A, Heindel T. 2008. Carbon monoxide mass transfer for syngas fermentation
in a stirred tank reactor with dual impeller configurations. Biotechnology Progress
23(3):613-620.
Vega J, Holmberg V, Clausen E, Gaddy J. 1988. Fermentation parameters of
Peptostreptococcus productus on gaseous substrates (CO, H2/CO2). Archives of
Microbiology 151(1):65-70.
Vega J, Klasson K, Kimmel D, Clausen E, Gaddy J. 1990. Sulfur gas tolerance and
toxicity of CO-utilizing and methanogenic bacteria. Applied Biochemistry and
Biotechnology 24(1):329-340.
116
CHAPTER 5
EFFECT OF PHYSICAL PARAMETERS AND EVALUATION OF KINETIC
PARAMETERS IN PRODUCER GAS FERMENTATIONS USING
CLOSTRIDIUM STRAIN P11
5.1 Introduction
Biomass derived feedstocks can provide a renewable and carbon neutral source
for ethanol production which has the potential to replace significant amounts of
petroleum consumed by the transportation sector of the United States (Khanal 2008;
Putsche and Sandor 1996). Primary agricultural crops such as sugarcane and corn are
currently the most important feedstocks for bioethanol production and industrial scale
production of bioethanol from these feedstocks has been successfully demonstrated by
Brazil and the United States (Tsai et al. 2009). These feedstocks are primarily a source of
food, which has given rise to many ethical questions like whether corn should be used for
food or fuel and the availability of land to grow corn (Anderson et al. 2008). This has led
to the development of alternative technologies such as the hydrolysis-fermentation and
thermochemical conversion of cellulosic biomass (corn stover, wheat straw, barley straw,
rice straw, switchgrass, wood waste, urban waste etc) into ethanol (Ananymous 2009b).
One such thermochemical conversion process is gasification. Gasification is a process in
which carbonaceous materials (natural gas, naphtha, residual oil petroleum

117
coke, coal or biomass) react with a gasification medium (air, oxygen and/or steam) at
high temperatures (~600-1000 °C) to produce a mixture of gases called synthesis gas
(syngas) or producer gas (El-Rub et al. 2004; Huber et al. 2006; Kumar et al. 2009;
McKendry 2002b; Spath and Dayton 2003). The producer gas produced by the
gasification processes can be converted into numerous products such as heat, electricity,
transportation fuels (hydrogen, Fisher-Tropsch diesel, synthetic gasoline) and chemicals
using chemical catalysis (El-Rub et al. 2004; Huber et al. 2006). Besides this,
microorganisms such as Peptostreptococcus productus, Clostridium ljundahlii,
Butyribacterium methylotrophicum and Clostridium carboxidivorans can biologically
ferment producer gas into ethanol, acetic acid, acetone and butanol. Biological
fermentation of gaseous substrates (or syngas fermentation) have several advantages over
chemical catalysis such as higher specificity (Ko et al. 1989), higher yields (Kasteren et
al. 2005; Vega et al. 1988b; Worden et al. 1991), lower energy costs (Heiskanen et al.
2007; Kasteren et al. 2005; Vega et al. 1988b; Worden et al. 1991), flexible CO/ H2/ CO2
ratios (Huber et al. 2006; Kasteren et al. 2005) and higher resistance to producer gas
impurities such as sulfides, tars and other hydrocarbon contaminants (Ahmed 2006;
Ahmed and Lewis 2007; Anonymous 1995; Smith et al. 1991; Vega et al. 1990b).
However, gasification-fermentation technology is still in its development stage and is less
studied than chemical catalysis or hydrolysis-fermentation because of its disadvantages
such as slower solvent productivities (Vega et al. 1988b), low solubilities of gaseous
substrates in the culture medium (Vega et al. 1988b) and necessity for special design
considerations (Barik et al. 1988).

118
Laboratory scale research in producer gas fermentations are usually performed in
serum bottles with producer gas in the headspace that is provided in a fed batch mode.
Bottle reactors are generally pressurized, but have a very slow rate of product formation
due to low gas solubilities and slow mass transfer. Efforts to increase the rate of product
formation has been studied in the past by evaluating environmental conditions like
increasing the rate of agitation (Doremus et al. 1985; Henstra et al. 2007) , partial
pressure of substrates (Doremus et al. 1985; Ko et al. 1989), headspace (Frankman 2009),
pH and heat shock treatments (Gapes et al. 2000; Gapes et al. 1983; Kutzenok and
Aschner 1952).
Heat shock is a practice where the cells are exposed to temperatures above their
tolerance limit for a brief amount of time to induce sporulation and has been a common
practice for culture maintenance for many Clostridial strains such as Clostridium
butylicum (now called Clostridium beijerinkii), Clostridium pasteurianum, Clostridium
acetobutylicum to overcome the strain degeneration phenomena which results in loss of
solvent producing abilities by the microbe (Gapes et al. 2000; Gapes et al. 1983;
Kutzenok and Aschner 1952; Martin et al. 1983; Spivey 1978). In some studies, heat
shock results in sporulation which in turn results in higher solvent production (Jones et al.
1982; Long et al. 1983). Contrary to this, Tracy et al. (2008) found an inverse correlation
with sporulation and solventogenesis in C. acetobutylicum. Besides sporulation, some
reports also suggests the presence of heat shock proteins (hsp74) induced by heat stress
are responsible for increased solvent production (Terracciano et al. 1988). Popoutsakis
(2005) reported that over expression of heat shock proteins (GroESL) resulted in an
increased production and tolerance of butanol in the microbe C. acetobutylicum.
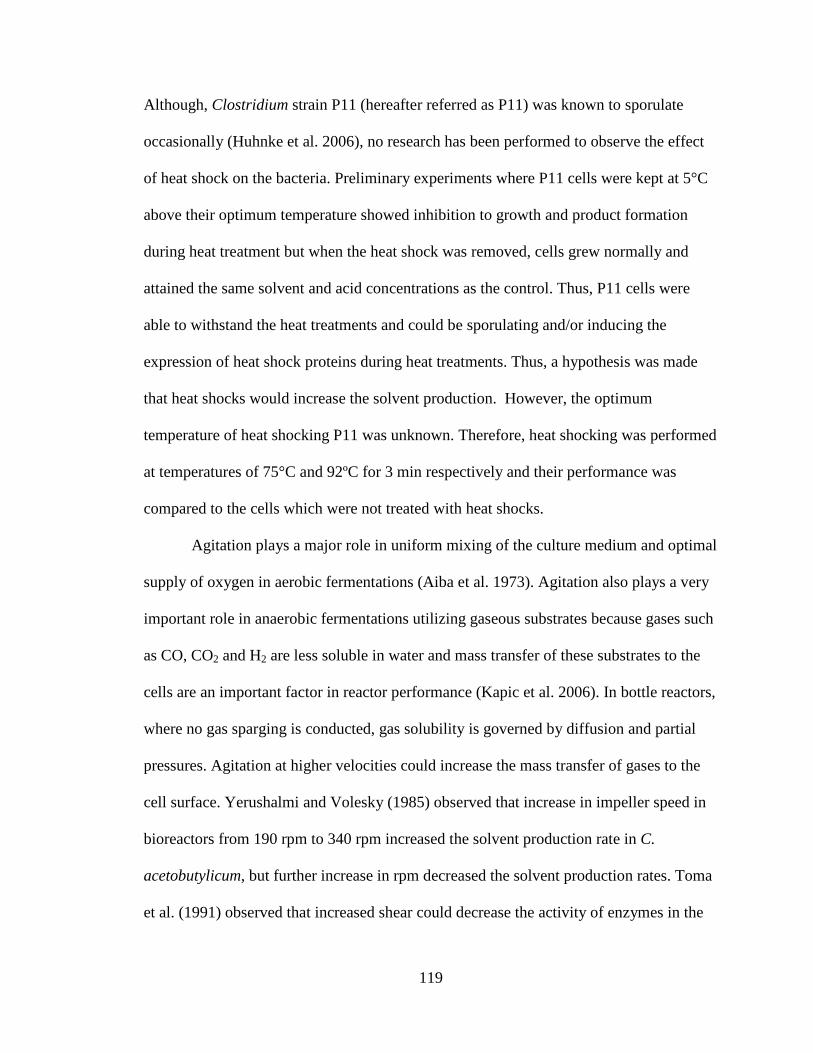
119
Although, Clostridium strain P11 (hereafter referred as P11) was known to sporulate
occasionally (Huhnke et al. 2006), no research has been performed to observe the effect
of heat shock on the bacteria. Preliminary experiments where P11 cells were kept at 5°C
above their optimum temperature showed inhibition to growth and product formation
during heat treatment but when the heat shock was removed, cells grew normally and
attained the same solvent and acid concentrations as the control. Thus, P11 cells were
able to withstand the heat treatments and could be sporulating and/or inducing the
expression of heat shock proteins during heat treatments. Thus, a hypothesis was made
that heat shocks would increase the solvent production. However, the optimum
temperature of heat shocking P11 was unknown. Therefore, heat shocking was performed
at temperatures of 75°C and 92ºC for 3 min respectively and their performance was
compared to the cells which were not treated with heat shocks.
Agitation plays a major role in uniform mixing of the culture medium and optimal
supply of oxygen in aerobic fermentations (Aiba et al. 1973). Agitation also plays a very
important role in anaerobic fermentations utilizing gaseous substrates because gases such
as CO, CO2 and H2 are less soluble in water and mass transfer of these substrates to the
cells are an important factor in reactor performance (Kapic et al. 2006). In bottle reactors,
where no gas sparging is conducted, gas solubility is governed by diffusion and partial
pressures. Agitation at higher velocities could increase the mass transfer of gases to the
cell surface. Yerushalmi and Volesky (1985) observed that increase in impeller speed in
bioreactors from 190 rpm to 340 rpm increased the solvent production rate in C.
acetobutylicum, but further increase in rpm decreased the solvent production rates. Toma
et al. (1991) observed that increased shear could decrease the activity of enzymes in the
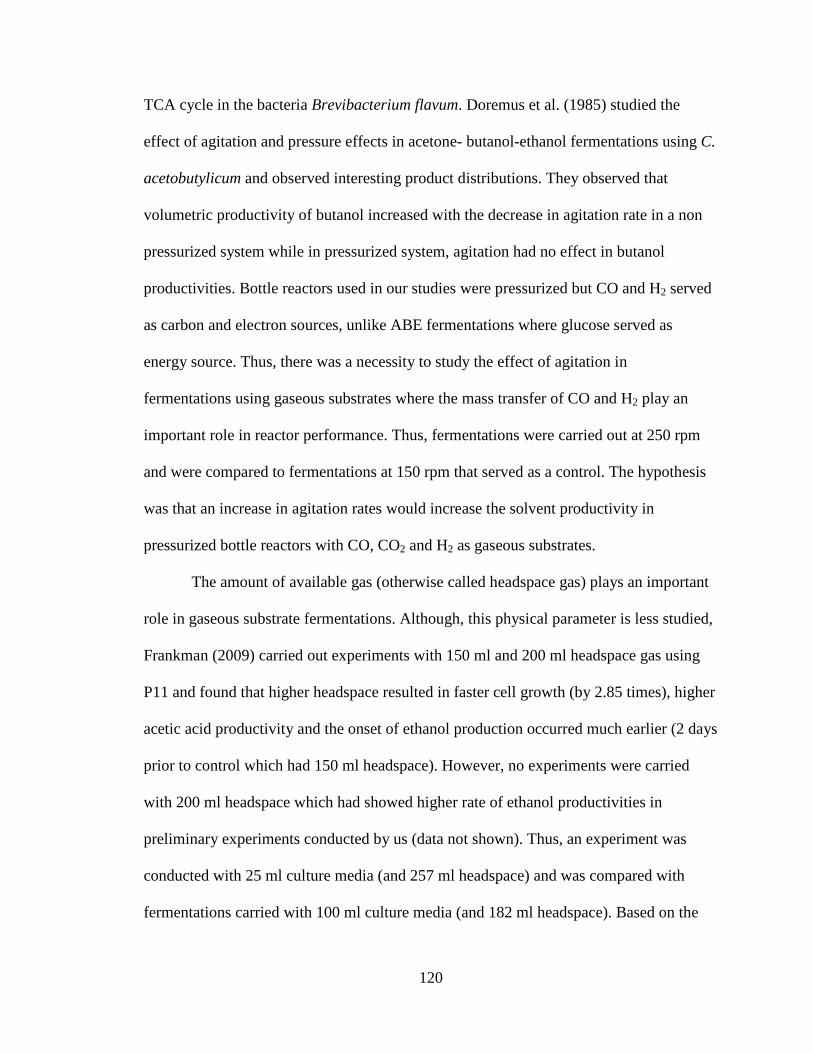
120
TCA cycle in the bacteria Brevibacterium flavum. Doremus et al. (1985) studied the
effect of agitation and pressure effects in acetone- butanol-ethanol fermentations using C.
acetobutylicum and observed interesting product distributions. They observed that
volumetric productivity of butanol increased with the decrease in agitation rate in a non
pressurized system while in pressurized system, agitation had no effect in butanol
productivities. Bottle reactors used in our studies were pressurized but CO and H2 served
as carbon and electron sources, unlike ABE fermentations where glucose served as
energy source. Thus, there was a necessity to study the effect of agitation in
fermentations using gaseous substrates where the mass transfer of CO and H2 play an
important role in reactor performance. Thus, fermentations were carried out at 250 rpm
and were compared to fermentations at 150 rpm that served as a control. The hypothesis
was that an increase in agitation rates would increase the solvent productivity in
pressurized bottle reactors with CO, CO2 and H2 as gaseous substrates.
The amount of available gas (otherwise called headspace gas) plays an important
role in gaseous substrate fermentations. Although, this physical parameter is less studied,
Frankman (2009) carried out experiments with 150 ml and 200 ml headspace gas using
P11 and found that higher headspace resulted in faster cell growth (by 2.85 times), higher
acetic acid productivity and the onset of ethanol production occurred much earlier (2 days
prior to control which had 150 ml headspace). However, no experiments were carried
with 200 ml headspace which had showed higher rate of ethanol productivities in
preliminary experiments conducted by us (data not shown). Thus, an experiment was
conducted with 25 ml culture media (and 257 ml headspace) and was compared with
fermentations carried with 100 ml culture media (and 182 ml headspace). Based on the

121
work performed by Frankman (2009), it was hypothesized that the growth, solvent and
acid productivities would be much higher with increased headspace gases.
The present study investigated the effect of physical parameters such as
temperature shocks, agitation and headspace on producer gas fermentations with a gas
composition of 20% CO, 15% CO2, 5% H2 and 60% N2 in a lab scale using bottle
reactors. Kinetic parameters of producer gas fermentation such as product yields,
percentage of substrate utilized, percentage of theoretical conversion and gas uptake rates
were also calculated for all the studies.
5.2 Materials and methods
5.2.1 Producer gas
Producer gas with a composition of 20% CO, 15% CO2, 5% H2 and 60% N2 was
used for all the experiments and served as energy and electron source for the
fermentations using P11. Cylindrical gas tanks with the specified composition were
purchased from Superior Specialty Gas, Inc (Tulsa, OK). This composition was used
because the fluidized bed reactor at OSU produced similar compositions of gas when
switchgrass was used as a substrate (Datar 2003).
5.2.2 Microbial catalyst and culture medium
P11, a novel acetogenic bacteria, isolated from a duck pond at the University of
Oklahoma was periodically provided by Dr. Ralph Tanner, University of Oklahoma, for
the experiments (Huhnke et al. 2006). A defined culture medium was used to cultivate the
bacteria that provided essential nutrients for its growth and product formation. One liter
of culture media consisted of 30 ml of mineral stock solution (Table 5.1), 10 ml of
vitamin stock solution (Table 5.1), 10 ml of trace metal solution (Table 5.1), 1 g of yeast

122
Components of mineral stock
solution
Amount
(g/l)
Components of trace metal
stock solution
Amount
(g/l)
Components of vitamin stock
solution
Amount
(g/l)
Ammonium chloride 100 Cobalt chloride 0.2 p-(4)-aminobenzoic acid 0.005
Calcium chloride 4 Cupric chloride 0 d-biotin 0.002
Magnesium sulfate 20 Ferrous ammonium sulfate 0.8 Calcium pantothenate 0.005
Potassium chloride 10 Manganese sulfate 1 Folic acid 0.002
Potassium phosphate
monobasic
10 Nickel chloride 0.2 MESNA 0.01
Nitrilotriacetic acid 2 Nicotinic acid 0.005
Sodium molybdate 0.02 Pyridoxine 0.01
Sodium selenate 0.1 Riboflavin 0.005
Sodium tungstate 0.2 Thiamine 0.005
Zinc sulfate 1 Thioctic acid 0.005
Vitamin B12 0.005
Table 5.1 Composition of mineral stock solution, trace metal stock solution and vitamin stock solution

123
extract, 10 g of N-morpholinoethanesulfonic acid (MES) buffer, 10 ml of 4% cysteine
sulfide solution and 1 ml of 0.1% resazurin solution. Mineral solution provides the source
of mineral ions that are crucial as cofactors of various enzymes, membrane transport and
as components of molecules and structural complexes (Cote and Gherna 1994). Trace
metals play an important role in anaerobiosis as most of the metals acts as cofactors to
metalloenzymes (Cote and Gherna 1994; Tanner 1997). Similarly, vitamins also play an
important role in catalytic functions as coenzymes, prosthetic groups (Cote and Gherna
1994). MES is a buffering agent which is used to avoid excessive pH fluctuation during
the fermentation process as external pH controllers were not used. Low redox potentials
are necessary for anaerobic processes (Wiegel et al. 2006) was achieved by the addition
of cysteine sulfide solution. Besides this, cysteine sulfide solution also scavenges any
dissolved oxygen if present in the media. Resazurin solution acted as a redox indicator.
All the chemicals were purchased from Sigma Chemical Company, St. Louis, Missouri
except yeast extract that was purchased from Difco laboratories, Detroit, Michigan.
5.2.3 Preparation of culture medium and batch studies
All the batch fermentation studies were performed in 250 ml serum bottles with
100 ml of culture media (except where another media volume is mentioned). The culture
media was prepared by mixing all its components (mineral stock solution, trace metal
solution, vitamin solution, MES, yeast extract and resazurin) in the appropriate amount of
deionized water in a round bottomed flask. The pH of the culture medium was then
adjusted to 6.1 using 2 N potassium hydroxide solution. The culture media was then
made anaerobic by boiling it in a microwave and then briskly passing nitrogen through
the media. The flask was sealed and taken into an anaerobic glove box (Coy Laboratory

124
Products Inc., Grasslake, MI) where appropriate volume of media was dispensed into
serum bottles which were then sealed prior to removal from the glove box. The bottles
were then sterilized in an autoclave (Primus Sterilizer Co. Inc, Omaha, NE) at 121 ºC for
20 min. After autoclaving, the serum bottles were then brought to room temperature and
1 ml of 4% sterile cysteine sulfide solution per 100 ml of media. The bottles were then
purged with producer gas up to a pressure of 239.25 KPa (or 34.7 psia) and inoculated
with a 10% inoculum (unless otherwise mentioned) from actively growing cultures. The
actively growing cells are obtained by sub-culturing twice. Sub-culturing was carried out
in duplicates. Each stage of sub-culturing is referred as a passage. Inoculum transfer from
one passage to the other was performed when the cells reached mid exponential phase.
The bottle reactor in which the microbes grew faster was chosen for inoculum transfers
into next passage as it was expected to have more healthy cells than the bottle reactor that
grew slower. All inoculum transfers were done from the same reactors, thereby,
minimizing the culture variation from reactor to reactor and from one treatment to
another. The media compositions and the method of culture media preparation remained
the same as the experimental procedure during the subculture stages. After inoculation
the batch reactors were placed in a warm room where the temperature was maintained at
37ºC on an orbital shaker (Innova 2100, New Brunswick Scientific, Edison, NJ) at 150
rpm. Cell concentration, pH, ethanol concentration, acetic acid concentration and
producer gas concentrations were analyzed at regular intervals. The overall sketch of the
three experiments is shown in the next section. Throughout the experiments, producer gas
was fed at every 24 hour intervals.
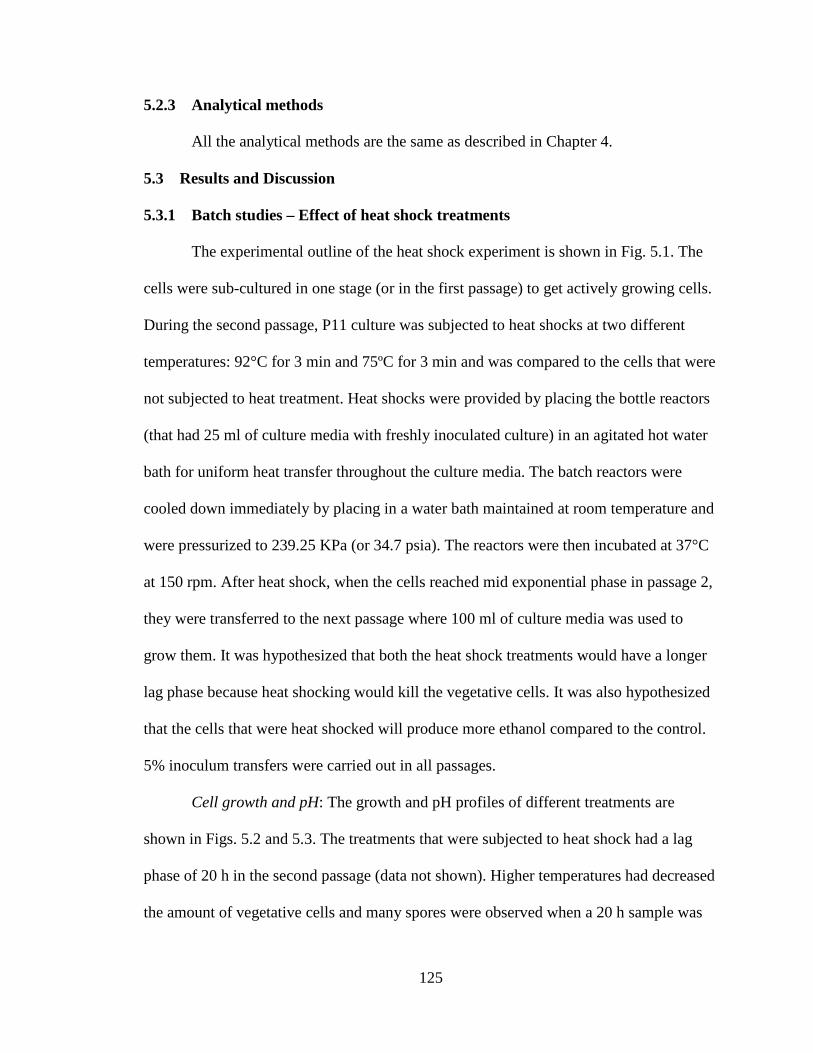
125
5.2.3 Analytical methods
All the analytical methods are the same as described in Chapter 4.
5.3 Results and Discussion
5.3.1 Batch studies – Effect of heat shock treatments
The experimental outline of the heat shock experiment is shown in Fig. 5.1. The
cells were sub-cultured in one stage (or in the first passage) to get actively growing cells.
During the second passage, P11 culture was subjected to heat shocks at two different
temperatures: 92°C for 3 min and 75ºC for 3 min and was compared to the cells that were
not subjected to heat treatment. Heat shocks were provided by placing the bottle reactors
(that had 25 ml of culture media with freshly inoculated culture) in an agitated hot water
bath for uniform heat transfer throughout the culture media. The batch reactors were
cooled down immediately by placing in a water bath maintained at room temperature and
were pressurized to 239.25 KPa (or 34.7 psia). The reactors were then incubated at 37°C
at 150 rpm. After heat shock, when the cells reached mid exponential phase in passage 2,
they were transferred to the next passage where 100 ml of culture media was used to
grow them. It was hypothesized that both the heat shock treatments would have a longer
lag phase because heat shocking would kill the vegetative cells. It was also hypothesized
that the cells that were heat shocked will produce more ethanol compared to the control.
5% inoculum transfers were carried out in all passages.
Cell growth and pH: The growth and pH profiles of different treatments are
shown in Figs. 5.2 and 5.3. The treatments that were subjected to heat shock had a lag
phase of 20 h in the second passage (data not shown). Higher temperatures had decreased
the amount of vegetative cells and many spores were observed when a 20 h sample was
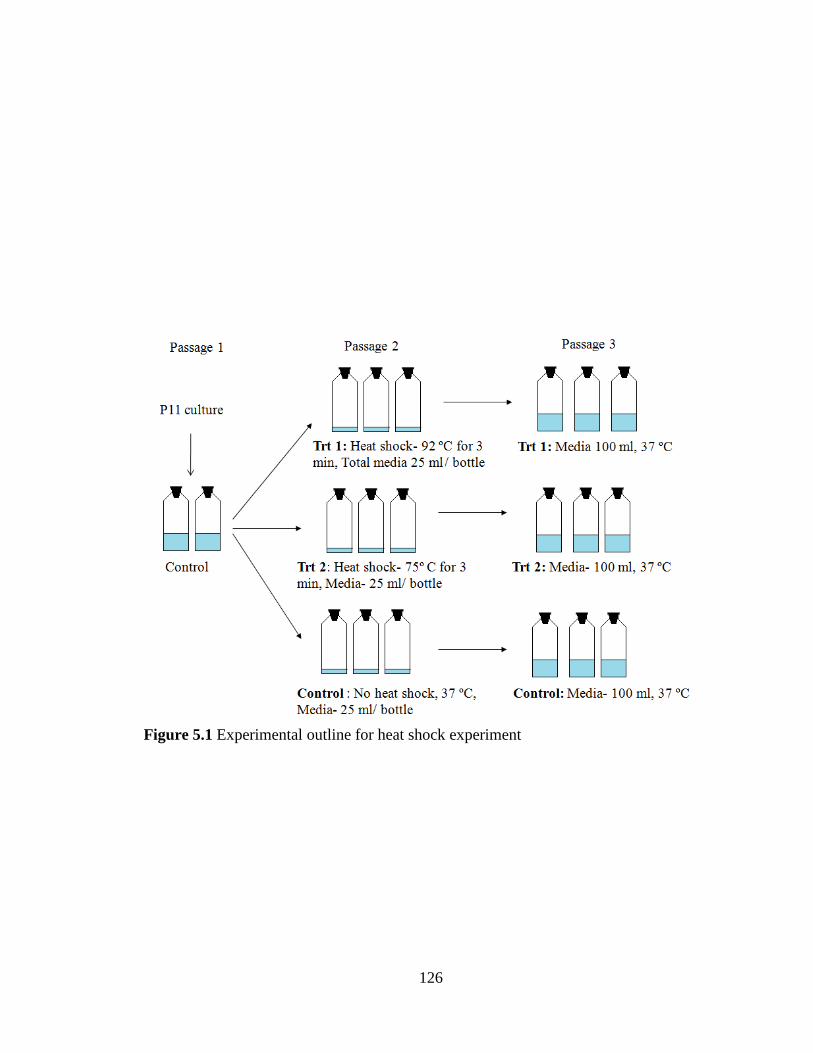
126
Figure 5.1 Experimental outline for heat shock experiment

127
Figure 5.2 Cell growth in different treatments. Each data point is the average of 3
replicates; Error bars represent standard error.
0.00
0.10
0.20
0.30
0.40
0 400 800 1200 1600 2000
Time (Hours)
Cel
l ma
ss c
on
cen
tratio
n (
g/l)
Control 75 C Heat shock 92 C Heat shock

128
Figure 5.3 pH profile in different treatments. Each data point is the average of 3
replicates; Error bars represent standard error.
4.00
4.50
5.00
5.50
6.00
6.50
0 400 800 1200 1600 2000Time (Hours)
pH
Control 75 Heat Shock 92 C Heat Shock

129
taken and spore stained using malachite green using the method described by Gerhardt et
al. (1981). In the third passage, growth of P11 occurred rapidly in the first 200 h followed
by a slight decrease in cell densities. This observation was similar to other fermentations
using P11. There was a secondary cell growth observed in all the treatments after 600 h
(approximately). The secondary growth phase was also associated with production of
acetic acid and uptake of CO and H2. Multi-growth phases similar to our observations
were also observed in C. acetobutylicum (Tracy et al. 2008). The reason for secondary
growth is unknown but it could be possible that the cells need more energy for cellular
metabolism and acetic acid production during this stage produces ATP. The final cell
mass concentrations were the highest for the cells that were treated at 92ºC followed by
75°C and control cells (where the cells were not subjected to any heat treatment). Media
pH dropped rapidly from 6.1 to 4.7 due to acetic acid production (Fig. 5.5). The break
point in the pH profile (an indication of shift in the metabolism from acidogenesis to
solventogenesis) was found to be 25 h earlier with both the heat treatments (190 h) than
compared to the control (215 h). However, the final pH in the different treatments was
almost the same in all the treatments.
Product profiles: Acetic acid (Fig. 5.5) is observed to be growth related as it is
involved with ATP production which is necessary for cellular replication and metabolism
(Henstra et al. 2007; Imkamp and Muller 2007). Ethanol (Fig. 5.4) is a secondary
metabolite in P11 fermentations. Hence, ethanol production starts only after 200 h
(approximately). But, from Fig. 5.4 it can be observed that the rate of ethanol production
was higher with the heat treatments (both 75ºC and 92ºC) than the control. For example,
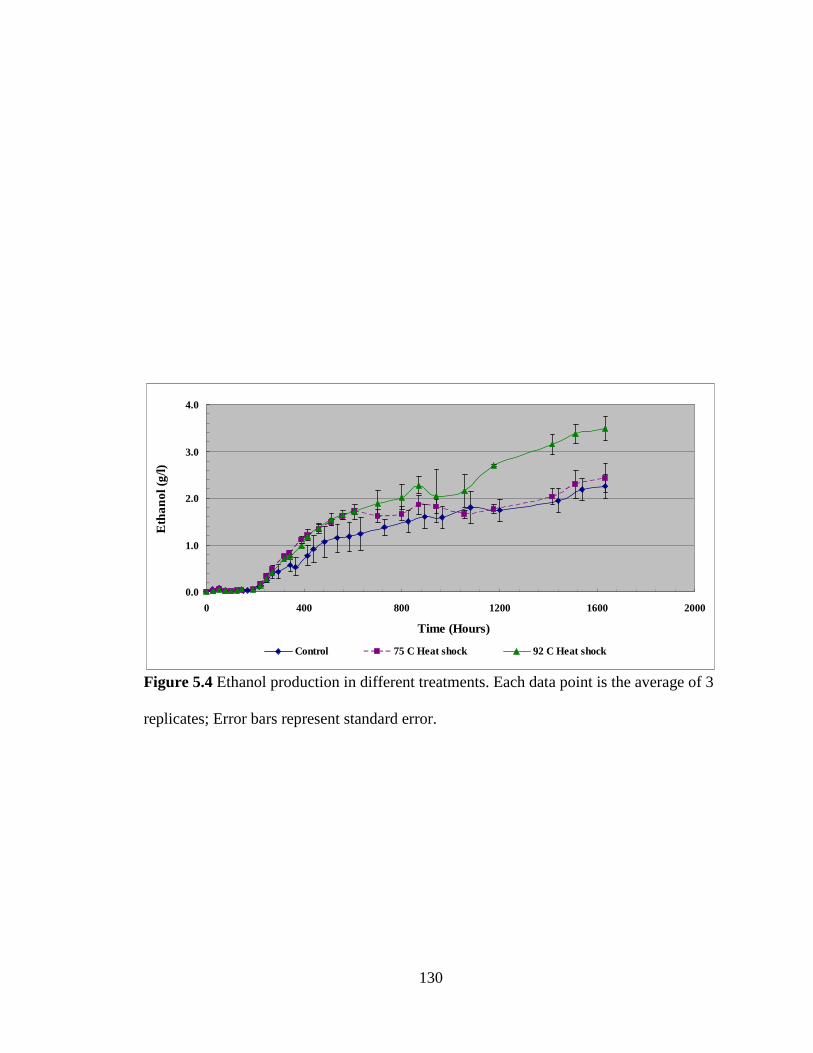
130
Figure 5.4 Ethanol production in different treatments. Each data point is the average of 3
replicates; Error bars represent standard error.
0.0
1.0
2.0
3.0
4.0
0 400 800 1200 1600 2000
Time (Hours)
E
tha
nol
(g/
l)
Control 75 C Heat shock 92 C Heat shock
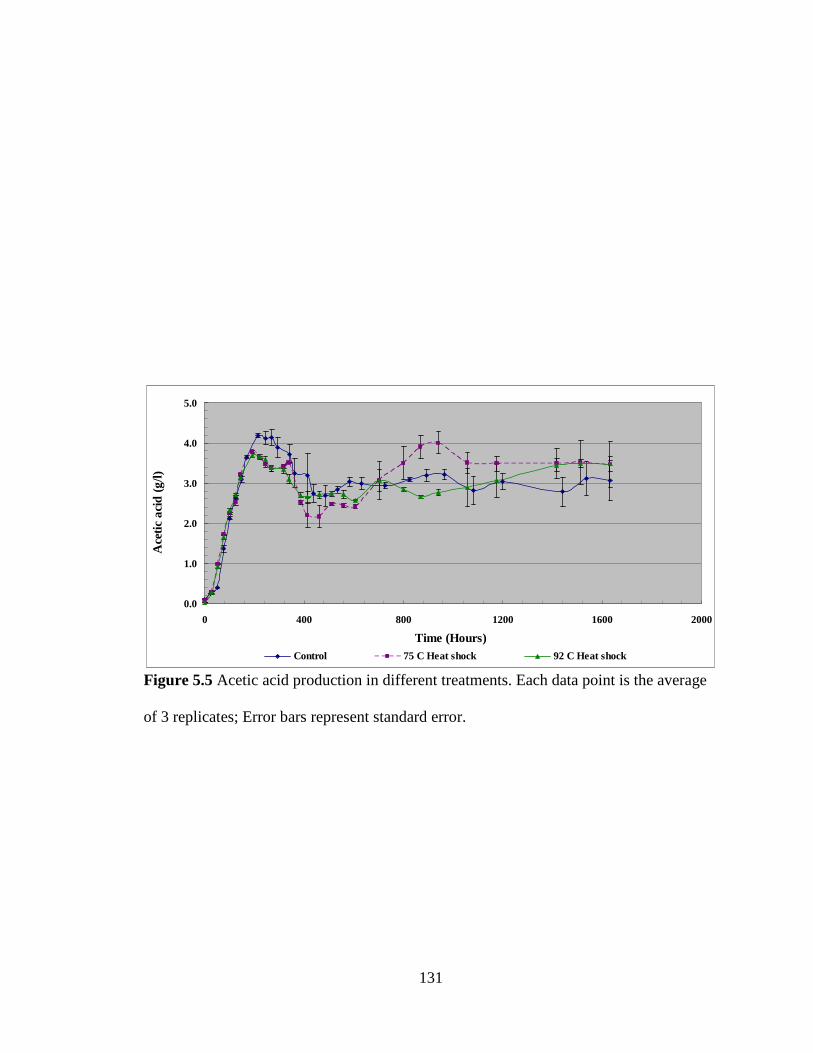
131
Figure 5.5 Acetic acid production in different treatments. Each data point is the average
of 3 replicates; Error bars represent standard error.
0.0
1.0
2.0
3.0
4.0
5.0
0 400 800 1200 1600 2000
Time (Hours)
Ace
tic a
cid
(g
/l)
Control 75 C Heat shock 92 C Heat shock
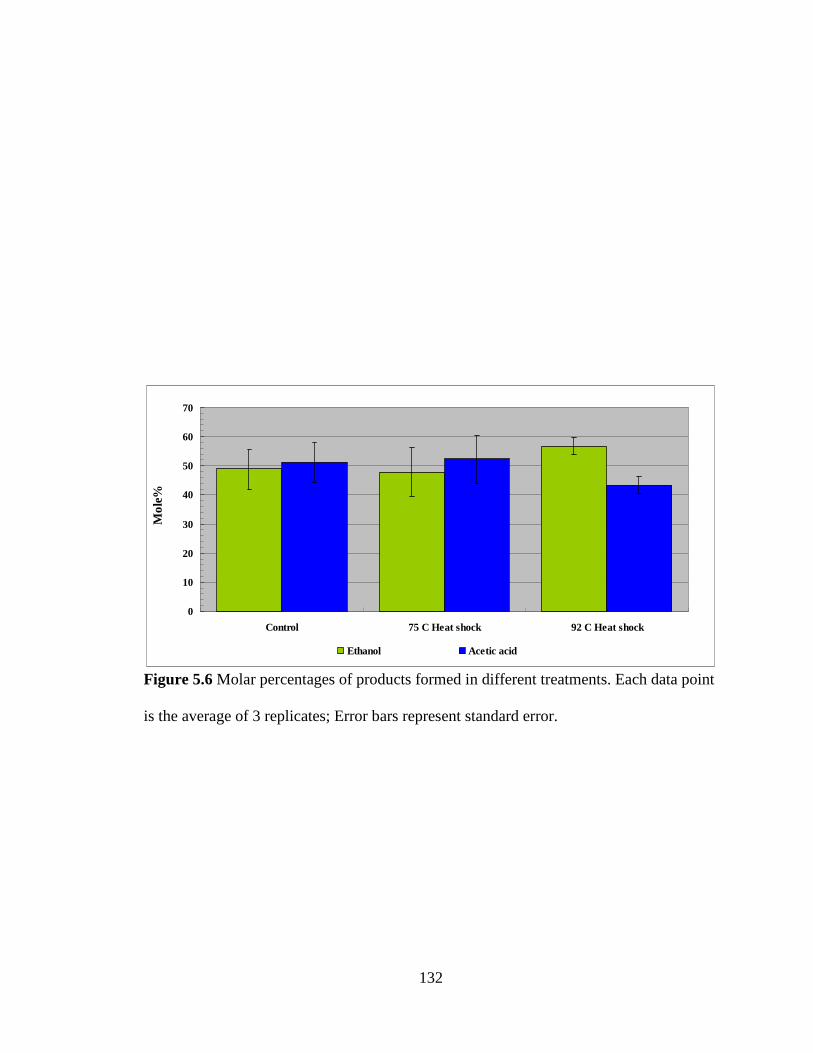
132
Figure 5.6 Molar percentages of products formed in different treatments. Each data point
is the average of 3 replicates; Error bars represent standard error.
0
10
20
30
40
50
60
70
Control 75 C Heat shock 92 C Heat shock
Mo
le%
Ethanol Acetic acid

133
at the end of 600 h, ethanol concentrations in both the heat treatments was 1.7 g/l,
whereas, the control had only 1.2 g/l of ethanol. After 600 h, the cells that were treated at
75ºC entered a secondary growth phase and produced acetic acid and hence the rate of
ethanol production decreased, thus, the control and 75°C heat shock treatment had similar
concentrations of ethanol at the end of fermentation. Cells exposed to 92ºC produced
55% more ethanol than the control (3.5 g/l in the 92ºC heat shock treatment compared to
2.3 g/l in control and 2.4 g/l in 75ºC shocks) at the end of fermentation. In the same way,
the cells that were exposed to 92°C and 75°C shock produced the highest acetic acid
concentrations (3.5 g/l) compared to control that produced only 3.1 g/l of acetic acid.
Higher ethanol and acetic acid production observed with the 92°C heat treatment could
be due to an up-regulation of enzymatic activities which has to be tested.
The acetic acid concentrations decreased after the first 200 h (growth phase) in all
the treatments, meaning the acetic acid could have been possibly converted into ethanol.
The molar distribution of products (Fig. 5.6) remained the same in the control and 75°C
heat shock (with approximately 48% ethanol and 52% acetic acid) but the 92ºC heat
shock treatment had 57% ethanol and 43% acetic acid. The ethanol to acetate ratio
(molar basis) for 92°C heat shock was 1.0 compared to 0.7 with control and 75ºC heat
shock. Higher ethanol concentrations in the 92ºC heat shock treatment could be a result
of sporulation (Jones et al. 1982; Long et al. 1983) and/or the increased expression of
heat shock proteins (Papoutsakis 2005; Terracciano et al. 1988).
Gas consumption and kinetic parameters: The consumption of gaseous substrates
CO, H2 and CO2 are shown in Figs. 5.7, 5.8 and 5.9, respectively. Rapid consumption of
CO and H2 and production of CO2 were observed during growth phase, which could be a

134
Figure 5.7 CO consumption profile in different treatments. Each data point is the average
of 2 replicates; Error bars represent standard error.
0
20
40
60
80
0 400 800 1200 1600 2000
Time (Hours)
CO
co
nsu
mpt
ion
(mM
)
Control 75 C Shock 92 C Shock

135
Figure 5.8 H2 consumption profile in different treatments. Each data point is the average
of 2 replicates; Error bars represent standard error.
0
2
4
6
8
10
0 400 800 1200 1600 2000
Time (Hours)
H2
cons
umpt
ion
(mM
)
Control 75 C Heat shock 92 C Heat shock
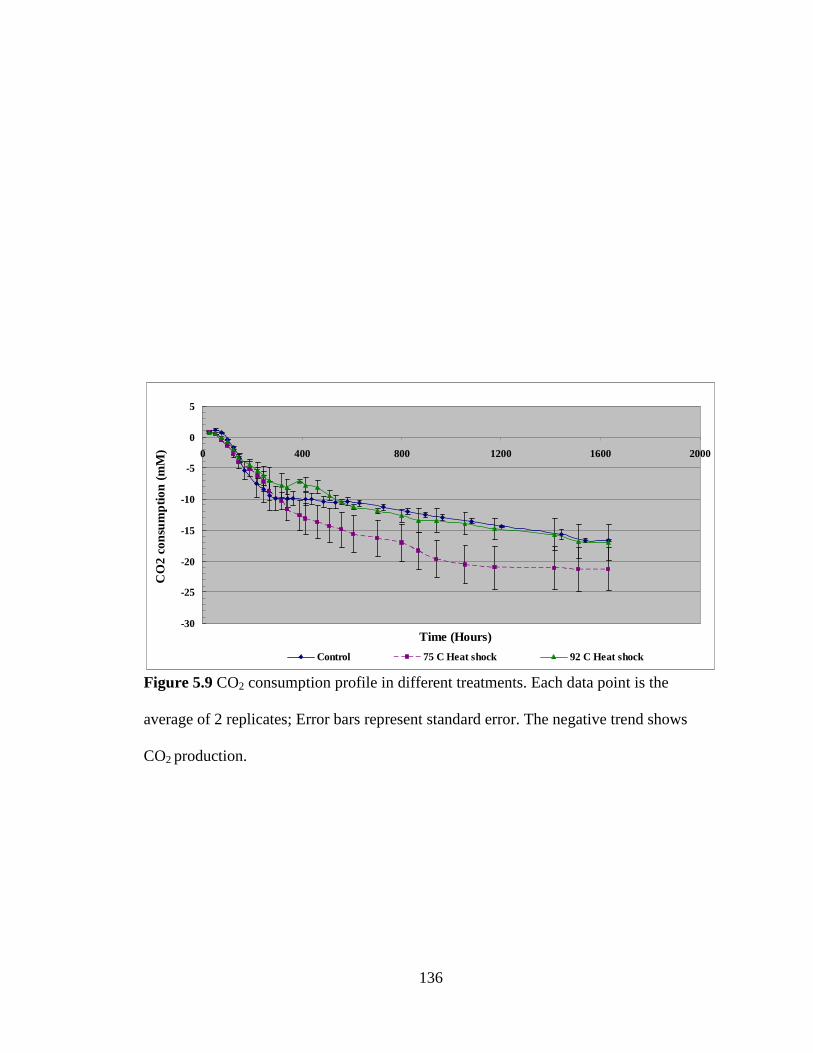
136
Figure 5.9 CO2 consumption profile in different treatments. Each data point is the
average of 2 replicates; Error bars represent standard error. The negative trend shows
CO2 production.
-30
-25
-20
-15
-10
-5
0
5
0 400 800 1200 1600 2000
Time (Hours)
CO
2 c
onsu
mp
tion
(m
M)
Control 75 C Heat shock 92 C Heat shock
137
result of reactions 5.1, 5.2 and 5.3. CO can act as a carbon and electron source while H2
serves as an electron source only. Thus, P11 shows preference to CO when a mixture of
CO and CO2 is provided like other acetogens such as P. productus (Vega et al. 1988a)
and C. carboxidivorans (Shenkman 2003). The consumption of CO and H2 slowed down
during the stationary phase when ethanol was being produced. In all the treatments,
decrease in acetic acid was observed, which could be a result of reduction of acetic acid
into ethanol as shown in reaction 5.5.
2CO + 4H2 → C2H5OH + H2O (5.1)
CO + H2O → CO2 + H2 (5.2)
3CO + 3H2 → C2H5OH + CO2 (5.3)
2CO + 2H2 → CH3COOH (5.4)
CH3COOH + 2 H2 → C2H5OH + H2O (5.5)
5CO + 7H2 → 2C2H5OH + CO2 + H2O (Overall reaction) (5.6)
CO and H2 consumption (in moles) was the highest in the 92°C heat shock,
treatment followed by 75ºC heat shock and control. This also resulted in higher CO and
H2 utilization and higher molar yields of ethanol (YETOH/CO) with the 92°C heat treatment
(Table 5.2). From reaction 5.3, 1 mole of ethanol is produced from 3 moles of carbon in
CO, thus making the theoretical maximum of ethanol from CO as 0.333 moles of ethanol/
mole of CO. Based on these calculations, the % theoretical conversion of ethanol from
CO (Actual YETOH/CO / Theoretical YETOH/CO) were calculated and found to be higher for
the treatment with 92ºC heat shock treatment (Table 5.2). Also, the specific ethanol
formation rate expressed in millimoles of ethanol produced per hour per gram of cells
was found to be higher with 92ºC heat shock treatment (Table 5.2).

138
Kinetic parameter Control 75 °C shock 92 ºC shock
% CO utilized 45.96% 52.55% 58.49%
% H2 utilized 22.98% 28.72% 30.36%
Yield (ETOH/CO) YETOH/CO (moles of ethanol/mole of CO) 0.062 0.063 0.079
Yield (AA/CO) YAA/CO (moles of acetic acid/mole of CO) 0.087 0.085 0.076
% Theoretical conversion (Actual YETOH/CO / Theoretical YETOH/CO) 18.57% 20.30% 25.15%
% Theoretical conversion (Actual YAA/CO / Theoretical YAA/CO) 17.34% 17.09% 15.24%
Specific CO uptake rate (mM CO/ hr/ g cells) 2.61 2.58 2.27
Specific H2 uptake rate (mM H2/ hr/ g cells) 0.33 0.35 0.29
Specific CO uptake rate (mM CO/ hr/ g cells) (First 510 hours) 4.39 5.29 4.71
Specific H2 uptake rate (mM H2/ hr/ g cells) (First 510 hours) 0.68 0.77 0.72
Specific ethanol formation rate (mM ethanol/ hr/ g cells) 0.183 0.179 0.197
Table 5.2 Kinetic parameters of P11 fermentation during heat shock experiment.

139
Ethanol production continued even after H2 consumption ceased after 1400 h
(approximately) in all the treatments. Possibly, CO could be acting as electron source for
the reduction reactions involved in ethanol formation (Ahmed and Lewis 2007). CO2
production was almost the same in 92ºC heat shock treatment and control but higher in
75ºC heat shock treatment. This could be due to the abrupt secondary growth that was
observed in 75ºC heat shock treatment after 600 h (approximately).
Final concentrations of acetic acid in the fermentation media were similar in all
the experimental conditions, but the yield of acetic acid (YAA/CO) was lower in the 92 °C
heat shock treatment as the CO consumed were higher (Table 5.2). Also, since the final
cell mass concentration was higher in the 92°C heat than the 75°C shock treatment and
the control that resulted in lower overall CO and H2 utilization rates (Table 5.2). But,
when closely seen in the CO and H2 consumption curves, most of the gas consumption
occurred in the first 500 h of fermentation. Thus, when the gas utilization rates were
calculated for the first 500 h, the 92ºC heat shock treatment higher CO and H2 utilization
rates than the control (Table 5.2).
To summarize, both the heat shock treatments were found to increase the
percentage of gas utilization of CO and H2, but the 92°C heat shock treatment produced
the highest ethanol. Gapes et al. (2000) showed 95ºC heat shocks for 2.5 min gave the
highest butanol to acetone yield with C. beijerinkii B592. Although, the morphological
effect during the fermentation were not observed by Gapes et al. (2000), Jones at al.
(1982) had found that the sporulation was related to solventogenesis. Later, Rogers et al.
(2006) showed that solventogenesis and sporulation were activated by a common
regulatory elements in the microbes C. acetobutylicum and C. beijerinckii. Besides

140
sporulation, some research also suggests the induction of heat shock proteins (hsp74)
during heat stress that were responsible for solvent production (Terracciano et al. 1988).
Popoutsakis (2005) reported that over expression of heat shock proteins (GroESL)
resulted in an increase in production and tolerance of butanol in the microbe C.
acetobutylicum. Although, our study did not look into the morphological alterations of
P11 during fermentation, we did confirm that a 20 h sample after heat shocking had
spores. Further investigation of the cause of metabolic shifts in the 92ºC heat shock
treatment is necessary. This research has shown that the solvent yields and gas uptake
rates could be increased by heat shocking P11 cells during the subculture stages at 92°C
for 3 min.
5.3.2 Batch studies - Effect of increased agitation speed
The overall experimental outline is shown in Fig. 5.10. P11 cells were sub-
cultured in duplicate before transferring to the third passage where the fermentation
kinetics is compared between two different agitation speeds: 250 rpm and 150 rpm
(control). Both the treatments were done in duplicate. As agitation is one of the important
factors in the mass transfer of gaseous substrates in the culture media (Kapic et al. 2006;
Riet and Tramper 1991; Yerushalmi and Volesky 1985), it was hypothesized that
producer gas fermentation at 250 rpm would increase the solvent productivity in
comparison to the fermentation at 150 rpm (control).
Growth and pH: The growth and pH profiles of different treatments are shown in
Figs. 5.11 and 5.12, respectively. A small lag phase of 19 h was initially observed, which
was followed by rapid cell growth in both the treatments. P11 culture at 250 rpm reached
maximum cell concentration (0.47 g/l) 73 h earlier than the cells that were at 150 rpm.

141
Figure 5.10 Experimental outline of agitation speed experiment.

142
Figure 5.11 Cell growth in different treatments. Each data point is the average of 2
replicates; Error bars represent standard error.
0.00
0.10
0.20
0.30
0.40
0.50
0.60
0 100 200 300 400 500 600
Time (hours)
Cel
l ma
ss c
onc
entra
tion
(g/l)
150 rpm 250 rpm

143
Figure 5.12 pH in different treatments. Each data point is the average of 2 replicates;
Error bars represent standard error.
4.0
4.5
5.0
5.5
6.0
6.5
0 100 200 300 400 500 600Time (hours)
pH
150 rpm 250 rpm

144
There was a decline in cell mass after P11 culture reached maximum cell mass
concentration at 250 rpm, but the control (cells at 150 rpm) was constant after the
maximum was reached. Media pH dropped rapidly from 6.1 to 5 in both the treatments,
with the control, a further decrease of pH from 5 to 4.70 occurred.
Product profiles: Acetic acid and ethanol were the products formed during the
producer gas fermentation using P11. Acetic acid (Fig. 5.14) was found to be a growth
related product and ethanol (Fig. 5.13) to be a non-growth associated product. Both
products’ (ethanol and acetic acid) concentrations were higher with cells that were
agitated at 150 rpm than 250 rpm. Ethanol production initiated 25 h earlier with the cells
agitated at 250 rpm compared to control, but ethanol production stopped abruptly after
240 h (approximately). The cause of the early initiation of ethanol could be due to the
early cessation of acetic acid formation (at 165 h) when the cells were agitated at 250 pm
while the control reached maximum acetic acid concentration at 240 h. Ethanol
concentration decreased by 50% when P11 cells were agitated at 250 rpm as compared to
150 rpm (1.8 g/l at 150 rpm and 0.9 g/l at 250 rpm of ethanol were obtained). Similarly,
the maximum acetic acid concentrations were 52% lower when cells were agitated at 250
rpm (4.2 g/l at 150 rpm and 2 g/l at 250 rpm). In the 150 rpm treatment, the acetic acid
concentration gradually decreased from 4.2 g/l to 2.7 g/l towards the end of fermentation.
This could have resulted in ethanol production by the reduction of acetic acid. Similar
observations of decreasing acetic acid concentrations were observed with other
fermentations (Chapter 4). Lower concentrations of acetic acid and ethanol at 250 rpm
indicate that higher agitations could be detrimental to the product formation. The
cessation in ethanol formation after 250 h with complete cessation of CO and H2 uptake

145
Figure 5.13 Ethanol concentrations in different treatments. Each data point is the average
of 2 replicates; Error bars represent standard error.
0.00
0.50
1.00
1.50
2.00
2.50
3.00
0 100 200 300 400 500 600
Time (Hours)
Eth
anol
(g
/l)
150 rpm 250 rpm

146
Figure 5.14 Acetic acid concentrations in different treatments. Each data point is the
average of 2 replicates; Error bars represent standard error.
0.0
1.0
2.0
3.0
4.0
5.0
6.0
0 100 200 300 400 500 600
Time (Hours)
Ace
tic a
cid
(g
/l)
150 rpm 250 rpm

147
(results described in next section) could be possibly due to the shear sensitivity of P11
cells to higher agitation rates. Toma et al. (1991) observed that the activity of enzymes
involved in the TCA cycle decreased due to the increase in agitation rates in the microbe
B. flavum. Enzymes such as CODH and hydrogenase involved in the acetyl-CoA pathway
could be affected due to the shear.
Gas consumption and kinetic parameters: CO and H2 are the major sources of
energy and electrons in producer gas fermentation using P11. Rapid consumption of CO
and H2 (Figs. 5.15 and 5.16) occurred during the growth phase of P11 in both the
treatments. Besides ethanol and acetic acid, CO2 (Fig. 5.17) was a product of producer
gas fermentations. Lower ethanol and acetic acid concentrations were due to the
inhibition in CO and H2 uptake and CO2 production after 250 h (approximately). No
signs of metabolism was shown by the cells agitated at 250 rpm (after 250 h) leading to a
conclusion that P11 cells could be shear sensitivity of to higher agitation rates. This
resulted in lower percentage utilization of CO and H2, lower CO and H2 uptake rates,
lower specific ethanol formation rate and lower molar yields of ethanol (YETOH/CO) when
P11 cells were agitated at 250 rpm (Table 5.3). The kinetic parameters obtained at 150
rpm (control) were similar to the previous experiment. The molar ratio of ethanol to
acetic acid at 150 rpm was 0.8 while at 250 rpm was 0.6 clearly indicating the failure to
produce reduced end products such as ethanol.
Our hypothesis that higher agitation rates would increase the product
concentrations was disproved. P11 cells obtained similar cell mass concentrations in both
conditions in the first 200 h, but after 250 h the CO and H2 consumption and ethanol
production completely stopped indicating the possibility of cells shear sensitivity. Our

148
Figure 5.15 CO consumption profile in different treatments. Each data point is the
average of 2 replicates; Error bars represent standard error.
0
10
20
30
40
0 100 200 300 400 500 600
Time (Hours)
CO
co
nsu
mp
tion
(m
M)
150 rpm 250 rpm

149
Figure 5.16 H2 consumption profile in different treatments. Each data point is the average
of 2 replicates; Error bars represent standard error.
0
2
4
6
8
10
0 100 200 300 400 500 600
Time (Hours)
H2
co
nsu
mp
tion
(m
M)
150 rpm 250 rpm

150
Figure 5.17 CO2 consumption in different treatments. Each data point is the average of 2
replicates; Error bars represent standard error. The negative trend shows CO2 production.
-25.00
-20.00
-15.00
-10.00
-5.00
0.00
5.00
0 100 200 300 400 500 600
Time (Hours)
CO
2 co
nsum
ptio
n (m
M)
150 rpm 250 rpm

151
observations are similar to Yerushalmi and Volesky (1985) that noted a decrease in the
formation of solvents and gases without affecting the cell mass concentrations of C.
acetobutylicum when the rpm was increased above 340 rpm. Further research has to be
performed at agitation rates between 150 rpm and 250 rpm in order to confirm if there is
any negative correlation between agitation rates and product profiles. Our research
supports the results reported by Doremus et al. (1985) that agitation had no effect in
butanol productivities in a pressurized system with C. acetobutylicum. The agitation
effect on non-pressurized systems like bioreactors is believed to behave differently than
bottle studies and will need further investigation with agitation rates. Although, it is
believed that there could be advantages with increasing agitation rates in bioreactors up
to a particular limit, as reported by Yerushalmi and Volesky (1985), important
considerations like shear sensitivity will have to be taken into account during
optimization of agitation rates.
5.3.3 Batch studies - Effect of increased headspace
The experimental outline of the headspace optimization experiment is shown in
Fig. 5.18. The headspace was increased by decreasing the volume of culture media from
100 ml in the control to 25 ml in the treatment with increased headspace. The cells were
sub-cultured in two passages with an increased headspace before inoculating the cells
into the experimental stage. 5% inoculum transfers were made in all passages. In the third
passage, the performance of increased headspace (256.5 ml) was compared to normal
headspace (178 ml) with respect to product concentrations, product yields, solvent
productivities, producer gas uptake rates and ethanol formation rates. Due to lesser
culture volume with increased headspace, liquid samples were withdrawn once every 72

152
Kinetic parameter 150 rpm 250 rpm
% CO utilized 47.40% 26.78%
% H2 utilized 43.74% 26.25%
Yield (ETOH/CO) YETOH/CO (moles of ethanol/mole of CO) 0.123 0.116
Yield (AA/CO) YAA/CO (moles of acetic acid/mole of CO) 0.174 0.227
% Theoretical conversion (Actual YETOH/CO / Theoretical YETOH/CO) 36.94% 34.76%
% Theoretical conversion (Actual YAA/CO / Theoretical YAA/CO) 34.74% 45.41%
Specific CO uptake rate (mM CO/ hr/ g cells) 1.33 0.95
Specific H2 uptake rate (mM H2/ hr/ g cells) 0.34 0.26
Specific ethanol formation rate (mM ethanol/ hr/ g cells) 0.245 0.153
Table 5.3 Kinetic parameters of producer gas fermentations using P11 during agitation experiments.

153
Figure 5.18 Experimental outline of headspace experiments
154
h but gas analysis and replacement of headspace gases was performed every 24 h. The
experiment was conducted in triplicate with the control, but in duplicate (because of
space limitation in the orbital shakers) with higher headspace. Experiment was stopped at
965 h because the product profiles with the increased headspace showed no signs of
metabolic activity. From the observations by Frankman (2009), it was hypothesized that
greater headspace would give higher cell growth and increased yields and productivities
of ethanol.
Growth and pH: Cell mass concentrations and pH profiles are shown in Figs. 5.19
and 5.20, respectively. A 50 h lag phase in cell growth was observed in the treatment
with regular headspace whereas rapid growth was observed with increased headspace.
Maximum cell mass concentrations were 150% more with the increased headspace
treatment with the regular headspace treatment. Increasing cell mass concentrations has
been shown to increase reaction rates (Qureshi et al. 2005), which is crucial for producer
gas fermentations. This could possibly be due to the presence of more gaseous substrates
available with increased headspace.
Rapid decrease in pH was observed due to acetic acid production during the
growth phase. With increased headspace, minimum pH was 4.6 while with normal
headspace the minimum pH was 4.7. A slight increase in pH during solventogenesis was
observed during solventogenic phase that could be due to acetic acid conversion into
ethanol.
Product profiles: Ethanol and acetic acid production profiles are shown in Figs.
5.21 and 5.22, respectively. As previously observed acetic acid was a growth related
product but unlike other fermentations ethanol was found to be a growth related product.

155
Figure 5.19 Cell growth in different treatments. Data points in control are the average of
3 replicates while the increased headspace is an average of 2 replicates; Error bars
represent standard error.
0.00
0.20
0.40
0.60
0.80
0 200 400 600 800 1000 1200Time (Hours)
Cel
l mas
s co
nce
ntra
tion
(g/
l)
Regular headspace (Control) Increased headspace

156
Figure 5.20 pH in different treatments. Data points in control are the average of 3
replicates while the increased headspace is an average of 2 replicates; Error bars
represent standard error.
4.00
4.50
5.00
5.50
6.00
6.50
0 200 400 600 800 1000 1200
Time (Hours)
pH
Regular headspace (Control) Increased headspace

157
Figure 5.21 Ethanol production in different treatments. Data points in control are the
average of 3 replicates while the increased headspace is an average of 2 replicates; Error
bars represent standard error.
0.0
1.0
2.0
3.0
4.0
5.0
0 200 400 600 800 1000 1200
Time (Hours)
Eth
ano
l (g
/l)
Regular headspace (Control) Increased headspace

158
Figure 5.22 Acetic acid production in different treatments. Data points in control are the
average of 3 replicates while the increased headspace is an average of 2 replicates; Error
bars represent standard error.
0.0
1.0
2.0
3.0
4.0
5.0
0 200 400 600 800 1000 1200Time (Hours)
Ace
tic a
cid
(g
/l)
Regular headspace (Control) Increased headspace

159
Figure 5.23 Molar percentages of products formed in different treatments. Data points in
control are the average of 3 replicates while the increased headspace is an average of 2
replicates; Error bars represent standard error.
0
10
20
30
40
50
60
70
Regular headspace (Control) Increased headspace
Mo
le %
Ethanol Acetic acid

160
Formation of ethanol from CO and H2 is thermodynamically favorable (Reaction 3.12 in
chapter 3) and it is believed that proper environmental conditions would promote a
growth related ethanol formation. With increased headspace a growth related ethanol was
formed which could be due to the higher availability of gaseous substrates for ethanol
formation. Rapid ethanol production was observed in the first 150 h followed by a pause
in the production of ethanol for the next 140 h. Following this pause, ethanol production
increased again as a non-growth related product. Ethanol production with the regular
headspace started after 200 h and thus was a non-growth product. With increased
headspace, 181% higher ethanol could be produced when compared to the control (4.5 g/l
of ethanol was produced with increased headspace compared to 1.6 g/l with regular
headspace). Solvent productivity was 865% higher with increased headspace, or in other
words, it took 100 h to produce 1.6 g/l of ethanol with cells having more headspace while
the same concentrations was produced in 965 h with the normal headspace.
Acetic acid concentrations increased rapidly with the growth of P11 cells in both
treatments. Although, acetic acid concentrations were similar in both treatments it is
important to note that only 6.3 g of acetic acid/ g cells was produced with the increased
headspace compared to 14.7 g of acetic acid/ g cells with the regular headspace. Thus,
lesser acetic acid per gram of cells was obtained using increased headspace which is
important in our fermentations as far as product specificity is concerned. The acetic acid
concentrations decreased slightly after they reached maximum concentrations at the end
of growth phase, possibly due to the conversion of acetic acid into ethanol.
The ethanol to acetate molar ratio was 1.42 with increased headspace and 0.65
with the normal headspace. Thus, this research has shown that the molar percentages of

161
products (Fig. 5.23) can be altered using the amount of headspace in the bottle reactors
that could be due to the increased availability of gaseous substrates for product formation.
This is in accordance with Le Chatelier’s principle which states that if equilibrium of a
reaction is disturbed by changing the reaction conditions such as concentrations of the
reactants, pressure and temperature, the position of the reaction moves to counteract the
change (Myers 2003). In other words, if the concentrations of the reactants are increased,
the rate of forward reactions will to also increase to form more products.
Gas consumption and kinetic parameters: The consumption of gaseous substrates
such as CO, H2 and CO2 are shown in Figs. 5.24, 5.25 and 5.26, respectively. With a
greater cell concentration with increased headspace, the CO and H2 consumption and
CO2 production was higher than the cells that were grown with normal headspace.
Presence of more gaseous substrates for the microbes by increasing the headspace
resulted in increased gas uptake rates and higher ethanol formation rates (Table 5.4).
However, after the growth phase, CO consumption decreased drastically, but marginal
CO2 consumption was observed with the treatment that had increased headspace. CO2
consumption in the presence of CO could have occurred due to the necessity of a carbon
source in the absence of CO consumption. Due to the decreased CO uptake during the
stationary phase, the CO supplied remained unconsumed, which decreased the percentage
of CO utilized. Further, since the volume of culture media was four times lesser than the
control, the number of moles of ethanol was that was formed in the media was low,
which decreased the yields and percent theoretical conversions drastically (Table 5.4).
The increased availability of gaseous substrates such as CO, CO2 and H2 due to
the increased headspace, with higher cell yields would have contributed to presence of

162
Figure 5.24 CO consumption in different treatments. Data points in control are the
average of 2 replicates while the increased headspace did not have any replicates for gas
analysis; Error bars represent standard error.
0
10
20
30
40
50
60
0 200 400 600 800 1000 1200
Time (Hours)
CO
con
sum
ptio
n (
mM
)
Regular headspace (Control) Increased headspace

163
Figure 5.25 H2 consumption in different treatments. Data points in control are the
average of 2 replicates while the increased headspace did not have any replicates for gas
analysis; Error bars represent standard error.
0
2
4
6
8
10
0 200 400 600 800 1000 1200
Time (Hours)
H2
co
nsum
ptio
n (
mM
)
Regular headspace (Control) Increased headspace

164
Figure 5.26 CO2 consumption in different treatments. Data points in control are the
average of 2 replicates while the increased headspace did not have any replicates for gas
analysis; Error bars represent standard error.
-20
-15
-10
-5
0
5
0 200 400 600 800 1000 1200
Time (Hours)
CO
2 co
nsu
mp
tion
(m
M)
Regular headspace (Control) Increased headspace

165
Kinetic parameter Regular headspace Increased headspace
% CO utilized 45.96% 33.98%
% H2 utilized 22.98% 25.24%
Yield (ETOH/CO) YETOH/CO (moles of ethanol/mole of CO) 0.062 0.031
Yield (AA/CO) YAA/CO (moles of acetic acid/mole of CO) 0.111 0.029
% Theoretical conversion (Actual YETOH/CO / Theoretical YETOH/CO) 17.49% 9.17%
% Theoretical conversion (Actual YAA/CO / Theoretical YAA/CO) 22.11% 4.18%
Specific CO uptake rate (mM CO/ hr/ g cells) 4.78 7.22
Specific H2 uptake rate (mM H2/ hr/ g cells) 0.33 1.35
Specific ethanol formation rate (mM ethanol/ hr/ g cells) 0.207 0.600
Table 5.4 Kinetic parameters of producer gas fermentation using P11 during headspace experiments.
166
more reactants for the product formation in accordance to Le-Chatelier’s principle.
Frankman (2009) found that there was no change in mass transfer rates between serum
bottles with 100 ml media and 50 ml media. Although, we employed 25 ml of media,
further research is needed to confirm this assumption mass transfer benefit with the
increase in headspace. The hypothesis of increased growth, ethanol productivities and
higher ethanol concentrations resulting from increased headspace was successfully
demonstrated.
5.4 Conclusion
This research has found the effect of physical parameters such as headspace gas
volume, agitation rates and heat shock treatment on ethanol concentrations in producer
gas fermentations using P11 cells in lab scale bottle reactors. Both the temperature shocks
at 75°C and 92ºC for 3 min increased gas uptake rates and initiated an early induction of
solventogenesis, but 92ºC heat treatment resulted in an increase in ethanol (55%) and
acetic acid (13%) when compared to the control that was not heat shocked. The increase
in agitation rates from 150 rpm to 250 rpm decreased ethanol (50%) and acetic acid
(52%), possibly due to the shear sensitivity of cells. The increase in headspace volume
resulted in a 181% increase in ethanol concentration and 23% increase in acetic acid
concentration. Besides this, ethanol was produced as a growth related product with
increased headspace volume that eventually increased the productivity of the ethanol
production by 865%. Thus, heat shocking of P11 cells and increasing the headspace
volume has shown promising results with increases in ethanol to acetate ratios and
ethanol productivities.

167
Acknowledgements
This research was supported by the South Central Sun Grant Initiative. We appreciate the
Dr. Ralph Tanner for isolating and providing us with Clostridium strain P11 bacteria.
Special thanks to Mr. Robert Ingraham for helping with setting up the gas
chromatography methods and Dr. Marthah DeLorme for giving her valuable suggestions
with heat shocking experiments.

168
5.5 References
Ahmed A. 2006. Effect of biomass-generated syngas on cell growth, product distribution
and enzyme activities of Clostridium caboxidivorans P7T [Ph.D. Dissertation].
Stillwater: Oklahoma State University. 227 p.
Ahmed A, Lewis RS. 2007. Fermentation of biomass-generated synthesis gas: Effects of
nitric oxide. Biotechnology and Bioengineering 97(5):1080-1086.
Aiba S, Humphrey AE, Millis NF. 1973. Biochemical Engineering. Tokyo: University of
Tokyo Press. 434 p.
Anderson DP, Outlaw JL, Bryant HL, Richardson JW, Ernstes DP, J. Marc Raulston,
Welch JM, Knapek GM, Herbst BK, Allison MS. 2008. The effects of ethanol on
Texas food and feed. College Station: Texas A&M Universtity. 39 p.
Anonymous. 2009. Growing innovation America’s energy future starts at home.
Washington, DC: Renewable Fuel Association.
Anonymous. 1995. Bench-scale demonstration of biological production of ethanol from
coal synthesis gas. Fayettville: Bioengineering Resources, Inc. Report nr
DOE/PC/92118--T14. 19 p.
Barik S, Prieto S, Harrison SB, Clausen EC, Gaddy JL. 1988. Biological production of
alcohols from coal through indirect liquefaction. Applied Biochemistry and
Biotechnology 18(1):363-378.
Cote RJ, Gherna RL. 1994. Nutrition and media. In: Gerhardt P, Murray RGE, Wood
WA, Krieg NR, editors. Methods for general and molecular bacteriology.
Washington, DC: American Society of Microbiology Press. p 155-178.

169
Datar RP. 2003. Anaerobic fermentation of biomass generated producer gase to ethanol
[Ph.D. Dissertation]. Stillwater: Oklahoma State University. 229 p.
Doremus M, Linden J, Moreira A. 1985. Agitation and pressure effects on acetone-
butanol fermentation. Biotechnology and Bioengineering 27(6):852-860.
El-Rub ZA, Bramer EA, Brem. G. 2004. Review of catalysts for tar elimination in
biomass gasification processes. Industrial & Engineering Chemistry Research
43(22):6911-6919.
Frankman AW. 2009. Redox, pressure and mass transfer effects on syngas fermentation
[M.S Thesis]. Provo: Brigham Young University. 106 p.
Gapes J, Swoboda H, Haslinger A, Nimcevic D. 2000. The effect of heat-shocking on
batch fermentation by Clostridium beijerinckii NRRL B592. Applied
Microbiology and Biotechnology 54(1):118-120.
Gapes JR, Larsen VF, Maddox IS. 1983. A note on procedures for inoculum development
for the production of solvents by a strain of Clostridium butylicum. Journal of
Applied Microbiology 55(2):363-365.
Gerhardt PR, Murray GE, Costilow RN, Nester EW, Wood WA, Krieg NR, Phillips GB.
1981. Manual of methods for general microbiology. Washington, DC: ASM
Press. 1106 p.
Heiskanen H, Virkajärvi I, Viikari L. 2007. The effect of syngas composition on the
growth and product formation of Butyribacterium methylotrophicum. Enzyme and
Microbial Technology 41(3):362-367.

170
Henstra AM, Sipma J, Rinzema A, Stams AJ. 2007. Microbiology of synthesis gas
fermentation for biofuel production. Current Opinion in Biotechnology 18:200-
206.
Huber GW, Iborra S, Corma A. 2006. Synthesis of transportation fuels from biomass:
Chemistry, catalysts, and engineering. Chemical Reviews 106:4044-4098.
Huhnke RL, Lewis RS, Tanner RS; 2006. Isolation and characterization of novel
clostridial species [Patent application]. USA.
Imkamp F, Muller V. 2007. Acetogenic bacteria. Encyclopedia of life sciences. Malden:
John Wiley & Sons, Inc. p 1-8.
Jones D, Van der Westhuizen A, Long S, Allcock E, Reid S, Woods D. 1982. Solvent
production and morphological changes in Clostridium acetobutylicum. Applied
and Environmental Microbiology 43(6):1434-1439.
Kapic A, Jones S, Heindel T. 2006. Carbon monoxide mass transfer in a syngas mixture.
Industrial and Engineering Chemical Research 45(26):9150-9155.
Kasteren JMN, Dizdarevic D, Waall WRvd, Guo J, Verberne R. 2005. Bio-ethanol from
bio-syngas. Eindhoven: Eindhoven University of Technology. 53 p.
Khanal SK. 2008. Anaerobic reactor configurations for bioenergy production. In: Khanal
SK, editor. Anaerobic biotechnology for bioenergy production: Principles and
applications. Ames: Wiley-Blackwell. p 93-114.
Ko CW, Vega JL, Clausen EC, Gaddy JL. 1989. Effect of high pressure a co-culture for
the production of methane from coal gas synthesis gas. Chemical Engineering
Communications 77(1):155-169.

171
Kumar A, Jones DD, Hanna MA. 2009. Thermochemical biomass gasification: A review
of the current status of the technology. Energies 2(3):556-581.
Kutzenok A, Aschner M. 1952. Degenerative processes in a strain of Clostridium
butylicum. Journal of Bacteriology 64(6):829-836.
Long S, Jones D, Woods D. 1983. Sporulation of Clostridium acetobutylicum P262 in a
defined medium. Applied and Environmental Microbiology 45(4):1389-1393.
Maddox I, Steiner E, Hirsch S, Wessner S, Gutierrez N, Gapes J, Schuster K. 2000. The
cause of "acid crash" and "acidogenic fermentations" during the batch acetone-
butanol-ethanol (Girbal et al.) fermentation process. Journal of Molecular
Microbiology and Biotechnology 2(1):95-100.
Martin J, Petitdemange H, Ballongue J, Gay R. 1983. Effects of acetic and butyric acids
on solvents production by Clostridium acetobutylicum. Biotechnology Letters
5(2):89-94.
McKendry P. 2002. Energy production from biomass (part 2): Conversion technologies.
Bioresource Technology 83(1):47-54.
Myers R. 2003. The basics of chemistry. Westport: Greenwood Press. 373 p.
Papoutsakis ET. 2005. Genomic and genetic approaches to solvent tolerance.
http://www.osti.gov/energycitations/product.biblio.jsp?osti_id=840821. Evanston:
Northwestern University. 10 p. accessed 12/2/09.
Putsche V, Sandor D. 1996. Strategic, economic and environmental issues for
tranportation fuels. In: Wyman CE, editor. Handbook on bioethanol: Production
and utilization. Washington, DC: Taylor and Francis. p 19-35.

172
Qureshi N, Annous B, Ezeji T, Karcher P, Maddox I. 2005. Biofilm reactors for industrial
bioconversion processes: Employing potential of enhanced reaction rates.
Microbial Cell Factories 4(1):24.
Rogers P, Chen J-S, Zidwick MJ. 2006. Organic acid and solvent production Part I:
Acetic, lactic, gluconic, succinic and polyhydroxyalkanoic acids. In: Dworkin M,
Falkow S, Rosenberg E, Schleifer K-H, Stackebrandt E, editors. The Prokaryotes.
New York: Springer. p 511-755.
Riet K, Tramper J. 1991. Shear. In: Riet K, Tramper J, editors. Basic bioreactor design.
New York: Marcel Dekker Inc. p 136-180.
Shenkman RM. 2003. C. carboxidivorans culture advances and the effect of pH,
temperature and producer gas on key enzymes [M.S Thesis]. Stillwater:
Oklahoma State University. 180 p.
Smith K, Klasson K, Clausen A, Gaddy J. 1991. COS degradation by selected CO-
utilizing bacteria. Applied Biochemistry and Biotechnology 28(1):787-796.
Spath PL, Dayton DC. 2003. Preliminary screening - Technical and economic assessment
of synthesis gas to fuels and chemicals with emphasis on the potential for
biomass-derived syngas. Golden: National Renewable Energy Laboratory. 142 p.
Spivey M. 1978. The acetone/butanol/ethanol fermentation. Process Biochemistry
13(11):2-4.
Tanner RS. 1997. Cultivation of bacteria and fungi. In: Hurst CJ, Crawford RL, Garland
JL, Lipson DA, Mills AL, editors. Manual of environmental microbiology.
Washington, D.C.: American Society of Microbiology Press. p 52-60.
173
Terracciano J, Rapaport E, Kashket E. 1988. Stress-and growth phase-associated proteins
of Clostridium acetobutylicum. Applied and Environmental Microbiology
54(8):1989.
Toma M, Ruklisha M, Vanags J, Zeltina M, Leite M, Gelinina N, Viesturs U, Tengerdy
R. 1991. Inhibition of microbial growth and metabolism by excess turbulence.
Biotechnology and Bioengineering 38(5):552-556.
Tracy B, Gaida S, Papoutsakis E. 2008. Development and application of flow-cytometric
techniques for analyzing and sorting endospore-forming clostridia. Applied and
Environmental Microbiology 74(24):7497.
Tsai S-P, Datta R, Basu R, Yoon S-H, Tobey RE; 2009. Modular membrane supported
bioreactor for conversion of synags components to liquid products. [Patent
application]. USA.
Vega J, Holmberg V, Clausen E, Gaddy J. 1988. Fermentation parameters of
Peptostreptococcus productus on gaseous substrates (CO, H2/CO2). Archives of
Microbiology 151(1):65-70.
Vega J, Klasson K, Kimmel D, Clausen E, Gaddy J. 1990. Sulfur gas tolerance and
toxicity of CO-utilizing and methanogenic bacteria. Applied Biochemistry and
Biotechnology 24(1):329-340.
Vega JL, Clausen EC, Gaddy JL. 1988b. Study of gaseous substrate fermentations:
Carbon monoxide conversion to acetate. 1. Batch culture. Biotechnology and
Bioengineering 34:774-784.
Wiegel J, Tanner RS, Rainey FA. 2006. An Introduction to the Family Clostridiaceae. In:
Dworkin M, editor. The Prokaryotes. New York: Springer. p 654-678.

174
Worden RM, Grethlein AJ, Jain MK, Datta R. 1991. Production of butanol and ethanol
from synthesis gas via fermentation. Fuel 70(5):615-619.
Yerushalmi L, Volesky B. 1985. Importance of agitation in acetone-butanol fermentation.
Biotechnology and Bioengineering 27(9):1297-1305.
175
CHAPTER 6
FUTURE WORK
This research has provided an understanding on the effects of producer gas and its
components such as methane and oxygen on Clostridium strain P11 fermentations.
During the study, the robustness of the microbe was shown with the components of
producer gas generated by pilot scale gasifiers. However, further studies have to be
performed for the successful integration of gasification and fermentation process. The
following studies are considered essential.
• The cause of enhanced solvent formation during the fermentation of producer gas
generated from the gasifiers must be determined. There could be multiple
components such as nitric oxide (Ahmed and Lewis 2007) in the producer gas that
contribute to this increase in solvent yields. The effect of individual components
must be studied closely. Enzymatic assays for essential enzymes such as FDH,
CODH, ADH and hydrogenase will give answers to the metabolism of the
microbe. The study should then be integrated to determine whether the producer
gas constituents have an additive effect on fermentation. This would help in
developing the gas cleaning technologies based on the tolerance of producer gas
components to keep the cost of the process to the minimum level.
176
• Isopropanol which was a major product formed during switchgrass producer gas
experiments could have been formed by the reduction of acetone. This study has
determined that acetone could act as a major contaminant of producer gas
fermentations (Appendix B) and thus methods have to be developed for complete
removal of acetone from producer gas. Since, the solubility of acetone is high; it
could be removed by bubbling through water. Although, it is believed that
isopropanol is produced from the reduction of acetone, it could also be produced
by the reduction of propionic acid. Hence, experiments will have to be conducted
for the evaluation of metabolic pathway of isopropanol production from P11.
• Heat shocking of P11 cells at 92ºC for 3 min showed increased solvent
concentrations. Although spores were detected after heat shocking, microbial
staining of cells were not performed during the different stages of the P11
fermentation. P11 cells could be sporulating and/or also forming heat shock
proteins and has to be studied closely to see if there is any relation between
sporulation and heat shock protein expression with solvent formation.
• In our studies, the availability of gaseous substrates increased the rate of ethanol
formation. Thus, it is believed that gas mixtures with composition close to
stoichiometric ratios will increase the amount of cells, rate of product formation
than the synthetic gas mix such as 20% CO, 15% CO2 and 5% H2. Effect of
different gas compositions will help in understanding the metabolism of the
microbe.

177
6.1 References
Ahmed A, Lewis RS. 2007. Fermentation of biomass-generated synthesis gas: Effects of
nitric oxide. Biotechnology and Bioengineering 97(5):1080-1086.

178
APPENDIX A
Calculation of kinetic parameters
% Gas utilization
In producer gas fermentations, CO acts as a source of carbon and electrons while
H2 serves as an electron source. Improving the consumption of both CO and H2 would
improve the fermentation yields and hence they are one of the most important kinetic
parameters. In batch reactors, the gaseous substrates were fed periodically at an interval
of x hours (h). The molar percentage of gas in inlet and after x h was calculated using the
GC-TCD. Ideal gas law was used to convert the gas percentages into number of moles.
The difference between the moles of CO in the inlet and moles of CO after x h would
equal the moles of CO consumed by the microbe in that particular time (x h).
COin = �����
RT
COout = �����
RT
Moles of CO consumed in x h = COin - COout
Total moles of CO consumed = Sum of moles of CO consumed at every x hours.
Total moles of CO provided = Sum of moles of CO provided after every x hours.
% CO utilized= (Total moles of CO consumed/ Total moles of CO provided)*100
179
Where,
P� = Inlet pressure of the batch reactor.
P� = Pressure of the batch reactor after x hours.
V = Total volume of the gas in the reactor.
y� = Initial mole fraction of CO in batch reactor.
y� = Mole fraction of CO in batch reactor after x hours that is calculated by the GC-TCD.
R = Molar gas constant.
T = Temperature in Kelvin.
Similarly,
% H2 utilized= (Total moles of H2 consumed/ Total moles of H2 provided)*100
Yield of ethanol (YETOH/CO) and Yield of acetic acid (YAA/CO)
Concentrations of ethanol and acetic acid produced from the fermentations were
calculated by the GC-FID. From the concentrations, moles of ethanol and acetic acid
formed during fermentation are calculated but the formula (moles= g of product/
molecular weight of the product). Total moles of CO consumed were calculated as
described in the previous section. CO is the limiting substrate for our reactions because in
the absence of CO, no products will be formed.
Thus,
YETOH/CO = Total moles of ethanol produced/ Total moles of CO consumed
Similarly,
YAA/CO = Total moles of acetic acid produced/ Total moles of CO consumed

180
% Theoretical conversion of ethanol and acetic acid
The theoretical maximum yield of ethanol and acetic acid is calculated from the
reactions:
3CO + 3 H2 → C2H5OH + CO2
2 CO + 2 H2 → CH3COOH
It could be observed that 1 mole of ethanol can be formed from 3 moles of CO,
thus making the theoretical maximum yield of ethanol as 0.333. Similarly, from the
second reaction, 2 moles of CO is required for the formation of 1 mole of acetic acid.
Thus, the theoretical maximum yield of acetic acid is 0.5.The % theoretical conversion of
the product is the ratio of actual yields of product observed in our fermentations (which
are calculated from the last section) to the theoretical maximum yields of the product.
Mathematically,
% Theoretical conversion of ethanol = Actual YETOH/CO/ Theoretical YETOH/CO
where, Actual YETOH/CO was calculated from last section and theoretical YETOH/CO is
0.333.
Similarly,
% Theoretical conversion of acetic acid = Actual YAA/CO/ Theoretical YAA/CO
where, Actual YAA/CO was calculated as described before and theoretical YAA/CO is 0.5.
Specific CO and H2 uptake rates (qCO and qH2)
Gas uptake rate is defined as the amount of gas consumed per unit time per unit
mass of cells. Thus,
qCO = (COin - COout) / (g cells in the bioreactor* t)

181
where,
COin - COout can be calculated as described before.
g cells in the bioreactor= Product of cell mass concentration (X) and volume (Vega et al.)
of culture media in the batch reactor.
t = Time taken to consume total moles of CO during the fermentation.
Similarly,
qH2 = (H2in – H2out) / (g cells in the bioreactor* t)
where,
H2in – H2out can be calculated as described before.
Specific ethanol formation rates (qETHOH )
Specific ethanol formation rate is defined as the ratio of molar ethanol production
rate per unit time per unit mass of cells. Thus,
qETOH = (moles of ethanol produced/ time) / (g cells in the bioreactor)
where,
moles of ethanol produced is calculated from GC-FID
Time = (Total fermentation time – lag time for ethanol formation). This lag time is
subtracted because ethanol is a non growth related product and no ethanol is usually
observed in the first 200 h of fermentation (approximately).
g cells in the bioreactor = Product of cell mass concentration (X) and volume (Vega et
al.) of culture media in the batch reactor.

182
APPENDIX B
Corn gluten feed experiment in the presence of 1.63% oxygen
Introduction
Oxygen is one of the most toxic gases to acetogens because many of the enzymes
present in the acetyl-CoA pathway are extremely sensitive to oxygen (Drake et al. 2006).
Oxygen has been reported during biomass gasification in the past (Datar 2003). Datar
(2003) studied the effect of oxygen on Clostridium carboxidivorans and found that
oxygen concentrations up to 1900 ppm (or 0.19%) did not affect CO and H2 utilization,
growth and product formation in C. carboxidivorans. Several acetogens like
Acetobacterium woodii , Clostridium magnum, Sporomus silvatica, Moorella
thermoautotrophicum and Clostridium glycolicum RD-1 have shown the tendency to
tolerate oxygen concentrations in the range of 0.5%-6% as they contain enzymes
involved in the removal of oxygen (or its toxic products) such as NADH-oxidase,
peroxidase, superoxide dismutase, rubredoxin oxidoreductase and rubrerythrin (Drake et
al. 2006; Karnholz et al. 2002; Kusel et al. 2001).
The objective of this research was to study the effect of presence of 1.63%
oxygen in the fermentation of a corn gluten feed (CGF) generated producer gas by
Clostridium strain P11.

183
Materials and Methods
All materials and methods are similar to that described in Chapter 4. The media
composition used for the cultivation of P11 was the same as that was used for the
methane experiments.
Results and discussion
Batch studies- Effect of CGF producer gas in the presence of 1.63% oxygen
Producer gas was generated from a downward draft gasifier with CGF as substrate
and a gas composition as shown in Table B.1 was obtained. CGF is a byproduct of the
corn wet milling industry. The CGF producer gas also had oxygen at 1.63% due to the
compressor malfunction which added atmospheric oxygen into the gas storage tanks. The
presence of oxygen could be toxic to many enzymes of the acetyl-CoA pathway (Drake et
al. 2006). Preliminary studies using switchgrass producer gas with 1.27% oxygen showed
acetone as a major product of fermentation at concentrations as high as 1.62 g/l in 10
days with cell mass concentrations as high as 0.5 g/l (data not shown). This was a
promising result because there were no previous reports on acetone production from P11.
However, neither acetic acid nor ethanol was observed in the preliminary study. Thus,
research questions like “whether P11 produced acetone and was this product distribution
an effect of presence of oxygen in producer gas” or “whether there is some other microbe
(contaminated culture) which produced acetone” had to be answered. Microscopic
evaluation of the preliminary culture revealed the presence of cocci shaped cells (while
P11 are rod shaped) in the bottles that produced acetone, which suggested that the
fermentation might have been contaminated by some other microorganism. The
contaminated culture is hereafter referred as “acetone culture”.
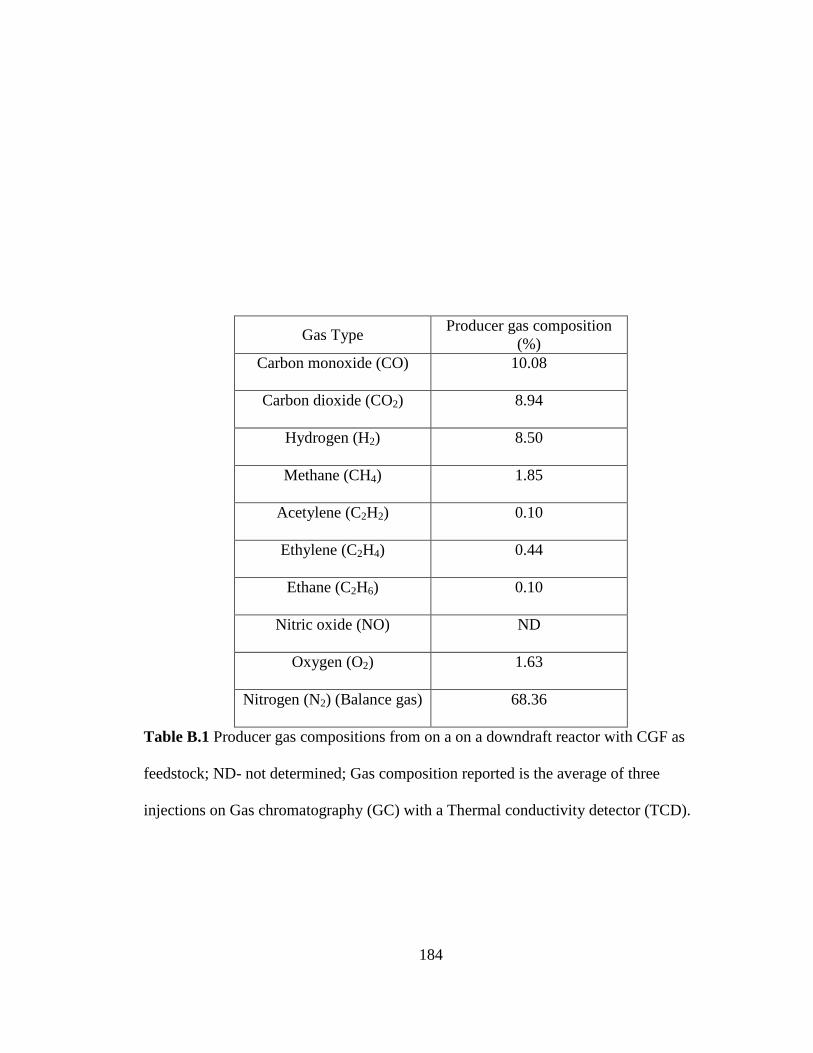
184
Gas Type Producer gas composition
(%) Carbon monoxide (CO) 10.08
Carbon dioxide (CO2) 8.94
Hydrogen (H2) 8.50
Methane (CH4) 1.85
Acetylene (C2H2) 0.10
Ethylene (C2H4) 0.44
Ethane (C2H6) 0.10
Nitric oxide (NO) ND
Oxygen (O2) 1.63
Nitrogen (N2) (Balance gas) 68.36
Table B.1 Producer gas compositions from on a on a downdraft reactor with CGF as
feedstock; ND- not determined; Gas composition reported is the average of three
injections on Gas chromatography (GC) with a Thermal conductivity detector (TCD).

185
Also, it was important to determine whether the observed acetone was
biologically produced or was a contaminant of biomass producer gas. This question was
raised because a 20% acetone solution was used in the scrubbers to reduce the amount of
tars in the gas. It could be possible that a part of this acetone accumulates in the producer
gas during scrubbing process.
The outline of the experiment is shown in Fig. B.1. Both P11 and the acetone
culture were tested for growth and product formation on synthetic gas mix and CGF
producer gas. The hypothesis was that P11 did not make acetone and it formed either by
the contaminated culture or abiotically. To test whether acetone was produced abiotically
two sets of negative control were added to the experiments. The negative controls were
treated the same way as the treatment bottles except they did not have any cells
inoculated. One set of duplicate bottles had synthetic gas mix and the other set had CGF
producer gas. In either of the negative controls, no cell growth was expected. If acetone
was present in the producer gas generated from the gasifiers, it will get accumulated in
the liquid media and thereby our hypothesis can be proved. If contaminated culture
produced acetone in both synthetic gas mix and CGF producer gas then we could prove
that the contaminated cocci cells were responsible for the production of acetone.
Growth and pH: The growth and pH profiles are shown in Fig. B.2 and B.3. In all
the graphs, the negative control with CGF producer gas was run the shortest time (168 h)
because the batch of CGF producer gas was all consumed during the experiments and
no feedstock (CGF) was available for gasification. All the experiments other than the
control (denoted as P11: synthetic gas) were stopped at 336 h because there was not
much change in the concentration of products like ethanol and acetic acid. The control
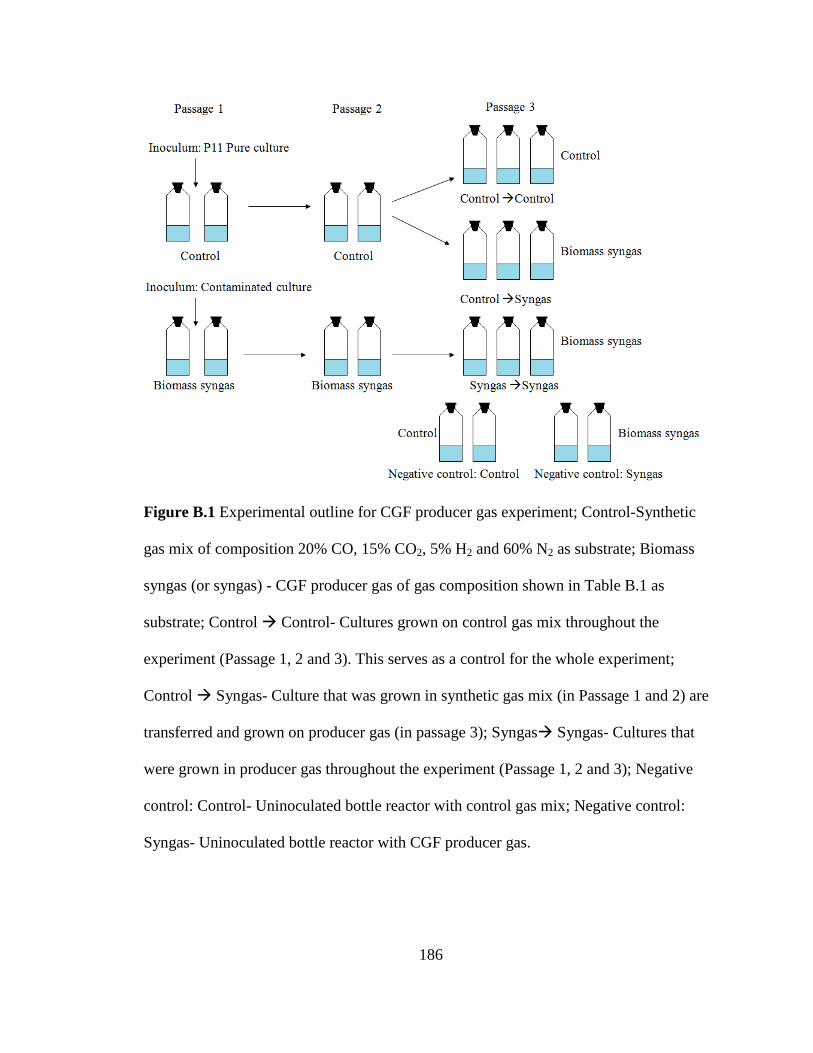
186
Figure B.1 Experimental outline for CGF producer gas experiment; Control-Synthetic
gas mix of composition 20% CO, 15% CO2, 5% H2 and 60% N2 as substrate; Biomass
syngas (or syngas) - CGF producer gas of gas composition shown in Table B.1 as
substrate; Control � Control- Cultures grown on control gas mix throughout the
experiment (Passage 1, 2 and 3). This serves as a control for the whole experiment;
Control � Syngas- Culture that was grown in synthetic gas mix (in Passage 1 and 2) are
transferred and grown on producer gas (in passage 3); Syngas� Syngas- Cultures that
were grown in producer gas throughout the experiment (Passage 1, 2 and 3); Negative
control: Control- Uninoculated bottle reactor with control gas mix; Negative control:
Syngas- Uninoculated bottle reactor with CGF producer gas.

187
Figure B.2 Cell growth in different treatments; Each data point is the average of number
of replicates; Number of replicates in each treatment is 3 except the negative controls
where the number of replicates is 2; Error bars represent standard error.
0.00
0.10
0.20
0.30
0.40
0 200 400 600 800
Time (Hours)
Cel
l ma
ss c
on
cent
ratio
n (g
/l)
P11 Culture:Synthetic gas P11 Culture: Corn gluten producer gasContaminated Culture:Synthetic gas Contaminated Culture: Corngluten producer gasNegative Control:Corn gluten producer gas Negative control: Bottled gas

188
Figure B.3 pH profile in different treatments; Each data point is the average of number of
replicates; Number of replicates in each treatment is 3 except the negative controls where
the number of replicates is 2; Error bars represent standard error.
4.5
5.0
5.5
6.0
6.5
0 200 400 600 800Time (Hours)
pH
P11 culture: Synthetic gas P11 culture: Corn gluten producer gasContaminated culture: Synthetic gas Contaminated culture: Corn gluten producer gas
Negative control: Synthetic gas Negative control: Corn gluten producer gas
189
(denoted as P11: synthetic gas) was stopped when the product formations leveled off at
720 h.
The only treatment where there was cell growth is the control (P11 culture on
synthetic gas) and the contaminated culture (cocci cells) on CGF producer gas. The
control had a lag time of 47 h after which exponential growth was observed. As reported
earlier, pH was observed to decrease during the growth phase. In control, the cells
reached the stationary phase at 123 h, and after 350 h increase in cell mass concentrations
were observed again. This second growth phase was linked with an increase in acetic acid
concentration, decrease in pH and higher uptake of substrates like CO and H2 gases.
Multiphase growth similar to our observations were also observed in the microbe
Clostridium acetobutylicum (Tracy et al. 2008).
P11 cells grown on CGF producer gas in the presence of oxygen showed a sharp
increase in cell concentrations (reached 0.16 g/l) in the first 24 h, but after that there was
a steep decrease in cell mass concentration to 0.06 g/l cells. This increase in cell mass
could be due to the removal of oxygen by cysteine sulfide solution, which is added to
fermentations to scavenge traces of oxygen. The resazurin in media remained colorless
for the first 24 h of fermentation, showing the ability of the reducing agent (cysteine
sulfide) to reduce oxygen to tolerable limits for the growth of the microbe. After 24 h, the
color of the media remained pink for the rest of the fermentation, showing the presence of
oxygen in the media. The decline in cell mass concentration indicates that 1.63% of
oxygen was toxic to the cells. This shows that P11 possibly does not have enzymes like
NADH-oxidase, peroxidsase, superoxide dismutase, rubredoxin oxidoreductase and

190
rubrerythrin to detoxify the harmful radicals produced in the presence of oxygen which
are reported in some studies (Drake et al. 2006; Karnholz et al. 2002; Kusel et al. 2001).
No change in the pH or acid production was observed in any levels of treatments
except the control (Fig. B.3).
Product profiles: Ethanol, acetic acid and acetone concentrations over time are
shown in Figs. B.4, B.5 and B.6, respectively. Ethanol production was only observed in
the control (P11 culture grown on synthetic gas). Ethanol was a non growth associated
product with an exponential increase in production only after 330 h. The standard error
bars are larger towards the end of fermentation due to variation between replicated
bottles.
Acetic acid was also found to be produced only in control (P11 culture grown on
synthetic gas). Acetic acid production was growth related as ATP is generated by
substrate level phosphorylation during its production. A slight increase in acetic acid
concentration (~1 g/l) was observed after 400 h, which was directly related to cell
growth, CO and H2 consumption. The increase in acetic acid production could be due to
increasing demand of ATP inside the cell for its survival and other metabolic activities
(Meyer and Papoutsakis 1988). No acetic acid and ethanol was formed in the treatments
when P11 culture was grown on CGF producer gas, which confirms that 1.63% oxygen
was toxic to product formation.
Acetone accumulated in the treatments (both P11 culture and contaminated
culture) using CGF producer gas. However, it was also observed in negative controls.
The presence of acetone in negative controls is likely due to the presence of acetone in
producer gas from the acetone scrubber used to clean the gas. Since acetone is highly

191
Figure B.4 Ethanol production in different treatments; Each data point is the average of 3
replicates; Error bars represent standard error; Number of replicates in each treatment is 3
except the negative controls where the number of replicates is 2.
0.0
0.5
1.0
1.5
2.0
0 200 400 600 800Time (Hours)
Eth
an
ol (
g/l)
P11 culture: Synthetic gas Contaminated culture: Synthetic gasP11culture: Corn gluten producer gas Contaminated culture: Corn gluten producer gasNegative control: Synthetic gas Negative control: Corn gluten producer gas

192
Figure B.5 Acetic acid production in different treatments; Each data point is the average
of 3 replicates except the negative controls where the number of replicates is 2; Error bars
represent standard error.
0
1
2
3
4
0 200 400 600 800Time (Hours)
Ace
tic a
cid
( g
/l)
P11culture: synthetic gas Contaminated culture: Synthetic gasP11culture: Corn gluten producer gas Contaminated culture: Corn gluten producer gasNegative control: Synthetic gas Negative control: Corn gluten producer gas

193
Figure B.6 Acetone production in different treatments; Each data point is the average of
3 replicates except the negative controls where the number of replicates is 2; Error bars
represent standard error.
0.0
0.2
0.4
0.6
0.8
0 200 400 600 800Time (Hours)
Ace
ton
e (g
/l)
Negative control:Corn gluten producer gas Contaminated culture: Corn gluten producer gasP11 culture: Corn gluten producer gas Contaminated culture: Synthetic gasP11 culture: Synthetic gas Negative control: Synthetic gas

194
soluble in water, it dissolved from the gas into liquid media. To confirm this, gas
samples were analyzed in a GC-MS (Gas chromatography- mass spectrometer) column
which showed the presence of acetone in CGF producer gas. However, when gas samples
were taken from a reactor which had liquid media, no acetone was observed in the
headspace (data not shown). Even when de-ionized (DI) water was used instead of
regular liquid media, no acetone was observed in the headspace (data not shown).
However, acetone was observed when the liquid samples were analyzed using a GC-FID.
This supports our hypothesis that acetone in the liquid media was the result of acetone in
the producer gas and not biological production. Furthermore, when no addition of
producer gas was made at 116 h for negative control and 336 h for contaminated culture
and pure culture grown on CGF producer gas, they showed no increase in acetone
production, which further confirms our findings. Acetone is not produced during
gasification of biomass feedstocks but was carried over from the scrubbing system which
is employed for the removal of tars from producer gas.
The contamination of acetone into liquid media could interfere with producer gas
fermentations in many ways as it could: a) give misleading information about product
formation and b) give rise to other metabolic products from acetone such as isopropanol
as acetone is a substrate for isopropanol production (as shown in Fig. 4.1). CGF producer
gas fermentation did not produce any isopropanol as the major metabolic activities were
shutdown due to the presence of oxygen. However, switchgrass producer gas did produce
isopropanol at concentrations as high as 3.9 g/l. Although no acetone was observed
during the analysis of the switchgrass producer gas fermentations, the GC method used
was unable to detect acetone. Therefore, the possibility of acetone reduction into

195
isopropanol cannot be ruled out since P11 was able to reduce acetone into isopropanol in
the presence of glucose as carbon source (data not shown). Further research needs to be
done to confirm whether acetone can be biologically produced by P11 and whether the
acetone conversion occurs in the presence of CO, CO2 and H2 as gaseous substrates.
Gas consumption profiles: The consumption of CO, H2 and CO2 are shown in
Figs. B.7, B.8 and B.9, respectively. In control bottles (P11 culture grown on synthetic
gas mix) CO consumption started sharply after 47 h of lag phase and slowed down during
the stationary phase (from ~100 h to 350 h). After 350 h, there was an increase in the rate
of CO consumption due to a secondary growth phase which produced acetic acid as well
(Fig. B.7). The H2 consumption data (Fig. B.8) had the same trend as the CO data (Fig.
B.7) implying that CO and H2 serve as two substrates for acetic acid and ethanol
formation possibly from the theoretical reactions described as follows (Barik et al. 1988;
Phillips et al. 1994; Ragsdale 1991; Rajagopalan et al. 2002).
2CO + 4H2 → C2H5OH + H2O (B.1)
CO + H2O → CO2 + H2 (B.2)
3CO + 3 H2 → C2H5OH + CO2 (B.3)
2CO + 2H2 → CH3COOH (B.4)
CH3COOH + 2 H2 → C2H5OH + H2O (B.5)
5CO + 7H2 → 2C2H5OH + CO2 + H2O (Overall reaction) (B.6)
The gas analysis data shows that P11 has a preference for CO as a carbon source
when a mixture of CO and CO2 are provided as carbon source. Other acetogens like P.
productus (Vega et al. 1988a) and C. carboxidivorans (Shenkman 2003) have also shown
preference to consume CO when a mixture of CO, CO2 and H2 are provided. On the CO2

196
Figure B.7 CO consumption in different treatments.
0
10
20
30
40
0 200 400 600 800
Time (Hours)
CO
co
nsum
ptio
n (
mM
)
Pure Culture: Synthetic gas Contaminated Culture: Synthetic gasNeg Control: Synthetic gas Pure Culture:Corn gluten producer gasContaminated Culture: Corn gluten producer gas Neg Cont: Corn gluten producer gas

197
Figure B.8 H2 consumption in different treatments
0
1
2
3
4
5
6
0 200 400 600 800Time (Hours)
H2
co
nsu
mp
tion
(m
ole
s)
Pure Culture: Synthetic gas Contaminated Culture: Synthetic gasNegative Control: Synthetic gas Pure Culture: Corn gluten producer gasContaminated Culture:Corn gluten producer gas Negative Control:Corn gluten producer gas

198
Figure B.9 CO2 consumption in different treatments.
-6
-3
0
3
6
9
0 200 400 600 800
Time (Hours)
CO
2 c
ons
ump
tion
(mM
)
P11 Culture: synthetic gas Contaminated Culture: Synthetic gasNegative Control:Synthetic gas P11 Culture:Corn gluten producergasContaminated Culture: Corn gluten producer gas Negative Control : Corn gluten producer gas

199
consumption profile (Fig. B.9), no CO2 consumption occurred during the lag phase
followed by a production phase from 79 h to 189 h, a consumption phase from 189 h to
350 h, a secondary production phase from 350 h to 503 h and then no consumption or
production was observed after 503 h.
In Fig. B.7, it could easily be seen that contaminated culture and negative controls
on synthetic gas overlap each other and the small increase in CO could be due to its
solubility in the media. A similar trend was observed in contaminated culture and
negative controls on CGF producer gas. The variation between the treatments grown on
synthetic gas and CGF producer gas could be due to the difference in the concentration of
CO in the two gaseous substrates (as synthetic gas had 20% CO whereas CGF producer
gas had only 10% CO). Similar variation was also seen in hydrogen consumption curves
because of the difference in concentration of H2 in the two gaseous substrates (as
synthetic gas had 5% H2 whereas CGF producer gas had 8.9% H2). CO2 production and
H2 consumption were seen with the treatment in which contaminated culture was grown
on CGF producer gas.
The contaminated cocci culture was later discovered to be a Staphylococcus
species (determined by 16 S rRNA sequencing) and was observed to be a facultative
anaerobe and was unable to grow on CO/CO2/H2 as the sole carbon and energy source
(Delorme and Wilkins, Presentation at SIM Annual meeting and exhibition, 2009).
Conclusion
In this study, we demonstrated that 1.63% oxygen was toxic to P11 as it did not
show any growth. Further investigations would need to be carried out to find out the
tolerance limit of oxygen by P11. Nevertheless, this research identified the presence of

200
acetone as a producer gas contaminant from scrubbing system and hence better way to
remove or reduce the concentrations of acetone from producer gas will have to be
identified.
201
References
Barik S, Prieto S, Harrison SB, Clausen EC, Gaddy JL. 1988. Biological production of
alcohols from coal through indirect liquefaction Applied Biochemistry and
Biotechnology 18(1):363-378.
Datar RP. 2003. Anaerobic fermentation of biomass generated producer gas to ethanol
[Ph.D. Dissertation]. Stillwater: Oklahoma State University. 229 p.
Drake HL, Kusel K, Matthies C. 2006. Acetogenic prokaryotes. In: Dworkin M, Falkow
S, Rosenberg E, Schleifer K-H, Stackebrandt E, editors. The prokaryotes. New
York: Springer. p 354-420.
Karnholz A, Kusel K, Gossner A, Schramm A, Drake H. 2002. Tolerance and metabolic
response of acetogenic bacteria toward oxygen. Applied and Environmental
Microbiology 68(2):1005-1009.
Kusel K, Karnholz A, Trinkwalter T, Devereux R, Acker G, Drake H. 2001.
Physiological ecology of Clostridium glycolicum RD-1, an aerotolerant acetogen
isolated from sea grass roots. Applied and Environmental Microbiology
67(10):4734-4741.
Meyer CL, Papoutsakis ET. 1988. Increased levels of ATP and NADH are associated
with increased solvent production in continuous cultures of Clostridium
acetobutylicum. Applied Microbiology and Biotechnology 30(5):450-459.
Phillips JR, Clausen EC, Gaddy JL. 1994. Synthesis gas as substrate for the biological
produciton of fuels and chemicals. Applied Biochemistry and Biotechnology
45/46:145-157.

202
Ragsdale SW. 1991. Enzymology of the acetyl-CoA pathway of CO2 fixation. Critical
Reviews in Biochemistry and Molecular Biology 26(3/4):261-300.
Rajagopalan S, Datar RP, Lewis RS. 2002. Formation of ethanol from carbon monoxide
via a new microbial catalyst. Biomass and Bioenergy 23:487-493.
Shenkman RM. 2003. C. carboxidivorans culture advances and the effect of pH,
temperature and producer gas on key enzymes [M.S Thesis]. Stillwater:
Oklahoma State University. 180 p.
Tracy B, Gaida S, Papoutsakis E. 2008. Development and application of flow-cytometric
techniques for analyzing and sorting endospore-forming clostridia. Applied and
Environmental Microbiology 74(24):7497.
Vega J, Holmberg V, Clausen E, Gaddy J. 1988. Fermentation parameters of
Peptostreptococcus productus on gaseous substrates (CO, H2/CO2). Archives of
Microbiology 151(1):65-70.

VITA
Karthikeyan Ramachandriya Dharman
Candidate for the Degree of
Master of Science
Thesis: EFFECT OF BIOMASS GENERATED PRODUCER GAS, METHANE AND PHYSICAL PARAMETERS ON PRODUCER GAS FERMENTATIONS BY CLOSTRIDIUM STRAIN P11.
Major Field: Biosystems Engineering Biographical: Personal Data: Born in Madurai, Tamilnadu, India on December 23, 1984, the son of R.S.
Dharman and R.D. Lakshmikantham. Raised in Damanjodi and graduated from and Guru Nanak High School.
Education: Received Bachelors of Technology in Biotechnology from Bharathidasan University,
Tiruchirapalli, Tamilnadu, India in May 2006 with distinction and university fifth rank.
Completed the requirements for the Master of Science in Biosystems Engineering at Oklahoma State University, Stillwater, Oklahoma in December, 2009.
Experience: Engineering Intern, High Energy Batteries (India) Pvt. Ltd., Tiruchirapalli, Tamilnadu,
India, December 2005 to April 2006. Junior Research Fellow, Indian Institute of Technology, Delhi, India, January 2007 to
June 2007. Graduate Research Assistant, Oklahoma State University, Stillwater, OK, August 2007 to
Present. Professional Memberships: American Society of Agricultural and Biological Engineers (ASABE), Society of Industrial and Microbiology (SIM), Golden Key Internationa l Honor Society.

ADVISER’S APPROVAL: Dr. Mark R. Wilkins
Name: Karthikeyan Ramachandriya Dharman Date of Degree: December, 2009 Institution: Oklahoma State University Location: Stillwater, Oklahoma Title of Study: EFFECT OF BIOMASS GENERATED PRODUCER GAS, METHANE
AND PHYSICAL PARAMETERS ON PRODUCER GAS FERMENTATIONS BY CLOSTRIDIUM STRAIN P11.
Pages in Study: 202 Candidate for the Degree of Master of Science Major Field: Biosystems Engineering Scope and Method of Study:
The effect of producer gas generated by gasification of Kanlow switchgrass was determined to investigate the robustness of Clostridium strain P11 for the integration of gasification-fermentation process in a lab scale. Further experiments were performed for determining the effect of 5% methane, as methane is a major component of producer gas generated through gasification. Effect of 1.63% oxygen that was present in corn gluten feed (CGF) producer gas was also determined. Furthermore, the effect of physical parameters such as heat shocking, agitation and headspace gas (amount of available gas) were determined for enhancing the solvent concentrations and productivities.
Findings and Conclusions:
The use of switchgrass producer gas generated from fluidized bed gasifier showed an increase in ethanol concentrations by 125%, decrease in acetic acid concentrations by 40% and production of isopropanol at concentrations as high as 3.9 g/l. Producer gas components such as tars, nitric oxide and hydrocarbons could possibly be responsible for the metabolic shifts. 5% methane did not affect growth, product formation and gas uptake in P11 fermentation indicating that methane was an inert component of producer gas. However, the presence of 1.63% oxygen was highly toxic to P11 cells as it inhibited growth, product formation and gas uptake rates. Also, acetone that was used in gas-clean up was found to be contaminant of producer gas in the CGF experiment as it was getting accumulated in the culture media.
Increasing agitation rates inhibited product formation possibly due to the shear sensitivity of P11. Heat shocking at 92°C improved the percentage of gas (CO and H2) utilization, yields of ethanol and acetic acid, ethanol productivity when compared to cells that were heat shocked at 75°C and the cells that were not heat treated. By increasing the headspace gas, cell mass and ethanol concentrations increased by 160% and 181% respectively and the ethanol productivity increased by 865% when compared to the cells that were grown with the normal headspace.