effect of dietary linolenic acid (18:3n–3)/linoleic acid ... · pdf filekeywords:...
TRANSCRIPT

Iranian Journal of Fisheries Sciences 13(1) 185-200 2014
Effect of dietary linolenic acid (18:3n–3)/linoleic acid (18:2n–6)
ratio on growth performance, tissue fatty acid profile and
histological alterations in the liver of juvenile Tor tambroides
Ramezani Fard, E.١; Salleh Kamarudin. M,٢*; Ehteshami, F.
2,3;
Shakiba Zadeh, S. 2; Roos Saad, C.
2; Zokaeifar, H.
2
Received: February 2013 Accepted: May 2013
Abstract
This study was conducted to determine optimal ratios of dietary linolenic acid (18:3n-3,
LnA) to linoleic acid (18:2n-6, LA) for Tor tambroides. Juveniles were fed three trial diets
with different ratios of LnA/LA (0.0, 0.5 and 1.0) for 10 weeks. Another diet contained 100%
palm oil, which was similar tothe diet with 0.0 LnA/LA ratio but different in total amounts of
C18polyunsaturated fatty acid, was also used as a control. At the end of the experiment, no
significant difference in growth performance was observed among treatments. The overall
fatty acid composition in muscle of T. tambroides fed experimental diets was similar in terms
of saturated fatty acid and monounsaturated fatty acid. The muscle of fish fed diet with
LnA/LA ratio of 0.0 contained significantly lower (p<.05) amount of overall n-3 PUFA than
those fed the other diets. Intense accumulation of lipid in the liver parenchyma of all fish
except for those fed control diet led to severe degeneration of hepatocytes indicating fatty
liver. However, most of the hepatocytes of fish fed control diet were also swollen with nuclei
migrated. T. tambroides fed diet with LnA/LA ratio of 0.0 showed degenerated enterocytes
with an epithelium with disrupted edges. In conclusion, using vegetable oils contained high
level of either LA or LnA in T. tambroides diet seemed to have no advantage over using palm
oil contained high level of saturated fatty acid.
Keywords: Omega-3, Nutrition, Fatty acid, Malaysian mahseer, Tor tambroides
١-Department of Marine Biology, Graduate School of Marine Science and Technology, Science and Research
Branch, Islamic Azad University, Tehran, Iran
٢-Department of Aquaculture, Faculty of Agriculture, Universiti Putra Malaysia, 43400 Serdang, Selangor,
Malaysia
3-Iranian Fisheries Research Organization, P.O.Box: 13185-116, Tehran, Iran
* Corresponding author’s email: [email protected]
Dow
nloa
ded
from
jifr
o.ir
at 1
4:22
+04
30 o
n T
hurs
day
Apr
il 19
th 2
018

186 Ramezani-Fard et al., Effect of Dietary Linolenic Acid (18:3n–3)/Linoleic Acid...
Introduction
Fish cannot synthesize de novo
polyunsaturated fatty acids (PUFAs) due to
lack of ∆12 and ∆15 desaturase enzymes, but
requires obtaining these fatty acids through
the diet (Tanet al., 2009). In fish nutrition,
provision of adequate amounts of correct
PUFAs is quite important in order to meet the
requirements for normal growth and
development as well as maintenance of
cellular structure and function. Since almost
all freshwater species studied so far could
bio-convert linolenic acid (LnA, 18:3 n-3) to
eicosapentaenoic acid (20:5 n-3) and
docosahexaenoic acid (22:6 n-3), and could
also bio-convert linoleic acid (LA, 18:2 n-6)
to arachidonic acid (20:4 n-6), the PUFA
requirements of freshwater teleosts may be
generally met by LA and LnA (Sargentet al.,
2002). These fatty acids, therefore, can be
considered as true essential fatty acid in
freshwater fish (Tanet al., 2009). Better
understanding of essential fatty acid
nutritional roles and interactions may lead to
produce a more efficient fish oil deprived
diet (Senadheera et al., 2010).
Although LnA and LA have been
considered as the essential fatty acid for
freshwater teleost, not both of these fatty
acids are needed for all the freshwater fish.
The species such as salmonids and whitefish
require mainly n-3 PUFA while tilapia is one
of the few fish require only LA (Sargent et
al., 2002). Earlier studies have been shown
that carp needs both LnA and LA fatty acids
and its optimal growth is obtained with a diet
containing 1% LnA and 1% LA (Henderson
and Tocher, 1987). There is a permanent
competition between the n-3 and n-6 PUFAs
for using the elongase and desaturase
enzymes (Jankowskaet al., 2010). Therefore,
precise requirements of LnA and LA are
determined not only by the absolute amounts
of each fatty acid, but also by the optimal
balance between them. The optimal LnA/LA
ratio has recently been studied for some
freshwater teleosts such as silver perch,
Bidyanus bidyanus (Smithet al., 2004),
yellow catfish, Pelteobagrus fulvidraco
(Tanet al., 2009) and Murray cod,
Maccullochella peelii peelii (Senadheeraet
al., 2010). A diet rich in n-6 PUFA affects
liver lipid deposition in some fish. It is
shown that the increase of liver lipid
deposition can be considered as a main
indication of imbalance dietary n-3/n-6 ratio
(Robainaet al., 1998). Fish oil substitution
with vegetable oil usually lowers the
percentage of n-3 PUFA in fish tissues.
However, the rate of this reduction is highly
influenced by the LnA/LA ratio in the diet
(Senadheeraet al., 2010).
The Malaysian mahseer, Tor
tambroides (Bleeker) is one of the most
valued and sought after species of mahseer,
Tor spp. (Ramezani-Fard et al., 2011a). The
culture of this species has recently been
initiated to meet the high demand for T.
tambroides in Southeast Asia. Accordingly,
efforts have been made to formulate a
suitable diet, which can provide good health
and optimal growth for fish as well as high
quality fillet composition for human
consumers. The aim of the present study was
to evaluate the effect of different LnA to LA
Dow
nloa
ded
from
jifr
o.ir
at 1
4:22
+04
30 o
n T
hurs
day
Apr
il 19
th 2
018
Iranian Journal of Fisheries Sciences 13(1) 2014 187
ratios on growth performance, body proximate composition, tissue histology, and
liver and muscle fatty acid profile of juvenile
Malaysian mahseer.
Materials and methods
Three isonitrogenous and isolipidic
diets containing 40% crude protein and 5-6%
crude lipid (Ramezani-Fard et al., 2012a)
were formulated to contain different LnA/LA
ratios. Linseed oil as the primary source of
LnA and sunflower oil as the primary source
of LA were mixed with palm oil in different
ratio in order to produce the oil mixtures with
different ratio of LnA/LA (0.0, 0.5 and 1.0).
A diet contained 100% palm oil was also
used as a control (CD). Diets CD and D0
were similar in LnA/LA ratio but different in
total amounts of C18 PUFA. There were at
least 1.1% n-3 long chain polyunsaturated
fatty acid (n-3 LC-PUFA) residues derived
from fishmeal in all the diets. Proximate and
fatty acid compositions of the experimental
diets are presented in Table 1.
Table 1: Feed ingredients and chemical and fatty acid compositions of the experimental
diets
Ingredient (% diet) Diet*
CD D0 D0.5 D1.0
Fish meal (Malaysian)a
23.0 23.0 23.0 23.0
Soy meal 50.0 50.0 50.0 50.0
Corn meal 21 21 21 21
Palm oil 3.0 1.5 1.5 1.5
Sunflower oil 0.0 1.5 0.7 0.0
Linseed oil 0.0 0.0 0.8 1.5
Vitamin premixb 2.0 2.0 2.0 2.0
Mineral premixc 1.0 1.0 1.0 1.0
Proximate analysis (% as fed basis)
Crude protein 38.6 38.8 39.2 38.1
Crude lipid 6.7 6.9 6.5 6.8
Ash 9.7 9.7 9.7 9.8
Carbohydratesd 33.5 33.4 33.6 33.6
Moisture 11.4 11.3 10.9 11.6
Gross energy (kJ g-1) 18.0 18.0 18.2 18.1
Fatty acid composition (% of total fatty acid)
14:0 1.0 0.9 0.7 0.8
16:0 31.0 22.6 23.1 21.4
Dow
nloa
ded
from
jifr
o.ir
at 1
4:22
+04
30 o
n T
hurs
day
Apr
il 19
th 2
018

188 Ramezani-Fard et al., Effect of Dietary Linolenic Acid (18:3n–3)/Linoleic Acid...
Continue Table 1:
16:1n-7 0.7 0.7 0.8 0.6
18:0 4.9 5.0 4.8 4.3
18:1n-9 34.4 30.8 29.2 26.2
18:2n-6 24.6 36.0 26.5 23.6
18:3n-3 1.4 1.7 12.7 21.2
20:0 0.8 0.7 0.7 0.5
20:1n-9 0.4 0.4 0.3 0.3
20:5 n-3 0.4 0.4 0.6 0.3
22:1n-11 0.2 0.1 0.0 0.1
22:6n-3 0.7 0.8 0.7 0.8
∑ SFA 37.7 29.2 29.2 27.1
∑ MUFA 35.3 31.9 30.3 27.1
∑ n-3 PUFA 2.5 2.9 14.0 22.2
∑ n-6 PUFA 24.6 36.0 26.5 23.6
Total C18 PUFA 26 37.7 39.1 44.8
n-3/ n-6 0.1 0.1 0.5 0.9
LnA/LAe
0.06 0.04 0.47 0.90
* CD, control diet; D0, diet with LnA /LA ratio of 0; D0.5, diet with LnA/LA ratio of 0.5; D1.0, diet with LnA /
LA ratio of 1.0;
a Malaysian fish meal (58% crude protein)
b Vitamin premix (g kg
-1 premix): ascorbic acid, 45; myo-inositol, 5; choline chloride, 75; niacin, 4.5; riboflavin,
1; pyridoxine, 1; thiamin mononitrate, 0.92; Ca-pantothenate, 3; retinyl acetate, 0.6; cholecalciferol, 0.083;
vitamin K menadione, 1.67; α-tocopheryl acetate (500 IU/g), 8; biotin, 0.02; folic acid, 0.09; vitamin B12, 0.001;
cellulose, 845.11
c Mineral premix (g kg
-1 premix): KCL, 90; KI, 0.04; CaHPO4.2H2O, 500; NaCl, 40; CuSO4.5H2O, 3;
ZnSO4.7H2O, 4; CoSO4, 0.02; FeSO4 7H2O, 20; MnSO4.H2O, 3; CaCo3, 215; MgOH, 124; Na2SeO3,0.03; NaF, 1
d Carbohydrates = Dry matter – [protein + lipid + ash]
e Linolenic acid/linoleic acid ratio
Domesticated wild caught juveniles T.
tambroides were obtained from a local supplier
and acclimatized to laboratory condition in
aquaculture experimental station for two
weeks. Fish were fed a practical diet contained
40% crude protein and 5% crude fat during
acclimatization. A total of 120 juveniles (initial
weight of 3.5 ± 0.4 g; mean ± S.D) were then
randomly distributed into 12 rectangular
shaped glass aquaria, filled with 65L
dechlorinated public utility water and equipped
with a biofilteration system (flow rate of
approximately 3 L / min). Water quality was
checked two times per week. Oxygen level
Dow
nloa
ded
from
jifr
o.ir
at 1
4:22
+04
30 o
n T
hurs
day
Apr
il 19
th 2
018
Iranian Journal of Fisheries Sciences 13(1) 2014 189
was maintained above 7 mg/L. Temperature
ranged from 27.8 to 29.3 °C and pH ranged
8.1 to 8.7. The ammonia (NH3+) level was
always below 0.01 mg/L and photoperiod was
left at natural condition. Three replicate groups
of fish were fed to visual satiety twice a day
(0900 and 1600 h). The experiment was
conducted for 10 weeks. Fish in each aquarium
were batch-weighed at the start and end of the
experiment as well as every two weeks.
At the end of the experiment, weight
gain (WG), specific growth rate (SGR) and
feed conversion ratio (FCR) were estimated
using the following formulae. Six fish per
treatment (two per replicate) were sacrificed,
weighed, and stored at -80 °C for subsequent
whole-body proximate analysis. Six more fish
per treatment (two per replicate) were
sacrificed, individually weighed, and dissected
in order to determine the hepato-somatic index
(HSI) and viscera-somatic index (VSI). The
dissected fish were subsequently dressed and
muscle from the area between the lateral and
dorsal line was removed. The liver and muscle
samples were immediately stored at -80 °C for
further fatty acid analyses.
WG = Final Body Weight – Initial Body
Weight
SGR = [(ln final mean weight – ln initial mean
weight) / experimental days]×100
FCR = dry feed intake (g) / wet weight gain (g)
HSI = 100 × liver weight (g) / body weight (g)
VSI = 100 × visceral weight (g) / body weight
(g)
Prior to biochemical analysis, the whole-
body and fillet of fish were lyophilized in
triplicate groups per sample for 48 h and the
lost moisture was calculated. The crude protein
of experimental diets and whole-body of fish
samples were determined by the Kjeldahl
method and the crude lipid were determined by
ether extraction with the Soxtec system
(Association of Official Analytical Chemists,
AOAC, 1997). The ash content was
determined by incinerating the dry samples at
600 °C for 4 h and the gross energy of diet
determined by direct combustion in an
adiabatic bomb calorimeter.
For fatty acid analysis, lipid were
extracted from feed, liver, and lyophilized
fillet with a chloroform:methanol (2:1 v:v)
mixture (Folchet al., 1957). After a series of
liquid / liquid phase separation, centrifugation,
and evaporation under nitrogen the lipid
fraction was methylated. Fatty acid methyl
esters (FAMEs) were then injected into a gas
chromatograph (Agilent 7890N) fitted with a
fused silica capillary column (Supelco SP-
2330: 30 m in length, 0.25 mm in diameter,
and 0.20 µm in film thickness) and a flame
ionization detector. Fatty acid profiles were
identified by comparing the relative retention
times with 37 components FA mix standards
(Supelco, USA) and menhaden oil, and
expressed as the area percentage of total fatty
acids.
Three fish per treatment were also
sacrificed and dissected and their visceral
organs including liver were extracted. The
extracted tissues were fixed in Bouin’s
solution at room temperature for 24 h, then
washed and stored in 70% ethanol until the
Dow
nloa
ded
from
jifr
o.ir
at 1
4:22
+04
30 o
n T
hurs
day
Apr
il 19
th 2
018

190 Ramezani-Fard et al., Effect of Dietary Linolenic Acid (18:3n–3)/Linoleic Acid...
wax embedding (Ramezani-Fard et al., 2011b).
Serial 5µm sections were prepared, stained
with haematoxylin-eosin and slides were
examined under a light microscopy (Zeiss
Primo Star) fitted with a digital camera (Canon
A640).
All the experimental data were reported
in mean ± SE and subjected to a one-way
ANOVA. The mean differences were
evaluated using Duncan’s Multiple Range test.
Percentage data were arcsin transformed when
necessary before being statistically analyzed.
Statistical analysis was carried out using SPSS
15 for Windows (SPSS Inc., Chicago, IL) and
the difference was considered significant at
p<.05.
Results
No significant differences (p>.05) were
observed in weight gain, SGR, FCR and HSI
of fish fed different experimental diets at the
end of the experiment (Table 2). The VSI
values, however, were significantly decreased
(p<.05) with the increase of dietary LnA/LA
ratio.
Table 2: Growth performance and body indices of T. tambroides juvenile fed the experimental
diet for 10 weeks
Parameters Diet*
CD D0 D0.5 D1.0
IW1
3.4 ± 0.2 3.4 ± 0.1 3.8 ± 0.2 3.6 ± 0.3
FW2
7.1 ± 0.3 6.8 ± 0.3 6.9 ± 0.1 7.0 ± 0.2
WG3 (g) 5.2 ± 0.2 5.3 ± 0.5 5.5 ± 0.1 5.3 ± 0.5
WG (%) 109.8 ± 8.9 102.7 ± 5.8 81.4 ± 6.0 96.9 ± 9.9
SGR4 (% day-1) 1.1 ± 0.1 1.0 ± 0.0 0.8 ± 0.1 1.0 ± 0.1
FCR5 1.8 ± 0.0 1.6 ± 0.1 1.7 ± 0.1 1.7 ± 0.1
HSI6 2.0 ± 0.1 2.2 ± 0.0 2.2 ± 0.0 2.0 ± 0.1
VSI7 9.9 ± 0.3
a 8.8 ± 0.4
ab 8.1 ± 0.5
b 7.9 ± 0.5
b
Mean ± SE (n=3); Values within the same row with different superscript are significantly different at p<.05
* See Table 1 for diet abbreviations
1 Initial body weight (g)
2 Final body weight (g)
3 Weight gain
4 Specific growth rate
5 Feed conversion ratio
6 Hepato-somatic index
7 Viscera-somatic index
Dow
nloa
ded
from
jifr
o.ir
at 1
4:22
+04
30 o
n T
hurs
day
Apr
il 19
th 2
018

Iranian Journal of Fisheries Sciences 13(1) 2014 191
Table 3: Whole body proximate composition and muscle lipid content (% wet weight) of
juveniles T. tambroides fed the test diets for 10 weeks.
Diet*
CD D0 D0.5 D1.0
Moisture 68.4 ± 0.3 68.3 ± 0.3 68.2 ± 0.5 68.4 ± 0.7
Protein 15.5 ± 0.1a
15.8 ± 0.2ab
14.5 ± 0.2c
15.9 ± 0.1b
Fat 12.5 ± 0.1a
11.5 ± 0.2b
13.4 ± 0.2c
11.7 ± 0.2b
Ash 3.6 ± 0.2
3.3 ± 0.1 3.6 ± 0.2 3.6 ± 0.1
Muscle fat 3.7 ± 0.2a
3.3 ± 0.2b
3.7 ± 0.1a
3.2 ± 0.1b
Mean ± SE; n=3; Values within the same row with different superscript are significantly different at p<.05.
* See Table 1 for diet abbreviations
Table 4: Fatty acid composition (% of total fatty acid) of muscle tissue of juveniles T. tambroides
fed the test diets for 10 weeks.
Fatty acid
Diet*
CD D0 D0.5 D1.0
14:0 2.9 ± 0.1 3.1 ± 0.1 2.9 ± 0.3 3.1 ± 0.1
16:0 29.3 ± 0.3 28.8 ± 0.5 28.1 ± 0.4 29.2 ± 0.2
16:1n-7 3.7 ± 0.2 3.6 ± 0.2 4.2 ± 0.3 4.3 ± 0.5
18:0 9.0 ± 0.3 8.3 ± 0.3 8.5 ± 0.5 8.5 ± 0.4
18:1n-9 31.6 ± 0.8 32.3 ± 1.1 30.5 ± 0.6 32.2 ± 0.3
18:2n-6 10.8 ± 0.4a 13.7 ± 0.4b 13.0 ± 0.3b 11.1 ± 0.4a
18:3n-3 1.4 ± 0.2a
1.1 ± 0.1a
2.5 ± 0.0b
3.5 ± 0.1c
20:1n-9 1.3 ± 0.0 1.4 ± 0.1 1.4 ± 0.1 1.4 ± 0.1
22:0 1.4 ± 0.0a
1.4 ± 0.2a
1.2 ± 0.1ab
0.8 ± 0.1b
22:1n-11 2.3 ± 0.3 2.1 ± 0.2 2.3 ± 0.2 1.4 ± 0.1
20:5n-3 1.0 ± 0.0a
0.6 ± 0.1b
1.0 ± 0.0a
0.9 ± 0.0a
Dow
nloa
ded
from
jifr
o.ir
at 1
4:22
+04
30 o
n T
hurs
day
Apr
il 19
th 2
018
192 Ramezani-Fard et al., Effect of Dietary Linolenic Acid (18:3n–3)/Linoleic Acid...
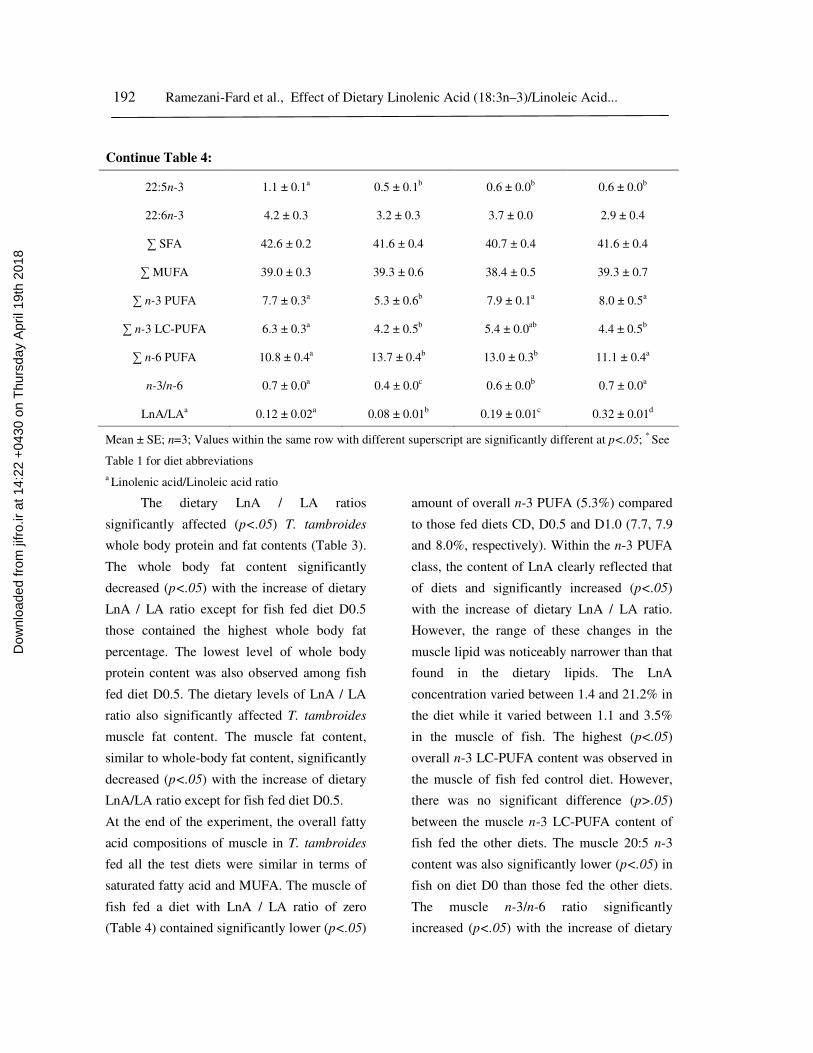
Continue Table 4:
22:5n-3 1.1 ± 0.1a
0.5 ± 0.1b
0.6 ± 0.0b
0.6 ± 0.0b
22:6n-3 4.2 ± 0.3 3.2 ± 0.3 3.7 ± 0.0 2.9 ± 0.4
∑ SFA 42.6 ± 0.2 41.6 ± 0.4 40.7 ± 0.4 41.6 ± 0.4
∑ MUFA 39.0 ± 0.3 39.3 ± 0.6 38.4 ± 0.5 39.3 ± 0.7
∑ n-3 PUFA 7.7 ± 0.3a
5.3 ± 0.6b
7.9 ± 0.1a
8.0 ± 0.5a
∑ n-3 LC-PUFA 6.3 ± 0.3a
4.2 ± 0.5b
5.4 ± 0.0ab
4.4 ± 0.5b
∑ n-6 PUFA 10.8 ± 0.4a 13.7 ± 0.4b 13.0 ± 0.3b 11.1 ± 0.4a
n-3/n-6 0.7 ± 0.0a
0.4 ± 0.0c
0.6 ± 0.0b
0.7 ± 0.0a
LnA/LAa
0.12 ± 0.02a
0.08 ± 0.01b
0.19 ± 0.01c
0.32 ± 0.01d
Mean ± SE; n=3; Values within the same row with different superscript are significantly different at p<.05; * See
Table 1 for diet abbreviations
a Linolenic acid/Linoleic acid ratio
The dietary LnA / LA ratios
significantly affected (p<.05) T. tambroides
whole body protein and fat contents (Table 3).
The whole body fat content significantly
decreased (p<.05) with the increase of dietary
LnA / LA ratio except for fish fed diet D0.5
those contained the highest whole body fat
percentage. The lowest level of whole body
protein content was also observed among fish
fed diet D0.5. The dietary levels of LnA / LA
ratio also significantly affected T. tambroides
muscle fat content. The muscle fat content,
similar to whole-body fat content, significantly
decreased (p<.05) with the increase of dietary
LnA/LA ratio except for fish fed diet D0.5.
At the end of the experiment, the overall fatty
acid compositions of muscle in T. tambroides
fed all the test diets were similar in terms of
saturated fatty acid and MUFA. The muscle of
fish fed a diet with LnA / LA ratio of zero
(Table 4) contained significantly lower (p<.05)
amount of overall n-3 PUFA (5.3%) compared
to those fed diets CD, D0.5 and D1.0 (7.7, 7.9
and 8.0%, respectively). Within the n-3 PUFA
class, the content of LnA clearly reflected that
of diets and significantly increased (p<.05)
with the increase of dietary LnA / LA ratio.
However, the range of these changes in the
muscle lipid was noticeably narrower than that
found in the dietary lipids. The LnA
concentration varied between 1.4 and 21.2% in
the diet while it varied between 1.1 and 3.5%
in the muscle of fish. The highest (p<.05)
overall n-3 LC-PUFA content was observed in
the muscle of fish fed control diet. However,
there was no significant difference (p>.05)
between the muscle n-3 LC-PUFA content of
fish fed the other diets. The muscle 20:5 n-3
content was also significantly lower (p<.05) in
fish on diet D0 than those fed the other diets.
The muscle n-3/n-6 ratio significantly
increased (p<.05) with the increase of dietary
Dow
nloa
ded
from
jifr
o.ir
at 1
4:22
+04
30 o
n T
hurs
day
Apr
il 19
th 2
018

Iranian Journal of Fisheries Sciences 13(1) 2014 193
LnA/LA. However, there were no significant
differences (p>.05) between the muscle n-3/n-
6 ratios of fish fed control diet and those on
diet D1.0. The muscle LnA/LA ratios simply
reflected this ratio in the diets.
Similar to the muscle, the overall
saturated fatty acid and MUFA contents of T.
tambroides liver were not significantly
different (p>.05) at the end of the experiment
(Table 5). However, within the MUFA class,
liver 20:1 n-9 and 22:1 n-11 levels
significantly decreased (p<.05) with the
increase of dietary LnA/LA ratios except for
the 22:1 n-11 of fish on diet D1.0. The liver n-
3 PUFA concentrations varied from 1.7% in
fish on diet D0 to 6.0% in those fed diet D1.0.
The concentrations were greatly enhanced by
increasing dietary LnA/LA ratio. However,
there was no significant difference (p>.05)
between fish on control diet and those on a
D0.5. Within the n-3 PUFA class, the content
of LnA noticeably reflected the LnA content of
diets. The liver LnA / LA ratio also increased
significantly (p<.05) with the increase of
dietary LnA/LA ratio. However, the ranges of
LnA concentration were clearly narrower in
the livers (0 – 2.1) than the diets (1.4 – 21.2).
The highest liver 20:5 n-3 and 22:6 n-3
concentrations observed in fish fed diet D1.0,
followed by those fed control diet. The lowest
liver contents of these fatty acids were
observed among fish on diets D0 and D0.5.
Liver parenchyma of T. tambroides fed control
diet is shown in Fig. 1. Most of the hepatic
cells were swollen, with a roundish polygonal
cell body containing a clear spherical nucleus.
A number of hepatocytes with nuclei migrated
due to lipid accumulation were also observed.
Lipid accumulation led to the degeneration in
few of the hepatocytes.
Table 5: Fatty acid composition (% of total fatty acid) of liver tissue of juveniles T.
tambroides fed the test diets for 10 weeks.
Fatty acid Diet*
CD D0 D0.5 D1.0
14:0 3.4 ± 0.2a
4.2 ± 0.1b
3.4 ± 0.0a
3.6 ± 0.1a
16:0 27.9 ± 0.9 28.9 ± 0.3 28.6 ± 0.6 27.7 ± 0.7
16:1n-7 4.7 ± 0.3 4.2 ± 0.1 4.8 ± 0.0 3.9 ± 0.3
18:0 11.2 ± 0.6a
8.9 ± 0.5b
9.5 ± 0.2b
9.4 ± 0.5b
18:1n-9 34.5 ± 1.3 37.7 ± 0.9 39.2 ± 1.1 38.7 ± 1.4
18:2n-6 7.3 ± 0.1ab
8.0 ± 0.4a
8.5 ± 0.6a
6.5 ± 0.3b
18:3n-3 0
0
1.4 ± 0.1a
2.1 ± 0.0b
20:1n-9 1.8 ± 0.1a 1.6 ± 0.2ab 1.5 ± 0.1b 1.2 ± 0.1c
Dow
nloa
ded
from
jifr
o.ir
at 1
4:22
+04
30 o
n T
hurs
day
Apr
il 19
th 2
018
194 Ramezani-Fard et al., Effect of Dietary Linolenic Acid (18:3n–3)/Linoleic Acid...
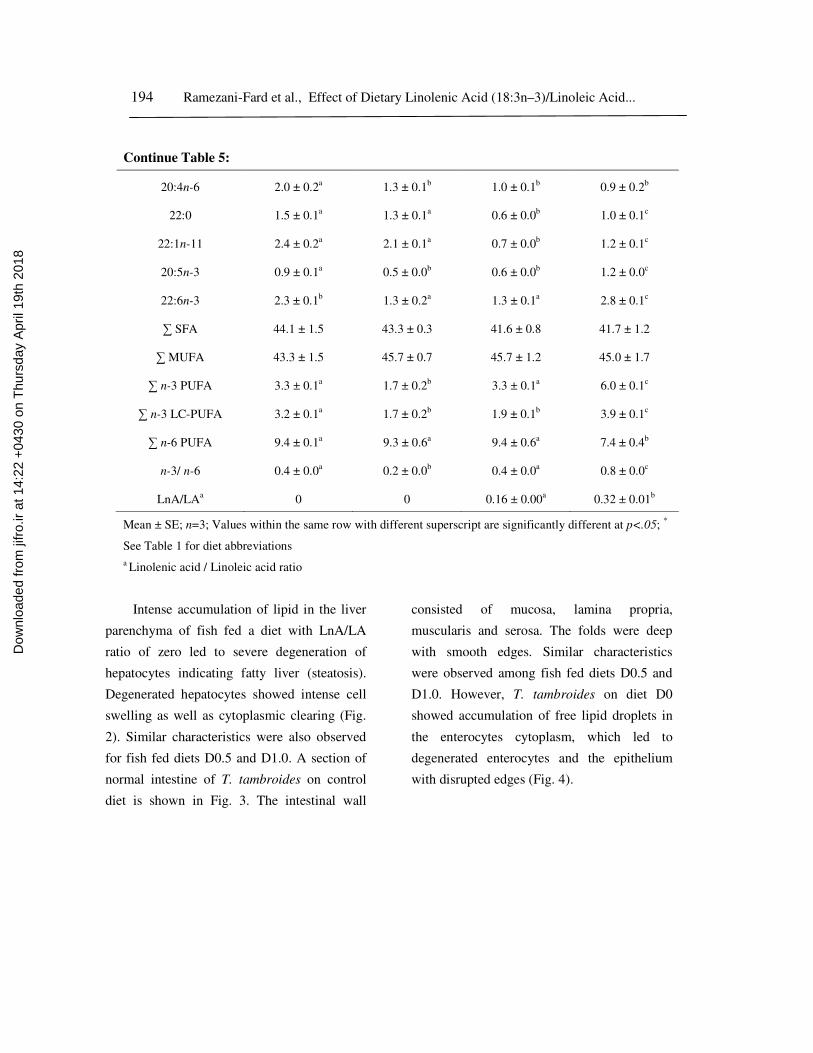
Continue Table 5:
20:4n-6 2.0 ± 0.2a
1.3 ± 0.1b
1.0 ± 0.1b
0.9 ± 0.2b
22:0 1.5 ± 0.1a
1.3 ± 0.1a
0.6 ± 0.0b
1.0 ± 0.1c
22:1n-11 2.4 ± 0.2a
2.1 ± 0.1a
0.7 ± 0.0b
1.2 ± 0.1c
20:5n-3 0.9 ± 0.1a 0.5 ± 0.0b 0.6 ± 0.0b 1.2 ± 0.0c
22:6n-3 2.3 ± 0.1b
1.3 ± 0.2a
1.3 ± 0.1a
2.8 ± 0.1c
∑ SFA 44.1 ± 1.5 43.3 ± 0.3 41.6 ± 0.8 41.7 ± 1.2
∑ MUFA 43.3 ± 1.5 45.7 ± 0.7 45.7 ± 1.2 45.0 ± 1.7
∑ n-3 PUFA 3.3 ± 0.1a
1.7 ± 0.2b
3.3 ± 0.1a
6.0 ± 0.1c
∑ n-3 LC-PUFA 3.2 ± 0.1a
1.7 ± 0.2b
1.9 ± 0.1b
3.9 ± 0.1c
∑ n-6 PUFA 9.4 ± 0.1a 9.3 ± 0.6a 9.4 ± 0.6a 7.4 ± 0.4b
n-3/ n-6 0.4 ± 0.0a
0.2 ± 0.0b
0.4 ± 0.0a
0.8 ± 0.0c
LnA/LAa
0
0
0.16 ± 0.00a
0.32 ± 0.01b
Mean ± SE; n=3; Values within the same row with different superscript are significantly different at p<.05; *
See Table 1 for diet abbreviations
a Linolenic acid / Linoleic acid ratio
Intense accumulation of lipid in the liver
parenchyma of fish fed a diet with LnA/LA
ratio of zero led to severe degeneration of
hepatocytes indicating fatty liver (steatosis).
Degenerated hepatocytes showed intense cell
swelling as well as cytoplasmic clearing (Fig.
2). Similar characteristics were also observed
for fish fed diets D0.5 and D1.0. A section of
normal intestine of T. tambroides on control
diet is shown in Fig. 3. The intestinal wall
consisted of mucosa, lamina propria,
muscularis and serosa. The folds were deep
with smooth edges. Similar characteristics
were observed among fish fed diets D0.5 and
D1.0. However, T. tambroides on diet D0
showed accumulation of free lipid droplets in
the enterocytes cytoplasm, which led to
degenerated enterocytes and the epithelium
with disrupted edges (Fig. 4).
Dow
nloa
ded
from
jifr
o.ir
at 1
4:22
+04
30 o
n T
hurs
day
Apr
il 19
th 2
018

Iranian Journal of Fisheries Sciences 13(1) 2014 195
Figure1: Histological appearance of the liver of fish fed control diet showed mild lipid
accumulation after 10 weeks. scale bar = 50µm; HC, swollen hepatocytes; MN,
hepatocytes with migration of nuclei; DH, degenerated hepatocytes
Figure 2: Histological appearance of fatty liver of fish fed diet with LnA/LA ratio of 0 showed an
intense degeneration of hepatocytes (DH). scale bar = 50µm
Dow
nloa
ded
from
jifr
o.ir
at 1
4:22
+04
30 o
n T
hurs
day
Apr
il 19
th 2
018

196 Ramezani-Fard et al., Effect of Dietary Linolenic Acid (18:3n–3)/Linoleic Acid...
Figure 3: Normal intestine wall in fish on control diet. scale bar = 50µm
Figure 4: Lipid vacuoles in the enterocytes of T. tambroides on diet with LnA / LA ratio of 0.
scale bar = 50µm.
Discussion
Our earlier studies have shown that a diet
containing either 50% or 100% linseed oil with
an n-3/n-6 ratio of above 1.0, compared to a
diet containing 100% palm oil as the oil
source, do not improve the growth
performance of T. tambroides (Kamarudin et
al., 2012). However, the effects of n-3/n-6
ratios lower than 1.0 is rather confusing. This
experiment was designed to investigate the
effects of the dietary n-3/n-6 ratio lower than
1.0, specifically the underlying effect of LnA
and LA, on the growth performance, tissue
fatty acid profile and histology of Malaysian
mahseer. The results revealed that increasing
dietary LnA/LA ratio up to 1.0 did not improve
the growth performance of T. tambroides.
However, the best growth performance of
juvenile yellow catfish, Pelteobragus
fulvidraco, is achieved at dietary LnA/LA ratio
of 1.17, while decreasing the ratio to 0.35
severely decreases the weight gain and SGR
(Tanet al., 2009). In contrast, Senadheera et al.
Dow
nloa
ded
from
jifr
o.ir
at 1
4:22
+04
30 o
n T
hurs
day
Apr
il 19
th 2
018
Iranian Journal of Fisheries Sciences 13(1) 2014 197
(2010) observed no significant difference
between growth performances of Murray cod
fed different LnA / LA ratios from 0.3 to 2.9
after a 74-days experimental period. Good
growth performances of fish fed different
dietary LnA/LA levels in this study suggested
that either n-3 PUFA is not an essential fatty
acid for growth performance of T. tambroides
or the essential n-3 PUFA can be met by the
residual LC-PUFA from fishmeal. Both
control diet and D0 were similar in LnA/LA
and n-3/n-6 ratios and different in the amounts
of LA. The lack of significant difference
between fish fed these two diets confirmed that
excess amount of LA from sunflower oil
cannot improve the growth performance of T.
tambroides.
The higher VSI value in fish fed low
dietary LnA / LA ratio suggesting larger size
of the epididymal fat in these fish than the
other experimental fish. Reduction of whole
body fat content with the increase of LnA / LA
ratio may support this notion. However, the
increased whole body fat content in fish fed
diet D0.5 was also associated with the increase
of fat content of muscle in this group of fish.
Fluctuation in muscle fat content indicated that
lipid deposition in muscle of T. tambroides
was influenced by dietary LnA / LA ratio.
Similar to mahseer, lipid deposition in muscle
of yellow catfishis also influenced by dietary
n-3/n-6 ratio (Tanet al., 2009). However, there
is no direct relationship between muscle fat
content and dietary n-3/n-6 ratio in tench,
Tinca tinca (Turchiniet al., 2007).
The LnA and LA contents of fish tissues
directly reflected those amounts in the diets.
Increased levels of tissue LnA concentration
were associated with the increase of LnA / LA
ratio in the diet. However, the C18 PUFA levels
were clearly lower in all fish tissues than the
diets, indicating this PUFA class tended to be
more catabolised or bio-converted by T.
tambroides. Selective depletion of LnA in the
tissue has been observed in other freshwater
species such as yellow catfish (Tanet al., 2009)
and Murray cod (Senadheera et al., 2010).
However, the LA can be deposited in the
tissues of fish fed a high LA diet (Trushenskiet
al., 2008; Senadheeraet al., 2010). The
depletion or deposition of a specific C18 PUFA
appeared to be species and/or diet dependant
characteristics. Franciset al. (2009) found that
∆-6 desaturase activity of fish fed high amount
of C18 PUFA have a greater tendency to act on
LnA rather than LA, while a reduction of
dietary C18 PUFA shifted the substrate
preference of ∆-6 desaturase from LnA to LA.
Accordingly, T. tambroides fed the diet with
highest LnA / LA ratio (1.0) and highest
amounts of C18 PUFA had a significant trend
to the increase of liver n-3 LC-PUFA
percentage, which may show active elongation
and desaturation of LnA to longer chain n-3
LC-PUFA in these fish. Lack of similar n-3
LC-PUFA elevation in the muscle was
probably due to low concentrations of very
low-density lipoproteins (VLDL), a major
vehicle complex for transporting lipids from
the liver to the other tissues (Sheridan, 1988;
Nantonet al., 2001; Martinset al., 2007). Low
Dow
nloa
ded
from
jifr
o.ir
at 1
4:22
+04
30 o
n T
hurs
day
Apr
il 19
th 2
018
198 Ramezani-Fard et al., Effect of Dietary Linolenic Acid (18:3n–3)/Linoleic Acid...
concentration of VLDL could consequently
caused accumulation and deposition of the n-3
LC-PUFA in the liver of fish fed a diet with
LnA / LA ratio of 1.0.
Total n-3 PUFA content of muscle
increased with the increase of LnA / LA ratio
in the diet. However, such elevation was a
direct reflection of increased LnA content in
the diet. Interestingly, muscle total n-3 LC-
PUFA content was significantly higher in fish
on the control diet with a LnA / LA ratio of
0.06 than the other diets. Control diet had a
total saturated fatty acids and MUFA amounts
of 73% (of total fatty acid) while in the other
diets, there were a total of 54.2 - 61.1% of
saturated fatty acids and MUFAs classes.
Adequate amounts of dietary saturated fatty
acid and MUFA have been recommended to
spare and maintain the level of n-3 PUFAs in
the tissues of freshwater fish (Mishra and
Samantaray, 2004). This recommendation has
been confirmed in T. tambroides by our earlier
study (Ramezani-Fard et al., 2012b).
Therefore, a balanced saturated fatty acid to n-
3 LC-PUFA ratio in the diet of T. tambroides
seems to be more important for optimizing the
tissue fatty acid profiles of fish than the n-3/n-
6 ratio.
Within the hepatocytes, free fatty acids
may be either oxidized for energy production
or converted to phospholipids and cholesterol
esters. Remaining fatty acids are then esterified
to triglycerides, forming very low density or
low-density lipoproteins and are released into
the plasma to be transferred to the other
tissues. The presence of excessive lipid within
the liver is termed as fatty liver or steatosis and
it occurs when the rate of triglyceride
accumulation inside the hepatocytes is more
than the rate of fatty acid catabolism or fatty
acid releasing into plasma (McGavinet al.,
2000). In this experiment, fish fed control diet
showed a moderate fatty liver while fish on the
other diets had intense steatosis. Similarly,
gilthead seabream, Sparus aurata showsslight
to intense levels of lipid accumulation and
steatosis when 70% of fish oil in its diet is
substituted with palm oil, rapeseed oil or soy
oil (Fountoulakiet al., 2009). An insufficient
amount of dietary essential fatty acid increases
the rate of de novo fatty acid synthesis as well
as reduces the rate of fatty acid removal from
the liver into the circulation (Farkas et al.,
1978). The higher rate of lipid synthesis in the
liver together with the lower amount of fatty
acid removal to blood stream increases the rate
of lipid accumulation in the liver. However,
intense lipid accumulation in the liver of fish
fed diet with LnA/LA ratio of 1.0 (with high
amounts of n-3 PUFA) may be associated with
the low concentrations of VLDL as described
above.
The pathogenic effects of steatosis are
not well understood yet. Many researchers
believe that fatty liver condition is a
physiological state due to an imbalanced diet
and it is reversible through a balanced diet
(Segner and Witt, 1990; Caballeroet al., 2004).
However, some researchers emphasized the
pathological characteristics of steatosis and
cautioned that, this hepatocyte disturbance
would lead to liver necrosis in the long-term if
the diet is not corrected (Storch et al., 1984;
Mosconi-Bac, 1990). Further long-term studies
are needed to confirm whether this notion is
also applicable for T. tambroides. As a
Dow
nloa
ded
from
jifr
o.ir
at 1
4:22
+04
30 o
n T
hurs
day
Apr
il 19
th 2
018

Iranian Journal of Fisheries Sciences 13(1) 2014 199
conclusion, this study showed that use of
vegetable oils with high levels of either LA or
LnA in T. tambroides diet have no advantage
over using palm oil as the dietary oil source.
However, the presence of dietary fishmeal with
residual fish oil should be noted.
Acknowledgement
This study was supported through a
Malaysian government E-Science grant no. 05-
01-04-SF0209.
References
Association of Official Analytical Chemists,
1997.Official methods of analysis.16th ed.,
Association of official analytical chemists,
Maryland.
Caballero, M.J., Izquierdo, M.S., Kjørsvik, E.,
Fernández, A.J. and Rosenlund, G., 2004.
Histological alterations in the liver of sea
bream, Sparusaurata L., caused by short- or
long-term feeding with vegetable oils. Recovery
of normal morphology after feeding fish oil as
the sole lipid source.Journal of Fish Diseases,
27, 531-541.
Farkas, T., Csengeri, I., Majoros, F. and Oláh,
J., 1978.Metabolism of fatty acids in fish. II.
biosynthesis of fatty acids in relation to diet in
the carp, Cyprinuscarpiolinnaeus 1758.
Aquaculture, 14, 57-65.
Folch, J., Lees, M. and Stanley, G. H. S., 1957.A
simple method for the isolation and purification
of total lipids from animal tissues.The Journal
of Biological Chemistry, 226, 497-509.
Fountoulaki, E., Vasilaki, A., Hurtado, R.,
Grigorakis, K., Karacostas, I., Nengas, I.,
Rigos, G., Kotzamanis, Y., Venou, B. and
Alexis, M.N., 2009. Fish oil substitution by
vegetable oils in commercial diets for gilthead
sea bream (Sparusaurata L.); effects on growth
performance, flesh quality and fillet fatty acid
profile: Recovery of fatty acid profiles by a fish
oil finishing diet under fluctuating water
temperatures. Aquaculture, 289, 317-326.
Francis, D. S., Peters, D. J. and Turchini, G. M.,
2009. Apparent in vivo ∆-6 desaturase activity,
efficiency, and affinity are affected by total
dietary C18 PUFA in the freshwater fish
Murray cod. Journal of Agricultural and Food
Chemistry, 57, 4381-4390.
Henderson, R. and Tocher, D. R., 1987. The lipid
composition and biochemistry of freshwater
fish.Progress in Lipid Research, 26, 281-347.
Jankowska, B., Zakęś, Z., śmijewski, T. and
Szczepkowski, M., 2010.Fatty acid profile of
muscles, liver and mesenteric fat in wild and
reared perch (Percafluviatilis L.).Food
Chemistry,118, 764-768.
Kamarudin, M. S., Ramezani-Fard, E., Saad, C.
R. and Harmin, S. A., 2012. Effects of dietary
fish oil replacement by various vegetable oils on
growth performance, body composition and
fatty acid profile of juvenile Malaysian
mahseer, Tor tambroides. Aquaculture
Nutrition, 18, 532-543.
Martins, D. A., Valente, L. M. P. and Lall, S. P.,
2007. Effects of dietary lipid level on growth
and lipid utilization by juvenile Atlantic halibut
(Hippoglossushippoglossus,L.). Aquaculture,
263, 150-158.
Dow
nloa
ded
from
jifr
o.ir
at 1
4:22
+04
30 o
n T
hurs
day
Apr
il 19
th 2
018

200 Ramezani-Fard et al., Effect of Dietary Linolenic Acid (18:3n–3)/Linoleic Acid...
McGavin, M. D., Carlton, W. and Zachary, J.,
2000.Thomson's special veterinary pathology,
3rd edn. Mosby Inc., St. Louis, 755P.
Mishra, K. and Samantaray, K., 2004. Interacting
effects of dietary lipid level and temperature on
growth, body composition and fatty acid profile
of rohu, Labeorohita (hamilton). Aquaculture
Nutrition, 10, 359-369.
Mosconi-Bac, N., 1990. Reversibility of artificial
feed-induced hepatocyte disturbances in
cultured juvenile sea bass
(Dicentrarchuslabrax): An ultrastructural study.
Aquaculture, 88, 363-370.
Nanton, D. A., Lall, S. P. and McNiven, M. A.,
2001. Effects of dietary lipid level on liver and
muscle lipid deposition in juvenile haddock,
Melanogrammusaeglefinus L. Aquaculture
Research, 32, 225-234.
Ramezani-Fard, E., Kamarudin, M. S., Saad, C.
R. and Harmin, S. A., 2011a.Changes over
time in muscle fatty acid composition of
Malaysian mahseer, Tor tambroides, fed
different dietary lipid percentage. African
Journal of Biotechnology, 10, 18256-18265.
Ramezani-Fard, E., Kamarudin, M. S., Harmin,
S. A., Saad, C. R., AbdSatar, M. K. and
Daud, S. K., 2011b.Ontogenic development of
the mouth and digestive tract in larval
Malaysian mahseer, Tor tambroidesbleeker.
Journal of Applied Ichthyology, 27, 920-927.
Ramezani-Fard, E., Kamarudin, M. S., Saad, C.
R., Harmin, S. A. and Meng, G. Y., 2012a.
Dietary lipid levels affect growth and fatty acid
profiles of Malaysian mahseerTor tambroides.
North American Journal of Aquaculture, 74,
530-536.
Ramezani-Fard, E., Kamarudin, M. S., Harmin,
S. A. and Saad, C. R., 2012b. Dietary saturated
and omega-3 fatty acids affect growth and fatty
acid profiles of Malaysian mahseer. European
Journal of Lipid Science and Technology, 114,
185-193.
Robaina, L., Izquierdo, M. S., Moyano, F. J.,
Socorro, J., Vergara, J. M. and Montero, D.,
1998. Increase of the dietary n−3/n−6 fatty acid
ratio and addition of phosphorus improves liver
histological alterations induced by feeding diets
containing soybean meal to gilthead seabream,
Sparusaurata. Aquaculture, 161, 281-293.
Sargent, J. R., Tocher, D. R. and Bell, J. G.,
2002. The lipids. In: J. E. Halver and R.W.
Hardy (Eds), Fish Nutrition, 3rd
edition.
Academic Press, San Diego:181-257.
Segner, H. and Witt, U., 1990. Weaning
experiments with turbot
(Scophthalmusmaximus): Electron microscopic
study of liver.Marine Biology, 105, 353-361.
Senadheera, S. P. S. D., Turchini, G. M.,
Thanuthong, T. and Francis, D. S., 2010.
Effects of dietary α-linolenic acid
(18:3n−3)/linoleic acid (18:2n−6) ratio on
growth performance, fillet fatty acid profile and
finishing efficiency in Murray cod.
Aquaculture, 309, 222-230.
Sheridan, M. A., 1988. Lipid dynamics in fish:
Aspects of absorption, transportation, deposition
and mobilization. Comparative Biochemistry
and Physiology Part B: Comparative
Biochemistry, 90, 679-690.
Smith, D. M., Hunter, B. J., Allan, G. L.,
Roberts, D. C. K., Booth, M. A. and
Glencross, B. D., 2004. Essential fatty acids in
the diet of silver perch (Bidyanusbidyanus):
Effect of linolenic and linoleic acid on growth
and survival. Aquaculture, 236, 377-390.
Dow
nloa
ded
from
jifr
o.ir
at 1
4:22
+04
30 o
n T
hurs
day
Apr
il 19
th 2
018

Iranian Journal of Fisheries Sciences 13(1) 2014 201
Storch, V., Segner, H., Juario, J. V. and Duary,
M. N., 1984. Influence of nutrition on the
hepatocytes of Chanoschanos (chanidae:
Teleostei). ZoologischerAnzeiger, 213, 151-160.
Tan, X., Luo, Z., Xie, P. and Liu, X., 2009. Effect
of dietary linolenic acid/linoleic acid ratio on
growth performance, hepatic fatty acid profiles
and intermediary metabolism of juvenile yellow
catfish Pelteobagrusfulvidraco. Aquaculture,
296, 96-101.
Trushenski, J., Lewis, H. and Kohler, C., 2008.
Fatty acid profile of sunshine bass: II. profile
change differs among fillet lipid classes. Lipids,
43, 643-653.
Turchini, G. M., Moretti, V. M., Mentasti, T.,
Orban, E. and Valfrè, F., 2007.Effects of
dietary lipid source on fillet chemical
composition, flavour volatile compounds and
sensory characteristics in the freshwater fish
tench (Tincatinca L.). Food Chemistry, 102,
1144-1155.
Dow
nloa
ded
from
jifr
o.ir
at 1
4:22
+04
30 o
n T
hurs
day
Apr
il 19
th 2
018