effect of direct liquid water injection and interdigitated flow
TRANSCRIPT

EFFECT OF DIRECT LIQUID WATER INJECTION AND INTERDIGITATED FLOW FIELD ON THE PERFORMANCE OF PROTON EXCHANGE MEMBRANE FUEL CELLS
By
David L. Wood, III, Jung S. Yi, and Trung V. Nguyen* Department of Chemical and Petroleum Engineering
University of Kansas Lawrence, Kansas 66045
Submitted as a Research Paper to ELECTROCHIMICA ACTA JOURNAL
Dr. Elton J. Cairns, North American Regional Editor Environmental Energy Technologies Division
Lawrence Berkeley National Laboratory MS 70-108B
One Cyclotron Road Berkeley, California 94720
December 2, 1997
Key Words: Proton Exchange Membrane fuel cells, humidification, gas distribution, direct
liquid water injection, interdigitated flow fields.
* Corresponding author Tel: 785-864-3938, Fax: 785-864-4967, E-mail: [email protected]

ABSTRACT
Proper water management is vital to ensuring successful performance of proton
exchange membrane fuel cells. The effectiveness of the direct liquid water injection scheme
and the interdigitated flow field design towards providing adequate gas humidification to
maintain membrane optimal hydration and alleviating the mass transport limitations of the
reactants and electrode flooding is investigated. It is found that the direct liquid water injection
used in conjunction with the interdigitated flow fields as a humidification technique is an
extremely effective method of water management. The forced flow-through-the-electrode
characteristic of the interdigitated flow field 1) provides higher transport rates of reactant and
products to and from the inner catalyst layers, 2) increases the hydration state and conductivity
of the membrane by bringing its anode/membrane interface in direct contact with liquid water,
and 3) increases the cell tolerance limits for excess injected liquid water, which could be used to
provide simultaneous evaporative cooling. Experimental results show substantial improvements
in performance as a result of these improvements.

INTRODUCTION
Proton Exchange Membrane (PEM) fuel cells are becoming more popular as direct electrical
energy conversion devices because of their high efficiency and simplicity in design and
operation made possible by the use of a proton conducting membrane as the electrolyte. Some
attractive characteristics of the PEM fuel cells include CO2 tolerance, self-starting at low
temperatures, and low-cost construction materials. The attractiveness of this fuel cell system
has increased significantly with improvements in many areas. However, the system is still not
fully optimized in terms of performance to be competitive with the principal competitor, the
combustion engine.
Improvements in the performance area can be identified by evaluating the polarization curve
of a fuel cell. See Figure 1. This curve can be separated into three regions. The sharp voltage
drop of the first region associated with the activation resistance is attributed to the type of
catalyst and the catalyst surface area that is in contact with the electrolyte and the electrical
network in the electrode and is accessible to the reacting gases. Lowering this resistance will
raise the whole polarization curve. The gradual drop in voltage of the second region, known as
the ohmic voltage loss, is attributed to the electronic, ionic and contact resistance of the
components within the electrical network of the fuel cell such as the electrodes, membrane and
current collecting components. Lowering this resistance will raise the polarization curve and
reduce the slope of the curve resulting in higher power densities at higher energy efficiencies.
The sharp voltage drop of the third region, known as the voltage loss associated with the
mass transport resistance, is attributed to concentration polarization, which occurs as a result of
the depletion of the reactant at the reaction interface as its transport to the reaction sites fails to
keep up with the reaction rate. This phenomenon is especially severe at the cathode of the fuel
cell where oxygen is the reactant because of the presence of liquid water within the porous
structure of the electrode and on the catalyst/membrane surface. This liquid water, which is the

product of the cathodic reaction and proton transport from the anode, acts as an additional
barrier to the transport of oxygen to the reaction sites. Minimizing this resistance will allow the
ohmic region to be extended resulting in much higher power densities.
Voltage loss in the first region can be reduced by using catalysts with lower activation
resistance or increasing the catalyst surface available for reaction per unit volume of electrode.
Currently, platinum is the best catalyst available. Efforts of sputtering the catalyst onto the
surface of the electrode that is later hot pressed onto the membrane and mixing the catalyst-
substrate with the membrane ionomer into an ink and applying it directly onto the membrane
have resulted in significant improvements in the fuel cell performance and major reduction in the
catalyst loading, from as high as 5 mg Pt/cm2 to 0.2 mg Pt/cm2,1-6. Note that the voltage loss
caused by gas crossover can be minimized by using a thicker membrane and keeping the
membrane well hydrated. However, reduction in voltage loss by gas crossover by using a
thicker membrane must be considered against the additional ohmic voltage loss of a thicker
membrane.
Voltage loss in the second region has been successfully reduced by humidifying the
reactant gases, especially the anode gas, and employing thinner membranes and membranes
with lower ionic and water transport resistances.7-9 Figure 2 shows some of various
humidification schemes that could be used to humidify the anode gas (and the cathode gas if air
is used).10 Note that these examples are in no way exhaustive. The conventional design
involves supplying water-saturated reactant gas streams, which are typically achieved by
passing the gas streams through a column of water. In this case, the amount of water that can
be brought into the cell will therefore depend on the humidification temperature. Low
temperatures result in low water partial pressures, while high temperatures result in low reactant
partial pressures. In contrast, the vapor injection design calls for complex electrode designs,
possibly consisting of porous backing plates for continuous water addition along the flow

channels. Components for this scheme would be more expensive to construct and difficult to
incorporate into a stack of cells.11 The recirculation design would also be satisfactory, however,
this method requires an external piece of equipment to recirculate the gas. Of these four
examples, the direct liquid water injection approach appears most attractive because of its
simplicity and efficiency . This approach allows more water to be introduced into the reaction
compartment to keep the membrane hydrated than that possible by just saturating the incoming
gas streams. That is, as water in the form of vapor is lost from the anode gas by the net
transport of water from the anode to the cathode (electro-osmosis minus back diffusion), more
water can be generated by the evaporation of liquid water. Furthermore, this liquid water
evaporation provides simultaneous cooling to the cell and can be used as a very effective
thermal management system. However, application of the direct liquid water injection in PEM
fuel cells had been very difficult because excessive amounts lead to electrode flooding. The
direct liquid water injection scheme was first tried in 1989 but was quickly dropped because of
the problems just mentioned.12 Recently, with the development of the interdigitated flow field (to
be described further below), it was tried again and found to work very well.
The last voltage loss region associated with mass transport limitation has not been fully
addressed. So far it has been solved indirectly by raising the gas pressure (increasing the local
concentrations) and partially by raising the gas stoichiometric flow rates which result in lower
energy efficiencies. Recently, a new flow field design called the interdigitated flow field was
developed to address this problem directly.13,14 See Figures 3 and 4. By forcing the gas to flow
into the electrodes in order to exit as compared to flowing over the surface of the electrodes in a
“conventional” flow field, the transport of the reactant and product gases to and from the catalyst
layers are converted from a diffusion mechanism to a forced convection mechanism. As a
result, the diffusion (stagnant) layer is reduced from the whole electrode thickness consisting of
the catalyst layer and macro-porous backing layer to a much thinner combined catalyst and

boundary layer. Furthermore, the shear force of this gas flow helps to remove a large amount of
the liquid water that is entrapped in the inner layers of the electrode, thereby significantly
reducing the electrode flooding problem.14 The forced-flow-through characteristic created by the
interdigitated flow field also enables the cell to handle two-phase (liquid water and reactant gas)
flow allowing the direct liquid water injection scheme to be used effectively. By introducing
liquid water directly into the anode and allowing it to contact the anode membrane interface
provides an additional benefit of possibly higher membrane hydration and therefore higher
conductivity. It has been found that membranes immersed in liquid water have higher water
contents than those in contact with water vapor.15
Finally, it is important to point out that the effectiveness of the direct liquid water injection
scheme has been theoretically evaluated and proven by mathematical models.10,16 This paper
reports experimental results on the effectiveness of the direct liquid water injection scheme and
the interdigitated flow field design in improving the performance of proton exchange membrane
fuel cells.
EXPERIMENTAL
The fuel cell used in this study consists of two copper bus plates to collect the current,
machined graphite flow fields for distribution of reactant gases, and a pre-gasketed membrane
and electrode assembly (MEA) provided by W.L. Gore & Associates, Inc. The MEA’s used had
either a 20 µm- or 40 µm-thick GORE-SELECTTM membrane with an equivalent weight of 950
and a catalyst loading of 0.3 mg Pt/cm2/electrode. The cell had an active surface area of 100
cm2 per electrode. The macro-porous diffusion layers placed on top of the catalyst layers were
made of waterproof, carbon fiber cloths. Liquid water was injected by two metering pumps into
two heated stainless steel coils, where it was preheated to the cell operating temperatures, and
then directly into the gas streams. Unless otherwise stated, cell pressures reported are outlet
pressures. Pressure drops across the cell were measured with water manometers, and gas flow

was controlled by mass flow controllers.
Anode and cathode liquid water injection rates for the base case of each set of operating
conditions were chosen as the minimum settings on the water metering pumps, corresponding
to 0.53 g H2O/min for the cathode pump and 0.50 g H2O/min for the anode pump.
Stoichiometric equivalent flow rates of 2.5 A/cm2 and 3.0 A/cm2 were chosen for the hydrogen
and oxygen flow rates, respectively, translating into 0.36 mol H2O/mol H2, 0.64 mol H2O/mol O2,
and 0.20 mol H2O/mol Air.
Using the minimum amount of humidification allowed by the equipment as a reference
point, variations in performance were evaluated by increasing the anode or cathode water flow
rate until a maximum level of improvement over the base case was attained. It was also desired
to examine the effect of flowing each gas stream into the cell with no humidification while
holding the other stream at the base-case water injection level. Performing these trials at
various conditions would verify whether the anode or cathode is more sensitive to humidification
and to what degree. To illustrate the effectiveness of the direct liquid water injection scheme
when used in conjunction with the interdigitated flow fields, the direct liquid water injection
scheme was also applied to a “conventional” flow field design in which the reactant gases were
flown along parallel channels over the outer surface of the electrodes. The same operating
conditions were used in both flow field designs. Examining these effects comprise the major
objective of this work. Other effects of interest include those of membrane thickness and air
operation versus oxygen operation.
RESULTS AND DISCUSSION
Results presented in this paper are intended to be an expanded, more detailed analysis
of results first published by Nguyen14 which confirmed the effectiveness of the interdigitated flow
field design at ambient operating conditions with GlobeTech, Inc. MEA’s. All data shown here
were obtained using MEA’s from W.L. Gore and Associates, Inc. Except for the results shown
in Figures 10 and 11, the MEA with a 40 µm membrane thickness was used. The MEA with a

20 µm thickness was used for the data taken and shown in Figures 10 and 11. Results where
pure oxygen was used as the cathode reactant will be presented first followed by those where
air was used as the cathode reactant.
Liquid Water Injection with Oxygen as the Cathode Gas:
Upon examining Figures 5 and 6, the most striking feature is the marked performance
improvement achieved simply by providing optimal humidification to the anode. Drastic
improvements were observed at 80°C and 1 atm abs using either type of flow field design as the
cathode water flow rate was held constant and the anode water flow rate was increased. As
would be expected, the worst performance was seen for both designs when the hydrogen
stream was not humidified. For every anode water flow rate, the interdigitated design yielded
superior performance over the conventional design, and the optimized maximum power
densities were about 0.57 W/cm2 and 0.42 W/cm2, respectively (see Figure 6). It is also
interesting to observe that the interdigitated flow fields could handle more liquid water at the
anode than the conventional flow fields. Comparing the curves in Figure 5 where the anode
water flow rates were increased from 0.36 mol H2O/mol H2 to 2.0 mol H2O/mol H2 illustrates this
point. Performance for cells using the interdigitated flow fields continued to increase as the
amount of injected liquid water increased while that for cells using the conventional ones
dropped significantly as the injected liquid water was increased from 1.2 to 2.0 mol H2O/mol H2.
Note that at 80oC and 1 atm abs, 100% water saturation would correspond to 0.90 mol H2O/mol
H2.
This finding is explained by the fact that the interdigitated design provides more uniform
reactant supply and at a higher rate to the reactive interface than the conventional design.14 In
addition, at the anode side, having liquid water that is carried by the gas stream in direct contact
with the electrode and membrane interface provides more water for electro-osmosis without
flooding the anode catalyst layer, higher membrane water content, and, consequently, higher

membrane conductivity.15 At the cathode side, the dead-ended flow channels cause the
electrode layer to be continuously purged of liquid water, a benefit not physically possible with
conventional flow channels. These points are further solidified by the fact that the region of
mass transfer limitations was reached at much lower current densities with conventional flow
fields, indicated by the steeper slopes at the end of the voltage curves in Figure 5 and the peaks
of the power density curves in Figure 6. When the interdigitated design was used, only the trial
where the hydrogen stream was not humidified was the maximum power density reached. In
contrast, all trials but one reached the mass transfer region when the conventional design was
used. A maximum power density improvement of ~0.21 W/cm2 to ~0.57 W/cm2 (or about 170%)
was obtained by changing from conventional flow fields and no anode water injection to
interdigitated flow fields and optimized anode water injection. The maximum power density
enhancement gained exclusively from anode water injection using the interdigitated flow fields
went from ~0.27 W/cm2 with no anode water to ~0.57 W/cm2 with 2.0 mol H2O/mol H2, a
remarkable improvement of about 110%.
One could have suspected that the pressure drop across these flow field shoulders (area
of flow field in electrical contact with the electrode) to be high, and if that was the case, the
increase in performance could be attributed to the higher pressure. On the contrary, we found
the pressure drop to be minimal. For the high stoichiometric flow rates used here, the pressure
drop across a 1 mm shoulder were measured at approximately 0.067 atm for the hydrogen side
and 0.08 atm for the oxygen side, respectively. That is, for a small 7-8% increase in pressure
we get from 30% to over 100% increase in performance. We attribute this small pressure drop
to the highly porous structure of the carbon fiber cloth used and the short shoulder length over
which the gas must travel. Of course, when air is used instead of oxygen the pressure drop will
be 5 times higher, which is still a small penalty.
Figures 7 and 8 show results for the cases holding the anode water flow rate constant
and varying the cathode water flow rate. Similar performance improvement was obtained, but

the maximum attainable power density using either flow field design was lower upon optimizing
the cathode water flow rate than that under optimized anode water flow rates (Figure 8 vs.
Figure 6). This observation shows that humidification optimization is more important for the
anode gas stream but still cannot be ignored for the cathode stream. Again the interdigitated
flow fields could handle more cathode water than the conventional flow fields as indicated by
Figure 8. When the cathode water flow rate was increased from 0.64 mol H2O/mol O2 to 1.3
mol H2O/mol O2, performance increased moderately with the interdigitated flow fields and
decreased significantly with the conventional flow fields. This trend indicates that the cathode is
more sensitive to flooding with liquid injection especially when conventional flow fields are used,
which agrees well with intuition since water accumulates by reaction and electro-osmosis at the
cathode interface. Finally, similarly to the anode water injection study, the mass transfer region
of operation was reached at a much lower current density with the conventional design than with
the interdigitated design (see Figures 6 and 8).
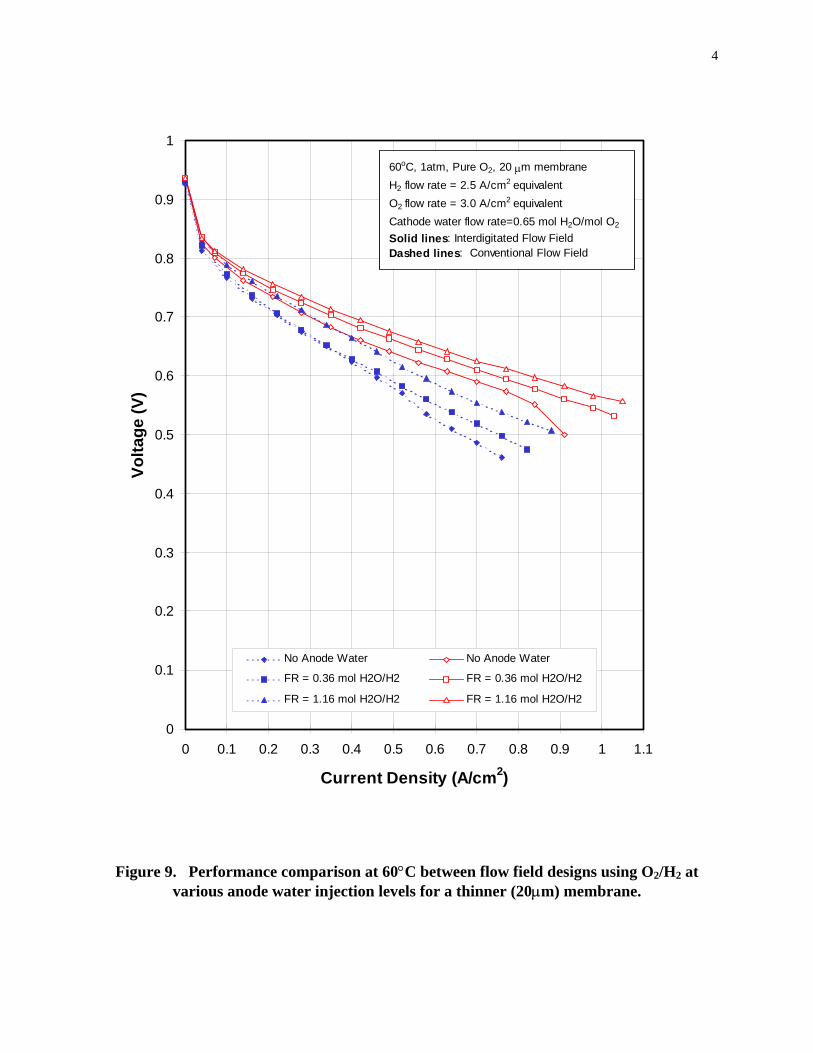
Shown in Figures 9 and 10 are the results of the anode water injection study performed
at 60°C and 1 atm abs using a MEA which has a membrane thickness of 20 µm. Simply
reducing the membrane thickness had multiple effects on the cell performance. However, the
general trends of improved performance of the interdigitated design over the conventional
design and increased performance with increasing anode water flow rate remain steadfastly in
tact. Even though the operating temperature was reduced by 20°C, the performance improved
in every trial shown in Figure 9 over the corresponding trial shown in Figure 5, especially of
those with no humidification and of the convention flow field design. Consequently, the
improvement in performance from using conventional flow fields and no anode water (about
0.35 W/cm2) to using interdigitated flow fields and optimized anode water injection (about 0.59
W/cm2) decreased to about 68% as compared to 170% for the case with thicker membranes.
These observations are explained by the fact that a thinner membrane translates into

shorter distance for back diffusion of water from the cathode to the anode to counter balance
the water that is lost by electro-osmosis, thus reducing the need for adequate anode gas
humidification. Consequently, cells with no humidification and conventional flow fields benefited
greatly from this higher back diffusion rate, and even cells with direct liquid water injection and
interdigitated flow fields showed some improvement from this benefit. All cells showed lower
membrane ionic resistance (represented by the lower slopes in the ohmic region), which can be
attributed in this case to both higher membrane hydration and its thinness. Finally, flooding of
the cathode when conventional flow fields were used was also alleviated because of the higher
back-diffusion rates of water to the anode, which is shown in Figure 10 in that none of the
conventional flow field power density curves reached their peaks.
Liquid Water Injection with Air Cathode:
When air is used as the cathode reactant at the same pressure (i.e., 1 atm abs), a much
higher mass flow rate must be used (about 4.76 times greater) to have the same mass of
oxygen as a pure oxygen feed stream due to nitrogen presence. Furthermore, the partial
pressure of oxygen is much lower, and the reactivity at the cathode is therefore reduced. The
major effect on cell humidification when air is used instead of pure oxygen is that the higher
mass flow rate dehydrates the MEA especially when the air stream is not humidified. With more
water transported out of the cathode layer with the exit stream because of the higher mass flow
rate, the direction of water diffusion across the membrane could change to the same direction
as electro-osmosis (towards the cathode), which would further dehydrate the MEA.10,16 Cathode
humidification then becomes important both to promote back diffusion of water to the anode and
to prevent dehydration at the cathode membrane interface. When dry air is used, membrane
dehydration is expected to be most severe at region near the cell inlet, (the region of most
importance because the electrode reaction rate could be at its highest level because of the high
reactant concentration) for both flow field designs. Furthermore, membrane dehydration is
expected to be even more severe for interdigitated flow field because dry air is forced to flow
deeply into the electrode layers. This effect has been predicted earlier by mathematical models
10,16 and confirmed experimentally here.
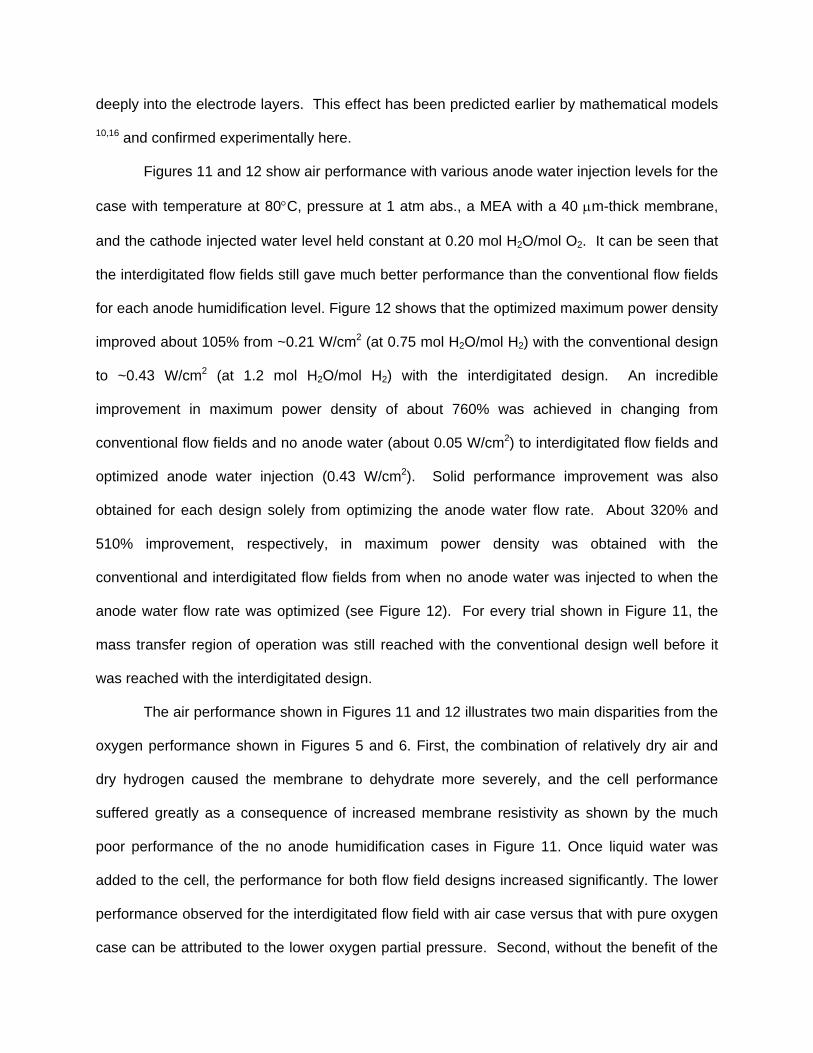
Figures 11 and 12 show air performance with various anode water injection levels for the
case with temperature at 80°C, pressure at 1 atm abs., a MEA with a 40 µm-thick membrane,
and the cathode injected water level held constant at 0.20 mol H2O/mol O2. It can be seen that
the interdigitated flow fields still gave much better performance than the conventional flow fields
for each anode humidification level. Figure 12 shows that the optimized maximum power density
improved about 105% from ~0.21 W/cm2 (at 0.75 mol H2O/mol H2) with the conventional design
to ~0.43 W/cm2 (at 1.2 mol H2O/mol H2) with the interdigitated design. An incredible
improvement in maximum power density of about 760% was achieved in changing from
conventional flow fields and no anode water (about 0.05 W/cm2) to interdigitated flow fields and
optimized anode water injection (0.43 W/cm2). Solid performance improvement was also
obtained for each design solely from optimizing the anode water flow rate. About 320% and
510% improvement, respectively, in maximum power density was obtained with the
conventional and interdigitated flow fields from when no anode water was injected to when the
anode water flow rate was optimized (see Figure 12). For every trial shown in Figure 11, the
mass transfer region of operation was still reached with the conventional design well before it
was reached with the interdigitated design.
The air performance shown in Figures 11 and 12 illustrates two main disparities from the
oxygen performance shown in Figures 5 and 6. First, the combination of relatively dry air and
dry hydrogen caused the membrane to dehydrate more severely, and the cell performance
suffered greatly as a consequence of increased membrane resistivity as shown by the much
poor performance of the no anode humidification cases in Figure 11. Once liquid water was
added to the cell, the performance for both flow field designs increased significantly. The lower
performance observed for the interdigitated flow field with air case versus that with pure oxygen
case can be attributed to the lower oxygen partial pressure. Second, without the benefit of the

flow-through characteristic of the interdigitated flow field, trials with conventional flow fields
become mass transport much more quickly with air operation than with oxygen operation.
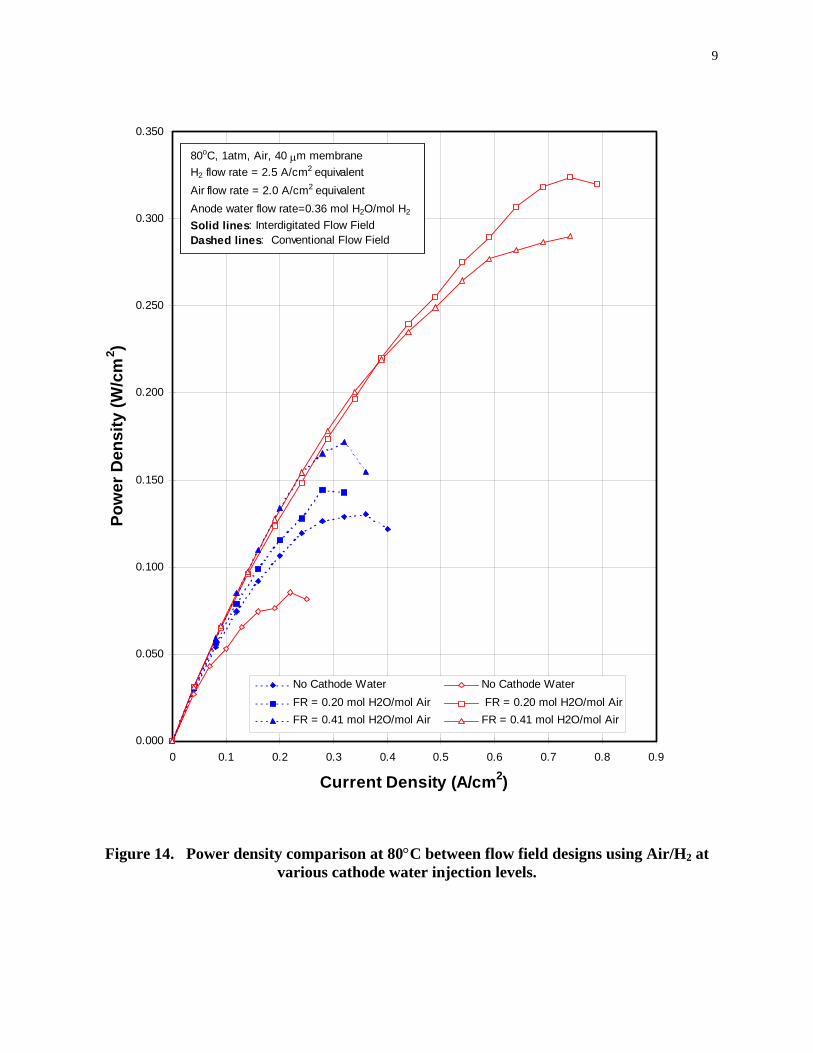
The effect of dry air operation, especially on cells with interdigitated flow fields, and the
importance of cathode humidification when air is used are illustrated in Figures13 and 14. Note
that the especially poor performance of the trial of no cathode water with the interdigitated flow
field is even lower than that of the same trial with the conventional flow field. The results
presented here confirmed the earlier predictions by mathematical models.10,16 Finally, note that
the performance of the trials with the conventional flow fields continued to benefit from
additional water added to the cell, while that of the trials with the interdigitated flow fields
showed no further increase with additional water. This can be explained by the flow through
characteristic of the interdigitated flow field which brings the humidified gas much closer to the
electrode and membrane interface. Consequently, less water is needed to prevent membrane
dehydration in the region near the inlet. Beyond this region sufficient amount of water is
generated to keep the downstream region well humidified.
CONCLUSIONS AND RECOMMENDATIONS
The interdigitated design shows superior performance over the conventional design, due
to its enhanced transport capabilities, for all cases whether air or pure oxygen is used as the
cathode reactant. Using the interdigitated flow fields prolongs the point at which the mass
transfer region of operation is reached, i.e., it is reached at higher current densities. The anode
stream can handle a higher water flow rate with the interdigitated flow fields than with the
conventional ones. Generally, anode humidification is more significant to achieving high cell
performance than cathode humidification and results in greater performance improvement when
optimized. Liquid water injection when used with the interdigitated flow field design is an
extremely effective water management scheme. Using the higher liquid water tolerance levels
offered by the interdigitated flow fields, excess injected liquid water could be used as a heat
removal scheme for PEM fuel cells.

Effects of MEA type, membrane thickness, and catalyst layer thickness on liquid water
injection must be systematically investigated before it can be completely determined if an
optimum range of ratios of mass of liquid water to mass of reactant gas exists. Experiments
quantifying the effects and potential benefits of liquid water injection on heat removal should be
conducted to further illuminate the relationship between heat and water management.
ACKNOWLEDGEMENTS
The author would like to thank the University of Kansas, the State of Kansas, and the
K*STAR NSF EPSCoR program for the financial support of this work. W. L. Gore and
Associates, Inc. provided GORE-PRIMEATM series 5000 membrane/electrode assemblies and
macro-porous gas diffusion layers under confidential disclosure agreement.

Bibliography
1. M.S. Wilson and S. Gottesfeld, J. Electrochem. Soc., 139, L28 (1992).
2. E.J. Taylor, E.B. Anderson, and N.R.K. Vilambi, J. Electrochem. Soc., 139, L45 (1992).
3. G. Sasikumar, M. Raja, and S. Parthasarathy, Electrochim. Acta, 40, 285 (1995).
4. M.S. Wilson, J.A. Valerio, and S. Gottesfeld, Electrochim. Acta, 40, 355 (1995).
5. T.R. Ralph, G.A. Hards, J.E. Keating, S.A. Campbell, D.P. Wilkinson, M. Davis, J. St-Pierre, and M.C. Johnson, J. Electrochem. Soc., 144, 3845 (1997).
6. I.D. Raistrick, U.S. Patent #4826115 (1989).
7. J.A. Kolde, B. Bahar, M.S. Wilson, T.A. Zawodzinski, and S. Gottesfeld, in Proton Conducting Membrane Fuel Cell I, S. Gottesfeld, G. Halpert, and A. Landgrebe, Editors, PV 95-23, p. 193, The Electrochemical Society Proceedings Series, Pennington, NJ (1995).
8. J.S. Wainright, J.-T. Wang, D. Weng, R.F. Savinell and M. Litt, J. Electrochem. Soc., 142, L121 (1995).
9. G.E. Wnek, J.N. Rider, J.M. Serpico, A.G. Einset, S.G. Ehrenberg, and L.A. Raboin, in Proton Conducting Membrane Fuel Cell I, S. Gottesfeld, G. Halpert, and A. Landgrebe, Editors, PV 95-23, p. 247, The Electrochemical Society Proceedings Series, Pennington, NJ (1995).
10. Trung V. Nguyen and Ralph E. White, J. Electrochem. Soc., 140, 2178 (1993).
11. P.J. Schutz, in Proceedings of the Symposium on Fuel Cells, R.E. White and A.J. Appleby, Editors, PV 89-14, p. 87, The Electrochemical Society Proceedings Series, Pennington, NJ (1989).
12. Trung Nguyen, James Hedstrom, and Nicholas Vanderborgh, in Proceedings of the Symposium on Fuel Cells, R.E. White and A.J. Appleby, Editors, PV 89-14, p. 39, The Electrochemical Society Proceedings Series, Pennington, NJ (1989).
13. Mahlon S. Wilson, Thomas E. Springer, John R. Davey, and Shimshon Gottesfeld, in Proton Conducting Membrane Fuel Cells I, S. Gottesfeld, G. Halpert, and A. Langrebe, Editors, PV 95-23, p. 115, The Electrochemical Society Proceedings Series, Pennington, NJ (1995).
14. Trung V. Nguyen, J. Electrochem. Soc., 143, L103 (1996).
15. T.E. Springer, T.A. Zawodzinski, and S. Gottesfeld, J. Electrochem. Soc., 138, 2334 (1991).
16. Jung S. Yi and Trung V. Nguyen, “An Along-the-Channel Model for Proton Exchange Membrane Fuel Cells,” J. Electrochem. Soc., in press.

List of Figures
1. Typical polarization curve of a PEM fuel cell.
2. Various anode gas humidification strategies for PEM fuel cells.
3. Gas transport inside a MEA using a conventional flow field design.
4. Gas transport inside a MEA using the interdigitated flow field design.
5. Performance comparison at 80oC between flow field designs using O2/H2 at various anode water injection levels.
6. Power density comparison at 80°C between flow field designs using O2/H2 at various anode water injection levels.
7. Performance comparison at 80°C between flow field designs using O2/H2 at various cathode water injection levels.
8. Power density comparison at 80°C between flow field designs using O2/H2 at various cathode water injection levels.
9. Performance comparison at 60°C between flow field designs using O2/H2 at various anode water injection levels for a thinner (20µm) membrane.
10. Power density comparison at 60°C between flow field designs using O2/H2 at various anode water injection levels for a thinner (20µm) membrane.
11. Performance comparison at 80°C between flow field designs using Air/H2 at various anode water injection levels.
12. Power density comparison at 80°C between flow field designs using Air/H2 at various anode water injection levels.
13. Performance comparison at 80°C between flow field designs using Air/H2 at various cathode water injection levels.
14. Power density comparison at 80°C between flow field designs using Air/H2 at various cathode water injection levels.

Voltage Loss due to Ohmic Resistance
Voltage Loss due to Mass
Transport Limitation
0.25
0.35
0.45
0.55
0.65
0.75
0.85
0.95
1.05
1.15
1.25
0.00 0.10 0.20 0.30 0.40 0.50 0.60 0.70 0.80 0.90
Current Density (A/cm2)
Cel
l Pot
entia
l (V
)
Voltage Loss due to Activation Resistance
Open-circuit voltage is lower than thermodynamic voltage due to gas crossover
Figure 1. Typical polarization curve of a PEM fuel cell.

Figure 2. Various anode gas humidification strategies for PEM fuel cells.
H2 H2O(l)
H2O(v)
Humidifier
Fuel Cell
C A T H O D E
A N O D E
Heat
H2O(v) H2,
H2
Porous Plate
H2
H2O(l)
HUMIDIFIER
H2
H2O(l)
Fuel Cell
Fuel Cell Fuel Cell
CONVENTIONAL VAPOR INJECTION RECIRCULATION LIQUID WATER INJECTION
CATHODE
CATHODE
CATHODE
ANODE
ANODE
A N O D E

FLOFLOW
H3O+ H3O+PROTON
EXCHANGE MEMBRANE
Pt/C
H2 H3O+
V
CATHODE LAYER
ANODE LAYER
DIFFUSIO
DIFFUSION
DIFFUSIODIFFUSIO
FLOFLOW
e-
Pt/C
O2 H3O+
e-
Conventional Flow Field Design
Inlet
Outlet
Figure 3. Gas transport inside a MEA using a conventional flow field design.

FLOW FLOW
FLOW FLOW
H3O+ H3O+PROTON
EXCHANGE MEMBRANE
Pt/C
H2 H3O+
e-
Pt/C
O2 H3O+
e-
V
CATHODE LAYER
ANODE LAYER
DIFFUSION DIFFUSION
FLO FLOW
DIFFUSIONDIFFUSION
FLOW FLOW
Outlet
Interdigitated Flow Field Design
Inlet
Figure 4. Gas transport inside a MEA using the interdigitated flow field design.

0
0.1
0.2
0.3
0.4
0.5
0.6
0.7
0.8
0.9
1
0 0.1 0.2 0.3 0.4 0.5 0.6 0.7 0.8 0.9 1 1.1
Current Density (A/cm2)
Volta
ge (V
)
No Anode Water No Anode WaterFR = 0.36 mol H2O/mol H2 FR = 0.36 mol H2O/mol H2 FR = 1.16 mol H2O/mol H2 FR = 1.16 mol H2O/mol H2 FR = 2.03 mol H2O/mol H2 FR = 2.03 mol H2O/mol H2
80oC, 1atm, Pure O2, 40 µm membrane H2 flow rate = 2.5 A/cm2 equivalent O2 flow rate = 3.0 A/cm2 equivalent Cathode water flow rate=0.64 mol H2O/mol O2
Solid lines: Interdigitated Flow Field Dashed lines: Conventional Flow Field
Figure 5. Performance comparison at 80oC between flow field designs using O2/H2 at
various anode water injection levels.

1
0.000
0.100
0.200
0.300
0.400
0.500
0.600
0 0.1 0.2 0.3 0.4 0.5 0.6 0.7 0.8 0.9 1 1.1
Current Density (A/cm2)
Pow
er D
ensi
ty (W
/cm
2 )
No Anode Water No Anode WaterFR = 0.36 mol H2O/mol H2 FR = 0.36 mol H2O/mol H2 FR = 1.16 mol H2O/mol H2 FR = 1.16 mol H2O/mol H2 FR = 2.03 mol H2O/mol H2 FR = 2.03 mol H2O/mol H2
80oC, 1atm, Pure O2, 40 µm membrane H2 flow rate = 2.5 A/cm2 equivalent O2 flow rate = 3.0 A/cm2 equivalent Cathode water flow rate=0.64 mol H2O/mol O2
Solid lines: Interdigitated Flow Field Dashed lines: Conventional Flow Field
Figure 6. Power density comparison at 80°C between flow field designs using O2/H2 at various anode water injection levels.

2
0
0.1
0.2
0.3
0.4
0.5
0.6
0.7
0.8
0.9
1
0 0.1 0.2 0.3 0.4 0.5 0.6 0.7 0.8 0.9 1 1.1
Current Density (A/cm2)
Volta
ge (V
)
No Cathode Water No Cathode Water
FR = 0.64 mol H2O/mol O2 FR = 0.64 mol H2O/mol O2
FR = 1.30 mol H2O/mol O2 FR = 1.30 mol H2O/mol O2
80oC, 1atm, Pure O2, 40 µm membrane H2 flow rate = 2.5 A/cm2 equivalent O2 flow rate = 3.0 A/cm2 equivalent Anode water flow rate=0.36 mol H2O/mol H2
Solid lines: Interdigitated Flow Field Dashed lines: Conventional Flow Field
Figure 7. Performance comparison at 80°C between flow field designs using O2/H2 at various cathode water injection levels.

3
0
0.1
0.2
0.3
0.4
0.5
0.6
0 0.1 0.2 0.3 0.4 0.5 0.6 0.7 0.8 0.9 1 1.1
Current Density (A/cm2)
Pow
er D
ensi
ty (W
/cm
2 )
No Cathode Water No Cathode Water
FR = 0.64 mol H2O/mol O2 FR = 0.64 mol H2O/mol O2 FR = 1.30 mol H2O/mol O2 FR = 1.30 mol H2O/mol O2
80oC, 1atm, Pure O2, 40 µm membrane H2 flow rate = 2.5 A/cm2 equivalent O2 flow rate = 3.0 A/cm2 equivalent Anode water flow rate=0.36 mol H2O/mol H2
Solid lines: Interdigitated Flow Field Dashed lines: Conventional Flow Field
Figure 8. Power density comparison at 80°C between flow field designs using O2/H2 at various cathode water injection levels.
4
0
0.1
0.2
0.3
0.4
0.5
0.6
0.7
0.8
0.9
1
0 0.1 0.2 0.3 0.4 0.5 0.6 0.7 0.8 0.9 1 1.1
Current Density (A/cm2)
Volta
ge (V
)
No Anode Water No Anode Water
FR = 0.36 mol H2O/H2 FR = 0.36 mol H2O/H2
FR = 1.16 mol H2O/H2 FR = 1.16 mol H2O/H2
60oC, 1atm, Pure O2, 20 µm membrane H2 flow rate = 2.5 A/cm2 equivalent O2 flow rate = 3.0 A/cm2 equivalent Cathode water flow rate=0.65 mol H2O/mol O2
Solid lines: Interdigitated Flow Field Dashed lines: Conventional Flow Field
Figure 9. Performance comparison at 60°C between flow field designs using O2/H2 at
various anode water injection levels for a thinner (20µm) membrane.

5
0.000
0.100
0.200
0.300
0.400
0.500
0.600
0.700
0 0.1 0.2 0.3 0.4 0.5 0.6 0.7 0.8 0.9 1 1.1
Current Density (A/cm2)
Pow
er D
ensi
ty (W
/cm
2 )
No Anode Water No Anode Water
FR = 0.36 mol H2O/H2 FR = 0.36 mol H2O/H2
FR = 1.16 mol H2O/H2 FR = 1.16 mol H2O/H2
60oC, 1atm, Pure O2, 20 µm membrane H2 flow rate = 2.5 A/cm2 equivalent O2 flow rate = 3.0 A/cm2 equivalent Cathode water flow rate=0.65 mol H2O/mol O2
Solid lines: Interdigitated Flow Field Dashed lines: Conventional Flow Field
Figure 10. Power density comparison at 60°C between flow field designs using O2/H2 at
various anode water injection levels for a thinner (20µm) membrane.

6
0
0.1
0.2
0.3
0.4
0.5
0.6
0.7
0.8
0.9
1
0 0.1 0.2 0.3 0.4 0.5 0.6 0.7 0.8 0.9
Current Density (A/cm2)
Volta
ge (V
)
No Anode Water No Anode WaterFR= 0.36 mol H2O/mol H2 FR= 0.36 mol H2O/mol H2FR= 0.75 mol H2O/mol H2 FR= 0.75 mol H2O/mol H2FR= 1.2 mol H2O/mol H2 FR= 1.2 mol H2O/mol H2
80oC, 1atm, Air, 40 µm membrane H2 flow rate = 2.5 A/cm2 equivalent Air flow rate = 2.0 A/cm2 equivalent Cathode water flow rate=0.20 mol H2O/mol Air Solid lines: Interdigitated Flow Field Dashed lines: Conventional Flow Field
Figure 11. Performance comparison at 80°C between flow field designs using Air/H2 at various anode water injection levels.

7
0
0.05
0.1
0.15
0.2
0.25
0.3
0.35
0.4
0.45
0.5
0 0.1 0.2 0.3 0.4 0.5 0.6 0.7 0.8 0.9
Current Density (A/cm2)
Pow
er D
ensi
ty (W
/cm
2 )
No Anode Water No Anode WaterFR= 0.36 mol H2O/mol H2 FR= 0.36 mol H2O/mol H2FR= 0.75 mol H2O/mol H2 FR= 0.75 mol H2O/mol H2FR= 1.2 mol H2O/mol H2 FR= 1.2 mol H2O/mol H2
80oC, 1atm, Air, 40 µm membrane H2 flow rate = 2.5 A/cm2 equivalent Air flow rate = 2.0 A/cm2 equivalent Cathode water flow rate=0.20 mol H2O/mol Air Solid lines: Interdigitated Flow Field Dashed lines: Conventional Flow Field
Figure 12. Power density comparison at 80°C between flow field designs using Air/H2 at
various anode water injection levels.

8
0
0.1
0.2
0.3
0.4
0.5
0.6
0.7
0.8
0.9
1
0 0.1 0.2 0.3 0.4 0.5 0.6 0.7 0.8 0.9
Current Density (A/cm2)
Volta
ge (V
)
No Cathode Water No Cathode Water
FR = 0.20 mol H2O/mol Air FR = 0.20 mol H2O/mol Air
FR = 0.41 mol H2O/mol Air FR = 0.41 mol H2O/mol Air
80oC, 1atm, Air, 40 µm membrane H2 flow rate = 2.5 A/cm2 equivalent Air flow rate = 2.0 A/cm2 equivalent Anode water flow rate=0.36 mol H2O/mol H2
Solid lines: Interdigitated Flow Field Dashed lines: Conventional Flow Field
Figure 13. Performance comparison at 80°C between flow field designs using Air/H2 at various cathode water injection levels.
9
0.000
0.050
0.100
0.150
0.200
0.250
0.300
0.350
0 0.1 0.2 0.3 0.4 0.5 0.6 0.7 0.8 0.9
Current Density (A/cm2)
Pow
er D
ensi
ty (W
/cm
2 )
No Cathode Water No Cathode WaterFR = 0.20 mol H2O/mol Air FR = 0.20 mol H2O/mol AirFR = 0.41 mol H2O/mol Air FR = 0.41 mol H2O/mol Air
80oC, 1atm, Air, 40 µm membrane H2 flow rate = 2.5 A/cm2 equivalent Air flow rate = 2.0 A/cm2 equivalent Anode water flow rate=0.36 mol H2O/mol H2
Solid lines: Interdigitated Flow Field Dashed lines: Conventional Flow Field
Figure 14. Power density comparison at 80°C between flow field designs using Air/H2 at various cathode water injection levels.