effect of ethnic diversity on economic …libproject.hkbu.edu.hk/trsimage/hp/02005018.pdfdirect...
TRANSCRIPT

EFFECT OF ETHNIC DIVERSITY ON
ECONOMIC GROWTH
BY
Liu Ka Ho
02005018
Applied Economics Option
An Honours Degree Project Submitted to the
School of Business in Partial Fulfillment
Of the Graduation Requirement for the Degree of
Bachelor of Business Administration (Honours)
Hong Kong Baptist University
Hong Kong
April 2005

Acknowledgement
I would like to express my genuine gratitude to my supervisor Dr. Mo. His valuable
advice and research finding not only guided me to do my project smoothly, but also
enrich my economic sense. His support initiates me to do my best in this project.
At the same time, I have to thank all the parties who gave their considerable comment
to my project.
1

Abstract
This paper employs a framework developed by Mo(2000) to study the role of ethnic
diversity in economic growth. We use ordinary least squares method to estimate the
direct effect of ethnic diversity on growth and indirect effects of ethnicity diversity on
growth through the transmission channels. We find that one-unit increase in the index
of ethnic diversity (i.e. change from complete homogeneity to complete
heterogeneity), the real GDP growth rate reduces by 2.67 percentage points, or
express differently, a 1% increase in the ethnicity index reduces the growth rate by
about 0.306%. The direct effect contributes 38% to the total effect, while among the
transmission channels, the most important one is the investment channel, followed by
the human capital channel, government consumption channel and political instability
channel.
2

Table of Contents
Acknowledgement……………………………………………………………….… 1
Abstract……………………………………………………………………………. 2
Table of Contents………………………………………………………….………. 3
1. Introduction……………………………………………………………………... 4
2. Literature Review………………………………………………….……………. 6
3. Analytical Framework…………………………………..………………………. 9
4. Data and Descriptive Statistics……………………………….………….……… 11
5. Empirical Analysis……………………………………...……………….……… 14
6. The Transmission Channels…………………………….…………….………… 17
7. Limitation………………………………………………….………….………… 26
8. Conclusion……………………………………………...………….…………… 28
Appendix………………………………………………………………….……….. 29
References……………………………………………………………….………… 34
3

1. Introduction
Economic growth is one of the most important research topics among economists.
From the studies of researchers, we know that many factors such as investment,
education, government policy, political stability, exchange rate are related to the
economic growth. By studying the relationship of these factors and GDP growth,
economists can explain or predict a country’s economic growth.
In the 1960s, World Bank’s chief economist predicted that seven of the African
countries would “clearly have the potential to reach or surpass” a 7% growth rate.
However, the result turned out was that those countries have a negative growth and
the overall real GDP per capita in Africa did not grow during the period of 1965-1990.
On the other hand, the developing countries in East Asia had a per capita GDP growth
over 5% in that period.
What happened to make the economists falsely estimate the growth of those African
countries? If it is because of the result of poor policies, poor investment, poor political
instability and low investment, is there any cause for it? Ethnic diversity (we simply
call ethnicity in following parts) maybe the answer. In this paper, we will estimate
4

how ethnicity influences the economic growth, its direct effect on growth and indirect
effects through other economic factors.
The paper is organized as follows. Literature review about ethnicity is shown in the
next section. In section 3, we introduce the analytical framework of this paper. The
data and descriptive statistics are shown in section 4. Section 5 is the report of our
regression results. Section 6 shows the effect of ethnicity on different transmission
variables. Section 7 shows the limitation of this paper. The last section is the
conclusion.
5

2. Literature Review
Ethnicity is a variable which is quite new to the economists. Before 1990s, ethnicity is
just a variable commonly used in social science literature. Mauro (1995) brings
ethnicity to the attention of economists by using it as an instrumental variable for
corruption while arguing that corruption causes slower growth and investment. After
that, effects of ethnicity start to be a research topic among economic studies.
Easterly and Levine (1997) conclude that Africa’s growth tragedy is caused by poor
public policies, while the Africa’s high ethnicity can explain a significant part of why
countries have chosen the poor policies. They find that high ethnicity is closely
associated with low schooling, underdeveloped financial systems, distorted foreign
exchange markets, and insufficient infrastructure. La Porta R. Lopez de Silanes, F.
Shleifer, and R. Vishiny (1999) also show that that ethnicity has a negative effect on
several indices of the quality of government (measured as property rights protection,
the extent of corruption, etc)
Beside public policies, Easterly with other researchers find that a variety of public
goods such as roads, schools, trash pickup, libraries worsen or receive less funding
6
with higher ethnicity in a sample of US cities (Alesina, Baqir, and Easterly, 1997).
Some researchers further differentiate the term ethnicity into ethnic fragmentation and
ethnic polarization. For instance, Montalvo and Reynal-Querol (2000) show that
ethnic fractionalization has a direct negative effect on economic development while
religious and ethnic polarization have a negative effect on growth through the
reduction of investment, the increase in government expenditure and the increase in
the probability of civil wars.
However, not all the researchers agree all the effects of ethnicity which we mentioned
above. Arcand JL, Guillaumont P, Guillaumont Jeanneney S (2000) question the paper
of Easterly and Levine (1997) about the Africa’s growth tragedy. They conclude that
the results in the paper of Easterly and Levine (1997) are both debatable and weak
from an econometric point of view. They also raise an interesting question: if ethnicity
is the cause of Africa’s growth tragedy, then there is very little, if anything can be
done, to change the tragedy, and the tragedy will become the fate of Africa. Other
researchers, such as Sachs and Warner (1997), Rodrik (1998), Guillaumont et al.
(1998) also find insignificant results for ethnicity in the growth regression models.
7

If ethnicity is the cause of the Africa’s tragedy, is there really nothing can be done?
Collier (1999) and Bluedorn (2001) may give us the solution. They suggest that
democracy can diminish the negative effect of ethnic diversity on economic
development, which means that the effect of ethnicity is not unavoidable.
8

3. Analytical Framework
In this paper, we employ a framework developed in Mo(2000) to investigate the effect
of ethnicity on economics growth. The framework starts with the input-output
relationship, which is characterized by the general production function,
(1) ),( LKTfY =
where Y is the total output level, T is total factor productivity, K is the capital stock, L
is the labor.
Total differentiation of Y:
(2) )( dLfdKfTfdTdY LK ++=
Divide (2) by Y, the equation becomes:
(3) L
dLfLf
YdKTf
TdT
YdY L
K ++=
We simplify the function as:
(4) [ ]dLLIYFGR ,,γ=
where GR represents the real GDP growth rate, γis the growth rate of total factor
productivity, IY is the investment output ratio and dLL is the growth rate of labor.
According to Levine and Renelt(1992), the share of investment in GDP, the rate of
population growth, the initial level of real GDP, and a proxy for human capital are the
four variables that robust in determining growth. The first two variables belong to the
9
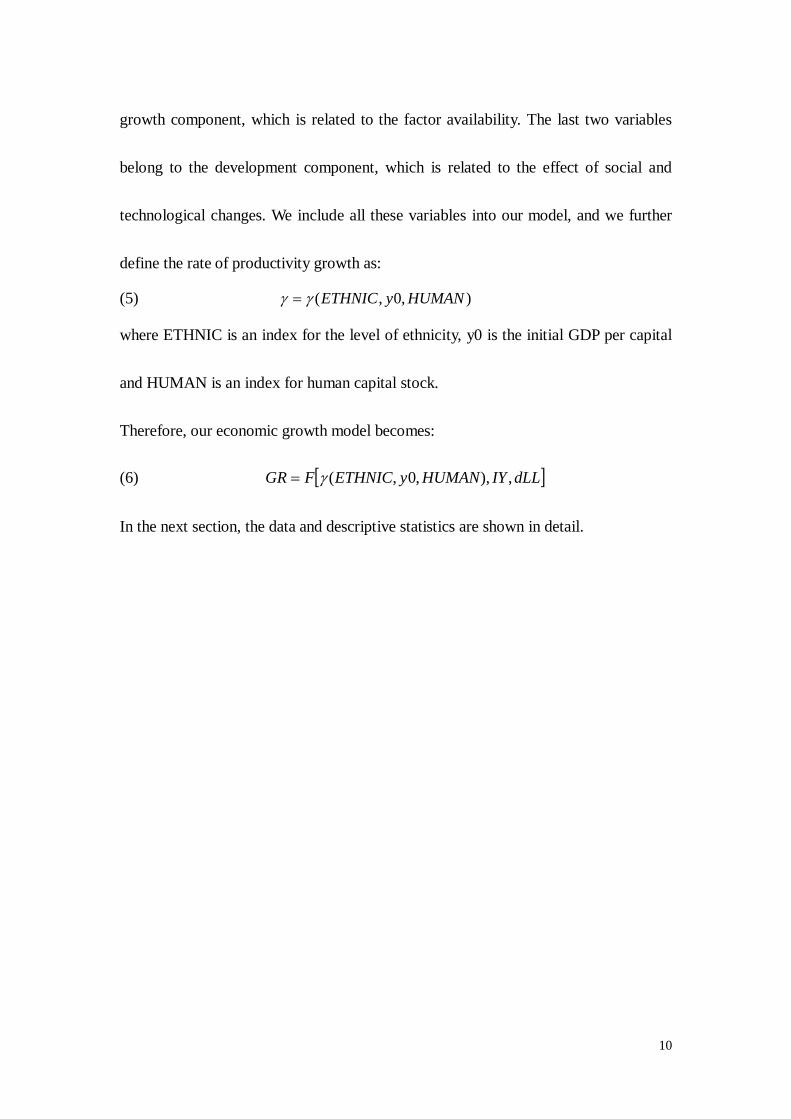
growth component, which is related to the factor availability. The last two variables
belong to the development component, which is related to the effect of social and
technological changes. We include all these variables into our model, and we further
define the rate of productivity growth as:
(5) ),0,( HUMANyETHNICγγ =
where ETHNIC is an index for the level of ethnicity, y0 is the initial GDP per capital
and HUMAN is an index for human capital stock.
Therefore, our economic growth model becomes:
(6) [ ]dLLIYHUMANyETHNICFGR ,),,0,(γ=
In the next section, the data and descriptive statistics are shown in detail.
10

4. Data and Descriptive Statistics
Except the ethnicity index, all the data in our model are obtained from the panel data
set assembled by Robert Barro and Jong-Wha Lee. Most of the data in Barro’s and
Lee’s data set are from 1960-1985, covering 138 countries. Some of the data are also
available up to 1990. The data are usually presented as an averaged five years’
sub-period, i.e. there are 5 five-year-averaged observations for a variable in the period
1960-1985.
Due to the fact that there are quite a lot missing observations for the period before
1970 and after 1985, in order to have a more accurate and meaningful estimation, we
only use the data from the period of 1970 to 1985 in our model. The reason that we
choose a fifteen-year-period is that a longer period is better for studying the
determinants of the growths in total factor productivity and capital stock.
We use the same definition of ethnicity as Easterly and Levine(1997) used in their
paper. They primarily defined ethnicity as ethnolinguistic fragmentation, which was
constructed in 1960 by a team of 70 researchers at the Miklukho-Maklai Ethnological
Institute in the Soviet Union and printed in the 1964 Atlas Narodov Mira (Atlas of
11

Peoples of the World). It measures the probability that two randomly selected
individuals in a country will belong to different ethnolinguistic groups. This variable
ranges from 0 to 1. The larger number of ethnolinguistic groups and the closer the
sizes of the groups are, the larger the index is. For instance, when there is only one
ethnic group, the index equals to 0. The index equals to 1 when there are infinite
number of ethnic groups. When there are only two ethnic groups with the same size,
the index equals to 0.5. The ethnic index modified by Easterly and Levine covers 109
countries.
All the data included in our regression model are closely related to the analytical
framework except the growth rate of labor. We use the growth rate of population as a
proxy for the growth rate of labor. Although the growth rate of population is different
from the growth rate of labor and might have different effects to the GDP growth, the
quality of the data on population growth is better. It is because different countries
have different definitions of labor and the measurements of labor growth are also not
identical. It makes the labor growth rates become incomparable. Therefore, it is
common for researchers to use population growth as a proxy.
The average schooling years in the total population over age 25 is used as a proxy for
12

human capital stock. We also add the variable, political instability, into our model to
capture the political effect. Political instability is defined as average of the number of
assassinations per million population per year and the number of revolutions per year
over the period. The annual growth rate of a variable is approximated by finding the
compound interest rate over the period 1970-1985.1
The correlation coefficients and descriptive statistics of variables are presented in
table 1.
TABLE 1
Correlation Coefficients and Descriptive Statistics GR ETHNIC y0 POPG IY HUM GOV INSTABGR 1.00 ETHNIC -0.15 1.00 y0 -0.22 -0.42 1.00 POPG 0.17 0.48 -0.70 1.00 IY 0.38 -0.41 0.43 -0.42 1.00 HUM -0.03 -0.45 0.86 -0.73 0.50 1.00 GOV -0.18 0.25 -0.25 0.20 -0.26 -0.15 1.00 INSTAB -0.21 0.20 -0.31 0.18 -0.28 -0.26 0.02 1.00 Mean 0.0365 0.4176 2953 0.0229 0.1474 4.470 0.1850 0.3079
Std. Dev. 0.0245 0.2984 4261 0.0150 0.0566 2.771 0.0701 0.4018
Note. GR = growth rate of real GDP, ETHNIC = index for ethnicity, y0 = real GDP per capita at 1970,
POPG = population growth rate, IY = ratio of private investment to real GDP, HUM = average
schooling years in the total population over age 25, GOV = share of government consumption in real
GDP, INSTAB = index for political instability.
1 For instance, the annual real GDP growth rate over 1970 to 1985 is estimated by finding r in the formula, GDP1970*(1+r)15=GDP1985
13

5. Empirical Analysis
We use the ordinary least squares method (OLS) for regressions to estimate the effect
of ethnicity on the economic growth and the White Heteroskedasticity-adjusted t
statistics are reported. The results are shown in the following table:
TABLE 2
The Effect of Ethnicity on the Growth Rate
Estimation: B1 B2 B3 B4 Dependent variables Independent variables
GR GR GR GR
ETHNIC -0.026734
(-3.05)
-0.012226
(-1.40)
-0.022437
(-2.45)
-0.023886
(-2.81)
y0 -1.41E-06
(-1.00)
-3.66E-06
(-2.48)
-6.86E-06
(-3.93)
-2.31E-06
(-1.60)
POPG 0.445710
(1.16)
0.386919
(1.09)
0.651735
(1.75)
0.433959
(1.19)
IY 0.231886
(5.43)
HUMAN 0.006225
(3.99)
GOV -0.103126
(-3.08)
INSTAB
Constant 0.041128
(3.74)
0.008782
(0.83) 0.023839
(2.02)
0.061687
(4.81) R2 0.11 0.33 0.24 0.18 No of obs. 109 101 88 109 Note: White heteroskedasticity-adjusted t statistics are reported. The t statistics are in parentheses.
14

TABLE 2 (Con’t) The Effect of Ethnicity on the Growth Rate
Estimation: B5 B6 B7 B8 Dependent variables Independent variables
GR GR GR GR
ETHNIC -0.023391
(-2.83)
-0.011328
(-1.19)
-0.014949
(-1.67)
-0.010084
(-1.07)
y0 -2.96E-06
(-2.09)
-7.44E-06
(-3.73)
-8.84E-06
(-5.08)
-8.11E-06
(-4.00)
POPG 0.361387
(0.98)
0.762692
(2.31)
0.587392
(1.72)
0.694660
(2.06)
IY 0.206686
(4.01)
0.189851
(3.80)
HUMAN 0.004835
(3.14)
0.006431
(4.48)
0.004768
(3.08)
GOV -0.079699
(-2.93)
-0.110497
(-3.32)
-0.081973
(-2.99)
INSTAB -0.019035
(-4.07)
-0.018608
(-4.31)
-0.014341
(-3.84)
Constant 0.053045
(4.82) 0.008031
(0.64)
0.052554
(4.18)
0.018307
(1.44)
R2 0.23 0.45 0.38 0.49 No of obs. 104 84 86 83 Note: White heteroskedasticity-adjusted t statistics are reported. The t statistics are in parentheses.
In table 2, estimation B1 indicates that ethnicity has a significant negative effect on
the real GDP growth rate when all the transmission channels are excluded in the
regression. Estimations B2 to B5 show the effects of ethnicity to the real GDP growth
rate when the possible transmission channels, which are the share of investment,
human capital stock, share of government consumption and political instability, are
added to the regression independently. As expected, the magnitude and significant
15
levels of the ETHNIC coefficient in B2 to B5 are smaller that in B1. This shows that
there may be muticollinearity problems between ethnic and the mentioned
transmission channels.
From estimation B1 to B2, B6, B8, we can observe that when more and more
variables are added to the estimations, the coefficients and significant levels of
ETHNIC decrease continuously. The magnitude and the significant level of the
ETHNIC coefficient are the lowest in estimation B8 when all the possible
transmission channels are included.
In the next section, we will estimate the direct effect of ethnicity and the indirect
effect of the transmission channels caused by ethnicity to the GDP growth.
16

6. The Transmission Channels
There are four transmission channels in our model, they are: the Investment Channel,
the Human Capital Channel, the Government Consumption Channel and the Political
Instability Channel. We will estimate each channel individually first and then analyze
their effects when they are all included in the regression.
6.1 The Investment Channel
When ethnicity is high (e.g. many ethnic groups of same size), in rent-seeking models,
the resources spent by each group in order to obtain political influence (e.g. time,
labor, etc.) can be considered as a social cost that has a negative effect on economic
growth because it implies a non-productive usage of these inputs. This would clearly
reduce the investment in the productive sector (Montalvo and Reynal-Querol, 2003).
If the growth rate of real GDP depends on the share of investment and the share of
investment is affected by ethnicity, the effect of ethnicity on the real GDP growth rate
can be decomposed as:
(7) ⎟⎠⎞
⎜⎝⎛
∂∂
∂∂
+∂
∂=
ETHNICIY
IYGR
ETHNICGR
dETHNICdGR
To find out the effect of ethnicity to share of investment, we estimate the effect of
ethnicity on share of investment together with the non-transmission variables by OLS
17

method:
(8) IY = -0.044320 ETHNIC + 9.05E-06 y70 + 0.197330 POPG + 0.141319 (-2.61) (3.32) (0.24) (6.20) R2 = 0.26 No. of observations = 101
Equation (8) indicates that ethnicity has a negative effect on the share of investment.
The direct effect of ethnicity on the real GDP growth rate is shown in the coefficient
of ETHNIC in estimation B2, while that in B1 incorporates the direct effect and the
indirect effect from the share of investment. As the indirect effect from the investment
channel is captured in estimation B2, the magnitude of the coefficient in B2 is
expected to be smaller than that in B1.
Base on equation (8), regression B1 and B2, we can calculate the role of the share of
investment by using equation (7). The results are reported in Table 3. We can see that
about 38% of the growth rate reduction is due to the investment channel.
TABLE 3
The Investment Channel Direct Effect Investment channel(a) Total effect(b) (a)/(b)-0.012226 0.231886*(-0.044320) = -0.010277 -0.026734 0.384
[-0.012226+(a)=-0.022503] Note: The summation inside the brackets […] is calculated total effect based on Equation (8) and B2,
while the estimated total effect is drawn from the result in B1.
18

6.2 The Human Capital Channel
As the ethnic group which controls the government usually chooses the policy which
favors its own ethnic group (Easterly and Levine, 1997), public good such as
schooling brings less satisfaction to everyone in a high ethnicity country because of
the preferences for language of instruction, curriculum, location, etc. Therefore, less
of the public good is chosen by society (Alesina and Spolaore, 1997). Alesina, Baqir,
and Easterly (1997) also found that a variety of public goods including schools and
libraries worsened or received less funding with higher ethnicity in a sample of U.S.
cities. Obviously, ethnicity has a negative effect to human capital stock. If the real
GDP growth rate is affected by human capital stock, the effect of ethnicity can be
decomposed as:
(9) ⎟⎠⎞
⎜⎝⎛
∂∂
∂∂
+∂
∂=
ETHNICHUMAN
HUMANGR
ETHNICGR
dETHNICdGR
We estimate the effect of ethnicity on human capital by following regression:
(10) HUMAN = -0.651840 ETHNIC + 0.000725 y70 - 58.63595 POPG + 3.871830
(-1.22) (6.91) (-2.63) (5.31) R2 = 0.76 No. of observations = 88
As we expected, equation (10) indicates that ethnicity has a negative effect on the
level of human capital. The direct effect of ethnicity on the real GDP growth rate is
shown in the coefficient of ETHNIC in estimation B3, while that in B1 incorporates
19

the direct effect and the indirect effect from the human capital channel. As the indirect
effect from the human capital channel is captured in estimation B3, the magnitude of
the coefficient in B3 is expected to be smaller than that in B1.
Base on equation (10), regression B1 and B3, we can calculate the role of the human
capital by using equation (9). The results are reported in Table 4, showing that the
human capital channel account for about 15% of the effect of ethnicity.2
TABLE 4 The Human Capital Channel
Direct Effect Human capital channel(a) Total effect(b) (a)/(b)-0.022437 0.006225*(-0.651840) = -0.004058 -0.026734 0.152
[-0.022437+(a)=-0.026495]
Note: The summation inside the brackets […] is calculated total effect based on Equation (10) and B3,
while the estimated total effect is drawn from the result in B1.
6.3 The Government Consumption Channel
When ethnicity is high, government increases public expenditure in order to mitigate
potential conflict. It contributes a negative effect on economic growth since it diverts
resources from the private sector. (Montalvo and Reynal-Querol, 2003). Therefore, if
the real GDP growth rate is affected by share of government consumption to real GDP 2 We use the estimated effect of ethnicity on human capital in equation (10) for calculation in Table 4, although the coefficient is statistically insignificant. Statistical insignificance may be due to the absence of a functional relationship between the variables or to multicollinearity among the independent variables or because the relationship is relatively small. Since the estimated result is consistent with the calculated results shown in Table 4, we adopt the last interpretation.
20

and share of government consumption to real GDP is affected by ethnicity, we can
decompose the effect by:
(11) ⎟⎠⎞
⎜⎝⎛
∂∂
∂∂
+∂
∂=
ETHNICGOV
GOVGR
ETHNICGR
dETHNICdGR
To find out the indirect effect of ethnicity to share of government consumption, we
estimate the effect by following regression:
(12) GOV = 0.027619 ETHNIC -8.65E-06 y70 -0.113950 POPG + 0.199360
(1.17) (-2.65) (-0.13) (9.00) R2 = 0.13 No. of observations = 109
Equation (12) indicates that ethnicity has a positive effect on the share of government
consumption. The direct effect of ethnicity on the real GDP growth rate is shown in
the coefficient of ETHNIC in estimation B4, while that in B1 incorporates the direct
effect and the indirect effect from the share of government consumption. As the
indirect effect from the government consumption channel is captured in estimation B4,
the magnitude of the coefficient in B4 is expected to be smaller than that in B1.
Base on equation (12), regression B1 and B4, we can calculate the role of the share of
government consumption by using equation (11). According to the results reported in
Table 5, the government consumption channel contributes about 11% of the growth
21

rate reduction.3
TABLE 5 The Government Consumption Channel
Direct Effect Government consumption channel(a) Total effect(b) (a)/(b)-0.023886 -0.103126*(0.027619) = -0.002848 -0.026734 0.107
[-0.023886+(a)=-0.026734]
Note: The summation inside the brackets […] is calculated total effect based on Equation (12) and B4,
while the estimated total effect is drawn from the result in B1.
6.4 The Political Instability Channel
Some researchers show that religious and ethnic polarization have a negative effect on
growth through the increase in the probability of civil wars (Montalvo and
Reynal-Querol, 2000). Although we do not include the effect of civil wars in our
definition of political instability, it is conceivable that ethnicity make the overall
political environment more instable. If the real GDP growth rate is affected by
political instability, we can decompose the effect of ethnicity to political instability by
equation (13):
(13) ⎟⎠⎞
⎜⎝⎛
∂∂
∂∂
+∂
∂=
ETHNICINSTAB
INSTABGR
ETHNICGR
dETHNICdGR
We estimate the effect of ethnicity on political instability by following regression:
(14) INSTAB = 0.166554 ETHNIC - 6.77E-05 y70 -7.101680 POPG + 0.559634 (1.35) (-4.44) (-1.74) (4.02) R2 = 0.13 No. of observations = 104 3 The reason to use the insignificant result in equation (12) is similar to footnote 2
22

Equation (14) indicates that ethnicity has a positive effect on the political instability.
The direct effect of ethnicity on the real GDP growth rate is shown in the coefficient
of ETHNIC in estimation B5, while that in B1 incorporates the direct effect and the
indirect effect from the political instability channel. As the indirect effect from the
political instability channel is captured in estimation B5, the magnitude of the
coefficient in B4 is expected to be smaller than that in B1.
Base on equation (14), regression B1 and B5, we can calculate the role of the share of
government consumption by using equation (13). The results are reported in Table 6.
It indicates that about 12% of the growth rate reduction is due to the political
instability channel.4
TABLE 6
The Political Instability Channel Direct Effect Political instability channel(a) Total effect(b) (a)/(b)-0.023391 -0.019035*(0.166554) = -0.003223 -0.026734 0.121
[-0.023391+(a)=-0.026614]
Note: The summation inside the brackets […] is calculated total effect based on Equation (14) and B5,
while the estimated total effect is drawn from the result in B1.
4 The reason to use the insignificant result in equation (14) is similar to footnote 2
23

6.5 Decomposition of the Transmission Channels
Since the share of investment, the human capital level, the share of government
consumption and the political instability level are not independent of each other,
analyzing the channels individually will lead to biased results. Therefore, we should
analyze all the plausible channels simultaneously. The effects of ethnicity and
different channels can be calculated by following equation:
(15) ∑ ⎟⎠⎞
⎜⎝⎛
∂∂
∂∂
+∂
∂=
TV ETHNICTV
TVGR
ETHNICGR
dETHNICdGR
where TV = IY, HUMAN, GOV and INSTAB.
Refer to the results of estimation B1, B8 and equations (8), (10), (12), (14), the direct
impact of ethnicity, effects of the four different channels are shown in table 7:
TABLE 7
Decomposition of the Transmission Channels
Model Direct Impact(a) Investment channel(b) Human Capital Channel
(c) B8 -0.010084 0.189851*(-0.044320) 0.004768*(-0.651840)
{0.377} = -0.008414 {0.321} =-0.003108 {0.137}
Government
consumption Channel(d) Political Instability
Channel(e) Overall Effect
-0.081973*0.027619 -0.0114341*0.166554 -0.026734
=-0.002264 {0.088} =-0.002389 {0.094} [-0.026259]
Note: The number inside the brackets […] is the calculated total effect that is equal to the summation of
(a), (b), (c), (d), (e), while that inside the braces {…} is the ratio of the respective channel to the overall
effect.
24

According to regression B1, the overall effect of ethnicity on the real GDP growth
rate is -0.0267 or 0.306 in elasticity terms. This overall effect can be decomposed into:
(1) the direct impact, which accounts for 37.7% of overall effect; (2) investment
channel, which account for 32.1% of overall effect; (3) human capital channel, which
account for 13.7% of overall effect; (4) government investment channel, which
account for 8.8% of overall effect, and; (5) political instability channel, account for
9.4% of overall effect.
25

7. Limitation
In this paper, we use the same definition of ethnicity as Easterly and Levine(1997).
However, there are some critiques among this index.
Firstly, some researchers argued that Easterly and Levine did not consider the
difference between ethnic fragmentation and ethnic polarization (Arcand JL,
Guillaumont P, Guillaumont Jeanneney S, 2000). Ethic polarization refers to the case
when there are two ethnic groups with the same size (the ethnicity index = 0.5).
Montalvo and Reynal-Querol (2000) showed that ethnic fractionalization has a direct
negative effect on economic development while religious and ethnic polarization have
a negative effect on growth through the reduction of investment, the increase in
government expenditure and the increase in the probability of civil wars.
Secondly, this index is a bit outdated. The index is basically formed in 1964, which is
40 years ago. Ethnicity may have changed due to factors including the education
policy, the language of instruction, and the change of official language. So the data
may not be able to reflect the real situation of ethnicity.
26

The reason why we insist in using the definition of ethnicity as Easterly and Levine is
that we want to keep our model simple, so we did not consider differentiating the
concept between ethnic fragmentation and ethnic polarization. Also, the data in our
model started at 1970, the time difference between other variables and the ethnicity
index is acceptable.
Besides the index of ethnicity, the definition of political instability is also arguable.
Different researchers have different definitions on political instability. Since all the
variables except ethnicity are in the same data set assembled by Robert Barro and
Jong-Wha Lee, we also choose the political instability in this data set for the reason of
simplicity. However, this data may not be the best data reflecting political instability.
27

8. Conclusion
Ethnicity is indeed an important and complex factor to growth. As stated in the part of
limitation, this report certainly does not give a complete and perfect framework about
the effect of ethnicity on growth. However, we have tried to show that ethnicity has a
direct effect and an indirect effect through the four transmission channels: the
investment channel, the human capital channel, the government consumption channel
and the political instability channel.
We find that with one-unit increase in the ethnicity (i.e. change from complete
homogeneity to complete heterogeneity), the real GDP growth rate reduces by 2.67
percentage points, or express differently, a 1% increase in the ethnicity index
reduces the growth rate by about 0.306%. The direct effect accounts for about 38% of
overall effect. Among the transmission channels, the most important one is the
investment channel, which accounts for 32%, and then followed by the human capital
channel, political instability channel and government consumption channel
respectively. These four channels are what we are interested in our model. However,
we do not mean that ethnicity is solely related to these four channels. For other
possible channels, they are out of the scope of this paper.
28
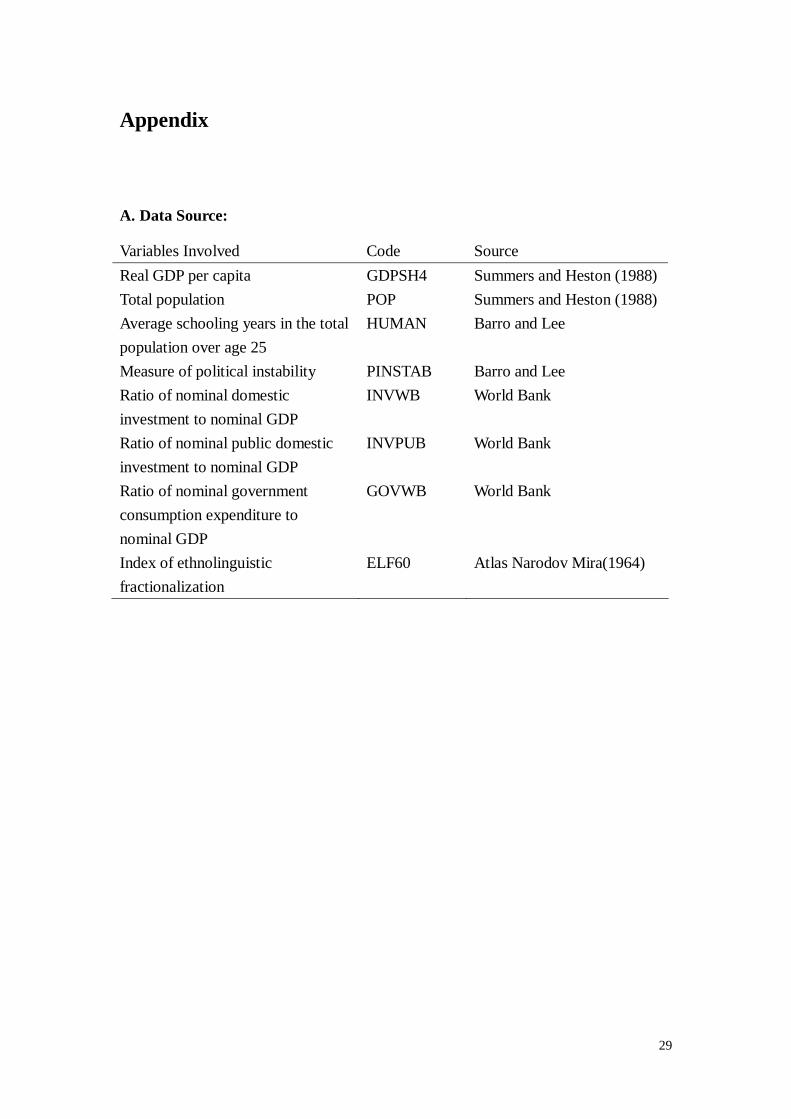
Appendix
A. Data Source:
Variables Involved Code Source Real GDP per capita GDPSH4 Summers and Heston (1988) Total population POP Summers and Heston (1988) Average schooling years in the total population over age 25
HUMAN Barro and Lee
Measure of political instability PINSTAB Barro and Lee Ratio of nominal domestic investment to nominal GDP
INVWB World Bank
Ratio of nominal public domestic investment to nominal GDP
INVPUB World Bank
Ratio of nominal government consumption expenditure to nominal GDP
GOVWB World Bank
Index of ethnolinguistic fractionalization
ELF60 Atlas Narodov Mira(1964)
29

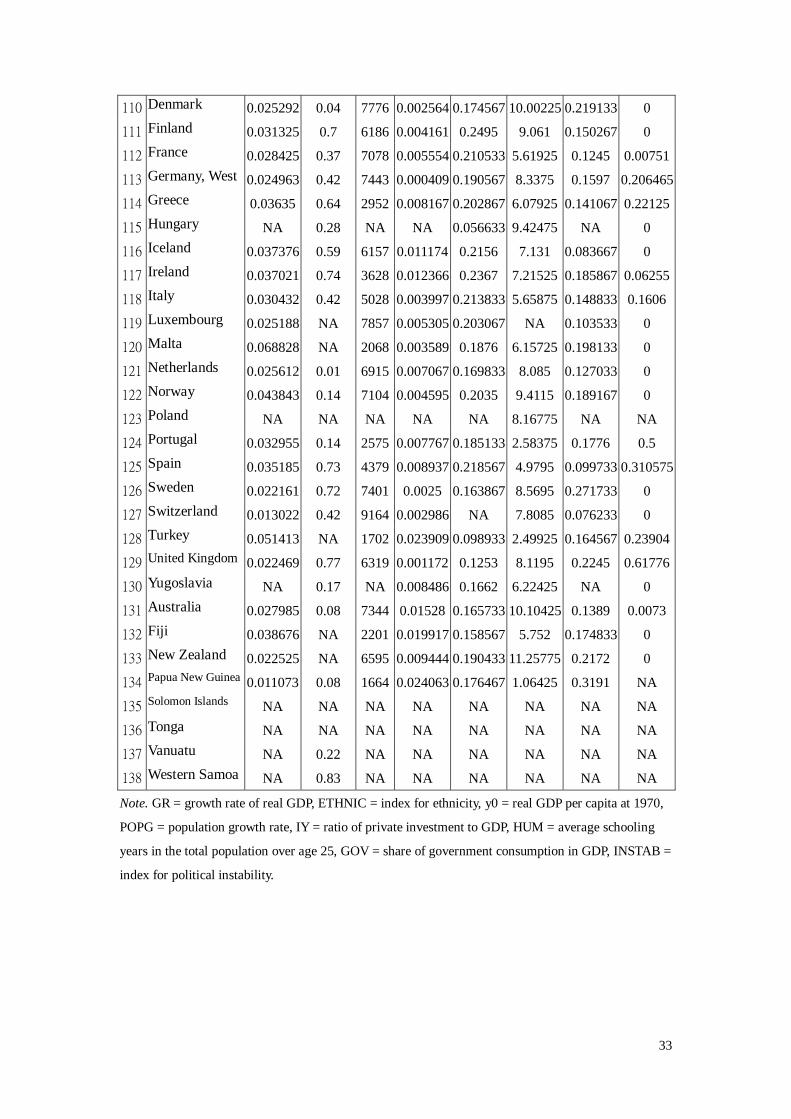
B. Data Set
Obs. Country Name GR ETHNIC y0 POPG IY HUM GOV INSTAB
1 Algeria 0.053618 NA 1551 0.031184 0.090267 1.54275 0.170833 0
2 Angola -0.01215 0.78 1146 0.030378 NA NA 0.258867 NA
3 Benin 0.020738 NA 571 0.02647 0.081333 NA 0.1817 NA
4 Botswana 0.086621 NA 881 0.037551 0.283367 2.292 0.2513 0
5 Burkina Faso 0.038183 0.31 305 0.023618 0.1034 NA 0.247067 0.5
6 Burundi 0.026073 NA 315 0.019869 0.030133 NA 0.203233 0.3286
7 Cameroon 0.059167 0.32 703 0.028333 0.091767 NA 0.1695 0.1
8 Cape verde NA 0.13 NA 0.012983 NA NA NA NA
9 Central African Rep. 0.01309 0.04 511 0.024181 0.046933 0.73 0.287533 0.4
10 Chad -0.01909 0.55 466 0.02141 NA NA 0.332233 1.3476
11 Comoros NA 0.62 NA 0.035592 NA NA NA NA
12 Congo 0.049723 NA 992 0.028991 NA NA 0.236933 0.52
13 Egypt 0.062745 NA 671 0.023033 0.1591 NA 0.247067 0.202815
14 Ethiopia 0.01654 NA 341 0.023019 0.063 NA 0.188 1.6347
15 Gabon 0.073875 NA 2082 0.045684 0.251533 NA 0.127333 0
16 Gambia 0.02704 NA 566 0.03207 0.066933 NA 0.280667 0.1
17 Ghana -0.00583 0.68 568 0.02698 0.047167 2.42625 0.171967 0.6
18 Guinea 0.027279 0.07 386 0.016526 NA NA 0.201467 0.36125
19 Guinea-Bissau NA 0.22 NA 0.034484 NA NA NA NA
20 Cote d'Ivoire 0.032338 NA 1028 0.040006 0.133667 NA 0.248433 0
21 Kenya 0.043478 NA 552 0.037925 0.152733 2.06775 0.250867 0.1073
22 Lesotho 0.078246 0.47 360 0.024867 0.128833 3.137 0.260667 0.17
23 Liberia 0.006441 0.51 708 0.0313 0.1413 1.2515 0.253633 0.4
24 Madagascar 0.007662 0.69 673 0.028235 0.093633 NA 0.174467 NA
25 Malawi 0.050331 0.75 301 0.03288 0.156267 2.247 0.2529 0.01465
26 Mali 0.032527 0.5 317 0.024763 0.1451 0.4645 0.2922 0.3
27 Mauritania 0.066786 0.14 1025 0.024908 0.1549 NA 0.158633 0.4
28 Mauritius 0.036865 NA 876 0.014164 0.1647 3.9855 0.217433 0
29 Morocco 0.022104 0.86 570 0.024541 0.121033 NA 0.321333 0.2062
30 Mozambique -0.01852 0.89 1020 0.025522 NA 0.85875 0.211267 NA
31 Niger 0.0359 0.66 401 0.031249 0.111133 0.53125 0.166 0.2
32 Nigeria 0.02739 0.06 630 0.032951 0.1109 NA 0.136567 0.501305
33 Rwanda 0.050125 NA 268 0.033395 0.091667 NA 0.167967 0.2
30

34 Senegal 0.028356 NA 760 0.0289 0.1167 1.989 0.264767 0
35 Seychelles NA 0.07 NA NA NA NA NA NA
36 Sierra Leone 0.019285 NA 459 0.021699 0.078167 1.43725 0.170867 0.137
37 Somalia 0.032511 0.35 374 0.037482 0.242867 NA 0.319767 0.4
38 South africa 0.028 NA 3609 0.022962 0.1557 4.641 0.147133 0.12304
39 Sudan 0.014711 0.03 683 0.030728 0.097033 0.59825 0.231067 1.207
40 Swaziland 0.063884 NA 743 0.03117 NA 2.906 0.219467 0.1
41 Tanzania 0.051096 NA 283 0.035332 0.116667 2.192 0.328367 0.1069
42 Togo 0.008669 0.05 644 0.027354 0.147933 1.29425 0.1825 0.1
43 Tunisia 0.068411 0.04 1076 0.023471 0.125533 1.63675 0.167 0
44 Uganda 0.030659 0.43 352 0.031643 0.0657 1.467 0.199733 0.76355
45 Zaire -0.00685 0.53 358 0.029099 0.073267 1.60875 0.1731 0.404465
46 Zambia 0.014331 0.04 789 0.034882 0.045333 3.1215 0.366133 0.1
47 Zimbabwe 0.041677 0.44 810 0.030809 0.1298 2.25625 0.1631 0.6981
48 Bahamas, The NA 0.69 NA NA NA NA NA NA
49 Barbados 0.038139 0.16 3147 0.003802 0.173433 7.8985 0.1556 0
50 Canada 0.03636 NA 8495 0.011674 0.1984 9.6445 0.134933 0.0094
51 Costa Rica 0.03835 0.26 2300 0.02859 0.168233 4.5595 0.219833 0
52 Dominica NA 0.69 NA NA NA NA NA NA
53 Dominican Rep. 0.049497 0.32 1232 0.025108 0.176867 3.5165 0.0874 0.222
54 El Salvador 0.010655 0.71 1358 0.019136 0.145167 2.93575 0.206833 1.8525
55 Grenada NA 0.75 NA NA NA NA NA NA
56 Guatemala 0.031001 NA 1544 0.028213 0.111133 2.133 0.0764 1.613
57 Haiti 0.026933 0.73 550 0.01757 0.123933 1.3025 0.151567 0.3198
58 Honduras 0.033515 NA 927 0.034715 0.128133 2.5745 0.159767 0.3
59 Jamaica -0.00844 NA 2422 0.014252 0.141433 3.59475 0.2146 0.191
60 Mexico 0.045775 0.1 3063 0.027589 0.137733 3.67675 0.086933 0.004505
61 Nicaragua 0.021856 NA 2292 0.031561 NA 2.8235 0.181967 0.5905
62 Panama 0.046631 0.64 2093 0.02384 0.175233 5.49425 0.262633 0.0655
63 St.Lucia NA 0.58 NA NA NA NA NA NA
64 St.Vincent & Grens. NA 0.02 NA NA NA NA NA NA
65 Trinidad & Tobago 0.012254 0.16 6957 0.012966 0.160433 5.7405 0.0949 0.1
66 United States 0.029473 0.01 9459 0.010346 0.1376 11.14725 0.1526 0.002288
67 Argentina 0.006532 NA 4002 0.015838 0.1149 6.30575 0.091433 1.1085
68 Bolivia 0.017479 0.68 1237 0.026159 0.126967 3.91425 0.198333 1.686
69 Brazil 0.065908 0.76 1782 0.023382 0.130333 3.0405 0.121767 0
70 Chile 0.012562 0.89 3687 0.016353 0.080233 5.84325 0.200533 0.41455
71 Colombia 0.051529 0.04 1711 0.022628 0.119933 3.96375 0.110167 0.0387
31

72 Ecuador 0.066309 0.05 1403 0.029192 0.144633 4.51825 0.154533 0.5
73 Guyana -0.00646 0.2 1546 0.007238 0.117067 4.51 0.3383 0.658
74 Paraguay 0.066777 0.04 1189 0.030564 0.202067 4.32925 0.119033 0
75 Peru 0.020792 0.05 2285 0.026099 0.1534 4.83525 0.161267 0.2217
76 Suriname 0.028903 0.05 2365 0.001945 NA NA 0.2563 NA
77 Uruguay 0.004772 0.01 3453 0.004597 0.088967 5.6815 0.167567 0.142
78 Venezuela -0.00872 0.83 6608 0.033238 0.191467 4.24825 0.1307 0.0076
79 Afghanistan NA NA 664 0.004256 NA 0.837 0.103 0.938
80 Bahrain NA NA NA 0.045528 NA 3.094 0.126867 0.1
81 Bangladesh 0.052132 NA 458 0.028177 0.063033 1.38025 0.087433 0.40465
82 Myanmar (Burma) 0.045123 0 398 0.021965 NA 1.39775 0.192033 0.7
83 China NA NA NA 0.016355 0.137633 NA NA 0.1
84 Hong Kong 0.087932 NA 3555 0.021905 0.2387 6.257 0.046767 0
85 India 0.040151 0.83 576 0.022007 0.139933 2.51625 0.207567 0.101376
86 Indonesia 0.085695 NA 490 0.022255 0.150167 2.938 0.1147 0.1
87 Iran, I.R. of 0.053618 NA 2816 0.030603 NA 2.17525 0.172767 0.56495
88 Iraq 0.024657 0.47 3317 0.035977 NA 2.115 0.218033 0.72885
89 Israel 0.041334 0.22 4861 0.023813 0.205433 8.57925 0.383767 0.05705
90 Japan 0.046973 0.15 5496 0.00984 0.245933 7.67875 0.0789 0.00183
91 Jordan 0.054086 0.53 1421 0.026571 0.1527 2.90175 0.3007 0.5715
92 Korea 0.082529 0.06 1189 0.016501 0.215867 6.55275 0.14 0.605555
93 Kuwait 0.000679 NA 34024 0.057459 0.064133 4.54 0.076267 0.082
94 Malaysia 0.081406 0.3 1525 0.02482 0.175567 4.324 0.157267 0.10815
95 Nepal 0.028784 0.78 506 0.026129 0.0915 0.45 0.095267 0
96 Oman 0.048157 0.08 7308 0.043685 NA NA 0.3383 NA
97 Pakistan 0.056264 NA 797 0.030578 0.071767 1.75725 0.151067 0.60837
98 Philippines 0.040984 0.65 1094 0.025939 0.2027 5.6815 0.178433 1.13897
99 Saudi Arabia 0.033 0.33 7405 0.047929 0.091 NA 0.1392 0.0138
100 Singapore 0.100843 NA 2869 0.014049 0.3237 4.0215 0.0999 0
101 Sri Lanka 0.045392 NA 1018 0.016982 0.1159 5.14375 0.208133 0.2128
102 Syria 0.077536 0.58 1581 0.034826 0.0781 2.76025 0.157967 0.65835
103 Taiwan 0.07843 0.62 1514 0.018279 0.1645 5.68425 0.207467 0.1068
104 Thailand 0.065236 0.72 1063 0.024781 0.185067 4.0375 0.126967 0.702295
105 United Arab Emirates 0.079145 NA 23937 0.127493 NA NA 0.070667 0.9395
106 Yemen, N.Arab 0.074178 0.73 527 0.0308 0.138533 NA 0.220567 0.5051
107 Austria 0.029505 0.87 5843 0.000808 0.229233 6.2205 0.156233 0
108 Belgium 0.026002 0.18 6750 0.001381 0.1785 8.50525 0.133533 0
109 Cyprus 0.04358 0.1 3028 0.005225 0.2314 6.7745 0.157033 0.854
32
110 Denmark 0.025292 0.04 7776 0.002564 0.174567 10.00225 0.219133 0
111 Finland 0.031325 0.7 6186 0.004161 0.2495 9.061 0.150267 0
112 France 0.028425 0.37 7078 0.005554 0.210533 5.61925 0.1245 0.00751
113 Germany, West 0.024963 0.42 7443 0.000409 0.190567 8.3375 0.1597 0.206465
114 Greece 0.03635 0.64 2952 0.008167 0.202867 6.07925 0.141067 0.22125
115 Hungary NA 0.28 NA NA 0.056633 9.42475 NA 0
116 Iceland 0.037376 0.59 6157 0.011174 0.2156 7.131 0.083667 0
117 Ireland 0.037021 0.74 3628 0.012366 0.2367 7.21525 0.185867 0.06255
118 Italy 0.030432 0.42 5028 0.003997 0.213833 5.65875 0.148833 0.1606
119 Luxembourg 0.025188 NA 7857 0.005305 0.203067 NA 0.103533 0
120 Malta 0.068828 NA 2068 0.003589 0.1876 6.15725 0.198133 0
121 Netherlands 0.025612 0.01 6915 0.007067 0.169833 8.085 0.127033 0
122 Norway 0.043843 0.14 7104 0.004595 0.2035 9.4115 0.189167 0
123 Poland NA NA NA NA NA 8.16775 NA NA
124 Portugal 0.032955 0.14 2575 0.007767 0.185133 2.58375 0.1776 0.5
125 Spain 0.035185 0.73 4379 0.008937 0.218567 4.9795 0.099733 0.310575
126 Sweden 0.022161 0.72 7401 0.0025 0.163867 8.5695 0.271733 0
127 Switzerland 0.013022 0.42 9164 0.002986 NA 7.8085 0.076233 0
128 Turkey 0.051413 NA 1702 0.023909 0.098933 2.49925 0.164567 0.23904
129 United Kingdom 0.022469 0.77 6319 0.001172 0.1253 8.1195 0.2245 0.61776
130 Yugoslavia NA 0.17 NA 0.008486 0.1662 6.22425 NA 0
131 Australia 0.027985 0.08 7344 0.01528 0.165733 10.10425 0.1389 0.0073
132 Fiji 0.038676 NA 2201 0.019917 0.158567 5.752 0.174833 0
133 New Zealand 0.022525 NA 6595 0.009444 0.190433 11.25775 0.2172 0
134 Papua New Guinea 0.011073 0.08 1664 0.024063 0.176467 1.06425 0.3191 NA
135 Solomon Islands NA NA NA NA NA NA NA NA
136 Tonga NA NA NA NA NA NA NA NA
137 Vanuatu NA 0.22 NA NA NA NA NA NA
138 Western Samoa NA 0.83 NA NA NA NA NA NA
Note. GR = growth rate of real GDP, ETHNIC = index for ethnicity, y0 = real GDP per capita at 1970,
POPG = population growth rate, IY = ratio of private investment to GDP, HUM = average schooling
years in the total population over age 25, GOV = share of government consumption in GDP, INSTAB =
index for political instability.
33

REFERENCES Alesina, Alberto, and Enrico Spolaore, (1997), “On the Number and Size of Nations,” Quarterly Journal of Economics, CII (1997), 1027–1056. Alesina, Alberto, Reza Baqir, and William Easterly, (1997), “Public Goods and Ethnic
Divisions”, Harvard University and World Bank mimeo, March 1997. Annett Anthony, (2001), “Social Fractionalization, Political Instability, and the Size
of Government”, IMF Staff Papers, Vol. 48, No. 3, pp. 561-592 Arcand JL, Guillaumont P, Guillaumont Jeanneney S, (2000), “How to make a
Tragedy: on the Alleged Effect of Ethnicity on Growth”, Journal of International Development, J. Int. Dev. 12, pp. 925-938
Bluedorn, J. C., (2001), “Can Democracy Help? Growth and ethnic divisions”,
Economics Letters 70, 121-126. Collier P., (1999), “The Political Economy of Ethnicity“, in: B. Plleskovic, J. E.
Stiglitz (Eds.), Annual World Bank Conference on Development Economics, 1998. Easterly, William and Ross Levine, (1997), “Africa’s Growth Tragedy: Politics and
Ethnic, Divisions,” Quarterly Journal of Economics, Vol. 112, pp. 1203–50. Guillaumont P, Guillaumont Jeanneney S, Brun J-F, 1999, “How instability lowers
African growth”, Journal of African Economies, March: 87-107 La Porta R. Lopez de Silanes, F. Shleifer, and R. Vishiny, (1999), “The Quality of
Government”, Journal of Law Economics and Organization 15, 1, 222-279 Levine, Ross, and David Renelt, (1992), “A Sensitivity Analysis of Cross-Country
Growth Regressions”, American Economic Review 82: 942-63 Mauro, Paolo, (1995), “Corruption and Growth,” Quarterly Journal of Economics, CX
(1995), 681–712 Mo, Pak Hung, (2001), “Corruption and Economic Growth”, Journal of Comparative
Economics 29, pp66-79
34

Mo, Pak Hung, (2002), “Human Capital and Economic Growth: Alternative Estimation Methods”, BRC Working Papers, Hong Kong Baptist University
Montalvo, J. G., and Reynal-Querol, M., (2000), “The Effect of Ethnic and Religious
Conflict on Growth”, IVIE Working Paper. Montalvo, J. G., and Reynal-Querol, M., (2003), “Ethnic diversity, political systems
and conflict”, WeltTrends, 38:44–60, 2003a. Rodrik D., (1998), “Trade policy and economic performance in sub-Sharan Africa”,
NBER Working Paper No. 6562 Sachs J, Warner A, (1997), “Sources of slow growth in African economies”, Journal
of African Economies 6:335-376
35