effect of evaporation-condensation · effect of evaporation-condensation on photoacoustics of...
TRANSCRIPT

EFFECT OF EVAPORATION-CONDENSATIONON PHOTOACOUSTICS OF AEROSOLS
FINAL REPORT
GRANT NUMBER: N00014-99-1-0912
SUBMITTED TO:
OFFICE OF NAVAL RESEARCH
800 NORTH QUINCY STREETARLINGTON, VA 22217-5660
by
Richard Raspet and William V. SlatonNational Center for Physical Acoustics
University of MississippiUniversity, MS 38677
and
W. Patrick ArnottDesert Research InstituteAtmospheric Sciences Center
2215 Raggio ParkwayReno, NV 89215-1095
NCPA Report LF0700-01
JULY 5, 2000
DISTRIBUTION STATEMENTA 20000720 011Approved for Public ReleaseDistribution Unlimited Qt'A."I•'T• .

REPOT DCUMNTATON AGEForm ApprovedREPORT~~~ DOUETTINPGOMB No. 0704-0188
Public reporting burden for this collection of information is estimated to average 1 hour per response, including the time for reviewing instructions, searching existing data sources,gathering and maintaining the data needed, and completing and reviewing the collection of information. Send comments regarding this burden estimate or any other aspect of thiscollection of information, including suggestions for reducing this burden, to Washington Headquarters Services, Directorate for Information Operations and Reports, 1215 JeffersonDavis Highway, Suite 1204, Arlington, VA 22202-4302, and to the Office of Management and Budget, Paperwork Reduction Project (0704-0188), Washington, 00 20503.
1. AGENCY USE ONLY (Leave I2. RE PORT DATE 3. REPORT DYPE AND DATES COVEREDBlank) 1 O7 Jul 00 Final 01 Jul9 to 30 Jun 00
4. TITLE AND SUBTITLE S. FUNDING NUMBERSEffect of Evaporation-Condensation on Photoacoustics of Aerosols PE 61153N
G N00014-99-1-0912
6. AUTHOR(S)Richard Raspet, Wiliam V. Slaton and W. Patrick Arnott
7. PERFORMING ORGANIZATION NAME(S) AND ADDRESS(ES) 8. PERFORMING ORGANIZATION REPORTJamie L. Whitten National Center for Physical Acoustics NUMBERThe University of MississippiUniversity, MS 38677
9. SPONSORING / MONITORING AGENCY NAME(S) AND ADDRESS(ES) 10. SPONSORING/I MONITORING AGENCYOffice of Naval Research REPORT NUMBERONR 331800 North Quincy Street
Arlington, VA 22217-5660
11. SUPPLEMENTARY NOTES
12a. DISTRIBUTION / AVAILABILITY STATEMENT 12b. DISTRIBUTION CODEApproved for public release; Distribution unlimited
13. ABSTRACT (Maximum 200 words)This document reports on the preliminary investigation of relative humidity effects on light absorption by aerosols. The Desert Research Institute
took part in the Southern Great Plans Radiation Measurement and took simultaneous measurements of photoacoustic light absorption and light absorptionmeasured by filter methods as a function of relative humidity. The variation In relative humidity was controlled artificially. This work is described in detailIn Section L A detailed theory of the effect or evaporation-condensation on photoacoustic output has been developed at the University of Mississippi. Thistheory is valid over a wide span of particle sizes, particle densities and operating frequencies. This work is presented in Section HI.
14. SUBJECT TERMS Photoacoustics, relative humidity, light absorption, aerosols, evaporation, condensation 15. NUMBER OF PAGES32S
16. PRICE CODE
17. SECURITY CLASSIFICATION 18. SECURITY CLASSIFICATION 19. SECURITY CLASSIFICATION 20. LIMITATION OF ABSTRACTOF REPORT OF THIS PAGE OF ABSTRACTUNCLASSIFIED UNCLASSIFIED UNCLASSIFIED____________
NSN 7540-01-280-5500 Standard Form 298 (Rev. 2-89)Prescribed by ANSI Std. Z39-1298-102
TABLE OF CONTENTS
Page
SU M M A R Y .................................................................... 1.....
1. RELATIVE HUMIDlTY DEPENDENCE OF LIGHT ABSORPTION.............................. 1
2. THEORY OF THE EFFECT OF EVPORATION-CONDENSATION ONPHOTOACOUSTIC OUTPUT ........................................................................... 8
2.1 Introduction........................................................................................... 82.2 Theory................................................................................................. 82.3 Boundary Conditions............................................................................... 142.4 Solution.............................................................................................. 162.5 Analysis ............................................................................................. 222.6 Applications......................................................................................... 252.7 Conclusion .......................................................................................... 26
REFERENCES .................................................................................................. 16
EFFECT OF EVAPORATION-CONDENSATIONON PHOTOACOUSTICS OF AEROSOLS
FINAL REPORT
SUMMARY
This preliminary investigation of relative humidity effects on light absorption by aerosols has
been very successful. The Desert Research Institute (DRI) took part in the Southern Great Plains
Radiation Measurement and took simultaneous measurements of photoacoustic light absorption and
light absorption measured by filter methods as a function of relative humidity. The variation in
relative humidity was controlled artificially. This work is described in detail in Section I.
A detailed theory of the effect of evaporation-condensation on photoacoustic output has been
developed at the University of Mississippi. This theory is valid over a wide span of particle sizes,
particle densities and operating frequencies. This work is presented in Section II.
Richard Raspet, Pat Arnott and Hans Moosmiiller met at DRI in May 2000 to coordinate the
research effects and to plan future cooperative research. The measurements and theory will be
combined in the near future in the preparation of papers for publication, of experimental design and of
proposals for future research.
1. RELATIVE HUMIDITY DEPENDENCE OF LIGHT ABSORPTION
The photoacoustic instrument is used to obtain light absorption by aerosols, with applications
relevant to radiation transfer in the atmosphere, or more specifically, electro-optical imaging and
sensing. The photoacoustic instrument has the potential for obtaining the relative humidity
dependence of light absorption, whereas more common filter methods cannot provide a quantitative
measure due to moisture deposition on the substrate. For dry aerosols (RH<50%), the sound generated
in the instrument is due to the conversion to heat of the light absorbed by the aerosols. The aerosols
are sufficiently small that this heat transfers entirely to the surrounding air during the acoustic period.
1
However, for moist aerosols, vapor may be released from the heated aerosols, in addition to heat. In
the general case, the sound pressure level is due to both heat and mass transfer.
The contribution of mass transfer to the sound pressure level measured in a photoacoustic
instrument was investigated by performing measurements and theoretical analysis. The photoacoustic
instrument was transported to the Department of Energy, Southern Great Plains Atmospheric Radiation
Measurement in north central Oklahoma (abbreviated as SGP). An "aerosol trailer," among others, is
located at the SGP, and the purpose of this trailer is to measure optical and physical properties of
atmospheric aerosol. In particular, personnel from NOAA in Boulder, CO operate a system to vary the
relative humidity (RH) of the incoming air from 40% to 95%. This RH conditioner has been evaluated
by NOAA, and provided a very convenient means to accomplish the experimental component of the
effort. Ancillary instruments also present in the trailer were useful in quantifying aerosol properties
before the humidity conditioner. The relative humidity dependence of light absorption has not been
directly measured in the past due to the use of filter-based methods. The photoacoustic instrument was
described previously, 1'2 and the calibration can be verified with nitrogen dioxide gas.3
The data set from this project is outstanding. DRI personnel were present for the project (the
entire month of March, 2000), and the aerosol trailer was operated during this time to ensure good data
quality. A synopsis follows.
1. Aerosol light absorption measurements with 3 instruments.
a. Normal psap filter based instrument used at SGP.
b. Extra psap sitting on the humidified inlet.
c. DRI photoacoustic instrument on the humidified inlet.
2. Light absorption for dry and humidified aerosols was measured. Light absorptionmeasurements are among the more difficult to do. A great combination of aerosols wasavailable:
a. Cases of very clean air (background)
b. Cases of long-range transport of probably vehicle exhaust (tractors, interstate, roads, etc,mostly diesel perhaps?)
2

c. Cases of smoke plumes from farmer's fires.
3. Findings to date are:
a. The photoacoustic data correlates well with the DRY psap measurements. However, theexact value for light absorption is not settled yet. (Slope of correlation is not one, butappears to be around 1.6, with the photoacoustic instrument reporting less light absorptionthan the other instrument).
b. The photoacoustic data show no increase of light absorption with increase of RH, andperhaps a decrease. (Theory suggests perhaps a factor of 2 increase for carbon corescoated with an aqueous layer. But are light absorbing aerosols hygroscopic?)
c. The humidified PSAP shows erroneously high light absorption as the RH increases due tothe filter taking on aqueous solution from scattering aeroso. When the RH goes backdown, this psap shoots erroneously negative as well. It is very good that the SGP crewuses a dry psap for their measurements on a routine basis. It also calls into question allmeasurements ever taken with a psap at elevated RH, including those done on aircraft.
To evaluate the light absorption dependence, the ratio of light absorption obtained by the
photoacoustic instrument to that of the dry psap was computed and averaged over the entire data set.
This ratio is deemed the f(RH) function for light absorption, and is a dimensionless value. If f(RH)
increases as the RH increases, than the conclusion is that light absorption increases with RH as the
aerosols swell and moisten with increased RH. It may also be that the chain aggregate structure of the
carbonaceous aerosol collapses upon humidification. Another potential effect is that RH increases
cause aerosol losses in the sample lines to increase. It should be kept in mind that the analogous f(RH)
for scattering by aerosols is in the range of 2 to 4 for the RH around 95%.
Figure 1 shows the measured f(RH) for a 1 gim inlet on the sample line. First, the average ratio is
around 0.6, indicating that the psap light absorption is larger than the photoacoustic value. It would be
unity if both instruments reported the same light absorption. This calibration issue is likely to be
traced to the psap calibration method. Next, note that the f(RH) function decreases with RH. This
decrease could be due to at least the following three factors:
1. The sample lines begin to absorb particles as the RH increases.
3
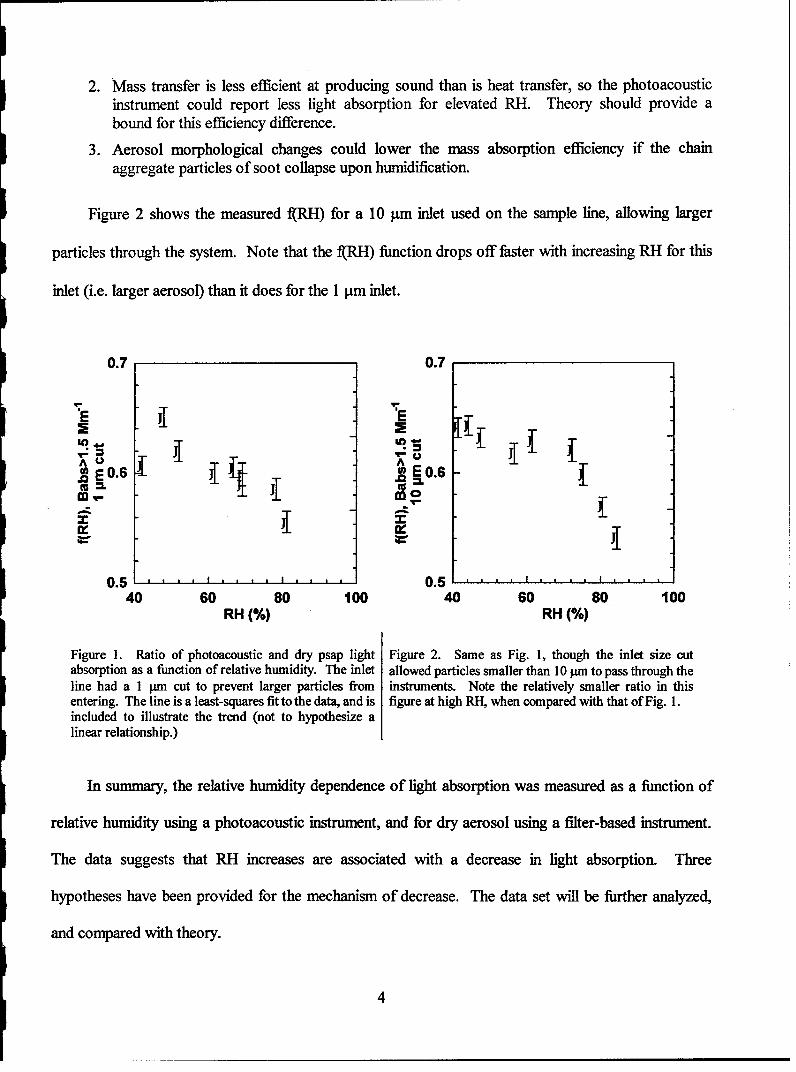
2. Mass transfer is less efficient at producing sound than is heat transfer, so the photoacousticinstrument could report less light absorption for elevated RH. Theory should provide abound for this efficiency difference.
3. Aerosol morphological changes could lower the mass absorption efficiency if the chainaggregate particles of soot collapse upon humidification.
Figure 2 shows the measured f(RH) for a 10 ptm inlet used on the sample line, allowing larger
particles through the system. Note that the t(RH) function drops off faster with increasing RH for this
inlet (i.e. larger aerosol) than it does for the 1 ptm inlet.
0.7 0.7
A Ao0.6
IJ
0.5 1 0.5 .40 60 80 100 40 60 80 100
RH (%) RH (%)
Figure 1. Ratio of photoacoustic and dry psap light Figure 2. Same as Fig. 1, though the inlet size cutabsorption as a function of relative humidity. The inlet allowed particles smaller than 10 pm to pass through theline had a 1 tun cut to prevent larger particles from instruments. Note the relatively smaller ratio in thisentering. The line is a least-squares fit to the data, and is figure at high RH, when compared with that of Fig. 1.included to illustrate the trend (not to hypothesize alinear relationship.)
In summary, the relative humidity dependence of light absorption was measured as a function of
relative humidity using a photoacoustic instrument, and for dry aerosol using a filter-based instrument.
The data suggests that RH increases are associated with a decrease in light absorption. Three
hypotheses have been provided for the mechanism of decrease. The data set will be further analyzed,
and compared with theory.
4
2. THEORY OF THE EFFECT OF EVPORATION-CONDENSATIONON PHOTOACOUSTIC OUTPUT
2.1 Introduction
DRI has developed photoacoustic spectrometers for the measurement of light absorption by
atmospheric aerosols.1 '2 A laser source is chopped near the resonant frequency of an acoustic resonator
containing the sample. The light absorbed by the aerosol in the beam heats the surrounding gas, driving
the acoustic wave in the resonator. The sound pressure level in the resonator is a measure of the light
absorption. The results of this technique have been compared to those from an aethalometer, a device
that measures the absorption of particles gathered on a filter medium. DRI is interested in the effects
of relative humidity on the adsorption of light by aerosols and on the effect of volatile components on
the calibration of the photoacoustic instrument.
M.B. Baker analyzed the effect of evaporation-condensation on the photoacoustics of volatile
aerosols in a non-resonant cell.4 Baker's analysis assumes that the aerosol particles do not interact and
that the photoacoustic cell is non-resonant. In this paper, we allow for high aerosol particle number
density effects and perform the Green's function source analysis as appropriate for resonant cells. The
analysis is based on the low reduced frequency method used previously to evaluate the effects of
evaporation-condensation on sound propagation in wet walled tubes.5 '6
2.2 Theory
The DRI photoacoustic cell is a flow through cell. The laser beam is much smaller than the area
of the resonate tube. We therefore assume that the residence time of the droplets in the beam is small
compared with the time for significant DC mass evaporation to occur. The laser excitation can be
considered as a DC component producing steady evaporation and heating and an AC component that
will alternately heat and cool the droplet. Our analysis will concentrate on the AC component. In
addition, we assume that each droplet of radius ro is surrounded by similar neighbors and that drop
5

inertia is high enough that each droplet supplies heat and vapor into its neighborhood of radius
a = 1/n1/3 where n is the aerosol particle density in m-3.
The governing equations are the Navier-Stokes equation, the continuity equation for each
component and for the mixture, the equation of state for the mixture, the entropy equation for the
mixture, and the diffusion equation for the mixture. In linearized form these are:7 "8
p 0 X = _Vp +/ItV2+ + 1. Y (V.v), (1)
d p, + POI(V~ - =0, (2a)
dt
d P2 + p2 (V v2 )0 (2b)
dt
+ p0 (V. i) =0, (2c)
-P + 7 nk -_ iV2T + kTnkT .(;I -i 2)0 (3)dt y-I at
at at M2 m at
and
; -V2=D210V2-10V -n (M2 _ml)Vpn2k VT .(5)
Pi2 P- PoPo njn 2 To
In these equations, variables, P1,I P 2 , are the density of the gas and of the vapor; p = P1 + P2 is the
density of the mixture; i- ,V-2 are the hydrodynamic velocity of the gas and of the vapor;
(=plýl + p 2i 2 )/p is the hydrodynamic velocity of the mixture; p is the pressure of the mixture; and
T is the temperature of the mixture. In the above equations, constant gi is the viscosity of the mixture;
6

Sis the bulk viscosity of the mixture; m 1 ,m 2 are the molecular mass of gas and vapor; n1 , n 2 are the
number density of the gas and of the vapor; n = n 1 + n 2 is the total number density; 71,'2 are the ratio
of specific heats of the gas and of the vapor; ny/(y-1)= n, 1/(r1 -1)+n 272 /(7 2 -1) is the ratio of
ncp/R for the mixture; Cp is the molar heat capacity at constant pressure; R is the universal gas
constant; IC is the thermal conductivity of the mixture; D 12 is the mass diffusion coefficient; kT is the
thermal diffusion ratio, as defined in Ref. 8, page 541; and k is the Boltzmann's constant.
The linearized heat equation for the droplet is given by,
E(p LCpLTL )- 1CL TL = Q(t) (6)Yt
where PL is the liquid density; cpL is the liquid heat capacity at constant pressure; 1cL is the heat
conductivity; TL is the temperature of the liquid; and Q(t) is the energy absorbed from the laser per unit
time per unit volume in the drop. Assuming single frequency excitation, we set Q(t) = Qe-i', where
Q,= a 1o with the absorption coefficient for the drop given by a and the intensity of the laser light
given by Io. We assume that the absorption of light energy is small enough so that the drop is evenly
heated. We assume also that the resulting diffusion and heat flow will be predominately radial and
define two dimensionless variables,
r1= -- , (7)
a
the dimensionless radius, and the reduced frequency,
L2 = (8)
C
7

Assuming that all the variables have an e-icat time dependence, where co is the angular frequency of the
modulated laser beam, we introduce normalized variables as follows:
P= P-c 2 (,0+ p*e-iO) (9a)
T = T,(1.0+ T*e-'a), (9b)
TL = T (1 + TLi e-), (9c)
-c - - ,* (9d)
and
v; - v2 = c V*e-i(f, (9e)
where c is the sound speed in the mixture.
Using the definitions above, the Navier-Stokes equation becomes
where A. a a /++4 y). Note that this definition of the dimensionless viscous wave number is not
the same as the shear wave number defined in Ref 5. The entropy equation is given by,
1* -lP-T*+i C' -T 1 (172 DT* ) y - 1kT (12V*)2 =0, (11)
where AT = a . The equation of state is combined with the continuity equations of each
component to form the equation of state in terms of p*, T*, v* and V*"
8

Up*-QT* ( (qV) inn2 1M - M2 )4 I 0(17 2V*) = .(12)
q 2 a,7 nf1 q 2 A917
The final equation results from combining the diffusion equation with the continuity relations;
i a 1 7(2v*) a n z p* n 2k 07""V * (, av1 -(ML• i)aP.fn, 12=0, (13)
DC917172 877 A2 ,, p0 817 q n2 O917
where 2 D = a(0D12 The temperature equation in the droplet is,
I 1 8(7 aTL iQo (14)TL - A2p tgC~L172 a17 ~ 817), CpLPLoJTO,
where AL =-a . Note this is defined with respect to the neighborhood radius a, not with respectFEL
to the drop radius r,. We can eliminate p* from the gas-vapor mixture equations resulting in the
following equations. Eqs. (11) and (12) form,
__[T-_i Y (1 27T + [nii4 i_ _nln2( _9 0.(qv)=0 (15)
Y-•L 4 rq2 Oy7t all J_ ;7 aq Lnp,,MIM -j• r A7
Eqs. (10) and (13) are combined to form,
""1-2 7 a (16)
n n2 0r POrl"*1 1
Finally, we eliminate Op from Eq. (10) and take the ri derivative of Eq. (12) to obtaina17
9
aimlnv +Li+ L D nvn2j j (17)
At this point, we note that the reduced frequency, 2, is small, even for low number density and
high operating frequency. (2 =- 0.04 for n = 350 particles/cm 3 and f = 2000 Hz). Accordingly, we
drop all terms in 2 2 from the equations:
a * (2*1r1,iL 2V*
K-1 [T*a(2aT - ii -Lr1 ) . n n 2 ) ]1r _ =0, (18)
4Y ~12 4 F dt il n,
Q n2kT * [ i a 0=, (19)XD n,n-- o " D D17
and
- 'T * - + i • -- n . (20 )
The term containing v* can be eliminated by combining Eqs. (18) and (20):
aT* i a (1 a (,72 T* .y-lkT a (1 2(02V* (21)
Equations (19) and (21) are coupled, second order differential equations for aT* and V*. The
coupling is provided by the thermal diffusion ratio, kT, that appears in the entropy equation from
diffusion across the control volume and in the diffusion equation for temperature driven diffusion.
These equations, combined with boundary conditions and the temperature equation in the drop,
represent a complete solution. The effect of the coupling on air-water mixtures has been investigated
10

in Ref 6. For photoacoustics in the atmosphere, the mole fraction of vapor will be very low (less than
0.05) and the effect of the coupling of the diffusion and thermal wave numbers low. In Ref 6, the
calculated fractional change in thermal and diffusive wave numbers for water vapor in air is less than
1 0 -4 for temperatures up to 30'C. The use of the low reduced frequency approximation and the modal
analysis of Ref 6 demonstrates that Baker's use of simplified hydrodynamic equations is justified for
this analysis for higher frequency devices. The boundary conditions for the solution of this problem
are developed within these approximations. Diffusion and thermal effects are assumed to dominate the
acoustic terms in the droplet neighborhood.
2.3 Boundary Conditions
The boundary conditions at the neighborhood boundary (r = a) are
V*G)= 0,(22a)
and,
=T0. (22b)
At the drop radius, r., the temperature must be continuous; the heat generated by condensation at
the surface must be carried away by the heat flux into the gas and droplet; and the diffusion velocity
can be calculated from the temperature at the drop radius. We require that the temperature in the drop,
T;, and the gas mixture, T*, be equal at the drop radius (rj = d)
T* = T*. (23)
Next, we require heat flux balance at the drop radius. In general, this can be written as,
i=IcVT- 1CLVTL, (24)
where • is the heat flux generated at the boundary. For a system undergoing a phase change at the
wall, the heat flux generated is written, i = e =£p° 2 r° where pO is the ambient vapora
density; v2 (r°) is the radial velocity of the vapor evaluated at the wall; and t is the latent heat ofa
vaporization. Thus, our boundary condition for the heat flux at 77 = ro/a becomes,
£p2 V2 = icVT- 1CLVTL. (25)
Use of the definition of the radial difference velocity, V*, yields the following equation for the heat
flux,
p2cV* R = T" -aT2] . (26)
Temperature fluctuations at the drop radius induce vapor pressure fluctuations. The Clausius-
Clapeyron equation,9
apor 17=r p, ex~ = 2 (R TREF r (27)
relates the vapor pressure to the temperature. An expression for the density of species 2 near the tube
wall can be derived from the ideal gas law and Eq. (27):
o TREF 'Mfm2 (1 1 I (28)
P21n1=r= P2 T72 exp _- _- 1 )r17='%
Linearizing with T = To0 (+ T*e-'") yields,
12

_P2 1+ 2_ T*e (29)2r ( R2 ),,=(9
where To is the ambient temperature of the system. The equation of continuity can be used to write
Eq. (29) in terms of V* and T*"
ii a (q2 V*) D QtMf2 _IJTi7 o (30),-•aqt r =" tRTo
q=ýa
The divergence of v* is dropped from this boundary condition since v* at the boundary is
smaller than V* by the ratio p 2 /p and v* is principally an acoustic wave with small spatial variation
compared to diffusion and heat conduction.'l The fourth boundary condition is that the time rate of
heat flow out of the drop at ro must equal the time rate of change in internal energy in the drop
neighborhood,
4r2 caT*r = -icji°,la CvpT** (q)4 3 '2dq" (31)4T "a aq ro
(31
Again, this boundary condition is only correct if the acoustic energy emission is negligible with respect
to the internal energy.
2.4 Solution
The set of differential equations to be solved are,
aT * I a I - (..7 ---, - 0 , (3 2 )a77 a1(72 173))
13
v zi V* -) 0, (33)
and
T--i I art2 aTL Qo (34)T 2 ý )77 art cpLpLfOTo
The solutions are in terms of spherical Bessel and Hankel functions. We choose solutions so that T£ is
finite at r =0 and so that aT* and V* are zero at r = a. The solutions are,
DT* =A f, (PrArT), (35)
V* B f, (jTt-A ), (36)
and
T= Djo(A4iiLr)+i Qo (37)CpLPLO)To
A, B and D are constants to be determined from the boundary conditions. fl (4ikq) and fo (0 riAr)
are defined as,
f (N)fi7)= A-- N(•2 41 o •'2) ( j'jr7) JTh ; ! (38)
and
f o (Ii ý, 77 ) = ~i.A] 77 0to[h()(•TJ t)-h(' ' ,r )(•j) (39)
h1 ()
14

where 7,o = rI/a. The functions f, and f0 are chosen so that they approach one for the small drop,
large neighborhood limit. This facilitates comparison with Baker's theory. Recursion relations for the
spherical Bessel functions give,
1 i) (fl2f (qqfl))= i/,2flofo(., £r/f), (40)
772 D17 (0
_•(o(,/A/ ,r) (41)
and
12(2fj (vQX))I'= i- 2 f- (4, 10. (42)
Integration of Eq. (35) gives,
T* (O) = -i 0oA f. (41A.)+C, (43)
where C is an additional undetermined constant. This term arises due to the finite neighborhood
assumption. Using this form in Eq. (31) gives,
f 4 (rV•70 )=iwj1 oCvp[-n0 Afo( tIiATr)+ C]47r a l2dil. (44)
a
Performing the integration yields,
A4rfj(a :'(Virl)=-iCCP iAr,°• :3 0(af!1r 0 )+ " (45)
15

Solving for C we find,
17o
C- a3iAK ' . (46)
Usually 77o, is negligible. C tends to zero as a goes to infinity. The equation for the temperature T* is
given by,
= -q, A [f. <liATq)-3fi(4iAT b7), (47)
1 r7.
where 8 3i= K ro 'v This term is small for all aerosols of interest. 3K 4xlO5 forOcp a3 1- -7 c3p
saturated air/water at 30°C. The spatially constant temperature fluctuations in the neighborhood of the
drop are negligible. In the following, we set 5 = 0. The temperature matching boundary condition,
Eq. (23), becomes
Dio PAiLq7o) + Q~0 = - 0 AfO (4iaT7o0 ) (48)
CpL PLCO)To
The heat flux boundary condition, Eq. (26), becomes
pcBf, (I D )- A f. (1'ý Iqo ) + -- ""', L D j, (, 2 ) L q . (49)
TO a a
The boundary condition that expresses the vapor pressure in terms of the surface temperature of the
drop gives,
ADq. B fo4iAD q.)=fM2( _I -1J7o AfOGa~T16 ) (50)
16
Eliminating D from Eqs. (48) and (49), we find that
Ir Oep c BfL 2 4 LI'i~L1 Q qAo1~q) (51)
La jo J iiAizoLCPLpLcTo
The product 2 Lrqo is usually small; small argument expansions can be used to express Eq. (51) in
simpler form.
Let cl 3 oJ o4A 11o I + -(2L7, )2 The second expression results from the small---L-1 W~ 771o) 15
argument expansion and demonstrates that c' can be taken as 1 unless ALt70 is of 0(1). For 100 pLm
drop of water at 2000 Hz this value is 2.3, at 20 Hz, Baker's assumed value it is 0.07. Gathering terms,
we find,
•.AI~./AT1O)1 LPL~r p~ 2 C' A (/fiA 7o] P 0C() Qoc'a (2SAf,~/2ro 1-i p+L2 Br° (52)
a 447)31c A (VZTr17o TO (5D1o 3To
From Eq. (50),
B=DI2 (eM2 1)"A fO.iTT70 A . (53)ac IRT0 fO ~~~?0 J
Eq. (52) is solved for A:
Q0c'roa 1(54)
where,
.C2 C fo (-7ro) ep°D,2 £m2 -1 fo( AIr/o f(i ,'Dr7o)
p = 1-i 30 .V .- yRTf (55)31c fA PA Trr7o) KTo ARO D 17(~~rl~ o )•l zo
17
These constants may be combined with Eqs. (35) and (36) to evaluate - and V*. For the present
investigation of photoacoustics, we evaluate the acoustic source terms rather than the variables -
and V*.
The wave equation with mass injection and heat injection is given by"
V 2P 1 p f(F,t), (56)
C2 at
2
where
fFt=aM+7 ~ 21H I=ia{ M +L2- H }(57)M is the mass injected per unit time and volume; H is the heat energy added per unit time and volume.
The mass injected per unit time per unit volume is calculated by the product of P 2V2 at the drop
surface times the surface area divided by the neighborhood volume with v2 = -cV*. This gives
M =(r j' 3 Qoc'p°Dl2 (•ml , fAo ((5i)
The heat energy injected per unit time per unit volume is determined by summing the heat flux over
the surface divided by the neighborhood volume:
H=( _jjQ'c (59)
aIIFor weakly absorbing drops, Q, is the product of the beam intensity and the liquid absorption in
inverse meters. The optical absorption length due to the aerosol is given by the absorption in the
18

droplet times the volume ratio (r la)3 . The phase of f(, t) will be the phase of the resulting
pressure wave with respect to the phase of the laser intensity.
2.5 Analysis
Equations (58) and (59) along with Eq. (55) have been written to facilitate comparison with
Baker's low frequency, small particle, large spacing results.4 Her results are recovered by setting
c' =1, (60a)
f. f(4(47,jl )- l, (60b)f1:,%rl) fo(Ja 'i-
and
<p.L:,,2. , <" o )T,,7-i 3 -0../,AiO (60c)
Eq. (60a) expresses the condition that the droplet radius is smaller than a thermal penetration depth in
the droplet; that is, the temperature is spatially uniform in the drop. Eq. (60b) expresses two
conditions. The first is that the finite drop neighborhood does not affect the heat and mass transfer at
the drop surface. This condition will be met if the neighborhood radius is more than a thermal
penetration depth in the gas. The second condition inherent in Eq. (60b) is that )XL71o be small enough
so that the leading terms in the small argument expansion for h0 and h, are sufficient. This is due to
the normalization of f 0 and f, retaining only the leading terms (see Eqs. (38) and (39)).
Figure 3 displays the magnitude and phase of the ratio in Eq. (60b) versus the neighborhood
radius for two particle sizes, 1 Wim and 10 gm for typical frequencies for Baker's study and for DRI
instrumentation. The ratio is significantly different from one only when the neighborhood radius is the
19

size of a thermal penetration depth. At 2000 Hz, this only occurs for particle densities of 240 cmf3
corresponding to a particle spacing of 10-3 m.
1.00 - - - - - - - . 1
0.99- ~~,~0.00- --- ----
~0.98
0 .0 0.5 1.0 1.5 2.01
Neighborhood radius (mm) Neighborhood radius (mm)
Figure 3a. Magnitude of the ratio in Eq. (60b) as a Figure 3b. Phase of the ratio in Eq. (60b) as a function offunction of neighborhood radius for different operating neighborhood radius for different operating frequenciesfrequencies and drop sizes. 2000 H1z and 10 micron sized and drop sizes. 2000 Hz and 10 micron sized drop (soliddrop (solid line); 200 Hz and 0.1 micron sized drop line); 200 Hz and 0. 1 micron sized drop (dashed line); 20(dashed line); 20 Hz and 1 micron sized drop (dotted line). Hz and 1 micron sized drop (dotted line). The ambient airThe ambient air pressure is 1 atm. and the ambient pressure is 1 atmn and the ambient temperature is 290 K.temperature is 290 K.
The last condition, Eq. (60c), is violated in higher frequency instruments. The magnitude and
phase of f0 (-,/i2T qo )/f, (,64 770) for the same cases as Fig. 3 is displayed in Fig. 4. These ratios are
near constant and real for particle densities less than 240 cmf3. The 10 pgm drop at low frequencies is
affected by the next term in the expansion of h. and h,. The magnitude of this term is 0(1) none-the-
less. The full term in Eq. (60c) can have a significant effect on the acoustic level for the high
frequency device and is frequency dependent. This term is due to the change in magnitude and phase
of the surface temperature due to heat conduction into the gas. As the frequency increases, more heat
energy is conducted from the particle and the temperature variation at the surface decreases and
changes phase with respect to the laser excitation. Chan 12 has discussed this effect in regard to thermal
blooming from high intensity laser beams in aerosols. When this term is neglected, the ratio of the
: heat and mass term in the source equation is frequency independent. The inclusion of Eq. (60c) in the
formulation provides a diagnostic for experimental investigation of mass transfer on photoacoustics.
20

1.05 - 0.20-
"1.00 0.15
0.95 0.10-
0 .50.950
0.85---0---0- ---- - - -0. 85-_ , _
------- -- - - - - - - - - --- - - --- - - - - - - -
0.80 -0.05- 0 1.0.0 0.5 1.0 1.5 2.0 0.0 .5 10 1.5 2.0
Neighborhood radius (mm) Neighborhood radius (mm)
Figure4a. Magnitude of the ratio fo([ii7Trofl,(j•rr/o) as Figure4b. Phase ofthe ratiofo(ii,1 r/o0 /f1 (iIr/o) as aa function of neighborhood radius for different operating fre- function of neighborhood radius for different operatingquencies and drop sizes. 2000 Hz and 10 micron sized drop frequencies and drop sizes. 2000 IHz and 10 micron(solid line); 200 Hz and 0.1 micron sized drop (dashed line); sized drop (solid line); 200 Hz and 0.1 micron sized drop20 Hz and 1 micron sized drop (dotted line). The ambient (dashed line); 20 Hz and 1 micron sized drop (dottedair pressure is 1 atm and the ambient temperature is 290 K. line). The ambient air pressure is 1 atm and the ambient
temperature is 290 K.
Figure 5 shows the magnitude and phase of the acoustic source strength for 1 gm water drops in
saturated air at 290 K. In this figure, we set Q. = 1. Also shown is the magnitude and phase of the
photoacoustic source strength per unit volume for an identical particle with no latent heat (a non-
volatile particle) and the magnitude of the individual contribution to the volatile source.
0.86
6.08
0.60 ------........... 0-
o.. ........ ...... 5.....
>< 0.4. ,•CD I/ ..-""
CO, .- O 5.2.
m 0.2.- .
j ... •....• -•"4.8.
0.0 . . . . . . . . . .0 2 4 6 8 1=0 1=2 1'4 16 1=8 20
0 2 4 6 8 10 12 14 16 18 20
Frequency (kHz) Frequency (kHz)
Figure 5a. Magnitude of the acoustic source strength for Figure 5b. Phase of the acoustic source strength for aa single drop as a function frequency for 1 micron sized single drop as a function frequency for 1 micron sizeddrops. Total effect (solid line); Heat contribution (dotted drops. Total effect (solid line); Heat contribution (dottedline); Mass contribution (dash-dot line); Total effect line); Mass contribution (dash-dot line); Total effectwithout latent heat (dashed line). The ambient air without latent heat (dashed line). The ambient airpressure is I atm and the ambient temperature is 290 K. pressure is 1 atm and the ambient temperature is 290 K.
21
At lower frequencies, the second term in E is negligible and the volatile particle source strength
is smaller than the non-volatile source strength. The cooling of the particle by evaporation reduces the
temperature variation at the drop surface and therefore reduces both the amount of heat conducted into
the gas and the amount of mass injected. At high frequencies, the cooling of the drop surface due to
conduction into the gas becomes dominant over cooling due to evaporation. The magnitude of the
thermal source alone approaches that of the thermal source of the non-volatile particle. The mass
injected into the gas then adds into the heat flux term to increase the photoacoustic signal.
A transition from the source strength being linearly dependent on frequency to near constant as co
is increased is observed. The position of the transition depends on the size of the terms in Eq. (55).
The second term is the only term that is sensitive to the frequency and to the particle size, other than
the leading (r,,/a)3 term in Eqs. (57) and (58) that just expresses the volumetric fraction occupied by
light absorbing material. The phase of the photoacoustic signal varies from 31rJ2 to 2nt as the second
term in Eq. (55) increases in size.
2.6 Applications
These equations can be applied to estimate the effect of thin layers of adsorbed volatile liquids on
the photoacoustics of solid particles. It is expected, for example, that water will be adsorbed onto
carbon particles at vapor pressures below saturation. If we assume fractional coverage, f, of the solid
by the liquid and the heat capacity and mass of the liquid is small with respect to those of the drop, the
photoacoustics source strength can be determined by Eqs. (57), (58) and (59) with the following
substitution: cpL -4 cps, the specific heat of the solid, and PL -- PsI the density of the solid. In
addition, the factor f is introduced into Eq. (49). This introduces the factor f as reducingM and in
reducing the third factor in Eq. (55). This also assumes that the solid particles are spherical.
22

2.7 Conclusions
A theory of photoacoustics for volatile aerosols for arbitrary acoustic frequencies has been
developed. Correction terms for larger particles and for high particle densities have been included in
the analysis. At high frequencies, a term not included in Baker's analysis is significant.
The contribution of evaporation to the photoacoustic measurements of light adsorption can be
determined using Eqs. (55), (57), (58) and (59). If the changes necessary to describe fractional liquid
coverage on a solid substrate particle are incorporated, the source strength contains four unknowns,
assuming that the identity and properties of the liquid-vapor species is known. Two measurements of
magnitude and phase of the source strength at widely spaced frequencies are sufficient to determine
whether evaporation-condensation is occurring on the absorbing particles and to evaluate the size of
that contribution. Multifrequency measurements would, of course, provide more information.
3. REFERENCES
1W. Patrick Arnott, Hans Moosmiiller, C. Fred Rogers, Tianfeng Jin, Reinhard Bruch, "Photoacoustic
Spectrometer for Measuring Light Absorption by Aerosol: Instrument Description," Atmos. Environ.
33, (1999) 2845-2852.
2H. Moosmitiller, W.P. Arnott, C.F. Rogers, J.C. Chow, C.A. Frazier, L.E. Sherman, D.L. Dietrich,
"Photoacoustic and Filter Measurements Related to Aerosol Light Absorption During the Front Range
Air Quality Study (Colorado 1996/1997)," J. Geo. Res. 103, D21, 28149-28157 (1998).
3W. P. Arnott, H. Moosmiiller, and J. W. Walker, "Nitrogen dioxide and kerosene-flame soot
calibration of photoacoustic instruments for measurement of light absorption by aerosols," Rev. Sci.
Ins. June_Submittal. (2000).
4W.B. Baker, "Energy Absorption by Volatile Atmospheric Aerosol Particles," Atmos. Environ. 10,
(1976) 241-248.
23

5Richard Raspet, Craig J. Hickey, James M. Sabatier, "The Effect of Evaporation-Condensation on
Sound Propagation in Cylindrical Tubes Using the Low Reduced Frequency Approximation," J.
Acoust. Soc. Am. 105, (1999) 65-73.
6Craig J. Hickey, Richard Raspet, William V. Slaton, "Effects of Thermal Diffusion on Sound
Attenuation in Evaporating and Condensing Gas Vapor Mixtures in Tubes," J. Acoust. Soc. Am. 107,
(2000) 1126-1130.
7L.D. Landau and E.M. Lifshitz, Fluid Mechanics, (Butterworth-Heinemann, Oxford 1997), 2 nd Ed.
8J.V. Hirschfelder, C. Curtiss, R. B. Bird, Molecular Theory of Gases and Liquids, (Wiley, New York,
1954).
9F. Reif, Fundamentals of Statistical and Thermal Physics, (McGraw - Hill, New York, 1965).
l0Alan D. Pierce, Acoustics, An Introduction to its Physical Principles and Applications, (Acoustical
Society of America, Woodbury, NY 1989). Characteristics of the vorticity, acoustical and entropy
modes are described on pages 519-531.
" Philip M. Morse and K. Uno Ingard, Theoretical Acoustics, (Princeton University Press, Princeton NJ
1986). Radiation of sound from a small region with violent fluid motion is analyzed on pages 322-
325.
12C.H. Chan, "Effective Absorption for Thermal Blooming Due to Aerosols," Appl. Phys. Letters 26,
1975, 628-629.
24