effect of fiber diameter on stress transfer and interfacial damage in fiber reinforced composites
TRANSCRIPT

7/27/2019 Effect of Fiber Diameter on Stress Transfer and Interfacial Damage in Fiber Reinforced Composites
http://slidepdf.com/reader/full/effect-of-fiber-diameter-on-stress-transfer-and-interfacial-damage-in-fiber 1/112
EFFECT OF FIBER DIAMETER ON STRESS TRANSFER AND INTERFACIAL
DAMAGE IN FIBER REINFORCED COMPOSITES
by
William Matthew Peterson
A thesis submitted in partial fulfillment
of the requirements for the degree
of
Master of Science
in
Mechanical Engineering
MONTANA STATE UNIVERSITY
Bozeman, Montana
July 2011

7/27/2019 Effect of Fiber Diameter on Stress Transfer and Interfacial Damage in Fiber Reinforced Composites
http://slidepdf.com/reader/full/effect-of-fiber-diameter-on-stress-transfer-and-interfacial-damage-in-fiber 2/112
©COPYRIGHT
by
William Matthew Peterson
2011
All Rights Reserved

7/27/2019 Effect of Fiber Diameter on Stress Transfer and Interfacial Damage in Fiber Reinforced Composites
http://slidepdf.com/reader/full/effect-of-fiber-diameter-on-stress-transfer-and-interfacial-damage-in-fiber 3/112
ii
APPROVAL
of a thesis submitted by
William Matthew Peterson
This thesis has been read by each member of the thesis committee and has beenfound to be satisfactory regarding content, English usage, format, citation, bibliographic
style, and consistency and is ready for submission to The Graduate School.
Dr. Christopher H. M. Jenkins
Approved for the Department of Mechanical Engineering
Dr. Christopher H. M. Jenkins
Approved for The Graduate School
Dr. Carl A. Fox

7/27/2019 Effect of Fiber Diameter on Stress Transfer and Interfacial Damage in Fiber Reinforced Composites
http://slidepdf.com/reader/full/effect-of-fiber-diameter-on-stress-transfer-and-interfacial-damage-in-fiber 4/112
iii
STATEMENT OF PERMISSION TO USE
In presenting this thesis in partial fulfillment of the requirements for a master’s
degree at Montana State University, I agree that the Library shall make it available to
borrowers under rules of the Library.
If I have indicated my intention to copyright this thesis by including a copyright
notice page, copying is allowable only for scholarly purposes, consistent with “fair use”
as prescribed in the U.S. Copyright Law. Requests for permission for extended quotation
from or reproduction of this thesis in whole or in parts may be granted only by the
copyright holder.
William Matthew Peterson
July 2011

7/27/2019 Effect of Fiber Diameter on Stress Transfer and Interfacial Damage in Fiber Reinforced Composites
http://slidepdf.com/reader/full/effect-of-fiber-diameter-on-stress-transfer-and-interfacial-damage-in-fiber 5/112
iv
ACKNOWLEDGEMENTS
First and foremost, I would like to acknowledge the inspiration and
encouragement that I received from my family. Thank you so much for being my well -
spring of support, my shade-tree when I needed it, and for sharing with me your sense of
humor.
Many thanks go to my major professor and advisor, Dr. Chris Jenkins, who has
been exceedingly patient and trusting in this work, has provided me with a great learning
environment, and has given me an excellent introduction into both the practice and
philosophy of the engineering profession. The efforts of my two other committee
members, Dr. Dave Miller and Dr. Ladean McKittrick, have also provided me with
wonderful insights into aspects of this research that I might not have otherwise
considered. I would also like to acknowledge Dr. Kyeongsik Woo and Dr. Awlad Hossain
for their thoughtful review. I truly enjoyed having the chance to bounce ideas back and
forth with each of the excellent people I have been able to work with – including my
committee members, other faculty, staff, and fellow students.

7/27/2019 Effect of Fiber Diameter on Stress Transfer and Interfacial Damage in Fiber Reinforced Composites
http://slidepdf.com/reader/full/effect-of-fiber-diameter-on-stress-transfer-and-interfacial-damage-in-fiber 6/112
v
TABLE OF CONTENTS
1. INTRODUCTION .................................................................................................. 1
Background ............................................................................................................. 1
Motivation............................................................................................................... 1
Objectives ............................................................................................................... 6
Primary Objectives............................................................................................. 7
Secondary Objectives......................................................................................... 7
Methods.............................................................................................................. 8
2. THEORETICAL BACKGROUND .......................................................................11
Composite Materials Overview .............................................................................11
Fiber -Reinforced Polymer Composites............................................................ 12 Micromechanics of Composite Materials ............................................................. 13
Homogenization Theory................................................................................... 14
Microstructural Representations ...................................................................... 17
The Representative Volume Element .......................................................... 18
The Repeating Unit Cell .............................................................................. 21
Shear -Lag Stress Transfer ..................................................................................... 25
Ineffective Fiber Length................................................................................... 27
Damage and Fracture ............................................................................................ 32
Continuum Failure Theories ............................................................................ 33
Fracture Mechanics .......................................................................................... 35
Overview of the Cohesive Zone Model ........................................................... 38 Cohesive Element Formulation........................................................................ 42
Element Geometry....................................................................................... 42
Thickness and Material Parameters............................................................. 43
Connectivity ................................................................................................ 45
Traction-Separation Relation....................................................................... 46
Cohesive Strength and Fracture Energy ...................................................... 47
Penalty Stiffness .......................................................................................... 48
Nominal Stresses and Strains ...................................................................... 49
3. MODEL DEVELOPMENT .................................................................................. 52
Conceptual Model................................................................................................. 52
Structural RUC Models ........................................................................................ 56
General Boundary Conditions.......................................................................... 56
Repeating Boundary Conditions ................................................................. 58
Symmetry RBC ........................................................................................... 59
Model 1 ............................................................................................................ 60
Model 2 ............................................................................................................ 61

7/27/2019 Effect of Fiber Diameter on Stress Transfer and Interfacial Damage in Fiber Reinforced Composites
http://slidepdf.com/reader/full/effect-of-fiber-diameter-on-stress-transfer-and-interfacial-damage-in-fiber 7/112
vi
TABLE OF CONTENTS - CONTINUED
Model 3 ............................................................................................................ 62 Applied Loads....................................................................................................... 63
Constituent Material Properties ............................................................................ 66
Summary ............................................................................................................... 67
4. RESULTS AND ANALYSIS ................................................................................ 69
Overview............................................................................................................... 69
Shear -Lag Analysis ............................................................................................... 70
Model 1 Results ............................................................................................... 70
Model 2 Results ............................................................................................... 74
Model 3 Results ............................................................................................... 76
Comparison of Shear -Lag Results ................................................................... 78
Cohesive Zone Model Damage Analysis.............................................................. 82
Load-Displacement Curves .............................................................................. 84
Damage Initiation............................................................................................. 85
Stiffness Degradation ....................................................................................... 86
5. SUMMARY AND CONCLUSION ...................................................................... 92
Summary of Results and Discussion .................................................................... 92
Shear -Lag Analysis .......................................................................................... 92
Cohesive Zone Model Damage Analysis ......................................................... 93
Future Work .......................................................................................................... 94 Conclusion ............................................................................................................ 95
6. REFERENCES ..................................................................................................... 96

7/27/2019 Effect of Fiber Diameter on Stress Transfer and Interfacial Damage in Fiber Reinforced Composites
http://slidepdf.com/reader/full/effect-of-fiber-diameter-on-stress-transfer-and-interfacial-damage-in-fiber 8/112
vii
LIST OF TABLES
Table Page
1. Comparison of methods to increase fiber -matrix interfacial
surface area. ...................................................................................................... 5
2. E-glass and epoxy mechanical properties ....................................................... 67
3. Summary of structural RUC M1, M2, and M3 ............................................... 67
4. Summary of ineffective fiber lengths for each model..................................... 80
5. Comparison of load, displacement, and effective stiffness............................. 81
6. Cohesive element parameters ......................................................................... 83

7/27/2019 Effect of Fiber Diameter on Stress Transfer and Interfacial Damage in Fiber Reinforced Composites
http://slidepdf.com/reader/full/effect-of-fiber-diameter-on-stress-transfer-and-interfacial-damage-in-fiber 9/112
viii
LIST OF FIGURES
Figure Page
1. Two methods to increase the interfacial surface area ....................................... 2
2. In Method A the interfacial surface area is a linear function of
fiber volume fraction......................................................................................... 5
3. In Method B the interfacial surface area is an exponential
function of fiber diameter ................................................................................. 6
4. Three main types of composite reinforcements ...............................................11
5. Cross section of typical [45/45]S glass/epoxy laminate. SEM,x15................................................................................................................... 15
6. Cross section of typical [45/45]S glass/epoxy laminate. SEM,
x50................................................................................................................... 16
7. Unidirectional E-glass fibers in Hexion resin epoxy. SEM,
x200................................................................................................................. 16
8. The RVE and RUC microstructural representations ....................................... 18
9. Periodic Boundary Conditions on an RUC ..................................................... 23
10. Typical RUCs for square/rectangular and the hexagonal
periodic arrangements ..................................................................................... 24
11. Derivation of the quarter -symmetric RUC ..................................................... 24
12. Loading of an FRP in the fiber axial direction. ............................................... 26
13. Shear -Lag conceptual model........................................................................... 26
14. Photoelastic image of single fiber fragmentation test
(E-glass/epoxy) ............................................................................................... 27
15. Example of the determination of shear stress at fiber -matrix
interface from photoelasticity. ........................................................................ 28
16. Lateral view of axial fiber stress and fiber -matrix interfacial
shear stress distributions near a fiber break .................................................... 29
17. RUC for Shear -Lag FEA ................................................................................ 30

7/27/2019 Effect of Fiber Diameter on Stress Transfer and Interfacial Damage in Fiber Reinforced Composites
http://slidepdf.com/reader/full/effect-of-fiber-diameter-on-stress-transfer-and-interfacial-damage-in-fiber 10/112
ix
LIST OF FIGURES - CONTINUED
18. Ineffective fiber length for the single fiber RUC as a functionof fiber diameter in two load cases ................................................................. 31
19. The percent of maximum axial stress for the single fiber RUC
as a function of fiber diameter ........................................................................ 31
20. Infinite plate with an elliptical through-crack under tension. ......................... 36
21. Stress redistribution in real materials due to a) plasticity, b)crazing, c) microcracking, or d) delamination ................................................ 39
22. Interfacial cohesive elements before and after separation .............................. 40
23. The CZM bilinear traction-separation relation ............................................... 40
24. Key geometric features of a cohesive element ............................................... 43
25. Cohesive element connectivity using a) node sharing, and b) tie
constraints for mismatched meshes ................................................................ 45
26. Collapsed cohesive element geometry at a bonded interface ......................... 46
27. Common variations in the shape of the t -δ relation ........................................ 47
28. Bilinear traction-separation relation ............................................................... 49
29. Idealization of an FRP composite lamina ....................................................... 52
30. RUC models with equal V f .............................................................................. 54
31. General BCs used on structural RUC ............................................................. 57
32. Model 1 conceptual geometry......................................................................... 60
33. The M1 structural RUC .................................................................................. 60
34. Model 2 conceptual geometry. ........................................................................ 61
35. The M2 structural RUC .................................................................................. 61
36. Model 1 conceptual geometry......................................................................... 62
37. The M1 structural RUC .................................................................................. 62

7/27/2019 Effect of Fiber Diameter on Stress Transfer and Interfacial Damage in Fiber Reinforced Composites
http://slidepdf.com/reader/full/effect-of-fiber-diameter-on-stress-transfer-and-interfacial-damage-in-fiber 11/112
x
LIST OF FIGURES - CONTINUED
38. RUC Boundary conditions and applied loads ................................................. 66
39. Structural RUC and symmetry model for a) Model 1; b) Model2; c) Model 3 ................................................................................................... 68
40. Axial and shear stresses along the length of the fiber inModel 1 ........................................................................................................... 71
41. Axial and shear stresses over the first 30 µm of the fiber lengthin Model 1 ....................................................................................................... 71
42. Normalized axial and shear stresses over the first 30 µm in
Model 1 ........................................................................................................... 72
43. Contour plot of axial stresses near the fiber break .......................................... 73
44. Contour plot of shear stresses near the fiber break ......................................... 74
45. Axial and shear stress distributions for Model 2 ............................................ 75
46. Axial and shear stresses over the first 30 µm of the fiber lengthin Model 2 ....................................................................................................... 75
47. Normalized axial and shear stresses over the first 30 µm in
Model 2 ........................................................................................................... 76
48. Axial and shear stress distributions for Model 3 ............................................ 77
49. Axial and shear stresses over the first 30 µm of the fiber lengthin Model 3 ....................................................................................................... 77
50. Normalized axial and shear stresses over the first 30 µm inModel 3 ........................................................................................................... 78
51. Comparison of axial stresses in each model ................................................... 79
52. Comparison of axial stresses, showing the first 30 µm and therelative change in ineffective fiber length between each model ..................... 79
53. Comparison of axial stresses on the normalized length scale, z/D ................................................................................................................... 80
54. Load vs. Displacement curves for each model ............................................... 81

7/27/2019 Effect of Fiber Diameter on Stress Transfer and Interfacial Damage in Fiber Reinforced Composites
http://slidepdf.com/reader/full/effect-of-fiber-diameter-on-stress-transfer-and-interfacial-damage-in-fiber 12/112
xi
LIST OF FIGURES - CONTINUED
55. Location of cohesive elements at the fiber -matrix interface inthe structural RUC models.............................................................................. 82
56. Load vs. Displacement for the cohesive zone damage models....................... 84
57. Damage Initiation Criterion at the first element to reach thecritical load state ............................................................................................. 85
58. Stiffness degradation of the first element to fail in each model...................... 87
59. Stiffness degradation in the first element to fail, zoomed inview................................................................................................................. 88
60. Stiffness degradation variable at 50% of σ0
along a path on the
interface........................................................................................................... 89
61. Stiffness degradation variable at 70% of σ0
along a path at the
interface........................................................................................................... 89
62. Stiffness degradation variable at 100% of σ0
along a path at the
interface........................................................................................................... 90
63. Load-displacement comparison of shear -lag and cohesive zonemodels ............................................................................................................. 91

7/27/2019 Effect of Fiber Diameter on Stress Transfer and Interfacial Damage in Fiber Reinforced Composites
http://slidepdf.com/reader/full/effect-of-fiber-diameter-on-stress-transfer-and-interfacial-damage-in-fiber 13/112
xii
ABSTRACT
In this work, the effect of fiber diameter upon the strength, stiffness, and damagetolerance of a fiber -reinforced polymer composite laminate structure was investigated.Three cases were considered, in which the fiber diameters of 16, 8, and 4 µm were used.
A fiber volume fraction of 32% was assumed in each model. Micromechanical, shear -lag,
and progressive damage analyses were performed using finite element models of the
structure, which was subjected to tensile loading in the fiber direction. Fiber -matrix loadtransfer efficiencies and the stress distributions near broken fibers within the composite
structure were investigated and results compared for each fiber diameter. In addition, the
effect of fiber diameter upon the initiation and evolution of fiber -matrix interfacialdamage and debonding was studied using cohesive interface elements. For a specified
volume fraction and load condition, as the fiber diameter was decreased the load transfer
efficiency and effective stiffness of the broken fiber model increased. Also, as the fiber diameter was decreased, the initiation of damage at the fiber -matrix interface occurred at
greater stresses and the subsequent growth of damage was less extensive. These results
indicate that, for the same total mass, the performance and damage tolerance of
composite materials may be enhanced simply by using smaller diameter fibers.
7/27/2019 Effect of Fiber Diameter on Stress Transfer and Interfacial Damage in Fiber Reinforced Composites
http://slidepdf.com/reader/full/effect-of-fiber-diameter-on-stress-transfer-and-interfacial-damage-in-fiber 14/112
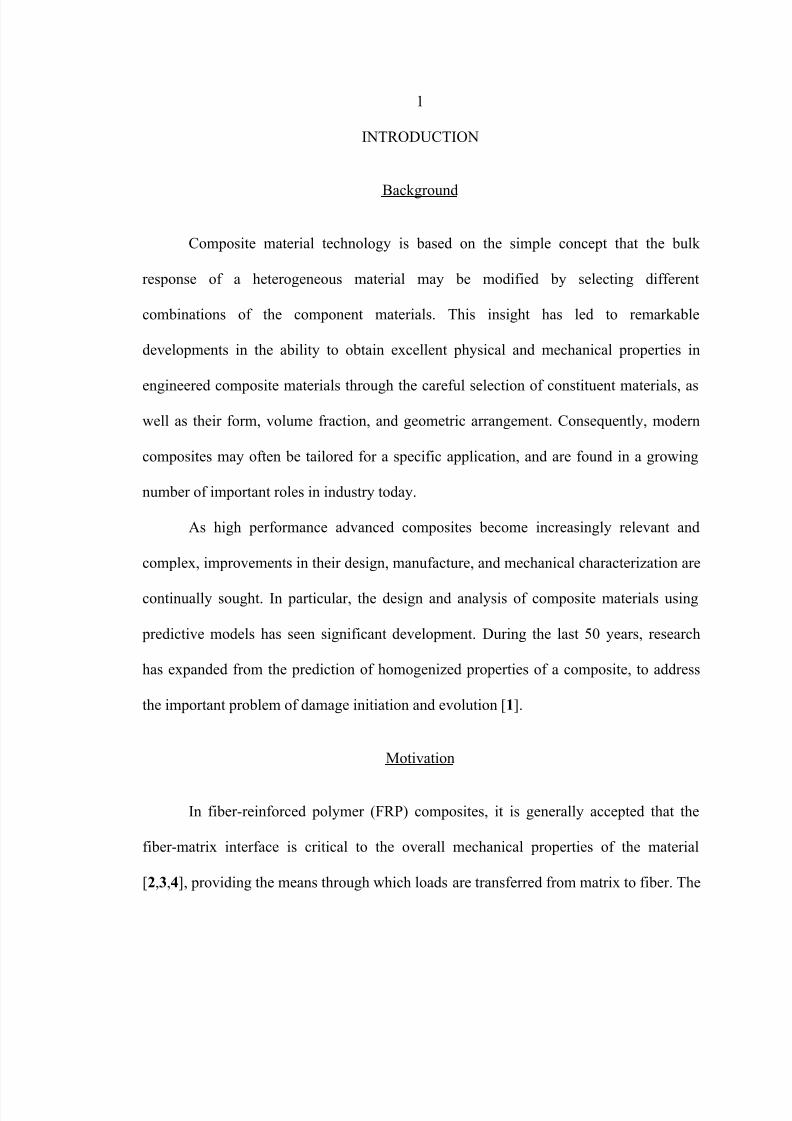
1
INTRODUCTION
Background
Composite material technology is based on the simple concept that the bulk
response of a heterogeneous material may be modified by selecting different
combinations of the component materials. This insight has led to remarkable
developments in the ability to obtain excellent physical and mechanical properties in
engineered composite materials through the careful selection of constituent materials, as
well as their form, volume fraction, and geometric arrangement. Consequently, modern
composites may often be tailored for a specific application, and are found in a growing
number of important roles in industry today.
As high performance advanced composites become increasingly relevant and
complex, improvements in their design, manufacture, and mechanical characterization are
continually sought. In particular, the design and analysis of composite materials using
predictive models has seen significant development. During the last 50 years, research
has expanded from the prediction of homogenized properties of a composite, to address
the important problem of damage initiation and evolution [1].
Motivation
In fiber -reinforced polymer (FRP) composites, it is generally accepted that the
fiber -matrix interface is critical to the overall mechanical properties of the material
[2,3,4], providing the means through which loads are transferred from matrix to fiber. The

7/27/2019 Effect of Fiber Diameter on Stress Transfer and Interfacial Damage in Fiber Reinforced Composites
http://slidepdf.com/reader/full/effect-of-fiber-diameter-on-stress-transfer-and-interfacial-damage-in-fiber 15/112
2
strength and stiffness of the interfacial bond, as well as the integrity of the fiber -matrix
boundary, are essential factors affecting the composite material’s overall performance and
resistance to damage.
Ostensibly, as the total effective (bonded) fiber -matrix interfacial surface area
increases, loads may be more efficiently redistributed from fiber to fiber. Such an
increase in the surface area at the fiber -matrix interface may also potentially compensate
for broken fibers and imperfect bonding at the fiber -matrix boundary. It is with this basic
concept that the current work is motivated.
Within a specified volume containing continuous fiber reinforcements, there are
two means by which such an increase in fiber -matrix interfacial surface area may be
achieved:
A. Increasing the fiber volume fraction while keeping the fiber diameter constant;
B. Decreasing the fiber diameter while keeping the fiber volume fraction constant.
OriginalMethod A
Method B
- same diameter as original
- increased volume fraction
- same volume fraction as original
- decreased diameter
Figure 1. Two methods to increase the interfacial surface area within a specifiedvolume.

7/27/2019 Effect of Fiber Diameter on Stress Transfer and Interfacial Damage in Fiber Reinforced Composites
http://slidepdf.com/reader/full/effect-of-fiber-diameter-on-stress-transfer-and-interfacial-damage-in-fiber 16/112
3
The key differences between these two methods are next demonstrated through a
brief example. Before modification, consider a fiber -reinforced composite originally
composed of equal parts by volume of fiber and matrix materials, i.e., the fiber volume
fraction is V f0 = 50%. Let the typical fiber diameter be D0 = 25 μm. Assuming the fibers
are continuous and there are no internal voids, using Equations 1-3 it can be found that in
one cubic meter (where the height h, width w, and length L are equal) the total interfacial
surface area is As0 = 80 000 m2.
= 4 ℎ = 4 Eq. ( 1 )
= 4 Eq. ( 2 )
= = 4 Eq. ( 3 )
Therefore, the surface area is proportional to V f / D.
Now, consider Method A (or, the “V f -scaling method”) from above. While keeping
the fiber diameter constant, any increase in the number of fibers ( N f ) will increase the
total interfacial surface area within the volume ( L3). For instance, if maintaining
DA = D0 = 25 μm while increasing the number of fibers in the volume such that the fiber
volume fraction becomes V fA = 75%, the new composite will have a fiber -matrix
interfacial surface area of AsA = 120 000 m2.
Alternatively, in Method B (or, the “fiber -scaling method”) the fiber volume
fraction is held constant at V fB = V f0 = 50% while the typical fiber diameter decreases. For
comparison, in order to obtain a fiber -matrix surface area of AsB = AsA = 120 000 m2, the
fiber diameter must decrease to approximately DB = 16.7 μm. As a natural consequence
7/27/2019 Effect of Fiber Diameter on Stress Transfer and Interfacial Damage in Fiber Reinforced Composites
http://slidepdf.com/reader/full/effect-of-fiber-diameter-on-stress-transfer-and-interfacial-damage-in-fiber 17/112
4
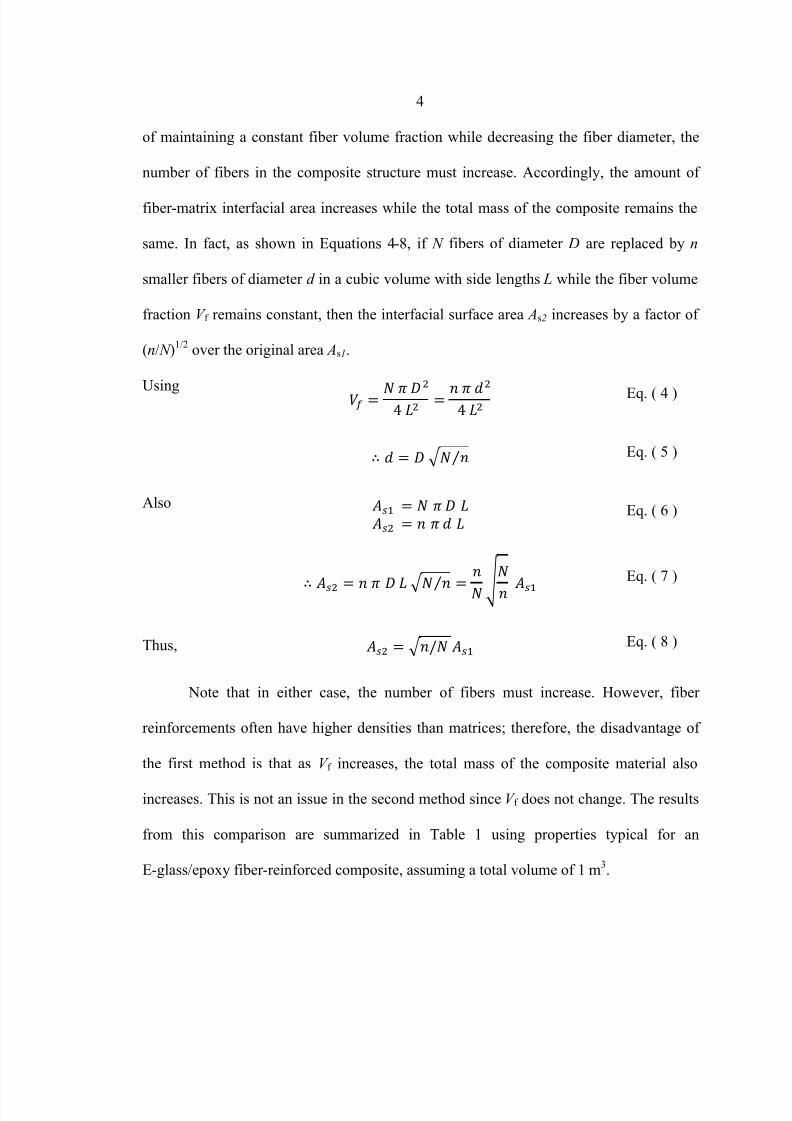
of maintaining a constant fiber volume fraction while decreasing the fiber diameter, the
number of fibers in the composite structure must increase. Accordingly, the amount of
fiber -matrix interfacial area increases while the total mass of the composite remains the
same. In fact, as shown in Equations 4-8, if N fibers of diameter D are replaced by n
smaller fibers of diameter d in a cubic volume with side lengths L while the fiber volume
fraction V f remains constant, then the interfacial surface area As2 increases by a factor of
(n/ N )1/2
over the original area As1.
Using = 4 = 4 Eq. ( 4 )
∴ = ⁄ Eq. ( 5 )
Also = = Eq. ( 6 )
∴ = ⁄ =
Eq. ( 7 )
Thus, = / Eq. ( 8 )
Note that in either case, the number of fibers must increase. However, fiber
reinforcements often have higher densities than matrices; therefore, the disadvantage of
the first method is that as V f increases, the total mass of the composite material also
increases. This is not an issue in the second method since V f does not change. The results
from this comparison are summarized in Table 1 using properties typical for an
E-glass/epoxy fiber -reinforced composite, assuming a total volume of 1 m3.

7/27/2019 Effect of Fiber Diameter on Stress Transfer and Interfacial Damage in Fiber Reinforced Composites
http://slidepdf.com/reader/full/effect-of-fiber-diameter-on-stress-transfer-and-interfacial-damage-in-fiber 18/112
5
Table 1. Comparison of methods to increase fiber -matrix interfacial surface area.
Specimen V f ,% D, μm As , m N f
Mass , kg
Original 50 25.0 80 000 1.02 E9 1850 A 75 25.0 120 000 1.53 E9 2175
B 50 16.7 120 000 2.28 E9 1850
At the present time, typical glass fibers are commercially produced with diameters
ranging from 4-25 µm [5]. Therefore, when using a diameter of 4 µm the total interfacial
surface area becomes approximately 500 000 m2, an increase of 525% over the original
area.
Consider also the rate at which the surface area may increase for each model.
From Equation 2, we can see that if the fiber diameter ( D) is constant while the volume
fraction (V f ) varies, then N is a linear function of V f . On the other hand, if D varies while
V f is constant, then N is proportional to 1/ D2
and becomes exponentially large as D
becomes small. This is clearly shown in Figures 2 and 3 below.
Figure 2. In Method A the interfacial surface area is a linear function of fiber volume fraction. Results are shown for a constant fiber diameter of D = 25 μm.
* E-glass fiber: density = 2500 kg/m3, Epoxy matrix: density = 1200 kg/m3 [2]
0.0E+00
3.5E+04
7.0E+04
1.1E+05
1.4E+05
1.8E+05
0 0.2 0.4 0.6 0.8 1
I n t e r f a c i a l S u r f a c e A r e a , m 2
Fiber Volume Fraction, %
7/27/2019 Effect of Fiber Diameter on Stress Transfer and Interfacial Damage in Fiber Reinforced Composites
http://slidepdf.com/reader/full/effect-of-fiber-diameter-on-stress-transfer-and-interfacial-damage-in-fiber 19/112
6
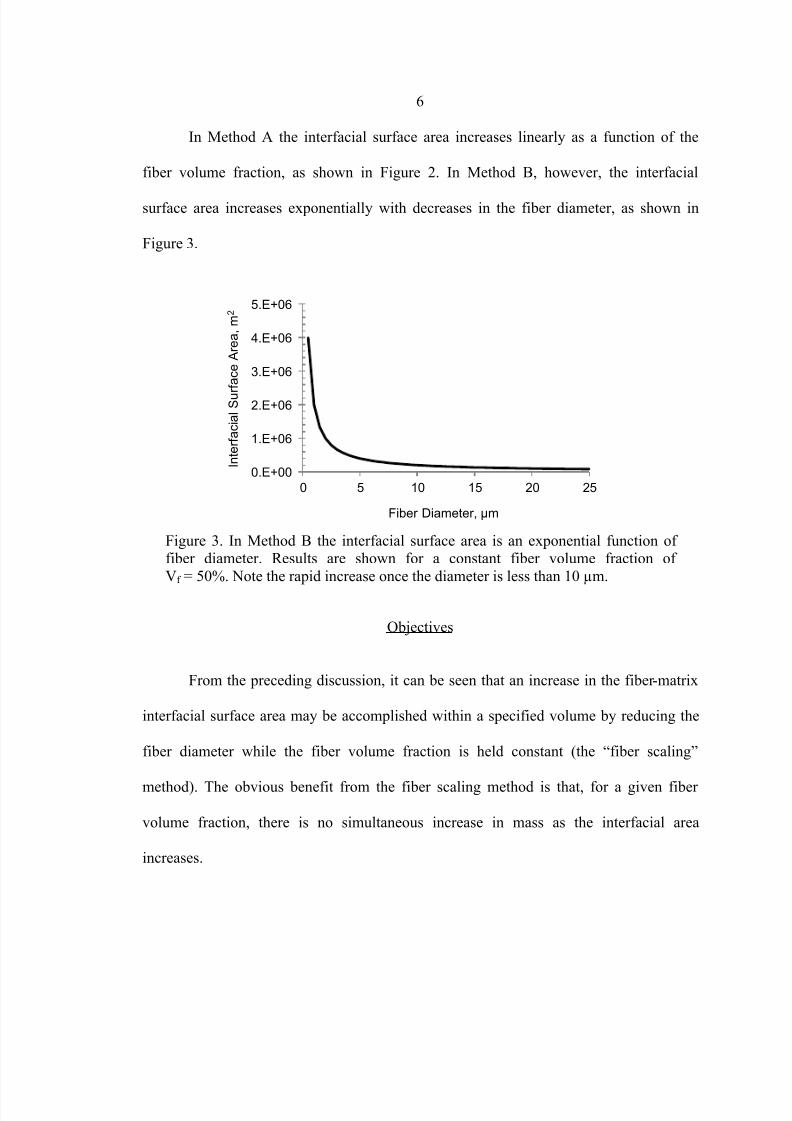
In Method A the interfacial surface area increases linearly as a function of the
fiber volume fraction, as shown in Figure 2. In Method B, however, the interfacial
surface area increases exponentially with decreases in the fiber diameter, as shown in
Figure 3.
Figure 3. In Method B the interfacial surface area is an exponential function of fiber diameter. Results are shown for a constant fiber volume fraction of
Vf = 50%. Note the rapid increase once the diameter is less than 10 µm.
Objectives
From the preceding discussion, it can be seen that an increase in the fiber -matrix
interfacial surface area may be accomplished within a specified volume by reducing the
fiber diameter while the fiber volume fraction is held constant (the “fiber scaling”
method). The obvious benefit from the fiber scaling method is that, for a given fiber
volume fraction, there is no simultaneous increase in mass as the interfacial area
increases.
0.E+00
1.E+06
2.E+06
3.E+06
4.E+06
5.E+06
0 5 10 15 20 25
I n t e r f a c i a l S u r f a c e A r e a , m 2
Fiber Diameter, μm

7/27/2019 Effect of Fiber Diameter on Stress Transfer and Interfacial Damage in Fiber Reinforced Composites
http://slidepdf.com/reader/full/effect-of-fiber-diameter-on-stress-transfer-and-interfacial-damage-in-fiber 20/112
7
Although extensive research exists in the literature regarding fiber -reinforced
composite materials and their behavior, at this time very little has been documented with
respect to the effect of fiber diameter upon fiber -matrix load transfer characteristics and
the overall toughness of the composite. As discussed in further sections, it also appears
that most micromechanical models in current use are, in fact, based upon fiber volume
fraction considerations only. Therefore, it is the goal of this work to provide a theoretical
investigation into fiber scaling effects.
Primary Objectives
The primary objectives of this research are to investigate the effect of fiber
diameter and the total fiber -matrix interfacial surface area upon the:
1. Composite material stiffness;
2. Fiber -matrix load transfer efficiency;
3. Fiber -matrix stress distributions;
4. Interfacial strength and damage resistance.
Secondary Objectives
In order to accomplish Primary Objective 4, an appropriate method of modeling
the initiation and evolution of damage is needed. Therefore, an important part of this
research is to:
5. Demonstrate the use of the cohesive zone model (CZM) to analyze fiber -matrix
interfacial damage and debonding.

7/27/2019 Effect of Fiber Diameter on Stress Transfer and Interfacial Damage in Fiber Reinforced Composites
http://slidepdf.com/reader/full/effect-of-fiber-diameter-on-stress-transfer-and-interfacial-damage-in-fiber 21/112
8
The CZM approach is a numerical representation of the progressive damage and
failure of a material implemented using the finite element method (FEM). Using this
method, cohesive elements are placed within the FE mesh at the fiber -matrix interface,
allowing the model to simulate the onset and evolution of interfacial damage at critical
loads – thus combining micromechanics and progressive damage modeling at the
constituent level in a composite material.
Methods
In micromechanical approaches, the essential details of a composite
microstructure are considered, e.g., the constituent phases, their form, volume fraction,
geometric arrangement, and bonding characteristics. In one successful micromechanical
technique, numerical models of an appropriate representative subset of the composite
material are used to analyze the local effects of stress and strain. Because microstructural
detail is retained in this approach, the discrete effects of deformation and damage upon
the matrix and reinforcing phases may be described, and different damage mechanisms
may be monitored – such as fiber -matrix interactions and interfacial debonding in fiber -
reinforced composites.
In order to achieve the objectives given above, in this work a number of
micromechanical finite element (FE) analyses of an FRP composite laminate structure are
presented. Importantly (and in contrast to many typical micromechanical methods), the
representative subvolume dimensions, geometry, and structural boundary conditions must
be the same in each case. Three cases are considered, in which the fiber diameters of 16,

7/27/2019 Effect of Fiber Diameter on Stress Transfer and Interfacial Damage in Fiber Reinforced Composites
http://slidepdf.com/reader/full/effect-of-fiber-diameter-on-stress-transfer-and-interfacial-damage-in-fiber 22/112
9
8, and 4 µm are used. In each case, a fiber volume fraction of 32% is ensured by
adjusting the fiber diameter and the number of fibers as required, within a well -defined
volume in the manner demonstrated by Method B in the example above. Fiber -matrix
load transfer efficiencies and stress distributions near broken fibers within the composite
structure are investigated. In addition, the effect of fiber diameter upon the initiation and
evolution of fiber -matrix interfacial damage and debonding is studied using cohesive
interface elements. Results are compared for each fiber diameter.
Numerical analysis has become the dominant method for modeling the failure
behavior of composite materials, and allows the treatment of detailed and complex
microstructures. In particular, the use of the finite element method (FEM) has become
widespread, due to its powerful ability to obtain approximate solutions to field problems
(such as described by differential or integral expressions) where analytical solutions may
not be possible. It is not in the scope of this work to fully describe the FEM or procedures
used in finite element analysis (FEA). Interested readers are referred to works by other
authors such as by Cooke et al. [6]. However, a brief description is useful in the following
sections. Therefore, briefly stated, in the FEM a continuous field problem described by
differential or integral expressions is discretized into a mesh of smaller elements of a
finite size, connected at their boundaries by nodes. The piecewise solution to the field
problem for the unknown field quantity (such as displacement resulting from a structural
load) at each node in the mesh is numerically obtained by solving a system of algebraic
equations – thus, an approximation for the spatial variation of the field solution is
achieved element- by-element. As mentioned, FEA gives an approximation to the “exact”

7/27/2019 Effect of Fiber Diameter on Stress Transfer and Interfacial Damage in Fiber Reinforced Composites
http://slidepdf.com/reader/full/effect-of-fiber-diameter-on-stress-transfer-and-interfacial-damage-in-fiber 23/112
10
solution obtained by the calculus of the differential/integral problem. Generally, this
approximate solution improves as more elements are added to the mesh. In this work, an
appropriate conceptual subvolume of the composite structure is chosen, which is then
further discretized into a mesh of smaller elements.

7/27/2019 Effect of Fiber Diameter on Stress Transfer and Interfacial Damage in Fiber Reinforced Composites
http://slidepdf.com/reader/full/effect-of-fiber-diameter-on-stress-transfer-and-interfacial-damage-in-fiber 24/112

7/27/2019 Effect of Fiber Diameter on Stress Transfer and Interfacial Damage in Fiber Reinforced Composites
http://slidepdf.com/reader/full/effect-of-fiber-diameter-on-stress-transfer-and-interfacial-damage-in-fiber 25/112
12
Various subclasses of composite reinforcements are also possible. Each
designation and subclass helps to identify the different mechanical properties and
manufacturing techniques that are associated with each fiber arrangement. For example,
in fiber -reinforced composites, the fibers may be short (in discontinuous, random
arrangements), long (in continuous, unidirectional arrangements), or form a textile
weave. In addition, hybrid composites incorporate more than one type of reinforcement.
Fiber -Reinforced Polymer Composites
The most common advanced composites are polymer matrix composites (PMCs)
reinforced with continuous thin diameter fibers [8], also known as fiber -reinforced
polymer (FRP) composites. The fibers are generally strong and stiff along the fiber axis,
and carry the majority of structural loads. The matrix is typically a tougher material with
low mechanical properties, and serves to keep the fiber reinforcements aligned, to
redistribute the load among the fibers, and to protect the fibers from environmental
exposure. FRP laminates are made by assembling successive layers of thin laminae, or
plies, together. The mechanical properties of each lamina are directionally-dependent on
the fiber orientation – usually, multi-directional stiffness is achieved in laminates by
using different fiber orientations for each layer, or by employing textile weaves [8].
Initially developed for use in the aerospace industry, advanced composites using
fiber -reinforced matrices offer considerable advantages relative to unreinforced
monolithic materials in structural applications where high strength, stiffness, low weight,
and fatigue resistance are important factors. Such materials now play an important role in

7/27/2019 Effect of Fiber Diameter on Stress Transfer and Interfacial Damage in Fiber Reinforced Composites
http://slidepdf.com/reader/full/effect-of-fiber-diameter-on-stress-transfer-and-interfacial-damage-in-fiber 26/112
13
many other fields, such as the wind energy, automotive, marine, and sports equipment
industries [2,8].
Micromechanics of Composite Materials
Composite materials are considered to be macroscopically heterogeneous
combinations of discrete constituent materials that have been bonded together. Although
they act in concert to produce the overall material behavior, the constituents retain their
identities. As a result, the local properties of a composite change from point to point,
depending on which phase the point is located in. This is in contrast to microscopic
combinations such as found in metal alloys or ceramics, which to a first approximation
are usually considered to be homogeneous [2,8]. This distinction is an important
characteristic of composite materials – indeed, the mechanical performance of a
composite is the result of complex interactions at the constituent level. For this reason,
the design, analysis, and mechanical characterization of composite materials is generally
much more complex than for monolithic materials, and has been a subject of extensive
research in recent decades.
Micromechanics is the study of the relations between the properties of the
constituents and the effective properties resulting from their specific combination. As
such, micromechanical models are based on known properties (such as the individual
mechanical behavior of the reinforcement and matrix phases, their volume fractions and
geometric arrangement) as well as assumptions regarding the interactions between the
constituent materials when under loading. In this capacity, micromechanics may be used

7/27/2019 Effect of Fiber Diameter on Stress Transfer and Interfacial Damage in Fiber Reinforced Composites
http://slidepdf.com/reader/full/effect-of-fiber-diameter-on-stress-transfer-and-interfacial-damage-in-fiber 27/112
14
to speed the design and development of new composite materials by identifying
promising combinations before manufacturing and physical characterization is
undertaken [9].
Homogenization Theory
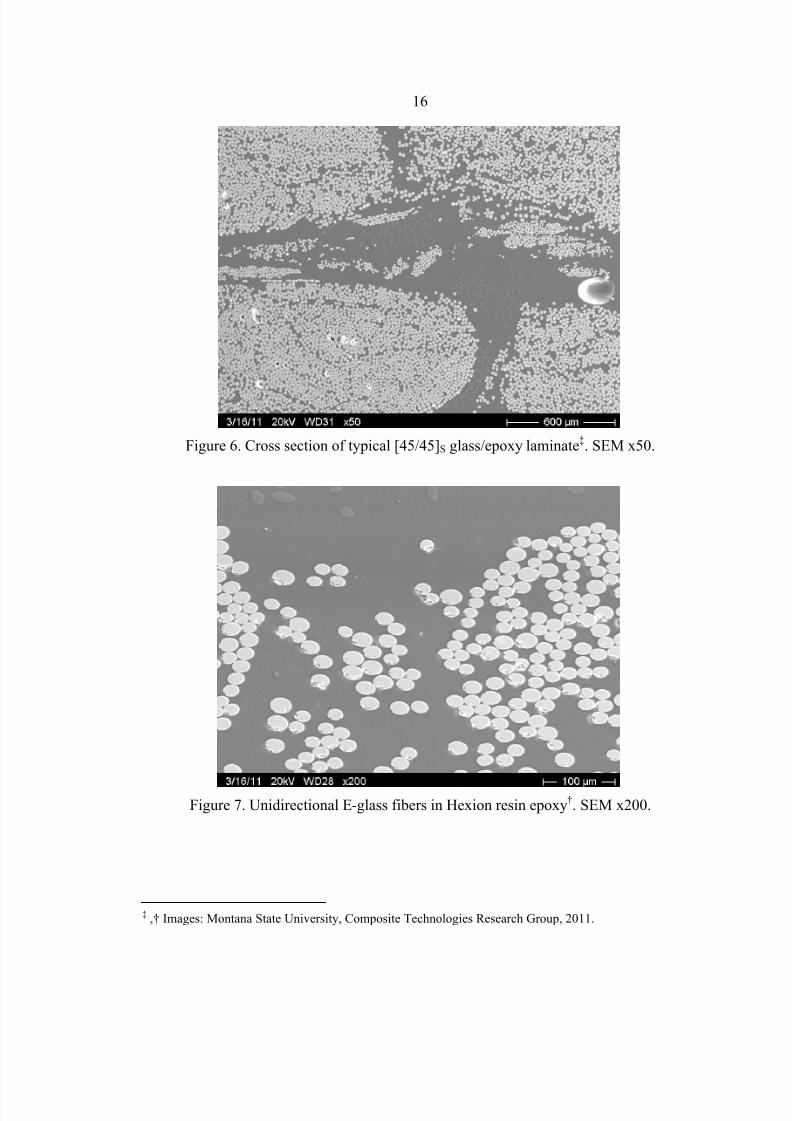
The microstructural geometry of most composite materials is inherently complex.
Consider the cross section of a typical glass/epoxy composite laminate as seen in the
scanning electron microscope (SEM) images shown in Figures 5-7. First, Figure 5 shows
the geometric arrangement of fiber bundles in each lamina, as well as several voids. Next,
in Figure 6 both the individual strands and fiber bundles are apparent at an intermediate
magnification; and in Figure 7 the arrangement of individual fiber strands within a fiber
bundle are shown.
At this microstructural level, micromechanical models allow the determination of
local stresses at each point and within each phase of the composite. Such
micromechanical stress analyses are useful in order to investigate local failure modes
before they might be detected on a macro-scale. In most engineering structural analyses,
however, the response of a macro-scale structure is of practical interest. This presents
conflicting requirements: on one hand, mechanical analyses of composite materials
without attention to the microstructure have limited ability to predict the material
behavior [10]. On the other hand, the direct analysis of a macroscopic composite
structure incorporating an exact representation of the material’s microstructure is not
currently possible by either analytical or numerical methods. To overcome this difficulty,
the average response of the constituents taken within an appropriate volume at the

7/27/2019 Effect of Fiber Diameter on Stress Transfer and Interfacial Damage in Fiber Reinforced Composites
http://slidepdf.com/reader/full/effect-of-fiber-diameter-on-stress-transfer-and-interfacial-damage-in-fiber 28/112
15
microscale may then be used to predict the material behavior of a structure on the
macroscale. This volume-averaging technique is called homogenization.
Although the stresses and strains at the microstructural level are not uniform as a
result of the different constituent material behaviors, in homogenization theory the
volume assumed by a micromechanical model can be replaced by an equivalent
homogeneous material with behavior described by the averaged responses of the
constituents. Therefore, the effective, or homogenized, properties obtained from a
micromechanical analysis are essential in the design and analysis of a composite structure
at the macroscale.
Figure 5. Cross section of typical [45/45]S glass/epoxy laminate†. SEM x15.
† Images: Montana State University, Composite Technologies Research Group, 2011.
7/27/2019 Effect of Fiber Diameter on Stress Transfer and Interfacial Damage in Fiber Reinforced Composites
http://slidepdf.com/reader/full/effect-of-fiber-diameter-on-stress-transfer-and-interfacial-damage-in-fiber 29/112
16
Figure 6. Cross section of typical [45/45]S glass/epoxy laminate‡. SEM x50.
Figure 7. Unidirectional E-glass fibers in Hexion resin epoxy†. SEM x200.
‡ ,† Images: Montana State University, Composite Technologies Research Group, 2011.

7/27/2019 Effect of Fiber Diameter on Stress Transfer and Interfacial Damage in Fiber Reinforced Composites
http://slidepdf.com/reader/full/effect-of-fiber-diameter-on-stress-transfer-and-interfacial-damage-in-fiber 30/112
17
In an FRP composite, for example, using homogenized properties it is then
possible to obtain the average stresses within a lamina, without the need to keep track of
the behavior of each fiber and fiber -matrix interaction. At this point, the fundamental
difference between a homogenized lamina and most other monolithic materials is the
high level of anisotropy manifested in the material properties; this directional dependence
is due to the orientation of the load bearing fiber -reinforcements. In a laminate, each
lamina may be associated with different homogenized properties and is assumed to
behave as a distinct homogeneous material. In composite laminate models, such as the
Classical Lamination Theory (CLT), the interaction of each layer in a laminate then
becomes possible, and composite structural mechanics may be more easily undertaken.
Microstructural Representations
When the local micromechanical behavior of a composite material is of interest
the actual geometric arrangement of the fibers within the matrix must be accounted for.
This is especially the case when the initiation and evolution of damage at the constituent
level is of concern. In order to avoid modeling all of the microstructural detail and
conserve computational resources, micromechanical idealizations are commonly used in
order to represent the essential microstructural details of a composite material. Such
efforts are based on the assumption that models using an appropriate geometric
representation and associated boundary conditions exhibit the mechanical behavior of the
macroscopic material.
As discussed by Pindera et al. [9], the analysis of spatially uniform periodic
composite materials may be grouped into two categories based on different geometric

7/27/2019 Effect of Fiber Diameter on Stress Transfer and Interfacial Damage in Fiber Reinforced Composites
http://slidepdf.com/reader/full/effect-of-fiber-diameter-on-stress-transfer-and-interfacial-damage-in-fiber 31/112
18
representations of the composite microstructure, each associated with different boundary
conditions (BCs):
1. The Representative Volume Element (RVE), as shown in Figure 8a;
2. The Repeating Unit Cell (RUC), as shown in Figure 8b.
a) RVE b) RUC
Figure 8. (a) The RVE microstructural representation characterizes the statistical
distribution of a composite; (b) the RUC microstructural representation assumes a periodic microstructure, and can be small relative to the RVE.
These concepts and terms are sometimes used interchangeably in the literature,
leading to some unfortunate confusion regarding the application of appropriate boundary
conditions (for a detailed discussion see the works of Li [11,12] or Drago and Pindera
[13], for example). Therefore, it is important to correctly identify each representation and
establish their usefulness for the current research.
The Representative Volume Element. In the RVE, homogenization of material
properties or microstructural stress analysis takes place over the smallest statistically
representative sample of the material at large, which contains the same fiber and matrix
volume fractions with the same distributions as the macroscopic material. This

7/27/2019 Effect of Fiber Diameter on Stress Transfer and Interfacial Damage in Fiber Reinforced Composites
http://slidepdf.com/reader/full/effect-of-fiber-diameter-on-stress-transfer-and-interfacial-damage-in-fiber 32/112
19
representation is based on the assumption that the application of homogeneous traction
and homogeneous displacement boundary conditions produce equivalent behavior and
homogenized properties. The homogeneous displacement and homogeneous traction BCs
are given in Equation 9 and 10, respectively.
Σ =
where ∈ Σ
Eq. ( 9 )
Σ =
where ∈
Eq. ( 10 )
In Equation 9, Σ are the displacement components applied to the boundary
surface Σ at the location x j – with the corresponding nominal strain field ; similarly, in
Equation 10, Σ are the applied traction components – with the corresponding nominal
stress field .
In the RVE concept, macroscopically uniform displacement and traction BCs are
applied in order to produce average strains () and stresses () in the micromechanical
model – which are the same as the nominal, uniform strains ( ) and stresses ( ) that
are produced when they are applied to an equivalent homogenized material [9]. If this
assumption is satisfied, then the representative volume element experiences boundary
deformations like an equivalent homogeneous material and the RVE characterization of
the composite microstructure is valid.
In other words, the application of uniform displacement BC Σ upon a
homogeneous material and the corresponding uniform strain field produces a uniform
stress field . In linear elastic homogeneous materials the stress and strain fields are

7/27/2019 Effect of Fiber Diameter on Stress Transfer and Interfacial Damage in Fiber Reinforced Composites
http://slidepdf.com/reader/full/effect-of-fiber-diameter-on-stress-transfer-and-interfacial-damage-in-fiber 33/112
20
related by the constitutive stiffness tensor , which is expressed by Hooke’s Law, as in
Equation 11.
= Eq. ( 11 )
The reverse also holds, such that uniform traction boundary conditions and the
corresponding uniform stress field produces a uniform strain field, as related by Hooke’s
Law and the inverse of the stiffness tensor (that is, the compliance tensor =
[]). Since the stiffness and compliance tensors are invertible, then the stress and
strain fields are thus related and the moduli are independent of the BC type, and the strain
energy in the homogeneous material can be expressed as in Equation 12 [13].
= 12 Eq. ( 12 )
In heterogeneous materials, the homogenized (effective) constitutive stiffness and
compliance tensors replace the homogeneous ones, i.e., → and → . If
→ [ ], then the same homogenized moduli are obtained whether displacement
or traction BCs are applied to the RVE . As a practical matter, however, this equivalence
is usually only achieved as the number of inclusions becomes large [9,14], and as the size
of the inclusions become small compared to the RVE boundary. As proposed by Hill [15],
the equivalence of loading type may be accomplished by ensuring that the strain energies
induced by homogenous traction or homogeneous displacement boundary conditions are
essentially the same, such as in Equation 13.
12 ≅ 12 ≅ 12 Eq. ( 13 )

7/27/2019 Effect of Fiber Diameter on Stress Transfer and Interfacial Damage in Fiber Reinforced Composites
http://slidepdf.com/reader/full/effect-of-fiber-diameter-on-stress-transfer-and-interfacial-damage-in-fiber 34/112
21
where:
= average stresses induced by homogeneous traction boundary conditions
= average strains induced by homogeneous displacement boundary conditions
With a sufficient number of inclusions, the homogenized properties calculated
from the RVE analysis asymptotically converge upon a single value [9,13,14]. Therefore,
while small in comparison to a full model attempting the direct analysis of a macroscopic
composite structure, typical RVEs are still quite large and generally computationally
intensive. In addition, several candidate RVEs may need to be tested before equivalence
is achieved.
The Repeating Unit Cell. Alternatively, the microstructure of a composite material
may be idealized as a periodic array of inclusions, as was illustrated in Figure 8b. In the
RUC, homogenization of material properties or microstructural stress analysis takes place
over the smallest element of a periodic microstructure which serves as the basic building
block for the material through replication [9]. Unlike an RVE, an RUC is valid using any
geometry and number of inclusions, provided the contents may be geometrically
replicated to reproduce a periodic microstructure. Because each RUC in the array is
identical, the response of any single subvolume to a load is identical to that of the entire
array. However, it is not enough to simply assume a geometrically periodic
microstructural distribution. In a valid RUC, periodicity is ensured by the application of
periodic boundary conditions (PBCs), with general forms given in Equations 14-15 [9].
+ − = Eq. ( 14 )

7/27/2019 Effect of Fiber Diameter on Stress Transfer and Interfacial Damage in Fiber Reinforced Composites
http://slidepdf.com/reader/full/effect-of-fiber-diameter-on-stress-transfer-and-interfacial-damage-in-fiber 35/112
22
where ∈Σ
+ − = 0 Eq. ( 15 )
In these general forms, the average strain components over the RUC (and thus,
the entire array) are represented by , the surface traction components by , and
represents the distance between corresponding points and + in the k -th coordinate
direction, which lie on opposing faces of the boundary surface Σ in the j-th direction. For
example, consider the distance in the x-direction between point A and its image on the
next RUC (for example, point B) on the corresponding faces in the j = 1 faces as shown
in Figure 9. This is given by Equation 16.
= − = −
= − = + ℓ −
= ℓ
Eq. ( 16 )
Similarly, the distance in the y-direction between point A and point B on the
corresponding faces in the j = 1 faces is given by Equation 17.
= − = −
= − = + 0 − = 0
Eq. ( 17 )
The concept of a periodic boundary condition (PBC) is actually quite simple –
essentially, PBCs require that the displacements at corresponding points on opposite sides

7/27/2019 Effect of Fiber Diameter on Stress Transfer and Interfacial Damage in Fiber Reinforced Composites
http://slidepdf.com/reader/full/effect-of-fiber-diameter-on-stress-transfer-and-interfacial-damage-in-fiber 36/112
23
of an RUC are related, or linked. This can be understood by considering the array of
repeating unit cells – each RUC is identical, such that a point
within any of the RUC
has its image within every other RUC in the array, separated by a distance d . Therefore,
corresponding nodes on opposing surfaces of the RUC displace in the same manner, plus
whatever volumetric strain effects resulting from applied loads. In addition, the resulting
boundary tractions at corresponding points on opposing faces are in equilibrium. Note
that the traction BCs in a finite element analysis are usually not explicitly prescribed,
since they are natural boundary conditions and are generally satisfied automatically as
part of the FEA solution process [12]. In summary, PBCs ensure continuity and
compatibility between adjacent RUC, such as shown in Figure 9.
A B
y
x
Figure 9. PBCs ensure that each RUC responds in an identical manner to loads,
and the relative displacement of Point A and its image (represented by an “x” suchas at Point B) on any other RUC are related by Equation 12.
In the RUC representation the inclusions are usually assumed to take hexagonal or
rectangular arrangements, which are illustrated in Figure 10.

7/27/2019 Effect of Fiber Diameter on Stress Transfer and Interfacial Damage in Fiber Reinforced Composites
http://slidepdf.com/reader/full/effect-of-fiber-diameter-on-stress-transfer-and-interfacial-damage-in-fiber 37/112
24
a) Square/Rectangular RUC b) Hexagonal RUC
Figure 10. Typical RUCs for a) the square/rectangular, and b) the hexagonal
periodic arrangements.
Although it is not a requirement, repeating unit cells often exhibit symmetry with
respect to the x-, y-, or z - planes. In the case where reflective symmetry exists in terms of:
1) geometry, 2) support conditions, 3) material properties, and 4) mechanical loading, the
solution obtained from the structural analysis will also be symmetric. Therefore,
computational models need only represent the symmetric part of the RUC. This is
obviously desirable in numerical calculations in order to further reduce computational
requirements. For example, consider a fiber -reinforced composite material with a
microstructure idealized as a square array of fibers as in Figure 11a.
x - s y m
rbc
y-sym
r b c
x
y
a) b) c)
Figure 11. Derivation of the quarter -symmetric RUC. Mechanical loading is assumed
to be in the fiber axial direction. Note that either of the RUCs indicated by the dashed
lines on the left may be represented by the quarter -symmetric RUC on the right.

7/27/2019 Effect of Fiber Diameter on Stress Transfer and Interfacial Damage in Fiber Reinforced Composites
http://slidepdf.com/reader/full/effect-of-fiber-diameter-on-stress-transfer-and-interfacial-damage-in-fiber 38/112
25
In this case the smallest valid repeating unit cell is a single fiber within a small
region of surrounding matrix material, as shown in Figure 11b. In general terms, the
application of PBCs to this geometry is sufficient for any load case. Now, supposing the
applied loads act along the fiber axis only, the reflectional symmetries about the x- and y-
planes may be exploited. Therefore, solutions obtained over a quarter -symmetric model
as in Figure 11c fully describe the response of the entire RUC. Such reductions in the
required model size allow an RUC to become much less computationally expensive,
especially with respect to that of the RVE.
Arguably, the simplification of a composite microstructure as an idealized,
regular, and periodic array of identical repeating unit cells is not always reasonable. Then
again, the computational expense of an RVE may be prohibitive and the homogeneous
displacement BCs (often referred to as the plane-remains- plane BC) may enforce
artificial rigidity along boundary surfaces. Therefore, an awareness of the actual
microstructural detail is required when attempting to model the behavior of a specific
composite material.
Shear -Lag Stress Transfer
FRP composites are optimally designed to carry loads in the fiber direction, as
shown in Figure 12. When loaded in such a manner (within the elastic limit and assuming
that the fiber -matrix interface is perfectly bonded) the strains in the matrix and fiber are
equal. In this ideal case, no shear stress exists at the interfacial boundary.

7/27/2019 Effect of Fiber Diameter on Stress Transfer and Interfacial Damage in Fiber Reinforced Composites
http://slidepdf.com/reader/full/effect-of-fiber-diameter-on-stress-transfer-and-interfacial-damage-in-fiber 39/112
26
σ0
Figure 12. Loading of an FRP in the fiber axial direction.
However, at fiber breaks, fiber ends, or where the fiber -matrix interface is
imperfectly bonded, the softer matrix material temporarily carries a greater portion of the
load – consequently, a strain gradient exists across the interfacial boundary until the load
is redistributed from the matrix to the broken fiber (and surrounding fibers) via intact
fiber -matrix interfaces. This occurs through shear stresses at the fiber -matrix boundaries.
The analysis of stress transfer between fiber and matrix materials in composites is
accomplished using a method commonly referred to as “shear -lag” analysis, originally
proposed by Cox [16] and greatly expanded by Nairn [17] and others. Shear -lag models
are usually represented by a single “broken” fiber embedded within a matrix material.
Typically the fiber and matrix are arranged in concentric cylinders like the CCA, as
illustrated in Figure 13a, although in some cases [18] other neighboring intact fibers are
present.
Matrix
Fiber
fiber break
a) b)
Figure 13. a) Shear -Lag conceptual model; b) Typical computational
shear -lag model exploiting symmetry.

7/27/2019 Effect of Fiber Diameter on Stress Transfer and Interfacial Damage in Fiber Reinforced Composites
http://slidepdf.com/reader/full/effect-of-fiber-diameter-on-stress-transfer-and-interfacial-damage-in-fiber 40/112
27
In this configuration, symmetry exists in the fiber axial direction about the fiber
break; consequently, only half of the model is necessary as in Figure 13b. In order to
simulate the broken fiber in the symmetric model, the fiber end is a free (unloaded)
surface, while mechanical or displacement boundary conditions are normally applied to
the matrix material only, which are then transferred from the matrix to the fiber through
shear stresses that develop at the fiber -matrix interface.
Ineffective Fiber Length
Experimental results [3,4] have shown that until the maximum fiber tensile stress
(σ) is recovered by a broken fiber, the nominal axial load is transferred from the matrix to
the fiber through interfacial shear stress (τ) at the fiber -matrix boundary. For instance, in
Figure 14 the photoelastic image of a single broken glass fiber in an epoxy matrix under
tensile loading is shown [4], and the isochromatic fringes can be observed. In the
photoelastic technique, the isochromatic fringes represent regions along which the
difference between the principal stresses is constant, and are directly related to the shear
stress. Therefore, the stress distribution at the fiber -matrix interface can be obtained from
photoelasticity, such as indicated in Figure 15 [19].
Figure 14. Photoelastic image of single fiber fragmentation test (E-glass/epoxy); the
isochromatic fringe seen can be used to obtain the shear stress at the fiber -matrix
interface [4].
7/27/2019 Effect of Fiber Diameter on Stress Transfer and Interfacial Damage in Fiber Reinforced Composites
http://slidepdf.com/reader/full/effect-of-fiber-diameter-on-stress-transfer-and-interfacial-damage-in-fiber 41/112
28
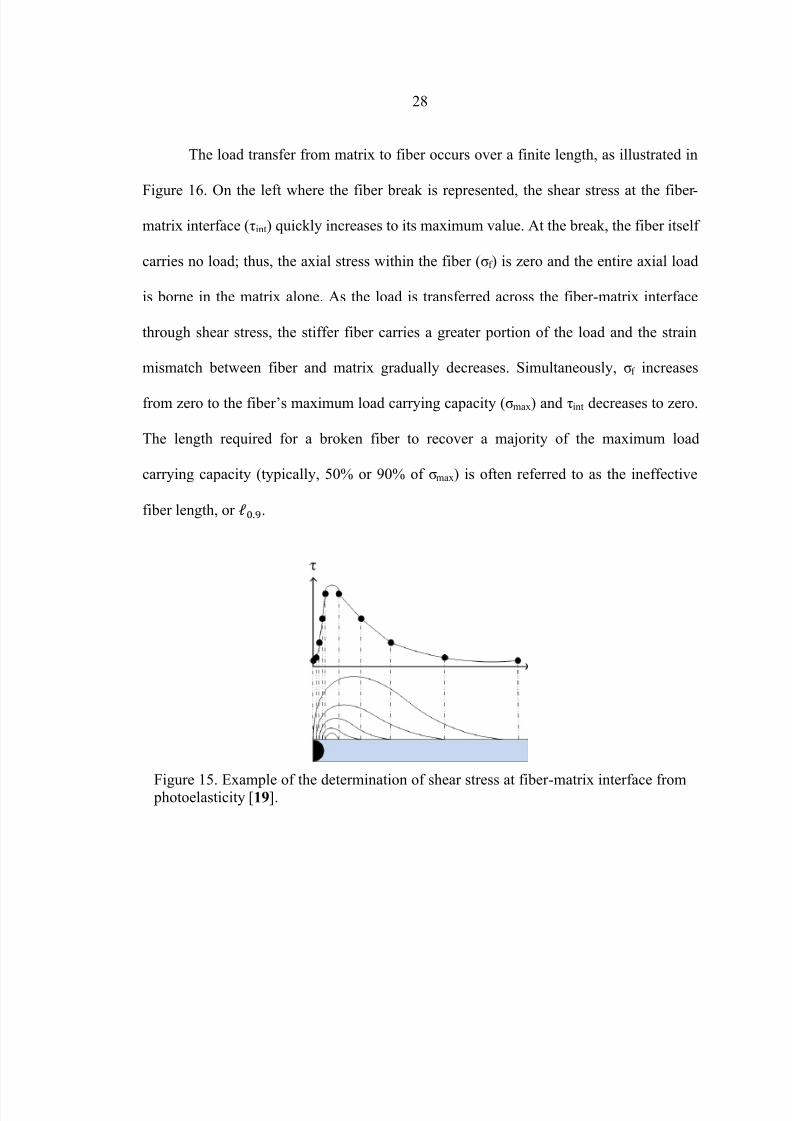
The load transfer from matrix to fiber occurs over a finite length, as illustrated in
Figure 16. On the left where the fiber break is represented, the shear stress at the fiber -
matrix interface (τint) quickly increases to its maximum value. At the break, the fiber itself
carries no load; thus, the axial stress within the fiber (σf ) is zero and the entire axial load
is borne in the matrix alone. As the load is transferred across the fiber -matrix interface
through shear stress, the stiffer fiber carries a greater portion of the load and the strain
mismatch between fiber and matrix gradually decreases. Simultaneously, σ f increases
from zero to the fiber’s maximum load carrying capacity (σmax) and τint decreases to zero.
The length required for a broken fiber to recover a majority of the maximum load
carrying capacity (typically, 50% or 90% of σmax) is often referred to as the ineffective
fiber length, or ℓ.
Figure 15. Example of the determination of shear stress at fiber -matrix interface from photoelasticity [19].

7/27/2019 Effect of Fiber Diameter on Stress Transfer and Interfacial Damage in Fiber Reinforced Composites
http://slidepdf.com/reader/full/effect-of-fiber-diameter-on-stress-transfer-and-interfacial-damage-in-fiber 42/112
29
0.9l
στf int
Figure 16. Lateral view of axial fiber stress (σf ) and fiber -matrix interfacial shear
stress (τint) distributions near a fiber break. The ineffective fiber length (
ℓ) is the
fiber length required before 90% of the fiber load carrying capacity is recovered.
It is well documented in the literature that the fiber length required before σ max is
recovered is a function of fiber volume fraction (V f ) and the fiber -to-matrix modulus ratio
( E f / E m). For example, as reported by Nairn [17] and Hossain et al. [20,21], ℓ decreases
V f increases, and increases as E f / E m increases.
Within the context of the current work, it is convenient to define a
nondimensional form of the ineffective fiber length given by
= ℓ/ Eq. ( 18 )
where:
ℓ = the 90% stress transfer distance (µm)
D = fiber diameter (µm)
This equation can be interpreted as the number of fiber diameters required before
90% of the maximum axial load has been recovered by a broken fiber.
7/27/2019 Effect of Fiber Diameter on Stress Transfer and Interfacial Damage in Fiber Reinforced Composites
http://slidepdf.com/reader/full/effect-of-fiber-diameter-on-stress-transfer-and-interfacial-damage-in-fiber 43/112
30
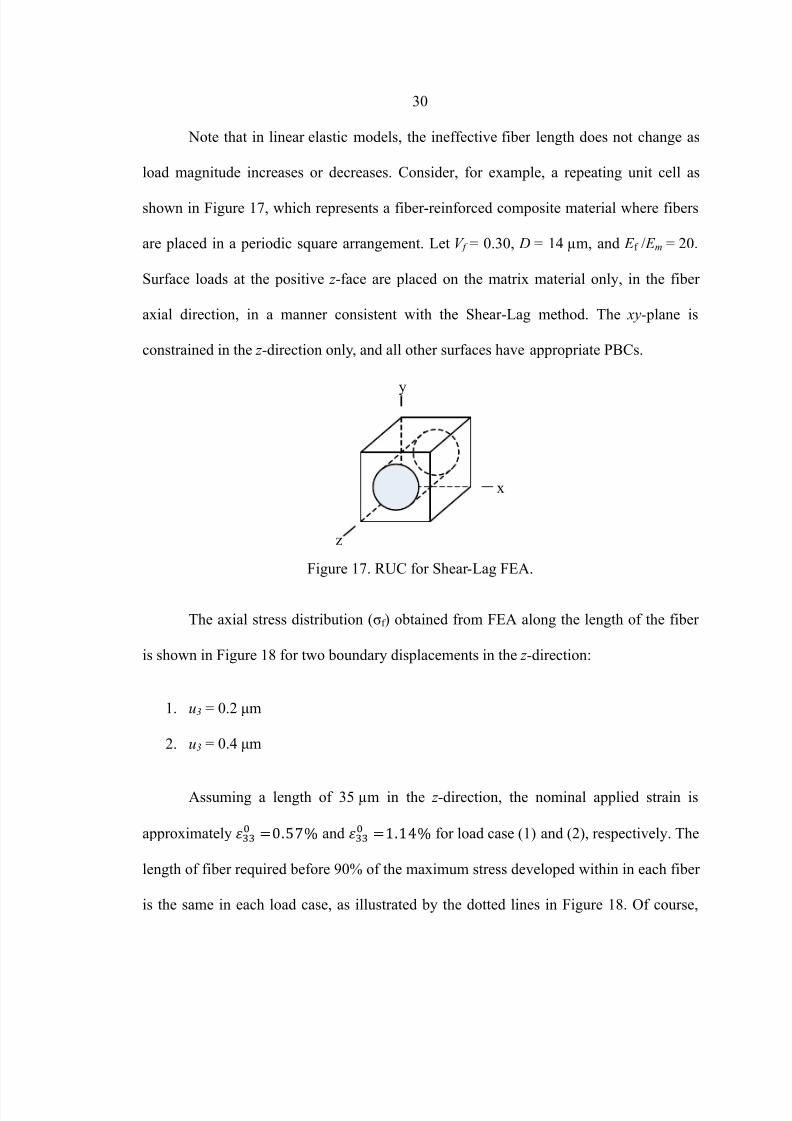
Note that in linear elastic models, the ineffective fiber length does not change as
load magnitude increases or decreases. Consider, for example, a repeating unit cell as
shown in Figure 17, which represents a fiber -reinforced composite material where fibers
are placed in a periodic square arrangement. Let V f = 0.30, D = 14 µm, and E f / E m = 20.
Surface loads at the positive z -face are placed on the matrix material only, in the fiber
axial direction, in a manner consistent with the Shear -Lag method. The xy- plane is
constrained in the z -direction only, and all other surfaces have appropriate PBCs.
x
y
z
Figure 17. RUC for Shear -Lag FEA.
The axial stress distribution (σf ) obtained from FEA along the length of the fiber
is shown in Figure 18 for two boundary displacements in the z -direction:
1. u3 = 0.2 μm
2. u3 = 0.4 μm
Assuming a length of 35 µm in the z -direction, the nominal applied strain is
approximately =057% and =114% for load case (1) and (2), respectively. The
length of fiber required before 90% of the maximum stress developed within in each fiber
is the same in each load case, as illustrated by the dotted lines in Figure 18. Of course,

7/27/2019 Effect of Fiber Diameter on Stress Transfer and Interfacial Damage in Fiber Reinforced Composites
http://slidepdf.com/reader/full/effect-of-fiber-diameter-on-stress-transfer-and-interfacial-damage-in-fiber 44/112
31
each model in this example has the same fiber diameter; therefore is the same in
each model as well. The rate at which the axial stress within the fiber increases to its
maximum is also the same, as shown in Figure 19. Thus, ℓ is a characteristic value for
a given V f and modulus ratio, and for linear elastic models does not change with load
magnitude.
Figure 18. Ineffective fiber length for the single fiber RUC as a function of fiber diameter in two load cases. For V f = 0.30, the 90% load transfer length is approximately 12.5 μm
(or approximately 89% of a fiber diameter) for both load case (1) and (2).
Figure 19. The percent of maximum axial stress for the single fiber RUC as a function of
fiber diameter. The rate at which the maximum stress in each fiber is developed is the
same for load cases (1) and (2).
-5.0E+07
5.0E+07
1.5E+08
2.5E+08
3.5E+08
4.5E+08
5.5E+08
6.5E+08
0 0.5 1 1.5 2 2.5
S t r e s s ,
N / m 2
Distance (Diameters) From Fiber Break along Fiber Axis, z/D
Axial Stress (1)
Axial Stress (2)
-100
102030405060708090
100
0 0.5 1 1.5 2 2.5
S t r e s s ,
%
Distance (Diameters) From Fiber Break along Fiber Axis, z/D
Axial Stress % (1)
Axial Stress % (2)

7/27/2019 Effect of Fiber Diameter on Stress Transfer and Interfacial Damage in Fiber Reinforced Composites
http://slidepdf.com/reader/full/effect-of-fiber-diameter-on-stress-transfer-and-interfacial-damage-in-fiber 45/112
32
Shear -lag models of various levels of complexity are found in the literature,
ranging from the relatively simple linear elastic to those which incorporate material
viscoelasticity, strain hardening, and damage parameters in an effort to reproduce
experimental data. In most models, it appears that analytical shear -lag methods accurately
predict fiber axial stresses [17], but have lower accuracy when predicting the shear stress
at the fiber -matrix interface. To overcome this, detailed finite element models have been
utilized [18,22,23]. However, very few results have been published regarding the effect of
fiber diameter on the ineffective fiber length for a given fiber volume fraction. In fact,
most analytical shear -lag models disregard this concept altogether. This is only just
beginning to be recognized, as in the recent works of Hossain et al. [21] and Peterson et
al. [24].
Damage and Fracture
An essential part of engineering design is to determine the ability of a structure to
sustain design loads without incurring damage, as well as the ability to continue service
in the presence of damage. Predicting the onset of damage and the potential for its
subsequent growth is a challenging problem, as one might expect, and several failure
theories are widely used in order to address the issue.
In general, damage mechanics and material failure models refer to the gradual
loss of load-carrying capacity resulting from the degradation of the material stiffness,
while fracture mechanics considers the growth of existing flaws. In this research,
progressive damage and failure is simulated using the cohesive zone – a powerful and

7/27/2019 Effect of Fiber Diameter on Stress Transfer and Interfacial Damage in Fiber Reinforced Composites
http://slidepdf.com/reader/full/effect-of-fiber-diameter-on-stress-transfer-and-interfacial-damage-in-fiber 46/112
33
versatile method that, in many ways, combines the best aspects from both damage
mechanics and fracture mechanics theories. The following sections give a brief overview
of classical continuum failure theories and fracture mechanics in order to provide a
general background, and to create a basis for comparison with the cohesive zone damage
model.
Continuum Failure Theories
In certain classical failure theories, such as the Maximum Principal Stress (or
Tresca) and Maximum Octahedral Shear Stress (or von Mises) Criteria, inelastic behavior
is assumed to occur when a critical stress, strain, or strain energy has been reached. The
failure criterion may be considered to be the resistance of a material to damage, however,
effects from local defects on the microscale are not explicitly considered, and material
behavior is taken on the macroscale only.
For example, at a material point where the applied load results in the three-
dimensional principal normal stresses, σ1, σ2, and σ3, the von Mises Criterion predicts
that failure or yielding occurs when the effective stress (σeff ) equals the material’s critical
stress (σc). Further loading results in permanent (plastic) deformation of the material.
This criterion is given in Equation 19, in terms of the principal stresses.
= = 1√ 2 σ − σ + σ − σ + σ − σ Eq. ( 19 )
Classical failure theories implicitly assume the material to be homogeneous and
free from large cracks or other geometric stress raisers. However, these types of
geometric discontinuities are a common source of failure in engineering structures. As

7/27/2019 Effect of Fiber Diameter on Stress Transfer and Interfacial Damage in Fiber Reinforced Composites
http://slidepdf.com/reader/full/effect-of-fiber-diameter-on-stress-transfer-and-interfacial-damage-in-fiber 47/112
34
discussed by Dowling [25] and many other mechanics of materials texts, stress analyses
for structural members with geometric discontinuities such as holes, fillets, blunt notches,
or other stress raisers may be performed by determining an appropriate stress
concentration factor,
=/ Eq. ( 20 )
which is the ratio of the maximum stress near a notch or crack (σ) to the nominal applied
stress (σ 0). However, these methods are unable to accurately account for materials with
sharp slit-like cracks, and where the crack tip radius tends to becomes small [26,27,25].
In fact, in such a case, σ becomes increasingly large near the crack tip – becoming
theoretically infinite if the crack is ideally sharp.
Consequently, the field of continuum damage mechanics (CDM) has evolved in
order to consider the initiation and growth of cracks at the microscale. In CDM a
continuous damage variable (Φ) represents the overall material degradation over a
process zone of finite size. Once a damage initiation criterion such as the von Mises
effective stress above is satisfied, the overall damage variable increases according to a
specified constitutive damage evolution law over the range 0 ≤ Φ ≤ 1. The stress field in
the material is given by the general form in Equation 21 [28],
= 1 − Φ Eq. ( 21 )
where is the stress field in the absence of damage. The material has lost its load
carrying capacity when Φ = 1. In finite element analysis, when the damage variable
reaches maximum degradation, or when Φ = 1, the element is typically inactivated and

7/27/2019 Effect of Fiber Diameter on Stress Transfer and Interfacial Damage in Fiber Reinforced Composites
http://slidepdf.com/reader/full/effect-of-fiber-diameter-on-stress-transfer-and-interfacial-damage-in-fiber 48/112
35
removed from the mesh [29]. Although a significant improvement over classical failure
criterion alone, CDM does not generally allow the observation of discrete damage
processes that are of interest in the current work, particularly regarding interfacial
debonding.
Fracture Mechanics
Fracture mechanics addresses the problem of the integrity and durability of
materials containing cracks or crack-like defects [26] using the concepts of strain energy
and stress intensity. The concept of a critical energy threshold required to form new
surfaces by crack extension is often traced back to the seminal work of Griffith [30].
In fracture mechanics, the stress intensities K I , K II , and K III characterize the
magnitude of the stresses near a crack tip in the Mode I, II, and II crack opening
displacements, respectively. For example, in the opening mode of fracture (Mode I) the
stresses near the crack tip are of the form given by the general form in Equation 22.
= √ 2 + ⋯ Eq. ( 22 )
where:
r = the distance from the crack tip
θ = angle of rotation about the crack plane
K I = the Mode I (opening) stress intensity factor
f ij I = defines the angular variation of the stress in Mode I
… = indicates the presence of higher -order terms in a series solution

7/27/2019 Effect of Fiber Diameter on Stress Transfer and Interfacial Damage in Fiber Reinforced Composites
http://slidepdf.com/reader/full/effect-of-fiber-diameter-on-stress-transfer-and-interfacial-damage-in-fiber 49/112
36
For convenience the stress intensity factor, K I , is often expressed as shown in
Equation 23.
= ∙ √ Eq. ( 23 )
Therefore, K I relates the applied nominal stress (σ) and the crack size (a), where F is a
dimensionless function of the crack size and placement as well as the overall specimen
geometry [25], and can be found in most engineering handbooks. Thus, for a particular
load and crack geometry a specific stress intensity factor K I may be calculated, which
characterizes the magnitude of the local stress field ahead of a crack. For example, in the
classic example of an elliptical crack in a wide plate loaded in tension, as shown in
Figure 20, the stress intensity K I is
= √ Eq. ( 24 )
σ
2a
h
Figure 20. Infinite plate with an elliptical through-crack under tension.
In this method, an existing crack extends when the local stress intensity at a crack
tip becomes critical; K I at this point is known as the fracture toughness of the material,

7/27/2019 Effect of Fiber Diameter on Stress Transfer and Interfacial Damage in Fiber Reinforced Composites
http://slidepdf.com/reader/full/effect-of-fiber-diameter-on-stress-transfer-and-interfacial-damage-in-fiber 50/112
37
K c. Thus, in Mode I, failure is predicted when K I > K Ic. For the load case shown in Figure
20, the fracture toughness at the critical load is given by Equation 25.
= √ Eq. ( 25 )
In fracture mechanics theory, when a material is loaded such that the stress state at
the crack becomes critical, the crack extends by a small amount da. If the displacement at
this critical point is held constant, then the stiffness of the member decreases. This results
in a decrease in the potential energy in the member by –dU , and it is said that energy has
been released by the formation of the new crack surface. The change in crack area is h·da,
where h is the thickness of the member. The energy per unit crack area required to extend
the crack is known as the critical strain energy release rate (G), and is given by
= − 1ℎ Eq. ( 26 )
The strain energy release rate, originally conceived by Griffith, is considered to be the
fundamental physical quantity controlling the behavior of the crack [25,30], and is
generally taken to be a material property. It can be shown that the stress intensity ( K ) is
related to the strain energy release rate (G) [25,26]. For mode I crack opening, the
relation is given by Equation 27.
=
Eq. ( 27 )
where = for plane stress; = 0 = 1 − for plane strain; = 0
Eq. ( 28 )

7/27/2019 Effect of Fiber Diameter on Stress Transfer and Interfacial Damage in Fiber Reinforced Composites
http://slidepdf.com/reader/full/effect-of-fiber-diameter-on-stress-transfer-and-interfacial-damage-in-fiber 51/112
38
As seen in Equation 22 above, the stresses at the crack tip approach infinity as r
approaches zero (nearing the crack tip). Thus, the crack tip in LEFM is known as a
singular point, and no realistic value of stress can be obtained. Also, in defining K , the
material is assumed to behave in a linear elastic manner [25], therefore this approach is
called linear elastic fracture mechanics (LEFM). LEFM successfully describes fracture in
isotropic and relatively brittle materials, where the fracture process zone at the crack tip
is small and there is little or no plastic (nonlinear) deformation [25,27]. In most real
materials, however, a redistribution of stresses occurs at the crack tip due to plasticity,
crazing, or microcracking [25,27,31]. In each case, the crack tip develops a finite
separation near its tip – thus, the very high stresses predicted by both concentration
factors and by LEFM are redistributed within the region surrounding the crack tip. In
addition, for LEFM to be practically applied an initial crack must exist in the material.
Therefore, fracture mechanics cannot be applied to predict the nucleation, or initiation, of
voids or microcracks within a material to form a new crack.
Overview of the Cohesive Zone Model
In the cohesive zone model (CZM), damage and fracture is viewed as a
phenomenon that takes place across an extended zone in front of a crack tip, in which the
growth of the crack is resisted by internal cohesive forces [32]. Within this cohesive
process zone, the effects of all mechanisms of irreversible material degradation (such as
shown in Figure 21) are lumped together [33]. First introduced by Dugdale [32] and
Barenblatt [34], CZMs have been successfully used to model a number of fracture and

7/27/2019 Effect of Fiber Diameter on Stress Transfer and Interfacial Damage in Fiber Reinforced Composites
http://slidepdf.com/reader/full/effect-of-fiber-diameter-on-stress-transfer-and-interfacial-damage-in-fiber 52/112
39
failure processes, most notably in the analysis of adhesive joints and interfacial
delamination in composites.
a) b)
c) d)
Figure 21. In real materials, nonzero radii are often accompanied by stressredistribution due to a) plasticity, b) crazing, c) microcracking, or d) delamination.
In debonding and decohesion failure where the initial separation between
debonding surfaces is negligibly thin, damage mechanisms present within an element
may be represented using a traction-separation (T -δ) relation. In this case, cohesive
elements are placed in the mesh between surrounding continuum elements, forming an
“interface” in which damage may occur and the surrounding continuum elements may
separate, as shown in Figure 22.
In the CZM, once a damage initiation criterion is met, material (interfacial)
damage may occur according to a specified damage evolution law. Thus, the CZM is
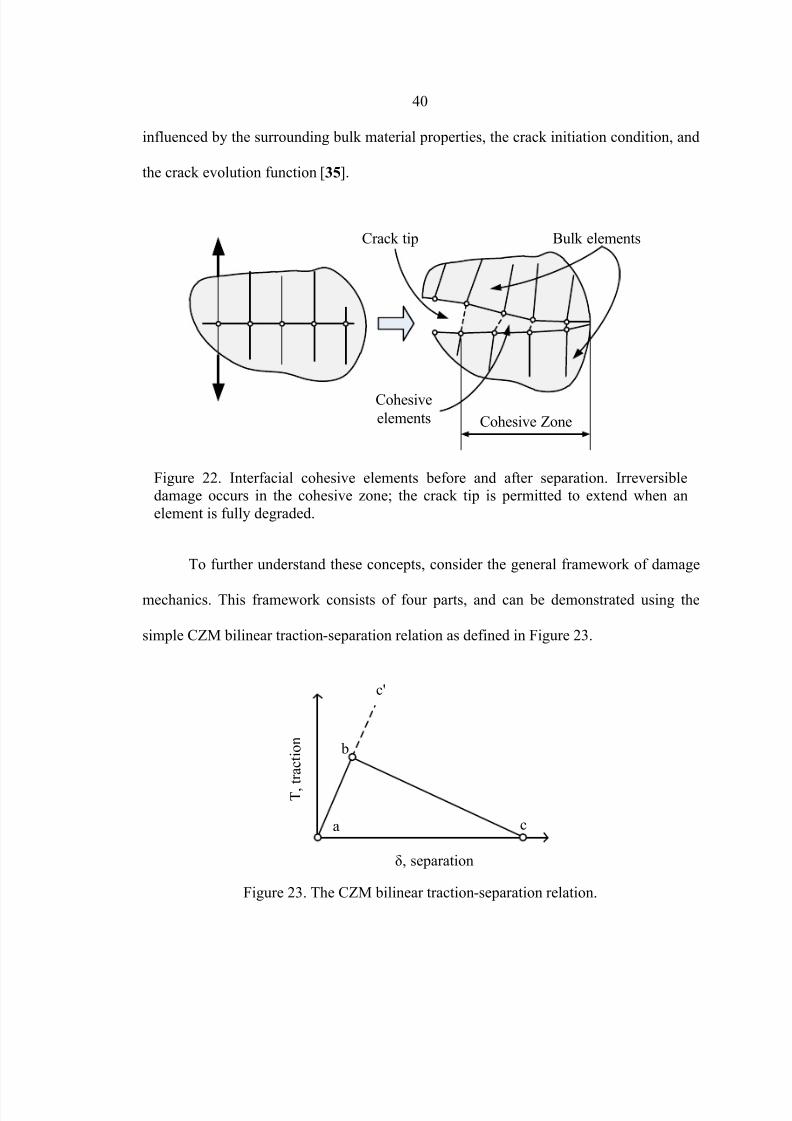
7/27/2019 Effect of Fiber Diameter on Stress Transfer and Interfacial Damage in Fiber Reinforced Composites
http://slidepdf.com/reader/full/effect-of-fiber-diameter-on-stress-transfer-and-interfacial-damage-in-fiber 53/112
40
influenced by the surrounding bulk material properties, the crack initiation condition, and
the crack evolution function [35].
Cohesive
elements
Bulk elementsCrack tip
Cohesive Zone
Figure 22. Interfacial cohesive elements before and after separation. Irreversibledamage occurs in the cohesive zone; the crack tip is permitted to extend when an
element is fully degraded.
To further understand these concepts, consider the general framework of damage
mechanics. This framework consists of four parts, and can be demonstrated using the
simple CZM bilinear traction-separation relation as defined in Figure 23.
T , t r a c t i o n
δ, separation
a
b
c'
c
Figure 23. The CZM bilinear traction-separation relation.

7/27/2019 Effect of Fiber Diameter on Stress Transfer and Interfacial Damage in Fiber Reinforced Composites
http://slidepdf.com/reader/full/effect-of-fiber-diameter-on-stress-transfer-and-interfacial-damage-in-fiber 54/112
41
These four parts are:
1. An initial, undamaged (linear elastic) constitutive behavior (path a-b-c’ );
2. Damage initiation (point b), representing the interfacial strength;
3. Damage evolution (path b-c), representing the process of material degradation;
4. Choice of element deletion upon complete material degradation (point c).
In a related sense, the key material properties required to define the interfacial behavior
of the bilinear CZM are:
1. The initial, undamaged elastic stiffness, K 0;
2. The interfacial cohesive strength, T c;
3. The interfacial fracture energy, Gc.
The CZM method is particularly successful when the crack path is known
a priori. In many simulations, knowledge of the most probable crack path is achieved
through prior experimental observation. For example, in composite laminates a common
mode of failure occurs through the delamination of individual plies – therefore, cohesive
elements are often placed at the interfaces between the plies in order to capture the onset
and spread of interlaminar damage. The cohesive zone model approach offers several
advantages for modeling failure in composite materials, including:
1. The fracture process zone in quasi- brittle materials (such as composites) may be
larger than allowed by LEFM;
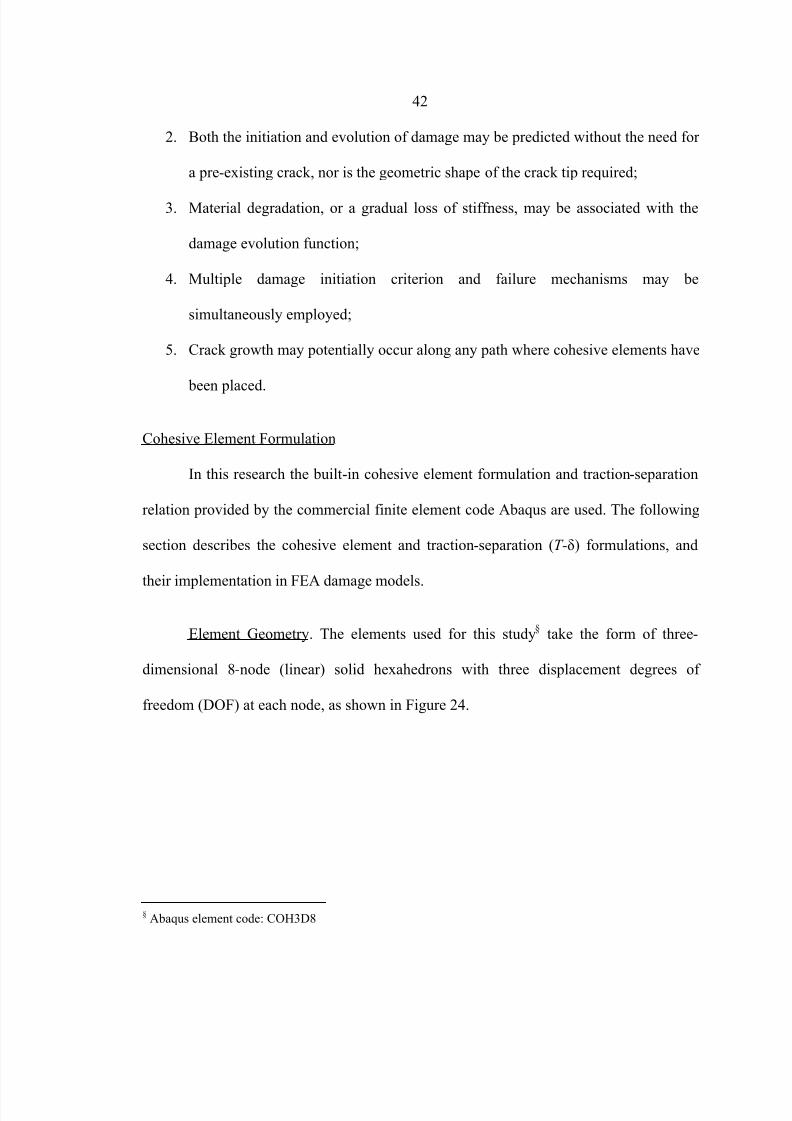
7/27/2019 Effect of Fiber Diameter on Stress Transfer and Interfacial Damage in Fiber Reinforced Composites
http://slidepdf.com/reader/full/effect-of-fiber-diameter-on-stress-transfer-and-interfacial-damage-in-fiber 55/112
42
2. Both the initiation and evolution of damage may be predicted without the need for
a pre-existing crack, nor is the geometric shape of the crack tip required;
3. Material degradation, or a gradual loss of stiffness, may be associated with the
damage evolution function;
4. Multiple damage initiation criterion and failure mechanisms may be
simultaneously employed;
5. Crack growth may potentially occur along any path where cohesive elements have
been placed.
Cohesive Element Formulation
In this research the built-in cohesive element formulation and traction-separation
relation provided by the commercial finite element code Abaqus are used. The following
section describes the cohesive element and traction-separation (T -δ) formulations, and
their implementation in FEA damage models.
Element Geometry. The elements used for this study§
take the form of three-
dimensional 8-node (linear) solid hexahedrons with three displacement degrees of
freedom (DOF) at each node, as shown in Figure 24.
§ Abaqus element code: COH3D8

7/27/2019 Effect of Fiber Diameter on Stress Transfer and Interfacial Damage in Fiber Reinforced Composites
http://slidepdf.com/reader/full/effect-of-fiber-diameter-on-stress-transfer-and-interfacial-damage-in-fiber 56/112
43
top face
bottom face
thickness direction
midsurface
node
integration
point
12
3
Figure 24. Key geometric features of a cohesive element.
As indicated in the figure, cohesive elements are associated with a thickness
direction. Conceptually, cohesive elements can be considered as a pair of top and bottom
faces, separated by a thickness [29]. The midsurface passes through the integration points
of the element, which are defined by averaging the coordinates of the node pairs at the
vertices of the top and bottom faces. The thickness direction is assumed to be normal to
this midsurface. The relative motion of the top and bottom faces measured along the
thickness direction represents opening or closing displacements of an interface.
Thickness and Material Parameters. The initial thickness ( H o) of the cohesive
element may correspond to the geometric thickness that has been modeled using the mesh
nodal positions and stack direction, or it may be specified directly. This is an important
choice that affects the behavior of the element, and is particularly relevant in interfacial
problems where the initial thickness may be very small or zero – in such a case, the
thickness computed by nodal coordinates may not be accurate due to round -off errors
[29] and direct specification should be used.
Material parameters used in the cohesive zone T-δ formulation can be thought to
describe the mechanical behavior of an interface, rather than any real physical material.

7/27/2019 Effect of Fiber Diameter on Stress Transfer and Interfacial Damage in Fiber Reinforced Composites
http://slidepdf.com/reader/full/effect-of-fiber-diameter-on-stress-transfer-and-interfacial-damage-in-fiber 57/112
44
The interpretation of material properties, such as the elastic stiffness, as interface
parameters is interesting in the limit case as the thickness of a cohesive element tends to
zero. Consider, for example, the axial displacement (δ) of a rod under a loading force ( F )
is
= = Eq. ( 29 )
where k eq is the equivalent stiffness of the rod, A is the cross-sectional area of the rod, E
is the modulus of elasticity, and L is the rod length. As an analogue to the elementary
equation = / , Equation 29 may be rewritten as = / where the axial stress is
= / and the constitutive stiffness is = / . As a matter of convenience, if the
length L is now replaced by the unit value 1.0, then the strain is the same as the
displacement.
= i f = 1 Eq. ( 30 )
In the T-δ formulation, if an adhesive material has a modulus of E c and an initial
thickness H 0, then the interface stiffness is given by Equation 31, which relates the
nominal stress across the interface to its displacement separation in the same manner as
= / .
= / Eq. ( 31 )
However, it can be seen that for an interface with a negligibly small initial
thickness, the stiffness K approaches infinity. In addition, both H 0 and K are difficult to
physically measure, and are generally unknown. Along these lines, the cohesive element

7/27/2019 Effect of Fiber Diameter on Stress Transfer and Interfacial Damage in Fiber Reinforced Composites
http://slidepdf.com/reader/full/effect-of-fiber-diameter-on-stress-transfer-and-interfacial-damage-in-fiber 58/112
45
initial thickness may be manually defined as a unit value – regardless of the length scale
or mesh coordinates used in the actual model. Consequently, the strains across the
interface are the same as the relative displacements of the top and bottom surfaces of the
cohesive element (as in Equation 30 above).
Connectivity. Cohesive elements are meant to represent an interface; they may not
be layered in the thickness direction. Therefore, the cohesive zone may only be
discretized using a single layer of cohesive elements through its thickness [29]. Cohesive
elements may be joined to adjacent continuum (bulk) elements by sharing nodes, or with
tie constraints (see Figure 25).
a) Node sharing:
A single meshed part is used. Cohesive
elements are embedded in mesh next to
surrounding bulk elements.
b) Tie constraints:
Three separate meshed parts are used. Cohesive
elements in a finely discretized region are tied to
surrounding bulk elements.
tie constraintsshared nodes
Figure 25. Cohesive element connectivity using a) node sharing, and b) tie constraints for
mismatched meshes.
As illustrated in Figure 25a, node sharing is possible when the cohesive elements
are the same size as the surrounding bulk elements. Generally, mesh creation using node
sharing is easy to implement; however, more accurate results (and higher resolutions) are
obtained when the cohesive zone is finely meshed. If both cohesive zone and bulk
elements are finely meshed, the total number of elements in the mesh may become quite
large and computationally expensive. To avoid this problem, the cohesive zone may be

7/27/2019 Effect of Fiber Diameter on Stress Transfer and Interfacial Damage in Fiber Reinforced Composites
http://slidepdf.com/reader/full/effect-of-fiber-diameter-on-stress-transfer-and-interfacial-damage-in-fiber 59/112
46
more finely discretized than the surrounding bulk elements with boundary connectivity
enforced by tie constraints, as indicated in Figure 25b. An additional benefit of using tie
constraints is that linear cohesive elements may then be joined to an adjacent mesh of
higher -order quadratic elements used for the bulk material on either side of the interface.
Traction-Separation Relation. At an initially bonded interface, let the initial
geometric distance between two surfaces be zero, or otherwise negligibly small.
Accordingly, the top and bottom surfaces of a cohesive element are collapsed upon
themselves, as shown in Figure 26. As a result, the nodes from the top and bottom
surfaces are superimposed, but retain independent DOF. In this configuration, the element
thickness is equal to zero, and the constitutive response of a cohesive element is
described using the traction-separation relation.
1
2
3
4
5
6
7
8
1,5
2,6
3,7
4,81
23
Figure 26. Collapsed cohesive element geometry at a bonded interface.
The T -δ relation assumes initially elastic behavior as the top and bottom surfaces
begin to separate under loading, followed by damage initiation and evolution until
complete material degradation is assumed to occur. When the cohesive element fails it is
removed from the mesh, and the surrounding bulk elements are no longer bonded. This
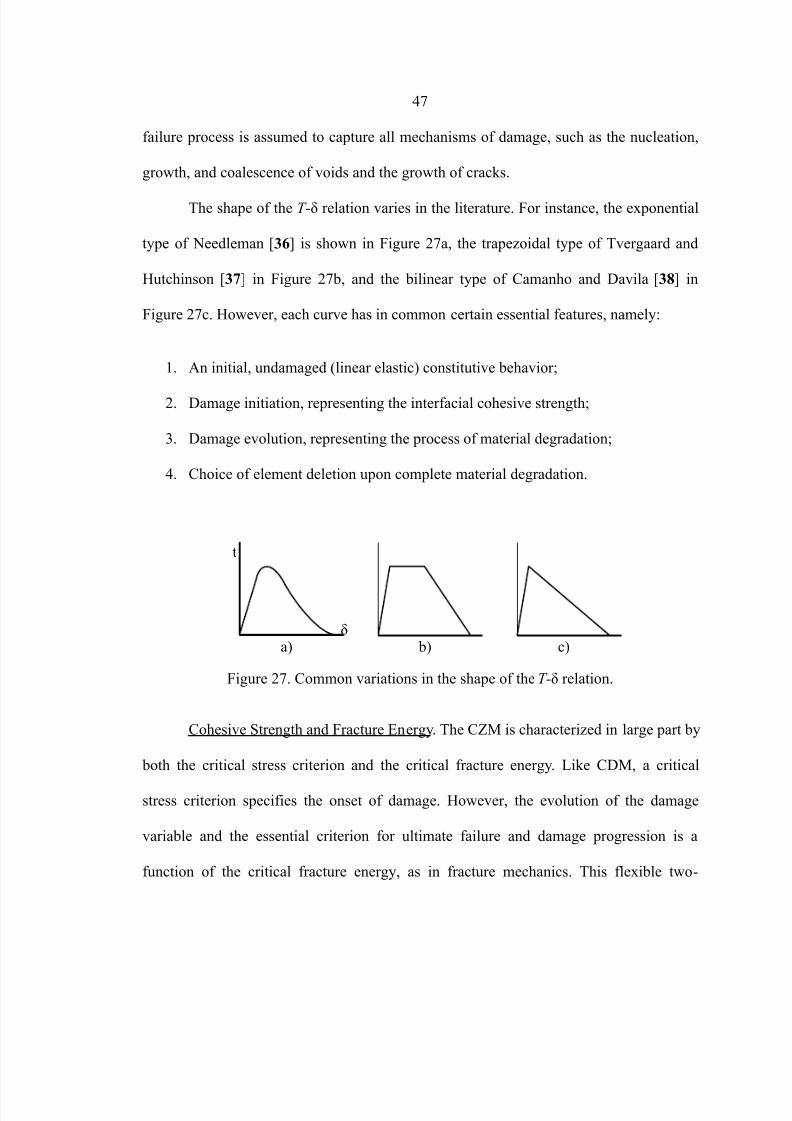
7/27/2019 Effect of Fiber Diameter on Stress Transfer and Interfacial Damage in Fiber Reinforced Composites
http://slidepdf.com/reader/full/effect-of-fiber-diameter-on-stress-transfer-and-interfacial-damage-in-fiber 60/112
47
failure process is assumed to capture all mechanisms of damage, such as the nucleation,
growth, and coalescence of voids and the growth of cracks.
The shape of the T -δ relation varies in the literature. For instance, the exponential
type of Needleman [36] is shown in Figure 27a, the trapezoidal type of Tvergaard and
Hutchinson [37] in Figure 27b, and the bilinear type of Camanho and Davila [38] in
Figure 27c. However, each curve has in common certain essential features, namely:
1. An initial, undamaged (linear elastic) constitutive behavior;
2. Damage initiation, representing the interfacial cohesive strength;
3. Damage evolution, representing the process of material degradation;
4. Choice of element deletion upon complete material degradation.
a) b) c)
t
δ
Figure 27. Common variations in the shape of the T -δ relation.
Cohesive Strength and Fracture Energy. The CZM is characterized in large part by
both the critical stress criterion and the critical fracture energy. Like CDM, a critical
stress criterion specifies the onset of damage. However, the evolution of the damage
variable and the essential criterion for ultimate failure and damage progression is a
function of the critical fracture energy, as in fracture mechanics. This flexible two -

7/27/2019 Effect of Fiber Diameter on Stress Transfer and Interfacial Damage in Fiber Reinforced Composites
http://slidepdf.com/reader/full/effect-of-fiber-diameter-on-stress-transfer-and-interfacial-damage-in-fiber 61/112
48
parameter approach allows cohesive zone models to predict fracture and failure in many
types of materials and damage processes.
Penalty Stiffness. When traction-separation cohesive behavior is used, a high
initial stiffness ( K 0) is chosen in order to prevent deformation across the interface while
loading occurs in the linear elastic pre-damage regime. Notice that the value of K 0 may be
obtained from the shape of the bilinear traction-separation curve, as in Equation 32,
where T c is the cohesive strength damage initiation criterion and δc is the critical
displacement at the onset of damage. Notice that the onset of damage may be fully
defined by either the critical cohesive strength (T c) or by the critical displacement (δc);
however, K 0 automatically defines whichever value has not already been specified by
using Equation 32.
=
/
Eq. ( 32 )
After the interfacial tractions attain the cohesive strength, the damage initiation
criterion (T c) is satisfied. Subsequent irreversible reduction in stiffness occurs, and the
stiffness may then be described as
= 1 − Φ Eq. ( 33 )
where
is used to indicate the initial stiffness before a reduction due to damage. Before
complete failure occurs, upon unloading the traction across the interface elastically
reduces to zero over a path described by , as shown in Figure 28. Upon reloading, the
tractions across the interface elastically increase until the maximum value that the
damaged element may carry has been recovered (defined here as the residual cohesive

7/27/2019 Effect of Fiber Diameter on Stress Transfer and Interfacial Damage in Fiber Reinforced Composites
http://slidepdf.com/reader/full/effect-of-fiber-diameter-on-stress-transfer-and-interfacial-damage-in-fiber 62/112
49
strength). Complete degradation of the element occurs when the fracture energy (Gc) has
been satisfied, which is the area under the T -δ curve. Once complete degradation has
occurred, → 0 and the element can no longer resist further deformation. In this work,
the element is removed from the mesh (deleted) when the damage variable equals one, or
Φ = 1, and the crack tip extends.
As an aside, although it has not been exploited in this research, it is noted that the
irreversible damage process in stiffness and the corresponding residual cohesive strength
may be useful in simulations of progressive damage in fatigue.
T
δ
K 0
Tc
δc δf
Gc
K Φ =(1-Φ)K 0
Figure 28. Bilinear traction-separation relation.
Nominal Stresses and Strains. The nominal stresses in a cohesive element, T, are
the force components divided by the original area at each cohesive element integration
point. The nominal strains, ε, are the separations between the top and bottom surfaces
divided by the original thickness at each integration point. The nominal stresses are
related to the nominal strains by an elastic stiffness matrix, K , as in Equation 34, where

7/27/2019 Effect of Fiber Diameter on Stress Transfer and Interfacial Damage in Fiber Reinforced Composites
http://slidepdf.com/reader/full/effect-of-fiber-diameter-on-stress-transfer-and-interfacial-damage-in-fiber 63/112
50
the three component directions n, s, and t represent the normal (along the local 3-axis in
the thickness direction) and the shear and transverse shear directions (along the local 1 -
and 2-directions).
= { } = { } = Eq. ( 34 )
Using the original thickness H o, the nominal strains are given by Equation 35.
= {
} =1
{
} Eq. ( 35 )
Recall, by defining the initial thickness H 0 = 1, the strains ε are the same as the
displacements across the cohesive element, δi. In light of the previous discussions
regarding the damage variable, constitutive thickness, and penalty stiffness, the bilinear
traction-separation relation may be concisely given by Equation 36-39 [29,38].
= for
≤
1 − Φ for ≤ ≤ 0 for ≥ Eq. ( 36 )
with Φ = − ( − ) Eq. ( 37 )
where = ⟨⟩ + + Eq. ( 38 )
and
= 2 / Eq. ( 39 )
where:
= the effective displacement across the element surfaces
= the critical effective displacement at damage initiation

7/27/2019 Effect of Fiber Diameter on Stress Transfer and Interfacial Damage in Fiber Reinforced Composites
http://slidepdf.com/reader/full/effect-of-fiber-diameter-on-stress-transfer-and-interfacial-damage-in-fiber 64/112
51
= the critical effective displacement at complete material degradation
= the maximum effective displacement achieved during loading

7/27/2019 Effect of Fiber Diameter on Stress Transfer and Interfacial Damage in Fiber Reinforced Composites
http://slidepdf.com/reader/full/effect-of-fiber-diameter-on-stress-transfer-and-interfacial-damage-in-fiber 65/112
52
MODEL DEVELOPMENT
Conceptual Model
In the fiber -scaling method discussed in previous sections, the fiber -matrix
interfacial surface area may be increased by using more fibers. However, for a specified
volume, the fiber volume fraction may remain constant if the fiber diameter is reduced
while the number of fibers increases – consequently, the total mass of the composite
material remains unchanged even as the fiber -matrix surface area increases.
In this work, the primary goal is to investigate the effect that fiber diameter and
the total fiber -matrix interfacial surface area have upon the mechanical properties of a
composite material. In order to accomplish this task the model itself need not be
particularly complex. Models developed for the comparative analyses of this work are
based upon appropriately simplified geometry. For example, consider the idealized cross-
section of a typical glass-fiber reinforced epoxy lamina shown in Figure 29. In this
idealization, fibers are assumed to be continuous, regularly spaced, and cylindrical in
shape. The lamina is assumed to extend indefinitely in the xz - plane.
x
y
zh
L
D
top face is a free surface
bottom face is a free surface
Figure 29. Idealization of an FRP composite lamina. This simplifiedgeometry forms the basis for model development in the current work.

7/27/2019 Effect of Fiber Diameter on Stress Transfer and Interfacial Damage in Fiber Reinforced Composites
http://slidepdf.com/reader/full/effect-of-fiber-diameter-on-stress-transfer-and-interfacial-damage-in-fiber 66/112
53
The conceptual geometry shown in Figure 29 forms the basis for model
development in the current work. It is interesting to note that this simple configuration
shares the essential details of many micromechanical models commonly found in the
literature, with one important difference: the presence of free boundary surfaces on the
top and bottom of the lamina. Unlike the RVE and RUC micromechanical
representations, the conceptual structural geometry in Figure 29 does not assume that the
model represents a material point within a much larger body. In fact, the opposite is true –
the present model represents a structural volume within a very thin body, such that the
diameters of the fiber reinforcements are on the same order as the thickness of the lamina
structure. This type of microstructural model is, strictly speaking, not a valid RVE for this
very reason. However, it does not appear to violate any specific requirements of the RUC.
If one likes, the conceptual geometry used in this work may be considered to be a special
case of RUC, in which repeating boundary conditions (RBCs) are used in order to
replicate a smaller subvolume within the plane of the structure only, rather than the usual
periodic boundary conditions (PBCs) applied to all surfaces.
It is also worthwhile to mention that typical micromechanical models using the
RVE or RUC representations do not strictly require the size of the inclusions to be
known. Provided the fiber volume fraction V f is maintained, the RVE and RUC may
assume any dimensions. This is implicitly recognized by unit cell methods, in which a
volume with unit lengths may be used for analysis, and the inclusion dimensions are
governed by the V f requirements.

7/27/2019 Effect of Fiber Diameter on Stress Transfer and Interfacial Damage in Fiber Reinforced Composites
http://slidepdf.com/reader/full/effect-of-fiber-diameter-on-stress-transfer-and-interfacial-damage-in-fiber 67/112
54
Consider the following as an example: as shown in Figure 30a, suppose a material
represented by RUC-1 has fibers of diameter D1 = 20 µm, a width of h = 40 µm, and a
length of L = 200 µm. The fiber volume fraction is therefore V f = 0.196.
Now, as shown in Figure 30b, RUC-2 represents a similar material with the same
fiber volume fraction as RUC-1, but with D2 ≤ D1 such that in order to have the same V f
as RUC-1, the number of fibers, N f , must increase to 9. The fiber diameter in RUC-2 may
be calculated in order to yield D2 = 6.67 µm.
x
y
hh
h
D1 D2
a) b)
Figure 30. RUC models with equal V f .
However, the differences in fiber diameters and outside width dimensions is
obscures the fundamental relationship between the ratio of fiber diameter to the overall
volume (that is, the fiber volume fraction, V f ). In fact, these two models are
mathematically identical and cannot be used to demonstrate differences in fiber diameter
and total interfacial surface area effects, as is the objective of this research. For the same
reaction force generated by a given load condition, they will each respond in an identical
manner.
This similarity can be demonstrated in a simple example: consider the fiber
volume fractions resulting from each unit cell,

7/27/2019 Effect of Fiber Diameter on Stress Transfer and Interfacial Damage in Fiber Reinforced Composites
http://slidepdf.com/reader/full/effect-of-fiber-diameter-on-stress-transfer-and-interfacial-damage-in-fiber 68/112
55
= 4
ℎ
= = 4
ℎ
=0196
Eq. ( 40 )
But, the same fiber volume fraction will also result from considering only one of the
subvolumes about a single fiber within RUC-2 as indicated by the dashed lines in Figure
30b, as demonstrated in Equation 41.
= 4 ℎ/3 = = 4 ℎ =0196 Eq. ( 41 )
Thus, each model is the same by the nature of the geometric ratio D/h, the periodic
replication of inclusions, and the imposed repeating boundary conditions. Moreover, from
the calculations above, it should be expected that any length is sufficient, as long as the
stress field is allowed to fully develop along the length of the RUC.
Therefore, the choice to include free boundary surfaces in the structural unit cell
is twofold. The primary reason, as described above, is that RUCs based on fiber volume
fractions alone cannot represent differences in fiber diameters, or account for an increase
in fiber -matrix interfacial surface area.
Secondly, this allows the investigation into potential fiber -scaling benefits for
fiber -reinforced membrane-like materials such as used in gossamer spacecraft. For
example, the durability, performance, and longevity of gossamer spacecraft may be
enhanced through the use of fiber reinforcements, while maintaining relatively low mass
and compact stowage characteristics. Provided an increase in durability results from
fiber -scaling for the same overall mass, reducing the fiber diameter could provide
exceptional advantages. In addition, given that the thickness of many gossamer

7/27/2019 Effect of Fiber Diameter on Stress Transfer and Interfacial Damage in Fiber Reinforced Composites
http://slidepdf.com/reader/full/effect-of-fiber-diameter-on-stress-transfer-and-interfacial-damage-in-fiber 69/112
56
membranes may be considerably less than conventional fiber diameters, going to smaller
diameter fibers may be the only practical solution.
Structural RUC Models
The key premise to this work is that the number of fibers and the total fiber -
matrix interfacial surface area increases as the fiber diameter is reduced, provided the
fiber volume fraction remains constant within a well-defined volume. The structural
repeating unit cell model, or structural RUC, outlined in the previous section forms the
basis for the development and investigation of this concept. Note that in each model, the
fiber volume fraction is maintained at
=032
General Boundary Conditions
In the following sections, three models are presented which will be used in further
analyses to represent the thin FRP lamina structure, and will enable the investigation into
fiber -scaling effects. In each case, a fiber volume fraction of 32% is ensured by adjusting
the fiber diameter and the number of fibers as required, within a well-defined volume
using the fiber -scaling method. The volume for each structural RUC is defined by the
height, width, and length:
ℎ = = 25 = 160
The boundary conditions placed on each model are exactly the same. In fact, each
model may be thought of as a variation of the same structural RUC, for each fiber

7/27/2019 Effect of Fiber Diameter on Stress Transfer and Interfacial Damage in Fiber Reinforced Composites
http://slidepdf.com/reader/full/effect-of-fiber-diameter-on-stress-transfer-and-interfacial-damage-in-fiber 70/112
57
diameter considered. In this sense, the combination of the two fundamental concepts
employed in this research (namely, the fiber -scaling method and the structural RUC) may
be considered as a technique to allow analyses upon the same structure using a different
“material”. Because each model represents the same structural component, the boundary
conditions placed upon them may be discussed without special attention to the number
and diameter of the fibers within them.
As such, the boundary conditions used in each analysis and for each model are
illustrated in Figure 31. Boundary conditions on each of the six faces are indicated.
x
y
RB C
R B C
free
free
h
h
L
z
“Roller” condition applied to the -z face:
u3(x,y,0) = 0
RBC on the ±x faces:
u1(h,y,z) = u1(0,y,z) + h·ε’11
u2(h,y,z) = u2(0,y,z)
u3(h,y,z) = u3(0,y,z) + h·ε’13
Loading applied to the +z face:u3(x,y,L) = ΔU3
Free surfaces on the ± y faces:
u3(x,0,z) = u3(x,0,z)
u3(x,h,z) = u3(x,h,z)
Figure 31. General BCs used on structural RUC.
Loads are introduced on the +z -face in the fiber axial direction. The - z -face is
constrained from movement in the z -direction only (and can be considered a symmetry
plane). Importantly, the free boundary surfaces on the top and bottom faces of the
structural RUC model must be included in the analyses, so that changes in the fiber

7/27/2019 Effect of Fiber Diameter on Stress Transfer and Interfacial Damage in Fiber Reinforced Composites
http://slidepdf.com/reader/full/effect-of-fiber-diameter-on-stress-transfer-and-interfacial-damage-in-fiber 71/112
58
diameter may be realized in the numerical solution – thus, the top and bottom surfaces are
unloaded.
Repeating Boundary Conditions. Note that through the application of RBCs to
corresponding points on the +x and - x faces, the structural RUC may be assumed to
repeat infinitely in the horizontal direction. The specific form of the RBCs depend on the
loading conditions, and are given in Equation 42 for a general case where repeating
boundary conditions are placed on opposing faces in the x-direction. Notice that the
relative displacements of corresponding points are specified as a function of the
coordinates, and the surfaces are not required to remain a plane after loading and
deformation.
ℎ = 0 + ℎ ℎ = 0 ℎ = + ℎ
Eq. ( 42 )
Further explanation of the RBC may be useful. Notice that, the RBC in Equation
42 introduces two extra DOF into the system: the average shear strain () and the
average strain in the x-direction () [12]. These may be introduced in an FE analysis as
independent degrees of freedom to the overall system; this may be accomplished by
creating or choosing special nodes with one DOF (that is, where all but one DOF are
constrained). Including these extra DOF in the RBC equations creates an average, or a
“macroscopic,” strain effect over the entire RUC. In addition, prescribed displacements
or forces may be applied to these DOF in order to impose average strains or stresses over
the system. Now, for symmetrical loads in the axial direction, no shearing stresses or
strains exist, and = 0. Therefore, only the average strain () remains. For axial

7/27/2019 Effect of Fiber Diameter on Stress Transfer and Interfacial Damage in Fiber Reinforced Composites
http://slidepdf.com/reader/full/effect-of-fiber-diameter-on-stress-transfer-and-interfacial-damage-in-fiber 72/112
59
loads, this DOF is left “free” so that the average stress is = 0. The nodal
displacement at this extra DOF gives the average strain directly [12], and relates the
displacements between the corresponding points on the opposing x-faces directly
produced by an axial load as a result of the Poisson effect.
Symmetry RBC. Notice, the RBC must be modified to account for the use of
symmetry. For symmetry in the x-direction (“x-symm”) the displacements at the plane of
symmetry are given by Equation 43.
= 0 = → = →
Eq. ( 43 )
Symmetry conditions on the two opposing x-faces require
ℎ = −0 ℎ = 0 ℎ = 0
Eq. ( 44 )
Therefore, the RBC relating the displacements of points on the +x-face in the symmetric
model becomes
ℎ = 0 + ℎ ∙ or ℎ = ℎ 2⁄ ∙
Eq. ( 45 )
Recall, the average strain in the x-direction is an “extra” DOF of the system.
When a value is not directly prescribed, it serves only to relate the magnitude of the
displacements in the x-direction for each node at the surface.

7/27/2019 Effect of Fiber Diameter on Stress Transfer and Interfacial Damage in Fiber Reinforced Composites
http://slidepdf.com/reader/full/effect-of-fiber-diameter-on-stress-transfer-and-interfacial-damage-in-fiber 73/112
60
Model 1
Conceptually, the geometry associated with Model 1 (M1) is shown in Figure 32
where the fiber diameter is
= 16
Therefore, the length is equal to 10 D1. The structural RUC derived from the conceptual
geometry is shown in Figure 33a. Only one fiber is required in order to obtain V f = 0.32.
Utilizing symmetry about the x- and y- planes, the quarter -symmetric structural RUC
indicated in Figure 33b is obtained for computational purposes.
x
y
zh
L
D
Figure 32. Model 1 conceptual geometry.
x - s y m
free
y-sym
r b c
x
y
a) b)
r b c
r b c
free
free
h
h h/2
h / 2
L
z
D = 16 um
h = 25 um
L = 160 um
Figure 33. a) The M1 structural RUC; dashed lines indicate the location of
the b) 1/4-symmetric structural RUC.

7/27/2019 Effect of Fiber Diameter on Stress Transfer and Interfacial Damage in Fiber Reinforced Composites
http://slidepdf.com/reader/full/effect-of-fiber-diameter-on-stress-transfer-and-interfacial-damage-in-fiber 74/112
61
Model 2
Conceptually, the geometry associated with Model 2 (M2) is shown in Figure 34
where the fiber diameter is
= 8
Therefore, the length is equal to 20 D2. Using Equation 5, it can be seen that because
D2 = 1/2 D1 four fibers are necessary in order to maintain the fiber volume fraction at
32%. The geometry and RBCs associated with Model 2 (M2) are shown in Figure 35a.
Full exploitation of symmetry about the x-
and y-
planes results in the 1/8-symmetric
structural RUC indicated in Figure 35b.
x
y
zh
L
D
Figure 34. Model 2 conceptual geometry.
x
y
a) b)
r b c
r b c
free
free
h
h
L
z
x - s y m
free
y-sym
r b c
h/4
h / 2
D = 8 um
h = 25 um
L = 160 um
Figure 35. a) The M2 structural RUC; dashed lines indicate the location of the b) 1/8-symmetric structural RUC.
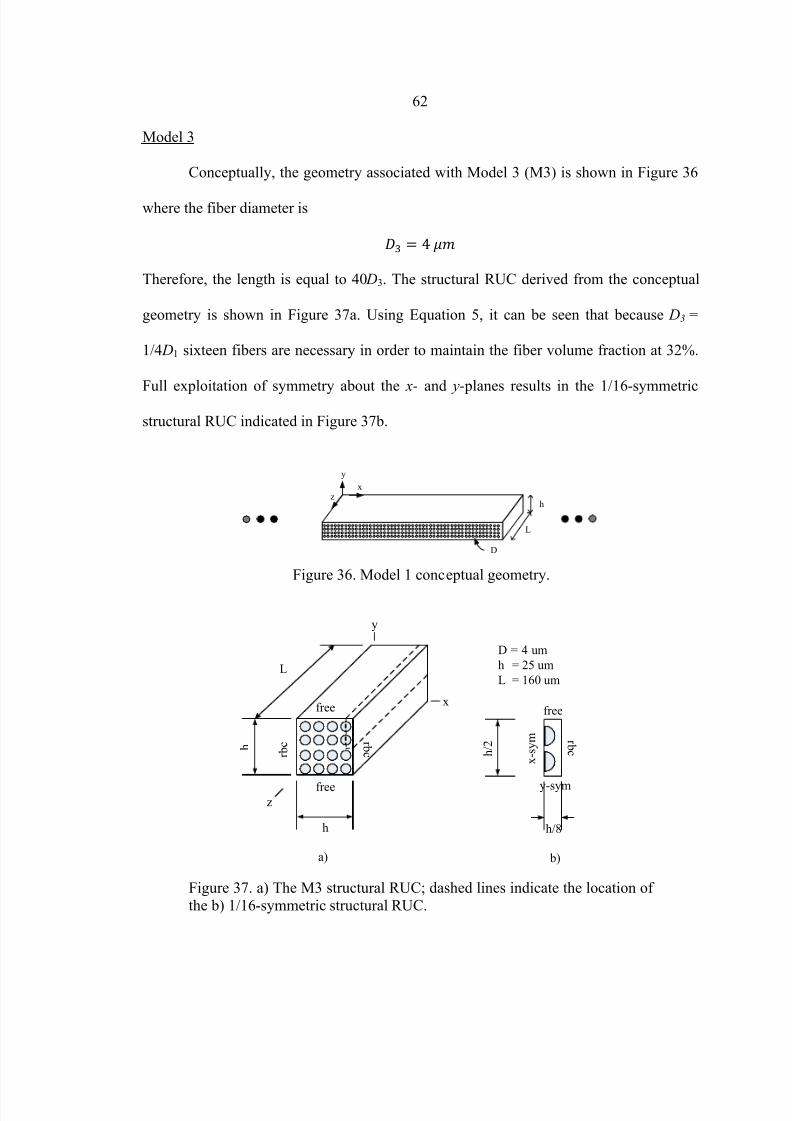
7/27/2019 Effect of Fiber Diameter on Stress Transfer and Interfacial Damage in Fiber Reinforced Composites
http://slidepdf.com/reader/full/effect-of-fiber-diameter-on-stress-transfer-and-interfacial-damage-in-fiber 75/112
62
Model 3
Conceptually, the geometry associated with Model 3 (M3) is shown in Figure 36
where the fiber diameter is
= 4
Therefore, the length is equal to 40 D3. The structural RUC derived from the conceptual
geometry is shown in Figure 37a. Using Equation 5, it can be seen that because D3 =
1/4 D1 sixteen fibers are necessary in order to maintain the fiber volume fraction at 32%.
Full exploitation of symmetry about the x-
and y-
planes results in the 1/16-symmetric
structural RUC indicated in Figure 37b.
x
y
zh
L
D
Figure 36. Model 1 conceptual geometry.
x
y
a) b)
r b c
r b c
free
free
h
h
L
z
x - s y m
free
y-sym
r b c
h/8
h / 2
D = 4 um
h = 25 um
L = 160 um
Figure 37. a) The M3 structural RUC; dashed lines indicate the location of the b) 1/16-symmetric structural RUC.

7/27/2019 Effect of Fiber Diameter on Stress Transfer and Interfacial Damage in Fiber Reinforced Composites
http://slidepdf.com/reader/full/effect-of-fiber-diameter-on-stress-transfer-and-interfacial-damage-in-fiber 76/112
63
Applied Loads
For an nominal axial stress applied in the z -direction ( ), equilibrium is satisfied
if a concentrated force F applied to the model is equal to the reaction force F R generated
at the back surface, as in the basic definition of stress shown in Equation 46.
= = Eq. ( 46 )
In order to provide a fair basis for comparisons between each model, the total
reaction force in the axial direction ( F R) developed at the constrained back surface of
each model must be the same – thus ensuring that each structural RUC carries the same
load. Without the use of symmetry reductions, this requirement is expressed by
= ℎ = ℎ = ℎ Eq. ( 47 )
However, the use of reflectional symmetries results in a reduction to the FE model
cross-sectional area, and the required reaction force must be similarly scaled. For
example, in Model 1, the quarter symmetric model has a cross-sectional area of
= ℎ4 = 4 Eq. ( 48 )
Therefore, to ensure the same load is placed upon the symmetry model as would be
placed on the “full” model, the required reaction force must also be scaled by a factor of
1/4, such that
= 4 Eq. ( 49 )
therefore, = = ℎ = Eq. ( 50 )

7/27/2019 Effect of Fiber Diameter on Stress Transfer and Interfacial Damage in Fiber Reinforced Composites
http://slidepdf.com/reader/full/effect-of-fiber-diameter-on-stress-transfer-and-interfacial-damage-in-fiber 77/112
64
Thus, for the same applied load, it becomes a simple matter to calculate the necessary
reaction force that must be generated in each symmetric structural RUC.
In the current work, each model is subjected to the same remotely applied tensile
loading,
= 128 Eq. ( 51 )
therefore,
= =
= 008 Eq. ( 52 )
where A = h2 = 25 µm
2. Thus, for the symmetric models shown in Figures 33b, 35b, and
37b, the values below are obtained.
symmetric
areas = ℎ4
= ℎ
8
= ℎ16
Eq. ( 53 )
symmetric
reactionforces
= 4
= 8
=
16
Eq. ( 54 )
In this work the tensile load condition is applied to the finite element mesh by
placing a concentrated force at a reference node, acting in the +z -direction. Note that this
reference node is not required to be connected to the rest of the meshed part. The

7/27/2019 Effect of Fiber Diameter on Stress Transfer and Interfacial Damage in Fiber Reinforced Composites
http://slidepdf.com/reader/full/effect-of-fiber-diameter-on-stress-transfer-and-interfacial-damage-in-fiber 78/112
65
displacement DOF of the reference node is then related to the displacements of other
nodes using a linear constraint equation of the following form:
− = 0 Eq. ( 55 )
where P represents a single node or node set and ref indicates the reference node. Notice
that the linear constraint equations are, therefore, applied in the same manner as the
RBCs.
The fibers within each structural RUC are considered to be broken. Therefore,
loading is applied to the matrix material only, at the forward (+z ) surface of the RUC
using the form of Equation 55. The fibers are left in an unloaded state. The nominal stress
( ) is applied by specifying a concentrated force at a reference node, which is
distributed to the nodes in the matrix material only using the constraint given by Equation
55. The constraint between the reference node and the matrix nodes at the forward
surface (belonging to the set P ) guarantees that each node in the mesh connected to an
element associated with the matrix material displaces in exactly the same manner – this is
useful in the tensile loading condition in order to represent the symmetry plane that was
previously illustrated in Figure 13. This is an important detail; notice that if a stress- based
load had been directly applied to the matrix material, the nodes nearest to the fiber would
displace less (due to the proximity of the stiffer fiber) and symmetry at the plane of the
fiber break could not be accurately represented. The model boundary conditions (repeated
from Figure 31) as well as the broken-fiber loading case are shown in Figure 38.

7/27/2019 Effect of Fiber Diameter on Stress Transfer and Interfacial Damage in Fiber Reinforced Composites
http://slidepdf.com/reader/full/effect-of-fiber-diameter-on-stress-transfer-and-interfacial-damage-in-fiber 79/112
66
x
y
z
1
2
3
2
3
4
Figure 38. RUC Boundary conditions and applied loads.
In Figure 38, the numbers indicate the BC or loads corresponding to:
1. Rear face of RUC: no z-displacement
2. Left and right faces of RUC: RBC
3. Top and bottom faces of RUC: Free surface
4. Forward face of RUC: applied nominal tensile stress (applied to a reference
node and distributed to the matrix material only, using the constraint given by
Equation 55)
Constituent Material Properties
E-glass and a typical epoxy are used to simulate the fiber and matrix constituent
materials, respectively, with typical values shown in Table 2 [2]. For simplicity, both fiber
and matrix material models are assumed to be linear elastic and isotropic. Note that these
values give a fiber/matrix modulus ratio of E f /E m = 20.

7/27/2019 Effect of Fiber Diameter on Stress Transfer and Interfacial Damage in Fiber Reinforced Composites
http://slidepdf.com/reader/full/effect-of-fiber-diameter-on-stress-transfer-and-interfacial-damage-in-fiber 80/112
67
Table 2. E-glass and epoxy mechanical properties [2]
Material Density, kg/m
Axial Modulus, GPa Axial Poisson’s Ratio
E-glass 2500 72 0.20 Epoxy 1200 3.5 0.30
Summary
In each model, the same fiber volume fraction (V f ≈ 32%) within the well-defined
volume of the structural RUC is ensured by increasing the number of fibers as the fiber
diameter is decreased. A comparison of the different structural RUC is given in Table 3.
The number of fibers required in each RUC can be calculated from Equation 2. The fiber -
matrix surface area in each RUC can be calculated using Equation 3.
Table 3. Summary of structural RUC M1, M2, and M3
Model Fiber Diameter,
µm
Fiber Volume
Fraction
No. of
Fibers in h2
Total Interfacial Surface
Area in h2 L, µm
2
M1 16 0.3217 1 8 042.5 M2 8 0.3217 4 16 085.0
M3 4 0.3217 16 32 170.0
Figure 39 illustrates the geometry that may be obtained once reflectional
symmetries are utilized, shown with respect to the original dimensions.
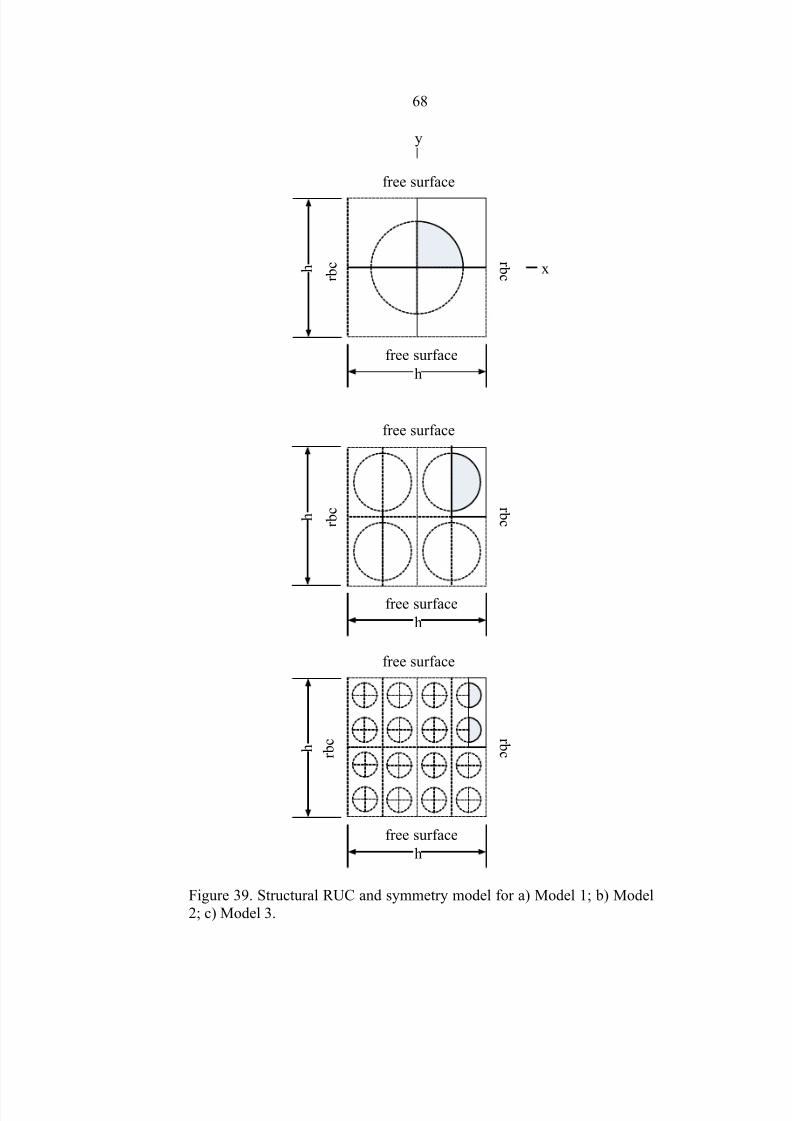
7/27/2019 Effect of Fiber Diameter on Stress Transfer and Interfacial Damage in Fiber Reinforced Composites
http://slidepdf.com/reader/full/effect-of-fiber-diameter-on-stress-transfer-and-interfacial-damage-in-fiber 81/112
68
free surface
r b c h
h
y
x
free surface
r b c
free surface
r b c
free surface
r b c
free surface
r b c
free surface
r b c
h
h
h
h
Figure 39. Structural RUC and symmetry model for a) Model 1; b) Model
2; c) Model 3.

7/27/2019 Effect of Fiber Diameter on Stress Transfer and Interfacial Damage in Fiber Reinforced Composites
http://slidepdf.com/reader/full/effect-of-fiber-diameter-on-stress-transfer-and-interfacial-damage-in-fiber 82/112
69
RESULTS AND ANALYSIS
Overview
The general framework for the work conducted in this research is described in the
previous sections. This framework consists of the core concepts:
1. The fiber -scaling method to increase the fiber -matrix interfacial area;
2. Micromechanics and homogenization theory;
3. Shear -lag stress transfer;
4. Interfacial damage and degradation using the cohesive zone model;
5. The necessity for the structural repeating unit cell;
6. Repeating boundary conditions.
To investigate the effects of fiber -scaling on the mechanical behavior of a
composite material, this general framework is now applied to the analysis of the three
structural repeating unit cell models described in the Model Development section. In the
following sections, results from each model are grouped together according the type of
analyses performed:
1. Shear -lag Analysis;
2. Interfacial CZM Analysis.

7/27/2019 Effect of Fiber Diameter on Stress Transfer and Interfacial Damage in Fiber Reinforced Composites
http://slidepdf.com/reader/full/effect-of-fiber-diameter-on-stress-transfer-and-interfacial-damage-in-fiber 83/112
70
Shear -Lag Analysis
The shear -lag models described in this section detail the axial stress (σ) and shear
stress (τ) distributions along the length of a broken glass fiber embedded in an epoxy
matrix. The ineffective fiber length (ℓ) is measured by determining the length required
for 90% of the maximum load carrying capacity (σmax) of the fiber to be recovered. The
nondimensional ineffective fiber length ( ) is evaluated by normalizing ℓ by the
fiber diameter ( D). The shear -lag models are also used to obtain the effective stiffness as
the fiber diameter changes. Recall that τ is obtained at the fiber -matrix interface, while σ
is obtained at the fiber center. The shear -lag analyses described in this section refer to the
linear elastic response of a structural RUC model to boundary loads and the broken fiber
load case, as described above. In the following cases, no interfacial damage is permitted.
In a sense, this represents an infinitely strong interfacial bond. The implicit solver of the
commercial finite element code, Abaqus/Standard, was used.
Model 1 Results
The axial stress (σ) and shear stress (τ) distributions along the fiber length are
shown in Figure 40. As shown, the constrained boundary at the rear surface of the model
is far from enough from the fiber break that no effect is made upon the stress field, and
the stresses are allowed to fully develop along the fiber length. The maximum fiber axial
stress and the maximum interfacial shear stresses are
a =3600
a = 689

7/27/2019 Effect of Fiber Diameter on Stress Transfer and Interfacial Damage in Fiber Reinforced Composites
http://slidepdf.com/reader/full/effect-of-fiber-diameter-on-stress-transfer-and-interfacial-damage-in-fiber 84/112
71
Figure 40. Axial and shear stresses along the length of the fiber in Model 1.
Figure 41 repeats this result for the first 30 µm from the fiber break. Here the
ineffective fiber length can be clearly shown, where
ℓ = 1355
Figure 41. Axial and shear stresses over the first 30 µm of the fiber length in
Model 1.
-50.0
0.0
50.0
100.0
150.0
200.0
250.0
300.0
350.0
400.0
0 20 40 60 80 100 120 140 160
S t r e s s , M P a
Distance From Fiber Break Along Fiber Axis, μm
M1 Shear Stress
M1 Axial Stress
-50.0
0.0
50.0
100.0
150.0
200.0
250.0
300.0
350.0
400.0
0 5 10 15 20 25 30
S t r e s s , M P a
Distance From Fiber Break Along Fiber Axis, μm
M1 Shear Stress
M1 Axial Stress
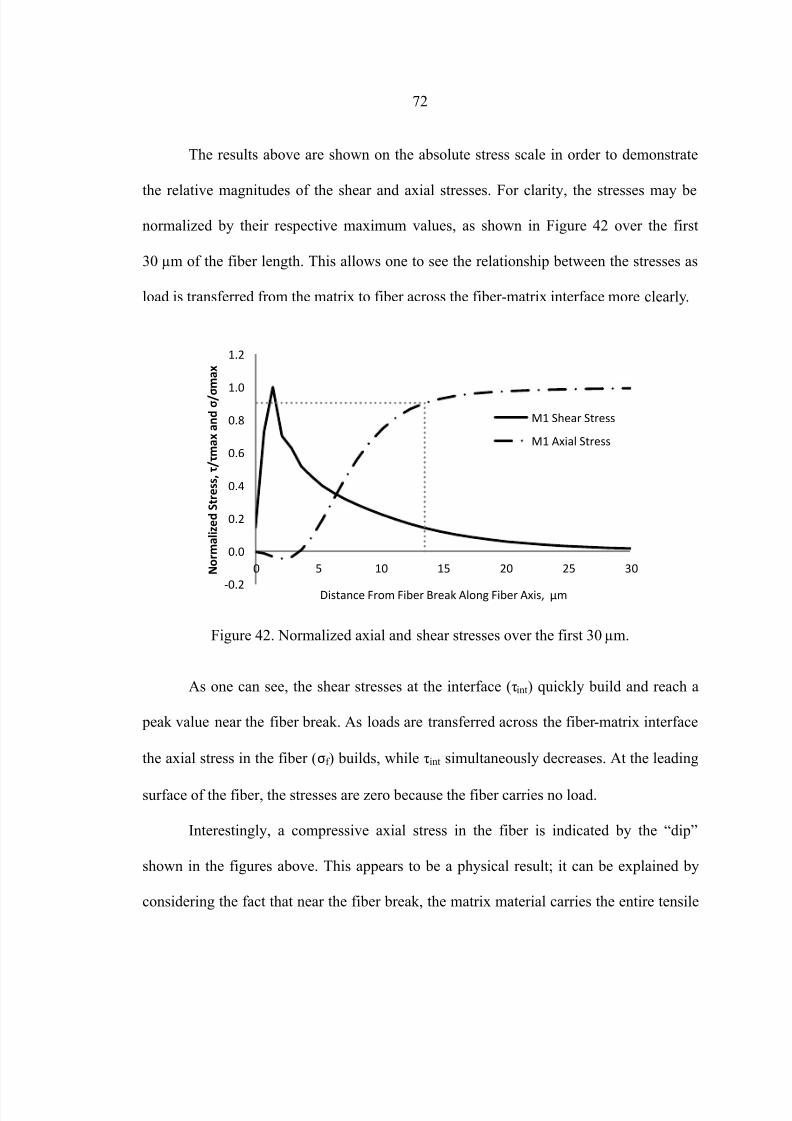
7/27/2019 Effect of Fiber Diameter on Stress Transfer and Interfacial Damage in Fiber Reinforced Composites
http://slidepdf.com/reader/full/effect-of-fiber-diameter-on-stress-transfer-and-interfacial-damage-in-fiber 85/112
72
The results above are shown on the absolute stress scale in order to demonstrate
the relative magnitudes of the shear and axial stresses. For clarity, the stresses may be
normalized by their respective maximum values, as shown in Figure 42 over the first
30 µm of the fiber length. This allows one to see the relationship between the stresses as
load is transferred from the matrix to fiber across the fiber -matrix interface more clearly.
Figure 42. Normalized axial and shear stresses over the first 30 µm.
As one can see, the shear stresses at the interface (τint) quickly build and reach a
peak value near the fiber break. As loads are transferred across the fiber -matrix interface
the axial stress in the fiber (σf ) builds, while τint simultaneously decreases. At the leading
surface of the fiber, the stresses are zero because the fiber carries no load.
Interestingly, a compressive axial stress in the fiber is indicated by the “dip”
shown in the figures above. This appears to be a physical result; it can be explained by
considering the fact that near the fiber break, the matrix material carries the entire tensile
-0.2
0.0
0.2
0.4
0.6
0.8
1.0
1.2
0 5 10 15 20 25 30 N o r m a l i z e d S t r e s s , τ / τ m a x a n d σ / σ m a x
Distance From Fiber Break Along Fiber Axis, μm
M1 Shear Stress
M1 Axial Stress
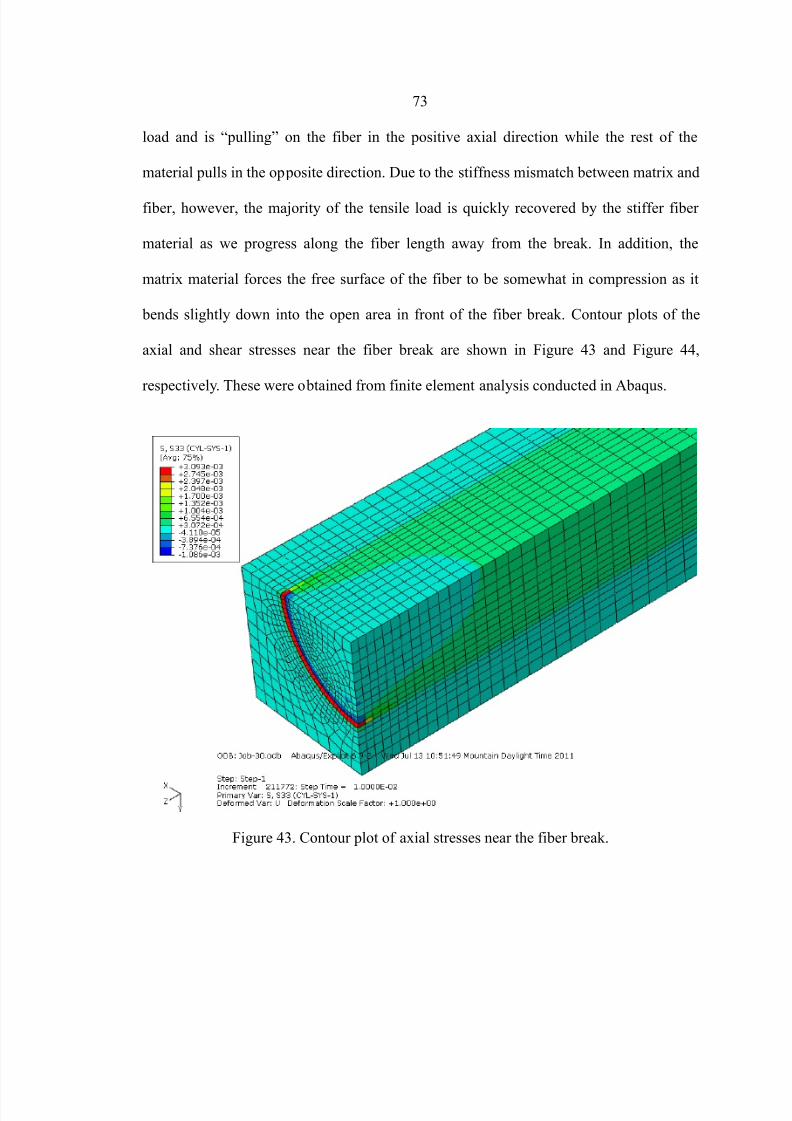
7/27/2019 Effect of Fiber Diameter on Stress Transfer and Interfacial Damage in Fiber Reinforced Composites
http://slidepdf.com/reader/full/effect-of-fiber-diameter-on-stress-transfer-and-interfacial-damage-in-fiber 86/112
73
load and is “pulling” on the fiber in the positive axial direction while the rest of the
material pulls in the opposite direction. Due to the stiffness mismatch between matrix and
fiber, however, the majority of the tensile load is quickly recovered by the stiffer fiber
material as we progress along the fiber length away from the break. In addition, the
matrix material forces the free surface of the fiber to be somewhat in compression as it
bends slightly down into the open area in front of the fiber break. Contour plots of the
axial and shear stresses near the fiber break are shown in Figure 43 and Figure 44,
respectively. These were obtained from finite element analysis conducted in Abaqus.
Figure 43. Contour plot of axial stresses near the fiber break.

7/27/2019 Effect of Fiber Diameter on Stress Transfer and Interfacial Damage in Fiber Reinforced Composites
http://slidepdf.com/reader/full/effect-of-fiber-diameter-on-stress-transfer-and-interfacial-damage-in-fiber 87/112
74
Figure 44. Contour plot of shear stresses near the fiber break.
Model 2 Results
The axial stress (σ) and shear stress (τ) distributions along the fiber length are
shown in Figure 45, and for the first 30 µm only in Figure 46. These results are similar to
those obtained from Model 1, however, it can be seen from the figures that the fiber axial
stress is recovered more quickly, and the interfacial shear stress peaks at a lower value.
The maximum fiber axial stress and the maximum interfacial shear stresses are
a =3620
a = 555
The ineffective fiber length is
ℓ = 670

7/27/2019 Effect of Fiber Diameter on Stress Transfer and Interfacial Damage in Fiber Reinforced Composites
http://slidepdf.com/reader/full/effect-of-fiber-diameter-on-stress-transfer-and-interfacial-damage-in-fiber 88/112
75
Figure 45. Axial and shear stress distributions for Model 2.
Figure 46. Axial and shear stresses over the first 30 µm of the fiber length in
Model 2.
Again, for clarity the stresses may be normalized by their respective maximum
values, as shown in Figure 47 over the first 30 µm of the fiber length.
-50.0
0.0
50.0
100.0
150.0
200.0
250.0
300.0
350.0
400.0
0 20 40 60 80 100 120 140 160
S t r e s s , M P a
Distance From Fiber Break Along Fiber Axis, μm
M2 Shear Stress
M2 Axial Stress
-50.0
0.0
50.0
100.0
150.0
200.0
250.0
300.0
350.0
400.0
0 5 10 15 20 25 30
S t r e s s , M P
a
Distance From Fiber Break Along Fiber Axis, μm
M2 Shear Stress
M2 Axial Stress

7/27/2019 Effect of Fiber Diameter on Stress Transfer and Interfacial Damage in Fiber Reinforced Composites
http://slidepdf.com/reader/full/effect-of-fiber-diameter-on-stress-transfer-and-interfacial-damage-in-fiber 89/112
76
Figure 47. Normalized axial and shear stresses over the first 30 µm in Model 2.
Model 3 Results
The axial stress (σ) and shear stress (τ) distributions along the fiber length are
shown in Figure 48, and for the first 30 µm only in Figure 49. These results are similar to
those obtained from Model 1 and Model 2, however, the fiber axial stress is recovered
even more quickly, and the interfacial shear stress peaks at an even lower value. The
maximum fiber axial stress and the maximum interfacial shear stresses are
a =3646
a = 406
The ineffective fiber length is
ℓ = 326
-0.2
0.0
0.2
0.4
0.6
0.8
1.0
1.2
0 5 10 15 20 25 30 N o r m a l i z e d S t r e s s , τ / τ m a x a n d σ / σ m a x
Distance From Fiber Break Along Fiber Axis, μm
M2 Shear Stress
M2 Axial Stress

7/27/2019 Effect of Fiber Diameter on Stress Transfer and Interfacial Damage in Fiber Reinforced Composites
http://slidepdf.com/reader/full/effect-of-fiber-diameter-on-stress-transfer-and-interfacial-damage-in-fiber 90/112
77
Figure 48. Axial and shear stress distributions for Model 3.
Figure 49. Axial and shear stresses over the first 30 µm of the fiber length for
Model 3.
The normalized axial and shear stresses for Model 3 are shown in Figure 50 over
the first 30 µm of the fiber length.
-50.0
0.0
50.0
100.0
150.0
200.0
250.0
300.0
350.0
400.0
0 20 40 60 80 100 120 140 160
S t r e s s , M P a
Distance From Fiber Break Along Fiber Axis, μm
M3 Shear Stress
M3 Axial Stress
-50.0
0.0
50.0
100.0
150.0
200.0
250.0
300.0
350.0
400.0
0 5 10 15 20 25 30
S t r e s s , M P a
Distance From Fiber Break Along Fiber Axis, μm
M3 Shear Stress
M3 Axial Stress

7/27/2019 Effect of Fiber Diameter on Stress Transfer and Interfacial Damage in Fiber Reinforced Composites
http://slidepdf.com/reader/full/effect-of-fiber-diameter-on-stress-transfer-and-interfacial-damage-in-fiber 91/112
78
Figure 50. Normalized axial and shear stresses over the first 30 µm for Model 3.
Comparison of Shear -Lag Results
The axial stresses obtained from each model are shown together in Figure 51. In
this figure it can be immediately seen that the magnitude of the axial stresses are quite
similar – in fact, the greatest difference exists between Model 1 and Model 3, where the
difference in magnitudes is approximately 1.3%. With further mesh refinement, this
difference could likely be reduced, if desired.
The axial stresses for each model are repeated in Figure 52, for the first 30 µm
only and where the ineffective fiber length (ℓ) has been indicated by the dotted lines
for each model. It can be seen that
ℓ ≈ 2ℓ ≈ 4ℓ
This is an interesting result, and correlates well with the relative diameters of each model,
which for Model 1, Model 2, and Model 3 are 16, 8, and 4 µm, respectively.
-0.2
0.0
0.2
0.4
0.6
0.8
1.0
1.2
0 5 10 15 20 25 30 N o r m a l i z e d S t r e s s , τ / τ m a x a n d σ / σ m a x
Distance From Fiber Break Along Fiber Axis, μm
M3 Shear Stress
M3 Axial Stress

7/27/2019 Effect of Fiber Diameter on Stress Transfer and Interfacial Damage in Fiber Reinforced Composites
http://slidepdf.com/reader/full/effect-of-fiber-diameter-on-stress-transfer-and-interfacial-damage-in-fiber 92/112
79
Figure 51. Comparison of axial stresses in each model.
Figure 52. Comparison of axial stresses, showing the first 30 µm and the relative
change in ineffective fiber length between each model.
In Figure 53, the axial stress is plotted where the horizontal axis is the normalized
length scale, z/D. This represents the distance from the fiber break in diameters, and the
nondimensional ineffective fiber length ( ) can be easily compared. Notice that in
-50.0
0.0
50.0
100.0
150.0
200.0
250.0
300.0
350.0
400.0
0 20 40 60 80 100 120 140 160
S t r e s s , M P a
Distance From Fiber Break Along Fiber Axis, μm
M1 Axial Stress
M2 Axial Stress
M3 Axial Stress
-50.0
0.0
50.0
100.0
150.0
200.0
250.0
300.0
350.0
400.0
0 5 10 15 20 25 30
S t r e s s ,
M P a
Distance From Fiber Break Along Fiber Axis, μm
M1 Axial Stress
M2 Axial Stress
M3 Axial StressM1 90%
M2 90%
M3 90%
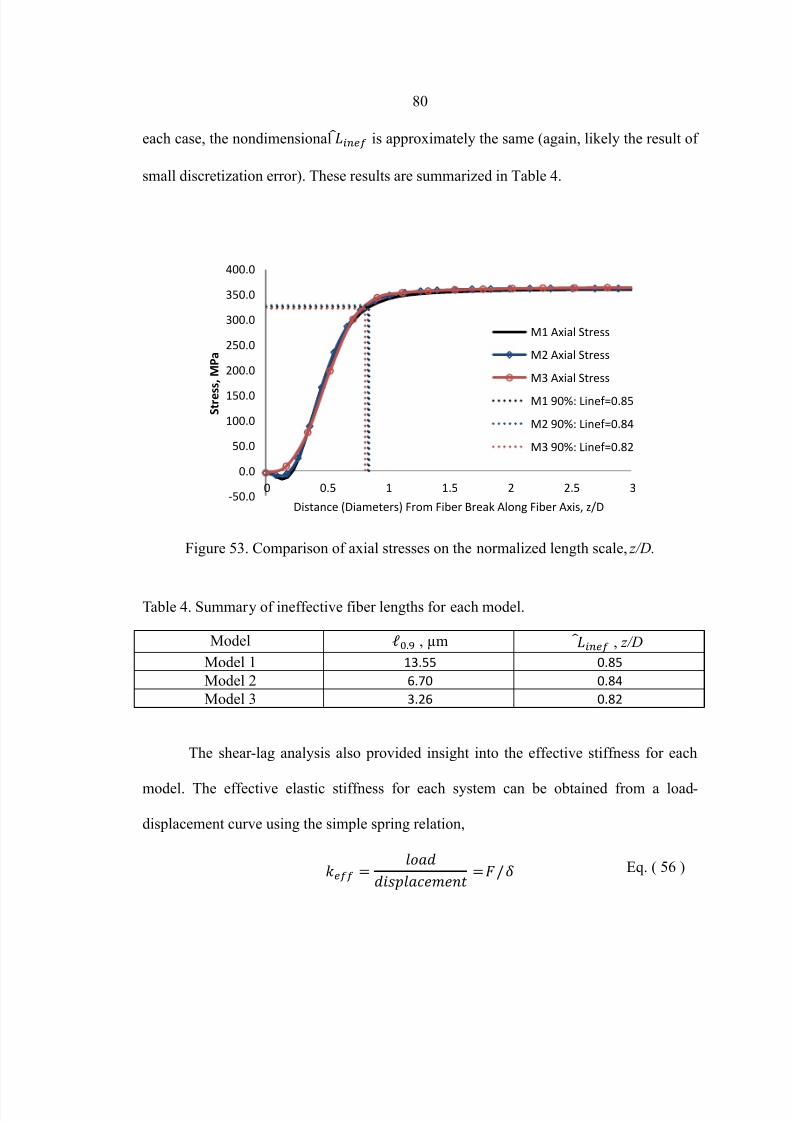
7/27/2019 Effect of Fiber Diameter on Stress Transfer and Interfacial Damage in Fiber Reinforced Composites
http://slidepdf.com/reader/full/effect-of-fiber-diameter-on-stress-transfer-and-interfacial-damage-in-fiber 93/112
80
each case, the nondimensional is approximately the same (again, likely the result of
small discretization error). These results are summarized in Table 4.
Figure 53. Comparison of axial stresses on the normalized length scale, z/D.
Table 4. Summary of ineffective fiber lengths for each model.
Model ℓ , µm , z/D
Model 1 13.55 0.85
Model 2 6.70 0.84
Model 3 3.26 0.82
The shear -lag analysis also provided insight into the effective stiffness for each
model. The effective elastic stiffness for each system can be obtained from a load-
displacement curve using the simple spring relation,
= =/ Eq. ( 56 )
-50.0
0.0
50.0
100.0
150.0
200.0
250.0
300.0
350.0
400.0
0 0.5 1 1.5 2 2.5 3
S t r e s
s , M P a
Distance (Diameters) From Fiber Break Along Fiber Axis, z/D
M1 Axial Stress
M2 Axial Stress
M3 Axial Stress
M1 90%: Linef=0.85
M2 90%: Linef=0.84
M3 90%: Linef=0.82

7/27/2019 Effect of Fiber Diameter on Stress Transfer and Interfacial Damage in Fiber Reinforced Composites
http://slidepdf.com/reader/full/effect-of-fiber-diameter-on-stress-transfer-and-interfacial-damage-in-fiber 94/112
81
Figure 54. Load vs. Displacement curves for each model. The applied load isshown by the dotted line, where F = 0.08 N for each model.
Notice that Model 1, which used the largest diameter fiber ( D1 = 16 µm),
experiences the greatest displacement for the same load. Model 3, which used the
smallest diameter fiber ( D3 = 4 µm) experiences the smallest displacement for the same
load. The total applied load ( F ), maximum displacement (δ), and the effective stiffness
(k eff ) for each model are shown in Table 5.
Table 5. Comparison of load, displacement, and effective stiffness
Model F (N) δ (µm) k eff (kN/m)
Model 1 0.08 0.818 97.8
Model 2 0.08 0.771 103.8
Model 3 0.08 0.746 107.2
0
0.01
0.02
0.03
0.04
0.05
0.06
0.07
0.08
0.09
0 0.1 0.2 0.3 0.4 0.5 0.6 0.7 0.8 0.9
L o a d , N
Displacement, um
M1
M2
M3

7/27/2019 Effect of Fiber Diameter on Stress Transfer and Interfacial Damage in Fiber Reinforced Composites
http://slidepdf.com/reader/full/effect-of-fiber-diameter-on-stress-transfer-and-interfacial-damage-in-fiber 95/112
82
Cohesive Zone Model Damage Analysis
The CZM damage analysis described in this section refers to the response of a
structural RUC model to boundary loads and the broken fiber load case. In this case, the
cohesive elements are defined to exist in a zero-thickness interface at the fiber -matrix
boundary, as shown in Figure 55.
Cohesive
Elementsx
yz
Figure 55. Location of cohesive elements at the fiber -matrix interface inthe structural RUC models used in this work.
As discussed, the bilinear traction-separation relation is used in this work. The
cohesive properties used for each element shown in Table 6 define this behavior for the
current work. Recall, the initial penalty stiffness ( K 0) is chosen to be large enough to
prevent undesirable deformation across an interface before damage initiation, yet not so
large that it results in ill-conditioning of the overall stiffness matrix. In addition, the
interfacial cohesive strength (T c) is chosen to represent the stress at which damage within
a cohesive element initiates, while ultimate failure of an element occurs when the critical
fracture energy (Gc) has been achieved.

7/27/2019 Effect of Fiber Diameter on Stress Transfer and Interfacial Damage in Fiber Reinforced Composites
http://slidepdf.com/reader/full/effect-of-fiber-diameter-on-stress-transfer-and-interfacial-damage-in-fiber 96/112
83
Table 6. Cohesive element parameters
Property Symbol Value Units
Initial Penalty Stiffness K 0 5.0E+15 N/m
Interfacial Cohesive Strength T c 30.0 MPa
Fracture Energy Gc 15.0 N/m
Density ρ 1200 kg/m
At the risk of oversimplification, the cohesive parameters have been assumed to
be the same in each direction. For example, the cohesive strength is assumed to be the
same in the normal, first, and second shear directions (corresponding to the Mode I,
Mode II, and Mode III fracture modes). Values have been chosen as a result of a review
of the literature regarding interfacial fracture in glass/epoxy FRP composites. However,
because this work is primarily concerned with the relative strengths of an FRP composite
with regard to the fiber diameter used, the specific values used are relatively unimportant,
as long as they are consistent between models.
Notice that the displacement at the onset of damage (δc) and at ultimate failure
(δf ) can be obtained using the shape of the bilinear traction-separation relation,
= / Eq. ( 57 )
= 2 / Eq. ( 58 )
Recall that Gc is taken to be the area under the T -δ curve. Because K 0 is chosen to
be a large value, the deformation at the onset of damage is very small (δc = 0.006 µm),
while the deformation at failure is δf = 1.0 µm. Normally, the area would be calculated
using the difference found by (δf – δc), however the contribution of δc is negligible and is
generally ignored.

7/27/2019 Effect of Fiber Diameter on Stress Transfer and Interfacial Damage in Fiber Reinforced Composites
http://slidepdf.com/reader/full/effect-of-fiber-diameter-on-stress-transfer-and-interfacial-damage-in-fiber 97/112
84
The cohesive formulation chosen for this study utilizes the built-in framework
provided by Abaqus. Use of the explicit solver in Abaqus/Explicit allowed solutions to be
obtained for the case in which element degradation and deletion occurs, which pose
significant problems for implicit solvers.
Load-Displacement Curves
The load-displacement curves for each model are shown in Figure 56. The applied
load of 0.08 N is indicated by the dotted lines. Notice that as the fiber diameter decreases,
a stiffer response is observed. In addition, Model 2 and Model 3 are able to sustain the
applied load, while Model 3 experiences complete debonding well before the maximum
load has been achieved.
Figure 56. Load vs. Displacement for the cohesive zone damage models.
0
0.01
0.02
0.03
0.04
0.05
0.06
0.07
0.08
0.09
0 1 2 3 4 5 6 7 8 9 10
N o m i n a l L o a d , N
Displacement, um
M1
M2
M3
F=0.0
8N
complete debond
initial debond

7/27/2019 Effect of Fiber Diameter on Stress Transfer and Interfacial Damage in Fiber Reinforced Composites
http://slidepdf.com/reader/full/effect-of-fiber-diameter-on-stress-transfer-and-interfacial-damage-in-fiber 98/112
85
In each case, the response is slightly nonlinear up to the initial debond; once
debonding occurs the behavior has a characteristic “hockey stick” shape. In fact, once the
initial debond takes place in Model 1 and Model 2, very little extra loading may be
sustained. In contrast, Model 3 does not experience any debonding.
Damage Initiation
The damage initiation criterion vs. displacement curve is shown in Figure 57 for
each model, for the first element along the interface which reached the critical stress
level. In the figure, a value of zero indicates an undamaged state, while a value of one
indicates the initiation criterion (T 0) has been satisfied. Once satisfied, further loading and
deformation results in material degradation and softening behavior of the element.
Figure 57. Damage Initiation Criterion at the first element to reach the critical
load state.
0.0
0.2
0.4
0.6
0.8
1.0
0.00 0.05 0.10 0.15 0.20 0.25
D a m a g e I n i t i a t i o n C r i t e r
i o n
a t f i r s t e l e m e n t
Displacement, um
M1
M2
M3
7/27/2019 Effect of Fiber Diameter on Stress Transfer and Interfacial Damage in Fiber Reinforced Composites
http://slidepdf.com/reader/full/effect-of-fiber-diameter-on-stress-transfer-and-interfacial-damage-in-fiber 99/112
86
This result shows that damage initiation occurs in Model 1 before Model 2, and
Model 3 lags far behind.
Referring to the inset, notice that before the damage initiation criterion is met, a
cohesive element behaves in a linear elastic manner. However, once T c has been satisfied,
the damage variable Φ begins to increase and the element stiffness is reduced as in
Equation 33.
Stiffness Degradation
Figure 58 shows the growth of the damage variable (or the stiffness degradation
variable) vs. displacement for the first element that reaches ultimate failure for each
model. It can be seen that in both Model 1 and Model 2, the first element fails and crack
growth begins. Model 3 does not reach the failure criterion at any point during loading
for any element along the fiber -matrix interface. Using the inset for reference, recall that
once the stiffness degradation, or damage variable, reaches a value of 1, the element has
satisfied the fracture energy criterion, Gc, which is the area under the T -δ curve between
the onset of damage (at the displacement of δc) and ultimate failure (at the displacement
of δf ).

7/27/2019 Effect of Fiber Diameter on Stress Transfer and Interfacial Damage in Fiber Reinforced Composites
http://slidepdf.com/reader/full/effect-of-fiber-diameter-on-stress-transfer-and-interfacial-damage-in-fiber 100/112
87
Figure 58. Stiffness degradation of the first element to fail in each model.
For clarity, this result is repeated in Figure 59, zoomed in on the region of interest.
In this figure, it can be more easily seen that debonding begins at a displacement of
Φ = 1 at () = 128
Φ = 1 at () = 155
in Model 1 and Model 2. The degradation variable in Model 3 reaches a maximum of
Φ = 091 at = 103
0.0
0.2
0.4
0.6
0.8
1.0
0.0 0.2 0.4 0.6 0.8 1.0 1.2
S t i f f n e s s D e g r a d a t i o n
a t f i r s t e l e m e n t
Displacement, um
M1
M2
M3

7/27/2019 Effect of Fiber Diameter on Stress Transfer and Interfacial Damage in Fiber Reinforced Composites
http://slidepdf.com/reader/full/effect-of-fiber-diameter-on-stress-transfer-and-interfacial-damage-in-fiber 101/112
88
Figure 59. Zoomed in view of the stiffness degradation in the first element to fail.
From this figure, it can be seen that Model 3 experiences less critical damage than
Model 2, which experiences less damage than Model 1. In addition, it should be noted
that although Model 2 experiences interfacial debonding, it occurs at an applied load that
is much larger than required for debonding in Model 1 (see Figure 56).
Therefore, it is useful to draw comparisons between each of the models by
investigating the growth of the degradation variable related to the applied load, σ0. The
degradation variable along a path at the fiber -matrix interface for each model is shown in
Figures 60-62, for 50%, 70%, and 100%, respectively, of the maximum applied tensile
load.
0.9
0.92
0.94
0.96
0.98
1
0.5 1.0 1.5 2.0
S t i f f n e s s D e g r a d a t i o n
a t f i r s t e l e m e n t
Displacement, um
M1
M2
M3

7/27/2019 Effect of Fiber Diameter on Stress Transfer and Interfacial Damage in Fiber Reinforced Composites
http://slidepdf.com/reader/full/effect-of-fiber-diameter-on-stress-transfer-and-interfacial-damage-in-fiber 102/112
89
Figure 60. Stiffness degradation variable at 50% of σ0
along a path on the
interface. A value of 1 indicates a fully damaged element, while a value of 0
indicates the element is undamaged.
Figure 61. Stiffness degradation variable at 70% of σ0
along a path at the
interface.
0
0.1
0.2
0.3
0.4
0.5
0.6
0.7
0.8
0.9
1
0 20 40 60 80 100 120 140 160
S t i f f n e s s D e g r a d a t i o n
Distance from Fiber Break, um
M1acz-050
M2acz-050
M3acz-050
0
0.1
0.2
0.3
0.4
0.5
0.6
0.7
0.8
0.9
1
0 20 40 60 80 100 120 140 160
S t i f f n e s s D e g r a d a t i o n
Distance from Fiber Break, um
M1acz-070
M2acz-070
M3acz-070

7/27/2019 Effect of Fiber Diameter on Stress Transfer and Interfacial Damage in Fiber Reinforced Composites
http://slidepdf.com/reader/full/effect-of-fiber-diameter-on-stress-transfer-and-interfacial-damage-in-fiber 103/112
90
Figure 62. Stiffness degradation variable at 100% of σ0
along a path at the
interface.
As can be seen from the above figures, both Model 1 and Model 2 experience
significant debonding along the length of the fiber. As already discussed, complete
debonding in Model 1 occurs at a relatively low load. In comparison, Model 2 nearly
debonds along the entire length, with the exception of a few elements near the rear
constrained face of the model (which likely affected the state of the nearby cohesive
elements), but manages to sustain the entire applied load of σ0 = 128 MPa. Again, Model
3 is free from any debonding. In Figures 61-62, it can be seen that debonding growth
occurs rapidly between 70% and 100% of the total applied load, particularly in Model 1.
While damage does, indeed, reach critical levels along the length of Model 2, it evolves
more slowly than in Model 1.
It is interesting to compare the behavior of the damage models to that of the
shear -lag models. For the load-displacement curve seen in Figure 54 in the shear -lag
0
0.1
0.2
0.3
0.4
0.5
0.6
0.7
0.8
0.9
1
0 20 40 60 80 100 120 140 160
S D E G
Distance from Fiber Break, um
M1acz-100
M2acz-100
M3acz-100

7/27/2019 Effect of Fiber Diameter on Stress Transfer and Interfacial Damage in Fiber Reinforced Composites
http://slidepdf.com/reader/full/effect-of-fiber-diameter-on-stress-transfer-and-interfacial-damage-in-fiber 104/112
91
section, the analogue for the damage model is as shown in Figure 63. Note that the
behavior of the CZM is “softer” than the linear elastic models (denoted m1, m2, and m3
in the legend) as a result of nonlinear material degradation properties.
Figure 63. Load-displacement comparison of shear -lag and cohesive zone models.
0
0.01
0.02
0.03
0.04
0.05
0.06
0.07
0.08
0 0.2 0.4 0.6 0.8 1 1.2
N o m
i n a l L o a d , N
Displacement, um
M1
M2
M3
m1
m2
m3

7/27/2019 Effect of Fiber Diameter on Stress Transfer and Interfacial Damage in Fiber Reinforced Composites
http://slidepdf.com/reader/full/effect-of-fiber-diameter-on-stress-transfer-and-interfacial-damage-in-fiber 105/112
92
SUMMARY AND CONCLUSION
Summary of Results and Discussion
Shear -Lag Analysis
The results from the shear -lag stress transfer analysis indicate that, for the same
volume fraction and applied load,
1. The maximum axial stresses developed in the fibers are the same.
2. The maximum shear stresses developed at the fiber -matrix interface decreases as
the fiber diameter decreases.
3. The ineffective fiber length (ℓ) decreases as the fiber diameter decreases.
4. The nondimensional ineffective fiber length ( ) is a constant ratio for the
specific fiber volume fraction and modulus ratio tested.
5. The maximum displacement decreases as fiber diameter decreases.
6. The effective stiffness of the model increases as the fiber diameter decreases.
The result of (1) was expected, as it must be true in order to ensure that the same
load is placed upon each model. Notice that in Model 2, four fibers together carry the
same load as the single fiber in Model 1; similarly, in Model 3, 16 fibers together carry
the same load as the single fiber in Model 1. Of course, each fiber in Model 2 and Model
3 carry one-quarter and one-sixteenth, respectively, of the total load F (that is, the load
carried by a fiber in Model 2 and Model 3 is less by a factor of 1/ N , where N is the
number of fibers in the RUC). However, the stress in each fiber is the same as a direct
result of the decreases in fiber diameter and the cross-sectional area ( A), which scales by

7/27/2019 Effect of Fiber Diameter on Stress Transfer and Interfacial Damage in Fiber Reinforced Composites
http://slidepdf.com/reader/full/effect-of-fiber-diameter-on-stress-transfer-and-interfacial-damage-in-fiber 106/112
93
the same factor as the load which is carried by each fiber. For example, notice that
A1 = 4 A2 = 16 A3. Therefore, the maximum axial stress in each fiber is the same for each
fiber in every model.
The result of (2) was an unexpected side effect from the fiber -scaling method.
This result, however, appears to be an effect due to the increase in fiber -matrix interfacial
surface area in the reduced-diameter models.
The result of (3) indicates that an increase in interfacial surface area (as a
consequence of the fiber -scaling method) improves load transfer efficiency as the fiber
diameter decreases. The result of (4) was quite interesting, indicating that for linear
elastic models the nondimensional ratio of = ℓ/ is a constant for the chosen
volume fraction and modulus ratio. Note that the change in ℓ as a function of fiber
volume fraction and the modulus ratio – and by extension, – is well documented in
the literature already [17,21], and is not discussed in this work.
Finally, the results of (5) and (6) indicate that as the ineffective fiber length
decreases, more of the stiffer fiber acts to resist loading; thus, the maximum displacement
is reduced. This is another interesting, yet unexpected result.
Cohesive Zone Model Damage Analysis
The results from the CZM damage analysis indicate that, for the same volume
fraction and applied load,
1. The initial response of each model is slightly nonlinear due to material
degradation at the fiber -matrix interface.

7/27/2019 Effect of Fiber Diameter on Stress Transfer and Interfacial Damage in Fiber Reinforced Composites
http://slidepdf.com/reader/full/effect-of-fiber-diameter-on-stress-transfer-and-interfacial-damage-in-fiber 107/112
94
2. Damage initiation occurs at higher nominal loads and greater displacements as the
fiber diameter decreases.
3. Interfacial debonding occurs at higher nominal loads and greater displacements as
the fiber diameter decreases. Model 1 experiences the debonding phenomenon at
relatively small load, followed by Model 2 (albeit, at a much larger load). Model 3
does not debond at any point during the analysis.
4. Once the ultimate failure (the fracture energy, Gc) criterion has been met, the
model can carry very little extra loads. The crack front extends easily once the
initial element fails.
5. In comparison to the linear elastic shear -lag models, the response of the structure
is “softer” as a result of the material degradation effects. The degree of the
softening behavior decreases as fiber diameter decreases.
Every metric considered above indicates improved mechanical behavior and
damage resistance in the models as the fiber diameter decreases. Therefore, these
analyses point to the possibility that, for the same fiber volume fraction, improvements in
the stiffness and load transfer efficiency of an FRP composite may be obtained by simply
reducing the fiber diameter.
Future Work
The application of repeating boundary conditions to a structural repeating unit cell
such as described in this work is an approach that warrants further examination.

7/27/2019 Effect of Fiber Diameter on Stress Transfer and Interfacial Damage in Fiber Reinforced Composites
http://slidepdf.com/reader/full/effect-of-fiber-diameter-on-stress-transfer-and-interfacial-damage-in-fiber 108/112
95
Additional analysis could be done to assess the effects of RBCs on the results, e.g., plane
stress vs. plane strain assumptions relative to the RBCs.
Conclusion
This investigation sought deeper insight into the effect that fiber diameter and the
total fiber -matrix interfacial surface area have upon the mechanical properties and the
damage resistance of an FRP composite material. It was found that by using the fiber -
scaling method, the amount of fiber -matrix interfacial area increases as the fiber diameter
decreases, while the fiber volume fraction and total mass of the composite remain the
same. Results indicate that for a specified volume fraction and load condition, as the fiber
diameter decreases the load transfer efficiency and effective stiffness of the broken fiber
model increases. Also, as the fiber diameter decreases, the initiation of damage at the
fiber -matrix interface occurs at greater stresses and subsequent growth of damage is less
extensive. Thus, the results of this work show that for the same total mass, the
performance and damage tolerance of composite materials may be enhanced simply by
using smaller diameter fibers.

7/27/2019 Effect of Fiber Diameter on Stress Transfer and Interfacial Damage in Fiber Reinforced Composites
http://slidepdf.com/reader/full/effect-of-fiber-diameter-on-stress-transfer-and-interfacial-damage-in-fiber 109/112
96
REFERENCES
[1] George J. Dvorak, Ed., Inelastic Deformation of Composite Materials. New York, NY: Springer -Verlag, 1991.
[2] Autar K. Kaw, Mechanics of Composite Materials, 2nd ed. Boca Raton, FL: CRC
Press, Taylor & Francis Group, 2006.
[3] Stuart M. Lee, Ed., Handbook of Composite Reinforcements.: Wiley-VCH, 1992.
[4] Ben W. Kim and John A. Nairn, "Observations of Fiber Fracture and InterfacialDebonding Phenomena Using the Fragmentation Test in Single Fiber Composites,"
Journal of Composite Materials, vol. 36, no. 15, pp. 1825-1858, 2002.
[5] AGY, "AGY Technical Product Guide," 2009.
[6] Robert D. Cook, David S. Malkus, Michael E. Plesha, and Robert J. Witt, Concepts
and Applications of Finite Element Analysis, 4th ed.: Wiley, 2002.
[7] "Military Handbook - MIL-HDBK -17-1F: Composite Materials Handbook, Vol. 1 - Polymer Matrix Composites Guidelines for Characterization of Strucural Materials,"
U.S. Department of Defense, 2002.
[8] Myer Kutz, Ed., Mechanical Engineers' Handbook, Materials and Mechanical Design, 3rd ed. Hoboken, NJ: Wiley, 2005.
[9] Marek -Jerzy Pindera, Hamed Khatam, Anthony S. Drago, and Yogesh Bansal,
"Micromechanics of spatially uniform heterogeneous media: A critical review andemerging approaches," Composites: Part B, vol. 40, no. 5, pp. 349-378, July 2009.
[10] Martin H. Sadd, Elasticity - Theory, Applications, and Numerics, 2nd ed.: Academic
Press - Elsevier, 2009.
[11] Shuguang Li, "On the Unit Cell for Micromechanical Analysis of Fibre-ReinforcedComposites," Proceedings: Mathematical, Physical and Engineering Sciences, vol.455, no. 1983, pp. 815-838, March 1999.
[12] Shuguang Li, "Boundary conditions for unit cells from periodic microstructures and
their implications," Composites Science and Technology, vol. 68, pp. 1962-1974,2008.

7/27/2019 Effect of Fiber Diameter on Stress Transfer and Interfacial Damage in Fiber Reinforced Composites
http://slidepdf.com/reader/full/effect-of-fiber-diameter-on-stress-transfer-and-interfacial-damage-in-fiber 110/112
97
[13] Anthony Drago and Marek -Jerzy Pindera, "Micro-mechanical analysis of
heterogeneous materials: Macroscopically homogeneous vs periodic
microstructures," Composites Science and Technology, vol. 67, pp. 1243-1263, 2007.
[14] Tarek I. Zohdi and Peter Wriggers, An Introduction to Computational
Micromechanics. Berlin, DEU: Springer, 2008.
[15] R. Hill, "Elastic properties of reinforced solids: some theoretical principles," Journal of Mechanics, Physics, and Solids, vol. 11, pp. 357-372, 1963.
[16] H.L. Cox, "The Elasticity and Strength of Paper and Other Fiberous Materials,"
British Journal of Applied Physics, vol. 3, no. 3, pp. 72-79, Mar. 1952.
[17] John A. Nairn, "On the Use of Shear -Lag Methods for Analysis of Stress Transfer inUnidirectional Composites," Mechanics of Materials, vol. 26, pp. 63-80, 1997.
[18] Z. Xia, T. Okabe, and W. Curtin, "Shear -lag versus finite element models for stress
transfer in fiber -reinforced composites," Composites Science and Technology, vol.
62, pp. 1141-1149, 2002.
[19] J.M. Vazquez-Rodriquez, P.J. Herrera-Franco, and P.I. Gonzalez-Chi, "Analysis of
the interface between a thermoplastic fiber and a thermosetting matrix using
photoelasticity," Composites Part A, vol. 38, pp. 819-827, August 2006.
[20] N.M. Hossain, E.C. Milliren, K. Woo, and C.H. Jenkins, "The Effect of Fiber Diameter on the Strength of Lightweight Composites," in 51st
AIAA/ASME/ASCE/AHS Structures, Structural Dynamics, and Material Conference,
Orlando, FL, 2010.
[21] N.M. Hossain, W.M. Peterson, K. Woo, and C.H. Jenkins, "Strength of flexible
composites: Effect of fiber scaling," in 52st AIAA/ASME/ASCE/AHS Structures,Structural Dynamics, and Material Conference, Denver, CO, 2011.
[22] H. Li, Y. Jia, G. Mamtimin, W. Jiang, and L. An, "Stress transfer and damage
evolution simulations of fiber -reinforced polymer -matrix composites," MaterialsScience and Engineering A, no. 425, pp. 178-184, 2006.
[23] E.C. Milliren, "Nanocomposites: A Study of Theoretical Micromechanical Behavior
Using Finite Element Analysis," Dept. of Mechanical and Industrial Engineering,Montana State University, Bozeman, MT 59717, MT, U.S.A., Master's Thesis 2009.

7/27/2019 Effect of Fiber Diameter on Stress Transfer and Interfacial Damage in Fiber Reinforced Composites
http://slidepdf.com/reader/full/effect-of-fiber-diameter-on-stress-transfer-and-interfacial-damage-in-fiber 111/112
98
[24] W.M. Peterson, N.M. Hossain, K. Woo, and C.H. Jenkins, "Strength of flexible
composites: damage tolerance in compliant unidirectional fiber reinforced
composites," in 52nd AIAA/ASME/ASCE/AHS Structures, Structural Dynamics, and
Material Conference, Denver, CO, 2011.
[25] Normal E. Dowling, Mechanical Behavior of Materials: Engineering Methods for
Deformation, Fracture, and Fatigue, 3rd ed. Upper Saddle River, NJ: PearsonPrentice Hall, 2007.
[26] Robert P. Wei, Fracture Mechanics: Integration of Mechanics, Materials Science
and Chemistry. New York: Cambridge University Press, 2010.
[27] Rene de Borst, "Numerical aspects of cohesive-zone models," Engineering Fracture
Mechanics, vol. 70, pp. 1743-1757, 2003.
[28] George Z. Voyiadjis and Peter I. Kattan, Advances in Damage Mechanics: Metalsand Metal Matrix Composites with an Introduction to Fabric Tensors, 2nd ed.
London, UK: Elsevier, 2006.
[29] SIMULIA, Abaqus Analysis User's Manual, v6.9, CH 28.5.
[30] A.A. Griffith, "The Phenomena of Rupture and Flow in Solids," Philosophical
Transactions of the Royal Society of London, vol. 221, pp. 163-198, 1921.
[31] M. Elices, G.V. Guinea, J. Gomez, and J. Planas, "The cohesive zone model:advantages, limitations, and challenges," Engineering Fracture Mechanics, vol. 69,
pp. 137-163, 2002.
[32] D.S. Dugdale, "Yielding of steel sheets containing slits," Journal of the Mechanics
and Physics of Solids, pp. 100-104, 1960.
[33] De Xie and Anthony M. Waas, "Discrete cohesive zone model for mixed-modefracture using finite element analysis," Engineering Fracture Mechanics, vol. 73, pp.
1783-1796, 2006.
[34] G.I. Barenblatt, "The mathematical theory of equilibrium cracks in brittle fracture,"
Advances in Applied Mechanics, vol. 7, pp. 55-129, 1962.
[35] A. Turon, C.G. Davila, P.P. Camanho, and J. Costa, "An engineering solution for mesh size effects in the simulation of delamination using cohesive zone models,"
Engineering Fracture Mechanics, vol. 74, pp. 1665-1682, 2007.
7/27/2019 Effect of Fiber Diameter on Stress Transfer and Interfacial Damage in Fiber Reinforced Composites
http://slidepdf.com/reader/full/effect-of-fiber-diameter-on-stress-transfer-and-interfacial-damage-in-fiber 112/112
99
[36] A. Needleman, "An analysis of decohesion along an imperfect interface,"
International Journal of Fracture, vol. 42, pp. 21-40, 1990.
[37] V. Tvergaard, "Effect of pure mode I, II or II loading or mode mixity on crack growth in a homogeneous solid," International Journal of Solids and Structures, vol.
47, pp. 1611-1617, 2010.
[38] P.P. Camanho and C.G. Davila, "Mixed-Mode Decohesion Finite Elements for the
Simulation of Delamination in Composite Materials," NASA/TM -2002–211737 , pp.
1–37, 2002.