effect of filler metal feed rate and composition on microstructure and mechanical ... · ·...
TRANSCRIPT

1
Effect of filler metal feed rate and composition on microstructure and mechanical
properties of fibre laser welded AA 2024-T3
J. Ahn1*, L. Chen2, E. He2, C. M. Davies1 and J. P. Dear1
1 Department of Mechanical Engineering, Imperial College London, South Kensington Campus,
London, UK SW7 2AZ
2 Science and Technology on Power Beam Lab, Beijing Aeronautical Manufacturing Technology
Research Institute, China
ABSTRACT
The influence of aluminium alloy 4043 filler wire feed rate on the weld quality and mechanical properties
of high power 5 kW fibre laser welded aluminium alloy 2024-T3 was investigated. Loss of volatile
alloying elements such as magnesium and other elements including copper and silicon which all
contributed to the hot crack sensitivity was measured using energy dispersive X-ray spectroscopy at
different filler wire feed rates. High feed rates of above 4.0 m/min produced instabilities, whereas, low
feed rates below 2.0 m/min did not sufficiently modify the chemical composition of the weld pool. The
optimum feed rate was found to be in the range between 2 and 3 m/min, where the corresponding
dilution ratio of around 9-12% in the weld pool with less than 0.6% silicon content reduced the
percentage of Mg2Si and also decreased the solidification temperature and total shrinkage during
freezing. The addition of filler metal reduced the risk of welding defects and improved ductility to over
3.5% and a fairly higher tensile strength of around 380 MPa than without. Microstructural examination
showed that the addition of filler wire increased the number of finer dimples within the weld, resulting in
a purely ductile fracture behaviour, as well as reduced micro hot cracks and porosities.
KEY WORDS
AA 2024-T3; Fibre laser; Welding; Digital Image Correlation; Mechanical properties; Microstructure
*corresponding author: [email protected]; Tel: +44 7948 532 667

2
1 INTRODUCTION
While pure aluminium is not susceptible to hot cracking due to the absence of low melting point
eutectic at the grain boundary, the addition of alloying elements such as copper, magnesium and
silicon to the 2024 alloy makes its composition crack susceptible. As a result, it is considered to have
poor weldability because of its high solute content, resulting in a wide solidification temperature range
and increased tendency to form low melting constituents along grain boundary, known as the eutectic
composition with lower freezing points than the base metal; and also due to high coefficient of thermal
expansion and large solidification shrinkage. Hot cracking is a high temperature cracking mechanism
and it can refer to either solidification cracking which occurs intergranularly along the grain boundary
of the weld metal during solidification due to the stresses acting on the segregated low melting point
constituents [1], or liquation cracking which occurs in the coarse heat affected zone along the fusion
boundary as a result of grain boundary liquation of the low melting point constituents.
The weld metal composition in autogenous welding of AA 2024-T3 is identical to the base metal
composition, so it is solidification cracking susceptible. Due to the higher equilibrium vapour pressure
and lower boiling point of volatile alloying elements such as zinc (917°C) and magnesium (1091°C)
compared to aluminium (2519°C), they are excessively and selectively vaporised during laser keyhole
welding, and as a consequence, segregation of these elements and dissolution of strengthening
precipitates [2] result in degradation of mechanical properties of the weld [3,4]. The vaporisation
process involves transport of the alloying element from bulk to surface of the weld pool and then
vaporisation at the liquid/vapour interface into the surround gas phases [5]. Moon and Metzbower [6]
observed depletion of magnesium in the fusion zone of laser beam welded AA 5456, where a
reduction from 5% in the base metal to 4% in the fusion zone occurred. The 20% reduction was
considered to be the reason for the reduced mechanical properties of the weld. Alferi et al. [7,8] also
observed loss of magnesium of 53% when butt welding 3.2 mm thick AA 2024 at a laser power of 1.6
kW, a welding speed of 10 mm/s and -0.5 mm defocus using disk laser. The reduced Mg content was
found to be responsible for keyhole instability which induced macro porosity formation. A part of the
reason is because the addition of elements such as zinc, silicon, copper and iron reduce the solubility
of hydrogen in liquid aluminium due to strong bonding of Al atoms to these elements, whereas, strong
attractive interactions between hydrogen and magnesium, lithium and titanium increase the hydrogen
solubility [9]. The 2024 alloy also contains small quantities of silicon which induces the formation of

3
non-strengthening coarse Mg2Si precipitates, and iron which induces the formation of Cu2FeAl7
phase, both of which reduce the fracture toughness of the weld significantly and deplete the solid
solution strengthening Cu solutes in the matrix needed for aged hardening [10].
In order to reduce the cracking susceptibility of AA 2024-T3, it is necessary to adjust the chemical
composition and the solidification microstructure of the weld metal to a less susceptible level. Hot
cracking sensitivity of the 2024 alloy can be reduced by controlling the solidification process during
welding by optimization of welding parameters and avoiding the crack sensitive composition in the
weld metal through the use of a suitable filler metal with different chemistry and a lower solidification
point than that of the base metal [11]. It is possible to reduce the crack sensitivity by introducing minor
eutectic alloy such as Al-Si via the addition of a crack resistant filler metal of the right composition,
usually from the 4xxx series alloys. More eutectics are provided by the filler wire to heal the cracks
formed during the solidification of the weld pool. In addition, using filler wire also improves the process
stability, reduces the tendency to porosity formation and leads to wider volume of the weld pool by
compensating for the loss of material due to vaporisation [12]. Improved welding process stability
means that macro pores caused by keyhole collapse and instability can be avoided. In addition, the
increased silicon content in the molten pool by filler metal addition effectively lowers its hydrogen
solubility and therefore, reduces the tendency to micro porosity formation as less hydrogen is
dissolved in the molten pool. When filler metal is used, the weld metal composition is determined by
the ratio between the amount of the melted base metal and the filler metal in the weld seam. The
dilution ratio is usually around 20% for laser beam welding and due to the low fraction of filler metal in
the weld, the eutectic alloy 4043 with 5% silicon was used as filler metal in this investigation. The
major alloying element of the 4xxx series aluminium-silicon alloys is silicon in amounts up to a
maximum of 12% in 4047, with a low melting point suitable as a filler material for welding AA 2024-T3
to eliminate solidification cracking and undercut, without causing brittleness in the resulting welded
joint [13]. The 4047 wire however, has lower ductility and is more expensive than the 4043 wire so
4043 was chosen over 4047 for its better ductility. The high percentages of silicon in 4043 filler metal
was important for the prevention of solidification cracking and it helped reduce the total shrinkage
during freezing. The low solidification temperature and narrow freezing range of around 5°C of the
4043 filler metal ensured that the base metal completely solidifies prior to the weld and reach its
maximum strength before become subjected by shrinkage stresses so that the duration in which liquid

4
metal is affected by this contraction is minimised during cooling. The filler metal was the last part of
the weld to solidify. The 4043 filler wire also combined with the base metal to lower the percentage of
MgSi2 in the weld and reduce its crack sensitivity. However, the addition of filler metal to the weld also
led to a mismatching mechanical properties and reduced the yield and tensile strengths of the weld
compared to the base metal. As well as that, in the case where the wire feed rate was too fast and not
optimised, it resulted in weld pool instability and formation of welding defects. Therefore, the optimum
values for wire feed rate was investigated to produce the best weld quality with reduced crack
sensitivity and mechanical performance.
2 EXPERIMENTAL PROCEDURES
Heat treatable aluminium alloy (Al-Cu-Mg) alloy 2024 sheets in the T3 temper condition (i.e. solution
heat-treated, cold worked and naturally aged) with 3 mm was used. A 0.6 mm diameter consumable
4043 aluminium filler alloy of a nominal composition Al-5%Si was used when welding 2024 with a filler
wire. The chemical compositions of AA 2024-T3 and Aa 4043 are listed in Table 1.
Table 1 Chemical composition of AA 2024-T3 and AA 4043 (Wt. %)
Material Al Cu Mg Mn Cr Si
AA 2024-T3 92.1 5.9 1.0 0.6 0.1 0.3 AA 4043 94.8 - - - - 5.2
A 5 kW continuous wave (CW) ytterbium fibre laser system YLS-5000 from IPG Photonics was used
in TEM01* mode for laser welding. The beam output of 200 W single-mode active fibres was combined
to deliver the beam output to the workpiece via a feed fibre with a diameter of 200 µm. To protect the
feed fibre from damage during welding, the feed fibre was coupled into a processing fibre with a
diameter of 300 µm which was connected directly to the laser processing head [14], and the beam
diameter at focus was 630 μm. The wavelength of fibre laser was 1070 nm, the beam quality factor,
M2 was around 7.3, the divergence half angle of the focused beam was 12.5 mrad and the Rayleigh
length was about 3.1 mm. The focal length of focusing lens was 300 mm, and the diameter of the
focusing lens was 50 mm. The focal length of the collimator lens was 100 mm and the diameter of the
collimator lens was 50 mm. A beam parameter product (BPP) of less than 2.5 mm mrad was formed.
The filler wire feed rate was the only parameter which was changed while all the other parameters
were kept constant. An independent investigation was conducted to optimise the remaining
parameters such as laser power, welding speed and focal position. All specimens were welded using
5
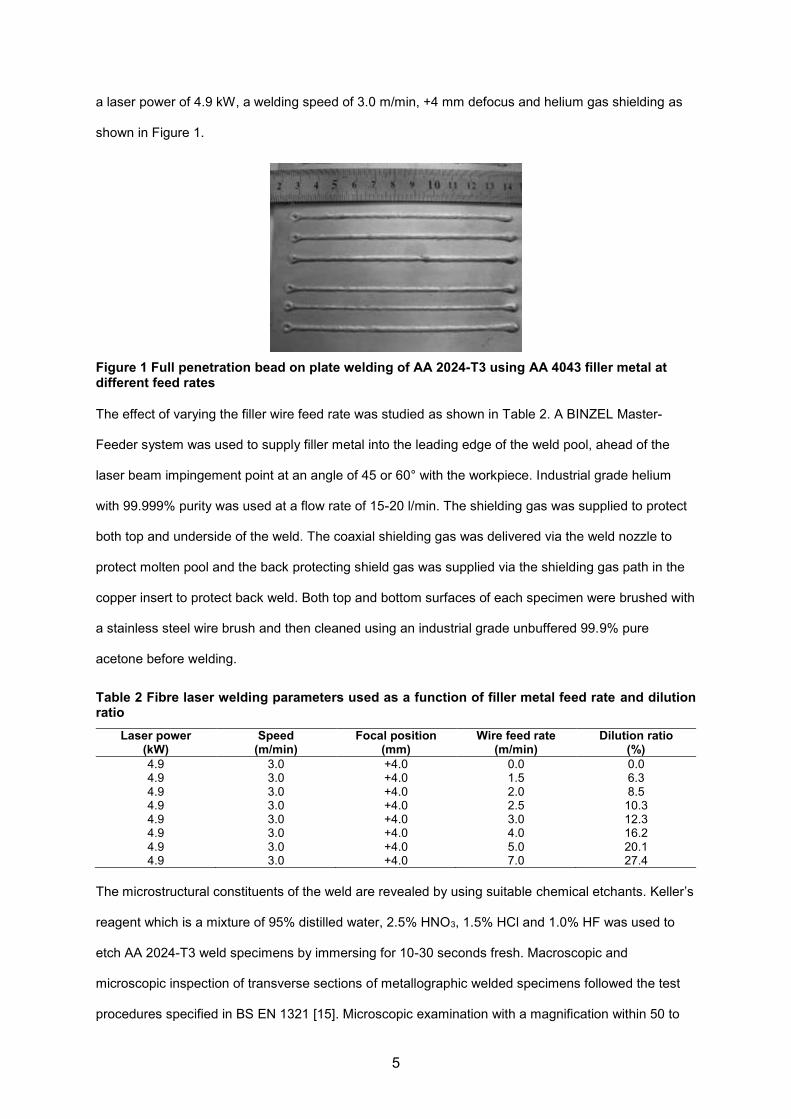
a laser power of 4.9 kW, a welding speed of 3.0 m/min, +4 mm defocus and helium gas shielding as
shown in Figure 1.
Figure 1 Full penetration bead on plate welding of AA 2024-T3 using AA 4043 filler metal at different feed rates
The effect of varying the filler wire feed rate was studied as shown in Table 2. A BINZEL Master-
Feeder system was used to supply filler metal into the leading edge of the weld pool, ahead of the
laser beam impingement point at an angle of 45 or 60° with the workpiece. Industrial grade helium
with 99.999% purity was used at a flow rate of 15-20 l/min. The shielding gas was supplied to protect
both top and underside of the weld. The coaxial shielding gas was delivered via the weld nozzle to
protect molten pool and the back protecting shield gas was supplied via the shielding gas path in the
copper insert to protect back weld. Both top and bottom surfaces of each specimen were brushed with
a stainless steel wire brush and then cleaned using an industrial grade unbuffered 99.9% pure
acetone before welding.
Table 2 Fibre laser welding parameters used as a function of filler metal feed rate and dilution ratio
Laser power Speed Focal position Wire feed rate Dilution ratio (kW) (m/min) (mm) (m/min) (%)
4.9 3.0 +4.0 0.0 0.0 4.9 3.0 +4.0 1.5 6.3 4.9 3.0 +4.0 2.0 8.5 4.9 3.0 +4.0 2.5 10.3 4.9 3.0 +4.0 3.0 12.3 4.9 3.0 +4.0 4.0 16.2 4.9 3.0 +4.0 5.0 20.1 4.9 3.0 +4.0 7.0 27.4
The microstructural constituents of the weld are revealed by using suitable chemical etchants. Keller’s
reagent which is a mixture of 95% distilled water, 2.5% HNO3, 1.5% HCl and 1.0% HF was used to
etch AA 2024-T3 weld specimens by immersing for 10-30 seconds fresh. Macroscopic and
microscopic inspection of transverse sections of metallographic welded specimens followed the test
procedures specified in BS EN 1321 [15]. Microscopic examination with a magnification within 50 to
6
500 times also with etching to reveal features of welded joints. An optical microscope (OM), Zeiss
Axio Scope A1 was used for microstructural examination. Energy dispersive X-ray spectroscopy
(EDX) in an environmental scanning electron microscope (SEM), Hitachi S-3400N VPSEM was used
to determine chemical compositions of the specimens at an accelerating voltage of 15 kV, an
emission current of 76 μA, a working distance of 6.8 mm, an elevation of 35° and a live time of 50
seconds. Scanning electron microscope (SEM) was also used to examine the fracture surface of
selected tensile specimens after tensile testing in the base metal and the welded joints at various
magnifications to determine the fracture behaviour and the presence of welding defects.
The quality of welds produced in this experiment were evaluated against a set of welding acceptance
criteria from several international standards on welding as shown in Table 3:
Table 3 Weld quality assessment criteria applied to 3 mm thick AA2024-T3 [16–18]
Standard Level Face width (mm)
Root width (mm)
Porosity (mm)
Undercut (mm)
Underfill (mm)
Reinforcement (mm)
AWS D17.1 Class A N/A N/A ≤ 0.99 ≤ 0.05 ≤ 0.13 ≤ 0.99 BS EN ISO 13919-2 stringent B N/A N/A ≤ 0.90 ≤ 0.15 ≤ 0.15 ≤ 0.65
BS EN 4678 AA ≤ 4.00 ≤ 2.50 ≤ 0.90 ≤ 0.15 ≤ 0.30 ≤ 0.55
The main criteria assessed were the top and bottom weld widths, the ratio of root to face width, Rw,
the depth of undercut and underfill, the size of weld porosity and the height of reinforcement or excess
weld penetration. Any weld showing a lack of penetration or crack were rejected according to AWS
D17.1, BS EN ISO 13919-2 and BS EN 4678. Other welding imperfections such as overlap and
spatter were also identified. The Rw was used to evaluate the processing stability of full penetration
welding and a value of 0.6 determined by Chen et al. [19].
The influence of filler wire feed rate on microstructural transformations and variations of local
hardness profiles of AA 2024-T3 welds was evaluated by measuring hardness in the direction
perpendicular to the transverse weld cross-sections along three lines located 0.5 mm away from the
top and the bottom surfaces, with a 1 mm gap between them. Micro-hardness measurements were
performed on weld cross-sections perpendicular to the weld line using a Zwick Roell Z2.5 (ZHU 0.2)
hardness testing machine at a load of 100 g and a dwell period of 15 seconds at a speed of 60 μms-1
to characterise the whole hardness profile across the weld seams up to the base metal. To avoid work
hardening contributions from the adjacent indents, indentations were separated by 200 μm and the
lines of indentation were separated by 500 μm.
7
Uniaxial tensile tests were conducted at ambient temperature on a 200 kN Instron electromechanical
universal testing machine in ram displacement control at a constant crosshead speed of 1 mm/min.
Tensile properties were determined from two butt-welded 3 mm thick AA 2024-T3 tensile specimens
one welded with and the other without filler metal. Digital image correlation (DIC) technique was used
to capture digital images of the deforming surface of the specimens during uniaxial tensile
deformation every second to compute the corresponding displacement and strain. Images were
captured using the 2D DIC technique at the minimum focus distance of 0.45 m and at a resolution of
3456 × 2304 pixels. The DIC area of analysis was selected manually to process the images only
within the specimen, with a resolution of 310 × 1800 pixels. Additionally, a facet size of 20 pixels and
a facet step of 16 pixels, giving an overlap of 4 pixels, were set up according to the configuration with
the average speckle diameter and the resolution of the image in order to ensure that the results are
accurate.
Table 4 lists the welding parameters of the specimens tested. In order to evaluate quantitatively the
differences in mechanical properties between the autogenously welded specimen and the specimen
welded using an optimum feed rate of 2.6 m/min as found in this investigation, the development of strain
distribution during loading was determined.
Table 4 Differernt sets of welding parameters used for tensile testing macro-tensile welded specimens
Welding mode Laser power
(kW) Welding speed
(m/min) Focal position
(mm) Wire feed rate
(m/min) Dilution ratio
(%)
Autogenous 2.9 1.5 +4 - 0.0 Filler 2.9 1.5 +4 2.6 10.5
3 RESULTS AND DISCUSSIONS
Microstructure of the weld with and without filler metal was examined at 50x and 500x magnifications
as shown in Figure 2. The specimen which was welded autogenously contained large solidification
cracks on the weld top surface, whereas, the one welded in the presence of filler metal displayed no
visible crack within the weld. It was found that in both cases the centre of the FZ showed the
formation of characteristic equiaxed dendrites, and columnar dendrites near the FZ boundary.
Epitaxial continuous growth of columnar grains was observed in the direction of thermal gradients in
the FZ, with the same crystallographic orientation to that at the FZ line. Dendritic growth was reported
by Watkins et al. [20] for alloys containing less than 5% weight copper, in this case AA 2024, with the
dendrites being α-Al and with either CuAl2 precipitates or CuAl2-Al eutectic as the inter-dendritic

8
phase. The FZ of AA 2024 mainly consisted of α-Al phase with a surrounding eutectic CuMgAl2 phase
as it contained magnesium.
a) b)
c) d)
Figure 2 Microstructure of the AA 2024-T3 weld a) autogenous and b) with filler metal, and dendrites (equiaxed and columnar) at the weld centre line c) autogenous and d) with filler metal
During welding of AA 2024, the low melting point eutectic with a wide range of freezing temperatures
segregated in the grain boundaries and formed the low melting point constituents, which were
rejected by the solidifying columnar grains. The amount of eutectic liquid between grains were large
enough to form a thin, continuous grain boundary film during solidification at a depressed liquidus and
solidus temperatures because of magnesium, compared to the bulk solidus temperature. The solidus
temperature was further suppressed due to a lack of diffusion resulting from rapid non-equilibrium
solidification during welding. The shrinkage strains was proportional to the coherence range between
the first formation of mushy stage by dendrite interlocking and the solidus, so a wider coherence
range increased the tendency for solidification cracking [21]. When the amount of liquid available
during the freezing process was insufficient to fill in the spaces between the solidifying grains at the
centre, then micro-cracks such as those observed in Figure 2 were formed due to the lack of material
and high shrinkage strains in the weld pool [22]. Equiaxed dendritic structure on the other hand,
reduced the crack sensitivity due to the abundance of liquid metal between grains which were able to

9
deform more easily under stresses [23], and the lower coherent temperature range resulting from the
formation of equiaxed dendrites at a later stage in freezing [24]. In addition, the fine isotropic grain
structure of equiaxed grains unlike coarse anisotropic columnar grains, increased the resistance to
crack formation and propagation [25] by distributing the low melting point segregates over a larger
grain boundary area and also relieved local shrinkage strains developed during freezing more
efficiently [24]. Equiaxed grain formation is important for the grain refinement of welds but due to the
high solidification rate and thermal gradient, it is often considered difficult to obtain. Instead, columnar
grain growth is favoured and there is a small chance of equiaxed grain formation, resulting in
predominantly coarse, low ductility columnar grain structure in the FZ [26]. The use of 4043 filler metal
which has a freezing range of around 5°C enabled rapid solidification of welds and reduced the time
for shrinkage during solidification, and therefore, micro-cracks were not observed in specimens
welded with filler wire.
The weld face and root dimensions were initially measured as shown in Figure 3. It was found that the
top and the bottom weld width of the specimens increased with increasing filler wire feed rate. The
change in the bottom width with feed rate was relatively small but quite large for the top width. The top
weld width of specimens measured at all feed rates passed the criterion in BS EN 4678, of 4.0 mm,
whereas the bottom weld width was above the maximum of 2.5 mm at all feed rates and therefore,
failed the criterion. However, as the weld quality in general was good in terms of welding defects and
Rw, and also because there were no weld quality acceptance criteria related to weld width specified in
AWS D17.1 and BS EN ISO 13919-2, it was not possible to judge the specimens using the criteria on
face and root weld widths in BS EN 4678 alone but also had to consider other factors as well. It was
found that the magnesium content in the weld measured by EDX decreased with increasing feed rate
from around 0.80% at 0 m/min to 0.65% at 7.0 m/min, which obviously increased the silicon content
as well, from around 0.10% at 0 m/min to 0.88% at 7.0 m/min, illustrated in more details in Figure 5.
The Rw was above 0.6 at all feed rates so the processing stability for full penetration welding was
high. A trend was observed where the Rw decreased with increasing feed rate, meaning that as
mentioned above, the rate of change in the top width was greater than the bottom width with the feed
rate. Underfill was observed when autogenous welding, above the maximum limit of 0.13 mm in AWS
D17.1 and 0.15 in BS EN ISO 13919-2 but below 0.30 mm in BS EN 4678. The depth of underfill was
reduced by more than half at 1.5 m/min which passed all criteria so welding with filler wire reduced

10
the formation of underfill defects and even eliminated at higher feed rates. As expected the height of
reinforcement or excess weld metal increased with increasing feed rate and at 7.0 m/min, it was
above the most stringent limit of 0.55 mm in BS EN 4678 but below that in BS EN ISO 13919-2 and
AWS D17.1, of 0.65 and 0.99 mm respectively. For the rest of the specimens, it was less than 0.55
mm. The depth of undercut was below the maximum limit of 0.15 mm in BS EN ISO 13919-2 and BS
EN 4678 at all feed rates, but was above the 0.05 mm in AWS D17.1 at the two highest feed rates of
5.0 and 7.0 m/min. The problems with welding defects including surface porosity, reinforcement and
undercut were found to be the most significant at 5.0 m/min and 7.0 m/min. It was possible that the
feed rate was too high at these feed rates which supplied too much filler metal to the weld pool for the
given laser power and welding speed. High feed rates produced instabilities, whereas, low feed rates
did not sufficiently modify the chemical composition of the weld pool [11].
a) b)
Figure 3 a) Relationship between weld width, magnesium and silicon content and filler metal feed rate at a laser power of 4.9 kW, a welding speed of 3.0 m/min, +4 mm defocus and with helium shielding gas, and b) the resultant weld width ratio, undercut, underfill and reinforcement
The weld shape was similar at all feed rates with an hourglass shape but with larger weld widths with
increasing feed rate. The small underfill observed at 0 m/min was reduced at 1.5 m/min and
completely removed at 2.0 m/min. The weld quality was good between 2.0 and 4.0 m/min but at 5.0
m/min, clustered pores with a maximum diameter of 0.21 mm. The criterion in AWS D17.1 for surface
porosity specifies at least 8 times the size of larger adjacent imperfection and a smaller maximum
pore size of 0.75 mm compared to 0.99 mm for subsurface pores. BS EN 4678 and BS EN ISO
13919-2 on the other hand, specify the same diameter of 0.99 mm for surface pores but with the
distance between the individual pores in clustered porosity greater than ¼ of the material thickness.
Although the size of surface pores was small, they were too close to each other so were
unacceptable. These surface pores were not observed at 7.0 m/min but instead large undercut
0.0
0.5
1.0
1.5
2.0
0.0
1.0
2.0
3.0
4.0
5.0
0 2 4 6 8
We
ight (%
)
We
ld w
idth
(m
m)
Filler wire feed rate (m/min)
TopBottomSiMg
0.00
0.10
0.20
0.30
0.40
0.50
0.0
0.2
0.4
0.6
0.8
1.0
1.2
0.0 2.0 4.0 6.0 8.0
Imperf
ections (
mm
)
Rw,
Rein
forc
em
ent (m
m)
Filler wire feed rate (m/min)
RwReinforcementUndercutUnderfill

11
defects on the top surface and excessive penetration on the bottom surface was found. Therefore, it
was concluded that the best weld quality in terms of morphology was produced when the filler metal
feed rate was in the optimum range of 1.5 to 4.0 m/min.
0 m/min 1.5 m/min 2.0 m/min 2.5 m/min
3.0 m/min 4.0 m/min 5.0 m/min 7.0 m/min
Figure 4 Transverse sections of welds and weld top bead profiles produced with different filler metal feed rate at a laser power of 4.9 kW, a welding speed of 3.0 m/min, +4 mm defocus and with helium shielding gas
The effect of silicon addition on the crack sensitivity of AA 2024-T3 is shown in Figure 5. The weight
content of magnesium and silicon in the weld was measured using energy dispersive X-ray
spectroscopy on specimens welded with different filler metal feed rates. It was found that the
magnesium level dropped whereas, the silicon level increased with increasing feed rate. As it can be
seen from the crack sensitivity curves for aluminium in Figure 5, the crack sensitivity is the maximum
when the Cu content is approximately 3%, Si is 1%, and Mg is 1.5%. AA 2024-T3 contained
approximately 4.5% Cu which may initially have indicated that it has relatively low crack sensitivity.
However, it also contained a small amount of Mg close to the critical level of 1.5% in the base metal,
which increased the crack sensitivity by widening the coherence range, and depressing the solidus
temperature but not the highest temperature of coherence [27]. Segregation of the low boiling point
alloying elements such as Zn and Mg caused hot cracking at the grain boundaries due to the
shrinkage strains during the solidification process. The presence of Si as well as Mg in the AA 2024-
T3 base metal increased the risk of inducing coarse Mg2Si precipitates so the maximum content of Si
in the 2024 alloy was required to be less than 0.7% [28]. According to Davis [29], the sensitivity

12
decreases rapidly if the Si content exceeds 1.5%. The dilution of the weld pool with excess silicon by
welding with the 4043 filler metal effectively reduced the percentage of Mg2Si in the weld by
combining with the base metal. Also, the addition of silicon to the weld lowered the solidification
temperature and decreased the total shrinkage during freezing as mentioned previously to prevent
cracking. As a result, the peak of the solidification crack sensitivity curve for Al-Mg and Al-Mg2Si
shifted away from the crack sensitive ranges. The silicon content in the welded specimens were
detected to be less than the recommended 0.6% to avoid the crack sensitive range of Al-Si up to the
feed rate of 3.0 m/min but above 0.6% at higher feed rates of 4.0, 5.0 and 7.0 m/min. Therefore, the
solidification crack sensitivity was minimised by welding at a filler wire feed rate of 2.0 to 3.0 m/min
with a dilution ratio of 8.5 to 12.3%.
a) b)
Figure 5 a) Weight percentage (%) of main alloying elements in the weld as a function of filler metal feed rate obtained using energy dispersive X-ray spectroscopy (EDX) and b) aluminium crack sensitivity curves showing the effects of different alloy additions (Figure 5 b) modified from [21,30])
3.1 Micro-hardness
Micro-hardness testing in the transverse weld bead cross-sections as illustrated in Figure 6 showed
that all AA 2024-T3 welds were under-matched with the lowest hardness in the FZ. The hardness in
the BM was the highest as expected. It was also found that the hardness in the HAZ was greater than
in the FZ but lower than in the BM. Micro-hardness increased as a function of the distance from the
weld centre in which the FZ had a hardness of around 90-100 HV, the HAZ hardness in the range of
100-120 HV and the BM hardness in the range of 130-140 HV. The HAZ adjacent to the FZ showed
hardness values close to that in the FZ whereas, the HAZ adjacent to the BM showed a hardness
close that in the BM. Since the extent of the FZ and the HAZ was very small, the resulting hardness
gradient was very steep. On the other hand, the hardness distribution was relatively uniform across
the FZ in most specimens.
0
1
2
3
4
5
Cu Mg Si
We
ight
(%)
Vf = 0 m/minVf = 1.5 m/minVf = 2.0 m/minVf = 2.5 m/minVf = 3.0 m/minVf = 4.0 m/minVf = 5.0 m/minVf = 7.0 m/min

13
The dissolution or loss of strengthening precipitates and alloying elements, softening in the FZ, and
over-aging in the HAZ were the main causes of hardness degradation during welding process. The
effect of grain growth with respect to strength was of minor importance but instead mainly influenced
by modification of precipitates [31]. Softening in the FZ was caused by microstructural changes as a
result of very high temperatures experienced in the FZ and the associated rapid heating and cooling
rates during welding. The heating action of the laser led to segregation of the strengthening elements,
magnesium and copper, and their hybrids (intermetallic compounds), formation and growth of non-
strengthening coarse precipitates, dissolution of strengthening precipitates and uniform re-distribution
of precipitating elements during heating which then froze due to fast cooling rates [32]. In addition,
softening can also be attributed to violent vaporization of low boiling point magnesium and element
variation resulting from the filler dilution [33] as observed in Figure 5 a) showing lower Cu and Mg
contents with increasing filler metal feed rate. The hardening effect was therefore, removed and the
mechanical properties of the weld degraded. The hardness in the FZ was similar to the hardness
measured in a fully solution treated and quenched AA 2024 of around 80 HV [34]. Even though the FZ
partially recovered its hardness by natural ageing at room temperature for several days after welding,
the effect was small due to inhomogeneous distribution of solute atoms. Loss of volatile elements
such as magnesium and zinc for strengthening also contributed to lowering the hardness in the FZ by
affecting the weld pool chemistry. The welding thermal cycle also affected the precipitation behaviour
in the HAZ such as dissolution, precipitation and coarsening so the HAZ was divided into two different
microstructural regions of partially melted zone and over-aged zone. The hardness in the partially
melted zone decreased due to dissolution of strengthening precipitates during melting and
segregation of alloys during solidification. In the over-aged zone, coarsening of the strengthening
semi-coherent S ́phase as well as transformation to the non-strengthening incoherent stable S phase
reduced the hardness [35]. As it can be seen from Figure 6, changing the filler metal feed rate does
not significantly affect the heat input and therefore, its effect on micro-hardness was relatively small
but rather influenced the weld width, where increasing the feed rate increased both the face and the
root weld widths.

14
a)
b)
c) d)
e) f)
g) h)
Figure 6 Micro-indentation hardness distributions of fibre laser welded AA 2024-T3 welds as a function of filler wire feed rate
50
75
100
125
150
175
200
-3 -2 -1 0 1 2 3
Vic
ker's
hard
ness (
HV
0.1
)
Distance from weld centre (mm)
Top
Mid
Bot
W15P= 4.9 kW, V = 3.0 m/min,f = +4 mm
50
75
100
125
150
175
200
-3 -2 -1 0 1 2 3
Vic
ker's h
ard
ness (
HV
0.1
)
Distance from weld centre (mm)
Top
Mid
Bot
W22P= 4.9 kW, V= 3.0f = +4 mm, w = 1.5 m/min
50
75
100
125
150
175
200
-3 -2 -1 0 1 2 3
Vic
ke
r's h
ard
ne
ss (
HV
0.1
)
Distance from weld centre (mm)
Top
Mid
Bot
W23P= 4.9 kW, V= 3.0f = +4 mm, w = 2.0 m/min
50
75
100
125
150
175
200
-3 -2 -1 0 1 2 3
Vic
ke
r's h
ard
ne
ss (
HV
0.1
)
Distance from weld centre (mm)
Top
Mid
Bot
W24P= 4.9 kW, V= 3.0f = +4 mm, w = 2.5 m/min
50
75
100
125
150
175
200
-3 -2 -1 0 1 2 3
Vic
ker's h
ard
ness (
HV
0.1
)
Distance from weld centre (mm)
Top
Mid
Bot
W25P= 4.9 kW, V= 3.0f = +4 mm, w = 3.0 m/min
50
75
100
125
150
175
200
-3 -2 -1 0 1 2 3
Vic
ker's h
ard
ness (
HV
0.1
)
Distance from weld centre (mm)
Top
Mid
Bot
W26P= 4.9 kW, V= 3.0f = +4 mm, w = 4.0 m/min
50
75
100
125
150
175
200
-3 -2 -1 0 1 2 3
Vic
ke
r's h
ard
ne
ss (
HV
0.1
)
Distance from weld centre (mm)
Top
Mid
Bot
W27P= 4.9 kW, V= 3.0f = +4 mm, w = 5.0 m/min
50
75
100
125
150
175
200
-3 -2 -1 0 1 2 3
Vic
ke
r's h
ard
ne
ss (
HV
0.1
)
Distance from weld centre (mm)
Top
Mid
Bot
W28P= 4.9 kW, V= 3.0f = +4 mm, w = 7.0 m/min
15
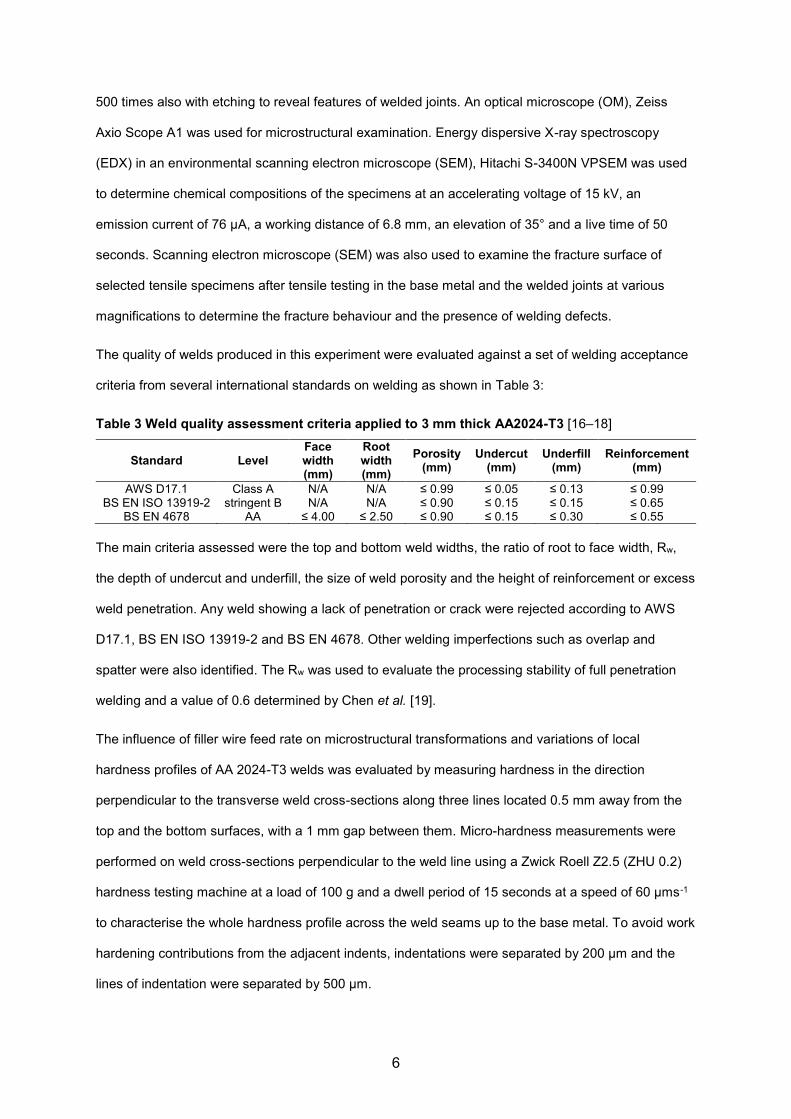
3.2 Global and local tensile properties
Figure 7 shows the full field longitudinal strain distribution at different percentage of the fracture time
at 25, 50, 75 and 99%. The strain profiles across the weld showed a sharp strain gradient from the
weld centreline to the BM at the onset of final fracture. The maximum strain localisation was located in
the FZ for both specimens, whereas, the minimum occurred in the BM. The strain distribution was
uniform and symmetrical about the weld centreline throughout the deformation with relatively larger
local strains of around 11% in the FZ for both specimens welded with or without filler metal.
Figure 7 Full field longitudinal strain distributions in the loading direction for fibre laser welded AA 2024-T3 showing the development of strain localisation relative to the time to fracture
The strain measured in the BM was of the order of only 0.5-1.0% at failure which indicated that it was
still under elastic loading. Although the boundaries of different characteristic regions corresponding to
the BM, the HAZ and the FZ cannot be easily identified from the strain maps, their locations were
measured and marked outside the processed regions prior to testing and also it was possible to
determine their extent by examining the highly non-uniform strain distribution across the weld at different
load levels. It was obvious from these strain maps that the stiffness of the welded specimen was a result
of the stiffness of the three different microstructural regions
The global tensile behaviour of the welded specimens and the BM and the corresponding mechanical
properties are shown in Figure 8. It was possible to create any size and number of gauge lengths on
the processed DIC images and so the global stress and strain curves were determined for a 25 mm
gauge length equal to that of the extensometer used. For mechanical characterisation of the welded
11
9
7.5
6
4.5
3
1.5
0
εy (%)11
9
7.5
6
4.5
3
1.5
0
εy (%)Autogenous Welded with filler metal
Percentage of failure timePercentage of failure time
25% 50% 75% 99% 25% 50% 75% 99%

16
joints, the elastic modulus, yield strength, ultimate tensile strength and elongation to failure were
determined as listed in Table 5.
Table 5 Results of tensile properties determined from tensile testing welded joints
Welding mode UTS (MPa) YS (MPa) Elongation (%) E (GPa)
Filler 370 277 3.7 63.6 Autogenous 364 283 2.4 66.6 Unwelded 463 358 14.9 69.1
Global tensile test results showed significant losses in ductility and tensile strength in the welded
specimens compared to the unwelded BM due to plastic strain localisation and increased constraint
within the lower strength weld region of the welded joint for the composite gauge length. Only moderate
variations in the yield strength and elastic modulus were observed, while considerable differences in
elongation to failure and ultimate tensile strength were measured. The addition of filler metal reduced
the risk of welding defects and resulted in a significantly greater ductility over 3.5% and a fairly higher
tensile strength of around 380 MPa than the other specimen.
Figure 8 Global stress and strain curves obtained from tensile testing welded specimens
The influence of local material behaviours in the various weld zones on the overall weld response was
determined using the DIC by assuming an iso-stress condition for all specimens, where the global stress
was considered as the corresponding local stress at any point within the analysed displacement data
field. The local strain data were derived from the DIC by measuring the local strain over each individual
region, which were then plotted against the global stress data to obtain the local tensile properties in
the FZ and the HAZ on either side of the FZ (HAZ1, HAZ2) as shown in Figure 9, As it was only possible
to obtain the full tensile response in the weakest region where strain localisation occurred, the stress
and strain curves in the stronger regions such as the BM were not obtained. The high hardening rate
0
100
200
300
400
500
0.00 0.05 0.10 0.15
Str
ess (M
Pa)
Strain
P=2.9 kW, V=1.5 m/min, f=+4 mm, filler
P=2.9 kW, V=1.5 m/min, f=+4 mm
BM

17
and low ductility observed in the global stress and strain curves of the welded specimens proved that
strain localisation occurred in the weaker regions of the weld. In fact, as all the AA 2024-T3 specimens
were under-matched, the local strain evolution in the FZ or the HAZ was successfully calculated up to
complete fracture, which was not possible to determine from standard tensile specimens without the
DIC because of the narrow size of the FZ. It was found that the longitudinal strains measured in the
weld was much higher than the measured global fracture strains which indicated that the strain
distribution within the 25 mm gauge length was not uniform but highly localised in the weaker FZ or
HAZ so the overall behaviour was dominated by that of the weakest component of the specimen and
minimal plastic deformation occurred outside the weld [36]. The maximum strain was reached in the FZ
for both specimens.
P=2.9 kW, V=1.5 m/min, f=+4 mm, filler metal feed rate=2.6 m/min (10.5% dilution ratio)
P=2.9 kW, V=1.5 m/min, f=+4 mm
Figure 9 Local mechanical responses in FZ and HAZ constructed from full field DIC tensile tests compared to overall responses
Figure 10 shows the relationship between longitudinal strain distributions across the weld at the onset
of final fracture obtained using the DIC and micro-hardness distributions in and around the respective
welds from micro-indentation hardness testing. The strain values in the BM were small tending to zero
with increasing distance from centre of weld, whereas, the strain increased in the HAZ at the same
positions where the hardness decreased so the hardness measurements were used to confirmed the
extent of the HAZ as well as the FZ where the hardness was the minimum with only small variations.
The strain distribution was more uniform in the specimen welded with filler wire, with a wider weld width.
0
50
100
150
200
250
300
350
400
450
0.00 0.02 0.04 0.06 0.08 0.10 0.12
Tru
e s
tre
ss (
MP
a)
True strain
FZ
HAZ1
HAZ2
Global
0
50
100
150
200
250
300
350
400
450
0.00 0.02 0.04 0.06 0.08 0.10 0.12
Tru
e s
tre
ss (
MP
a)
True strain
FZ
HAZ1
HAZ2
Global

18
P=2.9 kW, V=1.5 m/min, f=+4 mm, filler metal feed rate=2.6 m/min (10.5% dilution ratio)
P=2.9 kW, V=1.5 m/min, f=+4 mm
Figure 10 Local strain distributions across the welded joint obtained using the DIC at the onset of final fracture superimposed on micro-indentation hardness distributions measured in the transverse weld cross-sections
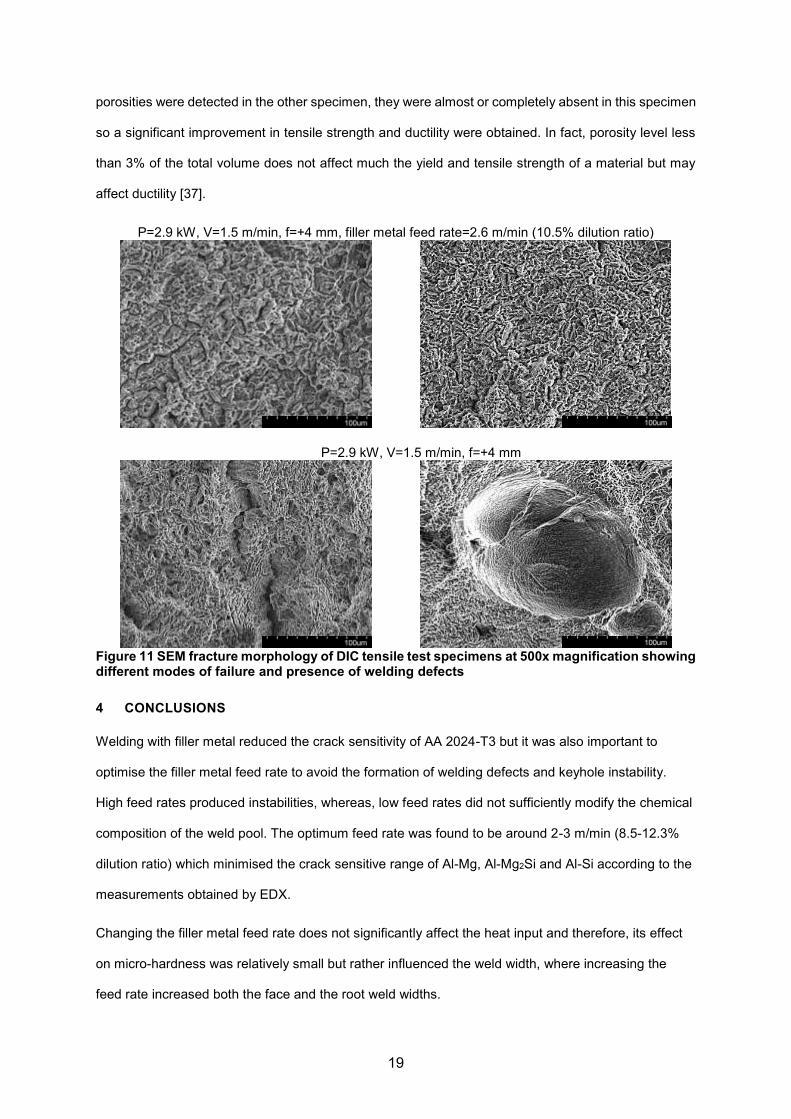
3.3 Microstructural observations using SEM
Scanning electron microscopy (SEM) analysis was performed on the fracture surfaces of the AA 2024-
T3 DIC tensile specimens as shown in Figure 11 to examine the fracture behaviour and the existence
of welding defects such as hot cracks and porosities. It was observed that for both specimens inspected,
failure occurred within the weld, either in the FZ or in the HAZ/FZ boundary but not in the BM due to
weld under-match.
For the specimen which was welded without filler wire, a rough and irregular fracture surface, consisting
of microvoids and dimples that act as microvoid nucleation sites, was observed. This indicated that the
specimen failed in a more ductile manner where fracture initiated by microvoid coalescence and then
by dimple rupture. Rough fracture surfaces with fine equiaxed dimples are the characteristic features
of ductile transgranular fracture mode. Hydrogen induced spherical shaped pores of different sizes
ranging from around 100 to 300 μm with round tip dendrites, were identified on the fracture surface in
clusters which were responsible for crack initiation during deformation. Porosities reduced the effective
cross-sectional area of the welded joints and therefore, caused stress concentrations which
deteriorated the strength of the joints in proportion to the reduction of the cross-sectional area.
For the specimen which was welded with filler wire at an optimum rate of 2.6 m/min (10.5% dilution
ratio), even greater amount of finer dimples was found to dominate the fracture surfaces which is the
characteristic feature of purely ductile fracture. A significant amount of localised microscopic weld
plasticity was observed which improved the tensile strength and ductility of the respective welds as
previously determined from tensile testing. While intergranular inter-dendritic micro hot cracks and
80
90
100
110
120
130
140
150
0.0
2.0
4.0
6.0
8.0
10.0
12.0
-5 -4 -3 -2 -1 0 1 2 3 4 5
Vic
ke
rs h
ard
ne
ss (
HV
0.3
)
Str
ain
(%
)
Distance from weld centre (mm)
Top
Middle
BottomBM FZHAZ HAZ BM
80
90
100
110
120
130
140
150
0.0
2.0
4.0
6.0
8.0
10.0
12.0
-5 -4 -3 -2 -1 0 1 2 3 4 5
Vic
ke
rs h
ard
ne
ss (
HV
0.3
)
Str
ain
(%
)
Distance from weld centre (mm)
Top
Middle
Bottom
BM FZHAZ HAZ BM
19
porosities were detected in the other specimen, they were almost or completely absent in this specimen
so a significant improvement in tensile strength and ductility were obtained. In fact, porosity level less
than 3% of the total volume does not affect much the yield and tensile strength of a material but may
affect ductility [37].
P=2.9 kW, V=1.5 m/min, f=+4 mm, filler metal feed rate=2.6 m/min (10.5% dilution ratio)
P=2.9 kW, V=1.5 m/min, f=+4 mm
Figure 11 SEM fracture morphology of DIC tensile test specimens at 500x magnification showing different modes of failure and presence of welding defects
4 CONCLUSIONS
Welding with filler metal reduced the crack sensitivity of AA 2024-T3 but it was also important to
optimise the filler metal feed rate to avoid the formation of welding defects and keyhole instability.
High feed rates produced instabilities, whereas, low feed rates did not sufficiently modify the chemical
composition of the weld pool. The optimum feed rate was found to be around 2-3 m/min (8.5-12.3%
dilution ratio) which minimised the crack sensitive range of Al-Mg, Al-Mg2Si and Al-Si according to the
measurements obtained by EDX.
Changing the filler metal feed rate does not significantly affect the heat input and therefore, its effect
on micro-hardness was relatively small but rather influenced the weld width, where increasing the
feed rate increased both the face and the root weld widths.

20
Only small variations in the yield strength and elastic modulus were observed, while considerable
differences in elongation to failure and ultimate tensile strength were measured. The addition of filler
metal reduced the risk of welding defects and improved ductility to over 3.5% and a fairly higher tensile
strength of around 380 MPa than without. The strain distribution was more uniform in the specimen
welded with filler wire, with a wider weld width.
Microstructural examination showed that the addition of filler wire increases the number of finer dimples
within the weld, resulting in a purely ductile fracture behaviour. A significant amount of localised
microscopic weld plasticity was observed which improved the tensile strength and ductility.
5 ACKNOWLEDGEMENT
The strong support from the Aviation Industry Corporation of China (AVIC) and Beijing Aeronautical
Manufacturing Technology Research Institute (BAMTRI) for this funded research is much appreciated.
The research was performed at the AVIC Centre for Structural Design and Manufacture at Imperial
College London. Dr C M Davies acknowledges the support of EPSRC under grant number
EP/I004351/1.

21
REFERENCES
[1] Kou S. Weld Metal Solidification Cracking. In: Kou S, editor. Weld. Metall. 2nd ed., Hoboken: John Wiley & Sons, Inc.; 2003, p. 263–300.
[2] Dos Santos J, Ç am G, Torster F, Insfran A, Riekehr S, Ventzke V, et al. Properties of power beam welded steels, al-and ti-alloys: Significance of strength mismatch. Weld World 2000;44:42–64.
[3] Takahashi K, Mehmetli B, Sato S. Influence of shielding gas and laser irradiation conditions on porosity formation in CO 2 laser welding of aluminium alloy. Weld Int 1998;12:347–53. doi:10.1080/09507119809448498.
[4] Pastor M, Zhao H, Debroy T. Pore formation during continuous wave Nd:YAG laser welding of aluminium for automotive applications. Weld Int 2001;15:275–81. doi:10.1080/09507110109549355.
[5] Zhao H, Debroy T. Weld Metal Composition Change during Conduction Mode Laser Welding of Aluminum Alloy 5182. Metall Mater Trans B 2001;32:163–72.
[6] Moon DW, Metzbower EA. Laser beam welding on aluminum alloy 5456. Weld J 1983;62:53s – 58s.
[7] Alfieri V, Cardaropoli F, Caiazzo F, Sergi V. Porosity evolution in aluminum alloy 2024 bop and butt defocused welding by Yb-YAG disk laser. Eng Rev 2011;31:125–32.
[8] Alfieria V, Caiazzoa F, Sergi V. Autogenous Laser Welding of AA 2024 Aluminium Alloy: Process Issues and Bead Features. Procedia CIRP 2015;33:406–11. doi:10.1016/j.procir.2015.06.094.
[9] Anyalebechi PN. Analysis of the effects of alloying elements on hydrogen solubility in liquid aluminum alloys. Scr Metall Mater 1995;33:1209–16. doi:10.1016/0956-716X(95)00373-4.
[10] Yang JG, Sung SH, Chen CS, Tan AH. Study of microstructural and mechanical properties of weld heat affected zones of 2024-T3 aluminium using Gleeble simulation. Mater Sci Technol 2011;27:357–65. doi:10.1179/026708310X12668415533964.
[11] Cicalǎ E, Duffet G, Andrzejewski H, Grevey D, Ignat S, Cicală E, et al. Hot cracking in Al-Mg-Si alloy laser welding - Operating parameters and their effects. Mater Sci Eng A 2005;395:1–9. doi:10.1016/j.msea.2004.11.026.
[12] Cao X, Jahazi M, Immarigeon JP, Wallace W. A review of laser welding techniques for magnesium alloys. J Mater Process Technol 2006;171:188–204. doi:10.1016/j.jmatprotec.2005.06.068.
[13] Zhao H, White DR, DebRoy T. Current issues and problems in laser welding of automotive aluminium alloys. Int Mater Rev 1999;44:238–66. doi:10.1179/095066099101528298.
[14] Kratky A, Schuöcker D, Liedl G. Processing with kW fibre lasers: advantages and limits. In: Vilar R, Conde O, Fajardo M, Silva LO, Pires M, Utkin A, editors. XVII Int. Symp. Gas Flow, Chem. Lasers, High-Power Lasers, vol. 7131, 2008, p. 71311X – 71311X – 12. doi:10.1117/12.816655.
[15] BS Standard EN ISO 17639:2013, “Destructive tests on welds in metallic materials. Macroscopic and microscopic examination of welds”, BSI, 2013 n.d.
[16] AWS Standard D17.1:2001, “Specification for Fusion Welding for Aerospace Applications”, AWS, 2001 n.d.
[17] ISO Standard 13919-2, 2011, “Welding — Electron and laser-beam welded joints — Guidance on quality levels for imperfections — Part 2: Aluminium and its weldable alloys”, ISO, 2011, www.iso.org. n.d.
[18] BS Standard EN 4678:2011, “Aerospace series. Weldments and brazements for aerospace structures. Joints of metallic materials by laser beam welding. Quality of weldments”, BSI, 2011 n.d.
[19] Chen L, Shuili G, Yang J. Study on Full Penetration Stability of Light Alloys Sheet Laser Welding. In: Hinduja S, Li L, editors. Proc. 37th Int. MATADOR Conf., Manchester: University of Manchester; 2012, p. 315–8.
[20] Watkins K., McMahon M., Steen W. Microstructure and corrosion properties of laser surface processed aluminium alloys: a review. Mater Sci Eng A 1997;231:55–61. doi:10.1016/S0921-5093(97)00034-8.
[21] Dudas JH, Collins RR. Preventing Weld Cracks in High-Strength Aluminum Alloys. Weld J 1966;45:241s – 249s.

22
[22] Kaplan A. Metallurgy of Welding and Hardening. In: Dowden J, editor. Theory Laser Mater. Process. Heat Mass Transf. Mod. Technol. 1st ed., Briston: Canopus Academic Publishing; 2009, p. 217–33.
[23] Huang C, Kou S. Liquation Cracking in Full-penetration Al-Cu Welds. Weld J 2004;83:111S – 122S.
[24] Yamaoka H. Microstructural control of laser‐ welded aluminium alloys. Weld Int 2001;15:845–50. doi:10.1080/09507110109549454.
[25] Cao X, Wallace W, Immarigeon J-PP, Poon C. Research and Progress in Laser Welding of Wrought Aluminum Alloys. II. Metallurgical Microstructures, Defects, and Mechanical Properties. Mater Manuf Process 2003;18:23–49. doi:10.1081/AMP-120017587.
[26] Koseki T, Inoue H, Fukuda Y, Nogami A. Numerical simulation of equiaxed grain formation in weld solidification. Sci Technol Adv Mater 2003;4:183–95. doi:10.1016/S1468-6996(03)00026-3.
[27] Ghaznavi MM, Ekrami A, Kokabi AH. Effect of solidification mechanism on microstructure and mechanical properties of joint in TLP bonded Al2024‐ T6 alloy. Sci Technol Weld Join 2011;16:174–80.
[28] Hutchinson CR, Ringer SP. Precipitation processes in Al-Cu-Mg alloys microalloyed with Si. Metall Mater Trans A 2000;31:2721–33. doi:10.1007/BF02830331.
[29] Davis JR. Fabrication and Finishing of Aluminum Alloys. In: Davis JR, editor. Alum. Alum. Alloy., ASM International; 1993, p. 199–451.
[30] Michaud EJ, Kerr HW, Weckman DC. Temporal pulse shaping and solidification cracking in laser welded Al-Cu alloys. Proc. 4th Int. Conf. Trends Weld. Res., Gatlinburg, TN: ASM International; 1995, p. 153–8.
[31] Ma T, den Ouden G. Softening behaviour of Al–Zn–Mg alloys due to welding. Mater Sci Eng A 1999;266:198–204. doi:10.1016/S0921-5093(99)00020-9.
[32] Wu SC, Hu YN, Duan H, Yu C, Jiao HS. On the fatigue performance of laser hybrid welded high Zn 7000 alloys for next generation railway components. Int J Fatigue 2016;91:1–10. doi:10.1016/j.ijfatigue.2016.05.017.
[33] Wu S, Yu X, Zuo R, Zhang W, Xie H, Jiang J. Porosity, Element Loss, and Strength Model on Softening Behavior of Hybrid Laser Arc Welded Al-Zn-Mg-Cu Alloy with Synchrotron Radiation Analysis. Weld J 2013;92:64s – 71s.
[34] Preston RV, Shercliff HR, Withers PJ, Smith S. Physically-based constitutive modelling of residual stress development in welding of aluminium alloy 2024. Acta Mater 2004;52:4973–83. doi:10.1016/j.actamat.2004.06.048.
[35] Chen YC, Feng JC, Liu HJ. Precipitate evolution in friction stir welding of 2219-T6 aluminum alloys. Mater Charact 2009;60:476–81. doi:10.1016/j.matchar.2008.12.002.
[36] Reynolds AP, Duvall F. Digital image correlation for determination of weld and base metal constitutive behavior. Weld J 1999;78:355s – 360s.
[37] Shore RJ, McCauley RB. Effects of Porosity on High Strength Aluminum 7039. Weld J 1970;7:311s – 321s.