effect of gic on power transformers & power … presentation at...gic has caused, and would...
TRANSCRIPT
© ABB Group 2013
Dr. Ramsis Girgis and Kiran Vedante;ABB Power Transformers; St. Louis , MO
Effect of GIC on Power Transformers &Power Systems
PSRC MeetingMay 14, 2014
© ABB Group 2013 - Slide 2
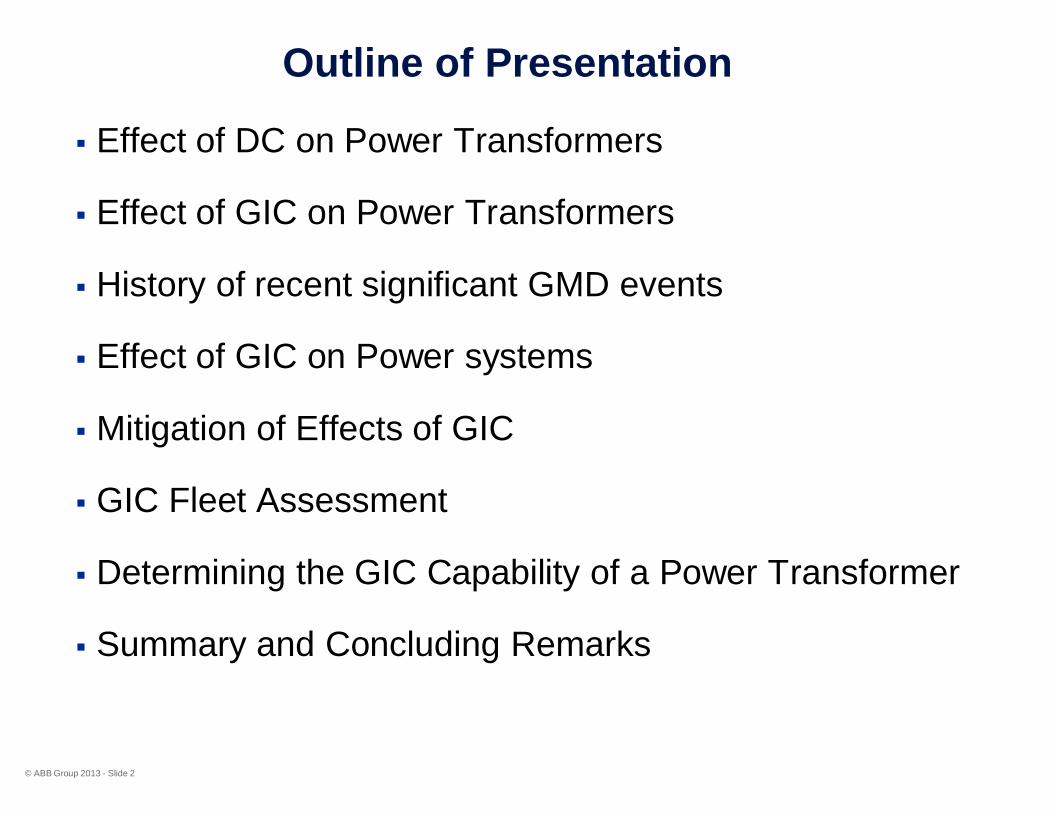
Outline of Presentation
§ Effect of DC on Power Transformers
§ Effect of GIC on Power Transformers
§ History of recent significant GMD events
§ Effect of GIC on Power systems
§ Mitigation of Effects of GIC
§ GIC Fleet Assessment
§ Determining the GIC Capability of a Power Transformer
§ Summary and Concluding Remarks
© ABB Group 2013 - Slide 3
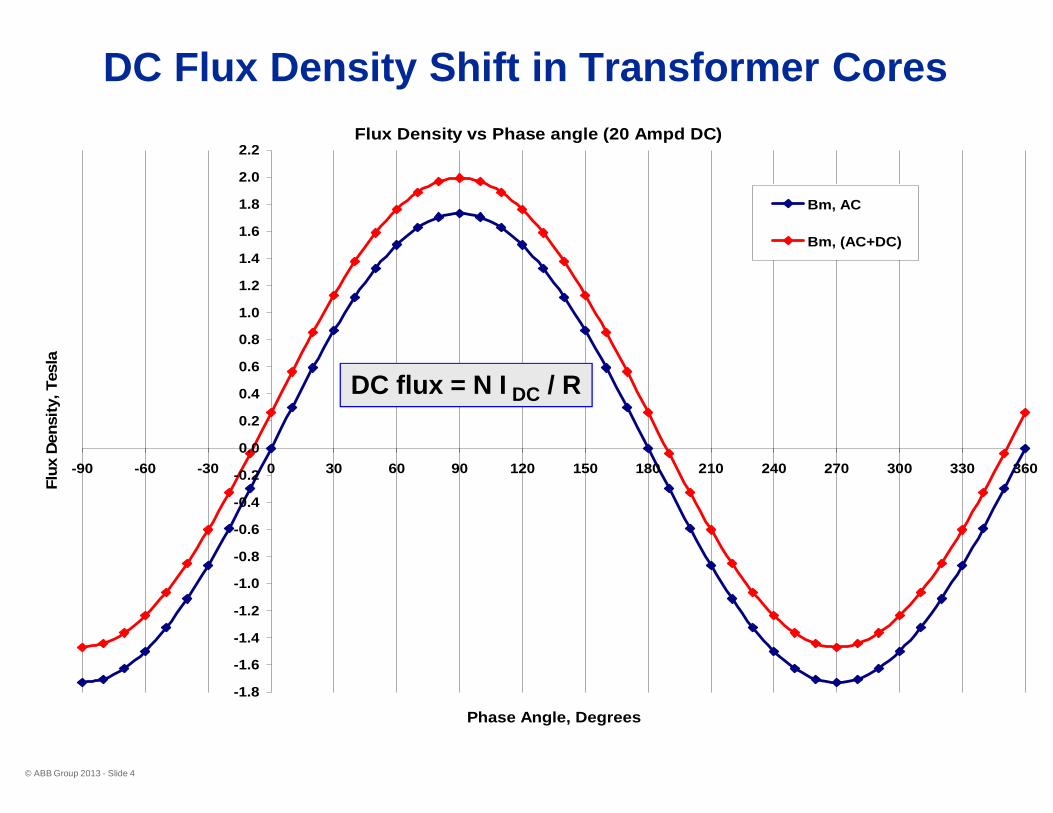
DC Flux Density Shift in Transformer CoresFlux Density vs Phase angle (20 Ampd DC)
-1.8
-1.6
-1.4
-1.2
-1.0
-0.8
-0.6
-0.4
-0.2
0.0
0.2
0.4
0.6
0.8
1.0
1.2
1.4
1.6
1.8
2.0
2.2
-90 -60 -30 0 30 60 90 120 150 180 210 240 270 300 330 360
Phase Angle, Degrees
Flux
Den
sity
,Tes
la
Bm, AC
Bm, (AC+DC)
DC flux = N I DC / R
© ABB Group 2013 - Slide 4
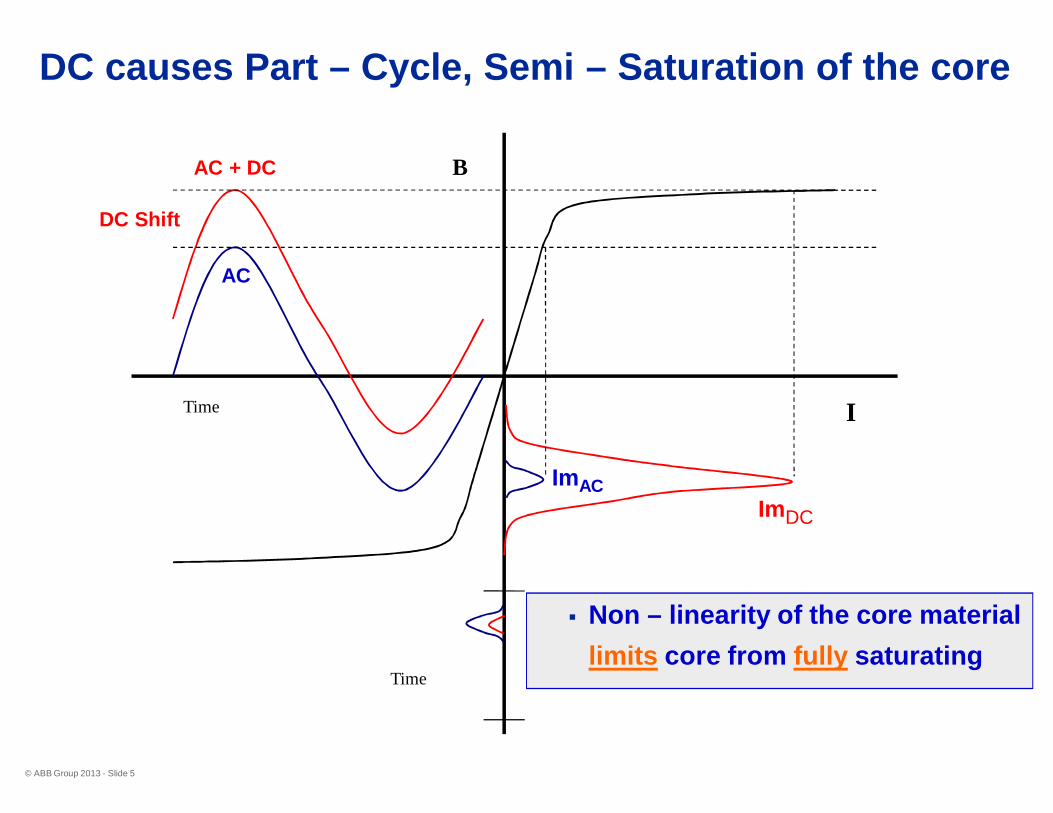
DC causes Part – Cycle, Semi – Saturation of the core
Time I
B
Time
DC Shift
AC + DC
ImDC
AC
ImAC
§ Non – linearity of the core materiallimits core from fully saturating
© ABB Group 2013 - Slide 5
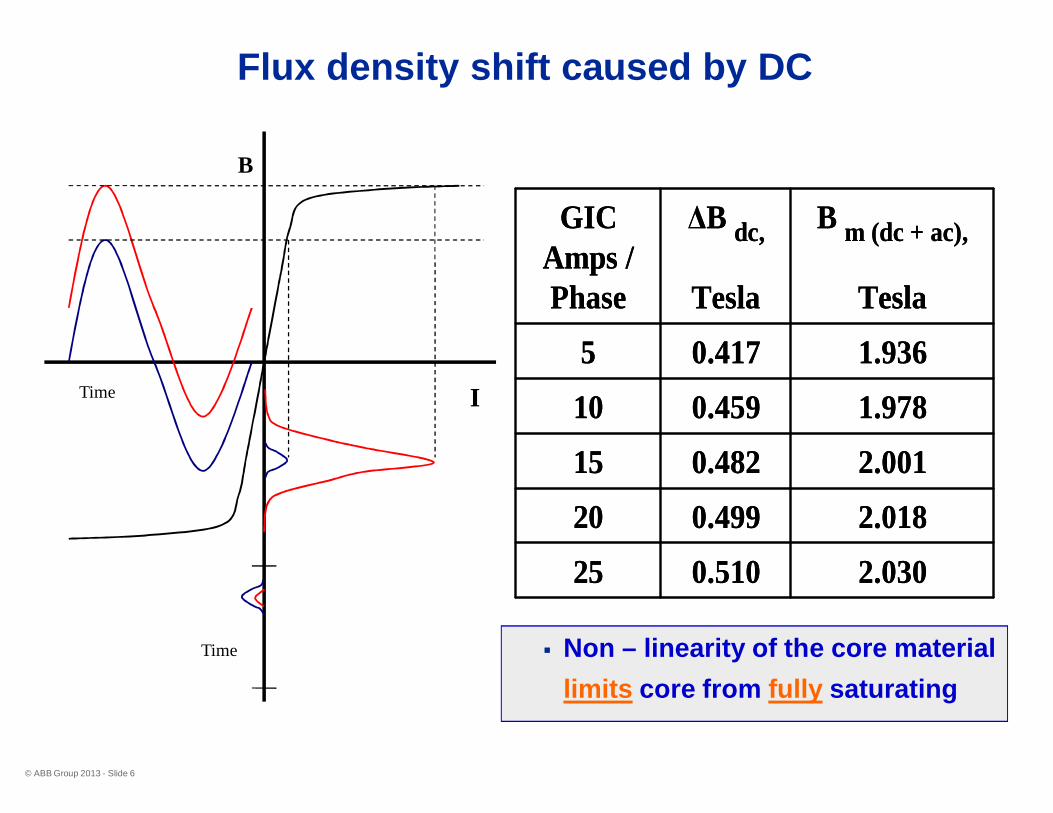
Flux density shift caused by DC
Time I
B
Time
© ABB Group 2013 - Slide 6
2.0300.510252.0180.499202.0010.482151.9780.459101.9360.4175
B m (dc + ac),
Tesla
ΔB dc,
Tesla
GICAmps /Phase
2.0300.510252.0180.499202.0010.482151.9780.459101.9360.4175
B m (dc + ac),
Tesla
ΔB dc,
Tesla
GICAmps /Phase
§ Non – linearity of the core materiallimits core from fully saturating

Magnetizing current pulse caused by DC / GIC% Exciting Current - 1 phase transformer - 20 Amps DC
0%
5%
10%
15%
20%
25%
30%
35%
40%
-90 -60 -30 0 30 60 90 120 150 180 210 240 270Degrees
Exci
ting
curr
ent,
%of
Load
Cuu
rent
© ABB Group 2013 - Slide 7
• High – Peak pulse
• One per Cycle
• Small mean – width
ú 1/8th – 1/12th of Cycle
§ RMS = 15 – 20 % of peak
§ Calculated using integration
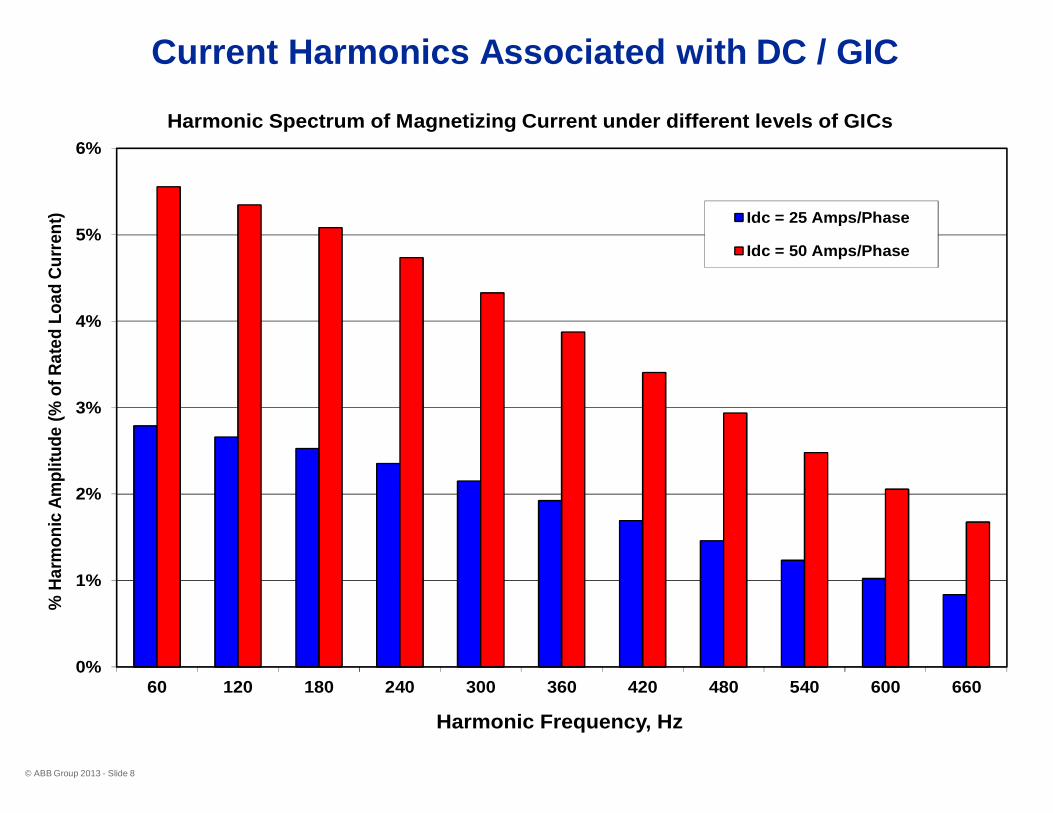
Current Harmonics Associated with DC / GIC
© ABB Group 2013 - Slide 8
0%
1%
2%
3%
4%
5%
6%
60 120 180 240 300 360 420 480 540 600 660
%Ha
rmon
icAm
plitu
de(%
ofRa
ted
Load
Curr
ent)
Harmonic Frequency, Hz
Harmonic Spectrum of Magnetizing Current under different levels of GICs
Idc = 25 Amps/Phase
Idc = 50 Amps/Phase
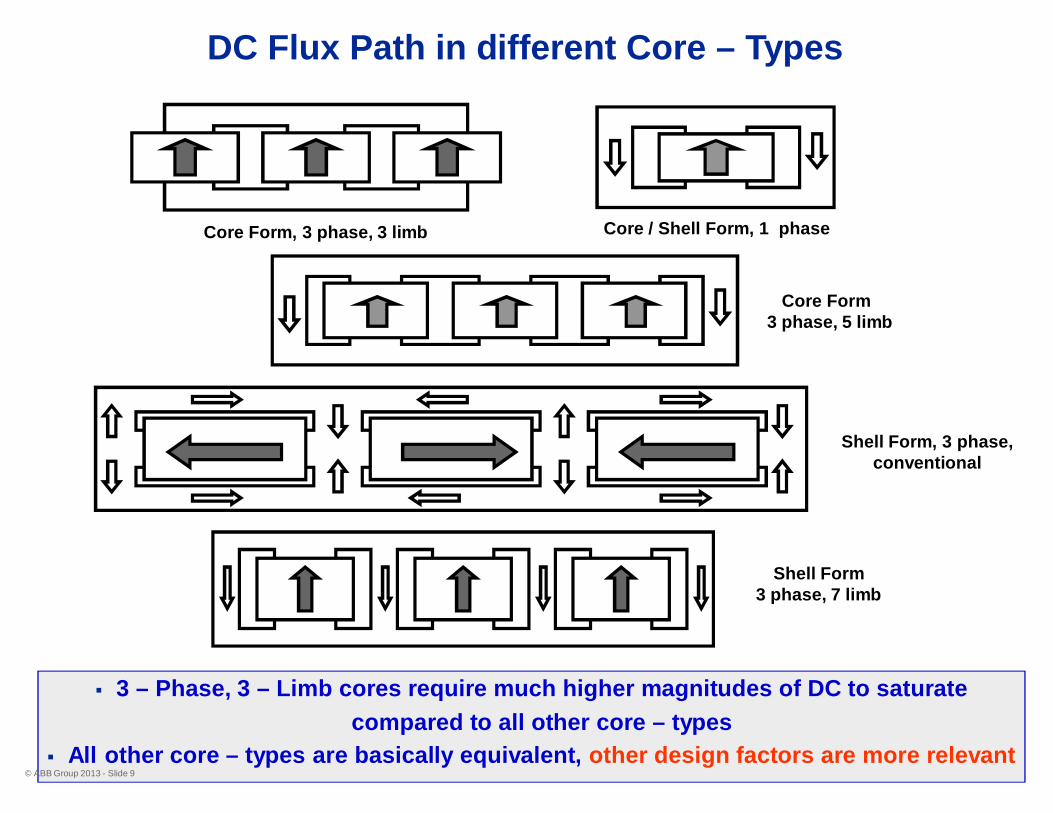
DC Flux Path in different Core – Types
Core / Shell Form, 1 phaseCore Form, 3 phase, 3 limb
Core Form3 phase, 5 limb
Shell Form, 3 phase,conventional
Shell Form3 phase, 7 limb
§ 3 – Phase, 3 – Limb cores require much higher magnitudes of DC to saturatecompared to all other core – types
§ All other core – types are basically equivalent, other design factors are more relevant© ABB Group 2013 - Slide 9
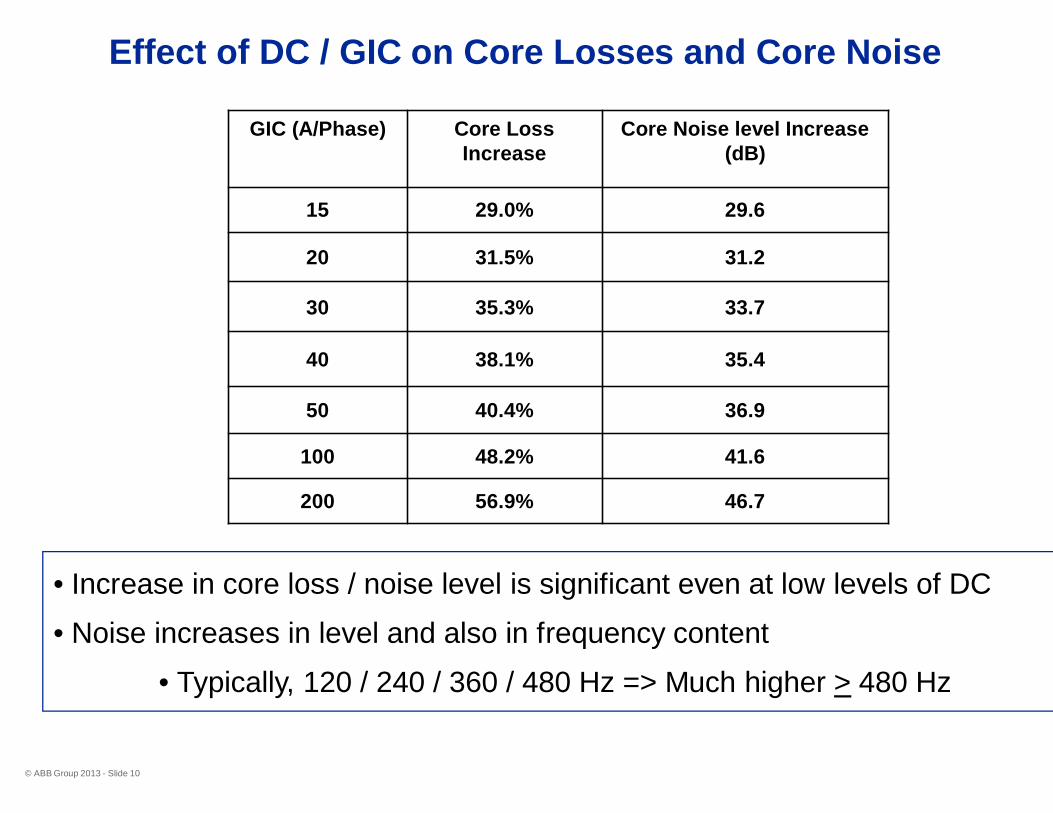
Effect of DC / GIC on Core Losses and Core Noise
© ABB Group 2013 - Slide 10
• Increase in core loss / noise level is significant even at low levels of DC
• Noise increases in level and also in frequency content
• Typically, 120 / 240 / 360 / 480 Hz => Much higher > 480 Hz
GIC (A/Phase) Core LossIncrease
Core Noise level Increase(dB)
15 29.0% 29.6
20 31.5% 31.2
30 35.3% 33.7
40 38.1% 35.4
50 40.4% 36.9
100 48.2% 41.6
200 56.9% 46.7
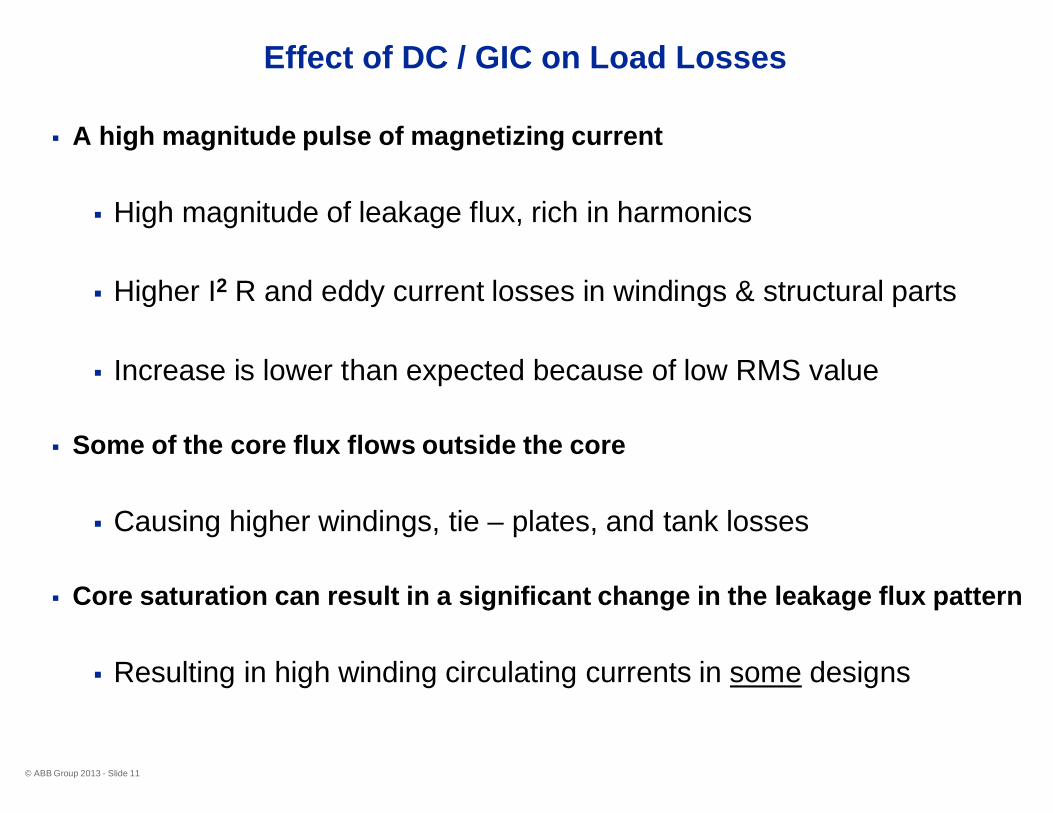
§ A high magnitude pulse of magnetizing current
§ High magnitude of leakage flux, rich in harmonics
§ Higher I2 R and eddy current losses in windings & structural parts
§ Increase is lower than expected because of low RMS value
§ Some of the core flux flows outside the core
§ Causing higher windings, tie – plates, and tank losses
§ Core saturation can result in a significant change in the leakage flux pattern
§ Resulting in high winding circulating currents in some designs
Effect of DC / GIC on Load Losses
© ABB Group 2013 - Slide 11
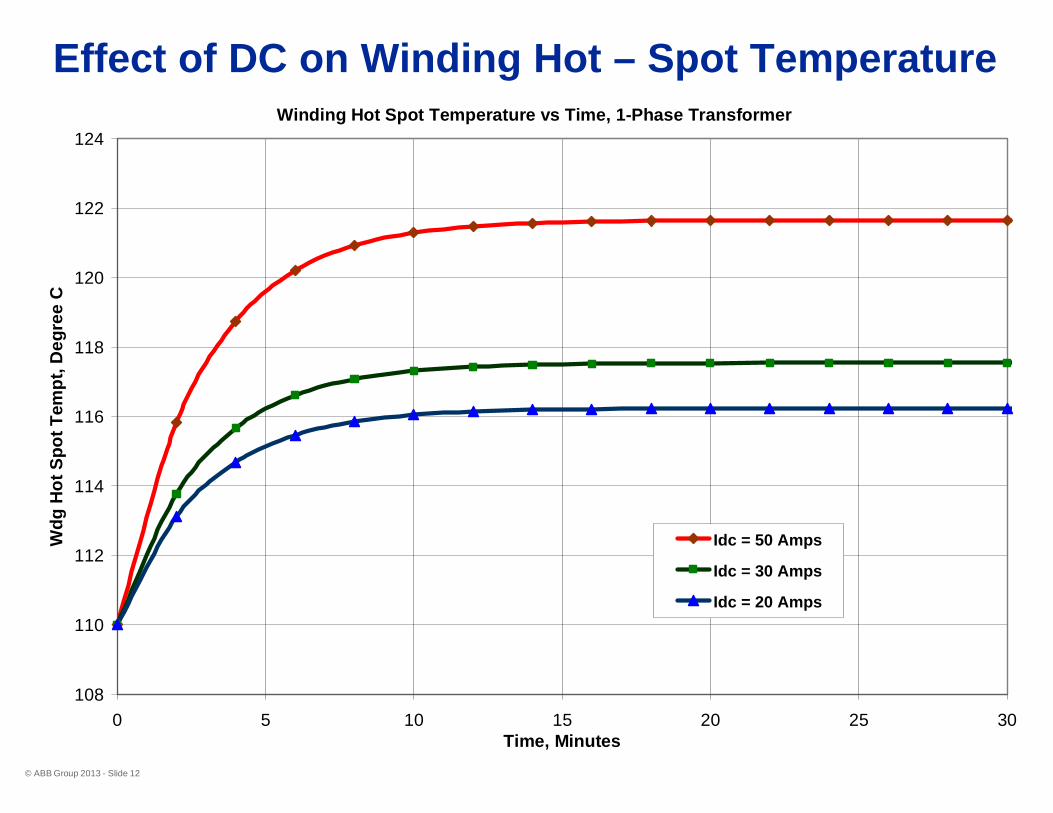
Effect of DC on Winding Hot – Spot TemperatureWinding Hot Spot Temperature vs Time, 1-Phase Transformer
108
110
112
114
116
118
120
122
124
0 5 10 15 20 25 30Time, Minutes
Wdg
Hot
Spot
Tem
pt,D
egre
eC
Idc = 50 Amps
Idc = 30 Amps
Idc = 20 Amps
© ABB Group 2013 - Slide 12
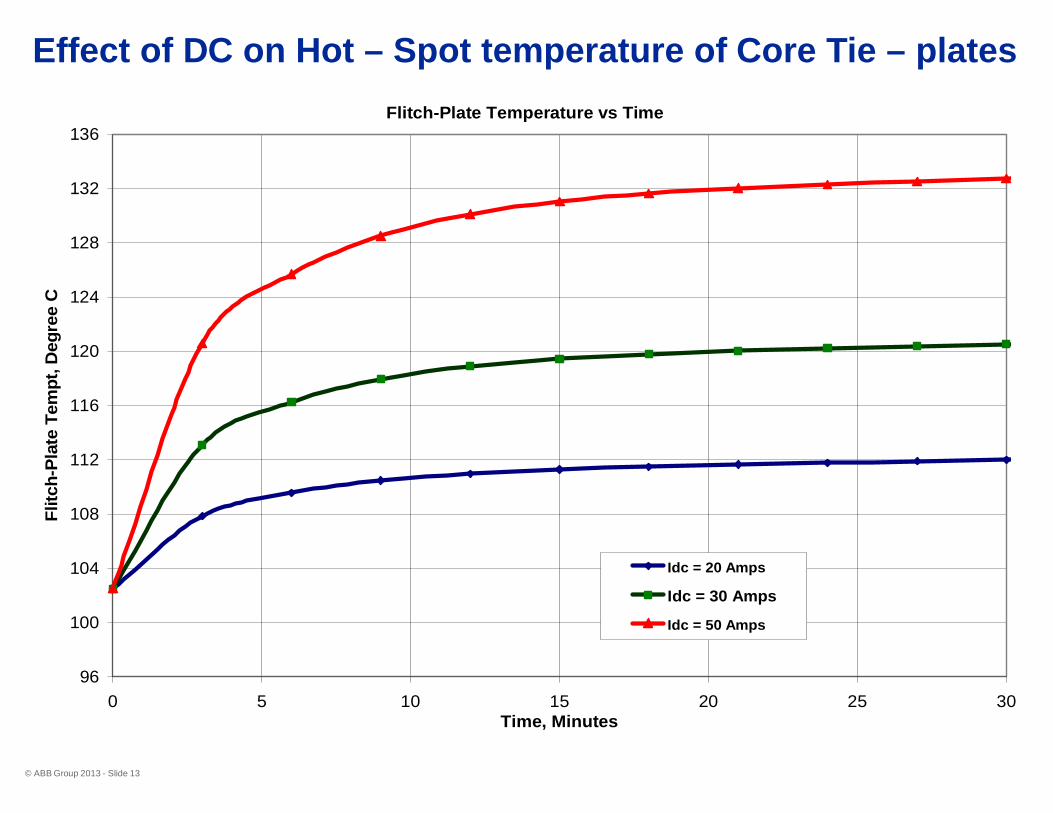
Effect of DC on Hot – Spot temperature of Core Tie – platesFlitch-Plate Temperature vs Time
96
100
104
108
112
116
120
124
128
132
136
0 5 10 15 20 25 30Time, Minutes
Flitc
h-Pl
ate
Tem
pt,D
egre
eC
Idc = 20 Amps
Idc = 30 Amps
Idc = 50 Amps
© ABB Group 2013 - Slide 13
© ABB Group 2013 - Slide 14
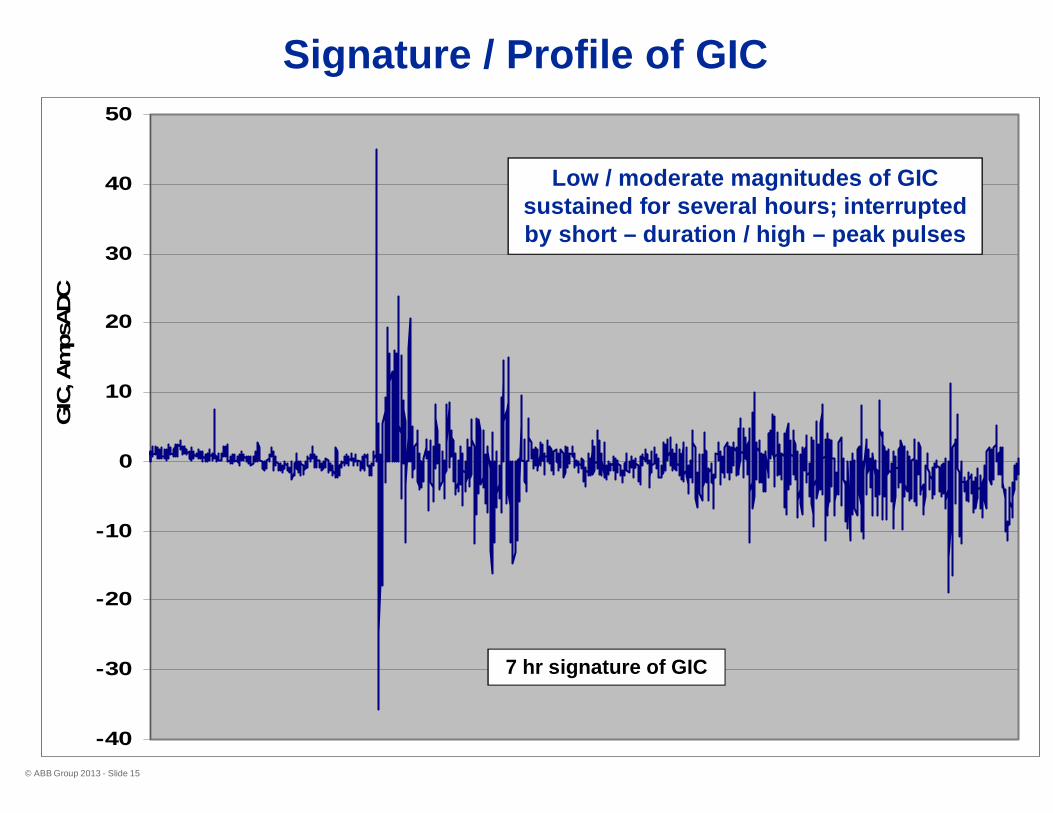
Signature / Profile of GIC
© ABB Group 2013 - Slide 15
-40
-30
-20
-10
0
10
20
30
40
50
GIC
,Am
psA
DC
Low / moderate magnitudes of GICsustained for several hours; interruptedby short – duration / high – peak pulses
7 hr signature of GIC
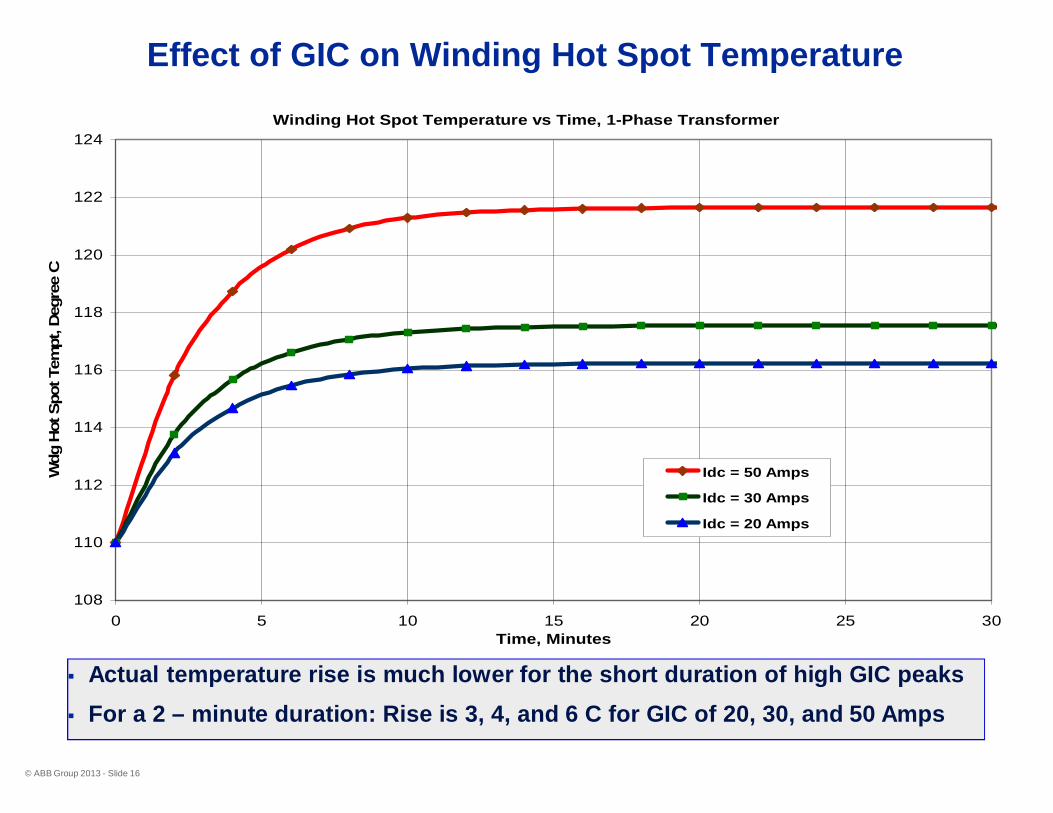
Effect of GIC on Winding Hot Spot Temperature
Winding Hot Spot Temperature vs Time, 1-Phase Transformer
108
110
112
114
116
118
120
122
124
0 5 10 15 20 25 30Time, Minutes
Wdg
Hot
Spot
Tem
pt,D
egre
eC
Idc = 50 Amps
Idc = 30 Amps
Idc = 20 Amps
§ Actual temperature rise is much lower for the short duration of high GIC peaks§ For a 2 – minute duration: Rise is 3, 4, and 6 C for GIC of 20, 30, and 50 Amps
© ABB Group 2013 - Slide 16
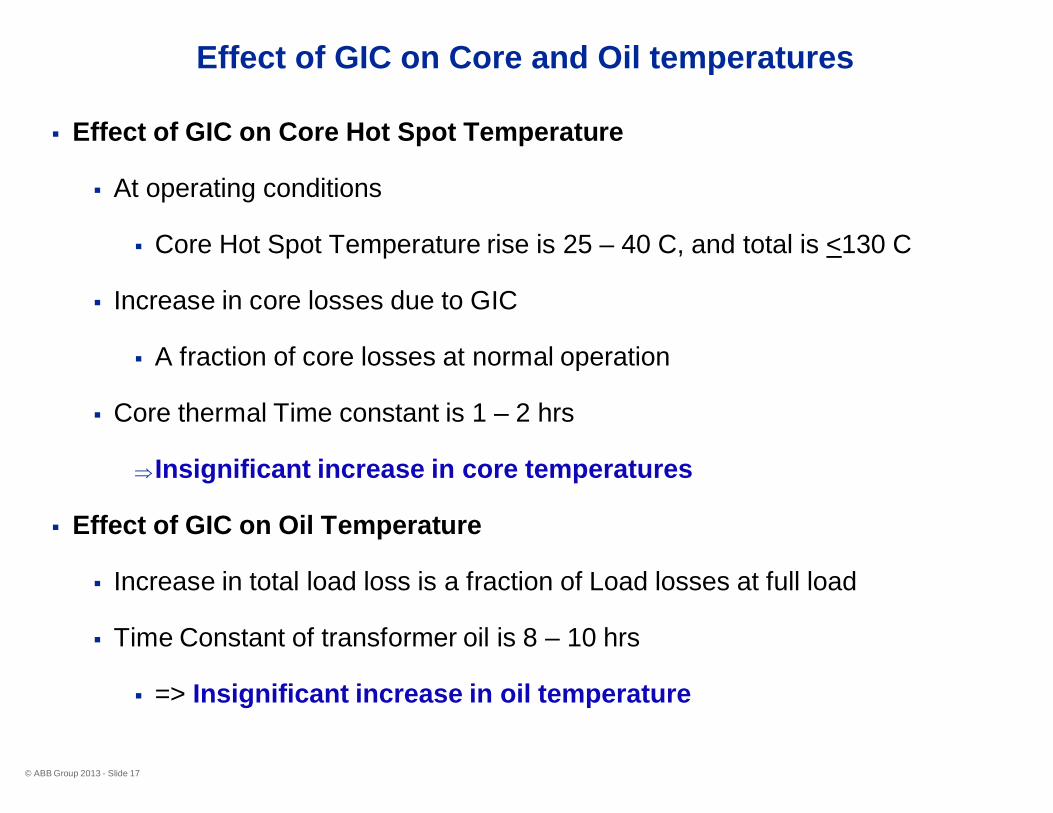
§ Effect of GIC on Core Hot Spot Temperature
§ At operating conditions
§ Core Hot Spot Temperature rise is 25 – 40 C, and total is <130 C
§ Increase in core losses due to GIC
§ A fraction of core losses at normal operation
§ Core thermal Time constant is 1 – 2 hrs
ÞInsignificant increase in core temperatures
§ Effect of GIC on Oil Temperature
§ Increase in total load loss is a fraction of Load losses at full load
§ Time Constant of transformer oil is 8 – 10 hrs
§ => Insignificant increase in oil temperature
Effect of GIC on Core and Oil temperatures
© ABB Group 2013 - Slide 17
© ABB Group 2013 - Slide 18
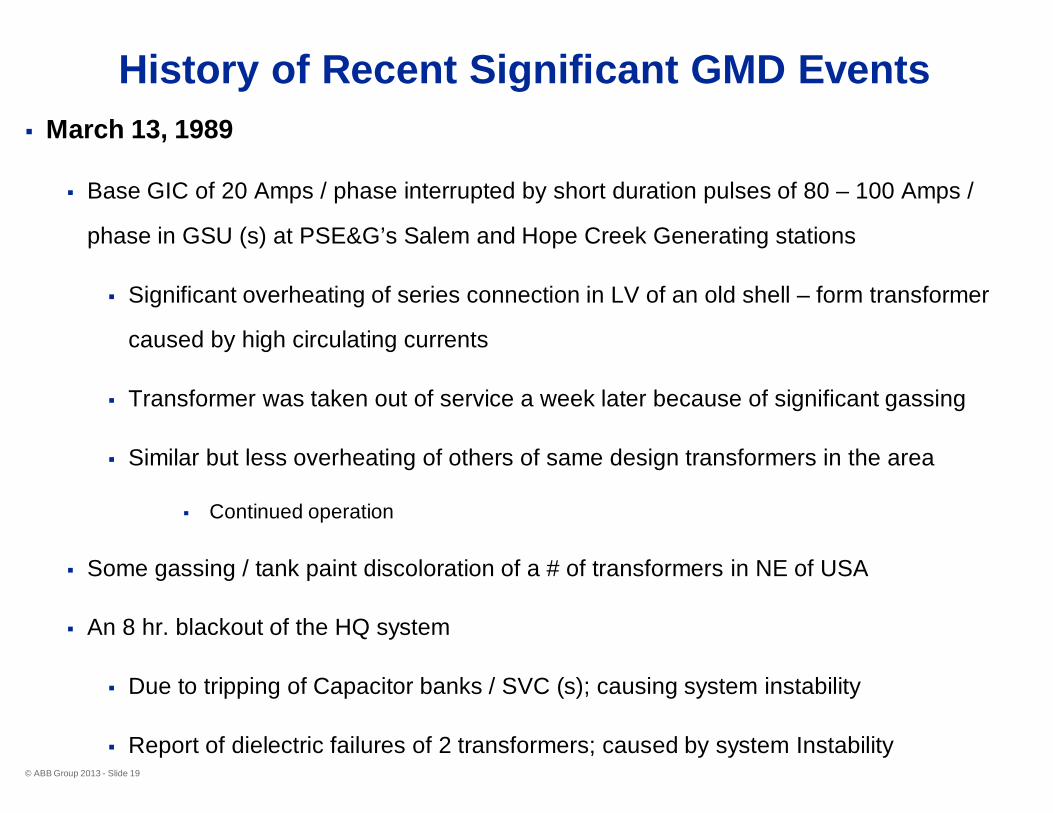
History of Recent Significant GMD Events§ March 13, 1989
§ Base GIC of 20 Amps / phase interrupted by short duration pulses of 80 – 100 Amps /
phase in GSU (s) at PSE&G’s Salem and Hope Creek Generating stations
§ Significant overheating of series connection in LV of an old shell – form transformer
caused by high circulating currents
§ Transformer was taken out of service a week later because of significant gassing
§ Similar but less overheating of others of same design transformers in the area
§ Continued operation
§ Some gassing / tank paint discoloration of a # of transformers in NE of USA
§ An 8 hr. blackout of the HQ system
§ Due to tripping of Capacitor banks / SVC (s); causing system instability
§ Report of dielectric failures of 2 transformers; caused by system Instability© ABB Group 2013 - Slide 19
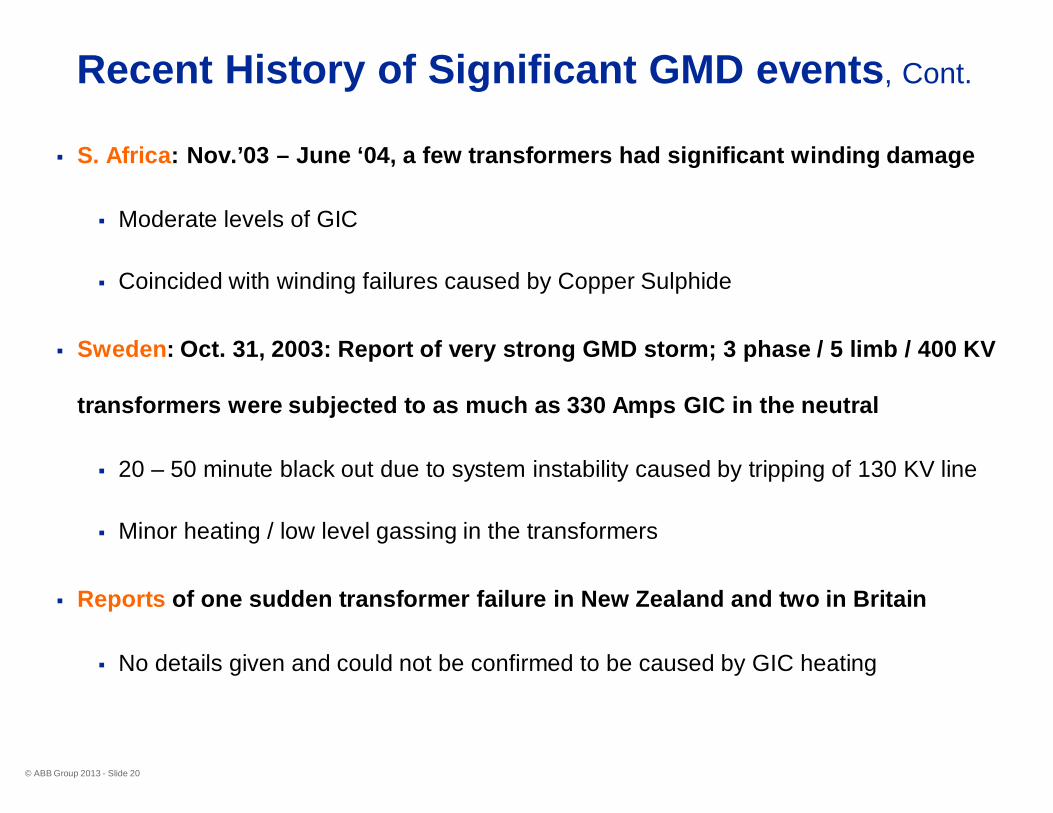
Recent History of Significant GMD events, Cont.
§ S. Africa: Nov.’03 – June ‘04, a few transformers had significant winding damage
§ Moderate levels of GIC
§ Coincided with winding failures caused by Copper Sulphide
§ Sweden: Oct. 31, 2003: Report of very strong GMD storm; 3 phase / 5 limb / 400 KV
transformers were subjected to as much as 330 Amps GIC in the neutral
§ 20 – 50 minute black out due to system instability caused by tripping of 130 KV line
§ Minor heating / low level gassing in the transformers
§ Reports of one sudden transformer failure in New Zealand and two in Britain
§ No details given and could not be confirmed to be caused by GIC heating
© ABB Group 2013 - Slide 20
© ABB 2011June 9, 2011 | Slide 21
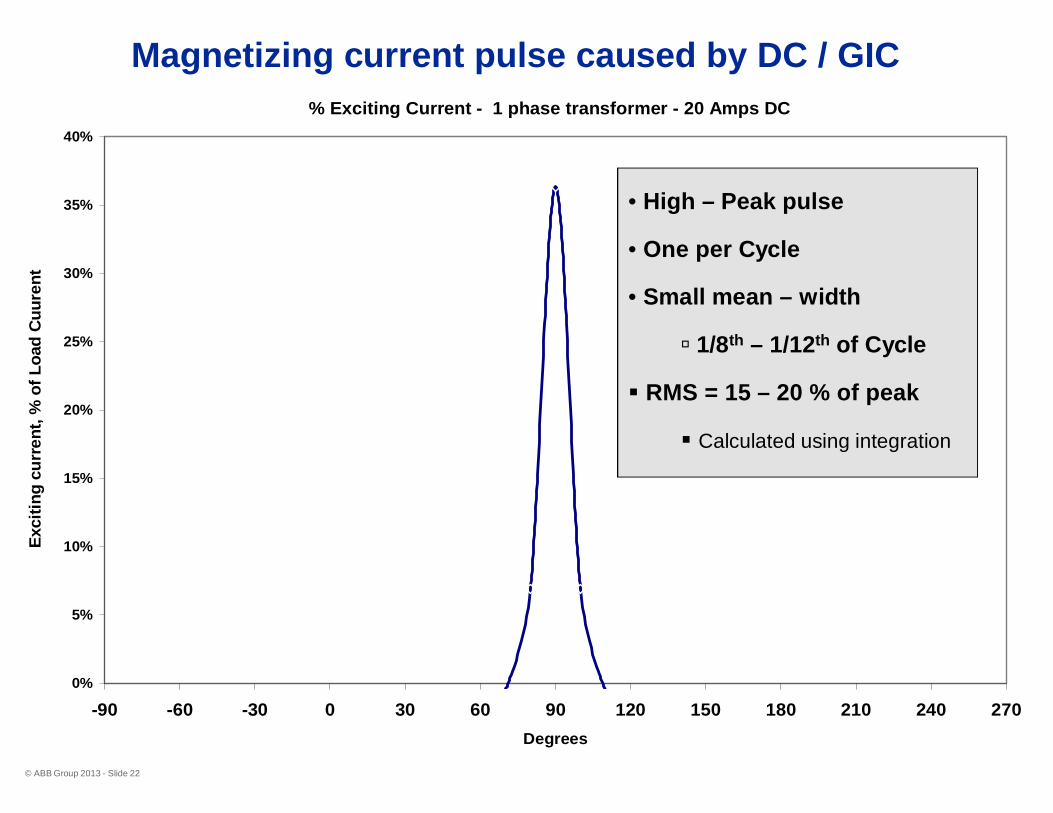
Magnetizing current pulse caused by DC / GIC% Exciting Current - 1 phase transformer - 20 Amps DC
0%
5%
10%
15%
20%
25%
30%
35%
40%
-90 -60 -30 0 30 60 90 120 150 180 210 240 270Degrees
Exci
ting
curr
ent,
%of
Load
Cuu
rent
© ABB Group 2013 - Slide 22
• High – Peak pulse
• One per Cycle
• Small mean – width
ú 1/8th – 1/12th of Cycle
§ RMS = 15 – 20 % of peak
§ Calculated using integration
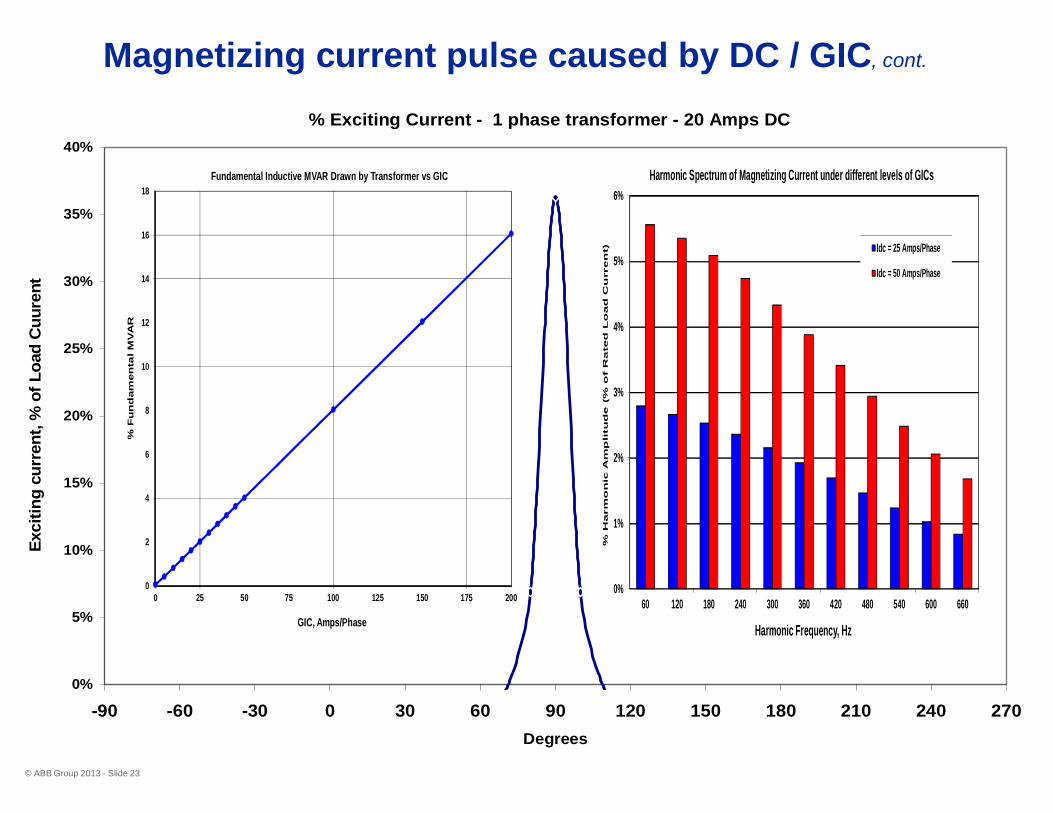
Magnetizing current pulse caused by DC / GIC, cont.
% Exciting Current - 1 phase transformer - 20 Amps DC
0%
5%
10%
15%
20%
25%
30%
35%
40%
-90 -60 -30 0 30 60 90 120 150 180 210 240 270Degrees
Exci
ting
curr
ent,
%of
Load
Cuu
rent
© ABB Group 2013 - Slide 23
0%
1%
2%
3%
4%
5%
6%
60 120 180 240 300 360 420 480 540 600 660%
Harm
on
icA
mp
litu
de
(%o
fR
ate
dL
oad
Cu
rren
t)
Harmonic Frequency, Hz
Harmonic Spectrum of Magnetizing Current under different levels of GICs
Idc = 25 Amps/Phase
Idc = 50 Amps/Phase
0
2
4
6
8
10
12
14
16
18
0 25 50 75 100 125 150 175 200
%F
un
dam
en
talM
VA
R
GIC, Amps/Phase
Fundamental Inductive MVAR Drawn by Transformer vs GIC
Effect of GIC on power systems
§ Causes a high magnitude current pulse of ~ 2 msec. duration to
flow in the system (once / cycle)
§ This pulse causes the capacitive components on the system,
such as static compensators, etc. to increase their currents and
may become overloaded and trip, causing grid instability
§ The current pulse is associated with high order harmonics:
§ Electrical resonance may occur and stability of the grid may becompromised.
§ Other harmonics can cause relay miss – operation
§ Low % of 2nd order harmonic could send the wrong message offault current to the differential relays
© ABB 2011June 9, 2011 | Slide 25
© ABB 2011June 9, 2011 | Slide 26
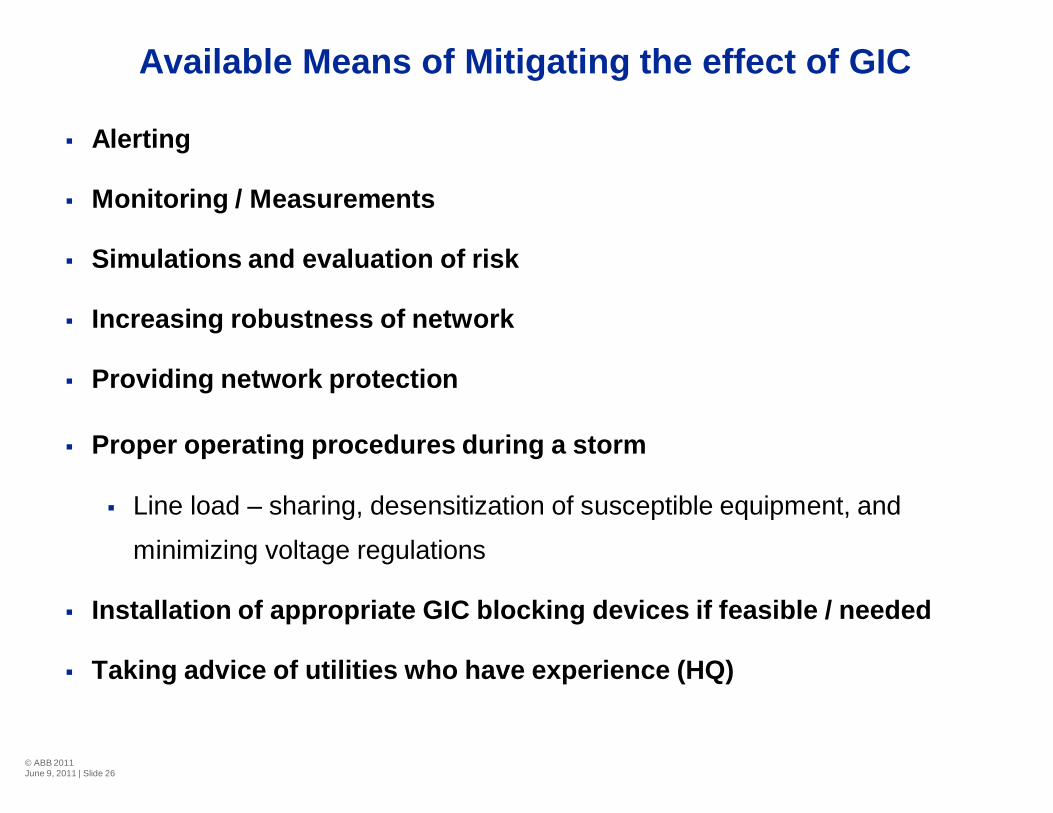
Available Means of Mitigating the effect of GIC
§ Alerting
§ Monitoring / Measurements
§ Simulations and evaluation of risk
§ Increasing robustness of network
§ Providing network protection
§ Proper operating procedures during a storm
§ Line load – sharing, desensitization of susceptible equipment, and
minimizing voltage regulations
§ Installation of appropriate GIC blocking devices if feasible / needed
§ Taking advice of utilities who have experience (HQ)
© ABB 2011June 9, 2011 | Slide 27
© ABB 2011June 9, 2011 | Slide 28
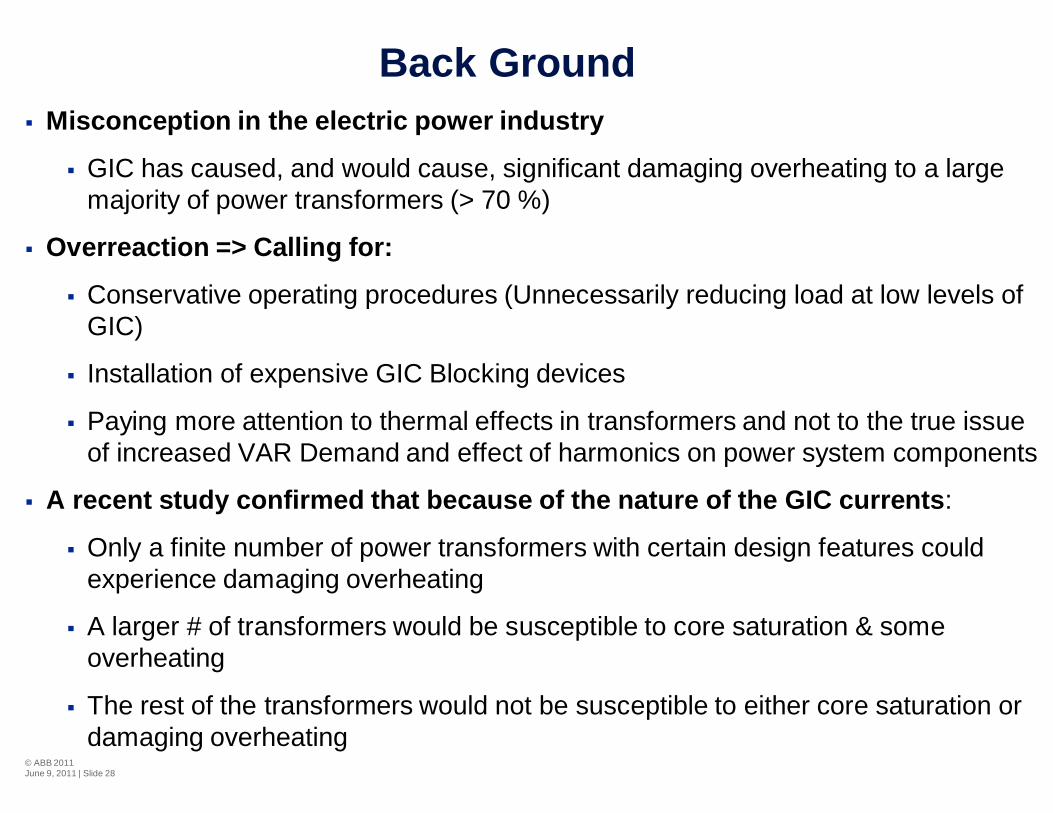
Back Ground§ Misconception in the electric power industry
§ GIC has caused, and would cause, significant damaging overheating to a largemajority of power transformers (> 70 %)
§ Overreaction => Calling for:
§ Conservative operating procedures (Unnecessarily reducing load at low levels ofGIC)
§ Installation of expensive GIC Blocking devices
§ Paying more attention to thermal effects in transformers and not to the true issueof increased VAR Demand and effect of harmonics on power system components
§ A recent study confirmed that because of the nature of the GIC currents:
§ Only a finite number of power transformers with certain design features couldexperience damaging overheating
§ A larger # of transformers would be susceptible to core saturation & someoverheating
§ The rest of the transformers would not be susceptible to either core saturation ordamaging overheating
© ABB 2011June 9, 2011 | Slide 29
Purpose of Fleet Assessment
§ To Determine which Transformers:
§ Would be susceptible to damaging overheating
§ Would be susceptible to only core saturation & moderate overheating
§ Would have a low level of susceptibility to either effects of GIC
§ Would not be susceptible to effects of GIC
© ABB 2011June 9, 2011 | Slide 30
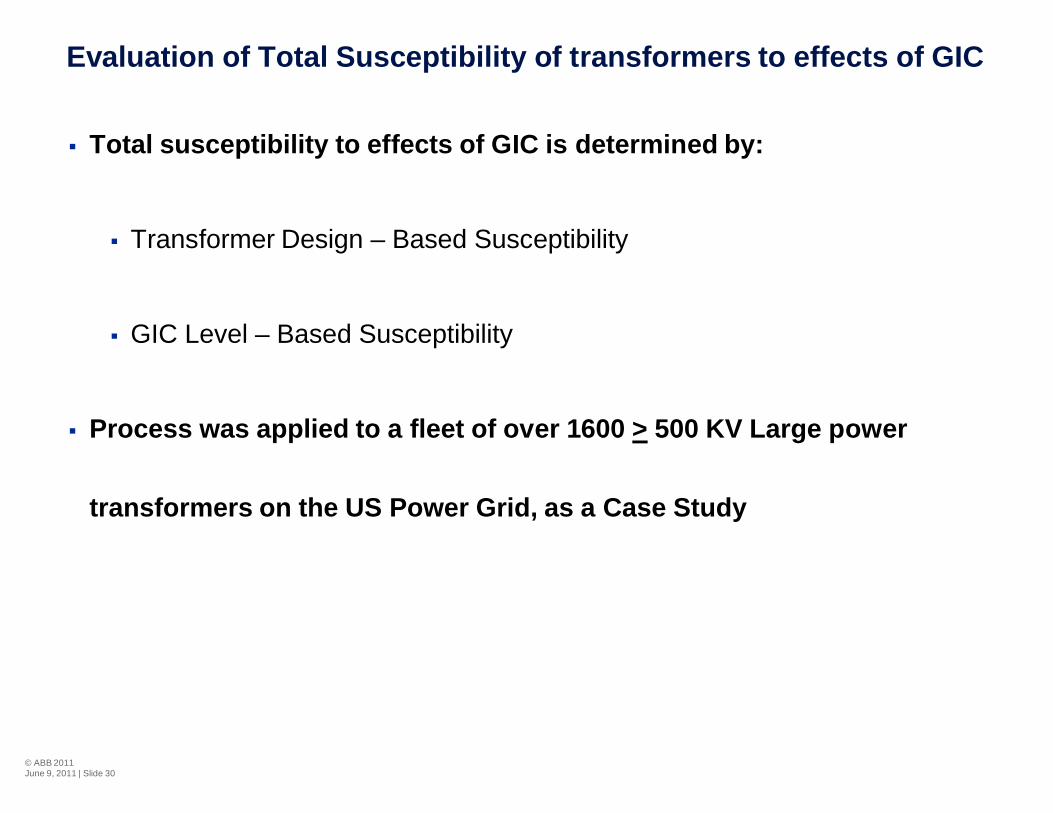
Evaluation of Total Susceptibility of transformers to effects of GIC
§ Total susceptibility to effects of GIC is determined by:
§ Transformer Design – Based Susceptibility
§ GIC Level – Based Susceptibility
§ Process was applied to a fleet of over 1600 > 500 KV Large power
transformers on the US Power Grid, as a Case Study
© ABB 2011June 9, 2011 | Slide 31
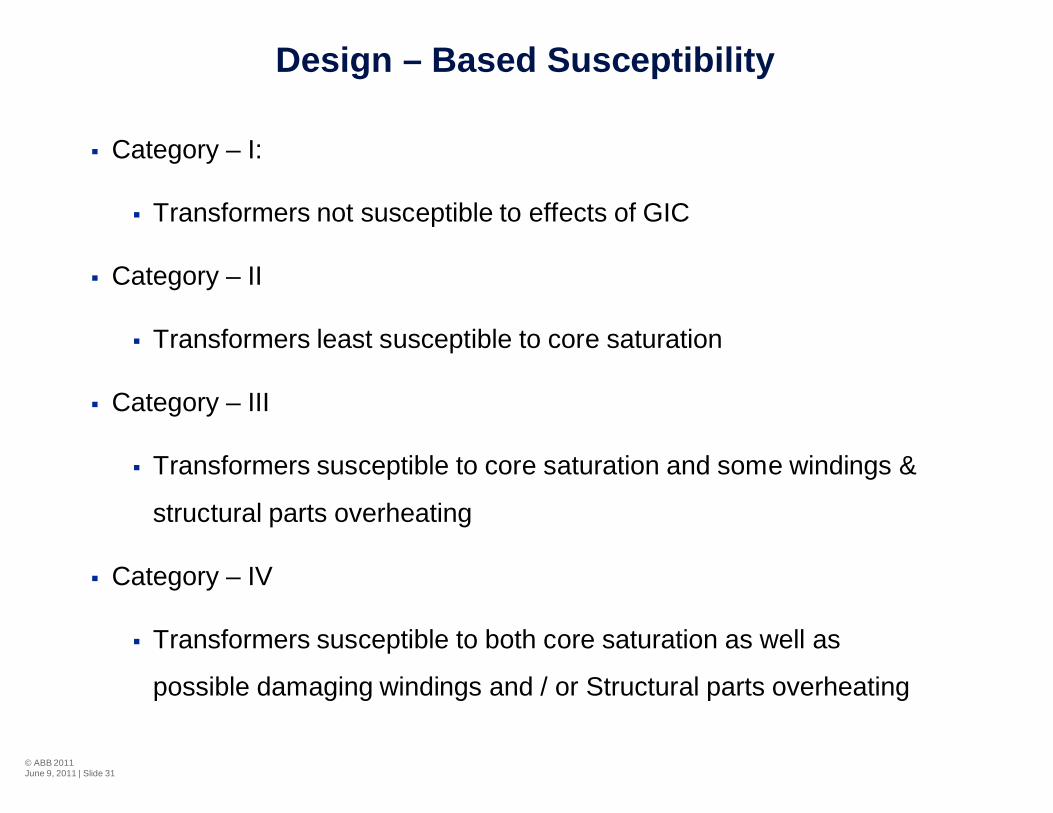
Design – Based Susceptibility
§ Category – I:
§ Transformers not susceptible to effects of GIC
§ Category – II
§ Transformers least susceptible to core saturation
§ Category – III
§ Transformers susceptible to core saturation and some windings &
structural parts overheating
§ Category – IV
§ Transformers susceptible to both core saturation as well as
possible damaging windings and / or Structural parts overheating
© ABB 2011June 9, 2011 | Slide 32
Parameters Used for Evaluating Design – Based Susceptibility
§ Voltage Ratings
§ Type of transformer (GSU vs. Auto transformers)
§ Shell-form vs. Core Form
§ Single-phase vs. three-phase and Core-type
§ Winding Connections
© ABB 2011June 9, 2011 | Slide 33
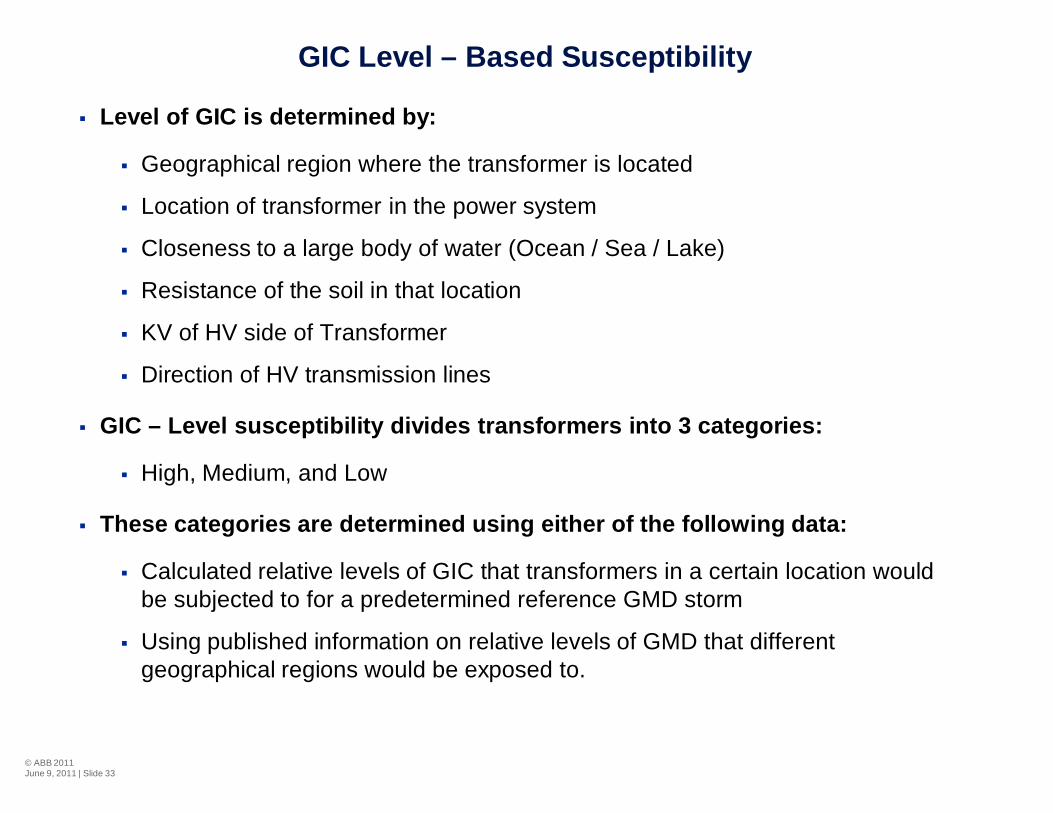
GIC Level – Based Susceptibility
§ Level of GIC is determined by:
§ Geographical region where the transformer is located
§ Location of transformer in the power system
§ Closeness to a large body of water (Ocean / Sea / Lake)
§ Resistance of the soil in that location
§ KV of HV side of Transformer
§ Direction of HV transmission lines
§ GIC – Level susceptibility divides transformers into 3 categories:
§ High, Medium, and Low
§ These categories are determined using either of the following data:
§ Calculated relative levels of GIC that transformers in a certain location wouldbe subjected to for a predetermined reference GMD storm
§ Using published information on relative levels of GMD that differentgeographical regions would be exposed to.
© ABB 2011June 9, 2011 | Slide 34
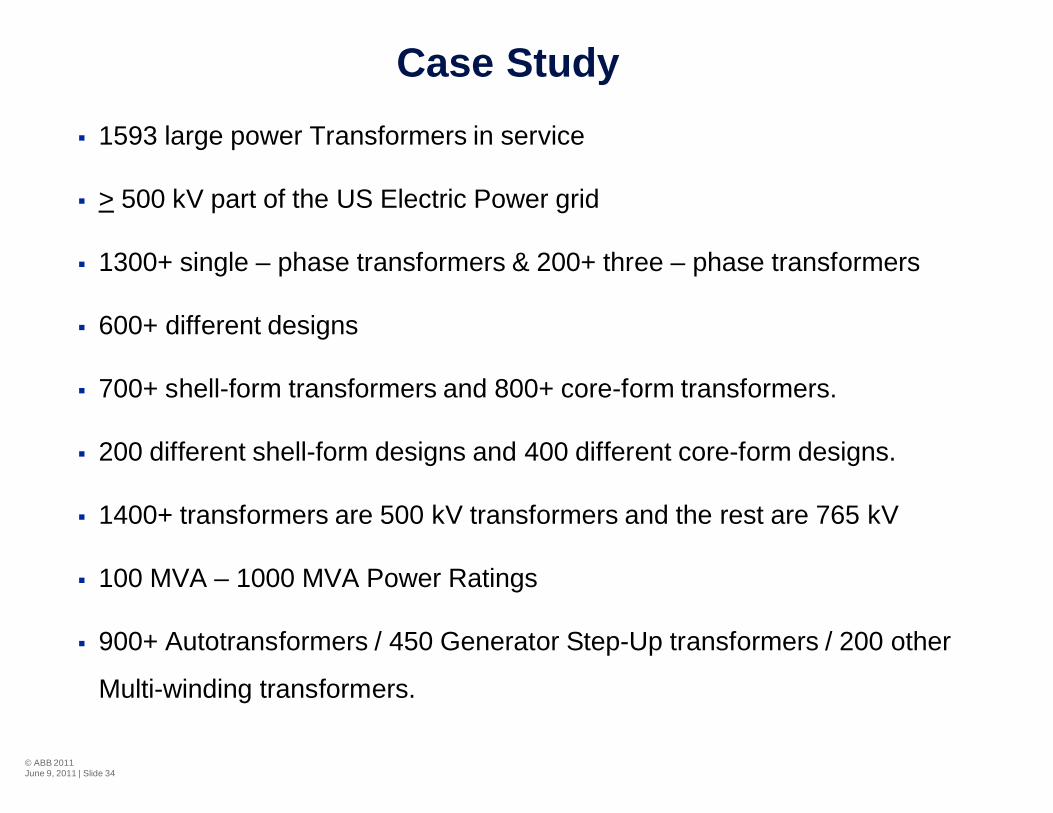
Case Study§ 1593 large power Transformers in service
§ > 500 kV part of the US Electric Power grid
§ 1300+ single – phase transformers & 200+ three – phase transformers
§ 600+ different designs
§ 700+ shell-form transformers and 800+ core-form transformers.
§ 200 different shell-form designs and 400 different core-form designs.
§ 1400+ transformers are 500 kV transformers and the rest are 765 kV
§ 100 MVA – 1000 MVA Power Ratings
§ 900+ Autotransformers / 450 Generator Step-Up transformers / 200 other
Multi-winding transformers.
© ABB 2011June 9, 2011 | Slide 35
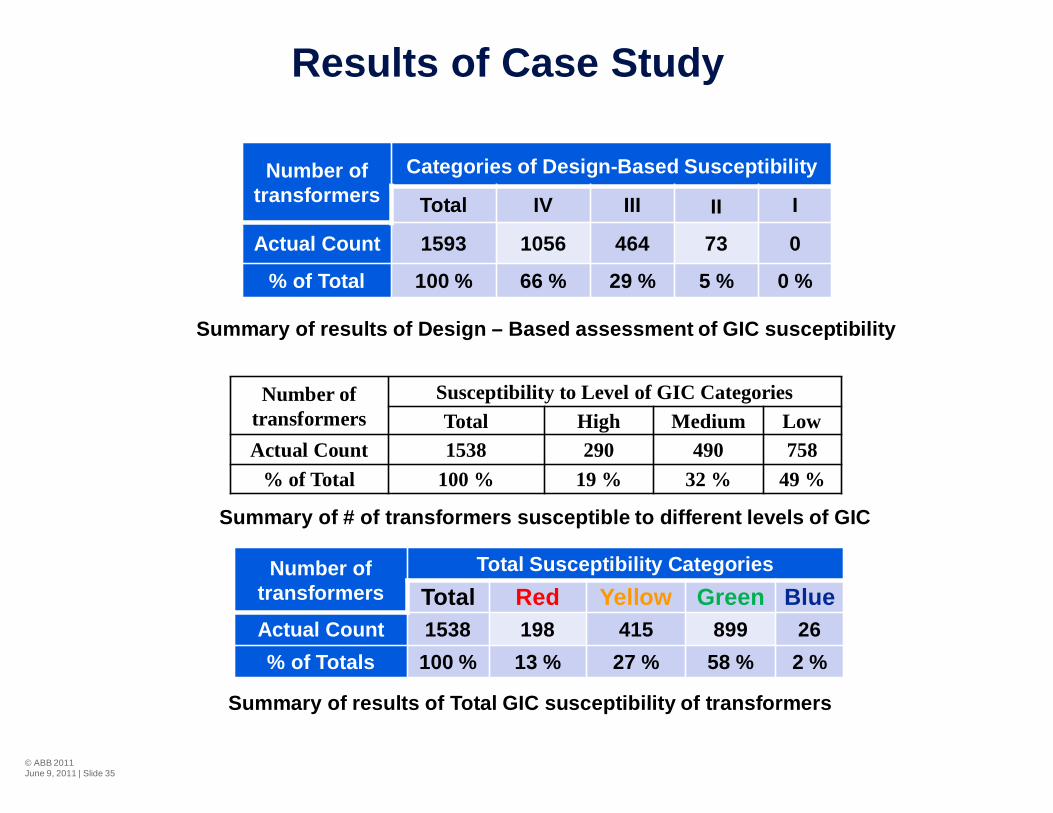
Results of Case Study
Summary of results of Design – Based assessment of GIC susceptibility
Number oftransformers
Categories of Design-Based Susceptibility
Total IV III II I
Actual Count 1593 1056 464 73 0
% of Total 100 % 66 % 29 % 5 % 0 %
Number oftransformers
Susceptibility to Level of GIC CategoriesTotal High Medium Low
Actual Count 1538 290 490 758% of Total 100 % 19 % 32 % 49 %
Summary of # of transformers susceptible to different levels of GIC
Number oftransformers
Total Susceptibility CategoriesTotal Red Yellow Green Blue
Actual Count 1538 198 415 899 26% of Totals 100 % 13 % 27 % 58 % 2 %
Summary of results of Total GIC susceptibility of transformers
© ABB 2011June 9, 2011 | Slide 36
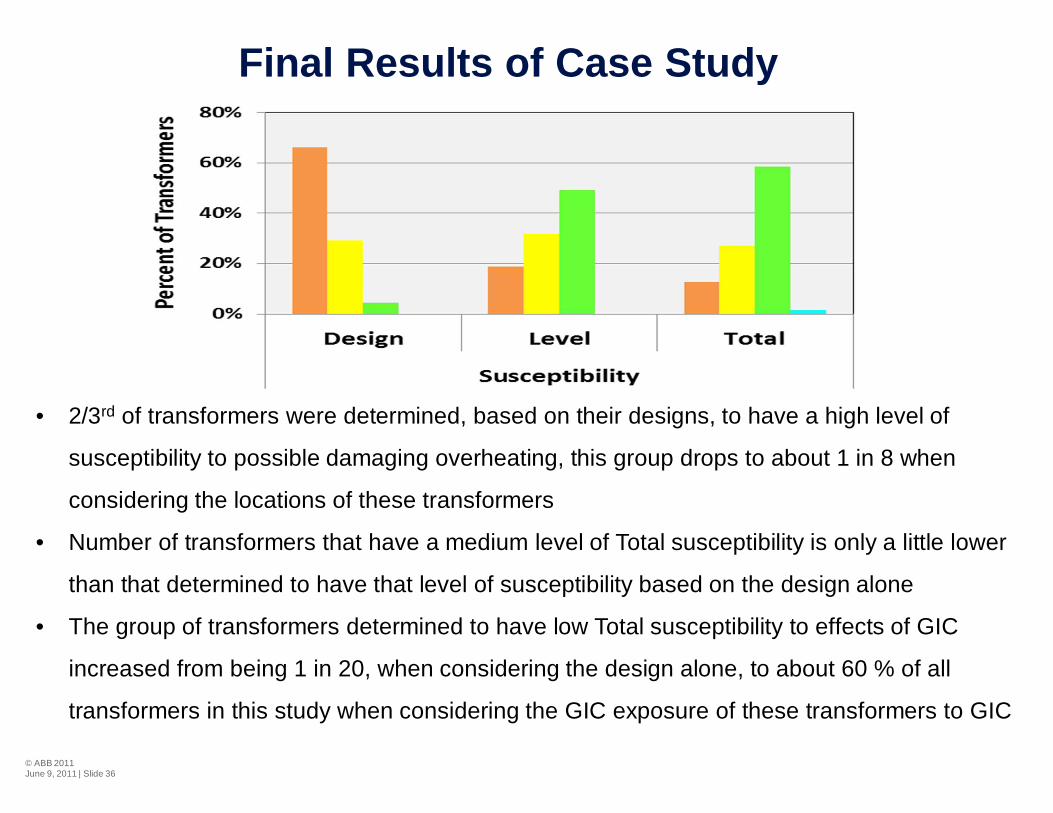
Final Results of Case Study
• 2/3rd of transformers were determined, based on their designs, to have a high level of
susceptibility to possible damaging overheating, this group drops to about 1 in 8 when
considering the locations of these transformers
• Number of transformers that have a medium level of Total susceptibility is only a little lower
than that determined to have that level of susceptibility based on the design alone
• The group of transformers determined to have low Total susceptibility to effects of GIC
increased from being 1 in 20, when considering the design alone, to about 60 % of all
transformers in this study when considering the GIC exposure of these transformers to GIC
© ABB 2011June 9, 2011 | Slide 37
Benefits of Fleet GIC Susceptibility Evaluation
§ Allows Utilities to focus their mitigation / studies effort
§ Utilities could request manufacturers of transformers, identified to be
susceptible to core saturation, to provide data on the additional VAR
consumption and current harmonics as a function of the level of GIC the
transformer would be exposed to
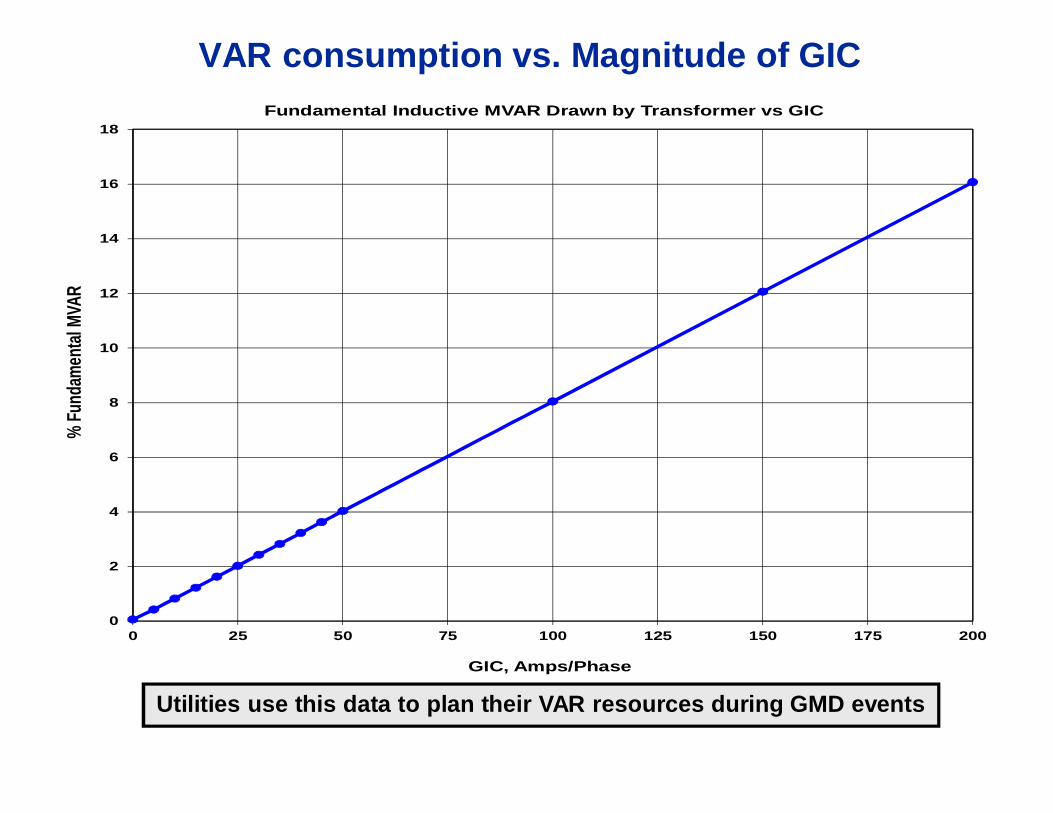
VAR consumption vs. Magnitude of GIC
Utilities use this data to plan their VAR resources during GMD events
0
2
4
6
8
10
12
14
16
18
0 25 50 75 100 125 150 175 200
%Fu
ndam
ental
MVAR
GIC, Amps/Phase
Fundamental Inductive MVAR Drawn by Transformer vs GIC
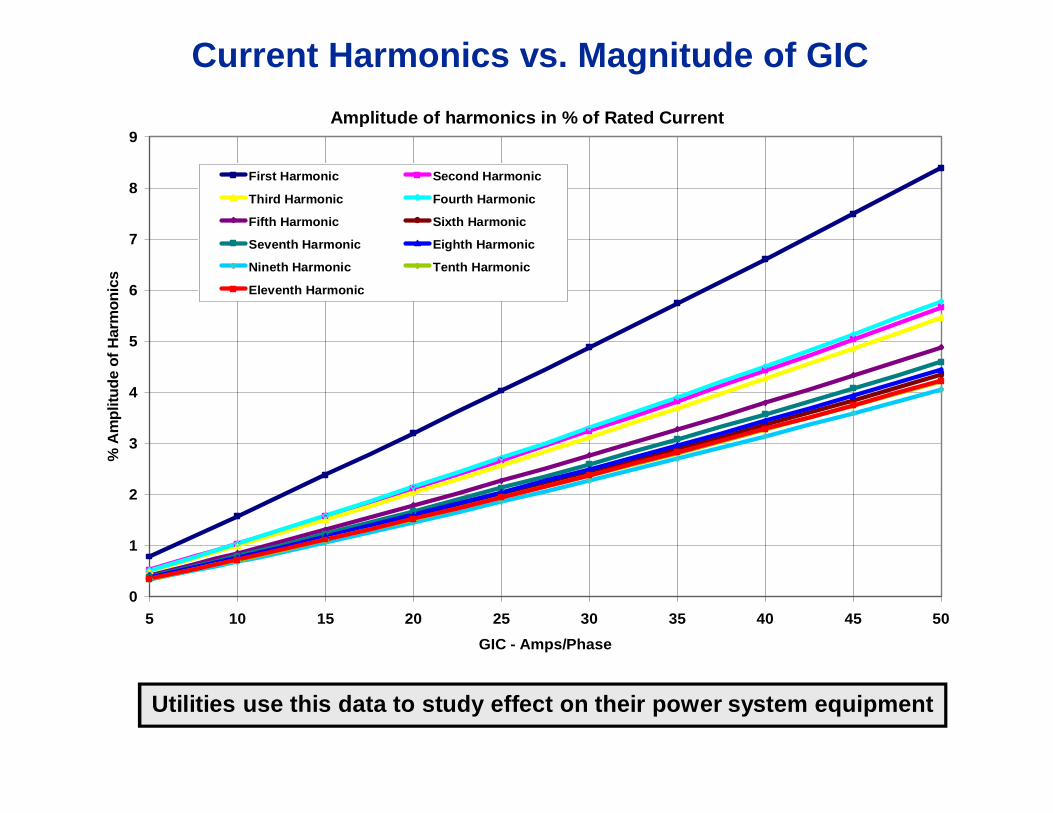
Current Harmonics vs. Magnitude of GIC
Utilities use this data to study effect on their power system equipment
Amplitude of harmonics in % of Rated Current
0
1
2
3
4
5
6
7
8
9
5 10 15 20 25 30 35 40 45 50GIC - Amps/Phase
%A
mpl
itude
ofH
arm
onic
s
First Harmonic Second Harmonic
Third Harmonic Fourth Harmonic
Fifth Harmonic Sixth Harmonic
Seventh Harmonic Eighth Harmonic
Nineth Harmonic Tenth Harmonic
Eleventh Harmonic
© ABB 2011June 9, 2011 | Slide 40
Benefits of Fleet GIC Susceptibility Evaluation, cont.
§ Power system analysts would use such data, to perform system
simulations for evaluating the response of the power system and its
components during a GMD storm. As a result of these studies:
§ Proper contingencies can be built into the Power System for such magnitudes
of VAR, so Voltage Collapse and possible grid black-outs can be avoided
§ Increasing robustness of the network; including providing additional network
protection and adjusting settings of relays and other susceptible equipment
§ Developing special / proper operating procedures during a GMD storm
§ Installation of appropriate GIC blocking devices, if needed
§ System blackouts and possible damages to some transformers can be
avoided in future GMD events
© ABB Group 2013 - Slide 41
© ABB 2011June 9, 2011 | Slide 42
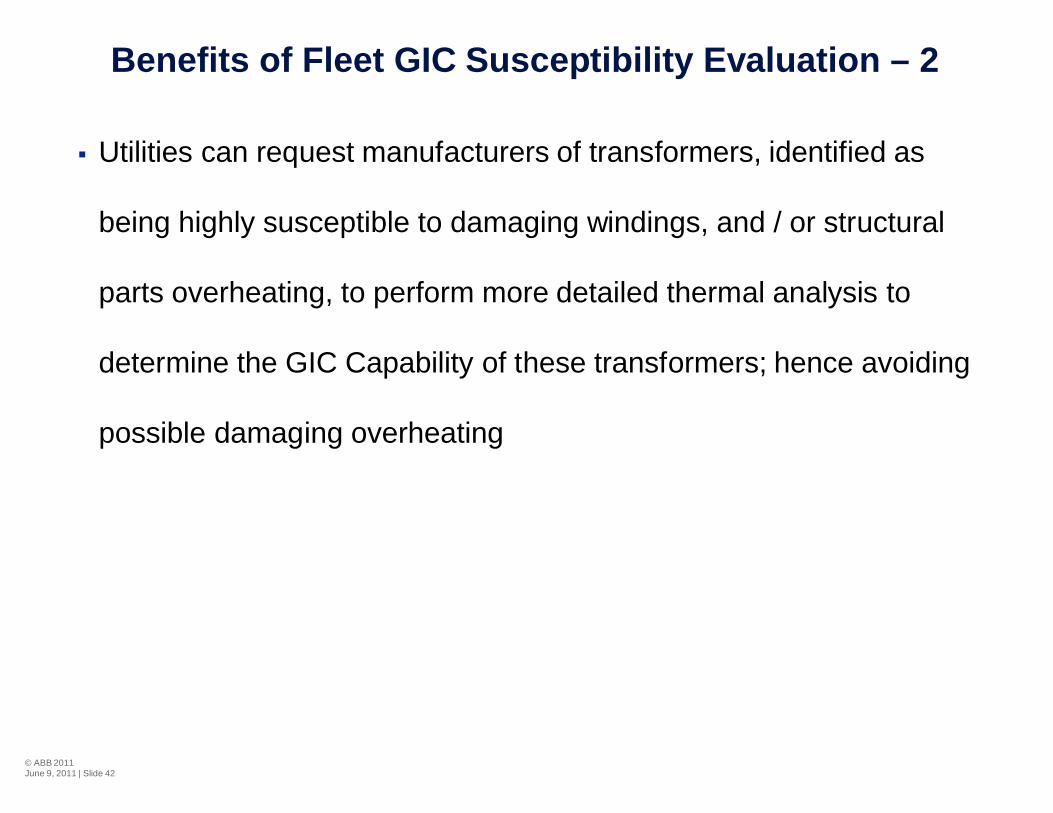
Benefits of Fleet GIC Susceptibility Evaluation – 2
§ Utilities can request manufacturers of transformers, identified as
being highly susceptible to damaging windings, and / or structural
parts overheating, to perform more detailed thermal analysis to
determine the GIC Capability of these transformers; hence avoiding
possible damaging overheating
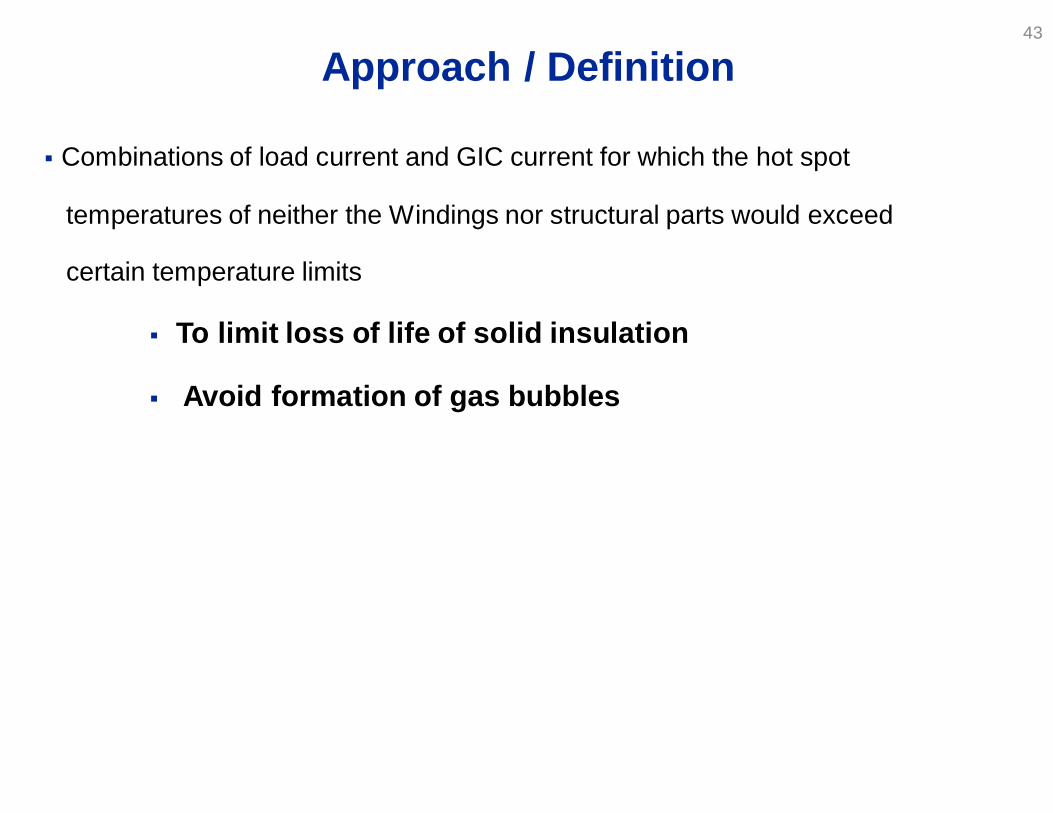
Approach / Definition43
§ Combinations of load current and GIC current for which the hot spot
temperatures of neither the Windings nor structural parts would exceed
certain temperature limits
§ To limit loss of life of solid insulation
§ Avoid formation of gas bubbles
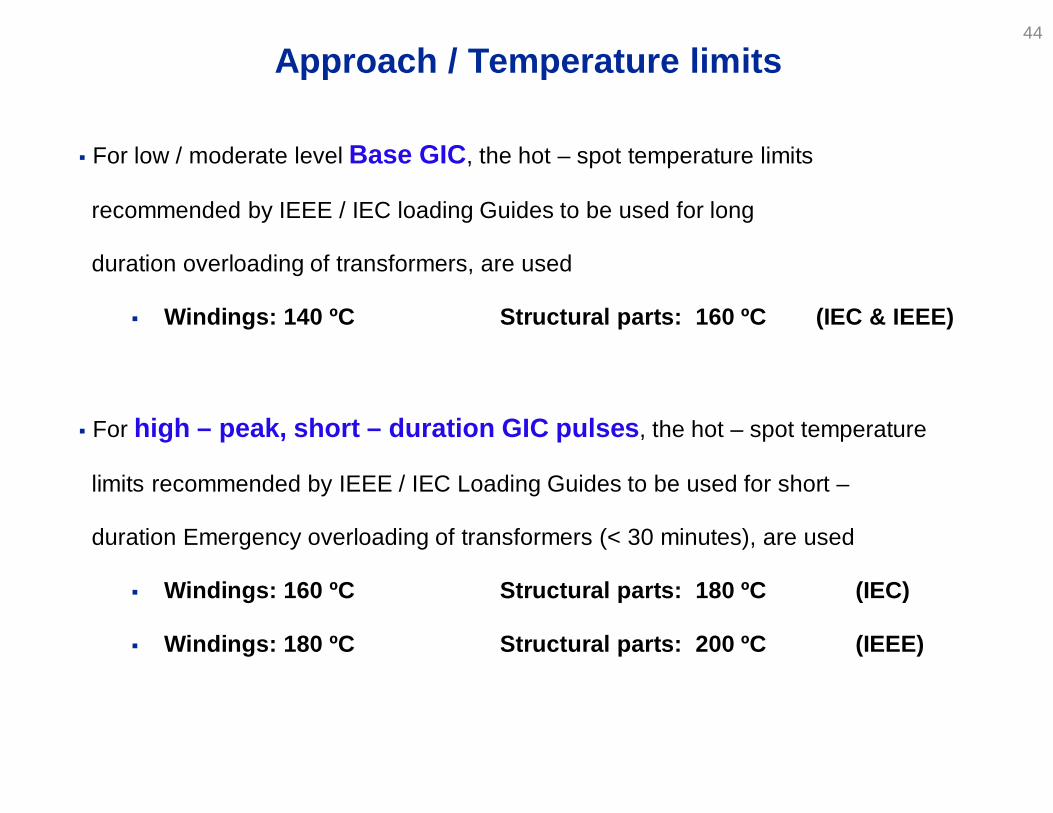
Approach / Temperature limits44
§ For low / moderate level Base GIC, the hot – spot temperature limits
recommended by IEEE / IEC loading Guides to be used for long
duration overloading of transformers, are used
§ Windings: 140 ºC Structural parts: 160 ºC (IEC & IEEE)
§ For high – peak, short – duration GIC pulses, the hot – spot temperature
limits recommended by IEEE / IEC Loading Guides to be used for short –
duration Emergency overloading of transformers (< 30 minutes), are used
§ Windings: 160 ºC Structural parts: 180 ºC (IEC)
§ Windings: 180 ºC Structural parts: 200 ºC (IEEE)
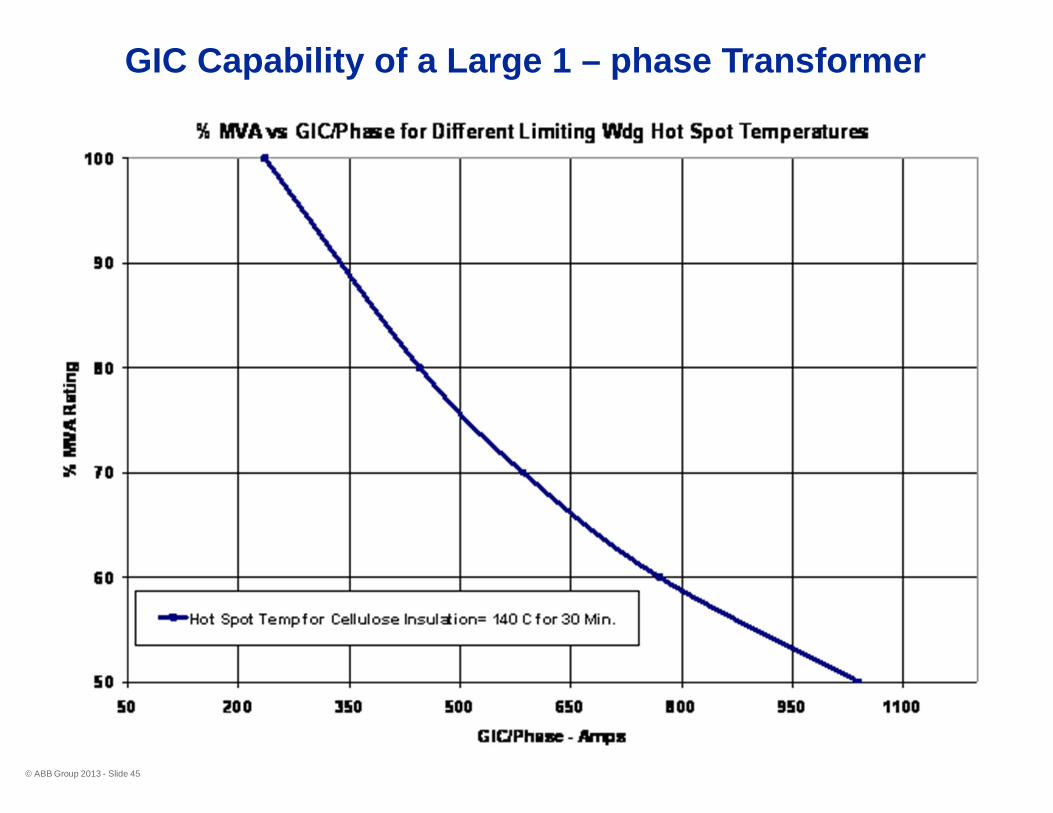
GIC Capability of a Large 1 – phase Transformer
© ABB Group 2013 - Slide 45
§ Because of the nature of GIC signature, the majority of large power
transformers would not fail thermally even under high magnitudes of GIC
§ Therefore, months / years of blackouts, as claimed, is not real
§ The effect of the increased VAR consumption & current harmonics on the
power system, and its components, is the real significant consequence of
GIC. This is even more true for high levels of GIC. It is important to
evaluate this effect
Summary and Concluding Remarks
© ABB Group 2013 - Slide 46
§ Transformer designs susceptible to damaging windings overheating
are those where core saturation changes the leakage flux pattern =>
Very high levels of winding circulating currents
§ The Salem Transformer was the example of these designs
§ GIC fleet assessment studies help utilities identify transformers that
require magnetic & thermal evaluations; reducing risk of blackouts and
possible thermal issues in some old design transformers
§ For many technical reasons, DC testing of power transformers in the
factory is of little benefit and little relevance to actual operating
conditions and is also unnecessary. Also, DC testing of transformers
on the power Grid for partial verification of some calculations may be
ok but the cost is very high and the test would be performed at no load
Summary and Concluding Remarks, cont.
© ABB Group 2013 - Slide 47

Thank you
48