effect of herbal medicines on the pharmacokinetics and
TRANSCRIPT

Effect of Herbal Medicines on the
Pharmacokinetics and Pharmacodynamics of
Warfarin in Healthy Subjects
By
Xuemin Jiang
A thesis submitted in fulfilment of
the requirements for the degree of
Doctor of Philosophy
Faculty of Pharmacy
The University of Sydney
March 2004

Preface
The work described in this thesis was carried out by the
author in the Faculty of Pharmacy, The University of Sydney,
under the supervision of Dr Andrew J McLachlan and Dr
Colin C Duke. This thesis has not been submitted for a
degree at any other university. Full acknowledgement has
been made where the work of others has been cited or used.
A list of publications is included in support of this thesis.
Xuemin Jiang

iii
Table of Contents
Chapter 1 Introduction..................................................................... 1
1.1 Overview...................................................................................................... 1
1.2 Physicochemical Properties of Warfarin...................................................... 3
1.3 Clinical Use of Warfarin .............................................................................. 6
1.4 Pharmacodynamics of Warfarin................................................................... 6
1.4.1 Mechanism of Action........................................................................... 6
1.4.2 Pharmacodynamic Models Used to Describe Warfarin Response....... 8
1.5 Pharmacokinetics of Warfarin.................................................................... 13
1.5.1 Absorption.......................................................................................... 13
1.5.2 Distribution ........................................................................................ 13
1.5.3 Metabolism......................................................................................... 14
1.5.4 Excretion ............................................................................................ 17
1.5.5 Pharmacokinetic Modelling of Warfarin .......................................... 17
1.5.6 Warfarin Pharmacokinetic-Pharmacodynamic Modelling................. 18
1.6 Warfarin Drug Interaction Mechanisms..................................................... 19
1.6.1 Pharmacodynamic Interactions .......................................................... 20
1.6.2 Pharmacokinetic Interactions ............................................................. 21
1.7 St. John's Wort ........................................................................................... 25
1.7.1 Chemistry and Pharmacology ............................................................ 25
1.7.2 Pharmacokinetics of St John’s Wort Constituents ............................. 27

iv
1.7.3 St John’s Wort Drug Interactions....................................................... 28
1.8 Panax Ginseng............................................................................................ 43
1.8.1 Chemistry and Pharmacology ............................................................ 43
1.8.2 Pharmacokinetics of Ginseng Constituents........................................ 45
1.8.3 Ginseng Drug Interactions ................................................................. 46
1.9 Ginkgo Biloba ............................................................................................ 49
1.9.1 Chemistry and Pharmacology ............................................................ 49
1.9.2 Pharmacokinetics of Ginkgo Constituents ......................................... 51
1.9.3 Ginkgo Drug Interactions................................................................... 53
1.10 Ginger......................................................................................................... 56
1.10.1 Chemistry and Pharmacology ............................................................ 57
1.10.2 Pharmacokinetics of Ginger Constituents.......................................... 59
1.10.3 Ginger Drug Interactions.................................................................... 59
Chapter 2 General Methodology ................................................... 61
2.1 Clinical Study............................................................................................. 61
2.1.1 Overview of Warfarin Drug Interaction Clinical Trial Designs ........ 61
2.1.2 Subjects .............................................................................................. 63
2.1.3 Warfarin and Herbal Medicine Products............................................ 64
2.1.4 Study Design and Dose Administration............................................. 65
2.1.5 Randomisation ................................................................................... 67
2.1.6 Sample Collection and Analysis ........................................................ 67
2.2 HPLC Assay for Warfarin Enantiomers .................................................... 68
2.3 HPLC Assay for S-7-hydroxywarfarin ...................................................... 69

v
2.4 Plasma Protein Binding.............................................................................. 69
2.5 INR Measurement ...................................................................................... 70
2.6 Platelet Aggregation Measurement ............................................................ 73
2.7 Data Analysis ............................................................................................. 76
2.7.1 Model Independent Pharmacokinetic and Pharmacodynamic Analysis
……………………………………………………………………….76
2.7.2 Pharmacokinetic-Pharmacodynamic Modelling ................................ 77
2.7.3 Statistical Analysis ............................................................................. 79
Chapter 3 Validation of Analytical Methods................................ 80
3.1 Calibration of HPLC Assay for Warfarin Enantiomers in Human Plasma
and S-7-hydroxywarfarin in Urine ......................................................................... 80
3.1.1 Introduction........................................................................................ 80
3.1.2 Materials and Methods....................................................................... 83
3.1.3 Calibration of HPLC Assay for Warfarin Enantiomers in Human
Plasma ……………………………………………………………………….85
3.1.4 Calibration of HPLC Assay for S-7-hydroxywarfarin in Human Urine
……………………………………………………………………….96
3.2 Calibration of Warfarin Protein Binding ................................................. 104
3.2.1 Introduction...................................................................................... 104
3.2.2 Materials and Methods..................................................................... 105
3.2.3 Results .............................................................................................. 106
3.2.4 Discussion ........................................................................................ 108
Chapter 4 Variability in Constituents of Herbal Medicines ..... 109

vi
4.1 Introduction.............................................................................................. 109
4.2 Materials and Methods............................................................................. 110
4.2.1 Materials and Reagents .................................................................... 110
4.2.2 Instrumentation ................................................................................ 112
4.2.3 Assessment of Recommended Dose Regimens of Different Brand
Herbal Medicine Products................................................................................ 113
4.2.4 Preparation of Reference Solutions.................................................. 113
4.2.5 Preparation of Test Solutions ........................................................... 113
4.2.6 TLC of St John’s Wort Preparations................................................ 115
4.2.7 TLC of Ginseng Preparations........................................................... 116
4.2.8 TLC of Ginger Preparations............................................................. 117
4.2.9 TLC of Ginkgo Preparations............................................................ 117
4.3 Results ...................................................................................................... 118
4.3.1 Comparison of Recommended Dose Regimens of Herbal Medicine
Products ……………………………………………………………………...118
4.3.2 TLC of Herbal Medicines ................................................................ 129
4.4 Discussion ................................................................................................ 136
Chapter 5 Effect of St John’s Wort and Ginseng on the
Pharmacokinetics and Pharmacodynamics of Warfarin in Healthy
Subjects ………………………………………………………...142
5.1 Introduction.............................................................................................. 142
5.2 Materials and Methods............................................................................. 143
5.3 Results ...................................................................................................... 144

vii
5.3.1 Subjects ............................................................................................ 144
5.3.2 Results of Statistical Analysis.......................................................... 144
5.3.3 Pharmacokinetics of S-warfarin and R-warfarin.............................. 144
5.3.4 Urinary Excretion Rate (UER) of S-7-hydroxywarfarin.................. 155
5.3.5 Plasma Protein Binding of Warfarin ................................................ 156
5.3.6 Pharmacodynamic Endpoints........................................................... 157
5.3.7 Pharmacokinetic and Pharmacodynamic Modelling........................ 160
5.3.8 Adverse Events ................................................................................ 164
5.4 Discussion ................................................................................................ 165
Chapter 6 Effect of Ginkgo and Ginger on the Pharmacokinetics
and Pharmacodynamics of Warfarin in Healthy Subjects ............. 173
6.1 Introduction.............................................................................................. 173
6.2 Materials and Methods............................................................................. 175
6.3 Results ...................................................................................................... 175
6.3.1 Subject.............................................................................................. 175
6.3.2 Results of Statistical Analysis.......................................................... 175
6.3.3 Pharmacokinetics of S-warfarin and R-warfarin.............................. 176
6.3.4 Urinary Excretion Rate (UER) of S-7-hydroxywarfarin.................. 186
6.3.5 Plasma Protein Binding of Warfarin Enantiomers........................... 187
6.3.6 Pharmacodynamics .......................................................................... 188
6.3.7 Pharmacokinetic and Pharmacodynamic Modelling........................ 191
6.3.8 Adverse Events ................................................................................ 195
6.4 Discussion ................................................................................................ 196

viii
Chapter 7 General Discussion, Conclusions and Further Studies
………………………………………………………...206
7.1 General Discussion .................................................................................. 206
7.2 General Conclusions ................................................................................ 209
7.3 Further Studies ......................................................................................... 212
References ............................................................................................ 213
Appendices ........................................................................................... 236

ix
Acknowledgements
I would like to express my sincere acknowledgements to my supervisors, Dr Andrew
J McLachlan and Dr Colin C Duke, for their excellent supervision, encouragement,
dedication and support during the course of this work.
I am indebted to the research team; Assoc Prof Kenneth M Williams, Dr Winston S
Liauw and Richard O Day in the Clinical Trial Centre and Department of Clinical
Pharmacology and Toxicology, St Vincent’s Hospital for the clinical implementation;
Dr Alaina J Ammit for her contribution in the haematology and Prof Basil D
Roufogalis for his consistent support, encouragement and his valuable advice on
herbal medicines.
I thank the healthy subjects for their time, effort, patience, tolerance and friendship
whose role was central to this project.
I acknowledge the financial support provided by the Faculty of Pharmacy, The
University of Sydney, the Vincent Fairfax Family Foundation and the National
Health and Medical Research Council.
Thanks must go to my friends; Dr Joe Turner, Dr Shirley Teng, Dr Lucy Sasongko,
Elaine Blair, Ying Hong, Kasia Loboz, Jiamin You, Sarah Cui, Qingyang Li, Dr
George Li, Garry Ng, Dana Strain and all other colleagues in pharmaceutics for their
help in the laboratory and friendship. Special thanks to Dr Gang Peng for his
contribution in TLC of herbal medicines.
And finally, my deepest gratitude is to my wife Yiqin, my son Tom, my daughter
Lynne and my parents Quanzhong and Chunhong. It is your understanding,
encouragement, support and love that give me the impetus to complete this work.

x
Publications in Support of this Thesis
• Jiang X, Williams KM, Liauw W, Ammit AJ, Roufogalis BD, Duke CC, Day
RO, McLachlan AJ, Effect of St John’s wort and ginseng on the
pharmacokinetics and pharmacodynamics of warfarin in healthy subjects,
British Journal of Clinical Pharmacology 2004;57:592-9.
• Jiang X, Williams KM, Liauw W, Ammit AJ, Roufogalis BD, Duke CC, Day
RO, McLachlan AJ, Effect of ginkgo and ginger on the pharmacokinetics and
pharmacodynamics of warfarin in healthy subjects, British Journal of
Clinical Pharmacology (Under revision).

xi
Papers Presented at Scientific Meeting • Jiang X, Williams KM, Liauw W, Ammit AJ, Roufogalis BD, Duke CC, Day
RO, McLachlan AJ, Pharmacokinetic-pharmacodynamic modelling to
investigate herb-drug interactions with warfarin. 8th World Congress on
Clinical Pharmacology & Therapeutics (2004). Poster
• Jiang X, Williams KM, Liauw W, Ammit AJ, Roufogalis BD, Duke CC, Day
RO, McLachlan AJ, Effect of ginkgo and ginger on the pharmacokinetics and
pharmacodynamics of warfarin in healthy subjects. Australasian
Pharmaceutical Science Association (APSA) Annual Conference, Sydney
(2003). Podium.
• Jiang X, Williams KM, Liauw W, Ammit AJ, Roufogalis BD, Duke CC, Day
RO, McLachlan AJ, Effect of St John’s wort and ginseng on the
pharmacokinetics and pharmacodynamics of warfarin in healthy subjects.
American Association of Pharmaceutical Scientist (AAPS) Annual
Conference and Exposition – Salt Lake City, 26-30, October, 2003. Poster.
• Jiang X, Williams KM, Liauw W, Ammit AJ, Roufogalis BD, Duke CC, Day
RO, McLachlan AJ, Effect of St John’s wort and ginseng on the
pharmacokinetics and pharmacodynamics of warfarin in healthy subjects
(Preliminary Study). Australasian Pharmaceutical Science Association
(APSA) Annual Conference – Melbourne (2002). Poster.
• Jiang X, Williams KM, Roufogalis BD, Duke CC, Day RO, McLachlan AJ,
Effect of St John’s wort and ginseng on the pharmacokinetics and
pharmacodynamics of warfarin: results of a pilot study. The University of
Sydney, The College of Health Sciences (CoHS) Research Conference –
Leura (2002). Miniposter/Podium.

xii
Abbreviations
ADP Adenosine disphosphate ANOVA Analysis of variance APTT Activated partial prothrombin time ATP Adenosine triphosphate AUC Area under the plasma drug concentration-time curve BP British Pharmacopoeia cAMP Adenosine 3’,5’-cyclic phosphate cGMP cyclic guanosine monophosphate CI Confidence interval Cmax Maximum drug concentration observed in plasma Cmin Minimum drug concentration observed in plasma CR R-warfarin concentration CS S-warfarin concentration C50,R Concentration of R-warfarin that produces 50% inhibition of PCA C50,S Concentration of S-warfarin that produces 50% inhibition of PCA CL Total clearance of drug from plasma CLu Clearance of unbound drug CNS Central nervous system CV Coefficient of variation CYP Cytochrome P450 DA Dopamine cDNA Complementary deoxyribonucleic acid Emax Maximum effect Em Emission Ex Excitation F Bioavailability of drug or herbal constituent FDA Food and Drug Administration fe Fraction of drug or herbal constituent excreted unchanged in urine fu Fraction of unbound drug concentration in plasma GC Gas chromatography GCP Good Clinical Practice GMP Good Manufacturing Practice GS Ginseng h Hour HIV Human immunodeficiency virus HPLC High performance liquid chromatography IC50 The concentration that produces 50% inhibition of PCA INR International normalised ratio of prothrombin time I.S. Internal standard k Elimination rate constant ka Absorption rate constant kd Degradation rate constant of the prothrombin complex LCMSMS Liquid chromatography mass spectrometry/mass spectrometry LOQ Limit of quantitation mRNA Messenger ribonucleic acid

xiii
min Minute MW Molecule weight NA Noradrenaline NSAIDs Non steroidal anti-inflammatory drugs QC Quality control PAF Platelet activating factor PCA Prothrombin complex activity PK/PD Pharmacokinetics/Pharmacodynamics PT Prothrombin time PXR Pregnane X receptor r2 Coefficient of determination Rdeg Degradation rate of prothrombin complex Rsyn Synthesis rate of prothrombin complex SD Standard deviation sec Second SJW St John’s wort t1/2 Half-life td Time between the start of absorption of the drug and the initiation
of anticoagulant TGA Therapeutic Goods Administration TXA2 Thromboxane A2 TLC Thin-layer Chromatography tmax Time at which the highest drug concentration occurs UV Ultraviolet USP United States Pharmacopoeia UER Urinary excretion rate V Volume of distribution WF Warfarin γ Slope factor in concentration-response relationship

xiv
Abstract
Herbal medicines are widely used in our community. A survey of Australian
consumers indicated that 60% had used complementary and/or alternative medicines
in the past year with the majority not informing their doctor that they were using
herbal medicines. Little is known about the potentially serious consequences of
interactions between herbal and conventional medicines. Warfarin has an important
role in treating people with heart disease, yet it has a narrow therapeutic range, is
highly bound to plasma proteins, and is metabolised by cytochrome P450. This
creates the potential for life-threatening interactions with other drugs and foods
leading to excessive bleeding. Hence, warfarin is one of the most frequently
investigated drugs for interaction studies. Early clinical reports suggest that there
exists the potential for an interaction between warfarin and four herbal medicines: St
John’s wort, ginseng, ginkgo and ginger. However, these herb-drug combinations
have never been conclusively studied.
The two clinical studies conducted as part of this research had an identical study
design. Twenty-four healthy male subjects were recruited into the two separate
studies. This was an open label, three-way crossover randomised study in twelve
healthy male subjects, who received a single 25 mg dose of warfarin alone or after 14
days pre-treatment with St John’s wort, or 7 days pre-treatment with ginseng. Dosing
with St John’s wort or ginseng was continued for 7 days after administration of the
warfarin dose in study I or who received a single 25 mg dose of warfarin alone or
xv
after 7 days pre-treatment with recommended doses of ginkgo or ginger from single
ingredient products of known quality. Dosing with ginkgo or ginger was continued
for 7 days after administration of the warfarin dose in study II. Platelet aggregation,
international normalised ratio (INR) of prothrombin time, warfarin enantiomer
protein binding, warfarin enantiomer concentrations in plasma and S-7-
hydroxywarfarin concentration in urine were measured in both studies. Statistical
comparisons were made using ANOVA and 95% confidence interval (CI) for mean
value and 90% CI for geometric mean ratio value are reported.
In study I, the mean (95% CI) apparent clearance of S-warfarin after warfarin alone
or with St John’s wort or ginseng were, respectively, 198 (174 – 223) ml/h, 269 (241
– 297) ml/h and 220 (201 – 238) ml/h. The respective apparent clearances of R-
warfarin were 110 (94 – 126) ml/h, 142 (123 – 161) ml/h and 119 (106 – 131) ml/h.
The mean ratio of apparent clearance for S-warfarin was 1.29 (1.16-1.46) and for R-
warfarin was 1.23 (1.11-1.37) when St John’s wort was co-administered. The mean
ratio of AUC0-168 of INR was 0.79 (0.70 - 0.95) when St John’s wort was co-
administered. The urinary excretion ratio of S-7-hydroxywarfarin after
administration of warfarin alone was 0.04 (0.03 – 0.06) mg/h and there was no
significant difference following treatment with either St John’s wort 0.03 (0.02 –
0.04) mg/h or ginseng 0.03 (0.02 – 0.04) mg/h. The ratio of geometric means for S-7-
hydroxywarfarin UER was 0.82 (0.61-1.12) for St John’s wort, and 0.68 (0.50-0.91)
for ginseng. St John’s wort and ginseng did not affect the apparent volumes of
distribution or protein binding of warfarin enantiomers.

xvi
In study II, the mean (95% CI) apparent clearance of S-warfarin after warfarin alone,
with ginkgo or ginger were 189 (167 – 210) ml/h, 200 (173 – 227) ml/h and 201 (171
– 231) ml/h, respectively. The respective apparent clearances of R-warfarin were 127
(106 – 149) ml/h, 126 (111 – 141) ml/h and 131 (106 – 156) ml/h. The mean ratio of
apparent clearance for S-warfarin was 1.05 (0.98 -1.12) and for R-warfarin was 1.00
(0.93 -1.08) when co-administered with ginkgo. The mean ratio of AUC0-168 of INR
was 0.93 (0.81 -1.05) when co-administered with ginkgo. The mean ratio of apparent
clearance for S-warfarin was 1.05 (0.97 -1.13) and for R-warfarin was 1.02 (0.95 -
1.10) when co-administered with ginger. The mean ratio of AUC0-168 of INR was
1.01 (0.93 -1.15) when co-administered with ginger. The urinary excretion ratio
(UER) of S-7-hydroxywarfarin after administration of warfarin alone was 0.04 (0.03
– 0.05) mg/h and there was no significant difference following treatment with either
ginkgo 0.04 (0.03 – 0.04) mg/h or ginger 0.03 (0.02 – 0.04) mg/h. The ratio of
geometric means for S-7-hydroxywarfarin UER was 1.07 (0.69-1.67) for ginkgo, and
1.00 (0.64-1.56) for ginger. Ginkgo and ginger did not affect the apparent volumes of
distribution or protein binding of either S-warfarin or R-warfarin.
In conclusion, St John’s wort significantly induced the apparent clearance of both S-
warfarin and R-warfarin, which in turn resulted in a significant reduction in the
pharmacological effect of rac-warfarin. Ginseng, ginkgo and ginger at
recommended doses affect neither clotting status, nor the pharmacokinetics or
pharmacodynamics of either S-warfarin or R-warfarin in healthy subjects.

Chapter 1 Introduction 1
Chapter 1 Introduction
1.1 Overview
Herbal medicines are widely used in our community [1-3]. A survey of Australian
consumers indicated that 60% had used complementary and/or alternative medicines
in the past year with the majority not informing their doctor that they were using
herbal medicines [4]. Little is known about the potentially serious consequences of
herbal medicines and conventional medicine interactions. Furthermore, herbal
products are not marketed with proof of efficacy or safety as is normally required for
conventional medicines by the Therapeutical Goods Administration (TGA) or Food
and Drug Administration (FDA). In the literature, most herb-drug interactions are
based on case reports or suspected interactions [5]. Fugh-Berman reported that of one
hundred and eight cases of suspected interactions identified in a review article
assessing the reliability of reported herb- drug interactions, seventy-four (68.5%) did
not contain sufficient information to evaluate the likelihood of an interaction [6].
Additionally, there is only variable evidence supporting herb-drug interactions, much
of which includes conflicting in vitro and in vivo data [7]. There have been a number
of case reports of suspected interactions and in vitro data indicating the possible
effects of herbal medicines on blood coagulation and clot formation [8]. However
there has been no systematic investigation of the potential interactions between

Chapter 1 Introduction 2
herbal medicines and the anticoagulant drug warfarin. This presents a challenge for
health care practitioners.
Warfarin has an important role in treating people with heart diseases, yet it has a
narrow therapeutic range, exhibits stereoselective metabolism, is approximately 99%
bound to plasma proteins, and is metabolised by cytochrome P450 (CYP). This
creates the potential for life-threatening interactions with other drugs and foods
leading to excessive bleeding or therapeutic failure. Hence, warfarin is one of the
most frequently investigated drugs for interaction studies [9]. Early clinical reports
suggest that there exists the potential for an interaction between warfarin and four
herbal medicines: St John’s wort, ginseng, ginkgo and ginger. However, these herb-
drug combinations have never been conclusively studied. Warfarin is widely used in
the community where people have free access to herbal and alternative medicines [4].
Hence, there is considerable potential for clinically significant drug interactions. The
systematic study of potential interactions between warfarin and herbal medicines
proposed in this research will lead to safer dosing guidelines for the use of warfarin
in combination with these supposedly “safe” herbal medicines. Excessive warfarin
response can be life threatening or cause excessive bleeding leading to serious
consequences. The identification and avoidance of significant drug interactions with
warfarin can reduce patient problems caused by bleeding and reduce the length of
hospital stays and decrease the need for frequent blood monitoring. Warfarin is a
substrate for the drug metabolising enzyme CYP2C9, so the present study will also
provide a valuable insight into possible interactions with other medicines that are
substrates for CYP2C9.

Chapter 1 Introduction 3
The aims of the studies reported in this thesis were
• To investigate the herb-drug interactions between four commonly used herbal
medicines (St John’s wort, ginseng, ginkgo, and ginger) and the anticoagulant
drug warfarin
• To identify the drug interaction mechanisms
• To investigate St John’s wort, ginseng, ginkgo, and ginger’s effect on clotting
status, respectively
The findings of these studies can be used to infer whether there are potentially
serious herb-drug interactions between these four herbal medicines and other
conventional medicines in addition to warfarin.
1.2 Physicochemical Properties of Warfarin
Warfarin, C19H16O4, ((RS)-2-oxo-3- (3-oxo-1-phenylbutyl)-2H-chromen-4-olate) is a
colourless crystalline material with a MW of 308.3 and melting point between 159oC
to 160oC. Warfarin can exhibit natural fluorescence with excitation and emission
wavelengths of 290-342 nm and 385 nm, respectively. It is practically insoluble in
water, moderately soluble in ethanol and readily soluble in acetone. On the other
hand, warfarin sodium, C19H15NaO4 (MW: 330.32), (sodium (RS)-2-oxo-3-(3-oxo-1-
phenylbutyl)-2H-chromen-4-olate) is a white hygroscopic powder which is very
soluble in water and in alcohols, soluble in acetone, very slightly soluble in ether and
in methylene chloride. Warfarin has an apparent dissociation constant (pKa) of 5.0
(at 20oC) and a partition coefficient (log P) (octanol/pH 8.0) of 0.0 [10].

Chapter 1 Introduction 4
Warfarin is a chiral molecule. The asymmetric carbon at position 9 of warfarin gives
rise to two enantiomers, namely R-(+)-warfarin (R-warfarin) and its mirror image
isomer S-(-)-warfarin (S-warfarin) (Figure 1-1). The main monohydroxylated
metabolites of warfarin, such as 4’-, 6-, 7- and 8-hydroxywarfarin, also contain a
single asymmetric centre (Table 1-1) [11].
Figure 1-1. Three dimensional structures of warfarin enantiomers.
R-warfarin
O
OH
O
O
O
OH
O
O
MIRROR
S-warfarin

Chapter 1 Introduction 5
Table 1-1. Structures of warfarin and its main metabolites. Adapted from [12].
O
OH
O
CH
8
10
7
6
R3
R4
R1
*
R2
4'
Structure
Compound
R1 R2 R3 R4 Warfarin H
CH3
O
H H
6-Hydroxywarfarin 6= OH
CH3
O
H H
7-Hydroxywarfarin 7= OH
CH3
O
H H
8-Hydroxywarfarin 8= OH
CH3
O
H H
4’-Hydroxywarfarin H
CH3
O
H OH
10-Hydroxywarfarin H
CH3
O
OHa H
Warfarin alcohol H
OH
CH3*
H H
Note: *: Asymmetric centre; a: The second asymmetric centre generated at C-10
position.

Chapter 1 Introduction 6
1.3 Clinical Use of Warfarin
In the clinical setting, warfarin is administered for the prevention and treatment of
venous thromboses and pulmonary embolism [13]. It is also used for the prophylaxis
and treatment of thromboembolic complications associated with atrial fibrillation,
diabetes mellitus and hypertension associated with an otherwise normal heart. It is
additionally used as an adjunct in the treatment of coronary occlusion. Warfarin does
not affect established thrombi or reverse tissue ischaemia but is instead used to
prevent clot growth and secondary complications [14]. The following ranges of
International normalized ratio (INR) of prothrombin time are recommended by the
British Society of Haematology. 2.0 to 2.5: prophylaxis of deep vein thrombosis
including high risk surgery; 2.0 to 3.0: treatment of deep vein thrombosis, pulmonary
embolism and atrial fibrillation; 3.0 to 4.5: recurrent deep vein thrombosis and
pulmonary embolism; arterial disease including myocardial infarction, arterial grafts;
cardiac prosthetic valves and grafts.
1.4 Pharmacodynamics of Warfarin
1.4.1 Mechanism of Action
Warfarin is a vitamin K dependent factor anticoagulant. It acts by inhibiting the
synthesis of vitamin K dependent clotting factors (Factors II, VII, IX and X and
clotting protein C and S) [15] (Figure 1-2).

Chapter 1 Introduction 7
Figure 1-2. The probable mechanism of action of vitamin K and the site of
action of oral anticoagulants. Adapted from [16].
γ

Chapter 1 Introduction 8
Reduced vitamin K (the hydroquinone) acts as a cofactor in the conversion of
glutamic acid (Glu) to γ-carboxyglutamic acid (Gla). During this reaction, the
reduced form of the vitamin K is converted to the epoxide, which in turn is reduced
to the quinone and then the hydroquinone. Warfarin has similar structural
characteristics to vitamin K, the inhibition of vitamin K reductase is competitive and
only exerts its actions in vivo without affecting clotting if added to blood in vitro [17].
Warfarin does not alter the degradation rate of clotting factors already in circulation;
it only affects the synthesis rate of clotting factors [18]. Therefore, the onset of
anticoagulation induced by warfarin is delayed. The anticoagulation effect of
warfarin takes about 8 hours to become apparent as a result of the time taken for
degradation of carboxylated factors [18]. The onset of action of warfarin depends on
the elimination half-lives of the relevant factors. Factor VII, with half-life of 6 hours,
is affected first, then Factors IX, X and II with half-lives of 24, 40 and 60 hours,
respectively [19, 20]. The two enantiomers of warfarin display different
anticoagulant potency in humans. S-warfarin is considerably more potent than R-
warfarin in terms of the anticoagulant effect [14].
1.4.2 Pharmacodynamic Models Used to Describe Warfarin Response
Various models have been reported to describe the relationship between warfarin
concentration (C) and the inhibitory effect of warfarin on the synthesis rate of
vitamin K-dependent clotting factors. The simplest is the linear pharmacodynamic
model [21]. The liner pharmacodynamic model is described in Equation 1-1.

Chapter 1 Introduction 9
f(C) = 1 - S×C Equation 1-1
where f(C) is an appropriate pharmacodynamic model describing the relationship
between warfarin concentration and its inhibiting effect on prothrombin complex
activity (PCA) synthesis rate; S is a slope parameter reflecting the patient’s
sensitivity to warfarin.
A power function has also been employed to define the effect of warfarin on the
inhibition of clotting factor synthesis (Equation 1-2). This modified version of the
linear pharmacodynamic model successfully deals with high warfarin concentrations
but fails with a zero concentration [22].
f(C) = 100 × 1 – 1/(S×Cn) Equation 1-2
in this model n is the power parameter.
Nagashima et al [23] proposed the first log-linear pharmacodynamic model to
describe warfarin pharmacodynamics. This was the first comprehensive model,
which described the in vivo effect of warfarin on the synthesis of clotting factors. The
hypothetical minimum effective plasma concentration (Cmin) is obtained by
extrapolating the percent inhibition of clotting factor synthesis rate versus log
concentration line to zero inhibition. In theory, the log-linear pharmacodynamic
model will overpredict the true effect when synthesis rate is more than 80% inhibited

Chapter 1 Introduction 10
and underpredict the effect when synthesis rate is less than 20% inhibited. This
model is described in Equation 1-3.
f(C) = 1 – M × [log (C) – log(Cmin)] Equation 1-3
where M is the slope of the log warfarin concentration versus percentage inhibition
of clotting factor synthesis rate profile.
The Emax pharmacodynamic model [24] has a more secure base in pharmacological
theory, and was able to describe the entire range of warfarin concentrations and
effects. However, this model assumes a fixed value for the gradient of the
concentration-effect relationship. The inhibitory Emax pharmacodynamic model is
described in Equation 1-4.
f(C) =1 – 1/(IC50+C) Equation 1-4
where IC50 is the warfarin concentration producing 50% inhibition of clotting factor
synthesis rate.
Chan et al. [18] detailed a further elaboration of the Emax model, the sigmoid Emax
pharmacodynamic model, which has been used to describe the simultaneous effect of
the S- and R- warfarin enantiomers on the inhibition of clotting factor synthesis rate.
This model is described in Equation 1-5.

Chapter 1 Introduction 11
f CC
ICC
ICS
50S
R
50R
bg= −
+FHG
IKJ+
FHG
IKJ
FHG
IKJ
1 1
1γ γ
Equation 1-5
where CS and CR are concentrations of S-warfarin and R-warfarin, IC50S and IC50R
are the corresponding concentrations of the enantiomers which individually produce
50% inhibition of prothrombin complex synthesis, and γ is the steepness parameter.
As described in Section 1.4.1, warfarin acts by inhibiting the synthesis of vitamin K-
dependent clotting factors. At any time, the PCA expressed as a percentage of
maximum response in blood is the net effect of synthesis rate (Rsyn) and degradation
rate (Rdeg) of the prothrombin complex (Equation 1-6 and 1-7) [18].
dPCA/dt = Rsyn - Rdeg Equation 1-6
dPCA/dt=Rsyn - kd×PCA Equation 1-7
where kd is the degradation or elimination rate constant of the prothrombin complex.
The effect of an anticoagulant drug (eg. warfarin) on Rsyn can be expressed in terms
of its fractional effect of the pre-treatment (control) synthesis rate (Rsyn,0):
dPCA/dt=Rsyn,0 [1-f(C)] - kd×PCA Equation 1-8

Chapter 1 Introduction 12
The unbound concentration of warfarin enantiomers are considered to be responsible
for the anticoagulant response at the active site and can be included in the model.
Combining the Equation 1-8 with Equation 1-5, the pharmacodynamic model is
described in Equation 1-9.
dPCAdt
k 100
1Cu tCu
Cu tCu
PCAd
S
50,S
R
50,R
S R=
+FHG
IKJ +
FHG
IKJ
−
L
N
MMMMM
O
Q
PPPPPbg bgγ γ
Equation 1-9
where Cu50,S and Cu50,R are the unbound concentrations of S- and R-warfarin,
respectively, required to produce a 50% inhibition of prothrombin complex activity.
Cu(t) is the unbound concentration of each enantiomer at time t, and γ is a measure
of the steepness of the concentration-response curve for each warfarin enantiomer.
Since the anticoagulant effect of racemic warfarin is predominantly contributed by S-
warfarin [18]. The Equation 1-9 can be simplified to Equation 1-10.
dPCAdt
k 100
1Cu tCu
PCAd
S
50,S
S=
+FHG
IKJ
−
L
N
MMMMM
O
Q
PPPPPbg γ
Equation 1-10

Chapter 1 Introduction 13
1.5 Pharmacokinetics of Warfarin
Warfarin is a racemic mixture of the R- and S-enantiomers. In studies that
administered warfarin enantiomers separately, it was found that the S-enantiomer
exhibits two to five times more anticoagulant activity than the R-enantiomer in
humans but generally has a more rapid clearance [25, 26]. Furthermore Chan et al
[18] found that the anticoagulant effect of warfarin is predominantly contributed by
S-enantiomer when warfarin was administered as rac-warfarin.
1.5.1 Absorption
Warfarin is essentially completely absorbed after oral administration and has a
systemic bioavailability of more than 90% in humans [18]. The peak concentration
after oral dosing is generally achieved within 60–90 min. No identifiable enantiomer-
specific differences in absorption have been reported while both the rate and extent
of absorption are independent of the dose administered [20, 27].
1.5.2 Distribution
Warfarin enantiomers distribute into a relatively small apparent volume of
distribution (V) of about 0.14 ± 0.03 L/kg (VS); 0.15 ± 0.03 L/kg (VR) in humans
[27-29]. A distribution phase last 6 to 12 h in distinguishable after rapid intravenous
or oral administration of an aqueous solution. Model-based estimates of volume of
distribution were close agreement for each enantiomer [18]. Approximately 99.5% of
the warfarin is bound to human plasma serum proteins, primarily albumin, where it is
pharmacologically inactive and is protected from biotransformation and excretion,
but the plasma protein bound drug is not permanently which is reversible [30]. No

Chapter 1 Introduction 14
stereoselective differences in protein binding of warfarin enantiomers has been found
(fuS = 0.0051 ± 0.0005, fuR = 0.0062 ± 0.0005, fu, fraction unbound drug
concentration) [30, 31].
1.5.3 Metabolism
The elimination of warfarin is almost entirely accounted for by hepatic enzymatic
metabolism (Figure 1-3). Warfarin is stereoselectively metabolised by hepatic
microsomal enzymes (cytochrome P450) located in the hepatic smooth endoplasmic
reticulum to inactive hydroxylated metabolites (predominant route) and also by
reductases to reduced metabolites (warfarin alcohols).
Hepatic metabolism of warfarin is the major determinant of inter-subject variability
in the warfarin dose-concentration-response relationship [20, 32]. Warfarin is
metabolized in a complex manner involving: (1) keto reduction resulting in the
formation of four diastereoisomeric metabolites designated as warfarin alcohols;

Chapter 1 Introduction 15
Figure 1-3. A: Sites of hydroxylation of S- and R-warfarin catalysed by human
cytochrome P450 isozymes to yield the hydroxylated metabolites of warfarin. B:
Structures of the dehydrowarfarin metabolites of warfarin. , major
metabolic pathway; , minor metabolic pathway. Adapted from [33].
CYP2C9
CYP2C94'
CYP2C19
CYP1A1CYP1A2CYP2C8
CYP2C8CYP2C18CYP2C19
CYP1A1CYP1A2
CYP1A1CYP1A2CYP2C19
O
OH
O
O
H
8
7
6
10
O
OH
O
O
8
7
6
10
4'
S-warfarin trans-Dehydrowarfarin
R-warfarin cis-Dehydrowarfarin
CYP3A4
O
OH
O
O
H
8
7
6
10
4' CYP2C9CYP2C18
O
OH
O
O
8
7
6
4'
A B

Chapter 1 Introduction 16
(2) oxidation to yield regioisomeric 4’-, 6-, 7-, 8- and 10-hydroxywarfarin; (3)
dehydration of warfarin alcohol to the cyclic metabolite and (4) various conjugation
reactions [34]. The warfarin alcohols have minimal anticoagulant activity. Table 1-1
shows the structures of warfarin and its main metabolites.
Based on in vitro studies, S-warfarin is metabolised predominantly to the inactive
metabolite S-7-hydroxywarfarin by the cytochrome P450 2C9 (CYP2C9) [35-37]
while R-warfarin is mainly metabolised to R,S-warfarin alcohol by liver cytosolic
ketone reductases [38]. A small percentage of R-warfarin is converted to oxidative
metabolites by several CYP450 enzymes including CYP1A2 [37], CYP3A4 [39] and
CYP2C19 [40]. Very little is known about the Phase II metabolism of the warfarin
metabolites in humans [33]. One in vivo study demonstrated that 10-hydroxywarfarin
was fully conjugated, 8-hydroxywarfarin was 66% conjugated and the extent of 6-
hydroxywarfarin conjugation varied between 66 and 100% in different patients by
treating the urine with glucuronidase and sulfatase enzymes [33].
CYP2C9 is known to be polymorphic [33]. Two known allelic variants CYP2C9*2
and CYP2C9*3 differ from the wild-type CYP2C9*1. Both allelic variants display
impaired hydroxylation of S-warfarin when expressed in vitro compared to wild type.
The CYP2C9*3 variant is less than 5% as efficient as the wild-type activity while
CYP2C9*2 shows about 12% of wild-type activity [41, 42]. Furthermore, some
CYP2C9 polymorphisms are associated with increased risk of excessive bleeding for
patients undergoing warfarin anticoagulation in the clinical setting [43, 44].

Chapter 1 Introduction 17
1.5.4 Excretion
Both reductive and oxidative metabolites of warfarin are excreted in urine and in bile
while enterohepatic circulation has been observed for the parent drug [45]. The
metabolites are principally excreted into the urine and, to a lesser extent, into the bile.
Only 2-5% of the warfarin administered appears unchanged in human urine [46, 47].
Warfarin enantiomers have different elimination rate constants (kS = 0.024 ± 0.009
1/h; kR = 0.017 ± 0.003 1/h) [18]. Since the volumes of distribution of warfarin
enantiomers are similar, the clearance of R-warfarin is generally half of S-warfarin
unbound clearance (CLuS = 675 ± 212 ml/h/kg; CLuR = 399 ± 58 ml/h/kg) [18].
Hence, the half-life of R-warfarin ranges from 37 to 89 h while the half-life of S-
warfarin ranges from 21 to 43 h [27].
1.5.5 Pharmacokinetic Modelling of Warfarin
Warfarin plasma concentration-time data after oral administration has been described
by both one- and two-compartment pharmacokinetic models [46, 48]. Although the
two compartment pharmacokinetic model may enhance the precision of data fitting, a
simple model should be adequate for drug-drug interactions and combined
pharmacokinetic-pharmacodynamic (PK/PD) studies [18]. The one compartment
pharmacokinetic model is described in Equation 1-11 and 1-12.
C t F DV
kaka k
e eSS S
k t katS( ) = ⋅⋅
FHG
IKJ −FHG
IKJ −− −
2c h
Equation 1-11

Chapter 1 Introduction 18
C t F DV
kaka k
e eRR R
k t katR( ) = ⋅⋅
FHG
IKJ −FHG
IKJ −− −
2c h
Equation 1-12
where D is the dose of racemic warfarin administered (divided by 2 to obtain the
equivalent dose of each enantiomer), F is the fraction of the dose absorbed, ka is the
first order absorption rate constant, kS and kR are the respective elimination rate
constants for individual warfarin enantiomers, and VS and VR are the respective
volumes of distribution.
1.5.6 Warfarin Pharmacokinetic-Pharmacodynamic Modelling
Equations 1-11 and 1-12 have been combined with Equation 1-9 to generate a
combined PK/PD model. An additional pharmacodynamic parameter was introduced
to account for the observed delay in PCA change after warfarin administration. The
parameter td represents the time between the onset of absorption of the drug and the
initiation of anticoagulant response. Therefore t in the combined PK/PD model was
replaced with a corrected time value t*, where t* = t - td.
Since the anticoagulant response data are generally obtained as an INR, the response
data can be transformed to PCA with the use of the functional relationship between
INR and PCA (percentage of normal activity) described in the following equation:
PCA(% normal) aINR b
=− Equation 1-13

Chapter 1 Introduction 19
The values of the constants a and b are determined by fitting this Equation 1-13 to
PCA and INR data obtained using serial dilutions of pooled normal plasma (See
Section 2.5).
1.6 Warfarin Drug Interaction Mechanisms
Drug interactions with warfarin can occur via three main mechanisms: 1)
Pharmacodynamic interactions: modification of the pharmacological effect of
warfarin without altering its concentration in the body; 2) Pharmacokinetic
interactions: alteration of the concentration of warfarin reaching its site of action and
3) Physicochemical interactions. Clinically important drug interactions occur when
either of the interacting drugs have a steep concentration-response curve and narrow
safety margin such that a small change in plasma concentration leads to a substantial
change in beneficial or adverse effect [16].
As a result of its narrow therapeutic range, high binding to plasma proteins and
metabolism by cytochrome P450, warfarin is prone to life-threatening interactions.
There have been more than 250 compounds, including clinically used drugs, herbal
medicines and other xenobiotics, proven to or suspected of having an interaction with
warfarin [49]. Understanding the mechanism of warfarin drug interactions provides
an insight into the possible clinical significance of an interaction and can help
elucidate strategies to avoid or minimise the impact in a given patient.

Chapter 1 Introduction 20
1.6.1 Pharmacodynamic Interactions
Drugs or herbal medicines can alter the pharmacodynamics of warfarin by their
influence on vitamin K intake and absorption, the rate of synthesis and clearance of
vitamin K-dependent clotting factors, by direct effects on blood coagulation or
platelet function. Pharmacodynamic interactions can occur in many different ways
and by various mechanisms. Their mechanisms are discussed in the following
sections.
Drugs that Affect Vitamin K Intake, Synthesis and Elimination of Vitamin K and
Clotting Factors
Warfarin competes with vitamin K and prevents the hepatic synthesis of various
coagulation factors. There are two main sources of vitamin K in humans. Vitamin K1
is of plant origin and is ingested [50], while vitamin K2 is synthesized by bacteria in
human intestine [51]. Drugs that reduce the systemic availability of vitamin K in the
intestine should be considered to potentially alter the patient’s the response to oral
anticoagulants. For example, Karlson et al [52] reported that a single administration
of 250 µg vitamin K1, 250 g spinach, 250 g broccoli and 37.5 ml wine did not affect
prothrombin time values in patients fed an ordinary diet and warfarin therapy.
However, when vitamin K1, broccoli and spinach were given daily for one week, the
prothrombin time was significantly reduced and the warfarin dose needed to be
adjusted. Furthermore, in a clinical trial study, Kim et al [53] reported that INR on
day 2 following a dose of 10 mg warfarin was 1.18 ± 0.19, which differed
significantly from baseline (INR = 1.00 ± 0.05) and warfarin (10 mg) orally with
vitamin K (10 mg) (INR = 1.06 ± 0.07). INR at baseline was not significantly

Chapter 1 Introduction 21
different from warfarin with vitamin K in a randomized crossover fasted study in
eleven (3 men, 8 women) healthy adults by investigating the effects of oral vitamin K
on S- and R-warfarin. On the other hand, if vitamin K2 production in the intestine is
inhibited, for example, by administration of broad spectrum antibiotics [49] that kill
intestinal microflora, the anticoagulant action of warfarin is increased.
Drugs that Affect Blood Coagulation and Platelet Aggregation
Drugs that have an independent effect on blood coagulation or platelet aggregation
may affect bleeding by distinct mechanisms in patients receiving warfarin therapy.
For example, halofenate [54] and paracetamol [55] have a pharmacodynamic
interaction with warfarin by independently affecting the activity of circulating
coagulation factors. Mercaptopurine [56] increases the activity of circulating of
Factor II which may correspondingly decrease the pharmacological effect of warfarin.
Aspirin and most NSAIDs [57] increase the risk of bleeding in patients receiving
warfarin by inhibition of platelet thromboxane A2 biosynthesis. An added concern
with NSAIDs is the risk of damage to the integrity of epithelial surfaces leading to
major bleeding [58].
1.6.2 Pharmacokinetic Interactions
Pharmacokinetic mechanisms for drug interactions with warfarin comprise mainly of
induction or inhibition of drug metabolising enzymes and to a lesser extent alteration
of plasma protein binding. It is important to note that some drugs may interact by
multiple mechanisms. All of the four major processes that determine the

Chapter 1 Introduction 22
pharmacokinetic behaviour of a drug: absorption, distribution, metabolism and
excretion can be affected by co-administration of other drugs.
Drugs that Affect Warfarin Absorption
Gastrointestinal absorption is slowed by drugs that inhibit gastric emptying or is
accelerated by drugs, which hasten gastric emptying. Alternatively, one drug may
interact with another drug in the gut in such a way as to inhibit absorption of
warfarin. Co-administration of cholestyramine [59], a bile acid binding resin used to
treat hypercholesterolemia, binds to warfarin in the gastrointestinal tract to prevent
its absorption if administered simultaneously. Despite a number of possible
interactions influencing warfarin absorption, the clinical significance of the
interaction is limited because generally warfarin is very rapidly absorbed and also
has a delay in the onset of its pharmacological response.
Drugs that Affect Warfarin Distribution
Although one drug may alter the distribution of another, such interactions are seldom
clinically important [60]. Warfarin is very highly bound to plasma protein (fuS =
0.0051 ± 0.0005, fuR = 0.0062 ± 0.0005) especially to albumin [18] and as a
consequence, small changes in protein binding will therefore lead to correspondingly
large changes in circulating unbound drug. Displacement of a drug from binding sites
in plasma or tissues transiently increases the unbound concentration of warfarin.
However, warfarin has a low hepatic extraction ratio so an increase in fraction
unbound leads to an increased hepatic clearance; a new steady state results in which

Chapter 1 Introduction 23
total drug concentration in plasma is reduced but the unbound drug concentration is
similar with that before. In this case, it should be appreciated that the target
therapeutic concentration range (with respect to total drug) will be altered by co-
administration of a displacing drug. For example, phenylbutazone is capable of
competing with warfarin for these plasma protein binding sites and it has been shown
to increase the unbound fraction of S-warfarin from 0.0062 ± 0.0005 to 0.0111 ±
0.0011 and from 0.0052 ± 0.0005 to 0.0114 ± 0.0015 for R-warfarin [18]. In other
words, the unbound concentration of warfarin almost doubled in over a short period
of time before returning to pre-treatment levels. Furthermore, the protein binding
affinity can be stereoselective. For example, sulfinpyrazone [61] can displace S-
warfarin from its protein binding site to a greater extent than R-warfarin.
Drugs that Affect Warfarin Metabolism
Drug interactions can occur via inhibition or induction of drug metabolism with the
risk of toxicity or reduced drug activity. These cases will be discussed in the
following sections.
Enzyme Induction
Many clinically important drug interactions result from enzyme induction,
particularly for cytochrome P450s. A number of drugs and xenobiotics cause enzyme
induction and thereby decrease the pharmacological activity of a range of other drugs
[62, 63]. For example, the antibiotic rifampicin [64], given for 3 days, reduces the
effectiveness of warfarin as an anticoagulant. In humans, members of the CYP3A
subfamily of P450 enzymes are particularly relevant to drug metabolism because of

Chapter 1 Introduction 24
their broad substrate specificity and their abundance in the liver and intestine.
CYP3A4 alone is involved in the metabolism of greater than 50% of prescription
drugs [62] while approximately 16% of clinically used drugs are metabolized by
CYP2C9 [65]. Furthermore, it has become increasingly evident that the pregnane X
receptor (PXR) as well as other nuclear receptors mediate CYP3A and CYP2C9 [66-
69]. Activation of the PXR and the subsequent induction of CYP3A, CYP2C9 and
other drug metabolising enzymes and transporters by xenobiotics can result, in turn,
in an accelerated metabolism of some medications.
Enzyme Inhibition
Many drugs cause enzyme inhibition, particularly of the cytochrome P450 system.
This can lead to increased drug and metabolite concentrations leading to excessive
drug effects at a given dose. Inhibition of drug metabolism can be either
stereoselective or non-stereoselective. For example, phenylbutazone selectively
inhibits S-warfarin metabolism and cimetidine selectively inhibits R-warfarin
metabolism, whereas amiodarone is known to inhibit the metabolism of both isomers
[36, 70].
Drugs that Have Effects on Warfarin Excretion
Warfarin mainly undergoes hepatic metabolism. After administration of warfarin to
humans, only trace amounts of unchanged warfarin are recovered in the urine [71].
Metabolites of warfarin excreted in urine are inactive, so drug interactions with the
renal excretion of warfarin metabolites are not likely to be clinically significant [27,
71, 72].

Chapter 1 Introduction 25
1.7 St. John's Wort
St John's wort, also called hypericum, consists of the whole plant or cut dried
flowering tops of Hypericum perforatum, harvested during flowering time. This herb
contains not less than 0.08% total hypericins usually expressed as the content of
hypericin (C30H16O8; MW 504.4), calculated with reference to the dried herb [73]. St
John’s wort is widely used in the community for the management of a range of
conditions including depression. The constituents, pharmacology and drug
interactions of St John’s wort have been the subject of several review articles [8, 73-
75].
1.7.1 Chemistry and Pharmacology
St John’s wort has been shown to contain at least nine groups of compounds that may
contribute to the herb’s pharmacological effect; however, the pharmacology of the
many constituents is not yet fully known (Table 1-2).
In a manner similar to conventional antidepressant pharmacology, it is reported that
constituents of St John’s wort may exert a significant affect on catecholamine
neurotransmission via known pathways, including: 1) inhibition of neurotransmitter
metabolism; 2) modulation of neurotransmitter receptor density and sensitivity; and 3)
synaptic reuptake inhibition [76]. St John’s wort extracts have been shown to inhibit
the uptake of serotonin (5-HT) [77], noradrenaline (NA) and dopamine (DA) and it
has also been shown to have a potent affinity for the adenosine, serotonin 5-HT1, and
benzodiazepine and γ-aminobutyric acid (GABA) receptors as well as weakly
inhibiting monoamine oxidase [78].

Chapter 1 Introduction 26
Table 1-2. The main constituents of St John’s wort and possible
pharmacological activity [74-76].
Constituent and percentage of composition Possible action
Anthraquinone derivatives (naphthodianthrones):
Hypericin and pseudohypericin (0.1 – 0.15%) and
isohypericin;
Protohypericin and protopseudohypericin
(biosynthetic precursors of hypericin and
pseudohypericin, respectively);
cyclopseudohypericin
Affinity for σ-opioid
receptors
Flavonoids
Flavonols (2-5%) (eg. kaempferol, quercetin);
Flavones (eg. luteolin);
Glycosides (eg. hyperoside (0.5-2%), isoquercitrin
(0.3%), quercitrin (0.3%), rutin (0.3-1.6%));
Biflavonoids including biapigenin (a flavone) and
amentoflavone (a isomeric to biapigenin derivative);
Catechins (flavonoids often associated with condensed
tannins)
Inhibition of MAO-A
Agonist at
benzodiazepine and
GABA receptor
Prenylated phloroglucinols
Hyperforin (2.0 – 4.5%)
Adhyperforin (0.2 – 1.9%)
Oxygenated analogues of hyperforin
Affinity for GABA
receptors
Inhibition of uptake of 5-
HT, norepinephrine
(NE), DA
Tannins (8-9%)
Proanthocyanidins (condensed type)
Unknown
Other phenols; Caffeic; Chlorogenic; p-coumaric;
ferulic; ρ-hydroxybenzoic; Vanillic acids
Unknown
Volatile oils (0.05 – 0.9%)
Methyl-2-octane (saturated hydrocarbon)
Unknown

Chapter 1 Introduction 27
It has been reported that interleukin-6 could be affected by St John’s wort and that
this might be related to the antidepressant activity of St John’s wort. Hyperforin is
the constituent most likely to contribute to the St John’s wort antidepressant activity
[79]. There have been no published reports suggesting that St John’s wort could
affect platelet aggregation or the coagulation system.
1.7.2 Pharmacokinetics of St John’s Wort Constituents
Hyperforin
Biber et al [80] investigated the oral bioavailability of hyperforin from hypericum
extracts in rats and humans. After oral administration of 300 mg/kg St John’s wort
extract (containing 5% hyperforin) to rats, the Cmax of hyperforin of 370 ng/ml were
reached after 3 h, and the estimated half-life and apparent clearance were 6 h and 70
ml/min/kg, respectively. In this study healthy volunteers received a film-coated tablet
containing 300 mg St John’s wort extract, which is equivalent to a dose of 14.8 mg
hyperforin. LC/MS/MS was used to measure the hyperforin concentration in the
plasma. The hyperforin Cmax, tmax and half-life were estimated to be 150 ng/ml, 3.5 h
and 9 h, respectively. Hyperforin pharmacokinetics were found to be linear up to a
dose of 600 mg of the St John’s wort extract. Increasing the doses to 900 or 1200 mg
of St John’s wort extract resulted in lower that expected Cmax and AUC. Multiple
doses of St John’s wort were also used in the study and no accumulation of
hyperforin in plasma was observed and the steady-state plasma concentrations of
hyperforin were 100 ng/ml after 3 x 300 mg/day of the St John’s wort extract [80].

Chapter 1 Introduction 28
Hypericin and Pseudohypericin
The single- and multiple-dose pharmacokinetics of the naphthodianthrones hypericin
and pseudohypericin derived from St. John's wort (Hypericum perforatum, LI 160,
Lichtwer Pharma GmbH, Berlin) were studied in 12 healthy male subjects. After a
single oral dose of 300, 900 or 1800 mg of dried St John’s wort extract (equivalent to
250, 750, or 1500 µg hypericin and 526, 1578, or 3156 µg pseudohypericin), the
median maximal plasma concentrations were 1.5, 4.1, and 14.2 ng/ml for hypericin
and 2.7, 11.7, and 30.6 ng/ml for pseudohypericin, respectively [81]. The elimination
half-lives of hypericin ranged from 24.8 to 26.5 h, and varied from 16.3 to 36.0 h for
pseudohypericin. Ranging between 2.0 to 2.6 h, the median lag-time of absorption
was longer for hypericin when compared with pseudohypericin (0.3 to 1.1 h). The
area under the plasma drug concentration-time curve (AUC) showed a non-linear
increase with increasing dose; this effect was statistically significant for hypericin.
During long-term dosing (3 x 300 mg/day) steady state was reached after 4 days.
Mean maximal plasma concentrations during the steady-state dosing regimen were
8.5 ng/ml for hypericin and 5.8 ng/ml for pseudohypericin, while mean trough
concentrations were 5.3 ng/ml for hypericin and 3.7 ng/ml for pseudohypericin [81].
1.7.3 St John’s Wort Drug Interactions
Numerous clinical trials have demonstrated that St John’s wort is an antidepressant
indicated in patients with mild to moderate depression [82-84]. Recently, St John’s
wort has been implicated in numerous herb-drug interactions [8]. In response to the
suspected St John’s wort drug interactions, the Food and Drug Administration (FDA)
published a Public Health Advisory announcement [85], stating that warnings need

Chapter 1 Introduction 29
to be added to the St John’s wort labelling. In Australia, the Therapeutic Goods
Administration (TGA) highlighted potentially serious interactions between St John’s
wort preparations and some prescribed medicines including warfarin [86]. But the
suspected interaction between St John’s wort and warfarin has not been systemically
investigated. Furthermore, conflicting results appear in the literature between in vitro
and in vivo studies. St John’s wort drug interactions are reviewed in detail in the
following sections.
Alprazolam
The benzodiazepine alprazolam is a substrate of CYP3A4 [87]. Markowitz et al [88]
suggested that pre-treatment with St. John's wort (300 mg 3 times daily for three
days) taken at recommended doses for depression is unlikely to affect alprazolam
activity in healthy volunteers. The long-term use of St John’s wort can induce
CYP3A4 as demonstrated in several studies [8]. The fact that no significant
difference was found in this study [88] could be related to short term use of St John’s
wort.
Amitriptyline
Several cytochrome P450 enzymes are involved in the metabolism of the tricyclic
antidepressant amitriptyline including CYP2D6, CYP2C19 and CYP3A4 [89]. Johne
et al [90] reported that plasma concentrations of amitriptyline, nortriptyline (a
metabolite of amitriptyline) and other hydroxylated metabolites decreased when

Chapter 1 Introduction 30
amitriptyline was co-administrated with St John’s wort (900 mg daily for 14 days).
Cumulative urinary excretion of amitriptyline and metabolites decreased to the same
extent as plasma concentrations upon co-administration with St John’s wort based on
a clinical trial in twelve patients[89]. Induction of cytochrome P-450 enzymes or
drug transporters (P-glycoprotein) by St. John's wort extract may contribute to this
pharmacokinetic interaction.
Caffeine
Two drug interaction studies [91, 92] have been reported with St John’s wort and
caffeine using different dose regimens; 1) 300 mg, 3 times daily for 28 days, 2) a
single 900 mg oral dose and 300 mg, 3 times daily for 14 days based on clinical trials.
No significant effect was observed on the activity of CYP1A2 using a probe-drug
cocktail including caffeine [91, 92]. Caffeine is a substrate of CYP1A2 [93] and it
was concluded that St John’s wort does not affect CYP1A2 activity. However the
cocktail approach has several limitations. First, the substrates of CYPs are not
directly relevant to a particular drug class. Second, it is important to use a validated
cocktail where there is not drug-drug interaction in them. Furthermore, a cocktail
approach is designed to study drug interaction mechanism in metabolism, which does
not allow assessing pharmacokinetic mechanism (including absorption, distribution,
metabolism and excretion) and pharmacodynamic mechanism.

Chapter 1 Introduction 31
Carbamazepine
The anticonvulsant carbamazepine is a predominantly metabolised by CYP3A4 and
partly by CYP2C8. Burstein et al [94] reported that treatment of eight healthy
volunteers with St John's wort (300 mg 3 times daily for 14 days) did not induce the
clearance of carbamazepine. Carbamazepine is subject to autoinduction so the
authors suggested that St John’s wort might not be potent enough to alter an enzyme
system that is already induced.
Chlorzoxazone and Debrisoquine
By using a probe-drug cocktail including chlorzoxazone and debrisoquine which are
substrates for CYP2E1 [95] and CYP2D6 [96], respectively and measuring single-
time point phenotypic metabolic 6-hydroxychlorzoxazone/chlorzoxazone serum and
debrisoquine urinary recovery ratios, Gurley et al [91] reported that St John’s wort
(300 mg, 3 times daily for 28 days) did not significantly affect the activity of
CYP2E1 and CYP2D6 suggesting that St John’s wort does not affect the metabolic
activity of CYP2E1 and CYP2D6.
Cyclosporin
Numerous case reports of drug interactions between the immunosuppressant
cyclosporin and St John’s wort have been identified including eight kidney transplant
recipients, one heart transplant recipient and one liver transplant recipient [97-105].
In these cases cyclosporin blood concentrations were consistently documented to be
subtherapeutic during co-administration with St John’s wort. One patient developed

Chapter 1 Introduction 32
acute rejection possibly due to low cyclosporin concentrations [97]. Another patient
developed acute graft rejection due to low cyclosporin concentrations, after stopping
treatment with St John's wort, cyclosporin blood levels remained within the
therapeutic range and liver function recovered completely [102]. Dresser et al [106]
reported that multiple doses of St John’s wort (300 mg 3 times daily for 12 days)
increased the clearance of cyclosporin after an oral dose in 21 young healthy subjects.
Furthermore, Bauer et al [107] reported that administration of a St John’s wort
extract (600 mg once daily for 14 days) to renal transplant recipients resulted in a
rapid and significant reduction of blood cyclosporin concentrations. Cyclosporin is a
substrate for the CYP3A4 isoenzyme and P-glycoprotein [108, 109], so the induction
of both CYP3A4 and P-glycoprotein by constituents of St John’s wort may act to
reduce the blood concentration of cyclosporin to subtherapeutic levels. This can lead
to clinically significant consequences such as the rejection of a transplanted organ.
Dextromethorphan
Several drug interaction studies have been performed using the cough suppressant
dextromethorphan as a substrate for CYP2D6 [110] in clinical trials. Roby et al [111]
reported that St John’s wort (300 mg 3 times daily orally for 14 days) failed to elicit
a statistically significant change in dextromethorphan – dextrorphan ratios in thirteen
healthy volunteers. Markowitz et al [88] suggested that pre-treatment with St. John's
wort (300 mg 3 times daily for 3 days) taken at recommended doses for depression is
unlikely to effect CYP2D6 activity in seven healthy volunteers. Furthermore, Wang
et al [92] reported that short-term (3×300 mg, a single oral dose) and long-term St

Chapter 1 Introduction 33
John's wort (300 mg 3 times daily for 12 days) had no significant effect on
dextromethorphan pharmacokinetics (and by inference CYP2D6 activity) in twelve
healthy subjects.
Digoxin
Digoxin, a cardiac inotropic agent, is a substrate for P-glycoprotein [112]. In one
case report, Cheng et al [113] reported a St John’s wort interaction with digoxin.
Durr et al [114] provided evidence from a rat study where St John's wort extract was
administered to rats over 14 days resulting in a 3.8-fold increase of intestinal P-
glycoprotein expression and a 2.5-fold increase in hepatic CYP3A2 expression using
western blot analyses. In the clinical arm of this study, the administration of St John's
wort extract (300 mg × 3 times) to eight healthy male volunteers for 14 days resulted
in an 18% decrease of digoxin exposure after a single digoxin dose (0.5 mg), a 1.4-
and 1.5-fold increase in expression of duodenal P-glycoprotein and CYP3A4,
respectively [114]. These researchers showed a 1.4-fold increase in the functional
activity of hepatic CYP3A4 using the 14C-erythromycin breath test. These results
indicate that St John’s wort induces intestinal P-glycoprotein in rats and humans,
hepatic CYP3A2 in rats, and intestinal and hepatic CYP3A4 in humans. In a separate
study, Johne et al [115] investigated the pharmacokinetics of digoxin in a single-
blind, placebo-controlled parallel study. After the achievement of steady state for
digoxin concentrations on day 5, 13 healthy volunteers received digoxin either with
placebo or with St John’s wort (900 mg/d) for another 10 days. No statistically
significant change was observed after the first dose of St John’s wort extract;

Chapter 1 Introduction 34
however, 10 days of treatment with St John’s wort extract resulted in a significant
decrease of digoxin AUC0-24 by 25%.
Fexofenadine
Several drug interaction studies have been carried out using fexofenadine as a typical
substrate for the drug transporter P-glycoprotein [116] in clinical trials. Dresser et al
[106] reported that St John’s wort (300 mg, 3 times daily for 12 days) increased the
clearance of fexofenadine after oral administration to 21 young healthy volunteers. In
a study by Wang et al [117] fexofenadine (60 mg) was orally administered before a
single dose of St John's wort (900 mg), and after 2 weeks of treatment with St John's
wort (300 mg 3 times a day) to determine P-glycoprotein activity using a three-
period, open-label, fixed-schedule study design. A single dose of St John's wort
significantly increased the maximum plasma concentration of fexofenadine by 45%
and significantly decreased the apparent clearance by 20%, with no change in half-
life or renal clearance. Long-term administration of St John's wort did not cause a
significant change in fexofenadine disposition relative to the control phase.
Compared with the single-dose treatment phase, long-term St John's wort caused a
significant 35% decrease in maximum plasma concentration and a significant 47%
increase in fexofenadine apparent clearance [117]. These results therefore suggest
that single dose of St John’s wort is an inhibitor of P-glycoprotein activity but is an
inducer of P-glycoprotein activity after long-term use (two weeks).

Chapter 1 Introduction 35
Indinavir and Nevirapine
Drug interactions between antiretroviral agents and St John’s wort have been
identified in several case reports. St John’s wort was found to lower nevirapine, Non-
nucleoside Reverse Transcriptase Inhibitors (NNRTIs) or indinavir concentrations in
people with human immunodeficiency virus (HIV) who were co-administered St
John’s wort [118-121]. In vivo studies in humans have shown that nevirapine is
extensively biotransformed via cytochrome P450 metabolism to several hydroxylated
metabolites. In vitro studies with human liver microsomes suggested that oxidative
metabolism of nevirapine is mediated primarily by isoenzymes from the CYP3A
family, although other isoenzymes may have a secondary role [8, 122]. Furthermore,
in a clinical trial in sixteen healthy volunteers, St John's wort significantly reduced
the AUC of the HIV-1 protease inhibitor indinavir by a mean of 57% and decreased
the extrapolated 8 h indinavir trough concentration by 81% [123].
Irinotecan
Mathijssen et al [124] reported the effect of St John’s wort on the metabolism of
irinotecan, a pro-drug of SN-38 and a known substrate for CYP3A4, in 5 cancer
patients treated with intravenous irinotecan in both the presence and absence of St
John’s wort (900 mg daily, orally for 18 days) in an unblinded, randomized crossover
study design. The plasma concentrations of the active metabolite SN-38 decreased by
42% following St John’s wort treatment. The degree of myelosuppression was
substantially worse in the absence of St John’s wort.

Chapter 1 Introduction 36
Midazolam
Several drug interaction studies with St John’s wort have been reported using the
sedative hypnotic midazolam as a typical substrate for CYP3A4 [125, 126]. Dresser
et al [106] reported that St John’s wort (300 mg, 3 times daily for 12 days) increased
the clearance of midazolam after oral and intravenous administration in 21 young
healthy volunteers. Furthermore, Gurley et al [91] reported that St John’s wort (300
mg, 3 times daily for 28 days) significantly induced the activity of CYP3A4 using a
probe-drug cocktail including midazolam by measuring single-time point phenotypic
metabolic ratios. Interestingly, Wang et al [92] reported that short-term
administration of St John's wort (a single 3×300 mg oral dose) had no effect on CYP
activities but longer-term St John's wort (300 mg, 3 times daily for 14 days)
administration caused a significant increase in the apparent clearance of midazolam
using both oral midazolam (to study intestinal wall and hepatic CYP3A) and
intravenous midazolam (to investigate hepatic CYP3A) in 12 healthy subjects.
Pravastatin and Simvastatin
The effects of St John's wort on the pharmacokinetics of the lipid lowing drugs
simvastatin and pravastatin were investigated by Sugimoto et al [127]. St John's wort
capsule (300 mg, three times a day for 14 days) was taken by sixteen healthy male
subjects (n = 8 in group 1 and n = 8 in group 2) in a double blind, crossover study.
On day 14, a single oral dose of simvastatin (10 mg) and pravastatin (20 mg) was
given to subjects in group 1 and group 2, respectively. Plasma concentrations of
simvastatin and simvastatin hydroxyl acid, an active metabolite, were significantly

Chapter 1 Introduction 37
reduced by coadministration with St John’s wort while plasma concentrations of
pravastatin were not affected. Simvastatin is metabolized by CYP3A4 in the
intestinal wall and liver. No significant differences were observed in the elimination
half-life of simvastatin or pravastatin. The results of this study suggest that the
interaction is caused by the enhancement of the CYP3A4-mediated first-pass
metabolism of simvastatin in the small intestine and liver. The lack of an interaction
with pravastatin is probably because the major metabolites of pravastatin are
produced by chemical degradation in the stomach rather than by cytochrome P450-
dependent metabolism in the liver and is mainly excreted into urine and bile [128].
Theophylline
The bronchodilator theophylline is a substrate for CYP1A2 [129]. Nebel et al [130]
reported the potential metabolic induction of theophylline by coadministration of St
John’s wort based on a case report. In an in vitro study, Karyekar et al [131] reported
that St John’s wort increased the expression of CYP1A2 in LS180 cells in a
concentration dependent manner. The induction was time-dependent, since enzyme
levels returned to baseline within 4-8 hours after removal of St John’s wort
constituents. This induction may be responsible for the observation of reduced
plasma theophylline concentrations during co-administration of St John’s wort [8,
131]. But this finding is in contrast with the results of an in vivo study using caffeine
as typical substrate for CYP1A2 [91, 92].
Chapter 1 Introduction 38
Tolbutamide
Tolbutamide is a substrate of CYP2C9 [132]. Wang et al [92] reported that short-
term administration of St John's wort (3×300 mg, a single oral dose) and long-term
St John's wort (300 mg 3 times daily for 12 days) administration in twelve healthy
subjects did not significantly affect tolbutamide pharmacokinetics.
Warfarin
Potential St John’s wort interactions with warfarin have been reported in the
literature. There are a number of case reports suggesting that co-administration of St
John’s wort decreases the effects of warfarin [8]. The Medical Products Agency
(MPA, Sweden) has received seven case reports of a reduced anticoagulant effect
and decreased INR of warfarin associated with co-administration of St John’s wort
[75]. Similarly, over the period October 1992 to September 2000, the United
Kingdom (UK) Committee on Safety of Medicines and the Medicines Control
Agency received 35 reports of suspected interactions between St John’s wort and
conventional medicines of which four were related to potential interactions with
warfarin [74], two reported an increase in INR and two cases reported a decrease in
INR. However no systematic investigation of the clinical significance and possible
mechanism of a St John’s wort interaction with warfarin have been reported.
Oral contraceptives
Oral contraceptive steroids are metabolised by cytochrome P450 [8]. Two drug
interactions with St John’s wort have been identified based on case reports. Schwarz

Chapter 1 Introduction 39
et al [133] reported an unwanted pregnancy upon self-medication with St John’s
wort despite hormonal contraception while Ratz et al [134] reported a case of
irregular bleeding upon co-administration of St John’s wort and oral contraceptives.
While these cases are suggestive of herb-drug interaction, two recent controlled
clinical trials have provided more definitive information.
Hall et al [135] reported that coadministration with St John's wort was associated
with a significant increase in the apparent clearance of norethindrone and a
significant reduction in the half-life of ethinyloestradiol. The study was conducted in
twelve healthy premenopausal women who had been using oral contraception for 3
months as a combination oral contraceptive pill containing ethinyloestradiol and
norethindrone for 3 consecutive 28-day menstrual cycles. The participants were
administered St John's wort (300 mg, 3 times a day) during the second and third
cycles. The serum concentrations of ethinylestradiol (day 7), norethindrone (day 7),
follicle-stimulating hormone (days 12-16), luteinizing hormone (days 12-16),
progesterone (day 21), and intravenous and oral midazolam (CYP3A4) (days 22 and
23) were measured. The incidence of breakthrough bleeding was quantified during
the first and third cycles. The apparent oral clearance of midazolam was significantly
increased during St John's wort administration, but the systemic clearance of
midazolam was unchanged. Serum concentrations of follicle-stimulating hormone,
luteinizing hormone, and progesterone were not significantly altered by St John's
wort treatment. Breakthrough bleeding occurred in 2 of 12 women in the control
phase compared with 7 of 12 women in the St John's wort phase. Induction of
ethinyloestradiol and norethindrone metabolism caused by St John’s wort was

Chapter 1 Introduction 40
consistent with increased CYP3A activity, which was demonstrated by using
midazolam as a probe for this drug metabolism enzyme. In another study, Pfrunder et
al [136] investigated the interaction between an oral contraceptive and St John’s wort
using eighteen healthy females treated with a low-dose oral contraceptive (0.02 mg
ethinyloestradiol, 0.150 mg desogestrel) alone or combined with St John's wort
extract (300 mg, twice daily or three times daily). Ovarian activity was assessed by
measuring follicle maturation and serum concentrations of oestradiol and
progesterone. During co-administration of low-dose oral contraceptive and St John's
wort, there was no evidence of ovulation and no significant change in follicle
maturation or serum sex hormone concentrations. However, significantly more
subjects reported intracyclic bleeding during combined treatment with St John's wort
extract (300 mg, twice daily) (13/17) and coadministration with St John's wort
extract (300 mg, three times daily) (15/17) than with oral contraceptives alone (6/17).
The Cmax and AUC0-24 of ethinyloestradiol were not changed during and study cycle,
whereas the AUC0-24 and Cmax of 3-ketodesogestrel decreased significantly during
administration of both St John's wort extract regimens. These data strongly suggest
the potential for a serious interaction between oral contraceptives and St John’s wort.
Others Drugs
One in vitro study demonstrated that St. John's wort constituents (hyperforin and
quercetin) significantly inhibited the metabolic activity of CYP1A2 (hyperforin IC50:
3.87 µM; quercetin IC50: 11.6 µM), CYP2C9 (hyperforin IC50: 0.01 µM; quercetin
IC50: 3.14 µM), CYP2C19 (hyperforin IC50: 0.02 µM; quercetin IC50: 6.13 µM)

Chapter 1 Introduction 41
CYP2D6 (hyperforin IC50: 12.03 µM; quercetin IC50: 21.0 µM)and CYP3A4
(hyperforin IC50: 4.2 µM; quercetin IC50: 19.52 µM) by analysing the conversion of
specific surrogate substrates measured fluorometrically in a 96-well plate format
[137]. Roby et al [138] reported that treatment with St John's wort (300 mg 3 times a
day for 14 days) resulted in significant increases in the urinary 6-beta-
hydroxycortisol/cortisol (a phenotype indicator of CYP3A4) ratio using healthy
volunteers. In an in vitro study, Obach et al [139] reported that crude extracts of St
John’s wort demonstrated inhibition of each of the five isoenzymes CYP2D6,
CYP2C9, CYP3A4, CYP1A2 and CYP2C19. The three former enzymes were more
sensitive than the two latter enzymes to inhibition by St John’s wort crude extracts.
The flavonoid compound I3, II8-biapigenin of St John’s wort was shown to be a
potent, competitive inhibitor of CYP3A4, CYP2C9 and CYP1A2 activities [139].
Hyperforin was a potent non-competitive inhibitor of CYP2D6 activity and
competitive inhibitor of CYP2C9 and CYP3A4 activities. Hypericin also
demonstrated potent inhibition of several CYP activities. Budzinski et al [140]
reported that St. John's wort has demonstrated in vitro CYP3A4 inhibitory capability
by means of a fluorometric microtitre plate assay. Furohyperforin, a mono-oxidized
hyperforin isolated from St John’s wort (MW 552, IC50 4.49 µM) was reported to be
less potent as an inhibitor compared to other hyperforin analogues (IC50 0.072 – 0.2
µM). The hyperforin analogues with MW 588 (IC50 0.072 µM) and MW 522 (IC50
0.079 µM) were the most potent inhibitors of CYP3A4 [141] using a fluorometric
method to measure the fluorescence of the substrate metabolite fluorescein. These in
vitro data suggesting that St John’s wort and its constituents are inhibitors of drug

Chapter 1 Introduction 42
metabolising enzymes is in striking contrast to in vivo data, which implicate long
term St John’s wort administration as an inducer of drug metabolism.
Enzyme Expression
Several in vitro studies have been performed to determine the effect of St John’s
wort on drug metabolising enzyme and transporter expression. In one in vitro study,
Perloff et al [142] exposed LS-180 intestinal carcinoma cells to St John’s wort
extract for 3 days. P-glycoprotein expression was strongly induced after exposure to
St John’s wort extract in a concentration-dependent manner. In Caco-2 cell
monolayers, St John’s wort significantly induced P-glycoprotein expression at
clinically relevant concentrations of its constituents. As previously discussed, the in
vivo study by Durr et al [114] demonstrated that St John's wort extract induced
hepatic CYP3A2 in rats, and intestinal and hepatic CYP3A4 in humans. In a clinical
trial using healthy volunteers who were randomized to receive either St John’s wort
(600 mg three times daily) for 16 days (in 15 subjects) or placebo (in 7 subjects),
Hennessy et al [143] reported that St John’s wort extract increased expression and
enhanced the drug efflux function of the multi drug transporters P-glycoprotein in
peripheral blood lymphocytes.
In summary, long-term use of St John’s wort extract in human subjects induces the
activity of CYP3A4 and P-glycoprotein but the available evidence suggests that the
herb has less of an effect on CYP1A2, 2E1, 2D6 and 2C9. Furthermore, conflicting
results were found between in vivo and in vitro studies. The role of individual

Chapter 1 Introduction 43
constituents of St John’s wort in herb-drug interactions has not been conclusively
investigated in vivo.
1.8 Panax Ginseng
In this thesis the term ginseng, also called Korean ginseng, refers to the whole or cut
dried root of Panax ginseng. Ginseng contains not less than 0.40% of combined
ginsenosides Rg1 (C42H72O14, 2H2O, = 837) and Rb1 (C54H92O23, 3H2O, = 1163),
calculated with reference to the dried herb [144]. Ginseng has been used in
Traditional Chinese Medicines to enhance stamina and capacity to cope with fatigue
and physical stress [145]. Numerous constituents, pharmacological activities and
drug interactions of ginseng have been reported in the literature [146-148].
1.8.1 Chemistry and Pharmacology
The chemistry and pharmacology of ginseng constituents have been reviewed by
Gillis et al [145] and Attele et al [147]. Ginseng typically contains panaxadiols
including ginsenoside Rb1 (0.38%), Rb2 (0.13%), Rc (0.19%), Rd (0.04%), Rg3,
Rh2 and Rh3, panaxatriols including ginsenoside Re (0.15%), Rf (0.09%), Rg1
(0.38%), Rg2 (0.02%) and Rh1, and oleanic acid including ginsenoside Ro. Most of
the pharmacological actions of ginseng are attributed to the ginsenosides [147].
However, more than twenty ginsenosides have been isolated. Some major
pharmacological effects are summarised in the following sections.
Chapter 1 Introduction 44
Ginseng has been claimed to have both stimulatory and inhibitory effects on the
central nervous system (CNS) including memory, learning and behaviour [149] and
may modulate neurotransmission. Ginsenosides Rb1 and Rg1 are thought to play a
major role in the effects of ginseng on the CNS [150, 151]. Several ginsenosides
show direct cytotoxic and growth inhibitory effects against tumour cells in vitro via
different mechanisms [152, 153]. Other studies have shown ginseng to induce
differentiation as well as to inhibit metastasis [154, 155] based on in vitro and animal
studies. Furthermore, ginseng and individual ginsenosides have demonstrated effects
on cardiovascular physiology by a mechanism involving nitric oxide [145].
Numerous in vitro and in vivo studies have been performed on the effect of ginseng
constituents on platelet aggregation and coagulation. One in vitro study in humans by
Park et al [156] reported that the non-saponin fraction from the roots of ginseng
inhibited the aggregation of human platelets induced by thrombin in a dose-
dependent manner by regulating the levels of cGMP and thromboxane A2 (TXA2).
Teng et al [157] reported that panaxynol markedly inhibited the aggregation induced
by collagen, arachidonic acid, adenosine diphosphate (ADP), ionophore A23187,
platelet activating factor (PAF) and thrombin of washed platelets while ginsenosides
had no significant effect on the aggregation. Even so, ginsenoside Ro (1 mg/ml) did
inhibit the ATP release from platelets. Kimura et al [158] reported that among six
saponins tested; only ginsenoside Rg1 inhibited adrenaline- and thrombin-induced
platelet aggregation and serotonin release in a dose-dependent manner. Park et al
[159] reported that the lipophilic fraction from ginseng increased cGMP directly and
cAMP indirectly and thus inhibited thrombin- or collagen-induced platelet

Chapter 1 Introduction 45
aggregation in one in vitro rat study. In another in vitro study using rabbit platelet,
Kuo et al [160] reported that panaxynol and ginsenosides Ro, Rg1, and Rg2 were
found to be the main antiplatelet components. In addition, panaxynol inhibited the
aggregation, release reaction, and thromboxane formation in rabbit platelets while
ginsenosides Ro, Rg1, and Rg2 suppressed the release reaction only. In one in vitro
study, Yun et al [161] reported using a platelet aggregation assay with human
platelet rich plasma, Korean red ginseng significantly inhibited thrombin (IC50 >2
mg/ml), ADP (IC50, 0.72 mg/ml), or collagen (IC50, 0.32 mg/ml) induced platelet
aggregation. Furthermore, in a study conducted in rats [159], both the prothrombin
time and activated partial thromboplastin time (APTT) were prolonged in vivo by the
action of the lipophilic fraction (25 mg) from ginseng on rat platelet aggregation
induced by collagen or thrombin. Blood coagulation and cGMP levels were also
significantly increased.
1.8.2 Pharmacokinetics of Ginseng Constituents
Few pharmacokinetic studies of the constituents of ginseng have been reported in
human subjects. Cui et al [162] determined that approximately 1.2% of the oral dose
of protopanaxatriol ginsenosides (3 mg) and smaller amounts of the protopanaxadiol
ginsenosides not exceeding 0.2% of the administered dose (7 mg) were recovered in
urine over five days after a single dose of ginseng to healthy subjects. However,
Shibata et al [163] reported that neither the individual ginsenosides nor their
metabolites could be identified except compound-K, which is the main intestinal
bacterial metabolite of protopanaxadiol ginsenosides, was identified in human serum
using a specific enzyme immunoassay 8 h after oral administration of ginseng. Panax

Chapter 1 Introduction 46
notoginseng is different with Panax ginseng but it also contains ginsenoside Rb1 and
Rg1. Very low bioavailability of ginsenoside Rb1 and ginsenoside Rg1 were found
by Xu et al [164] after Panax notoginseng was administered to rats and serum
samples were measured using an established HPLC method to quantitate ginsenoside
Rb1 and Rg1. The decline in the concentrations of Rb1 in serum was described by a
two-compartment pharmacokinetic model. The distribution half-life was reported as
23.4 min and the elimination half-life was 18.0 h. Ginsenoside Rb1 was absorbed
from the gastrointestinal tract and the absolute bioavailability after oral
administration was estimated to be only 4.35%. The pharmacokinetics of Rg1 in rats
also was described by a two-compartment model with distribution and elimination
half-lives were 24.23 and 14.13 h, respectively. Ginsenoside Rg1 was absorbed in
the gastrointestinal tract and the oral bioavailability was estimated to be 18.4% [164].
1.8.3 Ginseng Drug Interactions
Ginseng has been used for thousands years and was listed in the top five selling
herbal products for 2002 [165]. It could be expected that co-administration of
ginseng with other conventional medicines is likely to be very high. However,
relatively little information regarding herb-drug interactions with ginseng can be
found in the literature. The available data are summarised in the following section.
This thesis will focus on ginseng (Panax ginseng) which is different to Siberian
ginseng (Eleuthroccus senticosus) containing eleutherosides B and eleutherosides E
[166] and Panax notoginseng containing ginsenoside Rb1 and Rg1 [164].

Chapter 1 Introduction 47
Caffeine, Chlorzoxazone, Debrisoquine and Midazolam
Gurley et al [91] reported that administration of ginseng had no significant effect on
CYP3A4, CYP1A2, CYP2E1, and CYP2D6 activity in twelve healthy volunteers
who were randomly assigned to receive either ginseng or other herbal medicines for
28 days with a 30-day washout period between each treatment phase. A cocktail of
probe drugs including midazolam (CYP3A4), caffeine (CYP1A2), chlorzoxazone
(CYP2E1), and debrisoquin (CYP2D6) were administered before ginseng (baseline)
and after ginseng pre-treatment. To determine the relative metabolic activity of
CYP3A4, CYP1A2, CYP2E1, and CYP2D6, metabolic ratios including 1-
hydroxymidazolam/midazolam serum ratios (1-hour sample), paraxanthine/caffeine
serum ratios (6-hour sample), 6-hydroxychlorzoxazone/chlorzoxazone serum ratios
(2-hour sample), and debrisoquine urinary recovery ratios (8-hour collection) were
used to compare with or without coadministration, respectively [91].
Warfarin
In a case report, a 47-year-old man had received anticoagulation therapy with
warfarin since 1990 to prevent embolic events. The dosage of warfarin and INR had
been stabilised for past nine months. The patient’s INR was 3.1 four weeks before
co-ingestion of ginseng. Two weeks after the patient started taking ginseng, his INR
declined to 1.5. Ginseng was discontinued, and the INR returned to 3.3 in two weeks
[167]. However, in an animal study, Zhu et al [168] reported that there was no
significant impact of ginseng on the pharmacokinetics or pharmacodynamics of
warfarin using either single or multiple doses administration in male rats. Despite
these conflicting observations, the possible effects of ginseng’s constituents on

Chapter 1 Introduction 48
platelet aggregation still provides the possibility of a pharmacodynamic interaction
with warfarin in humans.
Other Drugs
Based on in vitro experiments that investigated the catalytic activity of c-DNA
expressed cytochrome P450 isoforms, Henderson et al [169] reported that the
ginsenosides including Rb1, Rb2, Rc, Rd, Re, Rf, and Rg1 and eleutherosides
including B and E are not likely to inhibit the metabolism of coadministered
medications in which the primary route of elimination is via cytochrome P450
including CYP1A2, CYP2C9, CYP2C19, CYP2D6 and CYP3A4. Increasing
concentrations of these ginsenosides and eleutherosides were incubated with a panel
of recombinant human CYP isoforms and their effects on the conversion of specific
surrogate substrates were measured fluorometrically in a 96-well plate format. In a
clinical trial, Anderson et al [165] reported that administration of ginseng (100 mg
standardized to 4% ginsenosides, two times a day for 14 days) did not significantly
alter the urinary 6-β-hydroxy-cortisol/cortisol ratio, leading to the suggestion that
ginseng does not affect CYP3A4. Kim et al [170] reported that the standardized
saponin of red ginseng showed inhibitory effects on CYP450-associated
monooxygenase activities in a dose-dependent manner. These in vitro studies found
that p-nitrophenol hydroxylase activity, which has been shown to represent the CCl4-
activating CYP450 2E1 enzyme, was inhibited. Chang et al [171] reported on CYP1
catalytic activity as assessed by 7-ethoxyresorufin O-dealkylation. The ginsenosides
Rb1, Rb2, Rc, Rd, Re, Rf, and Rg1, either individually or as a mixture and at the
levels reflecting those expected in vivo did not influence CYP1 activities. However,

Chapter 1 Introduction 49
at a higher ginsenoside concentration (50 mg/ml), Rb1, Rb2, Rc, Rd, and Rf
inhibited the enzyme’s activity.
In summary, no significant ginseng-drug interactions have been demonstrated in the
literature by in vivo or in vitro studies in therapeutic range of concentrations of
ginseng constituents. Furthermore, the poor bioavailability of ginseng constituents
ginsenoside Rb1 and Rg1 following administration of ginseng casts doubt on
potential interactions in vivo (See Section 1.8.2).
1.9 Ginkgo Biloba
Ginkgo is the dried leaf of Ginkgo biloba. It is generally collected in autumn when
leaves are green and leaves are dried immediately. Ginkgo biloba contains not less
than 0.40% of total amount of flavonol glycosides, calculated on the dry basis [172].
1.9.1 Chemistry and Pharmacology
The constituents of primary interest in ginkgo (Ginkgo biloba L.) leaf are terpenoid
compounds including ginkgolides (ginkgolides A, B, C, J and M), bilobalide and
phenolic compounds including flavonoids (flavones, biflavones, flavonols, tannins
and associated glycosides) [173]. The standardised leaf extract is prepared by a multi
step purification process to a 35 - 67:1 (average 50:1) ratio of dried leaves to final
concentrated extract. The extract is standardised to contain 22-27% flavonol
glycosides (determined as quercetin, kaemferol and isorhemnetin usually determined
by HPLC and calculated as quercetin and kaemferol glycosides with molar masses of

Chapter 1 Introduction 50
756.7 and 740.7, respectively), 5%-7% terpene lactones consisting of approximately
2.8-3.4% ginkgolides A, B and C and approximately 2.6-3.2% bilobalide; and below
5 ppm ginkgolic acids. The ginkgo leaf extract of the EGb 761 is standardised to
contain 24% flavonol glycosides and 6% terpene lactones [73].
Ginkgo has been claimed to have various pharmacological actions which have been
reviewed in several articles [174-177]. Ginkgo has been reported to have effects on
the cardiovascular and circulatory systems [178], peripheral vascular system [179],
neurological, psychological and behavioural function [180], immune system [181],
and the metabolic and nutritional systems [173].
The effects of ginkgo on thrombosis, hemostasis and embolism have also been
reported [173]. These effects provide the suggestion of a potential pharmacodynamic
interaction with warfarin. However, conflicting results have been observed in the
literature regarding the effect of ginkgo on clotting status. Several in vitro studies
have demonstrated that ginkgo extract or ginkgolides A, B and C can inhibit platelet
PAF rather than ADP or arachidonic acid induced platelet aggregation [182-185].
Furthermore, in clinical trials, collagen-induced platelet aggregation was inhibited
after an intravenous infusion of a ginkgo extract in 24 patients suffering from
arteriosclerotic disorders [186]. In another study, ginkgo extract significantly reduced
collagen but not PAF-mediated platelet aggregation in healthy volunteers and Type 2
diabetic subjects in a clinical trial in which 120 mg of standardised extract was
ingested for 3 months [187]. Reports that ginkgo does not affect clotting status have
also been reported. An in vitro study found that up to 0.2 mg/ml of ginkgo extract did

Chapter 1 Introduction 51
not inhibit ADP and collagen-induced aggregation of rat platelets [188]. In another
prospective, double blind, randomised, placebo-controlled study in 32 young male
healthy volunteers; ginkgo extract (EGb761) did not alter any haematological marker
using three doses of ginkgo extracts 120, 240 and 480 mg/day for 14 days [189]. In
this study, primary haemostasis was assessed by both the bleeding time measured by
the 3-point Ivy-Neison technique and a direct quantitative measurement of blood loss
according to the Bernal-Hoyos methods. The interaction between platelets and
coagulation was assessed using the thrombin generation test in platelet rich plasma.
Several methods were used to assess platelet function including (i) by platelet
aggregation in citrated platelet rich plasma, induced by three different agonists:
adenosine diphosphate (2.5 µM), thrombin receptor agonist peptide (25 µM) and
collagen (1.25 µg/ml); (ii) by quantification of platelet membrane glycoproteins and
(iii) by measurement of procoagulant activity assessed by annexin fixation on the
platelet membrane [189].
1.9.2 Pharmacokinetics of Ginkgo Constituents
Ginkgolide A, B, C and bilobalide
Drago et al [190] reported that a dose of Gingko biloba extract (40 mg twice daily
for 7 days) was accompanied by a significantly longer half-life of ginkgolide B (t1/2
= 11.64 ± 5.2 h) than gingko biloba extract (a single 80 mg dose daily for 7 days) (t1/2
= 4.31 ± 0.49 h), even though the latter caused a higher peak concentration of
ginkgolide B. The tmax of ginkgolide B was 2.3 h after administration in two different
dosage regimens for orally administered Gingko biloba extract using twelve healthy
volunteers randomly assigned to different treatment groups with a 21 day washout

Chapter 1 Introduction 52
period. Fourtillan et al [191] reported that after oral administration of 120 mg EGb
761 containing ginkgolide A (1.44 mg), ginkgolide B (1.03 mg) and bilobalide (3.36
mg) to twelve healthy volunteers, the mean absolute bioavailability was 80%, 88%
and 79% for ginkgolide A, B and bilobalide, respectively, while ginkgolide C was
not bioavailable. A significant amount of the given dose was excreted unchanged in
urine [191]: ginkgolide A (72.3%), ginkgolide B (41.4%) and bilobalide (31.2%)
after oral administration. The t1/2 was 4.5, 10.6 and 3.2 h for ginkgolide A, B and
bilobalide, respectively. The volumes of distribution were 36.9 L for ginkgolide A
and 53.6 L for ginkgolide B. There was no relevant influence of food on the
pharmacokinetics of ginkgolide A, B and bilobalide (Table 1-3). The
pharmacokinetics of these ginkgo constituents were found to be linear over the dose
range of 80 to 240 mg of EGb 761. The clearances in elderly people were lower (7.1
vs. 10.1 L/h for ginkgolide A, 8.4 vs. 9.7 L/h for ginkgolide B, 20.1 vs. 52.2 L/h for
bilobalide) when compared with young volunteers [191].
Table 1-3. Pharmacokinetic parameters of ginkgolide A, B and bilobalide after
oral administration of 120 mg EGb 761 under fasted and fed conditions (Data
extracted from [192]).
Cmax
(ng/ml)
tmax (h) AUC
(ng.h/ml)
F (%) fe(%) t1/2 (h) CL (L/h)
Fasting
Ginkgolide A
Ginkgolide B
Bilobalide
33.3 ± 9.1
16.5 ± 5.0
18.1 ± 8.8
1.1 ± 0.7
1.2 ± 0.7
1.2 ± 0.8
146.4 ± 21.5
109.9 ± 20.6
79.0 ± 39.0
0.8 ± 0.1
0.9 ± 0.2
0.8 ± 0.3
72.3 ± 12.3
41.4 ± 12.9
31.2 ± 10.1
4.5 ± 1.6
10.6 ± 3.6
3.2 ± 0.6
10.1 ± 1.6
9.7 ± 2.2
52.2 ± 26.2
After breakfast
Ginkgolide A
Ginkgolide B
Bilobalide
21.1 ± 4.3
11.5 ± 2.6
11.8 ± 6.7
2.0 ± 0.5
2.5 ± 0.6
2.9 ± 1.4
159.4 ± 52.5
112.3 ± 37.4
77.0 ± 33.0
0.9 ± 0.2
0.9 ± 0.2
0.8 ± 0.3
58.4 ± 12.3
40.0 ± 8.0
14.2 ± 12.2
4.0 ± 0.6
9.5 ± 3.2
4.3 ± 2.1
9.7 ± 2.4
9.9 ± 2.6
50.0 ± 17.8

Chapter 1 Introduction 53
1.9.3 Ginkgo Drug Interactions
Ginkgo has been widely used in many countries with the claims that it assists
peripheral circulation and improves memory and cognitive function [173]. A review
of ginkgo-drug interactions is presented in the following section.
Caffeine, Chlorzoxazone, Debrisoquine and Midazolam
Gurley et al [91] found no significant effect on CYP3A4, CYP1A2, CYP2E1, and
CYP2D6 metabolic activity in twelve healthy volunteers who were randomly
assigned to receive either ginkgo or other herbal medicines for 28 days with a 30-day
washout period between each treatment phase. In this study, a cocktail of probe drugs
including midazolam (CYP3A4), caffeine (CYP1A2), chlorzoxazone (CYP2E1), and
debrisoquine (CYP2D6) was administered before ginkgo and after pre-treatment with
ginkgo to determine the relative metabolic actability of these enzymes. However, this
study using the cocktail approach is not directly relevant to a particular drug class
and pharmacodynamic interactions remain unknown.
Digoxin
An open-labeled, randomized, crossover trial was conducted in eight healthy human
volunteers to investigate the potential interaction between ginkgo and digoxin. In the
first phase of this study, volunteers were randomly assigned to receive ginkgo (80
mg, three times daily) for one week, then ingested a single dose of digoxin (0.5 mg)
with ginkgo for another two days while other volunteers received digoxin alone. No

Chapter 1 Introduction 54
significant difference between treatments was observed with respect to digoxin
pharmacokinetics [193].
Diltiazem
In vitro and in vivo studies in rats by Ohnishi et al [194] reported that the addition of
ginkgo to small intestinal and hepatic microsomes inhibited the formation of N-
demethyl diltiazem, an active metabolite of diltiazem produced by CYP3A, in a
concentration-dependent manner. The pre-treatment significantly decreased the
elimination rate constant (k) of diltiazem following intravenous administration of
diltiazem. These results indicated that the concomitant use of Ginkgo biloba in rats
increased the bioavailability of diltiazem by inhibiting both intestinal and hepatic
metabolism, via inhibition of CYP3A [194]. However, data from animal may infer
the potential interactions but are not possible to conclusively assess clinical
significance in humans.
Ibuprofen
Meisel et al [195] described a case report of the fatal intracerebral mass bleeding
associated with co-ingestion of Ginkgo biloba and the NSAID ibuprofen (600 mg
daily) in a 71-year old patient who had been taking ginkgo (40 mg, twice daily) for at
least 2 years and 6 months. The fatal intracerebral mass bleeding in this patient was
suspected to be intensified due to the inhibition of the TXA2–dependent platelet
aggregation conferred by ibuprofen and ginkgo. However, uncontrolled
observational study may overestimate the significance.

Chapter 1 Introduction 55
Nicardipine
An in vivo study in rats by Shinozuka et al [196] reported that the feeding of ginkgo
extracts to rodents for 4 weeks significantly reduced the hypotensive effect of the
calcium channel blocker nicardipine, which is reported to be metabolized by
CYP3A2 in rats. But clinical significance remains unknown.
Warfarin
Engelsen et al [197] have conducted a randomised, double blind, placebo-controlled
crossover clinical trial in twenty-four outpatients on stable, long-term warfarin
treatment with two week wash out period. These researchers found that
coadministration of ginkgo extract (100 mg daily for four weeks) did not influence
the INR of warfarin. However, the effect of ginkgo on the pharmacokinetics of
warfarin was not investigated in this study.
Other Drugs
Zou et al [137] reported that constituents of Ginkgo biloba (ginkgolic acids I and II
rather than ginkgolide A, B and C), respectively, inhibited CYP1A2 (IC50 (µM): 4.81,
4.88), 2C9 (IC50 (µM): 2.41, 1.94), 2C19 (IC50 (µM): 4.22, 4.41), 2D6 (IC50 (µM):
10.42, 7.82) and 3A4 (IC50 (µM): 6.74, 6.25) metabolic activity of the cDNA human
P450 isoforms during in vitro experiments to measure their effects on the conversion
of specific substrates measured fluorometrically in a 96-well plate format. The
constituent bilobalide was found to inhibit the metabolic activity of CYP2D6 (IC50
(µM): 11.23). However, isolated tissues or microsomes may not reflect in vivo
response.

Chapter 1 Introduction 56
Enzyme Expression
Several in vivo studies in rats have suggested that ginkgo extract is capable of
inducing drug metabolism. Shinozuka et al [196] reported that male rats were fed
either a control diet or diet containing ginkgo for 4 weeks. The ginkgo diet markedly
induced levels of CYP2B1/2, CYP3A1 and CYP3A2 mRNA in the rodent liver. But
the levels of CYP1A1, CYP1A2, CYP2E1, CYP2C11 and CYP4A1 were unchanged.
Furthermore, Umegaki et al [188] reported that in rats, the concentration of CYPs
and activity of various CYP enzymes in the rodent liver were increased in a dose-
and time-dependent manner. The induction of CYP2B enzyme by ginkgo extract was
confirmed by Western blot analysis [188].
In summary, in vitro studies suggest ginkgo constituents inhibited enzyme activity of
CYP3A whereas in vivo studies in animals suggest the herb is an inducer to CYP3A2,
2B1/2 and 3A1. Data from a number of studies also suggests that ginkgo does not
affect CYP3A4, CYP1A2, CYP2E1, CYP2D6, CYP2C9, CYP1A1, CYP 2C11 and
CYP4A1.
1.10 Ginger
Ginger consists of the peeled, dried, whole or cut rhizome of Zingiber officinale,
either completely or from the wide flat surfaces only. Whole or cut, ginger contains
not less than 15 ml/kg of essential oil, calculated with reference to the dried herb
[198]. Constituents, pharmacological activity and potential drug interactions have
been reported for ginger [199, 200].

Chapter 1 Introduction 57
1.10.1 Chemistry and Pharmacology
Ginger contains volatile oils (1-3%), and the main constituents of these oils are
sesquiterpene hydrocarbons in which the most abundant are zingeberene (35%) and
farnesene (10%). Pungent compounds are considered to be responsible for the
biological effect of ginger [200]. The major constituents found among these are
different types of gingerols (33%) which are a series of homologous compounds
differentiated by the number of carbon atoms in their side-chain: 10, 12 and 14
carbon atoms give rise to [6]-, [8]- and [10]-gingerols, respectively. The [6]-gingerol
constituent is the most common. With prolonged storage of ginger, large amounts of
[6], [8]- and [10]-shogaols are also found which are the dehydrated form of the
gingerols [200] .
Numerous pharmacological effects have been documented in the literature including
gastrointestinal, cardiovascular, serotonin antagonistic effects [200]. The following
section reviews the effect of ginger and its constituents on platelet aggregation and
coagulation.
A series of synthetic gingerols and related phenylalkanol analogues were found to
inhibit arachidonic acid-induced platelet serotonin release and aggregation based on
an in vitro study using human platelets [201]. Furthermore, it was found in in vitro
studies that a significant effect of ginger extract was to inhibit platelet aggregation.
Srivastava et al [202-204] reported that ginger extract extracted using three organic
solvents: n-hexane, chloroform and ethyl acetate reduced platelet thromboxane

Chapter 1 Introduction 58
formation from exogenous arachidonic acid and also inhibited platelet aggregation
induced by arachidonic acid, epinephrine, ADP and collagen in a dose-dependent
manner. Suekawa et al [205] reported that (6)-Shogaol, a pungent component of
ginger, inhibited arachidonic acid - induced platelet aggregation in rabbits. In a
clinical trial, 5 g of dry ginger in two divided doses with a fatty meal was reported to
significantly inhibit the platelet aggregation induced by ADP and epinephrine in ten
healthy male volunteers in whom platelet aggregation was enhanced by 100 g butter
for 7 days while there was no significant alteration in platelet aggregation in the
placebo control group (10 healthy male volunteers) [205]. In addition, using a single
dose of 10 g powdered ginger, a significant reduction in platelet aggregation induced
by ADP and epinephrine was observed in patients with coronary artery disease while
no significant effect was found using a dose of 4 g daily for 3 months [206].
However, conflicting findings related to the effect of ginger constituents on platelet
aggregation are found elsewhere in the literature. In animal studies, no significant
effect on the coagulation parameters PT and APTT or on warfarin-induced changes
in blood coagulation was found in rats using multiple 100 mg/kg doses of
EV.EXT™33, which is a ginger extract of patented standardised ethanol extract of
dry rhizomes of Zingiber officinale Roscoe [207]. Lumb et al [208] investigated the
effects of 2 g dried ginger or placebo capsules on platelet function using eight
healthy male volunteers in a randomised double blind study. Bleeding time, platelet
count, thromboelastography and whole blood platelet aggregometry were measured
before, 3 h, and 24 h after the capsules. There were no significant differences found
between ginger and placebo [208].

Chapter 1 Introduction 59
1.10.2 Pharmacokinetics of Ginger Constituents
After bolus intravenous administration of a 3 mg/kg dose of ginger extract in rats, the
pharmacokinetics of [6]-gingerol were described by a two-compartment open
pharmacokinetic model. [6]-Gingerol was rapidly cleared from plasma with a
terminal elimination half-life of 7.2 min and a total body clearance of 16.8 ml/min/kg.
Serum protein binding of [6]-gingerol was reported to be 92.4% [209]. There are no
data describing the pharmacokinetics of ginger constituents in humans.
1.10.3 Ginger Drug Interactions
Ginger is a spice which is used daily in our society and with claims for aiding travel
sickness and nausea relief [73]. The possibility of herb-drug interactions with ginger
is expected in our community. The following sections provide a literature review of
the available evidence supporting ginger – drug interactions.
Paracetamol
In a randomised double-blind crossover trial, ginger (1 g) or placebo was
coadministered with paracetamol to 16 healthy volunteers. Gastric emptying and the
absorption of paracetamol was not affected by co-ingestion with ginger [210].
Warfarin
In studies conducted in rats, the effects of patented standardised ginger extract on
blood coagulation were studied. It was found that ginger had no significant effect on
warfarin-induced changes in blood coagulation, suggesting that this herb does not

Chapter 1 Introduction 60
interact with warfarin [207]. However, because of the possible effects of ginger’s
constituents on platelet aggregation, the possibility of a pharmacodynamic
interaction with warfarin in humans cannot be excluded.
Enzyme Expression
Banerjee et al [211] investigated the influence of certain essential oils including
ginger oil on carcinogen-metabolizing enzymes and acid-soluble sulfhydryls in
mouse liver and found ginger oil (10 µl/day for 14 days by gavage) did not
significantly affect CYP levels.
In summary, the available information suggests there is no conclusive evidence
supporting pharmacokinetic drug interactions with ginger. However, ginger has been
found to have a range of pharmacological effects including the inhibition of platelet
aggregation based on several in vitro studies. The possible pharmacodynamic
interaction with the anticoagulant drug warfarin remains to be clarified.
Chapter 2 General Methodology 61
Chapter 2 General Methodology
2.1 Clinical Study
2.1.1 Overview of Warfarin Drug Interaction Clinical Trial Designs
The anticoagulant drug warfarin remains one of the most frequently investigated
drugs in interaction studies with new chemical entities [9]. This section presents a
review of the literature of warfarin drug interaction studies with a focus on
methodological aspects of clinical trial design and in particular on the dose
administration to healthy volunteers.
The source of data for this review was obtained from MEDLINE 1966 to 2003
including articles listed under the search terms “warfarin” and “interactions”. Studies
were limited to clinical trials involving humans. Articles were reviewed to examine
the study design, dose of warfarin and all cases of subject withdrawal from drug
interaction studies involving warfarin related adverse events.
Table 2-1 summarises the outcome of the literature review. In this review there were
58 papers identified describing 50 studies conducted in healthy volunteers and eight
studies conducted in both male and female patients. The use of a single 25 mg dose
of warfarin was the most widely used dose in warfarin drug interaction clinical trials
involving healthy subjects. There were only eight reports of volunteer withdrawal
due to warfarin side effects from the 58 studies, which represented a total of 704
subjects.

Chapter 2 General Methodology 62
Table 2-1. Summary of clinical study designs to assess warfarin-drug
interactions.
Aspect of Study design Total References
Papers 58 papers
Studies using healthy subjects 50 papers (male, 670
subjects; female, 34 subjects)
Studies using patient subjects 8 papers (158 patients)
Studies using multiple doses 26 papers (Dose adjusted
according to the target INR)
5 mg 1 paper [212]
7.5 mg 1 paper [213]
10 mg 1 paper [214]
20 mg 1 paper [215]
25 mg 16 papers [216-231]
30 mg 7 papers [232-238]
50 mg 1 paper [239]
0.36 mg/kg 1 paper [240]
0.75 mg/kg 1 paper [241]
Stud
ies u
sing
sing
le d
ose
: 31
pape
rs
1.5 mg/kg 1 paper [18]
Number of volunteers
withdrawn due to ADR to
warfarin
8 subjects
Note: In one paper the dose of warfarin administered was unknown.
ADR: Adverse drug reaction

Chapter 2 General Methodology 63
Based on the data presented in this review, it can be concluded that it is safe and
reasonable to study drug interactions of warfarin in healthy male volunteers taking a
single oral dose of 25 mg of warfarin.
2.1.2 Subjects
The two clinical studies conducted as part of this research had an identical study
design. Twenty-four healthy male subjects were recruited into the two separate
studies (n=12 in each study). Subjects were non-smokers and selected based on the
following subject inclusion and exclusion criteria. A post-hoc power calculation
indicated that twelve subjects in a crossover study would provide an 80% chance of
detecting a 20% difference in the AUC0-∞ of S-warfarin at the p=0.05 level of
significance. All participants gave written informed consent before entering the study.
The study was approved by both the St Vincent’s Hospital Research Ethics
Committee and Human Ethics Committee of the University of Sydney.
Subject Inclusion Criteria
Subjects who fulfilled the following criteria were eligible for inclusion into this study:
1. Subjects must be healthy male volunteers aged 18 to 50 years and within 15%
of ideal body weight for height and build.
2. Subjects must be in good health based on medical history, physical
examination, and clinical laboratory test results including haematological test
with a full differential blood count and haemostasis investigation (platelet
aggregation and INR) and serum concentrations of creatinine, albumin, total
bilirubin and total protein.

Chapter 2 General Methodology 64
3. The current or past medical conditions of subjects must NOT be likely to
significantly affect their pharmacokinetic or pharmacodynamic response to
warfarin.
4. Subjects must not have taken any medication for at least two weeks before
commencing the study.
5. The subjects must be willing and able to comply with the “Information for
Participants”.
Subject Exclusion Criteria
The subjects who did not meet the subject inclusion criteria would not be eligible for
inclusion into this study.
1. Subject requesting cessation of treatment.
2. Subjects with any current or past medical condition that might significantly
affect their pharmacokinetic or pharmacodynamic response to warfarin were
excluded from the study.
3. Subject experiencing an adverse event that deemed to be sufficiently severe.
The adverse event must be recorded.
4. Subject that exhibits non-compliance with the protocol.
5. INR of subject is greater than 4.5 (at which time medical management might
warrant vitamin K administration).
2.1.3 Warfarin and Herbal Medicine Products
Coumadin™ (Warfarin sodium, Boots Healthcare Australia Pty Ltd, North Ryde
NSW, Australia) was used in these two clinical trials. The commercially available

Chapter 2 General Methodology 65
preparations of St John’s wort, ginseng, ginkgo and ginger used in these two studies
were chosen according to an assessment of the quality of various brands and also
conformity of the dose with that recommended in the Herbal Medicine-Expanded
Commission E Monographs. The qualitative assessment of a range of herbal
medicine products are described in Chapter 4. Proprietary products Bioglan® (St
John’s wort, each tablet containing standardised dry extract equivalent to 1 g
Hypericum perforatum flowering herb top, 0.825 mg hypericin and 12.5 mg
hyperforin; Batch 1331-2, Bioglan Ltd, Kirrawee NSW, Australia), Golden Glow
(Korean ginseng, each capsule containing extract equivalent to 0.5 g Panax ginseng
root and 8.93 mg ginsenosides as ginsenoside Rg1; Batch K0125, Queensland
Biochemics Pty Ltd, Virginia Qld, Australia), Tavonin™ (Ginkgo biloba, each tablet
containing the standardised dry extract, EGb761, equivalent to 2 g of Ginkgo biloba
leaf, 9.6 mg of ginkgo flavonglycosides, 2.4 mg of ginkgolides and bilobalide, Batch
6250202, Epping NSW, Australia) and Blackmore’s Travel Calm Ginger (Zingiber
officinale, each tablet containing extract equivalent to 0.4 g of ginger rhizome
powder, Batch 103863, Balgowlah NSW, Australia) were used in these two clinical
trials.
2.1.4 Study Design and Dose Administration
Both study designs were based on a 3 × 3 Latin Square (Table 2-2). It was an open
label, controlled three-treatment, three-period, three-sequence crossover study with at
least 14-day washout period between period I, period II and period III of dosing. An
equal number of subjects were randomly assigned to each of the three possible
dosing sequences.

Chapter 2 General Methodology 66
Table 2-2. 3 × 3 Latin Square study design.
Period Group
I II III
1. (Subject 1 – 4) A B C
2. (Subject 5 – 8) B C A
3. (Subject 9 – 12) C A B
Study I
A: A single 25 mg warfarin dose.
B: St John’s Wort doses (one tablet, three times daily) for 13 days, then a single 25
mg warfarin dose co-administered with multiple St John’s wort doses (one tablet,
three times daily) for a further 7 days.
C: Ginseng doses (two capsules, three times daily) for 6 days, then a single 25 mg
warfarin dose co-administered with multiple ginseng doses (two capsules, three times
daily) for a further 7 days.
Study II
A: A single 25 mg warfarin dose.
B: Ginkgo doses (two tablets, three times daily) for 6 days, then a single 25 mg
warfarin dose co-administered with multiple ginkgo doses (two tablets, three times
daily) for a further 7 days.
C: Ginger doses (three tablets, three times daily) for 6 days, then a single 25 mg
warfarin dose co-administered with multiple ginger doses (three tablets, three times
daily) for a further 7 days.

Chapter 2 General Methodology 67
2.1.5 Randomisation
Subject sequence numbers were allocated to the twelve subjects when they registered.
Following which, subjects were assigned a random number generated using
Microsoft Excel. In this manner, subjects were assigned to one of the three treatment
groups (Table 2-3).
Table 2-3. Randomisation.
Subject Sequence No. 1 2 3 4 5 6 7 8 9 10 11 12
Subject Random No. 2 2 3 3 1 3 2 1 1 1 2 3
Subject Group No. 2 2 3 3 1 3 2 1 1 1 2 3
2.1.6 Sample Collection and Analysis
In both studies, blood samples (20 ml) were collected into both sodium citrate and
EDTA tubes via an indwelling cannula or by venipuncture. Sampling times in
relation to warfarin dosing were: -48, -24, 0, 1, 2, 4, 8, 12, 24, 48, 72, 96, 120, 144
and 168 h. Whole blood was collected to measure platelet aggregation while plasma
was harvested by centrifugation (at 1500 g for 10 min) to determine the INR. A
portion of plasma was stored frozen until the time of drug concentration analysis.
Urine (24 h) was collected before and after administration of warfarin dose for three
days. The volume of urine was recorded and a portion was stored frozen for
subsequent analysis.

Chapter 2 General Methodology 68
2.2 HPLC Assay for Warfarin Enantiomers
The concentrations of S-warfarin and R-warfarin in plasma were determined using a
modified version of the high performance liquid chromatography (HPLC) assay by
Naidong et al [242] which employed a chiral HPLC column (Silica-bonded β-
cyclodextrin, Cyclobond™, Astec, Alltech Associates Australia Pty Ltd, Baulkham
Hills, NSW, Australia) with fluorescence detection. In brief, aliquots (0.5 ml) of
plasma were spiked with the internal standard (I.S., naproxen) and sulfuric acid
solution (0.35 ml, 0.5 M) and then extracted with dichloromethane: hexane (1:5, 4 ml)
on a roller for 15 min. The organic phase was decanted after separation by
centrifugation (at 1500 g for 10 min) and freezing the aqueous phase in dry ice. The
organic layer was evaporated to dryness under nitrogen and reconstituted in
acetonitrile (200 µl) and an aliquot (20 µl) was injected onto the column. The mobile
phase comprised of acetonitrile: triethylamine: glacial acetic acid (100:0.2:0.3,
v/v/v/v) with a flow rate of 1 ml/min. Measurements were made using a fluorescence
detector (RF 535, excitation wavelength 310 nm, emission wavelength 400 nm,
Shimadzu Scientific Instruments (Oceania) Pty Ltd, Rydalmere, NSW, Australia).
Unknown concentration in plasma samples from the clinical trial were analysed in
duplicate with five different concentrations of standard samples in plasma for
standard curve and low, medium and high concentration of the quality control
samples in plasma.

Chapter 2 General Methodology 69
2.3 HPLC Assay for S-7-hydroxywarfarin
The concentrations of S-7-hydroxywarfarin in urine were determined using a
modified version of the HPLC assay by Naidong et al [242] which employed a chiral
HPLC column (Silica-bonded β-cyclodextrin, Cyclobond™, Astec, Alltech
Associates Australia Pty Ltd, Baulkham Hills NSW, Australia) with fluorescence
detection. In brief, aliquots (0.1 ml) of urine samples were spiked with internal
standard (naproxen) and sulfuric acid solution (0.5 M, 0.1 ml) and then extracted
with dichloromethane: hexane (1:2, 4 ml). After 30 min on a roller bed mixer, the
organic phase was decanted after separation by centrifugation (at 1500 g for 10 min)
and freezing the aqueous phase in dry ice. The organic layer was evaporated to
dryness under nitrogen and reconstituted in acetonitrile (200 µl) and an aliquot (20 µl)
injected onto the column. The mobile phase comprised of acetonitrile: methanol:
triethylamine: glacial acetic acid (100:1.5:0.3:0.25, v/v/v/v) with a flow rate of 1
ml/min. Measurements were made using a fluorescence detector (Shimadzu RF 535,
excitation wavelength 310 nm, emission wavelength 400 nm, Shimadzu Scientific
Instruments (Oceania) Pty Ltd, Rydalmere, NSW, Australia). Unknown
concentration urine samples from the clinical trial were analysed in duplicate with
five different concentrations of standard samples in urine for standard curve and low,
medium and high concentrations of the quality control samples in urine.
2.4 Plasma Protein Binding
The unbound fractions of S-warfarin and R-warfarin in plasma were assessed by
ultrafiltration (Centrifree® YM-30, Millipore Australia Pty Ltd, North Ryde, NSW,

Chapter 2 General Methodology 70
Australia). Rac-warfarin (10 µg) was added to 1 ml of pooled plasma obtained from
each subject between the sampling times of 1-8, 12-72 and 96-168 h after warfarin
dose. After centrifuging at 1800 g for 20 min at 37oC, the ultrafiltrate was collected
for drug concentration measurement. The concentration of each warfarin enantiomer
in the ultrafiltrate and in plasma was measured by the validated HPLC method. In
brief, plasma ultrafiltrate (0.2 ml) containing warfarin, 10 µl of I.S. solution
(naproxen; 0.0341 mg/ml) and sulfuric acid (0.5 M, 140 µl) were added. After
mixing, dichloromethane: hexane (1:5, 2 ml) was added as an extraction solvent.
After roller bed mixing for 15 min, centrifuging at 1500 g for 10 min and freezing
the aqueous phase in dry ice, the organic phase was separated and evaporated to
dryness under nitrogen and the residue was reconstituted in 100 µl of the mobile
phase. A 50 µl of the reconstituted residue was injected into the HPLC. The fraction
unbound (fu) was calculated as the ratio of the concentration of each warfarin
enantiomer in the ultrafiltrate to that in plasma. All of the samples were analysed in
duplicate.
2.5 INR Measurement
Warfarin therapy can be monitored by measuring the prothrombin time (PT) or
International Normalised Ratio (INR). A number of methods can be used to measure
the effect of warfarin in individuals, including the measurements of vitamin K1 and
vitamin K1 2,3 epoxide concentration [243], γ-carboxyglutamic acid concentration
[244] and clotting factor concentrations [245]. Of the various methods available, the
PT test or INR test is the most common method for monitoring the effect of oral
anticoagulants [14]. The PT is responsive to depression of three of the four vitamin

Chapter 2 General Methodology 71
K-dependent clotting Factors (II, VII and X), which can be reduced in the presence
of warfarin at a rate proportional to the respective half-lives of these factors (Figure
2-1). The principle of the method is described in Equation 2-1.
Citrated plasma + Thromboplastin + CaCl2 Fibrin Clot Equation 2-1
Thromboplastin is a phospholipid-protein extract of tissue usually lung, brain or
placenta, containing both the tissue factor and phospholipid necessary to promote the
activation of Factor X by Factor VII. During induction of anticoagulant treatment,
the PT primarily reflects the depression of Factor VII, since this factor has the
shortest half-life (4-6 h) among the vitamin K-dependent factors. During
maintenance therapy, this test is sensitive to depression of prothrombin (Factor II),
Factor VII and Factor X [246].
Thromboplastins vary in their responsiveness to the anticoagulant effects of warfarin,
depending on their source, phospholipid content and preparation [247]. The
responsiveness of thromboplastins can be measured by assessing their International
Sensitivity Index (ISI). Difference in thromboplastin responsiveness was the main
reason for clinically important differences in oral anticoagulant dosing. In 1983, the
INR system proposed by Kirkwood was adopted by the World Health Organization
(WHO) which then made international PT standardisation possible [248]. The
calculation of INR is described in Equation 2-2.
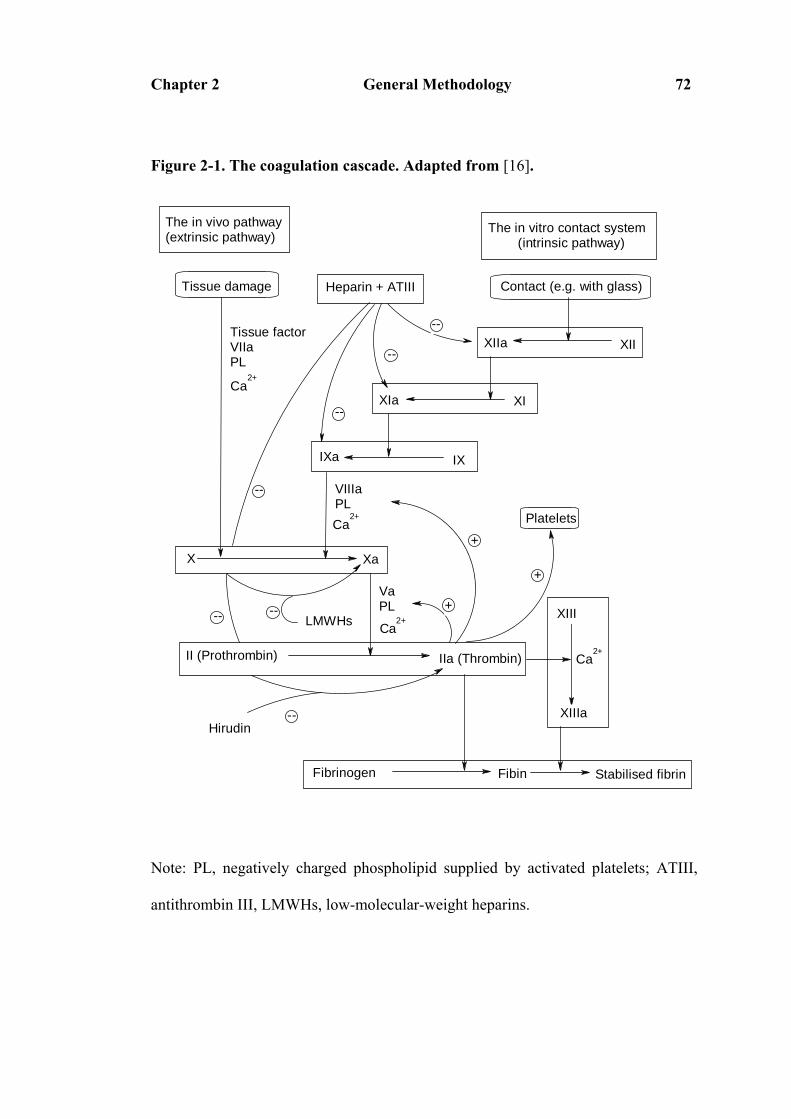
Chapter 2 General Methodology 72
Figure 2-1. The coagulation cascade. Adapted from [16].
Platelets
The in vivo pathway(extrinsic pathway)
The in vitro contact system (intrinsic pathway)
Tissue damage Heparin + ATIII Contact (e.g. with glass)
XIIa XII
XIa XI
IXa IX
X Xa
VIIIaPLCa
2+
II (Prothrombin) IIa (Thrombin)
XIII
XIIIa
Ca2+
Fibrinogen Fibin Stabilised fibrin
Tissue factorVIIaPL
Ca2+
VaPL
Ca2+LMWHs
Hirudin
--
--
--
--
-- -- +
+
+
--
Note: PL, negatively charged phospholipid supplied by activated platelets; ATIII,
antithrombin III, LMWHs, low-molecular-weight heparins.

Chapter 2 General Methodology 73
INR = (patient PT/mean normal PT)ISI Equation 2-2
The measurement of INR in the present study was conducted according to the
instructions supplied by the manufacturer (Dade Behring, Australia) in the principles
of the method. The coagulation process is triggered by incubation of plasma with the
optimal amount of thromboplastin and calcium. The time to formation of a fibrin clot
is then measured. Thromborel S (human thromboplastin/calcium reagent for one
stage prothrombin time, Dade Behring, Diagnostics Pty Ltd, Lane Cove NSW,
Australia) was reconstituted according to the labelled amount of distilled water and
warmed to 37oC before use (after reaching 37oC the reagent must be incubated at this
temperature for at least 30 minutes). Citrated plasma (50 µl) was pipetted into a Dade
Behring cuvette pre-warmed to 37oC and incubated for 1 min at 37oC; 100 µl of
Thromborel® S (warmed to 37oC) was pipetted to the Dade Behring Coagulometer
analyser. On the addition of the Thromborel® S reagent, the timer on the
coagulometer (Dade Behring, Diagnostics Pty Ltd, Lane Cove NSW, Australia) was
started and the PT was determined. INR is calculated using Equation 2-2, where
International Sensitivity Index (ISI) is provided for the Thromborel® S reagent by the
manufacturer. All of the samples were analysed in duplicate.
2.6 Platelet Aggregation Measurement
Numerous methods have been reported for measuring platelet function including
photo-optical (turbidimetric) methods of platelet aggregometry, impedance methods

Chapter 2 General Methodology 74
of platelet aggtegometry, viscometry, Clot retraction, PFA-100 and rapid platelet
function assay. The advantages and disadvantages of these methods have been
reviewed in several review articles [249-251]. Impedance platelet aggregation was
introduced in 1980 by Cardinal and Flower [252] as an alternative to photo optical
aggregometry that could also be applied to whole blood samples. The advantage of
this method is that whole blood is more physiologic, a smaller quantity of blood is
needed for testing, and it can be performed quickly and conveniently.
Platelet activation can be induced by a variety of chemical and mechanical methods
via several distinct intracellular pathways [251] (Figure 2-2). Adenosine
disphosphate (ADP) has been the agonist most commonly used for turbidimetric
aggregation studies. The relevance of collagen as an agonist stems from the
abundance of collagen in the subendothelium, which is exposed at the time of arterial
injury. The use of collagen as an agonist is limited by variability between production
lots that occur at the time of harvest. Arachidonic acid and TXA2 are weak platelet
agonists that are completely inhibited by aspirin. Thrombin is the most potent platelet
agonist; however, thrombin-induced platelet aggregation has several limitations
including lot-to-lot variability, storage requirements and the ability of thrombin to
activate the coagulation cascade and thus interfere with the assay. Recently, a
thrombin receptor agonist peptide (TRAP) has been used to replace thrombin to
allow activation of platelets through the thrombin receptor without activating
fibrinogen into fibrin [253].

Chapter 2 General Methodology 75
Figure 2-2. Platelet activation cascade. Adapted from [16].
Note: ADP, adenosine disphosphate; GP, glycoprotein; NO, nitric oxide; TXA2,
thromboxane A2
Ruptured atherosclerotic plaque

Chapter 2 General Methodology 76
Platelet aggregation was measured in these studies using a whole-blood
aggregometer (Chrono-par®, Chrono-log Corporation, USA, supplied by Edward
Keller Australia Pty Ltd, Hallam, Vic, Australia) according to the manufacturer’s
instructions. Briefly, pre-warmed whole blood (1 ml) diluted 1 in 2 (one part of
blood to one part of saline) with normal saline was incubated at 37oC for 2 min
(stirring speed-1200 rpm). Platelet aggregation was induced by adding arachidonic
acid (10 µl, 50 mM stock concentration, Chrono-par®, Chrono-log Corporation,
USA, supplied by Edward Keller Australia Pty Ltd, Hallam, Vic, Australia). A
change in impedance was recorded for 6 min after stimulation with arachidonic acid
and reported as impedance aggregation (ohm). All of the samples were analysed in
duplicate.
2.7 Data Analysis
2.7.1 Model Independent Pharmacokinetic and Pharmacodynamic Analysis
The pharmacokinetic parameters for warfarin enantiomers were estimated using two
approaches; model independent and model dependent methods (See Section 2.7.2).
The elimination rate constant (k) of warfarin enantiomers was obtained by linear
regression analysis of the terminal log-linear portion of the warfarin enantiomer
concentration – time curve. Elimination half-life (t1/2) was calculated as ln2/k. The
area under the plasma S-warfarin and R-warfarin concentration-time curves until the
last concentration observation (AUC0-t) were calculated using the trapezoidal rule.
The AUC was extrapolated to infinity (AUC0-∞) using Ct/k where Ct is the last
measured S-warfarin or R-warfarin concentration occurring at time “t”. The highest
S-warfarin and R-warfarin concentrations (Cmax) and the time that these occurred

Chapter 2 General Methodology 77
(tmax) were obtained by observation without interpolation. Apparent clearance (CL/F)
and apparent volume of distribution (V/F) for the warfarin enantiomers were
calculated as Dose/2/AUC0-∞ and CL/F/k, respectively. INR was reported as the area
under the INR versus time curve (AUC0-168 of INR) and calculated by the trapezoidal
method. Also the INRmax and tmax of INR were reported. Urinary excretion rate (UER)
of S-7-hydroxywarfarin was calculated as the amount of metabolite eliminated (Ae,m)
over the sample collection time interval (T).
2.7.2 Pharmacokinetic-Pharmacodynamic Modelling
Equation 2-3 and Equation 2-4 were combined with Equation 2-5 to produce a
combined PK/PD model as described by Chan et al [18]: the enantiomer
concentration-time data was described using the one-compartment Pharmacokinetic
model with first order absorption (ka) and elimination (k). Such that;
C t F D2 V
kaka k
e eRR R
k t t ka t tR d dbg e jb g b g=⋅⋅
FHG
IKJ −FHG
IKJ −− − − −
Equation 2-3
C t F D2 V
kaka k
e eSS S
k t t ka t tS d dbg e jb g b g=⋅⋅
FHG
IKJ −FHG
IKJ −− − − −
Equation 2-4
where CR(t) and CS(t) are the concentrations R- and S-warfarin at time (t).

Chapter 2 General Methodology 78
dPCAdt
k 100
1Cu tCu
Cu tCu
PCAd
S
50,S
R
50,R
S R=
+FHG
IKJ +
FHG
IKJ
−
L
N
MMMMM
O
Q
PPPPPbg bgγ γ
Equation 2-5
The terminology used in these equations is defined in Section1.4.2. An additional
pharmacodynamic parameter was introduced to account for the observed delay in
PCA change after warfarin administration. Anticoagulant response data was obtained
as INR, so in order to fit these data using the proposed PK/PD model, response data
was transformed to PCA with the use of the functional relationship between INR and
PCA (percentage of normal activity) described in Equation 2-6.
PCA(% normal) aINR b
=− Equation 2-6
in where a = 80.65 and b = 0.18. The values of the constants a and b were determined
by fitting Equation 2-6 to PCA% and INR data (Figure 2-3) obtained using serial
dilutions of pooled normal plasma. This relationship was substituted into the
combined equation to allow direct application of INR data.

Chapter 2 General Methodology 79
Figure 2-3. PCA%-INR standard curve (n=4).
y = 0.0124x - 0.0022R2 = 0.9985
0.00
0.01
0.02
0.03
0.04
0.05
0.06
0.00 1.00 2.00 3.00 4.00 5.00
INR
1/(P
CA
%)
Then the pharmacokinetic-pharmacodynamic modelling of warfarin enantiomer was
analysed using Scientist® for Windows™ Version 2.0 (MicroMath, Inc., Salt Lake
City, Utah 84121) to estimate PK/PD parameters.
2.7.3 Statistical Analysis
The PK/PD parameters were compared using analysis of variance (ANOVA)
followed by the post hoc multiple comparisons with Dunnett using Stata® 5.0 (Stata
Corporation, USA) and SPSS® 11.0 (SPSS Inc., USA) for sequence, period and
treatment effects. The 95% confidence interval (CI) was used for the descriptive
presentation of study parameters while the 90% CI of the ratio of logarithmically
transformed parameters was used to compare control (warfarin alone) and treatment
(warfarin with herbal medicine) phases. It was deemed that an interaction lacked
clinical significance if the 90% CI values fell within the range 80%-125%. A p-value
of less than 0.05 was considered significant.

Chapter 3 Validation of Analytical Methods 80
Chapter 3 Validation of Analytical Methods
3.1 Calibration of HPLC Assay for Warfarin Enantiomers in
Human Plasma and S-7-hydroxywarfarin in Urine
3.1.1 Introduction
An assay capable of quantifying warfarin enantiomers in human plasma and S-7-
hydroxywarfarin in human urine is necessary for the present study. Several HPLC
methods have been developed for the determination of warfarin enantiomers in
human plasma in the literature. The HPLC methods can be classified into two
categories: methods (Table 3-1) that employ derivatisation of warfarin to
diastereoisomers followed by an achiral HPLC separation and methods (Table 3-2)
that employ a chiral HPLC stationary phase column to directly separate enantiomers.
The major issue of methods requiring derivatisation is the optical purity of the chiral
derivatising agent and the reaction efficiency. Methods requiring derivatisation can
also be time consuming and laborious hence most recent assays of warfarin
enantiomers have focussed on using chiral stationary phase. There are several kinds
of chiral stationary phases which are used in stereoselective HPLC that have been
used to separate warfarin enantiomers, such as Chiralcel OC (Cellulose), Chiralcel
OD (Cellulose), Achiral/chiral (C8/Chiral-AGP), Silica-bonded β-cyclodextrin and
achiral/chiral (Bovine serum albumin/ Pinkerton) (Table 3-2).

Chapter 3 Validation of Analytical Methods 81
Det
ecto
r
UV
: 313
nm
Fluo
resc
ence
Ex
: 313
nm
Em
: N/A
Fluo
resc
ence
Ex
: 313
nm
Em
: 370
nm
Prec
isio
n
N/A
N/A
8.6-
11%
Acc
urac
y
N/A
N/A
105.
9-10
8.6%
Sens
itivi
ty
96-1
60 n
g
50-1
00 n
g
5 –
10 n
g/m
l
Res
olut
ion
fact
or
N/A
N/A
N/A
Col
umn
type
an
d de
riva
tisin
g ag
ent
Silic
a;
Car
bobe
nzyl
oxy-
L-pr
olin
e
Silic
a an
d po
st-
colu
mn
amin
olys
is w
ith
n-po
st-c
olum
n;
Car
bobe
nzyl
oxy-
L-pr
olin
e
Silic
a an
d hy
drol
ysed
pos
t-co
lum
n;
(-)-
HC
A
Tab
le 3
-1. H
PLC
met
hods
for
usin
g ch
iral
der
ivat
isin
g ag
ents
for
assa
y of
war
fari
n en
antio
mer
s in
hum
an p
lasm
a.
Ref
eren
ce
Ban
field
et a
l [2
54]
Ban
field
et a
l [2
55]
Car
ter e
t al
[256
]
N/A
: Not
ava
ilabl
e; H
CA
: hep
t-5-e
ne-2
-car
boxy
lic a
cid
Ex: E
xcita
tion;
Em
: Em
issi
on

Chapter 3 Validation of Analytical Methods 82
Det
ecto
r
Fluo
resc
ence
Ex
: 315
nm
Em
: 370
nm
UV
: 312
nm
Fluo
resc
ence
Ex
: 300
nm
Em
: 390
nm
UV
: 320
nm
N/A
MS/
MS
Prec
isio
n
R-:
3.6-
9.5%
S-
: N/A
<9.6
%
N/A
S-: 1
2.1%
R
-: 9.
7%
N/A
S-: <
7.3%
R
-: <6
.5%
Acc
urac
y
90%
96.9
-103
91.2
-93.
3%
N/A
N/A
S-:<
7.3%
(bia
s)
R-:5
.8%
(bia
s)
Sens
itivi
ty
25 n
g/m
l
R-:
20 n
g/m
l S-
: 40
ng/m
l
50 n
g/m
l
12.5
ng/
ml
N/A
1 ng
/ml
Res
olut
ion
fact
or
>1.5
5.6
1.64
>1.5
1.05
N/A
Col
umn
type
Chi
ralc
el O
C
(Cel
lulo
se)
Chi
ralc
el O
D
(Cel
lulo
se)
Ach
iral/c
hira
l (C
8 / C
hira
l –
AG
P)
Silic
a-bo
nded
β-
cycl
odex
rin
Ach
iral/c
hira
l (B
ovin
e se
rum
al
bum
in/P
inke
rto
n)
Silic
a-bo
nded
β-
cycl
odex
rin
Tab
le 3
-2. H
PLC
met
hods
usi
ng c
hira
l sta
tiona
ry p
hase
for
assa
y of
war
fari
n en
antio
mer
s in
hum
an p
lasm
a.
Ref
eren
ce
And
erse
n et
al
[257
]
Taka
hash
i et a
l [2
58]
McA
leer
et a
l
[259
]
Nai
dong
et a
l [2
42]
Chu
et a
l [26
0]
Nai
dong
et a
l [2
61]
N/A
: Not
ava
ilabl
e

Chapter 3 Validation of Analytical Methods 83
The main disadvantage of such an approach is the expense and relatively short life of
the column.
A modified version of the assay by Naidong et al [242] was employed in the present
investigation of warfarin enantiomer concentrations in plasma and S-7-
hydroxywarfarin in urine. This assay was chosen because it demonstrates excellent
enantiomer resolution, high sensitivity and longer column stability compared with
other assays.
3.1.2 Materials and Methods
Materials and Reagents
Racemic warfarin (98%, Lot 65H12131) was purchased from Sigma-Aldrich (Sigma-
Aldrich Pty. Ltd., NSW, Australia), S-7-hydroxywarfarin (98%) was purchased from
UFC Ltd (Manchester, England), naproxen (Lot B-6-JD-006) was obtained from
Syntex laboratories, Inc. (Palo Alto, Calif., USA). All organic solvents were of
analytical grade and purchased from Biolab (Mulgrave, Vic, Australia) including
dichloromethane (Mallinkrodt, ChromAR®), hexane (Mallinkrodt, ChromAR®),
acetonitrile (B&J Brand ®), triethylamine (AJAX Chemicals, UNILAB), acetic acid,
glacial (AJAX Chemicals, UNIVAR) and sulfuric acid was purchased from (AJAX
Chemicals, UNIVAR).

Chapter 3 Validation of Analytical Methods 84
Instrumentation
The HPLC system consisted of an autosampler (Waters 715 Ultra WISP Sample
processor), pump (Shimadzu, LC-10 AS), detector (Hitachi, F1000, Fluorescence
Spectrophotometer, with the excitation wavelength was set at 310 nm and the
emission wavelength was set 400 nm), the β-cyclodextrin analytical column
(Cyclobond I 2000 column of 250×4.6 mm, Cat. No.20024, Ser. No. 13175, Astec,
Whippany, NJ, USA, purchased from Alltech Associates Pty Ltd, Australia) and β-
cyclodextrin guard column (Cyclobond I 2000 column of 20×4.0 mm, Cat. No.
21100, Ser. No. 000815, Astec, Whippany, NJ, USA, Alltech Associates Pty Ltd,
Australia). The flow rate was 1.0 ml/min. The mobile phase was acetonitrile:
triethylamine: glacial acetic acid (100:0.2:0.3, v/v/v) for the separation of the
warfarin enantiomers in human plasma assay. Whereas, the mobile phase was
acetonitrile: methanol: triethylamine: glacial acetic acid, (100:1.5:0.3:0.25, v/v/v) for
S-7-hydroxywarfarin in the urine assay.
Data Management
The chromatograms were measured and data were captured using a Turbochrom data
system (version 4, Perkin Elmer, purchased from Alltech Associates Pty Ltd,
Australia).

Chapter 3 Validation of Analytical Methods 85
3.1.3 Calibration of HPLC Assay for Warfarin Enantiomers in Human
Plasma
Extraction Procedures
Aliquots (0.5 ml) of plasma were spiked with the internal standard (naproxen, 0.17
mg/ml) and sulfuric acid solution (0.35 ml, 0.5 M) and then extracted with
dichloromethane: hexane (1:5, 4 ml). The organic phase was decanted after
separation by centrifugation (at 1500 g for 10 min) and freezing the aqueous phase in
dry ice. The organic layer was evaporated to dryness under nitrogen and
reconstituted in acetonitrile (200 µl) and an aliquot (20 µl) injected onto the column.
Results
Warfarin Fluorescence Spectrum in Mobile Phase
The warfarin fluorescence spectrum was measured in mobile phase (acetonitrile:
triethylamine: glacial acetic acid, (100:0.2:0.3, v/v/v)) using a fluorescence
spectrophotometer (Hitachi, F-2000, Hitachi Ltd, Tokyo, Japan). The excitation
wavelength was 311nm and the emission wavelength was 400 nm (Figure 3-1).

Chapter 3 Validation of Analytical Methods 86
Figure 3-1. The fluorescence spectrum of warfarin in mobile phase.
Specificity
Figure 3-2 shows typical HPLC chromatograms of warfarin enantiomers. Twelve
different batches of control plasma containing EDTA were used to investigate the
specificity of the assay. No interfering peaks were observed in the different batches
of drug free plasma samples at the retention time of warfarin enantiomers and
internal standard (I.S.). The typical retention times were 5.7, 6.2 and 11.9 min for S-
warfarin, R-warfarin and I.S., respectively. The analytical run time was 20 min per
sample.
Inte
nsity
Wavelength (nm)

Chapter 3 Validation of Analytical Methods 87
Time (min) Time (min)
Time (min) Time (min)
Figure 3-2. HPLC chromatogram of warfarin enantiomers.
I. Extracted blank plasma; II. Extracted blank plasma with I.S.; III. Extracted plasma
sample from a subject at 144 h with I.S.; IV. Extracted blank plasma spiked with rac-
warfarin and I.S.; a. S-warfarin; b. R-warfarin; c. I.S. (Naproxen); d. Unknown
metabolite of warfarin
I II
III IV
C
a
b c a bc
Inte
nsity
(mV
) In
tens
ity (m
V) d

Chapter 3 Validation of Analytical Methods 88
Calibration Curve
Limit of Quantitation (LOQ)
The LOQ for S-warfarin and R-warfarin is 36.9 ng/ml using 0.5 ml of plasma sample
and injecting 20 µl of reconstituted residue. The typical peak height response at this
concentration is five times greater than background interference in blank plasma
samples at the retention time of the S-warfarin and R-warfarin (Figure 3-3). The
peaks of the S-warfarin and R-warfarin were identifiable, discrete and reproducible.
Table 3-3 shows the precision was less than 20% at 36.9 ng/ml.
Time (min)
Figure 3-3. HPLC chromatogram of extracted low quality control plasma
sample (36.9 ng/ml).
Linearity
The plasma concentration range of warfarin enantiomers expected in warfarin
pharmacokinetic studies is 40 to 2500 ng/ml [216]. Eight different warfarin
concentrations were used to establish the standard curve for each analytical run. Five
Inte
nsity
(mV
) I.S.
S-w
arfa
rin
R-w
arfa
rin

Chapter 3 Validation of Analytical Methods 89
validation standard curves were run on five different days over three weeks during
assay development.
Table 3-3. Standard curve statistics for spiked S- and R-warfarin in human
plasma.
Conc. Ratio of warfarin (peak height) to I.S.
ng/ml 1 2 3 4 5 Mean SD CV%
S-warfarin 18.5 0.04 0.03 0.02 0.04 0.00 0.03 0.02 64.4
R-warfarin 18.5 0.03 0.03 0.03 0.00 0.00 0.02 0.02 91.3
S-warfarin 36.9 0.06 0.06 0.05 0.04 0.06 0.05 0.01 16.6
R-warfarin 36.9 0.06 0.06 0.06 0.05 0.06 0.06 0.01 7.7
S-warfarin 73.8 0.10 0.11 0.10 0.10 0.13 0.11 0.01 12.1
R-warfarin 73.8 0.10 0.11 0.09 0.09 0.09 0.10 0.01 9.3
S-warfarin 184.5 0.26 0.25 0.26 0.25 0.25 0.25 0.01 2.2
R-warfarin 184.5 0.28 0.25 0.23 0.23 0.24 0.25 0.02 8.4
S-warfarin 369.0 0.56 0.53 0.51 0.53 0.55 0.54 0.02 3.6
R-warfarin 369.0 0.54 0.53 0.48 0.52 0.52 0.52 0.02 4.4
S-warfarin 1107.0 1.61 1.58 1.63 1.61 1.63 1.61 0.02 1.3
R-warfarin 1107.0 1.58 1.53 1.55 1.56 1.60 1.56 0.03 1.7
S-warfarin 2214.0 3.12 2.96 3.15 3.30 3.30 3.17 0.14 4.5
R-warfarin 2214.0 3.01 2.95 3.09 3.26 3.16 3.09 0.12 3.9
S-warfarin 2952.0 3.93 4.28 4.20 4.37 4.58 4.27 0.24 5.6
R-warfarin 2952.0 3.89 4.19 4.10 4.20 4.44 4.16 0.20 4.8

Chapter 3 Validation of Analytical Methods 90
Figure 3-4. Typical S-warfarin standard curve in plasma.
y = 0.0014xR2 = 0.9999
0
1
2
3
4
5
0 500 1000 1500 2000 2500 3000
S-warfarin Conc. (ng/ml)
Rat
io o
f Pea
k H
eigh
t of S
-w
arfa
rin to
I.S
.
Figure 3-5. Typical R-warfarin standard curve in plasma.
y = 0.0014xR2 = 1
0
1
2
3
4
5
0 500 1000 1500 2000 2500 3000
R-warfarin Conc. (ng/ml)
Rat
io o
f Pea
k H
eigh
t of R
-w
arfa
rin to
I.S
.

Chapter 3 Validation of Analytical Methods 91
Table 3-3 shows that the precision at the LOQ is less than 20% and the deviation of
standards other than LOQ in eight non-zero standards is less than 15%. The
correlation coefficients (r2) of S-warfarin and R-warfarin are greater than 0.995.
Figure 3-4 and Figure 3-5 show that there are linear relationships in the plasma
concentration range of 36.9 – 2952 ng/ml for both enantiomers of warfarin.
Precision and Accuracy
Precision and accuracy assessment was conducted at three different enantiomer
concentrations of quality control samples in the range of expected concentrations
with five determinations per concentration. Table 3-4 shows that the inter-day
accuracy was within 15% of the actual value and precision did not exceed 15% CV at
each concentration.
Recovery
The recovery experiment was performed by comparing the peak height of warfarin
enantiomers of extracted plasma samples at three concentrations with unextracted
standard solutions. Liquid-liquid extraction was used for sample clean up. Table 3-5
shows that the overall extraction recoveries were 90%, 91% and 87% for S-warfarin,
R-warfarin and I.S., respectively. Also demonstrated are the precision, accuracy,
reproducibility and efficiency.

Chapter 3 Validation of Analytical Methods 92
Table 3-4. Precision and accuracy of S- and R-warfarin quality controls (n=5).
S-Warfarin (ng/ml) R-Warfarin (ng/ml)
Nominal
Conc. 65.4 981.0 2289.0 65.4 981.0 2289.0
Inter-day
1 64.3 821.4 2007.1 69.2 892.3 2069.2
2 71.4 935.7 2335.7 71.4 907.1 2278.6
3 85.7 892.9 2064.3 78.6 878.6 1985.7
4 66.7 833.3 1873.3 64.3 871.4 1957.1
5 73.3 913.3 1960.0 80.0 873.3 1933.3
Mean 72.3 879.3 2048.1 72.7 884.6 2044.8
SD 8.3 50 175.3 6.6 15.0 140.4
CV% 11.5 5.7 8.6 9.0 1.7 6.9
RE% 110.5 89.6 89.5 111.2 90.2 89.3
Intra-day
Run
1 66.7 820.0 1913.3 53.3 786.7 1840.0
2 86.7 946.7 2166.7 73.3 953.3 2106.7
3 73.3 846.7 1873.3 66.7 820.0 1793.3
4 66.7 913.3 1880.0 53.3 860.0 1860.0
5 73.3 913.3 1960.0 80.0 873.3 1933.3
Mean 73.3 888.0 1958.7 65.3 858.7 1906.7
SD 8.2 52.6 121.2 12.0 63.0 122.7
CV% 11.2 5.9 6.2 18.3 7.3 6.4
RE% 112.2 90.5 85.6 99.9 87.5 83.3
SD: Standard deviation; CV: Coefficient of variation; RE%: Relative error or
Accuracy; n: Number of replicates

Chapter 3 Validation of Analytical Methods 93
Table 3-5. Recovery of S- and R-warfarin and internal standard in human
plasma.
S-Warfarin
(ng/ml)
R-Warfarin
(ng/ml)
Internal
standard
(mg/ml) Nominal
Conc. 104 552 2760 104 552 2760 0.012
Extracted peak height
Mean (n=4) 645.9 2910.3 13954.1 644.7 2904.7 13649.0 484.2
SD 5.1 177.5 684.1 15.9 189.1 524.0 42.6
CV% 0.8 6.1 4.9 2.5 6.5 3.8 8.8
Unextracted peak height
Mean (n=4) 698.1 3382.3 15320.6 693.6 3286.1 14876.9 555.4
SD 18.0 72.5 573.3 35.3 90.2 611.8 25.4
CV% 2.6 2.1 3.7 5.1 2.7 4.1 4.6
%Recovery 92.5 86.1 91.1 92.9 88.4 91.8 87.2
Mean
Recovery% 90 91 87
SD 3.4 2.4
CV% 3.8 2.6
Recovery % = Extracted peak height/ Unextracted peak height × 100%

Chapter 3 Validation of Analytical Methods 94
Stability
Table 3-6, Table 3-7 and Table 3-8 show that S-warfarin, R-warfarin and I.S. in
human plasma QC samples stored at -4oC were stable after 17 days and 5 freeze-
thaw cycles. S-warfarin, R-warfarin and I.S. in this mobile phase were stable at the
room temperature for 17 hours when stored in the autosampler. S-warfarin, R-
warfarin and I.S. of stock standard solutions stored at 5oC were stable over 15 days.
Table 3-6. Sample storage and freeze thaw stability of quality control samples in
plasma.
S-Warfarin (ng/ml) R-Warfarin (ng/ml)
Nominal 65.4 981.0 2289.0 65.4 981.0 2289.0
1 64.3 821.4 2007.1 69.2 892.3 2069.2
2 71.4 935.7 2335.7 71.4 907.1 2278.6
3 85.7 892.9 2064.3 78.6 878.6 1985.7
4 66.7 833.3 1873.3 64.3 871.4 1957.1
Free
ze/T
haw
Cyc
le
5 73.3 913.3 1960.0 80.0 873.3 1933.3
Observed
mean 72.3 879.3 2048.1 72.7 884.6 2044.8
SD 8.3 50.0 175.3 6.6 15.0 140.4
CV% 11.5 5.7 8.6 9.0 1.7 6.9

Chapter 3 Validation of Analytical Methods 95
Table 3-7. Autosampler stability of quality control samples in plasma.
S-Warfarin (ng/ml) R-Warfarin (ng/ml)
I.S.
(mg/ml)
Nominal
Conc. 65.4 981.0 2289.0 65.4 981.0 2289.0 0.2
0 71.4 914.3 2371.4 71.4 878.6 2335.71 3316.9*
9 64.3 942.9 2357.1 64.3 928.6 2264.3 3482.5*
Tim
e (h
)
17 71.4 950.0 2285.7 71.4 914.3 2228.6 3770.5*
Mean 69.1 935.7 2338.1 69.1 907.1 2276.2 3523.3*
SD 4.1 18.9 45.9 4.1 25.8 54.6 229.6
CV% 6.0 2.0 2.0 6.0 2.8 2.4 6.5
*Measured by comparing peak height
Table 3-8. Stock solution stability of quality control samples in plasma.
Time
(Day) S-Warfarin (ng/ml) R-Warfarin (ng/ml)
I.S.
(mg/ml)
Nominal
Conc. 65.4 981.0 2289.0 65.4 981.0 2289.0 0.17
0 58.3 991.7 2400.0 58.3 958.3 2341.7 5329.8*
7 61.5 984.6 2323.1 61.5 961.5 2246.2 4854.1*
9 72.7 1163.6 2745.5 73.3 900.0 2309.1 5612.3*
14 61.5 815.4 2284.6 66.7 1000.0 2416.7 5199.5*
Mean 63.5 988.8 2438.3 65.0 955.0 2328.4 5248.9*
SD 6.3 142.2 210.3 6.5 41.3 71.0 314.6
CV% 9.9 14.4 8.6 10.1 4.3 3.1 6.0
*Measured by comparing peak height

Chapter 3 Validation of Analytical Methods 96
3.1.4 Calibration of HPLC Assay for S-7-hydroxywarfarin in Human Urine
Extraction Procedures
Aliquots (0.1 ml) of urine samples were spiked with internal standard (naproxen,
0.17 mg/ml, 10 µl) and sulfuric acid solution (0.5 M, 0.1 ml) and then extracted with
dichloromethane: hexane (1:2, 4 ml). After 15 min on a roller bed mixer, the organic
phase was decanted after separation by centrifugation (at 1500 g for 10 min) and
freezing the aqueous phase in dry ice. The organic layer was evaporated to dryness
under nitrogen and reconstituted in acetonitrile (200 µl) and an aliquot (20 µl)
injected onto the column.
Results
7-Hydroxywarfarin Fluorescence Spectrum in Mobile Phase
The 7-hydroxywarfarin fluorescence spectrum was measured in mobile phase
(acetonitrile: methanol: triethylamine: glacial acetic acid, (100:1.5:0.3:0.25, v/v/v))
using a fluorescence spectrophotometer (Hitachi, F-2000, Hitachi Ltd, Tokyo, Japan).
The excitation and emission wavelengths were 301 nm and 401 nm, respectively
(Figure 3-6).

Chapter 3 Validation of Analytical Methods 97
Figure 3-6. The fluorescence spectrum of 7-Hydroxywarfarin in mobile phase.
Wavelength (nm)
Figure 3-7 shows HPLC chromatograms of S-7-hydroxywarfarin in the mobile phase.
Twelve different batches of control urine were used to investigate the specificity of
the assay. No interfering peaks were found in the different batches of control urine
samples at the retention time of S-7-hydroxywarfarin and I.S. The typical retention
times were 12.8 and 15.6 min for S-7-hydroxywarfarin and I.S., respectively. The
analytical run time was 20 min per sample.
Inte
nsity

Chapter 3 Validation of Analytical Methods 98
Specificity
Figure 3-7. HPLC chromatogram of S-7-hydroxywarfarin.
I. Extracted blank urine; II. Extracted urine spiked S-7-hydroxywarfarin and I.S.; III.
Extracted blank urine with I.S; IV. Extracted urine sample from a volunteer receiving
25 mg dose of warfarin with added I.S. a. I.S (Naproxen) b. S-7-hydroxywarfarin
I II
III IV
b a
b
a
a
Time (min) Time (min)
Time (min) Time (min)
Inte
nsity
(mV
) In
tens
ity (m
V)

Chapter 3 Validation of Analytical Methods 99
Precision and Accuracy
Precision and accuracy assessment was conducted at three different 7-
hydroxywarfarin concentrations of quality control (QC) samples in the range of
expected concentrations with five determinations per sample. Table 3-9 shows that
the inter-day accuracy were within 15% of the actual value while precision did not
exceed 15% CV% at each concentration. Figure 3-8 shows that there is linear
relationship in the urine concentration range of 82.5 – 1650 ng/ml for S-7-
hydroxywarfarin.
Figure 3-8. S-7-hydroxywarfarin standard curve (n=4).
y = 0.0028xR2 = 0.9983
0
1
2
3
4
5
6
0 500 1000 1500 2000
Conc. (ng/ml)
Pea
k R
atio
of S
-7-
hydr
oxyw
arfa
rin to
I.S

Chapter 3 Validation of Analytical Methods 100
Table 3-9. Inter-day precision and accuracy of S-7-hydroxywarfarin quality
control sample in urine (n=4).
S-7-hydroxywarfarin (ng/ml)
Nominal Conc. 165.0 330.0 660.0
Observed Mean 160.5 320.1 646.5
SD 16.6 15.8 14.3
CV% 10.3 4.9 2.2
RE% 97.2 97.0 98.0
RE%: Relative error or Accuracy; n: Number of replicates
Recovery
The recovery experiment was performed by comparing the peak height of S-7-
hydroxywarfarin of extracted urine samples at three concentrations with unextracted
standard solutions. Liquid-liquid extraction was used for sample clean up. Table 3-10
shows that the overall extraction recoveries were 83.0% and 83.3% for S-7-
hydroxywarfarin and I.S., respectively. The data demonstrate the precision, accuracy,
reproducibility and efficiency of the recovery of S-7-hydroxywarfarin from human
urine.

Chapter 3 Validation of Analytical Methods 101
Table 3-10. Recovery of S-7-hydroxywarfarin and internal standard (I.S.) in
human urine.
S-7-hydroxywarfarin (ng/ml) I.S. (ng/ml)
Nominal
Conc.
82.5 330.0 825.0 11100.0
Unextracted peak height
Mean (n=3) 3483.3 13175.6 34419.6 15866.0
SD 213.2 686.4 1590.7 988.1
CV% 6.1 5.2 4.6 6.2
Extracted peak height
Mean (n=3) 2810.9 11542.1 27748.4 13219.5
SD 389.3 260.0 2334.1 1026.5
CV% 13.8 2.3 8.4 7.8
Recovery% 80.7 87.6 80.6 83.3
Mean
Recovery %
83.0
SD 4.0
CV% 4.8
Recovery % = Extracted peak height/ Unextracted peak height × 100%

Chapter 3 Validation of Analytical Methods 102
Discussion
Assay of Warfarin Enantiomers in Human Plasma
Twelve batches of control drug-free plasma (from St Vincent’s Hospital,
Darlinghurst, NSW, Australia) were used to investigate the specificity of the assay.
No interference was observed in different control plasma samples at the retention
time of warfarin enantiomers or the internal standard (naproxen). Fluorescence
detection was chosen to measure the intensity of warfarin enantiomers in the HPLC
column eluent rather than a UV detector because interference was observed at
retention times of S-warfarin, R-warfarin and I.S. when a UV detector (320 nm) was
used. This is modification to the assay published by Naidong et al [242].
Several extraction solvents have been used in an attempt to clean up the plasma
sample, for example, diethyl ether, hexane, dichloromethane, chloroform, and a
mixture of dichloromethane: hexane (1:5). Dichloromethane: hexane (1:5) was
selected for use in this assay since the interference was smaller and the extraction
recovery was higher for warfarin enantiomers compared with other solvents. This is
another modification to the assay published by Naidong et al [242] in which ether
was employed as an extraction solvent.
Sensitivity of this method was less (LOQ is 36.90 ng/ml) when compared with the
assay published by Naidong et al [242] (LOQ is 12.5 ng/ml) [5]. However, 0.5 ml of
plasma was used for this assay and reconstituted residue (20 µl) was used to inject
into HPLC column, while plasma (1 ml) and reconstituted residue (50 µl) was used
in the assay published by Naidong et al [242]), yet still covered the range of warfarin

Chapter 3 Validation of Analytical Methods 103
enantiomer plasma concentrations expected in pharmacokinetic studies using the
design outlined in this thesis. Hence this is a more practical method and has the
added advantage of extending the working life of the column. If the sensitivity of this
assay was found to be inadequate, it would be possible to improve sensitivity by
increasing the plasma sample volume or by increasing the injection volume into
HPLC column.
Assay of S-7-hydroxywarfarin in Human Urine
S-7-Hydroxywarfarin could not be detected in the human plasma but was
quantifiable in urine samples. After modification of the assay published by Naidong
et al [242], the present method can now be used to analyse S-7-hydroxywarfarin in
human urine. Twelve batches of control urine were used to investigate the specificity
of the assay. No interference was observed in different control samples at the
retention time of S-hydroxywarfarin and I.S. (naproxen). Fluorescence detection was
chosen to measure the intensity of S-7-hydroxywarfarin. Several extraction solvents
have been used to try to clean up the urine sample including diethyl ether, hexane,
dichloromethane, chloroform, a mixture of dichloromethane: hexane (1:5) and a
mixture of dichloromethane: hexane (1:2). Dichloromethane: hexane (1:2) was
selected for use in the present assay because the interference was smaller and the
extraction recovery was higher for S-7-hydroxywarfarin. The limit of quantification
of this method was 82.5 ng/ml.

Chapter 3 Validation of Analytical Methods 104
3.2 Calibration of Warfarin Protein Binding
3.2.1 Introduction
The plasma protein binding of drugs has been shown to have significant effects on
numerous aspects of clinical pharmacokinetics and pharmacodynamics. In many
clinical situations, measurement of the total drug concentration does not provide the
necessary information concerning the unbound fraction of drug in plasma, which is
available for distribution, elimination, and pharmacodynamic action. Thus, accurate
determination of unbound plasma drug concentrations is essential in the therapeutic
monitoring of drugs [262]. Many methodologies are available for determining the
extent of plasma protein binding of drugs including microdialysis, equilibrium
dialysis, ultrafiltration, dynamic dialysis, ultracentrifugation, gel filtration,
electrophoresis, and spectrophotometry and enzyme kinetic methods. In the clinical
evaluation of drug therapy, equilibrium dialysis and ultrafiltration are the most
routinely utilised methods. Both of these methods have been proven to be
experimentally sound and to yield adequate protein binding data [256, 263].
Warfarin has high binding to plasma proteins (See Section 1.5.2). A small change in
the fraction of unbound warfarin has the potential to significantly affect the
anticoagulant activity in a transient manner [18]. Two main techniques for measuring
unbound drug concentration, equilibrium dialysis and ultrafiltration using the
addition of radiolabeled warfarin enantiomers or addition of racemic warfarin, have
been reported to measure the concentration of unbound warfarin enantiomers [263,
264]. The present study examines the method of ultrafiltration with addition of
racemic warfarin for the assessment of unbound fractions of warfarin enantiomers.

Chapter 3 Validation of Analytical Methods 105
This approach relies on the assumption of concentration independent protein binding
as established by Banfield et al [265].
3.2.2 Materials and Methods
Materials and Reagents
The materials and methods for section have been presented in Section 3.1.2.
Instrumentation
Ultrafiltration Tubes (Centrifree YM-30) were purchased from Amicon, Millipore
Corporation (North Ryde, NSW, Australia). A fixed angle rotor centrifuge (Jouan
CT422) was used.
Preparation of Ultrafiltrate
Warfarin standard buffer solution (1 ml, 10 µg/ml) was transferred to Centrifree®
YM-30 tube. After centrifuging at 1800 g for 20 min at 37oC, 0.1 ml of the
ultrafiltrate was transferred to a 10 ml volumetric flask and diluted to volume. The
ultrafiltrate (0.1 µg/ml, in buffer) was then ready for analytical use.
Warfarin plasma standard (1 ml, 10 µg/ml) and different concentrations of warfarin
in plasma for measuring linear range of warfarin unbound fraction were transferred
to Centrifree® YM-30 tube. After centrifugation at 1800 g for 20 min at 37oC, the
ultrafiltrate was ready for analytical use.

Chapter 3 Validation of Analytical Methods 106
Extraction Procedures:
To 0.2 ml warfarin original buffer solution (0.1 µg/ml), warfarin buffer ultrafiltrate
solution (0.1 µg/ml) and warfarin plasma ultrafiltrate (10 µg/ml), 10 µl of I.S.
solution (0.0341 mg/ml, naproxen) and sulfuric acid (0.5 M, 140 µl) were added.
After mixing, 2 ml of dichloromethane: hexane (1:5) was added to extract the
compounds. After 15 min on a roller bed mixer and centrifugation at 1500 g for 10
min, the organic phase was separated and evaporated to dryness under nitrogen,
followed by reconstitution in 100 µl of mobile phase. A 50 µl portion of the
reconstituted residue was injected into the HPLC.
Data Treatment
The fraction unbound (fu) was calculated as the ratio of the concentration of each
warfarin enantiomer in the ultrafiltrate to the corresponding concentration in plasma.
3.2.3 Results
Table 3-11 shows that after rac-warfarin was spiked into blank plasma the unbound
fraction of S-warfarin and R-warfarin enantiomers were 0.0051 ± 0.0003 and 0.0057
± 0.0002, respectively. The warfarin adsorbed by the ultrafiltrate device and
membrane was less than 10% for S-warfarin and less than 5% for R-warfarin. Table
3-12 shows that warfarin protein bindings are independent of concentration in the
range 8.6 – 13.8 µg/ml.

Chapter 3 Validation of Analytical Methods 107
Table 3-11. Fraction of unbound warfarin and unadsorbed warfarin by
ultrafiltration.
S-warfarin R-warfarin
Buffer Plasma Buffer Plasma
Mean concentration before
ultrafiltration (µg/ml)
5.0 5.00 5.0 5.00
Mean concentration after
ultrafiltration (µg/ml)
4.6 0.03 4.9 0.03
Mean of unbound/unadsorbed
fraction
0.917 0.005 0.977 0.006
SD 0.04 0.0003 0.03 0.0002
CV% 4.7 5.3 3.1 3.9
n 3 3 3 3
Note: Concentration of S-warfarin and R-warfarin is half of rac-warfarin.
n: Number of replicates
Table 3-12. Linear range of fraction of unbound warfarin (n=4).
Warfarin concentration
in plasma (µg/ml)
S-warfarin
fu
R-warfarin
fu
8.6 0.005 0.005
10.4 0.005 0.006
12.1 0.005 0.005
13.8 0.004 0.004
Mean 0.005 0.005
SD 0.001 0.001
CV% 10.5 16.3

Chapter 3 Validation of Analytical Methods 108
3.2.4 Discussion
The plasma protein binding of warfarin was independent over the range of 8.6 – 13.8
µg/ml in the present study. This is in agreement with the report of Chan et al [18]
which demonstrated that plasma protein binding of warfarin was independent over
the range of 0.275 to 10.55 µg/ml. Therefore, the addition of racemic warfarin to a
plasma sample made at a concentration of 10 µg/ml before ultrafiltration is not
expected to alter the original fraction of the unbound warfarin enantiomers in the
sample. Furthermore, the ultrafiltrate warfarin enantiomers in plasma at this
concentration can be measured by the presently established method. The results
demonstrated by this method show good agreement with those previously reported
by ultrafiltration and equilibrium dialysis methods using radiolabel warfarin
enantiomers [265].
.

Chapter 4 Variability in Constituents of Herbal Medicines 109
Chapter 4 Variability in Constituents of Herbal
Medicines
4.1 Introduction
Herbal medicines are included under the broader definition of complementary
medicines. To be listed by the Therapeutic Goods Administration (TGA), herbal
medicine products need to meet requirements for safety and quality, the latter
requiring that they be manufactured under Good Manufacturing Practice (GMP)
conditions. Most herbal medicines are listed. Listed herbal medicine products are not,
however, individually assessed for efficacy but the sponsors are required to hold
evidence to support efficacy claims for their product [266]. The World Health
Organization (WHO) publishes guidance concerning the quality assurance of
pharmaceuticals and the specifications for drug substances and dosage forms and
provides advice on the validation of manufacturing processes and on the manufacture
of both investigational products for clinical trials and herbal medicinal products.
WHO also has a certification scheme to endorse the quality of pharmaceutical
products moving in international commerce, and the assessment of herbal medicines
and import procedures for pharmaceutical products [267].
However, there is relatively little information about the quality of herbal medicine
products in the scientific literature. This partly stems from the complexity of these

Chapter 4 Variability in Constituents of Herbal Medicines 110
medicines which often contain a complex mixture of phytochemicals. Several quality
issues were found in the literature regarding the variability in the content of the
constituents including Hypericum perforatum [268-270], Ginkgo biloba [271, 272]
and their commercial extracts in herbal medicine products.
The aim of this chapter was to investigate the recommended dose regimen suggested
by manufacturers and, using thin-layer chromatography (TLC) as a screening method,
to assess the quality of different commercial herbal medicine products available in
Australia. These included St John’s wort (Hypericum perforatum), ginseng (Panax
ginseng), ginkgo (Ginkgo biloba) and ginger (Zingiber officinale) that were to be
used in the herb-drug interaction studies with warfarin presented later in this thesis.
4.2 Materials and Methods
4.2.1 Materials and Reagents
Commercially available herbal medicine products of St John’s wort included
• Golden Glow St John’s Wort (Batch H11092, Queensland Biochemics Pty
Ltd, Virginia, Qld, Australia);
• Blackmores Hyperiforte™ (St John’s Wort) (Batch 20183, Blackmores Ltd,
Balgowlah, NSW, Australia);
• Nature’s Own Hypericum (St John’s Wort) (Batch 7890701, Bullivant’s
Natural Health Products Pty. Ltd, Virginia, Qld, Australia);
• Bioglan® Stress Relax with St. John’s Wort (Batch 1331-2, Bioglan Ltd,
Kirrawee, NSW, Australia);

Chapter 4 Variability in Constituents of Herbal Medicines 111
• Greenridge Extra Strength Hypericum (St John’s Wort), (Batch 514900B,
Greenridge Botanicals (Australia) Pty. Ltd., Toowoomba, Qld., Australia).
Herbal medicine products containing ginseng included
• Golden Glow Korean Ginseng (Batch K01251, Queensland Biochemics Pty
Ltd, Virginia, Qld, Australia);
• Blackmores Korean Ginseng (Batch 15698, Blackmores Ltd, Balgowlah,
NSW, Australia);
• Nature’s Own® Korean Ginseng (Batch 7852805, Bullivant’s Natural Health
Products Pty. Ltd, Virginia, Qld, Australia);
• VitaGlow GINZ!NG (Batch 12569, VitaGlow Pty Ltd, Balgowlah, NSW,
Australia).
Ginkgo herbal medicine products evaluated included
• Blackmores Ginkgoforte™, (Batch 20897, Blackmores Ltd, Balgowlah,
NSW 2093, Australia);
• Bioglan, (Batch 1268-2); Golden Glow Ginkgo Biloba, (Batch H11169,
Queensland Biochemics Pty Ltd, Virginia, Qld, Australia);
• Nature’s Own, Ginkgo Biloba (Batch 7859504, Bullivant’s Natural Health
Products Pty. Ltd, Virginia, Qld, Australia);
• BioGinkgo® (Batch 1268-2, Pharmanex Inc., Provo, UT 84601, USA);
• Flordis Tavonin™ Extract of Ginkgo biloba (Batch 6250202, made in
Germany by Dr. Willmar Schwabe GmbH & Co. and are marketed in
Australia by Flordis, Epping, NSW, Australia);
• Tebonin® forte (Batch 2860200, Dr. Willmar Schwabe Arzneimittel,
Postfach 41 0925, 76209 Karlsruhe, Germany);

Chapter 4 Variability in Constituents of Herbal Medicines 112
• Phytomedicine (Batch 41546A, Phytomedicine Pty Ltd, Dee Why, NSW,
Australia);
• Herron Ginkgo Biloba (Batch 53261, Herron Pharmaceuticals Pty Ltd,
Tennyson, Qld, Australia) and Medi Herb® Ginkgo biloba (Batch 112086,
Mediherb Pty Ltd, Warwick, Qld, Australia).
Herbal medicine products that contained ginger included
• Blackmores Travel Calm Ginger (Batch 19782, Blackmores Ltd, Balgowlah,
NSW, Australia); Golden Glow Ginger (Batch D10468, Queensland
Biochemics Pty Ltd, Virginia Qld, Australia);
• Vcaps™ (Supplier not available);
• Zinaxin™ (Batch 904002, Ferrosan International Pty. Ltd., Gladesville, NSW,
Australia).
Analytical standards of specific phyto-constituents including rutin, ginsenoside Rb1,
ginsenoside Rg1, bilobalide, ginkgolide A, ginkgolide B and ginkgolide C were
donated from the Phytolaboratory Services, Herbal Medicines Research and
Education Centre (HMREC), Faculty of Pharmacy, The University of Sydney.
Resorcinol was purchased from Sigma-Aldrich Pty. Ltd, (Sydney, Australia). The
purity of standards was not less than 95%. All solvents and reagents were analytical
grade or HPLC grade.
4.2.2 Instrumentation
The high performance thin layer chromatographic system consisted of plate of
chromatography silica gel F254 (Merck 1.05554), TLC band loading and developing

Chapter 4 Variability in Constituents of Herbal Medicines 113
device (Camag Linomat IV 1.16) and image device including Camag VideoScan
Version 1.01, Camag HPTLC Vario System and Camag TLC Software”Cats”
(Version 3.20) (CAMAG, Sonnenmattstr, 11, CH-4132 Muttenz, Switzerland).
4.2.3 Assessment of Recommended Dose Regimens of Different Brand Herbal
Medicine Products
Dose regimens of different brands of herbal medicine products were evaluated and
compared. Daily dosage equivalents of raw material and the main ingredients either
known actives or markers were calculated and compared with those mentioned in the
Commission E monographs for each herbal medicine [73].
4.2.4 Preparation of Reference Solutions
Reference solution of rutin (1 mg/ml), ginsenoside Rb1 (0.1 mg/ml) ginsenoside Rg1
(0.1 mg/ml), bilobalide (1 mg/ml), ginkgolide A (1 mg/ml), ginkgolide B (1 mg/ml)
and ginkgolide C (1 mg/ml) and resorcinol (1 mg/ml) were prepared in methanol,
and resorcinol (1 mg/ml) was prepared immediately before use.
4.2.5 Preparation of Test Solutions
Test Solutions of St John’s Wort
Golden Glow, Blackmores, Nature’s Own and Bioglan St John’s wort tablets (10
tablets) were weighed and ground into powder using a mortar and pestle, respectively.
According to the weight of each tablet and the labelled contents, Golden Glow
(0.1974 g), Blackmores (0.2836 g), Nature’s Own (0.1955 g), Bioglan (0.4555 g) and
Greenridge (0.5 ml) St John’s wort, equivalent to 0.5 g of dried Hypericum

Chapter 4 Variability in Constituents of Herbal Medicines 114
perforatum were weighed, respectively. The powdered St John’s wort tablets were
stirred in 10 ml of methanol, sonicated for 15 min then centrifuged at 1500 g for 10
min. The supernatants of the methanolic extracts were used as test solutions and a 1
µl portion was spotted onto the TLC plate for each sample using the loading device.
Test Solutions of Ginseng
Blackmores ginseng (10 tablets) was weighed and ground into powder with a mortar
and pestle. According to the weight of each tablet and the labelled contents,
Blackmores (1.034 g), Golden Glow (1 capsule), Nature’s Own (1 capsule) and
VitaGlow (1 capsule) ginseng equivalent to 0.5 g of raw Panax ginseng were
weighed, respectively. The powdered ginseng tablets or capsule contents were stirred
in 5 ml of methanol, sonicated for 15 min and then centrifuged at 1500 g for 10 min.
The methanolic supernatants were used as the test solutions and a 1 µl portion was
spotted onto the TLC plate for each sample using the loading device.
Test Solutions of Ginkgo
Blackmores, Bioglan, Golden Glow, Nature’s Own, BioGinkgo, Tavonin, Tebonin
forte, Phytomedicine, Herron and Medi Herb ginkgo tablets (10 tablets) were
weighed and ground, respectively as above. According to the weight of tablet and the
labelled contents, Blackmores (2.2626 g), Bioglan (1.3198 g); Golden Glow (1.0403
g); Nature’s Own (1.8008 g), BioGinkgo (0.3970 g), Tavonin (0.5543 g), Tebonin
forte (0.5485 g), Phytomedicine (1.5945 g), Herron (1.5708 g) and Medi Herb
(1.0010 g) ginkgo equivalent to 4 g of raw Ginkgo biloba were weighed, respectively.

Chapter 4 Variability in Constituents of Herbal Medicines 115
The powdered ginkgo tablets were stirred in 5 ml of methanol, sonicated for 15 min
and centrifuged at 1500 g for 10 min. The supernatants of methanolic extracts were
used as the test solution and a 3 µl portion of test solution was spotted onto the TLC
plate for each sample using the loading device.
Test Solutions of Ginger
Golden Glow, Blackmores and Vcaps™ ginger tablet (10 tablets) were weighed and
ground with mortar and pestle, respectively. According to the weight of each tablet
and the labelled contents, Golden Glow (0.8277 g), Blackmores (1.2930 g), Vcaps™
(0.3710 g) and 1 ml of Zinaxin™ (1 capsule was mixed in 6.6 ml of methanol) ginger
equivalent to 1.0 g of raw Zingiber officinale were weighed, respectively. Methanol
(5 ml) was added to each powdered tablet and methanol (4 ml) was added to 1 ml of
Zinaxin™. Then the powdered ginger dose forms or capsule content of ginger extract
were shaken for 15 min on a roller and centrifuged for 10 min at 1500 g. The
supernatant of methanolic extracts were used as the test solution and a 10 µl portion
was spotted onto the plate for each sample.
4.2.6 TLC of St John’s Wort Preparations
TLC of St John’s wort preparations was conducted according to the Hypericum
Monograph in the British Pharmacopeia 2001 [273]. Briefly, extracts of products
containing hypericum were examined using thin-layer chromatography on a TLC
silica gel plate. Test and reference solutions (1 µl) were applied to the plate as 5 mm
bands, spaced 4 mm apart using the Camag Linomat IV loading device. A path of 7

Chapter 4 Variability in Constituents of Herbal Medicines 116
cm was developed using a mixture of 6 volumes of anhydrous formic acid, 9
volumes of water, and 90 volumes of ethyl acetate in the Camag HPTLC Vario
System. The plate was allowed to dry at 100oC to 105oC for 10 min on the Camag
heater. A 10 g/l solution of diphenylboric acid aminoethyl ester in methanol was then
sprayed onto the plate and further treated with a 50 g/l solution of macrogol 400 in
methanol. After 30 min, the plate was examined under ultraviolet (UV) light at 366
nm. The TLC image of the constituents of St John’s wort dose forms were captured
using the Camag VideoScan and Camag TLC Software”Cats”.
4.2.7 TLC of Ginseng Preparations
TLC of ginseng preparations was conducted according to the Ginseng Monograph in
the British Pharmacopeia 2001 [144]. Briefly, extracts of products containing
ginseng were examined using a TLC silica gel plate. Test solution (1 µl) and
reference solution (3 µl) were applied to the silica gel plate as 5 mm bands, spaced 4
mm apart using the Camag Linomat IV loading device. A path of 9 cm was
developed using an unsaturated tank with the upper layer of a mixture of 2.5 ml of
ethyl acetate, 5 ml of water and 10 ml of butanol, which had been allowed to separate
for 10 min. The plate was allowed to dry in air and was then dipped in 10%
methanolic sulfuric acid solution (20 ml of sulphuric acid, 10 ml of methanol and
170 ml of water) for 1 sec followed by heating at 120oC for 2 min. The TLC image
of the constituents of ginseng products were captured using the Camag VideoScan
and Camag TLC Software”Cats” with VideoStore 2 under a UV source at 366 nm.

Chapter 4 Variability in Constituents of Herbal Medicines 117
4.2.8 TLC of Ginger Preparations
TLC of ginger preparations was conducted according to the Ginger Monograph in
the British Pharmacopeia 2001 [198]. Briefly, extracts of products containing
Zingiber officinale were examined using TLC. Test solution (8 µl) and the resorcinol
reference solution (1 µl) were applied to the silica gel plate as 5 mm bands, spaced 4
mm apart using the Camag Linomat IV loading device. The plate was developed
over 10 cm in the unsaturated Camag HPTLC Vario System using a mixture of 40:60
(hexane: ether). The plate was allowed to dry in air. A 10 g/l solution of vanillin in
sulfuric acid was sprayed onto the plate and examined in the daylight while heating
at 100oC to 105oC for 10 min. The TLC image of the constituents of ginger dose
forms was captured using the Camag VideoScan and Camag TLC Software”Cats”.
4.2.9 TLC of Ginkgo Preparations
TLC of ginkgo preparations were conducted according to the Ginkgo Monograph in
the Pharmacopeia of P. R. China, 2000 [172]. Briefly, extracts of products containing
Ginkgo biloba were examined using TLC. Test and reference solutions (1 µl) were
applied as 5 mm bands, spaced 5 mm apart using the Camag Linomat IV loading
device to a plate pre-washed with methanol, dried then pre-treated with 4% sodium
acetate for 20 min and then dried. The plate was developed over 9 cm using a
mixture of 10 ml volume of toluene, 5 ml volume of ethyl acetate, 5 ml of acetone
and 0.6 ml of methanol. The plate was allowed to dry and was then dipped in a
mixture of 8 g of sodium acetate, 120 ml of ethanol, and 80 ml of water (4% sodium
hydroxide) for 1 sec followed by heated at 160oC for 30 min. The TLC image of the

Chapter 4 Variability in Constituents of Herbal Medicines 118
constituents of ginkgo was captured with VideoStore 2 under a UV source at 366 nm
using Camag VideoScan and Camag TLC Software”Cats”.
4.3 Results
4.3.1 Comparison of Recommended Dose Regimens of Herbal Medicine
Products
St John’s Wort (Hypericum perforatum)
Hypericum perforatum, also named St John’s wort, is an herbal medicine with
claimed therapeutic effects on nervous tension and mild anxiety (See Section 1.7).
There is clear evidence of its antidepressant actions (See Section 1.7). Daily dosage
according to the Commission E monograph [73] for hypericum is 2-4 g per day of
chopped or powdered herb for internal use, or 0.2-1.0 mg of total hypericin in other
forms of preparation via alternative application. The daily dosage regimens
recommended on the labels of different commercial herbal medicine products
containing St John’s wort as a single herbal ingredient are summarised in Table 4-1.
Variation in the recommended dosage regimens and quality was found in different
commercial products of St John’s wort. For St John’s wort, the daily dose
recommended on Blackmores (raw: 5.4 g), Nature’s Own (raw: 5.4 g) and
Greenridge (raw: 6 g) product labels are higher than recommended according to the
Commission E monographs for St John’s wort (raw: 2-4 g). However, the
recommended daily dose suggested on the Bioglan (raw: 3 g), Golden Glow (raw: 2-
4 g) and Remotiv (raw: 2.73 g) product labels are consistent with the dose
recommended by the Commission E monographs for hypericum.

Chapter 4 Variability in Constituents of Herbal Medicines 119
Ginseng
Ginseng is an herbal medicine with claimed efficacy in “stress relief” (See Section
1.8). The daily recommended dosage regimens according to the Commission E
monograph for Panax ginseng is 1-2 g of Panax ginseng root per day for up to three
months [146]. The daily dosage regimen recommended on the labels of different
commercial herbal medicine products containing ginseng as a single ingredient are
summarised in Table 4-2. For ginseng, the daily doses given on the Blackmores (raw:
1g) and Nature’s Own (raw: 1 g) product labels are consistent with the dose
recommended by the Commission E.

Chapter 4 Variability in Constituents of Herbal Medicines 120
Dai
ly
dosa
ge
regi
men
eq
uiva
lent
to
raw
mat
eria
l and
m
ain
ingr
edie
nts
Raw
mat
eria
l: 5.
4 g
Hyp
eric
in d
eriv
ativ
es: 2
.97
mg
Raw
mat
eria
l: 5.
4 g
Hyp
eric
in: 2
.7 m
g H
yper
forin
: 45
mg
Raw
mat
eria
l: 3
g H
yper
icin
: 2.5
mg
Hyp
erfo
rin: 3
7.5
mg
Act
ive
ingr
edie
nt p
er t
able
t or
ea
ch 2
ml
dose
bas
ed o
n la
bel
clai
m
Hyp
eric
um p
erfo
ratu
m (S
t Joh
n’s
Wor
t) ex
tract
eq
uiv.
to
dr
y flo
wer
ing
herb
to
p 1.
8 g
(sta
ndar
dise
d to
co
ntai
n hy
peric
in d
eriv
ativ
es 9
90 µ
g)
Hyp
eric
um p
erfo
ratu
m (S
t Joh
n’s
Wor
t) co
ncen
trate
d ex
tract
equ
iv.
to d
ry h
erb
top
flow
ers
1.8
g (s
tand
ardi
sed
to
cont
ain
hype
ricin
900
µg;
hyp
erfo
rin 1
5 m
g)
Stan
dard
ised
dr
y ex
tract
eq
uiva
lent
to
: H
yper
icum
pe
rfor
atum
(St J
ohn’
s Wor
t) he
rb
top
flow
erin
g ap
prox
. 1
g (e
quiv
alen
t to
hyp
eric
in 8
25 µ
g;
hype
rfor
in 1
2.5
mg)
Adu
lt do
sage
on
pr
oduc
t la
bel
and
wei
ght p
er ta
blet
Take
one
tab
let
thre
e tim
es d
aily
with
m
eals
, or a
s pro
fess
iona
lly p
resc
ribed
W
eigh
t per
tabl
et: 1
.0 ±
0.1
g
Take
one
tabl
et th
ree
times
a d
ay. O
r as
ad
vise
d by
you
r hea
lth c
are
prof
essi
onal
. W
eigh
t per
tabl
et: 0
.7 ±
0.0
5 g
Take
one
tab
let
thre
e tim
es d
aily
with
m
eals
, or
as
dire
cted
by
a he
alth
care
pr
ofes
sion
al
Wei
ght p
er ta
blet
: 0.9
± 0
.1 g
Tab
le 4
-1. D
aily
dos
age
regi
men
of d
iffer
ent c
omm
erci
al p
rodu
cts o
f St J
ohn’
s wor
t .
(The
reco
mm
ende
d da
ily d
osag
e re
gim
en o
n C
omm
issi
on E
mon
ogra
phs f
or h
yper
icum
: ra
w: 2
-4 g
)
Bra
nd N
ame
Bla
ckm
ores
Hyp
erifo
rte™
(S
t Joh
n’s W
ort);
A
UST
L 5
8665
B
atch
: 201
83;
Expi
ry d
ate:
052
004
Nat
ure’
s Ow
n; H
yper
icum
; (S
t Joh
n’s W
ort)
AU
ST L
664
71
Bat
ch: 7
8907
01;
Expi
ry d
ate:
04
2004
Bio
glan®
(S
t Joh
n’s W
ort)
AU
ST L
610
58
Bat
ch: 1
331-
2 Ex
piry
dat
e: 0
5200
3

Chapter 4 Variability in Constituents of Herbal Medicines 121
Dai
ly d
osag
e re
gim
en e
quiv
alen
t to
ra
w
mat
eria
l an
d m
ain
ingr
edie
nts
Raw
mat
eria
l: 6
g
Raw
mat
eria
l: 2-
4 g
Hyp
eric
in: 1
-2 m
g
Raw
mat
eria
l: 2.
75 g
H
yper
icin
: 1 m
g
Act
ive
ingr
edie
nt
per
tabl
et
or
each
2
ml
dose
ba
sed
on
labe
l cl
aim
Each
2
ml
cont
ains
H
yper
icum
pe
rfor
atum
(St J
ohn’
s Wor
t) ex
tract
eq
uiv.
to 2
g d
ry h
erb
Hyp
eric
um p
erfo
ratu
m (
St.
John
’s
Wor
t) he
rb
appr
ox.
2 g,
St
anda
rdis
ed
equi
v.
Hyp
eric
in
903.
2 µg
– 1
.129
mg
Extra
cts
equi
vale
nt
to
dry:
H
yper
icum
per
fora
tum
her
b 1.
375
g st
anda
rdis
ed to
500
µg
hype
ricin
Adu
lt do
sage
on
pr
oduc
t la
bel
and
wei
ght p
er ta
blet
Take
2 m
l th
ree
times
dai
ly i
n a
smal
l qua
ntity
of w
ater
.
Swal
low
1 o
r 2
tabl
ets
daily
or
as
dire
cted
by
yo
ur
heal
th
care
pr
ofes
sion
al.
Wei
ght p
er ta
blet
: 0.8
± 0
.1g
Take
on
e ta
blet
m
orni
ng
and
even
ing.
Dur
atio
n of
the
rapy
is
reco
mm
ende
d fo
r fo
ur
to
six
wee
ks.
Wei
ght p
er ta
blet
: 0.6
± 0
.05
g
Tab
le 4
-1.
Con
tinue
d.
Bra
nd N
ame
Gre
enrid
ge H
yper
icum
(S
t Joh
n’s W
ort)
AU
ST L
460
88
Bat
ch: 5
1490
0B
Expi
ry d
ate:
052
004
Gol
den
Glo
w
(St.
John
’s W
ort)
AU
ST L
676
06
Bat
ch: H
1109
2 Ex
piry
dat
e: 0
7200
4
Rem
otiv®
Ex
tract
of
Hyp
eric
um (
St.
John
’s
Wor
t) A
UST
L 7
6830
B
atch
: 173
111
Expi
ry d
ate:
012
004

Chapter 4 Variability in Constituents of Herbal Medicines 122
Dai
ly
dosa
ge
regi
men
t eq
uiva
lent
to
raw
mat
eria
l an
d m
ain
ingr
edie
nts
Raw
mat
eria
l: 1
g G
inse
nosi
des:
18.
6 m
g
Raw
mat
eria
l: 1
g
Raw
mat
eria
l: 0.
5-1.
0 g
Gin
seno
side
s: 9
-18
mg
Raw
mat
eria
l: 3
g G
inse
nosi
des:
53.
58 m
g
Act
ive
ingr
edie
nt p
er t
able
s or
ca
psul
es
Pana
x gi
nsen
g (K
orea
n gi
nsen
g)
extra
ct e
quiv
alen
t to
dry
roo
t 50
0 m
g (s
tand
ardi
sed
to
cont
ain
gins
enos
ides
9.3
mg)
Each
cap
sule
con
tain
s: 5
00 m
g of
K
orea
n gi
nsen
g
Extra
ct e
quiv
. dry
: Pan
ax g
inse
ng
(Kor
ean
Gin
seng
) ro
ot
appr
oxim
atel
y 50
0 m
g (s
tand
ardi
zed
equi
vale
nt
gins
enos
ides
(as g
inse
nosi
de R
g1)
8.93
mg)
Each
ca
psul
e co
ntai
ns
extra
ct
equi
vale
nt
to
Pana
x gi
nsen
g (K
orea
n G
inse
ng)
root
ap
prox
imat
ely
500
mg,
sta
ndar
d eq
uiva
lent
to
gi
nsen
osid
es
(as
gins
enos
ide
Rg1
) 8.9
3 m
g
Adu
lt do
sage
and
wei
ght
per
tabl
et o
r ca
psul
e
Take
two
tabl
ets
daily
with
mea
ls,
or a
s pro
fess
iona
lly p
resc
ribed
W
eigh
t per
tabl
et: 1
.0 ±
0.1
g
Take
tw
o ca
psul
es
daily
w
ith
food
. W
eigh
t per
cap
sule
: 1.4
± 0
.1 g
Take
one
to
two
caps
ules
dai
ly
with
fo
od
or
as
prof
essi
onal
ly
pres
crib
ed.
Wei
ght p
er c
apsu
le: 0
.6 ±
0.0
5g
Swal
low
two
caps
ules
thre
e tim
es
daily
for
per
iods
of
up t
o tw
o m
onth
s. W
eigh
t per
cap
sule
s: 0
.5 ±
0.0
5g
Tab
le 4
-2.
Dai
ly d
osag
e re
gim
en o
f diff
eren
t com
mer
cial
pro
duct
s of g
inse
ng.
(The
reco
mm
ende
d da
ily d
osag
e re
gim
en o
n C
omm
issi
on E
mon
ogra
phs f
or P
anax
gin
seng
is 1
-2 g
)
Bra
nd N
ame
Bla
ckm
ores
; K
orea
n gi
nsen
g;
AU
ST L
519
87
Bat
ch: 1
5698
Ex
piry
dat
e: 1
1200
3
Nat
ure’
s Ow
n®; K
orea
n gi
nsen
g;
AU
ST L
661
48 7
53/5
B
atch
: 785
2805
Ex
piry
dat
e: 0
2200
3
Vita
Glo
w
Kor
ean
gins
eng;
A
UST
L 5
1089
B
atch
: 125
69
Expi
ry d
ate:
032
003
Gol
den
Glo
w
Kor
ean
Gin
seng
A
UST
L 5
9267
B
atch
: K01
251
Expi
ry d
ate:
102
003

Chapter 4 Variability in Constituents of Herbal Medicines 123
In contrast, the daily dose given on the VitaGlow (raw: 0.55-1.1 g) product label is
lower than the dose recommended by the Commission E while the daily dose given
on the Golden Glow (raw: 3g) product label is higher than the dose recommended by
the Commission E.
Ginger
Ginger (Zingiber officinale) is an herbal medicine with claimed therapeutic benefits
in travel sickness, morning sickness and indigestion (See Section 1.10).
Recommended dosage according to the Commission E monograph for Zingiber
officinale is dose of 2-4 g of cut rhizome or dried extract, or 0.25-1.0 g of powdered
rhizome, three times daily [199]. Dosage regimens of ginger on the labels of different
commercial product available in Australia are summarised in Table 4-3. For ginger,
the recommended daily dose of the Golden Glow (raw: 2-4 g) product is consistent
with dose recommended in the Commission E monograph, but daily dose raw 1-2 g
given on the Vcaps™ product label is lower than the dose recommended in the
Commission E. The dose recommended on the Blackmores product is only for short
term use, so a valid comparison with the Commission E recommended dose is not
appropriate.

Chapter 4 Variability in Constituents of Herbal Medicines 124
Dai
ly d
osag
e re
gim
ent
equi
vale
nt
to r
aw m
ater
ial o
n la
bels
Raw
mat
eria
l: 2.
4 g
Raw
mat
eria
l: 2
to 4
g
[6]-
Gin
gero
l: 2
to 4
mg
Act
ive
ingr
edie
nt p
er t
able
s or
ca
psul
es
Zing
iber
of
ficin
ale
(Gin
ger)
rh
izom
e po
wde
r 400
mg
Con
tain
s ex
tract
equ
ival
ent
fres
h Zi
ngib
er
offic
inal
e (G
inge
r)
rhiz
ome.
App
rox.
1 g
sta
ndar
dise
d eq
uiva
lent
[6]
-Gin
gero
l l 1
mg
Zing
iber
of
ficin
ale
extra
ct
equi
vale
nt t
o dr
y rh
izom
e 6.
6 g
Adu
lt do
sage
an
d w
eigh
t pe
r ta
blet
or
caps
ule
Take
2 t
o 3
tabl
ets
half
an h
our
befo
re
trave
lling
, th
en
1 ta
blet
ev
ery
2 ho
urs.
Wei
ght p
er ta
blet
: 0.
5 ±
0.05
g
Swal
low
1 to
2 ta
blet
s, tw
o tim
es
per d
ay
Wei
ght p
er ta
blet
: 0.8
± 0
.07
g
Wei
ght p
er c
apsu
les:
0.7
± 0
.06g
Tab
le 4
-3.
Dai
ly d
osag
e re
gim
en o
f diff
eren
t com
mer
cial
pro
duct
s of g
inge
r.
(A re
com
men
ded
2-4
g pe
r day
of c
ut rh
izom
e or
drie
d ex
tract
on
the
Com
mis
sion
E)
Bra
nd N
ame
Bla
ckm
ores
; Tr
avel
cal
m g
inge
r A
UST
L 2
0201
B
atch
: 197
82;
Expi
ry d
ate:
052
004
Gol
den
Glo
w
Gin
ger 1
000
AU
ST L
683
79
Bat
ch: D
1046
8 Ex
piry
dat
e: 0
4200
4 Zi
naxi
n™ *
Fe
rros
an In
tern
atio
nal
Bat
ch: 9
0400
2
* N
ot a
vaila
ble
in A
ustra
lia

Chapter 4 Variability in Constituents of Herbal Medicines 125
Ginkgo
Ginkgo biloba leaf preparation is an herbal medicine with claimed therapeutic
benefits in assisting blood circulation (See Section 1.9). The recommended daily
dosage according to the Commission E monograph for Ginkgo biloba is 120-240 mg
(raw material: 6 – 12 g) standardised dry extract in liquid or solid pharmaceutical
dose form for oral administration, given in two or three divided daily doses [175].
Recommended daily dosage regimens on different commercial ginkgo product labels
are summarised in Table 4-4. For ginkgo, the daily doses given on the Nature’s Own
(raw: 1.5-3 g) and Bioglan (raw: 2-6 g) product labels are lower than the dose
recommended in the Commission E monograph for Ginkgo biloba. The daily doses
given on the Blackmores (raw: 6 g), BioGinkgo (raw: 6 g), Golden Glow (6 g),
Tavonin 6-12 g), Phytomedicine (7.5 g), Herron (raw: 6 g) and Medi Herb (6 g)
product labels are consistent with the dose recommended in the Commission E
monograph for the herb.

Chapter 4 Variability in Constituents of Herbal Medicines 126
Dai
ly d
osag
e re
gim
ent
equi
vale
nt
to
raw
m
ater
ial
and
mai
n in
gred
ient
s
Raw
mat
eria
l: 6
g G
inkg
o fla
vong
lyco
side
s: 3
2.1
mg
Gin
kgol
ides
: 8.1
mg
B
iloba
lide:
8.1
mg
Raw
mat
eria
l: 1.
5-3
g G
inkg
o fla
vone
gly
cosi
des:
7.2
-14.
4 m
g
Raw
mat
eria
l: 2-
6 g
Gin
kgo
flavo
ne g
lyco
side
s: 9
.6-2
8.8
mg
Act
ive
ingr
edie
nt p
er t
able
t or
ca
psul
e
Gin
kgo
bilo
ba
(Gin
kgo)
ex
tract
eq
uiva
lent
to
dr
y le
af
2 g
(sta
ndar
dise
d to
co
ntai
n gi
nkgo
fla
vone
gly
cosi
des
10.7
mg
and
gink
golid
es
and
Bilo
balid
e 2.
7 m
g).
Con
cent
rate
d st
anda
rdis
ed G
inkg
o bi
loba
as
extra
ct e
quiv
alen
t to
dry
leaf
75
0 m
g.
Stan
dard
ised
to
gi
nkgo
fla
vone
gly
cosi
des
3.6
mg
(24%
).
Stan
dard
ised
ex
tract
dr
y co
nc.
Equi
vale
nt d
ry g
inkg
o bi
loba
leaf
2
g eq
uiva
lent
to
gi
nkgo
fla
vone
gl
ycos
ides
9.6
mg
Adu
lt do
sage
an
d w
eigh
t pe
r ta
blet
or
caps
ule
Take
one
tab
let
thre
e tim
es d
aily
w
ith m
eals
. W
eigh
t per
tabl
et: 1
g
Take
1 o
r 2
caps
ules
tw
ice
daily
. O
r as
adv
ised
by
your
hea
lth c
are
prof
essi
onal
. W
eigh
t per
cap
sule
: 0.3
4 g
Take
1-3
tabl
ets d
aily
with
a m
eal.
Wei
ght p
er ta
blet
: 0.6
6 g
Tab
le 4
-4.
Dai
ly d
osag
e re
gim
en o
f diff
eren
t com
mer
cial
pro
duct
s of g
inkg
o.
(120
-240
mg
(raw
mat
eria
l: 6
– 12
g) s
tand
ardi
sed
dry
extra
ct w
as re
com
men
ded
on C
omm
issi
on E
)
Bra
nd n
ame
Bla
ckm
ores
G
inkg
ofor
te™
A
UST
L 6
7101
B
atch
208
97
Expi
ry d
ate:
072
004
Nat
ure’
s Ow
n;
Gin
kgo
bilo
ba;
AU
ST L
284
60 7
51/4
B
atch
: 785
9504
; Ex
piry
dat
e: 0
2200
4
Bio
glan®
; Su
per g
inkg
o 20
00
AU
ST L
614
61
Bat
ch: 1
268-
2 Ex
piry
dat
e: 0
1200
5
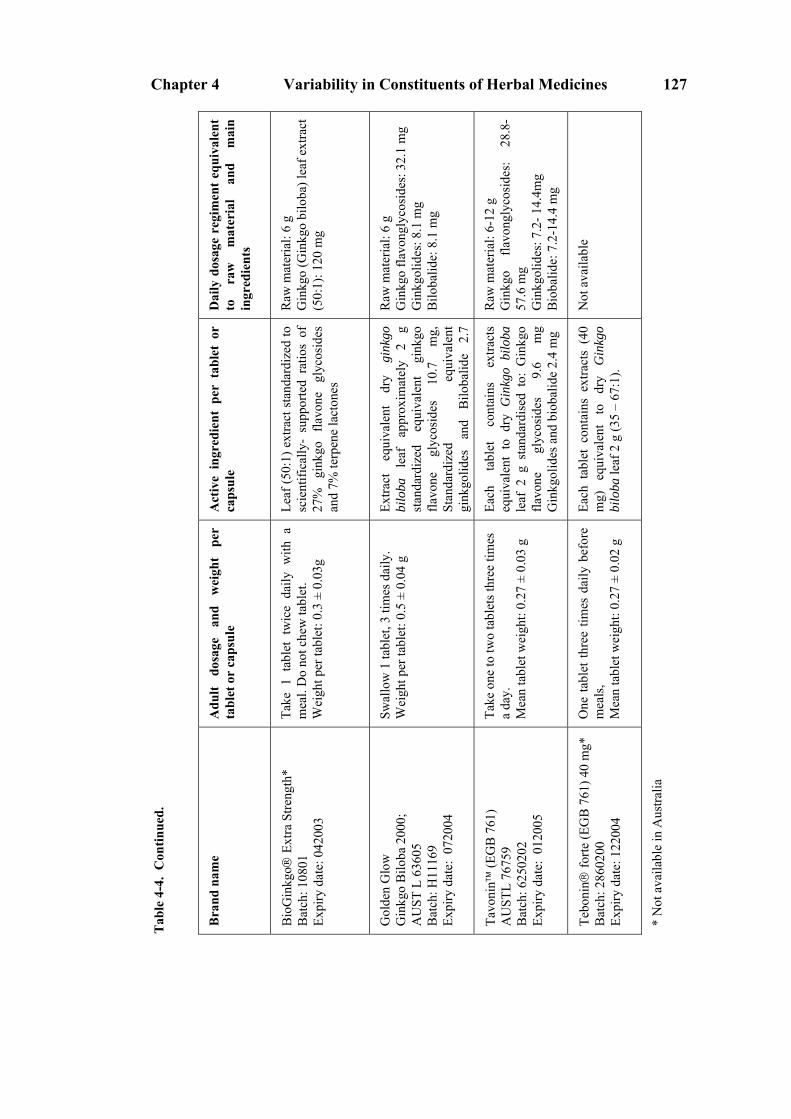
Chapter 4 Variability in Constituents of Herbal Medicines 127
Dai
ly d
osag
e re
gim
ent e
quiv
alen
t to
ra
w
mat
eria
l an
d m
ain
ingr
edie
nts
Raw
mat
eria
l: 6
g G
inkg
o (G
inkg
o bi
loba
) lea
f ext
ract
(5
0:1)
: 120
mg
Raw
mat
eria
l: 6
g G
inkg
o fla
vong
lyco
side
s: 3
2.1
mg
Gin
kgol
ides
: 8.1
mg
Bilo
balid
e: 8
.1 m
g
Raw
mat
eria
l: 6-
12 g
G
inkg
o fla
vong
lyco
side
s:
28.8
-57
.6 m
g G
inkg
olid
es: 7
.2- 1
4.4m
g
Bio
balid
e: 7
.2-1
4.4
mg
Not
ava
ilabl
e
Act
ive
ingr
edie
nt p
er t
able
t or
ca
psul
e
Leaf
(50:
1) e
xtra
ct s
tand
ardi
zed
to
scie
ntifi
cally
- su
ppor
ted
ratio
s of
27
%
gink
go
flavo
ne
glyc
osid
es
and
7% te
rpen
e la
cton
es
Extra
ct
equi
vale
nt
dry
gink
go
bilo
ba
leaf
ap
prox
imat
ely
2 g
stan
dard
ized
eq
uiva
lent
gi
nkgo
fla
vone
gl
ycos
ides
10
.7
mg,
St
anda
rdiz
ed
equi
vale
nt
gink
golid
es
and
Bilo
balid
e 2.
7
Each
ta
blet
co
ntai
ns
extra
cts
equi
vale
nt t
o dr
y G
inkg
o bi
loba
le
af 2
g s
tand
ardi
sed
to:
Gin
kgo
flavo
ne
glyc
osid
es
9.6
mg
Gin
kgol
ides
and
bio
balid
e 2.
4 m
g
Each
tab
let
cont
ains
ext
ract
s (4
0 m
g)
equi
vale
nt
to
dry
Gin
kgo
bilo
ba le
af 2
g (3
5 –
67:1
).
Adu
lt do
sage
an
d w
eigh
t pe
r ta
blet
or
caps
ule
Take
1 t
able
t tw
ice
daily
with
a
mea
l. D
o no
t che
w ta
blet
. W
eigh
t per
tabl
et: 0
.3 ±
0.0
3g
Swal
low
1 ta
blet
, 3 ti
mes
dai
ly.
Wei
ght p
er ta
blet
: 0.5
± 0
.04
g
Take
one
to tw
o ta
blet
s thr
ee ti
mes
a
day.
M
ean
tabl
et w
eigh
t: 0.
27 ±
0.0
3 g
One
tabl
et th
ree
times
dai
ly b
efor
e m
eals
, M
ean
tabl
et w
eigh
t: 0.
27 ±
0.0
2 g
Tab
le 4
-4.
Con
tinue
d.
Bra
nd n
ame
Bio
Gin
kgo®
Ext
ra S
treng
th*
Bat
ch: 1
0801
Ex
piry
dat
e: 0
4200
3 G
olde
n G
low
G
inkg
o B
iloba
200
0;
AU
ST L
636
05
Bat
ch: H
1116
9 Ex
piry
dat
e: 0
7200
4 Ta
voni
n™ (E
GB
761
) A
UST
L 76
759
Bat
ch: 6
2502
02
Expi
ry d
ate:
012
005
Tebo
nin®
forte
(EG
B 7
61) 4
0 m
g*
Bat
ch: 2
8602
00
Expi
ry d
ate:
122
004
* N
ot a
vaila
ble
in A
ustra
lia

Chapter 4 Variability in Constituents of Herbal Medicines 128
Dai
ly d
osag
e re
gim
ent
equi
vale
nt
to
raw
m
ater
ial
and
mai
n in
gred
ient
s
Raw
mat
eria
l: 7.
5 g
Gin
kgo
flavo
ne g
lyco
side
s: 4
0.05
m
g
Raw
mat
eria
l: 6
g G
inkg
o fla
vone
gly
cosi
des:
32.
1 m
g G
inkg
olid
es: 8
.1 m
g B
iloba
lide:
8.1
mg
Raw
mat
eria
l: 6
g G
inkg
o fla
vone
gly
cosi
des:
32.
1 m
g G
inkg
olid
es: 8
.1 m
g B
iloba
lide:
8.1
mg
Act
ive
ingr
edie
nt p
er t
able
t or
ca
psul
e
Gin
kgo
bilo
ba e
xtra
ct e
quiv
. To
dr
ied
leaf
250
0 m
g. S
tand
ardi
sed
to
cont
ain
gink
go
flavo
ne
glyc
osid
es 1
3.35
mg
Each
ta
blet
co
ntai
ns:
Gin
kgo
(Gin
kgo
bilo
ba)
extra
ct e
quiv
alen
t to
dry
lea
f 2
g st
anda
rdis
ed t
o co
ntai
n G
inkg
o Fl
avon
glyc
osid
es
10.7
m
g,
Gin
kgol
ides
an
d B
iloba
lide
2.7
mg,
Each
tabl
et c
onta
ins
extra
ct e
quiv
. D
ry:
Gin
kgo
bilo
ba
leaf
2.
0 g
stan
dard
. to
gi
nkgo
fla
vone
gl
ycos
ides
10
.7
mg
stan
dard
to
gi
nkgo
lides
and
bilo
balid
e 2.
7 m
g
Adu
lt do
sage
an
d w
eigh
t pe
r ta
blet
or
caps
ule
One
ta
blet
th
rice
daily
be
fore
m
eals
Ta
ble
wei
ght:
1.0
± 0.
1 g
Adu
lts: T
ake
one
tabl
et th
ree
times
da
ily w
ith fo
od
Tabl
e w
eigh
t: 0.
8 ±
0.05
g
Take
1 ta
blet
3 ti
mes
dai
ly,
Tabl
e w
eigh
t: 0.
5 ±
0.05
g
Tab
le 4
-4. C
ontin
ued.
B
rand
nam
e
Phyt
omed
icin
e gi
nkgo
250
0 A
UST
L 7
5421
B
atch
: 415
46A
Ex
piry
dat
e: 0
6200
3
Her
ron
Gin
kgo
Bilo
ba 2
000
AU
ST L
768
46
Bat
ch: 5
3261
Ex
piry
dat
e: 0
7200
5
Med
i Her
b®
Phyt
osyn
ergi
st™
G
inkg
o bi
loba
A
UST
L 7
6385
B
atch
: 112
086
Expi
ry d
ate:
052
005

Chapter 4 Variability in Constituents of Herbal Medicines 129
4.3.2 TLC of Herbal Medicines
Figure 4-1 shows TLC chromatograms of different commercial products of
hypericum with a run time of 25 min. The chromatogram obtained with the reference
solution shows a band in the lower third zones which is attributable to rutin and
which shows yellow-orange fluorescence. The chromatogram obtained with the test
solution shows reddish-orange fluorescent zones of rutin and hyperoside in the lower
third, the band corresponding to pseudohypericin in the lower part of the upper third
and above it, band corresponding to hypericin, both with red fluorescence. Other
yellow or blue fluorescence zones are also visible. These results suggest that the
Bioglan, Natures Own and Golden Glow products have a pattern and amount of
constituents, which are consistent with comparable quality. In contrast, the
Greenridge product appears to lack some constituents suggesting it is of lower
quality. Based on the qualitative TLC results obtained from different commercial St
John’s wort products (Figure 4-1), the Bioglan product was selected for use in
clinical trials to investigate drug interactions between warfarin and St John’s wort
that are described in this thesis.

Chapter 4 Variability in Constituents of Herbal Medicines 130
TLC of St John’s Wort (Hypericum)
Figure 4-1. TLC of different commercial products of St John’s wort and standard constituents. A: Golden Glow; B: Blackmores Hyperiforte™; C: Nature’s Own; D: Rutin (1
mg/ml); E: Bioglan® Stress Relax with St John’s wort; F: Greenridge (The labelled
standards have been identified based on their expected retention times in this TLC
system according to the British Pharmacopoeia 2001).
-Hypericin -Pseudohypericin
-Hyperoside
-Rutin
A B C D E F

Chapter 4 Variability in Constituents of Herbal Medicines 131
Figure 4-2 shows the TLC chromatograms of different commercial products
containing Panax ginseng over a run time of 35 min. From the TLC chromatograms
of ginseng, it can be seen that the Golden Glow and Blackmores Korean ginseng
products have well defined TLC finger prints while the pattern of constituents is less
well defined for the Nature’s Own and Vita Glow products. These qualitative data
suggest that the Golden Glow and Blackmores products have comparable quality. In
contrast, the quality of the Nature’s Own and Vita Glow herbal medicine products
are not as well established. Based on the TLC comparison of different commercial
products of ginseng, the Golden Glow product was deemed to be of appropriate
quality for use in the clinical studies.
Figure 4-3 and Figure 4-4 show TLC chromatograms of different commercial
products of Ginkgo biloba with a run time of 20 min. It suggests that all products
contain a similar range and amount of constituents. The Ginkgo biloba extract of
EGb 761 is used in the Tavonin™ product. Several clinical trials using EGb 761
extract have already been performed with this ginkgo extract (as reviewed in Section
1.9), so the Tavonin™ product was selected for use in subsequent clinical trials to
investigate drug interactions between warfarin and this herbal medicine.
Figure 4-5 shows TLC chromatograms of different commercial products of Zingiber
officinale. The chromatogram obtained with the reference solution shows an intense
red band (resorcinol) in the lower half of the TLC plate.

Chapter 4 Variability in Constituents of Herbal Medicines 132
TLC of Ginseng
Figure 4-2. TLC of different commercial products of ginseng and standard constituents. A: Ginsenoside Rb1 (0.1 mg/ml); B: Blackmores; C: Nature’s Own; D: Golden
Glow; E: Vita Glow; F: Ginsenoside Rg1 (0.1mg/ml).
-Rg1
-Rb1
A B C D E F

Chapter 4 Variability in Constituents of Herbal Medicines 133
-Ginkgolide C
TLC of Ginkgo
Figure 4-3. TLC of different commercial products of ginkgo and standard constituents. A: Ginkgolide B (1 mg/ml); B: Bilobalide (1 mg/ml); C: Blackmores; D: Bioglan; E:
Golden Glow; F: Nature’s Own; G: BioGinkgo; H: Ginkgolide A (1 mg/ml); I:
Ginkgolide C (1 mg/ml).
-Bilobalide
-Ginkgolide A
-Ginkgolide B
A B C D E F G H I

Chapter 4 Variability in Constituents of Herbal Medicines 134
-Ginkgolide C
Figure 4-4. TLC of different commercial products of ginkgo and standard constituents. A: Ginkgolide B (1 mg/ml); B: Bilobalide (1 mg/ml); H: Ginkgolide A (1 mg/ml); I:
Ginkgolide C (1 mg/ml); J: Tavonin™; K: Tebonin®forte; L: Phytomedicine; M:
Herron; N: Medi Herb.
-Ginkgolide A -Ginkgolide B
-Bilobalide
A B J K L M N H I
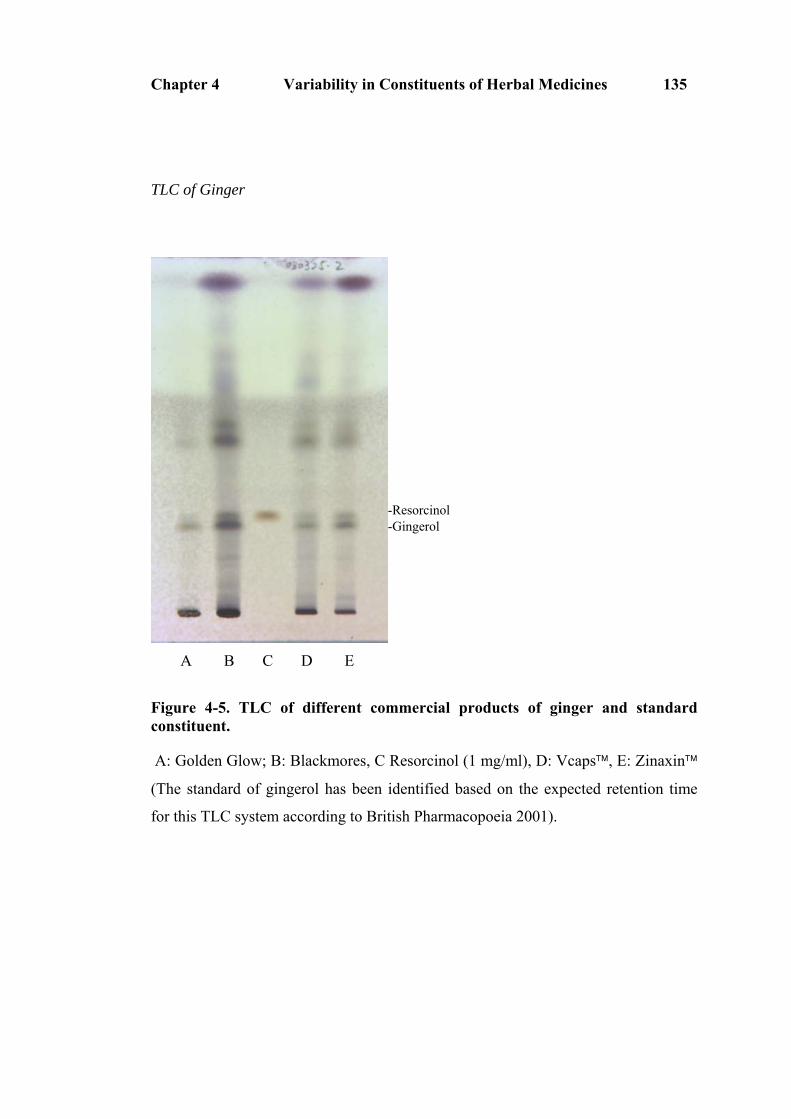
Chapter 4 Variability in Constituents of Herbal Medicines 135
TLC of Ginger
Figure 4-5. TLC of different commercial products of ginger and standard constituent. A: Golden Glow; B: Blackmores, C Resorcinol (1 mg/ml), D: Vcaps™, E: Zinaxin™
(The standard of gingerol has been identified based on the expected retention time
for this TLC system according to British Pharmacopoeia 2001).
-Resorcinol-Gingerol
A B C D E

Chapter 4 Variability in Constituents of Herbal Medicines 136
The chromatogram obtained with the test solutions shows two intense violet bands
(gingerols) below the resorcinol band. These data suggest that the Blackmores
product has a well defined constituent finger-print and hence, this product was used
in subsequent clinical trial to investigate drug interactions between warfarin and
ginger.
4.4 Discussion
The daily dosage regimens of these four herbal medicines vary according to different
commercial products. However, most are within the recommended dosage range
suggested by the Commission E. The main ingredients were comparable in different
commercial products of ginseng, ginger and ginkgo, but there were notable
differences between different commercial products of St John’s wort. The most
likely explanation is that these differences between products arise from the different
sources of herbal medicines and the different manufacturing processes used for these
products including herb extraction, purification, drying and dosage formulation. TLC
was used in this study as a method for quality screening of different brands of
commercial herbal medicines. It should be noted that in this study pharmacopoeial
methods have been used to investigate the quality of herbal medicines to facilitate
product selection. The exact concentration of active or marker compounds has not
been quantitated.
This qualitative study has highlighted some differences in the dose recommendations
and pattern of different constituents between herbal medicine products. Similar

Chapter 4 Variability in Constituents of Herbal Medicines 137
results regarding dosage issues of herbal medicines have also been noted in the
literature. For example, Garrard et al [268] investigated the 10 most commonly
purchased herbs based on their highest sales (as dollars) in 1998 including echinacea,
St John's wort, ginkgo, garlic, saw palmetto, ginseng, goldenseal, aloe, Siberian
ginseng and valerian. A large range in label ingredients and recommended daily dose
were found in these 10 herbal medicine products. Among the 880 products
investigated for these ten herbal medicines, 43% were consistent with product labels
in ingredients and recommended daily dose, 20% in ingredients only, and 37% were
either not consistent this recommended doses or the labeled information was
insufficient to assess dosing guidelines.
In contrast to conventional medicines, the pharmaceutical properties of most herbal
medicine products are poorly characterized. Since it is difficult to find the individual
components, which are responsible for the observed or claimed pharmacological
activities, in many cases the whole plant extract is considered to be the “active” part
of the dose form. However, where the active components or extraction markers have
been identified, these constituents should be used to establish a quality control
monograph. Such a monograph can be used to ensure the quality of herbal medicine
products from batch to batch, between different brands of commercial herbal
medicine products involving the same herbal ingredients and to compare products
with respect not only to content uniformity but also to their biopharmaceutical
properties. With the increasing use of analytical methods such as HPLC, GC and
TLC to investigate the quality control of herbal medicines, there is greater
understanding of the complex nature of many herbal medicines.

Chapter 4 Variability in Constituents of Herbal Medicines 138
Quality issues including content uniformity and stability are critical issues for herbal
medicine products. Numerous quality studies have been done on products containing
St John’s wort but few studies have been conducted on ginseng, ginkgo and ginger.
Bergonzi et al [269] investigated samples of Hypericum perforatum, including the
dried extracts and four commercially available dried extracts, using HPLC to
determine the relative concentration of the main constituents of this herb. The total
flavonol content ranged from 4.58% to 15.90%; hypericins ranged from 0.05% to
0.11%; and hyperforins ranged from 1.37% to 20.80% in these products. For
commercial dried extracts, their flavonol content varied from 10.64% to 15.01%,
hypericins varied from 0.03% to 0.20%, and hyperforins varied from 1.18% to 6.54%
[269]. Batch to batch reproducibility of St. John’s wort herbal medicine products has
been performed by Wurglics et al [274]. These researchers analyzed both hyperforin
and hypericin content from five batches from each of eight manufacturers.
Hyperforin concentrations were analyzed by HPLC, and total hypericin
concentrations were determined by polarography, an electrochemical method.
Widely differing amounts of hypericin and hyperforin were found in some products
[274]. Bilia et al [275] evaluated thermal and photostability of a commercial dried
extract and capsules of St. John's wort. In addition, capsules of different colors
corresponding to different opacity and pigment contents were also evaluated as the
primary packaging of the herbal medicine product. Tests in the secondary pack were
performed using amber containers. HPLC was employed for determination of the
stability of all the characteristic constituents including flavonols, hyperforins and
hypericins. Results of the photostability test showed all the constituents to be
photosensitive under the tested conditions. However, capsules of different opacity

Chapter 4 Variability in Constituents of Herbal Medicines 139
and containing different pigments influenced the stability of the different classes of
constituents. Amber containers, suggested as secondary packages, only partly
influenced the photostability of the investigated constituents. Long-term thermal
stability testing by measuring t90 of hyperforins and hypericins, respectively, showed
the stable period was less than 4 months even if the antioxidants ascorbic and citric
acids were added to the formulation.
Besides the quality issues mentioned above, issues related to phytoequivalence or
bioequivalence of commercial herbal medicine remains an area of research. One
study conducted by Westerhoff et al [276] investigated the dissolution of specific
constituents of St John’s wort products. The components of St John's wort including
phloroglucines, naphthodianthrones and the flavonoids, which were known or
suspected to play a role in its antidepressant activity, were measured in the
dissolution study. The study demonstrated that products had notably different
release profiles of selected constituents. Another conclusion was that bioequivalence
was not likely to be demonstrated even though the label claims on these St John’s
wort products indicated that these products should be pharmaceutically equivalent
[276].
Kressmann et al [271, 272] published two separate studies which aimed to identify
the quality issues of ginkgo products and the influence on the bioavailability of
ginkgo constituents. A variety of products on the USA market was studied including
quantity of constituents and in vitro dissolution. Flavone glycosides ranged from
24% to 36%, terpene lactones from 4% to 11% and the ginkgolic acids from < 500

Chapter 4 Variability in Constituents of Herbal Medicines 140
ppm to about 90000 ppm were found in these ginkgo products. Comparing the
dissolution rates of terpene lactones and flavone glycosides within the single
products, most of the products released more than 75% of the content of both
components within 30 min. However, several products showed differences in
dissolution rates. Furthermore, two different Ginkgo biloba brands were analysed for
dissolution rates and relative bioavailability in terms of ginkgolide A, ginkgolide B
and bilobalide. Dissolution rates at pH 1 and 4.5 were conducted according to the
USP 23. The relative bioavailability was investigated after single oral administration
of 120 mg Ginkgo biloba extract as tablets or capsules in twelve healthy male
volunteers using an open-label, randomized crossover design. Significant difference
in AUC0-∞, tmax and Cmax in term of ginkgolide A, ginkgolide B and bilobalide were
found in the test and reference products. The poor dissolution rate of the ginkgo
product resulted in poor bioavailability. The results demonstrated that the two ginkgo
products were not considered to be bioequivalent [271].
Only in the last few decades, reports of clinical trials started to appear in the
literature that compare the constituents of different products using in vivo
investigations [277]. Most reports have been based on observational trials and were
rarely conducted according to the Good Clinical Practice (GCP). Recently, clinical
studies with herbal medicines have started to be performed according to the GCP
requirement by a few pharmaceutical companies. Compared with conventional
medicines, the complex composition of herbal medicines makes it difficult to carry
out pharmacodynamic and pharmacokinetics studies. It is not unreasonable that
clinical development of herbal medicine products should be conducted according to

Chapter 4 Variability in Constituents of Herbal Medicines 141
the general principles of conventional drug development. However, without rigorous
phytoequivalence studies, the results of a clinical trial performed with a particular
brand of herbal medicine product cannot be easily or reliably extrapolated to other
brands of herbal medicine products.

Chapter 5 Effect of St John’s Wort and Ginseng on Warfarin 142
Chapter 5 Effect of St John’s Wort and Ginseng
on the Pharmacokinetics and Pharmacodynamics of
Warfarin in Healthy Subjects
5.1 Introduction
The anticoagulant warfarin has an important place in the management of
cardiovascular disease in the community where people have free access to herbal
medicines. The narrow therapeutic range of warfarin and its metabolism by
cytochrome P450 (CYP) make it prone to potentially life-threatening interactions and
result in warfarin being one of the most frequently investigated drugs with respect to
drug interactions [9]. St John’s wort (Hypericum perforatum) is a herbal medicine
widely used in the community for the management of a range of conditions including
depression. Numerous drug interactions with St John’s wort have been documented
based on case reports, and in vitro and in vivo studies [8, 74, 75]. There are a number
of case reports suggesting that co-administration of St John’s wort decreases the
effects of warfarin [8]. The Medical Products Agency (MPA, Sweden) has received
seven case reports of a reduced anticoagulant effect and decreased INR of warfarin
associated with co-administration of St John’s wort [75]. Similarly, over the period
of October 1992 to September 2000, the UK Committee on Safety of Medicines and
the Medicines Control Agency received 35 reports of suspected interactions between
St John’s wort and conventional medicines; of these four were related to potential

Chapter 5 Effect of St John’s Wort and Ginseng on Warfarin 143
interactions with warfarin [74]; two cases reported an increase in INR and two cases
reported a decrease in INR. Despite these observations, the possible interaction
between warfarin and St John’s wort has not been systemically investigated.
Similarly, ginseng (Panax ginseng) is also widely used in the community for a
variety of indications, but few drug interaction studies have been undertaken. There
is a published case report of decreased effect of warfarin in a patient receiving
ginseng [167], but a study in rats found no effect of ginseng on the pharmacokinetics
or pharmacodynamics of warfarin [168]. The conclusion from a recent systematic
review was that patients who take warfarin with ginseng should regularly monitor
their INR [148].
The aim of the present study was to investigate the possible drug interactions
between warfarin and these two widely used herbal medicines in healthy subjects
using single herbal ingredient products of known quality. The results from this
chapter have been published in the British Journal of Clinical Pharmacology [278].
5.2 Materials and Methods
The materials and methods for this chapter have been presented in Chapter 2.
.

Chapter 5 Effect of St John’s Wort and Ginseng on Warfarin 144
5.3 Results
5.3.1 Subjects
Twelve healthy male subjects were recruited into and completed the study in three
treatment groups. Subjects were aged between 20 to 39 years and within 15% of
ideal body weight for height and build. Subjects came from a diverse ethnic mix (8
Caucasians, 4 Asians). All subjects were non-smokers and met the inclusion criteria
outlined in Section 2.1.2. The demographic data for the subject cohort are described
in Table 5-1.
5.3.2 Results of Statistical Analysis
ANOVA was performed on log transformed parameters including AUC(0-∞) and Cmax
of S-warfarin and R-warfarin and AUC0-168 of INR. Sequence and period factors of
AUC(0-∞) of S-warfarin and R-warfarin and AUC0-168 of INR were not identified as
being statistically significant while treatment was significantly different (Appendix
1-5). The lack of a period or sequence effect supports the observation that the trial
design, especially the washout period, was adequate to exclude any carryover effect
of St John’s wort, ginseng and warfarin. This is especially important given that St
John’s wort has been shown to be an inducer of drug metabolising enzymes.
5.3.3 Pharmacokinetics of S-warfarin and R-warfarin
There was a significant difference in AUC0-∞, t1/2 and CL/F for both S-warfarin and
R-warfarin following pre-treatment with St John’s wort. By contrast, there were no
significant changes in these parameters following treatment with ginseng. Neither St

Chapter 5 Effect of St John’s Wort and Ginseng on Warfarin 145
John’s wort nor ginseng affected the apparent volume of distribution, Cmax or tmax of
the warfarin enantiomers (Figure 5-1 to 5-12, Table 5-2 and Table 5-3).
Table 5-1. Subject demographic data (n=12).
Subject Age (years) Weight (kg) Height (cm) Ethnicity
1 24 66 179 Caucasian
2 27 65 175 Caucasian
3 36 66.4 163 Asian
4 22 76 178 Asian
5 21 108.9 189.5 Caucasian
6 22 91 187.5 Caucasian
7 23 94 185 Caucasian
8 20 51 179 Caucasian
9 22 70 175 Caucasian
10 25 68 169.5 Asian
11 35 70 180 Caucasian
12 39 65 168 Asian
Mean ± SD 26.3 ± 6.6 74.3 ± 15.9 177.4 ± 7.9

Chapter 5 Effect of St John’s Wort and Ginseng on Warfarin 146
Figure 5-1. S-warfarin concentration-time profiles following administration of a
single 25 mg oral dose of rac-warfarin either alone (warfarin only), or warfarin
and ginseng (GS), or warfarin and St John’s wort (SJW). Data are presented as
Mean (± SD, n=12) with semi-log (A) and linear (B) plots. Individual subject
data are shown in Appendix 11.
A:
1
10
100
1000
10000
0 50 100 150 200
Time (hour)
S-w
arfa
rin C
onc.
(ng/
ml)
Warfarin OnlyWarfarin+GSWarfarin + SJW
B:
0
500
1000
1500
2000
2500
0 50 100 150 200
Time (hour)
S-w
arfa
rin C
onc.
(ng/
ml)
Warfarin OnlyWarfarin+GSWarfarin + SJW

Chapter 5 Effect of St John’s Wort and Ginseng on Warfarin 147
Figure 5-2. R-warfarin concentration-time profiles following administration of a
single 25 mg oral dose of rac-warfarin either alone (warfarin only), or warfarin
and ginseng (GS), or warfarin and St John’s wort (SJW). Data are presented as
mean (± SD, n=12) with semi-log (A) and linear (B) plots. Individual subject
data are presented in Appendix 11.
A:
1
10
100
1000
10000
0 50 100 150 200
Time (hour)
R-w
arfa
rin C
onc.
(ng/
ml)
Warfarin OnlyWarfarin+SJWWarfarin+GS
B:
0
500
1000
1500
2000
2500
0 50 100 150 200
Time (hour)
R-w
arfa
rin C
onc.
(ng/
ml)
Warfarin OnlyWarfarin+SJWWarfarin+GS

Chapter 5 Effect of St John’s Wort and Ginseng on Warfarin 148
Table 5-2. Warfarin pharmacokinetic parameters following administration a
single oral 25 mg rac-warfarin (WF) alone, in combination with either St John’s
wort (WF + SJW) or ginseng (WF + GS). Data are presented as mean ± SD
(n=12). The 95% confidence interval is shown in brackets for each parameter.
Individual subject data are presented in Appendices 13-19.
Treatment WF alone WF + SJW WF + GS
fu S-warfarin
R-warfarin
0.0034 ± 0.0011 (0.0027 - 0.0041) 0.0048 ± 0.0006 (0.0044 - 0.0051)
0.0036 ± 0.0010 (0.0030 - 0.0043) 0.0047 ± 0.0009 (0.0041 - 0.0052)
0.0039 ± 0.0016 (0.0029 - 0.0049) 0.0046 ± 0.0008 (0.0041 - 0.0051)
AUC0-∞ (ng/ml×h) S-warfarin
R-warfarin
65400 ± 13800 (56600 - 74100) 120900 ± 32900 (99000 - 142700)
47700 ± 8300
(42400 - 53000) 91100 ± 15400
(80800 - 101300)
57800 ± 7400
(53100 - 62500) 108100 ± 18300 (95900 - 120200)
tmax (h) S-warfarin
R-warfarin
1.29 ± 0.51 (0.97 - 1.62) 1.34 ± 0.48
(1.02 – 1.66)
1.26 ± 0.46 (0.97 - 1.55) 1.34 ± 0.48
(1.10 – 1.73)
1.30 ± 0.55 (0.95 - 1.65) 1.30 ± 0.52
(0.95 – 1.65) Cmax (ng/ml) S-warfarin
R-warfarin
1890 ± 260
(1700 - 2000) 19200 ± 320 (1700 - 2100)
1820 ± 340
(1600 - 2000) 1840 ± 360
(1600 - 2100)
1930 ± 310
(1700 - 2100) 1890 ± 290
(1700 - 2000) t1/2 (h)
S-warfarin
R-warfarin
31.7 ± 4.5
(28.8 - 34.5) 51.7 ± 9.6
(45.6 - 57.8)
25.1 ± 4.3
(22.4 - 27.9) 40.3 ± 3.9
(38.0 - 42.7)
29.2 ± 5.2
(25.9 - 32.4) 47.9 ± 7.8
(42.9 - 52.9) CL/F (ml/h) S-warfarin
R-warfarin
198 ± 38
(174 - 223) 110 ± 25 (94 - 126)
270 ± 44
(241 - 297) 142 ± 29
(123 - 161)
220 ± 29
(201 - 238) 119 ± 20
(106 - 131) V/F (ml/kg) S-warfarin
R-warfarin
120 ± 30
(110 - 140) 100 ± 20 (90 - 130)
130 ± 30
(110 - 150) 100 ± 20
(100 - 130)
130 ± 30
(110 - 150) 100 ± 20
(100 - 120)

Chapter 5 Effect of St John’s Wort and Ginseng on Warfarin 149
Table 5-3. Mean ratios and 90% confidence intervals for log transformed S-
warfarin and R-warfarin pharmacokinetic parameters comparing each herb
treatment to the warfarin only arm as control (n=12).
Treatment
St John’s wort (90% CI)
Ginseng (90% CI)
fu S-warfarin R-warfarin
1.12 (0.96 - 1.31) 1.04 (0.95 - 1.14)
1.10 (0.85 - 1.42) 1.03 (0.94 - 1.13)
AUC0-∞ S-warfarin R-warfarin
0.73 (0.65 - 0.83)* 0.77 (0.67 - 0.87)*
0.89 (0.82 - 0.98) 0.91 (0.84 - 0.99)
tmax S-warfarin R-warfarin
1.13 (0.76 - 1.49) 1.17 (0.80 - 1.54)
1.20 (0.77 - 1.62) 1.11 (0.78 - 1.44)
Cmax S-warfarin R-warfarin
0.95 (0.86 - 1.05) 0.96 (0.84 - 1.09)
1.01 (0.90 - 1.12) 0.98 (0.88 - 1.09)
t1/2 S-warfarin R-warfarin
0.79 (0.72 - 0.87)* 0.79 (0.72 - 0.86)*
0.92 (0.85 - 0.99) 0.93 (0.88 - 0.99)
CL/F S-warfarin R-warfarin
1.29 (1.16 - 1.46)* 1.23 (1.11 - 1.37)*
1.12 (1.03 - 1.22) 1.10 (1.01 - 1.20)
V/F S-warfarin R-warfarin
1.10 (0.97 - 1.24) 1.06 (0.88 - 1.24)
1.04 (0.94 - 1.14) 1.03 (0.95 - 1.10)
ANOVA *p<0.05

Chapter 5 Effect of St John’s Wort and Ginseng on Warfarin 150
Figure 5-3. S-warfarin apparent clearance (CL/F) following single oral 25 mg
rac-warfarin dose with warfarin only (WF), warfarin + ginseng (WF + GS) and
warfarin + St John’s wort (WF + SJW).
0
100
200
300
400
0 1 2 3WF + SJW WF WF + GS
CL/
F (m
l/h)
Subject 1Subject 2Subject 3Subject 4Subject 5Subject 6Subject 7Subject 8Subject 9Subject 10Subject 11Subject 12
Figure 5-4. R-warfarin apparent clearance (CL/F) following single oral 25 mg
rac-warfarin dose with warfarin only (WF), warfarin + ginseng (WF + GS) and
warfarin + St John’s wort (WF + SJW).
0
50
100
150
200
250
0 1 2 3WF + SJW WF WF + GS
CL/
F (m
l/h)
Subject 1Subject 2Subject 3Subject 4Subject 5Subject 6Subject 7Subject 8Subject 9Subject 10Subject 11Subject 12
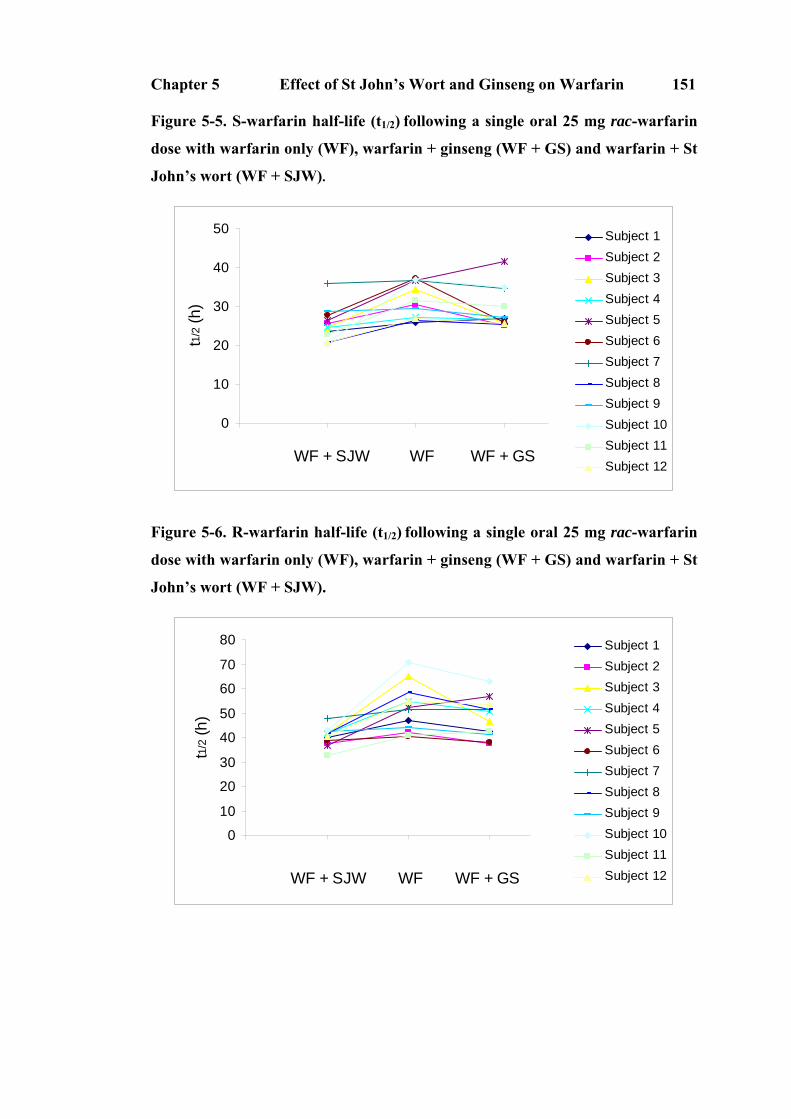
Chapter 5 Effect of St John’s Wort and Ginseng on Warfarin 151
Figure 5-5. S-warfarin half-life (t1/2) following a single oral 25 mg rac-warfarin
dose with warfarin only (WF), warfarin + ginseng (WF + GS) and warfarin + St
John’s wort (WF + SJW).
0
10
20
30
40
50
0 1 2 3WF + SJW WF WF + GS
t1/2 (
h)
Subject 1Subject 2Subject 3Subject 4Subject 5Subject 6Subject 7Subject 8Subject 9Subject 10Subject 11Subject 12
Figure 5-6. R-warfarin half-life (t1/2) following a single oral 25 mg rac-warfarin
dose with warfarin only (WF), warfarin + ginseng (WF + GS) and warfarin + St
John’s wort (WF + SJW).
0
10
20
30
40
50
60
70
80
0 1 2 3
WF + SJW WF WF + GS
t1/2 (
h)
Subject 1Subject 2Subject 3Subject 4Subject 5Subject 6Subject 7Subject 8Subject 9Subject 10Subject 11Subject 12

Chapter 5 Effect of St John’s Wort and Ginseng on Warfarin 152
Figure 5-7. S-warfarin apparent volume of distribution (V/F) following single
oral 25 mg rac-warfarin dose with warfarin only (WF), warfarin + ginseng (WF
+ GS) and warfarin + St John’s wort (WF + SJW).
0
40
80
120
160
200
240
0 1 2 3
WF + SJW WF WF + GS
V/F
(ml/k
g)
Subject 1Subject 2Subject 3Subject 4Subject 5Subject 6Subject 7Subject 8Subject 9Subject 10Subject 11Subject 12
Figure 5-8. R-warfarin apparent volume of distribution (V/F) following single
oral 25 mg rac-warfarin dose with warfarin only (WF), warfarin + ginseng (WF
+ GS) and warfarin + St John’s wort (WF + SJW).
0
40
80
120
160
0 1 2 3
WF + SJW WF WF + GS
V/F
(ml/k
g)
Subject 1Subject 2Subject 3Subject 4Subject 5Subject 6Subject 7Subject 8Subject 9Subject 10Subject 11Subject 12

Chapter 5 Effect of St John’s Wort and Ginseng on Warfarin 153
Figure 5-9. S-warfarin maximum plasma concentration (Cmax) following single
oral 25 mg rac-warfarin dose with warfarin only (WF), warfarin + ginseng (WF
+ GS) and warfarin + St John’s wort (WF + SJW).
0
1000
2000
3000
0 1 2 3WF + SJW WF WF + GS
Cm
ax (n
g/m
l)
Subject 1Subject 2Subject 3Subject 4Subject 5Subject 6Subject 7Subject 8Subject 9Subject 10Subject 11Subject 12
Figure 5-10. R-warfarin maximum plasma concentration (Cmax) following single
oral 25 mg rac-warfarin dose with warfarin only (WF), warfarin + ginseng (WF
+ GS) and warfarin + St John’s wort (WF + SJW).
0
1000
2000
3000
0 1 2 3WF + SJW WF WF + GS
Cm
ax (n
g/m
l)
Subject 1Subject 2Subject 3Subject 4Subject 5Subject 6Subject 7Subject 8Subject 9Subject 10Subject 11Subject 12

Chapter 5 Effect of St John’s Wort and Ginseng on Warfarin 154
Figure 5-11. The time at which S-warfarin Cmax occurs (tmax) following single
oral 25 mg rac-warfarin dose with warfarin only (WF), warfarin + ginseng (WF
+ GS) and warfarin + St John’s wort (WF + SJW).
0
1
2
3
0 1 2 3WF +SJW WF WF + GS
tmax
(h)
Subject 1Subject 2Subject 3Subject 4Subject 5Subject 6Subject 7Subject 8Subject 9Subject 10Subject 11Subject 12
Figure 5-12. The time at which R-warfarin Cmax occurs (tmax) following single
oral 25 mg rac-warfarin dose with warfarin only (WF), warfarin + ginseng (WF
+ GS) and warfarin + St John’s wort (WF + SJW).
0
1
2
3
0 1 2 3WF +SJW WF WF + GS
tmax
(h)
Subject 1Subject 2Subject 3Subject 4Subject 5Subject 6Subject 7Subject 8Subject 9Subject 10Subject 11Subject 12

Chapter 5 Effect of St John’s Wort and Ginseng on Warfarin 155
5.3.4 Urinary Excretion Rate (UER) of S-7-hydroxywarfarin
The urinary excretion rate of S-7-hydroxywarfarin after administration of warfarin
alone (0.04 ± 0.02 mg/h) was not significantly different following treatment with St
John’s wort (0.03 ± 0.02 mg/h), but was reduced by treatment with ginseng (0.03 ±
0.02 mg/h) (Figure 5-13) as assessed by the ratio of geometric mean and 90%
confidence intervals for the UER which was 0.82 (0.61-1.12) after pre-treatment with
St John’s wort and 0.68 (0.50-0.91) with ginseng.
Figure 5-13. Urinary excretion rate of S-7-hydroxywarfarin following a single
oral 25 mg rac-warfarin alone (WF), and in combination with either St John’s
wort (WF + SJW) or ginseng (WF + GS).
0.00
0.02
0.04
0.06
0.08
0 1 2 3
WF + SJW WF WF + GS
UE
R (m
g/h)
Subject 1Subject 2Subject 3Subject 4Subject 5Subject 6Subject 7Subject 8Subject 9Subject 10Subject 11Subject 12

Chapter 5 Effect of St John’s Wort and Ginseng on Warfarin 156
5.3.5 Plasma Protein Binding of Warfarin
The fraction unbound of S-warfarin and R-warfarin were 0.0034 ± 0.0011 and
0.0048 ± 0.0006, respectively, following administration of warfarin alone, and
0.0036 ± 0.0010 and 0.0047 ± 0.0009 for warfarin following pre-treatment with St
John’s wort, was 0.0039 ± 0.0016 and 0.0046 ± 0.0008 following pre-treatment with
ginseng, respectively. The protein binding of warfarin enantiomers did not change
over the duration of the sample collection interval (Figure 5-14, 15).
Figure 5-14. Fraction of unbound S-warfarin following administration of a
single oral 25 mg dose of rac-warfarin alone (WF), or in combination with either
St John’s wort (WF + SJW) or ginseng (WF + GS).
0
0.002
0.004
0.006
0.008
0 1 2 3WF + SJW WF WF + GS
Fra
ctio
n of
unb
ound
S
-war
farin
Subject 1Subject 2Subject 3Subject 4Subject 5Subject 6Subject 7Subject 8Subject 9Subject 10Subject 11Subject 12

Chapter 5 Effect of St John’s Wort and Ginseng on Warfarin 157
Figure 5-15. Fraction of unbound R-warfarin following administration of a
single oral 25 mg dose of rac-warfarin alone (WF), in combination with either St
John’s wort (WF + SJW) or ginseng (WF + GS).
0
0.002
0.004
0.006
0.008
0 1 2 3WF + SJW WF WF + GS
Frac
tion
of u
nbou
nd
R-w
arfa
rin
Subject 1Subject 2Subject 3Subject 4Subject 5Subject 6Subject 7Subject 8Subject 9Subject 10Subject 11Subject 12
5.3.6 Pharmacodynamic Endpoints
After administration of a single 25 mg dose of warfarin, the INR for each subject
increased to a peak at approximately 48 h after a delay of about 8-12 hours. INR
values returned to normal after approximately 144 hours (Figure 5-16 and Table 5-4).
The ratios of the AUC0-168 of INR and the 90% confidence intervals were 0.79 (0.70-
0.95) for treatment with St John’s wort, and 1.01 (0.88-1.16) for ginseng (Table 5-5).
There was a significant difference in warfarin pharmacodynamics between warfarin
alone and co-administration with St John’s wort. However, there was no significant
difference in warfarin pharmacodynamics when warfarin was ingested following pre-
treatment with ginseng. Neither St John’s wort nor ginseng alone affected baseline
INR or platelet aggregation (Table 5-5).

Chapter 5 Effect of St John’s Wort and Ginseng on Warfarin 158
Figure 5-16. INR versus time profiles following a single oral 25 mg rac-warfarin
dose with warfarin only (WF), warfarin + ginseng (GS) and warfarin + St
John’s wort (WF + SJW) (mean ± SD, n=12).
0
1
2
3
4
-48 0 48 96 144 192
Time (hour)
INR
Warfarin+GS
Warfarin only
Warfarin+SJW
Figure 5-17. AUC0-168 of INR following a single oral 25 mg rac-warfarin alone
(WF), in combination with either St John’s wort (WF + SJW) or ginseng (WF +
GS).
0
50
100
150
200
250
0 1 2 3WF + SJW WF WF + GS
AU
C 0-
168 o
f IN
R
Subject 1Subject 2Subject 3Subject 4Subject 5Subject 6Subject 7Subject 8Subject 9Subject 10Subject 11Subject 12

Chapter 5 Effect of St John’s Wort and Ginseng on Warfarin 159
Table 5-4. Warfarin pharmacodynamic parameters following a single oral dose
of 25 mg rac-warfarin alone (WF), and in combination with either St John’s
wort (WF + SJW) or ginseng (WF + GS). Data are presented as mean ± SD and
95% CI are shown in brackets (n=12). Individual subject data are presented in
Appendices 20-24.
Treatment WF alone WF + SJW WF + GS
INRbaseline*
1.14 ± 0.07
(1.08 - 1.20)
1.12 ± 0.06
(1.08 -1.20)
1.13 ± 0.05
(1.10 - 1.12)
AUC0-168 of INR
111.0 ± 49.3
(79.6 - 142.3)
88.3 ± 30.7
(68.8 - 107.8)
111.1 ± 43.1
(83.9 - 138.7)
tmax of INR (h) 45.5 ± 17.4
(34.5 – 56.6)
39.8 ± 12.7
(31.7 – 47.9)
41.2 ± 12.1
(33.6 – 48.9)
INRmax 2.4 ± 0.8
(2.0 – 2.9)
2.2 ± 0.5
(2.0 – 2.5)
2.6 ± 0.8
(2.1 – 3.1)
Baseline platelet
aggregation (Ω)
7.7 ± 2.2
(5.6 - 9.1)
7.5 ± 1.1
(6.5 - 8.2)
7.1 ± 1.4
(6.0 - 7.8)
*INRbaseline: the INR after either 14 days pre-treatment with SJW or 7 days pre-
treatment with ginseng prior to warfarin administration
Table 5-5. Mean ratios and 90% confidence intervals of the ratio of log-
transformed warfarin pharmacodynamic parameters (n=12) after treatment
with different herb medicines. (*p<0.05)
Treatment St John’s wort (90% CI) Ginseng (90% CI)
INR baseline 0.99 (0.96 - 1.01) 0.99 (0.97 - 1.02)
AUC0-168 of INR 0.79 (0.70 - 0.95)* 1.01 (0.88 - 1.16)
tmax of INR 0.89 (0.78 – 1.01) 0.93 (0.82 – 1.06)
INRmax 0.95 (0.84 – 1.08) 1.07 (0.94 – 1.22)
Baseline platelet aggregation
1.00 (0.88 - 1.14) 1.00 (0.85 - 1.06)

Chapter 5 Effect of St John’s Wort and Ginseng on Warfarin 160
5.3.7 Pharmacokinetic and Pharmacodynamic Modelling
The warfarin enantiomer concentration – time data and the effect data (expressed as
prothrombin complex activity, PCA) were best described by a one compartment
pharmacokinetic model and a sigmoid Emax pharmacodynamic model, respectively.
Mean data are presented in Figure 5-18 and individual fits to pharmacokinetic and
pharmacodynamic data are presented in Appendix 11. The model dependent
pharmacokinetic and pharmacodynamic parameters are presented in Table 5-6 and
Figure 5-18 to 5-21. Their ratios between different herbal pre-treatments are
presented in Table 5-7. It was not possible to obtain reliable model dependent
estimates of the concentration of R-warfarin required to produce a 50% inhibition
prothrombin complex activity (C50,R). These results confirm the significant difference
in t1/2 and CL/F for both S-warfarin and R-warfarin following pre-treatment with St
John’s wort. Furthermore, these data indicate no significant changes observed in the
pharmacodynamic parameters of S-warfarin in healthy male volunteers following
treatment with St John’s wort. Model dependent analyses confirm that ginseng did
not affect either the pharmacokinetics or pharmacodynamics of warfarin. The
pharmacokinetic parameters estimated based on the model-dependent methods and
the pharmacokinetic parameters generated using the model independent approach
(See Section 5.3.3) is in excellent agreement.

Chapter 5 Effect of St John’s Wort and Ginseng on Warfarin 161
Figure 5-18. Prothrombin complex activity (PCA)-time profiles following
administration of a single oral dose of 25 mg rac-warfarin either alone (WF),
warfarin + ginseng (WF + GS) or warfarin + St John’s wort (WF + SJW) (mean
± SD, n=12). Individual subject profiles are presented in Appendix 11.
0
20
40
60
80
100
120
-48 0 48 96 144 192
Time (hour)
PC
A%
Warfarin OnlyWarfarin + GSWarfarin + SJW
Figure 5-19. Model dependent estimates of the degradation rate constant of the
prothrombin complex (kd) following oral administration of a 25 mg rac-
warfarin dose as warfarin only (WF), warfarin + St John’s wort (WF + SJW)
and warfarin + ginseng (WF + GS).
0
0.04
0.08
0.12
0.16
0 1 2 3
WF + SJW WF WF + GS
kd (1
/h)
Subject 1Subject 2Subject 3Subject 4Subject 5Subject 6Subject 7Subject 8Subject 9Subject 10Subject 11Subject 12

Chapter 5 Effect of St John’s Wort and Ginseng on Warfarin 162
Figure 5-20. Model dependent estimates of concentration of S-warfarin required
to produce a 50% inhibition of PCA (C50,S) following oral administration of a 25
mg rac-warfarin dose as warfarin only (WF), warfarin + St John’s wort (WF +
SJW) and warfarin + ginseng (WF + GS).
0
400
800
1200
1600
2000
0 1 2 3WF + SJW WF WF + GS
C50
,S (n
g/m
l)
Subject 1Subject 2Subject 3Subject 4Subject 5Subject 6Subject 7Subject 8Subject 9Subject 10Subject 11Subject 12
Figure 5-21. Model dependent estimates of the steepness of the concentration-
response curve (γ) following oral administration of a 25 mg rac-warfarin dose as
warfarin only (WF), warfarin + St John’s wort (WF + SJW) and warfarin +
ginseng (WF + GS).
0
1
2
3
4
0 1 2 3WF + SJW WF WF + GS
Subject 1Subject 2Subject 3Subject 4Subject 5Subject 6Subject 7Subject 8Subject 9Subject 10Subject 11Subject 12
γ

Chapter 5 Effect of St John’s Wort and Ginseng on Warfarin 163
Table 5-6. Model dependent warfarin pharmacokinetic and pharmacodynamic
parameters following a single oral dose of 25 mg rac-warfarin alone (WF) or in
combination with either St John’s wort (WF + SJW) or ginseng (WF + GS)
(mean ± SD, 95% CI, n=12). Individual data are presented in Appendices 20-24.
Treatment WF alone WF + SJW WF + GS
kd (1/h) 0.06 ± 0.02 (0.04 – 0.07)
0.06 ± 0.02 (0.05 – 0.08)
0.07 ± 0.03 (0.05 – 0.09)
C50,S (ng/ml) 698 ± 477 (395 – 1000)
566 ± 371 (330 - 801)
622 ± 506 (300 – 943)
γS 1.8 ± 1.0 (1.2 – 2.4)
1.6 ± 0.8 (1.1 – 2.1)
1.5 ± 0.6 (1.1 – 1.9)
t1/2 (h) S-warfarin
R-warfarin
30.9 ± 4.0
(28.4 – 33.5) 49.9 ± 8.8
(44.3 – 55.5)
23.6 ± 4.4
(20.8 – 26.4) 38.8 ± 3.9
(36.3 – 41.3)
27.6 ± 3.9
(25.1 – 30.1) 46.6 ± 6.5
(42.5 – 50.7) CL/F (ml/h) S-warfarin
R-warfarin
202 ± 38
(178 – 226) 113 ± 25
(97 – 129)
283 ± 50
(251 – 315) 147 ± 31
(127 – 166)
223 ± 35
(201 – 245) 120 ± 19
(107 – 132) V/F (ml/kg) S-warfarin
R-warfarin
120 ± 30
(100 – 140) 110 ± 20
(100 – 120)
130 ± 30
(110 – 150) 110 ± 20
(100 – 120)
120 ± 30
(100 – 140) 110 ± 20
(100 – 120)

Chapter 5 Effect of St John’s Wort and Ginseng on Warfarin 164
Table 5-7. Mean ratios and 90% confidence intervals for selected log
transformed pharmacokinetic and pharmacodynamic parameters between herb
treatments compared to warfarin only (n=12).
Treatment
St John’s wort (90% CI) Ginseng (90% CI)
kd 1.11 (1.03 – 1.18) 1.23 (1.14 – 1.32)
C50,S 0.84 (0.78 – 0.90)
0.87 (0.81 – 0.94)
γS
0.96 (0.87– 1.05) 0.90 (0.82– 0.98)
t1/2 S-warfarin R-warfarin
0.76 (0.74 – 0.78)* 0.79 (0.76 – 0.81)*
0.89 (0.87 – 0.92) 0.94 (0.91 – 0.97)
CL/F S-warfarin R-warfarin
1.40 (1.34 – 1.47)* 1.31 (1.25 – 1.37)*
1.13 (1.08 – 1.15) 1.07 (1.02 – 1.12)
V/F S-warfarin R-warfarin
1.06 (1.00 – 1.12) 1.06 (0.97 – 1.06)
0.98 (0.93 – 1.04) 1.00 (0.95 – 1.04)
*ANOVA, p<0.05
5.3.8 Adverse Events
Twelve subjects completed the study and no significant adverse events or bleeding
episodes were observed during the study. Three subjects reported changes in sleeping
habits (waking up early in the morning) during St John’s wort treatment.

Chapter 5 Effect of St John’s Wort and Ginseng on Warfarin 165
5.4 Discussion
This study investigated the effect of two commonly ingested herbal medicines on the
pharmacokinetics and pharmacodynamics of warfarin and their independent effect on
INR and platelet aggregation using a standard study design widely used in
investigating warfarin–drug interactions. The major finding was that the co-
administration of St John’s wort at the Commission E recommended doses (1 tablet 3
times daily for 14 days) increased the apparent clearance of the warfarin enantiomers,
leading to a subsequent reduction in the plasma concentrations of warfarin
enantiomers and their pharmacodynamic effect.
In assessing potential herb-drug interactions, it is essential to use herbal medicines of
known quality to provide the best chance of being able to rigorously detect
significant effects. In this study, qualitative TLC and Pharmacopoeial methods were
used to characterise the constituents of proprietary preparations of St John’s wort and
ginseng prior to the study (See Chapter 4). As some variability in the composition of
different brands of commercial herbal medicines products of St John’s wort and
ginseng has been described, it was important to establish the quality of the herbal
medicines under investigation. There remains debate about which constituents of St
John’s wort and ginseng [8, 74, 148] might be involved in potential herb-drug
interactions, so the products employed in this study were not quantitatively assessed
for the specific content of individual constituents but for their overall content and
quality.

Chapter 5 Effect of St John’s Wort and Ginseng on Warfarin 166
In this study, warfarin, a racemic mixture, was administered and the
pharmacokinetics of the individual enantiomers was studied. It is known that S-
warfarin exhibits a significantly greater anticoagulant activity when compared to the
R-enantiomer when each enantiomer is administered separately [18]. Furthermore,
there are stereoselective differences in the pharmacokinetics of warfarin enantiomers.
S-warfarin has been reported to be two to five times more potent than R-warfarin in
terms of the anticoagulant effect [26]. However, R-warfarin may actually be less
potent than previously reported, as the source of R-warfarin used in the study to
investigate its potency contained a significant amount of S-warfarin (7.5%;[25]) [26].
Chan et al [18] reported that the anticoagulant effect observed after the
administration of racemic warfarin is almost entirely contributed by S-warfarin and
the observation was confirmed in the PKPD modelling analysis in the present study.
Elucidation of the pharmacokinetics of warfarin enantiomers thus allows greater
insight into the mechanism of possible pharmacokinetic interactions with this drug.
S-warfarin is metabolised to S-7-hydroxywarfarin by CYP2C9 [279] while R-
warfarin is partly metabolised by CYP1A2 and CYP3A4 [18]. The simultaneous
investigation of warfarin enantiomer pharmacokinetics thus provides insight into the
possible effects of St John’s wort and ginseng on these drug metabolism pathways.
In vitro studies have demonstrated that constituents of St John’s wort inhibit the
metabolic activity of CYP2C9, CYP2D6 and CYP3A4 [139, 140]. Paradoxically, St
John’s wort has also been reported to induce CYP1A2, CYP2E1 and CYP3A4 based
on in vivo studies [91, 106, 114, 124, 127, 138, 280, 281]. This effect has been
attributed to the activation of the human pregnane X receptor (PXR) by the St John’s

Chapter 5 Effect of St John’s Wort and Ginseng on Warfarin 167
wort constituent, hyperforin, which has been demonstrated both in vitro [282] and in
vivo [283]. The present study employed a regimen of 14-day pre-treatment with St
John’s wort which was based on the study by Wang et al [92] who reported that
following administration of St John’s wort to healthy volunteers for 14 days, there
was induction of CYP3A4 activity in the intestinal wall and liver. Interestingly,
Wang et al [92] found no alteration in the metabolic activities of CYP2C9, CYP1A2,
or CYP2D6. This conclusion was based on administration of a cocktail of substrates
for specific cytochromes (these included tolbutamide, CYP2C9; caffeine, CYP1A2;
dextromethorphan, CYP2D6; oral midazolam, intestinal wall and hepatic CYP3A;
and intravenous midazolam, hepatic CYP3A). The studies reported in this thesis
employed (at least) a 14-day washout period between treatment periods. As little is
known about the offset of the induction of drug metabolising enzymes by St John’s
wort, this period was based on the half-lives of warfarin enantiomers [18] and the St
John’s wort constituents, hypericin and hyperforin [74]. The analysis of variance in
this randomised three-period study demonstrated no period effect, suggesting the
inductive effect of St John’s wort on drug metabolising enzymes had dissipated in
the 14 days between treatments.
In the present study, treatment with St John’s wort significantly induced not only
CYP1A2 and/or CYP3A4 as evidenced by the effects on R-warfarin, but also
CYP2C9 as determined by the effects on the pharmacokinetics of the S-enantiomer.
The induction of CYP2C9 reported in this thesis was in contrast to the observations
of Wang et al [92] but confirms the suggestions raised by Henderson et al [8] in their
review of St John’s wort drug interactions and an in vitro study [67] that

Chapter 5 Effect of St John’s Wort and Ginseng on Warfarin 168
demonstrated the human pregnane X receptor (hPXR) mediates induction of
CYP2C9 by hyperforin (found in St. John's wort). Surprisingly, St John’s wort did
not significantly affect the UER of S-7-hydroxywarfarin (the main metabolite of S-
warfarin) while it induced the clearance of S-warfarin. An increase in the UER
would be expected due to induction of CYP2C9 by St John’s wort. The mechanism
of this effect is not clear and needs further study. Missed urine sample collection that
was reported by a few volunteers during 24 hours urine collections, could have
contributed to this observation and represents a disadvantage for using urine samples
to investigate metabolite pharmacokinetics.
A few ginseng-drug interactions have been reported in the literature. In a case report,
a 47-year-old man had received anticoagulation therapy with warfarin since 1990 to
prevent embolic events. The dosage of warfarin and INR had been stabilised for the
past nine months. The patient’s INR was 3.1 four weeks before he started taking
ginseng. Two weeks after the patient started taking ginseng, his INR declined to 1.5.
Ginseng was discontinued, and the INR returned to 3.3 in two weeks [167]. However,
no significant effect on drug metabolism was found in a clinical trial in humans
wherein the activities of various cytochrome P450 isoenzymes were assessed using
the phenotypic ratios of probe-drugs that included midazolam (CYP3A4), caffeine
(CYP1A2), chlorzoxazone (CYP2E1) and debrisoquin (CYP2D6) [91]. Furthermore.
A warfarin–ginseng interaction study in male Sprague-Dawley rats using both single
(2 mg/kg) and multiples doses of warfarin (0.2 mg/kg daily x 6 days) found no
significant effect of Panax ginseng on warfarin pharmacokinetics [168]. The authors
also found the content of vitamin K was undetectable in the ginseng decoction [168].

Chapter 5 Effect of St John’s Wort and Ginseng on Warfarin 169
Consistent with these latter reports, the present study confirmed that ginseng did not
affect the pharmacokinetics or the pharmacodynamics of warfarin in human subjects.
From these studies it is possible to confirm that Panax ginseng had no effect on the
activity of CYP1A2, CYP3A4 or CYP2C9 in the healthy volunteers pre-treated with
this herb.
Since approximately 99% of the warfarin in plasma is bound to plasma proteins,
another possible drug interaction mechanism that may alter the hepatic clearance of
warfarin enantiomers could be the effect of St John’s wort or ginseng constituents on
the protein binding of warfarin. No in vitro or in vivo studies were found in the
literature regarding the ability of St John’s wort or ginseng constituents to affect
protein binding of warfarin. In this study, treatment with St John’s wort and ginseng
did not influence warfarin enantiomer protein binding or the distribution in the
present study. It suggests that increased clearances of warfarin enantiomers are due
to induction of CYP 2C9, CYP 3A4 and/or CYP1A2 by pre-treatment with St John’s
wort.
Several in vitro studies have demonstrated that constituents of ginseng may inhibit
thrombin, collagen or arachidonic acid induced platelet aggregation using human
platelet rich plasma [157, 159, 161]. Yun et al [161] evaluated the antithrombotic
effects of Korean red ginseng using platelet aggregation and coagulation assays. In
the platelet aggregation assay using human platelet rich plasma (PRP), extracts of
Korean red ginseng were found to significantly inhibit thrombin and collagen-
induced platelet aggregation. The IC50 values of Korean red ginseng were >2 mg/ml
Chapter 5 Effect of St John’s Wort and Ginseng on Warfarin 170
for thrombin, 0.32 ± 0.01 mg/ml for collagen and 0.72 ± 0.25 mg/ml for ADP. In the
coagulation assay, Korean red ginseng was found to significantly prolong APPT and
PT as compared with control data. Park et al [159] studied the effect of dietary
supplementation with 25 mg (0.0025% of the total diet) of a lipophilic fraction from
Panax ginseng on rat platelet aggregation induced by collagen (100 µg/ml) or
thrombin (0.1 units/ml), and on blood coagulation. The cGMP levels in collagen-
stimulated platelets from rats fed 15% corn oil plus the lipophilic fraction of ginseng
were significantly increased compared to rats only fed 15% corn oil. The levels of
cAMP in thrombin-stimulated platelets in the ginseng fraction treated rats were
decreased but were increased in collagen-stimulated platelets. Furthermore, the levels
of both cGMP and cAMP were also increased by addition of the lipophilic fraction of
ginseng to thrombin- and collagen-stimulated platelets in vitro. Both the prothrombin
time and activated partial thromboplastin time were prolonged in citrated platelet-
poor plasma in lipophilic fraction of ginseng group compared to corn oil only treated
group. Teng et al [157] reported that panaxynol (0.1 mg/ml) isolated from the diethyl
ether layer of Panax ginseng inhibited markedly the aggregation of washed platelets
induced by collagen, arachidonic acid, ADP, PAF and thrombin while ginsenosides
had no significant effect on the aggregation, however, ginsenoside Ro (1 mg/ml)
inhibited the ATP release of platelets using human blood in in vitro study.
Contrary to these reports, pre-treatment with ginseng in healthy male subject did not
significantly affect the baseline INR and platelet aggregation in the present study.
This discrepancy between in vitro and in vivo effects could be related to metabolic
biotransformation or poor bioavailability of ginseng constituents after oral dosing as

Chapter 5 Effect of St John’s Wort and Ginseng on Warfarin 171
suggested by several bioavailability studies [163, 284]. Cui et al [162] determined
that about 1.2% of the oral dose of protopanaxatriol ginsenosides (3 mg) and smaller
amounts of the protopanaxadiol ginsenosides not exceeding 0.2% of the administered
dose (7 mg) were recovered in five days in human urine after a single dose of
ginseng. However, Shibata et al [163] reported that neither the individual
ginsenosides nor their metabolites could be identified except compound-K which is
the main intestinal bacterial metabolite of protopanaxadiol ginsenosides was
identified in human serum using a specific enzyme immunoassay 8 h after oral
administration of ginseng. Panax notoginseng is different with Panax ginseng but it
contains ginsenoside Rb1 and Rg1 as well. Xu et al [164] found very low
bioavailability of ginsenoside Rb1 ( 4.35%) and ginsenoside Rg1 (18.40%) after
Panax notoginseng was administrated to rats. Serum samples were measured using
an established HPLC method to quantitate ginsenoside Rb1 and Rg1.
In this study a combined PK/PD model was employed to characterise the warfarin
concentration effect data obtained in the three phases of this clinical trial. This
approach allows an assessment of the effect of these herbs on warfarin
pharmacodynamic parameters. No lag time was found for drug absorption in the
present study, but a characteristic of the pharmacological response of warfarin is the
delay in the onset of action after oral administration of the drug [18]. In the
combined PK/PD model this delay is represented by the parameter td. In the present
study, it was not possible to estimate lag time of onset of anticoagulant (td) directly
so it was fixed to the value of 8.0 h. Chan et al [18], who proposed the modelling
approach used in this study, found that td ranged from 8.0 to 8.8 in their study of six

Chapter 5 Effect of St John’s Wort and Ginseng on Warfarin 172
volunteers. The modelling approach could not provide reliable estimates of C50R and
γR probably because the anticoagulant effect of racemic warfarin is predominately
determined by S-warfarin [26]. Co-administration with St John’s wort or ginseng did
not affect the protein binding of warfarin enantiomers so C50,S was reported rather
than Cu50,S. No significant difference was found in estimates of the
pharmacodynamic parameters kd, C50,S and γS obtained from data collected with and
without pre-treatment with herbal medicines. The estimates of kd, C50S and γS from
the present study are in close agreement with previously reported data [18].
In summary, this study found that St John’s wort when administered to healthy male
subjects in a single ingredient herbal product at recommended doses induced the
metabolism of both S-warfarin and R-warfarin with a subsequent effect on INR. In
another word, the PD relationship was not intrinsically altered by St John’s wort. By
contrast, Panax ginseng at recommended doses had no significant effect on warfarin
metabolism or its pharmacological effect in healthy subjects. These findings suggest
that there is a potential for significant herb-drug interactions with St John’s wort for
drugs that are the substrates for CYP2C9 and CYP3A4 and/or CYP1A2.

Chapter 6 Effect of Ginkgo and Ginger on Warfarin 173
Chapter 6 Effect of Ginkgo and Ginger on the
Pharmacokinetics and Pharmacodynamics of
Warfarin in Healthy Subjects
6.1 Introduction
The anticoagulant warfarin has a narrow therapeutic index and displays high inter-
and intra-subject variability in pharmacokinetics and pharmacodynamics. In the
community, there is also widespread, often unreported, self-medication with a range
of herbal medicines. The opportunity for potential life-threatening interactions
between herbal medications and warfarin is therefore high [2]. Ginkgo (Ginkgo
biloba) is one such herbal medicine. It is commonly used as EGb 761, a ginkgo
extract, for promoting and maintaining mental alertness, concentration, focus and a
wide range of other indications [173, 285]. In a review article published in the
Cochrane Database, Birks et al [285] reviewed the effect of ginkgo on cognitive
impairment and dementia in the literature. It is reported that cognition, activities of
daily living, measures of mood and emotional function show benefit for ginkgo at
doses less than 200 mg/day compared with placebo at less than 12 weeks.
Despite the utility of this herb and its extracts, relatively little is known about the
potential for or clinical significance of ginkgo-drug interactions. A recent review
article [2] identified one case report of an interaction between ginkgo and warfarin
and four case reports of spontaneous bleeding associated with ginkgo use attributed

Chapter 6 Effect of Ginkgo and Ginger on Warfarin 174
to possible effects of this herb on platelet function. In vitro studies indicate that
constituents of Ginkgo biloba (ginkgolic acids I and II) inhibit drug metabolising
enzymes including CYP1A2, CYP2C9, CYP2C19, CYP2D6 and CYP3A4 [137]. In
contrast, the feeding of ginkgo extracts to rats for 4 weeks reportedly reduced the
hypotensive effect of nicardipine (which is metabolised by CYP3A2) and induced
the expression of hepatic CYP2B1/2, CYP3A1 and CYP3A2 mRNA [196]. In vitro,
animal and in vivo clinical studies have investigated the effect of ginkgo extracts on
platelet aggregation and coagulation, but the results have been conflicting [183, 187-
189].
Ginger (Zingiber officinale) is also widely used in the community for the prevention
of motion sickness and a variety of other indications [200]. However few drug
interaction studies using ginger have been undertaken. Several in vitro studies
demonstrated that platelet aggregation was inhibited by ginger extracts [201-204,
286]. Furthermore, when patients received a single dose (10 g) of powdered ginger,
platelet aggregation was found to be reduced [206]. These data suggest that a
pharmacodynamic interaction with warfarin is possible.
The aim of the present study was to investigate the possible drug interactions
between warfarin and these two widely used herbal medicines at recommended doses
from herbal medicine products of known quality. The independent effects of ginger
and ginkgo on clotting status also were investigated.

Chapter 6 Effect of Ginkgo and Ginger on Warfarin 175
6.2 Materials and Methods
The materials and methods for this chapter have been presented in Chapter 2.
6.3 Results
6.3.1 Subject
Twelve healthy male subjects were recruited and completed this study in three
treatment groups. Subjects were aged 22 to 31 years and within 15% of ideal body
weight for height and build. Subjects came from 2 main ethnic groups (6 Caucasians,
6 Asians) (Table 6-1). All subjects were non-smokers and met the inclusion criteria
as outlined in Section 2.1.2.
6.3.2 Results of Statistical Analysis
ANOVA was performed on the log-transformed parameters including AUC0-∞ and
Cmax of S-warfarin and R-warfarin and AUC 0-168 of INR. Both sequence and period
effects were found to be significant in the analysis but treatment was not. The
statistical results of AUC0-∞ of S-warfarin, R-warfarin and AUC0-168 of INR are
shown in Appendix 6 - 10. The reason for the sequence and period effects was
unclear. Despite this, the results are acceptable based on in vivo bioequivalence
guidance [287] because this was a single-dose study, which includes only healthy
male subjects. Furthermore, an adequate washout period was used and no detectable
warfarin concentration was measured prior to warfarin dose administration in each
period.

Chapter 6 Effect of Ginkgo and Ginger on Warfarin 176
6.3.3 Pharmacokinetics of S-warfarin and R-warfarin
There were no significant changes observed in the pharmacokinetic parameters of S-
or R-warfarin in healthy male volunteers following treatment with ginkgo or ginger
(Table 6-2 and 6-3; Figure 6-1 to 6-12).
Table 6-1. Subject demographic data (n=12).
Subject Age (years) Weight (kg) Height (cm) Ethnicity
1 28 52.2 172.5 Asian
2 22 79.4 183.8 Caucasian
3 23 75.8 175.8 Asian
4 22 70.4 168.2 Asian
5 27 72.4 174.5 Asian
6 25 78 180.5 Caucasian
7 22 101 199.7 Caucasian
8 23 71.6 187.5 Caucasian
9 30 74.4 163 Asian
10 26 72.6 178 Caucasian
11 31 99.2 173 Asian
12 28 73.8 183 Caucasian
Mean ± SD 25.6 ± 3.2 76.7 ± 12.9 178.3 ± 9.6

Chapter 6 Effect of Ginkgo and Ginger on Warfarin 177
Figure 6-1. S-warfarin concentration-time profiles following administration of a
single 25 mg oral dose of rac-warfarin either alone (warfarin only), or warfarin
and ginkgo (WF + Ginkgo), or warfarin and ginger (WF + Ginger). Data are
presented as mean (± SD, n=12) with semi-log (A) and linear (B) plots.
Individual subject profiles are presented in Appendix 12.
A:
1
10
100
1000
10000
0 48 96 144 192
Time (hour)
S-w
arfa
rin C
onc.
(ng/
ml)
Warfarin onlyWarfarin + ginkgo
Warfarin + ginger
B:
0
500
1000
1500
2000
2500
0 48 96 144 192
Time (hour)
S-w
arfa
rin C
onc.
(ng/
ml)
Warfarin onlyWarfarin + ginkgo
Warfarin + ginger

Chapter 6 Effect of Ginkgo and Ginger on Warfarin 178
Figure 6-2. R-warfarin concentration-time profiles following administration of a
single 25 mg oral dose of rac-warfarin either alone (warfarin only), or warfarin
and ginkgo (WF + Ginkgo), or warfarin and ginger (WF + Ginger). Data are
presented as mean (± SD, n=12) with semi-log (A) and linear (B) plots.
Individual subject profiles are presented in Appendix 12.
A:
1
10
100
1000
10000
0 48 96 144 192
Time (hour)
R-w
arfa
rin C
onc.
(ng/
ml)
Warfarin onlyWarfarin + ginkgo
Warfarin + ginger
B:
0
500
1000
1500
2000
2500
0 48 96 144 192
Time (hour)
R-w
arfa
rin C
onc.
(ng/
ml)
Warfarin onlyWarfarin + ginkgo
Warfarin + ginger

Chapter 6 Effect of Ginkgo and Ginger on Warfarin 179
Table 6-2. Warfarin pharmacokinetic parameters following administration of a
single oral dose of 25 mg rac-warfarin only (WF), or after pre-treatment with
ginkgo (WF + ginkgo) or warfarin + ginger (WF + ginger) (mean ± SD, 95% CI,
n=12). Individual subject data are presented in Appendices 25-31.
Treatment Warfarin only Warfarin + ginkgo
Warfarin + ginger
fu S-warfarin
R-warfarin
0.0052 ± 0.0013
(0.0044 – 0.0060) 0.0048 ± 0.0011
(0.0041 – 0.0054)
0.0049 ± 0.0012
(0.0042 – 0.0057) 0.0047 ± 0.0009
(0.0041 – 0.0052)
0.0052 ± 0.0010
(0.0045 – 0.0058) 0.0048 ± 0.0084
(0.0043 – 0.0054) AUC0-∞ (ng/ml×h)
S-warfarin
R-warfarin
68000 ± 11400
(60800 – 75300) 104000 ± 24700
(88400 – 120000)
65800 ± 16800
(55100 – 76500) 102200 ± 18000
(90800 – 113600)
66000 ± 1900
(54000 – 78100) 102600 ± 25500
(86400 – 118800)
tmax (h) S-warfarin
R-warfarin
2.1 ± 1.1
(1.4 – 2.8) 2.1 ± 1.1
(1.4 – 2.8)
1.4 ± 0.8
(0.9 – 1.9) 1.6 ± 1.7
(0.6 – 2.7)
1.6 ± 0.8
(1.1 – 2.1) 1.6 ± 0.8
(1.1 – 2.1) Cmax (ng/ml) S-warfarin
R-warfarin
1700 ± 500
(1400 – 2000) 1700 ± 500
(1400 – 2000)
1800 ± 400
(1500 – 2000) 1800 ± 400
(1500 – 2000)
1700 ± 400
(1500 – 2000) 1700 ± 400
(1500 – 1900) t1/2 (h)
S-warfarin
R-warfarin
35.8 ± 7.2
(31.1 – 40.3) 50.3 ± 7.1
(45.8 – 54.9)
35.1 ± 6.7
(30.9 – 39.3) 48.6 ± 6.1
(44.7 – 52.4)
35.7 ± 8.9
(30.0 – 41.3) 47.7 ± 8.0
(42.6 – 52.8) CL/F (ml/h) S-warfarin
R-warfarin
189 ± 34
(167 – 210) 127 ± 34
(106 – 149)
200 ± 43
(173 – 227) 126 ± 24
(111 – 141)
201 ± 47
(171 – 231) 131 ± 39
(106 – 156) V/F (ml/kg) S-warfarin
R-warfarin
120 ± 20
(110 – 140) 120 ± 20
(100 – 130)
120 ± 10
(110 – 130) 110 ± 10
(100 – 120)
120 ± 20
(110 – 130) 110 ± 20
(100 – 120)

Chapter 6 Effect of Ginkgo and Ginger on Warfarin 180
Table 6-3. Mean ratios and 90% confidence intervals for log transformed S-
warfarin and R-warfarin pharmacokinetic parameters comparing each herb
treatment to the warfarin only arm as control (n=12).
Treatment Ginkgo Ginger
fu S-warfarin R-warfarin
0.98 (0.90 – 1.02) 0.99 (0.95 – 1.05)
1.02 (0.89 – 1.15) 1.03 (0.97 – 1.09)
AUC0-∞ S-warfarin R-warfarin
0.97 (0.89 – 1.03) 1.10 (0.92 – 1.07)
0.95 (0.89 – 1.03) 0.98 (0.91 – 1.06)
tmax S-warfarin R-warfarin
0.68 (0.63 – 0.73) 0.72 (0.67 – 0.77)
0.79 (0.73 – 0.85) 0.79 (0.73 – 0.85)
Cmax S-warfarin R-warfarin
1.04 (0.97 – 1.09) 1.03 (0.97 – 1.10)
1.01 (0.94 – 1.07) 1.02 (0.95 – 1.07)
t1/2 S-warfarin R-warfarin
0.98 (0.93 – 1.04) 0.97 (0.92 – 1.02)
0.99 (0.94 – 1.04) 0.94 (0.90 – 1.01)
CL/F S-warfarin R-warfarin
1.05 (0.98 – 1.12) 1.00 (0.93 – 1.08)
1.05 (0.97 – 1.13) 1.02 (0.95 – 1.10)
V/F S-warfarin R-warfarin
1.03 (0.99 – 1.07) 0.95 (0.95 – 1.01)
1.03 (0.99 – 1.08) 0.97 (0.93 – 1.00)

Chapter 6 Effect of Ginkgo and Ginger on Warfarin 181
Figure 6-3. S-warfarin apparent clearance (CL/F) following a single oral 25 mg
rac-warfarin dose with warfarin only (WF), warfarin + ginkgo (WF + Ginkgo)
and warfarin + ginger (WF + Ginger).
0
100
200
300
0 1 2 3WF + Ginkgo WF WF + Ginger
CL/
F (m
l/h)
Subject 1Subject 2Subject 3Subject 4Subject 5Subject 6Subject 7Subject 8Subject 9Subject 10Subject 11Subject 12
Figure 6-4. R-warfarin apparent clearance (CL/F) following a single oral 25 mg
rac-warfarin dose with warfarin only (WF), warfarin + ginkgo (WF + Ginkgo)
and warfarin + ginger (WF + Ginger).
0
100
200
300
0 1 2 3WF + Ginkgo WF WF + Ginger
CL/
F (m
l/h)
Subject 1Subject 2Subject 3Subject 4Subject 5Subject 6Subject 7Subject 8Subject 9Subject 10Subject 11Subject 12

Chapter 6 Effect of Ginkgo and Ginger on Warfarin 182
Figure 6-5. S-warfarin half-life (t1/2) following a single oral 25 mg rac-warfarin
dose with warfarin only (WF), warfarin + ginkgo (WF + Ginkgo) and warfarin
+ ginger (WF + Ginger).
0
10
20
30
40
50
60
0 1 2 3WF + Ginkgo WF WF + Ginger
t1/2 (
h)Subject 1Subject 2Subject 3Subject 4Subject 5Subject 6Subject 7Subject 8Subject 9Subject 10Subject 11Subject 12
Figure 6-6. R-warfarin half-life (t1/2) following a single oral 25 mg rac-warfarin
dose with warfarin only (WF), warfarin + ginkgo (WF + Ginkgo) and warfarin
+ ginger (WF + Ginger).
0
10
20
30
40
50
60
70
0 1 2 3
WF + Ginkgo WF WF + Ginger
t1/2 (
h)
Subject 1Subject 2Subject 3Subject 4Subject 5Subject 6Subject 7Subject 8Subject 9Subject 10Subject 11Subject 12

Chapter 6 Effect of Ginkgo and Ginger on Warfarin 183
Figure 6-7. S-warfarin apparent volume of distribution (V/F) following a single
oral 25 mg rac-warfarin dose with warfarin only (WF), warfarin + ginkgo (WF
+ Ginkgo) and warfarin + ginger (WF + Ginger).
0
40
80
120
160
200
0 1 2 3WF + Ginkgo WF WF + Ginger
V/F
(ml/k
g)Subject 1Subject 2Subject 3Subject 4Subject 5Subject 6Subject 7Subject 8Subject 9Subject 10Subject 11Subject 12
Figure 6-8. R-warfarin apparent volume of distribution (V/F) following a single
oral 25 mg rac-warfarin dose with warfarin only (WF), warfarin + ginkgo (WF
+ Ginkgo) and warfarin + ginger (WF + Ginger).
0
40
80
120
160
200
0 1 2 3WF + Ginkgo WF WF + Ginger
V/F
(ml/k
g)
Subject 1Subject 2Subject 3Subject 4Subject 5Subject 6Subject 7Subject 8Subject 9Subject 10Subject 11Subject 12

Chapter 6 Effect of Ginkgo and Ginger on Warfarin 184
Figure 6-9. S-warfarin maximum plasma concentration (Cmax) following a single
oral 25 mg rac-warfarin dose with warfarin only (WF), warfarin + ginkgo (WF
+ Ginkgo) and warfarin + ginger (WF + Ginger).
0
1000
2000
3000
0 1 2 3WF + Ginkgo WF WF + Ginger
Cm
ax (n
g/m
l)
Subject 1Subject 2Subject 3Subject 4Subject 5Subject 6Subject 7Subject 8Subject 9Subject 10Subject 11Subject 12
Figure 6-10. R-warfarin maximum plasma concentration (Cmax) following a
single oral 25 mg rac-warfarin dose with warfarin only (WF), warfarin + ginkgo
(WF + Ginkgo) and warfarin + ginger (WF + Ginger).
0
1000
2000
3000
0 1 2 3WF + Ginkgo WF WF + Ginger
Cm
ax (n
g/m
l)
Subject 1Subject 2Subject 3Subject 4Subject 5Subject 6Subject 7Subject 8Subject 9Subject 10Subject 11Subject 12

Chapter 6 Effect of Ginkgo and Ginger on Warfarin 185
Figure 6-11. The time at which S-warfarin Cmax occurs (tmax) following a single
oral 25 mg rac-warfarin dose with warfarin only (WF), warfarin + ginkgo (WF
+ Ginkgo) and warfarin + ginger (WF + Ginger).
0
1
2
3
4
5
0 1 2 3
WF + Ginkgo WF WF + Ginger
tmax
(h)
Subject 1Subject 2Subject 3Subject 4Subject 5Subject 6Subject 7Subject 8Subject 9Subject 10Subject 11Subject 12
Figure 6-12. The time at which R-warfarin Cmax occurs (tmax) following a single
oral 25 mg rac-warfarin dose with warfarin only (WF), warfarin + ginkgo (WF
+ Ginkgo) and warfarin + ginger (WF + Ginger).
0
2
4
6
8
0 1 2 3WF + Ginkgo WF WF + Ginger
tmax
(h)
Subject 1Subject 2Subject 3Subject 4Subject 5Subject 6Subject 7Subject 8Subject 9Subject 10Subject 11Subject 12

Chapter 6 Effect of Ginkgo and Ginger on Warfarin 186
6.3.4 Urinary Excretion Rate (UER) of S-7-hydroxywarfarin
UER of S-7-hydroxywarfarin after administration of warfarin alone was 0.04 ± 0.01
mg/h and there was no significant difference following treatment with either ginkgo
(0.04 ± 0.01 mg/h) or ginger (0.03 ± 0.01 mg/h) (Figure 6-13). The ratio of
geometric means (and 90% CI) for S-7-hydroxywarfarin UER was 1.07 (0.69-1.67)
for ginkgo, and 1.00 (0.64-1.56) for ginger. These CIs of ratios were outside the
predefined limit of 0.80 to 1.25 suggesting that a lack of difference cannot be
concluded but appears unlikely based on the present data.
Figure 6-13. Urinary excretion rate of S-7-hydroxywarfarin following a single
oral 25 mg rac-warfarin alone (WF), in combination with either ginkgo (WF +
Ginkgo) or ginseng (WF + Ginger).
0.00
0.02
0.04
0.06
0.08
0 1 2 3
WF + Ginkgo WF WF + Ginger
UE
R (m
g/h)
Subject 1Subject 2Subject 3Subject 4Subject 5Subject 6Subject 7Subject 8Subject 9Subject 10Subject 11Subject 12

Chapter 6 Effect of Ginkgo and Ginger on Warfarin 187
6.3.5 Plasma Protein Binding of Warfarin Enantiomers
The fraction of unbound S-warfarin and R-warfarin in plasma were 0.0052 ± 0.0013
and 0.0048 ± 0.0011, respectively, following administration of warfarin alone, and
0.0049 ± 0.0012 and 0.0047 ± 0.0008 for warfarin following administration with
ginkgo. Similarly, following treatment with ginger, the fraction of unbound S-
warfarin and R-warfarin in plasma were 0.0052 ± 0.0010 and 0.0048 ± 0.0008,
respectively (Figure 6-14 and Figure 6-15). These differences were not significant.
Furthermore, protein binding did not change over the time course of the study.
Figure 6-14. Fraction of unbound S-warfarin in plasma following
administration of a single oral 25 mg dose of rac-warfarin alone (WF), in
combination with either ginkgo (WF + Ginkgo) or ginger (WF + Ginger).
0
0.002
0.004
0.006
0.008
0.01
0 1 2 3WF + Ginkgo WF WF + Ginger
Frac
tion
of u
nbou
nd
S-w
araf
rin
Subject 1Subject 2Subject 3Subject 4Subject 5Subject 6Subject 7Subject 8Subject 9Subject 10Subject 11Subject 12

Chapter 6 Effect of Ginkgo and Ginger on Warfarin 188
Figure 6-15. Fraction of unbound R-warfarin following administration of a
single oral 25 mg dose of rac-warfarin alone (WF), in combination with either
ginkgo (WF + Ginkgo) or ginger (WF + Ginger).
0
0.002
0.004
0.006
0.008
0.01
0 1 2 3WF + Ginkgo WF WF + Ginger
Frac
tion
of u
nbou
nd
R-w
arfa
rin
Subject 1Subject 2Subject 3Subject 4Subject 5Subject 6Subject 7Subject 8Subject 9Subject 10Subject 11Subject 12
6.3.6 Pharmacodynamics
The mean ratios of the AUC0-168 of INR (and 90% CI) were 0.93 (0.64-1.34)
following treatment with ginkgo and 1.03 (0.72-1.49) for ginger (Table 6-4 and
Table 6-5). While these confidence intervals included 1.0 suggesting no significant
difference, the interval boundaries were not included in the 0.80 to 1.25 predefined
limits. While a change in warfarin pharmacodynamics after ginkgo or ginger pre-
treatment is unlikely, this cannot be concluded based on the present data. However,
neither ginkgo nor ginger alone affected the baseline INR or platelet aggregation in
response to arachidonic acid (Table 6-4, Table 6-5; Figure 6-16 and Figure 6-17).

Chapter 6 Effect of Ginkgo and Ginger on Warfarin 189
Figure 6-16. INR-time profiles following a single oral 25 mg rac-warfarin dose
with warfarin only, warfarin + ginkgo and warfarin + ginger (mean ± SD, n=12,
warfarin dose administered on time 0).
0
1
2
3
4
-48 0 48 96 144 192Time (hour)
INR
Warfarin only
Warfarin + ginkgo
Warafrin + ginger
Figure 6-17. AUC0-168 of INR following a single oral 25 mg rac-warfarin dose
with warfarin only (WF), warfarin + ginkgo (WF + Ginkgo) and warfarin +
ginger (WF + Ginger).
0
100
200
300
400
0 1 2 3WF + Ginkgo WF WF + Ginger
AU
C 0-
168
of IN
R
Subject 1Subject 2Subject 3Subject 4Subject 5Subject 6Subject 7Subject 8Subject 9Subject 10Subject 11Subject 12

Chapter 6 Effect of Ginkgo and Ginger on Warfarin 190
Table 6-4. Warfarin pharmacodynamic parameters following a single oral dose
of 25 mg rac-warfarin alone (WF), in combination with either ginkgo (WF +
ginkgo) or ginger (WF + ginger). Data are presented as mean ± SD and 95% CI
are shown in brackets (n=12). Individual subject data are presented in
Appendices 32-36.
Treatment Warfarin alone WF + ginkgo WF + ginger
INRbaseline* 1.12 ± 0.08
(1.10 – 1.17)
1.14 ± 0.07
(1.10 – 1.18)
1.12 ± 0.07
(1.10 – 1.16)
tmax of INR (h) 45.7 ± 8.6
(40.2 – 51.1)
45.7 ± 16.6
(35 – 56.3)
43.3 ± 10.7
(36.6 – 50.1)
INRmax 2.6 ± 0.6
(2.2 – 2.9)
2.5 ± 0.8
(2.0 – 3.0)
2.6 ± 0.6
(2.3 – 3.0)
AUC0-168 of INR 124 ± 54
(90 – 158)
121 ± 69
(77 – 165)
125 ± 55
(91 – 160)
Baseline platelet
aggregation (Ω)
7.5 ± 1.5
(6.5 – 8.4)
8.4 ± 1.3
(7.6 – 9.2)
8.1 ± 0.9
(7.5 – 8.7)
* INRbaseline: the INR after 7 days pre-treatment with ginkgo or ginger prior to
warfarin administration
Table 6-5. Mean ratios and 90% confidence intervals of the ratio of log-
transformed warfarin pharmacodynamic parameters (n=12) after treatment
with different herb medicines.
Treatment Ginkgo (90% CI) Ginger (90% CI)
INRbaseline 1.03 (1.00 – 1.05)
1.10 (0.98 – 1.02)
tmax of INR 0.96 (0.84 – 1.09)
0.94 (0.82 – 1.06)
INRmax 0.97 (0.85 – 1.09) 1.03 (0.91 – 1.17)
AUC0-168 of INR 0.93 (0.81 – 1.05) 1.01 (0.93 – 1.15)
Baseline platelet aggregation (Ω)
1.14 (1.08 – 1.20) 1.11 (1.04 – 1.16)

Chapter 6 Effect of Ginkgo and Ginger on Warfarin 191
6.3.7 Pharmacokinetic and Pharmacodynamic Modelling
As demonstrated in Chapter 5 the warfarin enantiomer concentration and effect-time
data were best described by a one compartment pharmacokinetic model and the
sigmoid Emax pharmacodynamic model. The results of the pharmacokinetic
modelling confirmed that there were no significant changes observed in the
pharmacokinetic parameters of S- or R-warfarin following treatment with ginkgo or
ginger. The findings of the PKPD modelling confirmed the suggestion [18] that the
anticoagulant effect of rac-warfarin is predominantly contributed by S-warfarin and
the pharmacokinetic and pharmacodynamic modelling does not have the ability to
reliably estimate C50,R and γR. Interestingly, the pharmacodynamic aspect of the
modelling approach found that there was a significant difference in the degradation
(or elimination) rate constant of the prothrombin complex (kd) following a pre-
treatment with ginger (Table 6-6, 6-7; Figure 6-18 to 6-21).

Chapter 6 Effect of Ginkgo and Ginger on Warfarin 192
Figure 6-18. Prothrombin complex activity (PCA)-time profiles following
administration of a single oral dose of 25 mg rac-warfarin alone (WF), warfarin
+ ginkgo (WF + ginkgo) or warfarin + ginger (WF + ginger) (mean ± SD, n=12).
Individual subject profiles are presented in Appendix 12.
0
20
40
60
80
100
120
-48 0 48 96 144 192
Time (hour)
PC
A%
Warfarin OnlyWarfarin + GinkgoWarfarin + Ginger
Figure 6-19. Model dependent estimates of the degradation rate constant of the
prothrombin complex (kd) following oral administration of a 25 mg rac-
warfarin dose as warfarin only (WF), warfarin + ginkgo (WF + Ginkgo) and
warfarin + ginger (WF + Ginger).
0
0.04
0.08
0.12
0.16
0 1 2 3
WF + Ginkgo WF WF + Ginger
kd (1
/h)
Subject 1Subject 2Subject 3Subject 4Subject 5Subject 6Subject 7Subject 8Subject 9Subject 10Subject 11Subject 12

Chapter 6 Effect of Ginkgo and Ginger on Warfarin 193
Figure 6-20. Model dependent estimates of concentration of S-warfarin required
to produce a 50% inhibition of PCA (C50,S) following oral administration of a 25
mg rac-warfarin dose as warfarin only (WF), warfarin + ginkgo (WF + Ginkgo)
and warfarin + Ginger (WF + Ginger).
0
400
800
1200
1600
2000
2400
0 1 2 3WF + Ginkgo WF WF + Ginger
C50
,S (n
g/m
l)
Subject 1Subject 2Subject 3Subject 4Subject 5Subject 6Subject 7Subject 8Subject 9Subject 10Subject 11Subject 12
Figure 6-21. Model dependent estimates of the steepness of the concentration-
response (γ) following oral administration of a 25 mg rac-warfarin dose as
warfarin only (WF), warfarin + ginkgo (WF + Ginkgo) and warfarin + ginseng
(WF + Ginger).
0
1
2
3
4
5
6
7
0 1 2 3
WF + Ginkgo WF WF + Ginger
Subject 1Subject 2Subject 3Subject 4Subject 5Subject 6Subject 7Subject 8Subject 9Subject 10Subject 11Subject 12
γ

Chapter 6 Effect of Ginkgo and Ginger on Warfarin 194
Table 6-6. Model dependent warfarin pharmacokinetic and pharmacodynamic
parameters following a single oral dose of 25 mg rac-warfarin alone (WF) or in
combination with either ginkgo (WF + Ginkgo) or ginger (WF + Ginger) (mean
± SD, 95% CI, n=12).
Treatment WF alone WF + Ginkgo WF + Ginger
kd (1/h) 0.06 ± 0.02 (0.05 – 0.07)
0.07 ± 0.03 (0.05 – 0.09)
0.08 ± 0.03 (0.06 – 0.10)
C50,S (ng/ml) 543 ± 241 (389 – 696)
611 ± 323 (406 - 817)
633 ± 586 (261 – 1005)
γS 2.0 ± 1.6 (1.0 – 3.0)
1.5 ± 0.3 (1.2 – 1.7)
1.8 ± 2.3 (0.3 – 3.2)
t1/2 (h) S-warfarin
R-warfarin
35.1 ± 6.5
(31.0 – 39.3) 50.3 ± 11.2
(43.2 – 57.3)
33.7 ± 6.4
(30.0 – 37.8) 48.1 ± 8.4
(42.8 – 53.5)
35.6 ± 9.8
(29.4 – 41.8) 48.2 ± 8.7
(42.6 – 53.7)
CL/F (ml/h) S-warfarin
R-warfarin
194 ± 40
(168 – 219) 130 ± 33
(109 – 151)
195 ± 42
(168 – 222) 124 ± 22
(110 – 139)
199 ± 48
(169 – 229) 132 ± 41
(106 – 158)
V/F (ml/kg) S-warfarin
R-warfarin
130 ± 20
(120 – 140) 120 ± 20
(110 – 130)
120 ± 10
(110 – 130) 110 ± 10
(100 – 120)
130 ± 20
(110 – 140) 120 ± 20
(100 – 130)

Chapter 6 Effect of Ginkgo and Ginger on Warfarin 195
Table 6-7. Mean ratios and 90% confidence intervals for selected log
transformed pharmacokinetic and pharmacodynamic parameters between herb
treatments compared to warfarin only (n=12).
Treatment
Ginkgo (90% CI) Ginger (90% CI)
kd 1.19 (1.06 – 1.33) 1.36 (1.21 – 1.52)*
C50,S 1.10 (1.03 – 1.18)
0.98 (0.92 – 1.05)
γS 0.86 (0.75 – 0.97) 0.70 (0.61 – 0.79)*
t1/2 S-warfarin R-warfarin
0.96 (0.93 – 0.98) 0.97 (0.93 – 1.00)
0.99 (0.97 – 1.02) 0.96 (0.93 – 1.00)
CL/F S-warfarin R-warfarin
1.00 (0.97 – 1.03) 0.97 (0.94 – 1.01)
1.02 (0.99 – 1.05) 1.01 (0.97 – 1.05)
V/F S-warfarin R-warfarin
0.96 (0.93 – 0.99) 0.95 (0.93 – 0.97)
1.00 (0.97 – 1.03) 0.97 (0.95 – 1.00)
ANOVA *p<0.05
6.3.8 Adverse Events
In the present study, twelve subjects completed the study. No significant adverse
events or bleeding episodes were observed. One subject reported constipation during
the first two days of ginkgo pre-treatment and mild diarrhoea during the first two
days of ginger pre-treatment.

Chapter 6 Effect of Ginkgo and Ginger on Warfarin 196
6.4 Discussion
This study investigated the effect of two commonly ingested herbal medicines on the
pharmacokinetics and pharmacodynamics of warfarin enantiomers as well as the
independent effects of these herbs on INR and platelet aggregation using a standard
study design widely used in investigating warfarin–drug interactions. The major
finding was that co-administration of recommended doses of ginkgo or ginger did
not significantly affect pharmacokinetic and pharmacodynamic parameters of
warfarin enantiomers after a single dose of the drug to healthy male subjects.
Both sequence and period effects were found to be significant in the ANOVA
analysis of the log transformed parameters including AUC0-∞ of S- and R-warfarin
and AUC0-168 of INR. The reason for the sequence and period effects was unclear.
The results are considered acceptable according to sequence effect described in the
In Vivo Bioequivalence Guidances (United States Pharmacopoeia) USP23 [287]
because this was a single-dose study which included only healthy male subjects. An
adequate washout period was used with no detectable warfarin concentrations prior
to warfarin dose administration in each period and INR returned to baseline in each
case.
Twelve healthy subjects were recruited in the present study. This sample size was
determined by power calculation based on twelve subjects in a crossover study
would provide an 80% chance of detecting a 20% difference in the AUC0-∞ of S-
warfarin while forty-three subjects were needed to find the difference in the AUC0-168
of INR. Hence using twelve healthy subjects could not conclusively exclude a

Chapter 6 Effect of Ginkgo and Ginger on Warfarin 197
pharmacodynamic interaction. However, such an interaction is unlikely because there
was no significant change in the pharmacokinetics of S-warfarin and R-warfarin and
there was no statistically difference in baseline INR following pre-treatment with
ginkgo or ginger.
The Ginkgo biloba leaf extracts generally have a low incidence of side effects. It is
reported in a review article by McKenna et al [173] that numerous clinical trials have
demonstrated that EGb 761 is considered safe without causing any serious adverse
effects. The reported side effects include gastrointestinal complaints, headache, sleep
disturbances, dizziness, and allergic skin reactions. And there also are several case
reports involving patients who experience haemorrhage. Ginger has been recognized
by the US Food and Drug Administration (FDA) and is listed as a food additive that
is “Generally Recognized as Safe” [200].
No batch to batch or brand to brand reproducibility studies of ginger preparations
have been found in the literature. Kressmann et al [271, 272] published two separate
articles to identify the quality issues of the ginkgo products and their influence on the
bioavailability of ginkgo constituents (See Section 4.4). Herbal medicine products
containing extracts of ginkgo or ginger were chosen for this study following a
qualitative assessment of a range of commercially available single-ingredient herbal
medicine products (See Chapter 4). Furthermore, the selected study formulations
conformed to the dosage recommended in the Herbal Medicine-Expanded
Commission E Monographs. There was good agreement in the composition of
different commercial herbal medicine products containing ginkgo as a single herb
ingredient. In contrast, notable variability was found in the composition of the
Chapter 6 Effect of Ginkgo and Ginger on Warfarin 198
different brands of ginger. As stated in Chapter 5, this observation further reinforces
the need to establish the quality of herbal medicines products used in clinical studies
to evaluate their clinical efficacy or potential herb-drug interactions. The herbal
medicine product chosen for the present study (Tavonin™) contained Ginkgo biloba
refined extract, EGb 761 which has been investigated in numerous clinical trials and
has been the subject of a systematic review [285]. This level of evidence, which
supports the clinical use of this extract, is one of the reasons it was selected for
investigation in this study.
Ginkgo extracts have been reported to inhibit the drug metabolising activity of
CYP450. Zou et al [137] evaluated the effects of ginkgolide A, B, C, ginkgo acid I,
II, bilobalide and isorhemnetin, purified compounds from Ginkgo biloba, on the
catalytic activity of cDNA-expressed cytochrome P450 isoforms using in vitro
experiments. Increasing concentrations of the compounds were incubated with a
panel of recombinantly expressed human CYP isoforms and examined their effects
on the conversion of specific substrates measured fluorometrically in a 96-well plate
format. Ginkgolic acids I and II were found to be potent inhibitors of CYP1A2 (IC50
(µM): 4.81, 4.88), 2C9 (IC50 (µM): 2.41, 1.94), 2C19 (IC50 (µM): 4.22, 4.41), 2D6
(IC50 (µM): 10.42, 7.82) and 3A4 (IC50 (µM): 6.74, 6.25), respectively, while
ginkgolide A, B, C, bilobalide and isorhemnetin did not inhibit these enzymes.
Furthermore, Ohnishi et al [194] investigated the effects of Ginkgo biloba leaf
extract, on the pharmacokinetics of diltiazem, a substrate for CYP 3A using both in
vitro and in vivo studies in rats. A standardized method was used to prepare the
Ginkgo biloba extract. The final quality of this extract was assured containing over
24% flavonoid glycosides and 6% terpene lactones and less than 1 ppm ginkgolic

Chapter 6 Effect of Ginkgo and Ginger on Warfarin 199
acids, and the yield was about 2%. The simultaneous addition of this Ginkgo biloba
extract to small intestine and liver microsomes inhibited the formation of N-
demethyldiltiazem, an active metabolite of diltiazem generated by CYP3A, with an
IC50 of about 50 and 182 µg/ml, respectively. Both the formation rate of N-
demethyldiltiazem and the total amount of CYP in intestinal or hepatic microsomes
decreased transiently and the area under the concentration-time curve and absolute
bioavailability after oral administration of diltiazem (30 mg/kg) were significantly
increased after a single oral pretreatment with Ginkgo biloba (20 mg/kg). The
pretreatment with Ginkgo biloba extract (20 mg/kg) significantly decreased the
elimination rate constant and increased the mean residence time after intravenous
administration of diltiazem (3 mg/kg). Umegaki et al [188] reported that the addition
of ginkgo extract resulted in a concentration dependent inhibition of various CYP
enzymes, especially CYP2B based on in vitro studies using rats and human hepatic
microsomes. Paradoxically, ginkgo extract has also been reported in the literature to
induce cytochrome P450. Shinozuka et al [196] reported, based on studies in rats,
that the levels of CYP2B1/2, CYP3A1 and CYP3A2 mRNA in the liver were
significantly induced while CYP1A1, CYP1A2, CYP2E1, CYP2C11 and CYP4A1
remained unchanged and the hypotensive effect of nicardipine, metabolized by
CYP3A2, was significantly reduced in rats after pre-treatment with 0.5% of ginkgo
extract for four weeks. Umegaki et al [188] also reported that the concentration and
activities of CYP enzymes, especially the CYP2B enzyme, were significantly
increased on day 1 of feeding of a 0.5% ginkgo extract diet and after administration
of ginkgo extract of 10 mg/kg body weight for 5 days by intragastric gavage in rats.
However, these effects of ginkgo have not been observed in clinical trials in humans.
Gurley et al [91] reported that a single-time point phenotypic metabolic ratios were

Chapter 6 Effect of Ginkgo and Ginger on Warfarin 200
used to determine whether long-term administration of Ginkgo biloba and other
herbal medicines affected CYP1A2, CYP2D6, CYP2E1 or CYP3A4 activity. Twelve
healthy volunteers (6 males, 6 females) were randomly assigned to receive either
Ginkgo biloba (60 mg, 4 times daily) or other herbal medicines for 28 days. For each
subject, a 30-day washout period was used between each herbal medicine phase.
Probe-drug cocktails of midazolam (CYP3A4), caffeine (CYP1A2), chlorzoxazone
(CYP2E1) and debrisoquin (CYP2D6) were administered before herbal medicine
treatment and at the end of herbal medicine treatment. Phenotypic trait measurements
were determined for CYP3A4, CYP1A2, CYP2E1, and CYP2D6 by using 1-
hydroxymidazolam/midazolam serum ratios (1-hour sample), paraxanthine/caffeine
serum ratios (6-hour sample), 6-hydroxychlorzoxazone/chlorzoxazone serum ratios
(2-hour sample), and debrisoquin urinary recovery ratios (8-hour collection),
respectively. No significant effect on CYP activity was observed for Ginkgo biloba.
The effect of ginkgo extract on the in vivo metabolic activity of CYP2C9 was not
investigated by these researchers.
A recent clinical trial investigated the effect of ginkgo co-administration on warfarin
pharmacodynamics using a randomized, double-blind placebo-controlled cross-over
trial in patients using 100 mg of ginkgo extract daily over treatment periods of four
weeks [197]. Twenty-four outpatients (fourteen women and ten men) were included
who were receiving stable, long-term warfarin treatment. A two-week wash out
period was employed. The INR was kept between 2.0 and 4.0 by appropriate
adjustment of the warfarin dosage. The INR was stable during all treatment periods.
The geometric mean dosage of warfarin did not change during the treatment periods

Chapter 6 Effect of Ginkgo and Ginger on Warfarin 201
[197]. However, the effect of ginkgo on the pharmacokinetics of warfarin was not
investigated in the study by Engelsen et al [197].
In the study reported in this thesis, recommended doses of a herbal medicine product
containing EGb 761 (ginkgolic acids < 5 ppm) did not affect the clearance of
warfarin enantiomers which suggests that this herb does not significantly influence
CYP1A2, CYP3A4 or CYP2C9 metabolic activity at this dose. The conflicting
observations about the possible effects of ginkgo constituents on cytochrome P450 in
the literature could be caused by variability in constituents of ginkgo and different
concentrations of ginkgo constituents used in the in vivo and in vitro studies reported
in the literature. Therefore, the use of standardised methods to prepare herbal
medicines and standardised methods to perform quality control is quite important to
guarantee equivalent efficacy in different proprietary preparations.
Conflicting results have also been observed in the effect of ginkgo on clotting status
in the literature. Several in vitro studies have demonstrated that ginkgo extract or
ginkgolides A, B and C inhibit PAF but not ADP or arachidonic acid induced platelet
aggregation [182-185]. Furthermore, in clinical trials, twenty-four patients suffering
from arteriosclerotic disorders were divided into 2 groups. Twelve patients received
sodium chloride (250 ml) with Ginkgo biloba extract (25 ml) while the other twelve
patients were treated with sodium chloride (250 ml) only. The collagen induced
platelet aggregation was determined before, immediately after infusion and on the
following day. The platelet aggregation increased in both treatment groups after
infusion. Platelet aggregation in the group treated with Ginkgo biloba extract after 1
day returned to normal while the aggregation remained increased in the sodium

Chapter 6 Effect of Ginkgo and Ginger on Warfarin 202
chloride group [186]. Furthermore, ginkgo extract significantly reduced collagen but
not PAF-mediated platelet aggregation in healthy volunteers (n=28) and Type 2
diabetic subjects (n=19) in which 120 mg of standardized ginkgo was ingested for 3
months [187].
However, several studies have concluded that ginkgo does not affect clotting status.
In one study, up to 0.2 mg/ml of ginkgo extract did not inhibit ADP and collagen-
induced platelet aggregation in vitro in rats [288]. In another prospective, double
blind, randomised, placebo-controlled study in 32 young male healthy volunteers;
ginkgo extract (EGb761) did not alter any haematological marker using three doses
of ginkgo extracts 120, 240 and 480 mg/day for 14 days [189]. In this study, primary
haemostasis was assessed by both the bleeding time measured by the 3-point Ivy-
Neison technique and a direct quantitative measurement of blood loss according to
the Bernal-Hoyos methods. The interaction between platelets and coagulation was
assessed using the thrombin generation test in platelet rich plasma. Several methods
were used to assess platelet function including (i) by platelet aggregation in citrated
platelet rich plasma, induced by three different agonists: adenosine diphosphate (2.5
µM), thrombin receptor agonist peptide (25 µM) and collagen (1.25 µg/ml); (ii) by
quantification of platelet membrane glycoproteins and (iii) by measurement of
procoagulant activity assessed by annexin fixation on the platelet membrane [189].
In the present study, ginkgo did not significantly affect platelet aggregation induced
by arachidonic acid and coagulation which is in agreement with these findings.
Few ginger-drug interactions have been reported in the literature. Banerjee et al [211]
investigated the influence of certain essential oils including ginger oil, on

Chapter 6 Effect of Ginkgo and Ginger on Warfarin 203
carcinogen-metabolizing enzymes and acid-soluble sulfhydryls in mouse liver and
found ginger oil (10 µl/day for 14 days by gavage) did not significantly affect
cytochrome P450 levels. This is consistent with the observations of a lack an effect
of ginger on warfarin metabolism reported in this thesis.
Investigation of the effect of ginger on platelet aggregation or coagulation has been
conducted by several researchers. A series of synthetic gingerols and related
phenylalkanol analogues were found to inhibit arachidonic acid induced platelet
serotonin release and aggregation based on an in vitro study of human platelets [201].
Furthermore, it was found in in vitro studies that a significant effect of ginger extract
was to inhibit platelet aggregation. Srivastava et al [202-204] reported that organic
ginger extract extracted in three organic solvents: n-hexane, chloroform and ethyl
acetate reduced platelet thromboxane formation from exogenous arachidonic acid
and also inhibited platelet aggregation induced by arachidonic acid, epinephrine,
ADP and collagen in a dose-dependent manner. Suekawa et al [286] reported that
(6)-Shogaol, a pungent component of ginger, inhibited arachidonic acid - induced
platelet aggregation in rabbits platelet in vitro.
However, conflicting findings related to the effect of ginger constituents on platelet
aggregation are found elsewhere in the literature. Lumb et al [208] reported the
effects of 2 g dried ginger or placebo capsules on platelet function using eight
healthy male volunteers in a randomised double blind study. Bleeding time, platelet
count, thromboelastography and whole blood platelet aggregometry were measured
before, 3 h, and 24 h after administration of ginger. There were no significant
differences found between ginger and placebo [208]. In contrast, administration of 5

Chapter 6 Effect of Ginkgo and Ginger on Warfarin 204
g of dry ginger in two divided doses with a fatty meal was reported to significantly
inhibit the platelet aggregation induced by adenosine diphosphate and epinephrine in
ten healthy male volunteers in whom platelet aggregation was enhanced by 100 g
butter for 7 days while there was no significant alteration in platelet aggregation in
the placebo control group (10 healthy male volunteers) [205]. In addition, using a
single dose of 10 g powdered ginger, a significant reduction in platelet aggregation
induced by ADP and epinephrine was observed in patients with coronary artery
disease while no significant effect was found using a dose of 4 g daily for 3 months
[206]. In animal studies, no significant effect on coagulation parameters PT and
APTT or on warfarin-induced changes in blood coagulation was found in rats using
multiple 100 mg/kg doses of EV.EXT™ 33, which is a ginger extract of patented
standardised ethanol extract of dry rhizomes of Zingiber officinale Roscoe [207]. In
the present study, no significant effect was found on platelet aggregation and
coagulation in healthy human volunteers using a daily dose of 3.6 g of ginger for 5
days.
The conflicting results on clotting status in the literature and the present study could
be attributed to a number of factors including the in vivo metabolic biotransformation
of the ginger constituents after oral dosing of ginger, dose regimen or study
population. There are no studies reported on the pharmacokinetics of ginger
constituents in humans.
In this study a combined PK/PD model was employed to characterise the warfarin
concentration-effect data obtained in the three phases of this clinical trial. This
allows assessment of the effect of herbs on pharmacodynamic parameters.

Chapter 6 Effect of Ginkgo and Ginger on Warfarin 205
Co-administration with ginger was found to significantly increase the degradation
rate constant (kd) of PCA and slop factor in concentration-response relationship (γS)
while no significant difference was found in C50S with and without these two herbal
medicines. The clinical implications of the effect of ginger on the kd of PCA and γS
is unclear given that ginger did not significantly affect INR baseline and AUC0-168 of
INR. The mechanism by which ginger affects kd or γS is not clear. C50S, kd and γS
from the present study of control group are in agreement with previous reported [18].
In summary, this study found that neither ginkgo nor ginger when administered as
single herbal ingredient medicines at recommended doses for a week affected the
pharmacokinetics of either S-warfarin or R-warfarin in humans, nor did they affect
coagulation status. These finding suggest that the coadministration of ginkgo or
ginger at recommended doses is unlikely to affect warfarin response in healthy
persons. The finding that ginger increased degradation rate constant deserves further
investigation and the safety of these herbs in anticoagulant patients has yet to be
established.

Chapter 7 General Discussion, Conclusions and Further Studies 206
Chapter 7 General Discussion, Conclusions and
Further Studies
7.1 General Discussion
These studies involved standard warfarin-drug interactions study design which is the
most frequently used in the literature (See Section 2.1.1). A power calculation
indicated that using 12 subjects to investigate warfarin drug interaction in a crossover
study provides an 80% chance to detect a 20% difference in AUC0-∞ of S-warfarin.
However, 43 subjects would be needed to show a similar difference in AUC0-168 of
INR as pharmacodynamic parameter. A number of CI ranges of ratios for
pharmacodynamic parameters were out side the predefined limit of 0.80 to 1.25
suggesting that a lack of significant difference cannot be concluded. While these two
studies could not conclusively exclude a pharmacodynamic interaction such an
interaction is unlikely because no significant change was observed in
pharmacokinetics of S-warfarin while warfarin was coadministered with ginseng,
ginkgo or ginger and also no statistically difference was found in baseline INR
during pre-treatment with St John’s wort, ginseng, ginkgo or ginger. For St John’s
wort, it induced the metabolism of warfarin and subsequently reduced the
anticoagulant effect of warfarin.

Chapter 7 General Discussion, Conclusions and Further Studies 207
Cmax of S- and R-warfarin were not suitable to be used to test sequence and period
effect, because the sampling time was not designed to find a difference in Cmax of S-
and R-warfarin.
The single 25 mg dose of warfarin used in the study was based on the literature
review of warfarin drug interaction study design. It is the most frequently used in the
literature (See Section 2.1.1). Warfarin has a narrow therapeutic range and serious
side effects such as bleeding rarely happened after an in single dose of warfarin but
are not uncommon during long-term use. The target therapeutic range of warfarin
therapy INR (2-3) for treatment of venous thrombosis and pulmonary embolism (See
Section 1.3) which is recommended by Therapeutic Guidelines: Cardiovascular
(Australia) was reached after a single 25 mg dose of warfarin (Figure 5-17 and
Figure 6-17). Furthermore, Figure 7-1 and Figure 7-2 show the concentration-effect
relationship for warfarin derived from the PKPD modelling analysis and the PD
parameter estimated. Over the S-warfarin concentration range (0 - 2 µg/ml) observed
after a single 25 mg dose, the maximum inhibition of PCA is approximately 80%.
This observation means that this study design was capable of detecting both
increases and decreased in warfarin effect during drug interaction studies.

Chapter 7 General Discussion, Conclusions and Further Studies 208
Figure 7-1. PCA-Concentration profiles following single oral 25 mg rac-
warfarin dose with warfarin only, warfarin + St John’s wort and warfarin +
ginseng using mean data (n=12) derived from PD parameters presented in
Table 5-6.
0
20
40
60
80
100
0 500 1000 1500 2000
S-warfarin Conc. (ng/ml)
Inhi
bitio
n of
PC
A%
Warfarin Only
Warfarin + Ginseng
Warfarin + St John's wort
Figure 7-2. PCA-Concentration profiles following single oral 25 mg rac-
warfarin dose with warfarin only, warfarin + ginkgo and warfarin + ginger
using mean data (n=12) derived from PD parameters presented in Table 6-6.
0
20
40
60
80
100
0 500 1000 1500 2000
S-warfarin Conc. (ng/ml)
Inhi
bitio
n of
PC
A%
Warfarin OnlyWarfarin + GinkgoWarfarin + Ginger

Chapter 7 General Discussion, Conclusions and Further Studies 209
7.2 General Conclusions
This thesis has investigated the effect of herbal medicines on the pharmacokinetics
and pharmacodynamics of warfarin and their individual effect on coagulation and
platelet aggregation in healthy subjects. This has been achieved using four of the
most commonly used herbs St John’s wort, ginseng, ginkgo and ginger. The results
of this study revealed important information about the potential for herbs to influence
human metabolism enzymes including CYP2C9, CYP1A2 and/or CYP3A4.
This chapter details the important findings of the work presented in this thesis. Key
elements of the preceding chapters are discussed in a broader context and potential
areas of further research are highlighted.
Chapter 4 describes the investigations into the quality of herbal medicine products. In
this thesis commercially available herbal medicine products were selected as it would
most likely reflect the type of products used by patients receiving warfarin. No
significant variability was found between different commercial products of ginkgo.
However, the variability between different commercial products of St John’s wort,
ginseng, and ginger was notable. TLC was used as a screening method to investigate
the quality of herbal medicines because it is a simple, quick and productive method
to perform batch tests investigating the qualitative differences between commercial
products of herbal medicines and different constituents within such herbal medicines.
Standardised quality control methods based on the British Pharmacopoeia 2001 and
the People’s Republic of China Pharmacopoeia 2000 were used in this thesis. The
Chapter 7 General Discussion, Conclusions and Further Studies 210
use of standardised methods to prepare herbal medicines and to perform quality
control is recommended. This is critical to ensure the quality of herbal medicines; to
minimise the variability of constitutes in herbal medicines and to ensure efficacy of
herbal medicines.
In Chapter 5, it has been demonstrated that pre-treatment with St John’s wort can
induce the metabolism of both S- and R- warfarin in humans by comparing
pharmacokinetic and pharmacodynamic parameters with and without
coadministration with St John’s wort. S-warfarin is metabolised predominantly to S-
7-hydroxywarfarin by CYP2C9 while R-warfarin is partly metabolised by CYP3A4
and CYP1A2. The study design and data analysis approach used in this thesis
demonstrated that the drug interaction mechanism of St John’s wort on warfarin is
the result of induction of the CYP2C9, CYP3A4 and/or CYP1A2 rather than a
reduction in the unbound fraction of warfarin leading to an increase in its clearance.
Previous studies have not demonstrated an effect of St John’s wort on CYP2C9.
Potential drug interactions with St John’s wort include other drugs that are substrates
of CYP2C9, CYP3A4 and/or CYP1A2. Co-administration of St John’s wort can
reduce the efficacy of warfarin based on this pharmacokinetic interaction mechanism.
This most certainly has implications for patients taking and the need to avoid or
carefully monitor the use of St John’s wort.
Studies in Chapter 5 and 6 of this thesis found that ginseng, ginkgo and ginger
administered as single ingredient herbal medicines at the recommended dose had

Chapter 7 General Discussion, Conclusions and Further Studies 211
little effect on the pharmacokinetics and pharmacodynamics of warfarin enantiomers.
Furthermore, ginseng, ginkgo and ginger had little effect on substrates of CYP2C9,
CYP3A4 and CYP1A2.
Administration of St John’s wort, ginseng, ginkgo and ginger at recommended oral
doses did not significantly affect coagulation and platelet aggregation in healthy
subjects. Nevertheless, the safety of these herbs in patients receiving anticoagulants
has yet to be established.
The lack of an interaction with ginseng ginger and ginkgo observed in this study
does not allow one to conclude that such an interaction is not possible in patients.
There is little information about the way that herbal medicines are used in our
community but the suggestion is that people often take multiple combinations of
herbs often at higher recommended dosed. In summary, these findings provide
rigorous evidence to support the recommendation that close monitoring of INR
should be undertaken in patients receiving this herb-drug combination. Further
research is needed to clarify the implications of these findings for elderly patients
(who are likely to receive warfarin) and in people using a range of herbal and
complementary medicines often in a variety of doses.

Chapter 7 General Discussion, Conclusions and Further Studies 212
7.3 Further Studies
The pharmacokinetic interactions between warfarin and these four herbal medicines
have been clarified in this thesis. Understanding the mechanism of warfarin drug
interactions provides an insight into the possible clinical significance of an
interaction and can help elucidate strategies to avoid or minimise the impact in a
given patient. Based on these findings in healthy male subjects, further studies
should be conducted in patients receiving anticoagulants to obtain the most definitive
data on the probability and magnitude of warfarin pharmacodynamic interactions
with the four herbal medicines examined. Especially, the finding that ginger
increased the degradation rate constant of the prothrombin complex deserves further
study.

References 213
References
1. Brazier NC, Levine MA. Drug-herb interaction among commonly used conventional medicines: a compendium for health care professionals. Am J Ther 2003;10:163-9. 2. Vaes LP, Chyka PA. Interactions of warfarin with garlic, ginger, ginkgo, or ginseng: nature of the evidence. Ann Pharmacother 2000;34:1478-82. 3. Valli G, Giardina EG. Benefits, adverse effects and drug interactions of herbal therapies with cardiovascular effects. J Am Coll Cardiol 2002;39:1083-95. 4. Kristoffersen SS, Atkin PA, Shenfield GM. Uptake of alternative medicine. Lancet 1996;347:972. 5. Ernst E. Herb-drug interactions: potentially important but woefully under-researched. Eur J Clin Pharmacol 2000;56:523-4. 6. Fugh-Berman A, Ernst E. Herb-drug interactions: review and assessment of report reliability Herb-drug interactions: potentially important but woefully under-researched. Br J Clin Pharmacol 2001;52:587-95. 7. Coxeter PD, McLachlan AJ, Duke CC, Roufogalis BD. Herb-drug interactions: an evidence based approach. Curr Med Chem 2004;11:1513-25. 8. Henderson L, Yue QY, Bergquist C, Gerden B, Arlett P. St John's wort (Hypericum perforatum): drug interactions and clinical outcomes. Br J Clin Pharmacol 2002;54:349-56. 9. Huang SM, Lesko LJ, Williams RL. Assessment of the quality and quantity of drug-drug interaction studies in recent NDA submissions: study design and data analysis issues. J Clin Pharmacol 1999;39:1006-14. 10. O'Reilly RA, Nelson E, Levy G. Physicochemical and physiologic factors affecting the absorption of warfarin in man. J Pharm Sci 1966;55:435-7. 11. Kelly JG, O'Malley K. Clinical pharmacokinetics of oral anticoagulants. Clin Pharmacokinet 1979;4:1-15. 12. Sadowski J, Booth SL, Mann KG, Malhotra OP, Bovill EG,. Structure and mechanism of activation of vitamin K antagonists. New York; 1996.

References 214
13. Wells PS, Holbrook AM, Crowther NR, Hirsh J. Interactions of warfarin with drugs and food. Ann Intern Med 1994;121:676-83. 14. Hirsh J, Dalen J, Anderson DR, Poller L, Bussey H, Ansell J, Deykin D. Oral anticoagulants: mechanism of action, clinical effectiveness, and optimal therapeutic range. Chest 2001;119:8S-21S. 15. Vigano D'Angelo S, Comp PC, Esmon CT, D'Angelo A. Relationship between protein C antigen and anticoagulant activity during oral anticoagulation and in selected disease states. J Clin Invest 1986;77:416-25. 16. Rang HP, Dale MM, Ritter JM, Moore PK. In: Pharmacology - Fifth Edition: Churchill Livingstone; 2003. p. 319. 17. McLachlan A. Warfarin drug interactions. Australian Pharmacist 2000;19:38-46. 18. Chan E, McLachlan A, O'Reilly R, Rowland M. Stereochemical aspects of warfarin drug interactions: use of a combined pharmacokinetic-pharmacodynamic model. Clin Pharmacol Ther 1994;56:286-94. 19. Pitsiu M, Parker EM, Aarons L, Holt B, Rowland M, Chan E, Serlin M, Breckenridge A. A comparison of the relative sensitivities of factor VII and prothrombin time measurements in detecting drug interactions with warfarin Inter-relationship among individual vitamin K-dependent clotting factors at different levels of anticoagulation. Eur J Clin Pharmacol 1992;42:645-9. 20. O'Reilly RA, Aggeler PM, Leong LS. Studies on the coumarin anticoagulant drugs: the pharmacodynamics of warfarin in man. J Clin Invest 1963;42:1542-51. 21. Sheiner LB. Computer-aided long-term anticoagulation therapy. Comput Biomed Res 1969;2:507-18. 22. Wiegman H, Vossepoel AM. A computer program for long term anticoagulation control. Comput Programs Biomed 1977;7:71-84. 23. Nagashima R, O'Reilly RA, Levy G. Kinetics of pharmacologic effects in man: the anticoagulant action of warfarin. Clin Pharmacol Ther 1969;10:22-35. 24. Holford NH, Sheiner LB. Understanding the dose-effect relationship: clinical application of pharmacokinetic-pharmacodynamic models. Clin Pharmacokinet 1981;6:429-53. 25. Breckenridge AM. Interindividual differences in the response to oral anticoagulants. Drugs 1977;14:367-75.

References 215
26. Pitsiu M, Parker EM, Aarons L, Rowland M. A Bayesian method based on clotting factor activity for the prediction of maintenance warfarin dosage regimens. Ther Drug Monit 2003;25:36-40. 27. Holford NH. Clinical pharmacokinetics and pharmacodynamics of warfarin. Understanding the dose-effect relationship. Clin Pharmacokinet 1986;11:483-504. 28. Chan E, McLachlan AJ, Pegg M, MacKay AD, Cole RB, Rowland M. Disposition of warfarin enantiomers and metabolites in patients during multiple dosing with rac-warfarin. Br J Clin Pharmacol 1994;37:563-9. 29. O'Reilly RA, Welling PG, Wagner JG. Pharmacokinetics of warfarin following intravenous administration to man. Thromb Diath Haemorrh 1971;25:178-86. 30. Yacobi A, Levy G. Protein binding of warfarin enantiomers in serum of humans and rats. J Pharmacokinet Biopharm 1977;5:123-31. 31. Chan E, McLachlan AJ, Rowland M. Warfarin metabolites: stereochemical aspects of protein binding and displacement by phenylbutazone. Chirality 1993;5:610-5. 32. Lewis RJ, Trager WF. Warfarin metabolism in man: identification of metabolites in urine. J Clin Invest 1970;49:907-13. 33. Kaminsky LS, Zhang ZY. Human P450 metabolism of warfarin. Pharmacol Ther 1997;73:67-74. 34. Lewis RJ, Trager WF, Robinson AJ, Chan KK. Warfarin metabolites: the anticoagulant activity and pharmacology of warfarin alcohols. J Lab Clin Med 1973;81:925-31. 35. Lewis RJ, Trager WF, Chan KK, Breckenridge A, Orme M, Roland M, Schary W. Warfarin. Stereochemical aspects of its metabolism and the interaction with phenylbutazone. J Clin Invest 1974;53:1607-17. 36. Heimark LD, Wienkers L, Kunze K, Gibaldi M, Eddy AC, Trager WF, O'Reilly RA, Goulart DA. The mechanism of the interaction between amiodarone and warfarin in humans. Clin Pharmacol Ther 1992;51:398-407. 37. Rettie AE, Korzekwa KR, Kunze KL, Lawrence RF, Eddy AC, Aoyama T, Gelboin HV, Gonzalez FJ, et al. Hydroxylation of warfarin by human cDNA-expressed cytochrome P-450: a role for P-4502C9 in the etiology of (S)-warfarin-drug interactions. Chem Res Toxicol 1992;5:54-9. 38. Hewick DS, Moreland TA. Proceedings: An NADPH dependent warfarin reductase in human and rat liver and kidney soluble fraction. Br J Pharmacol 1975;53:441.

References 216
39. Brian WR, Sari MA, Iwasaki M, Shimada T, Kaminsky LS, Guengerich FP. Catalytic activities of human liver cytochrome P-450 IIIA4 expressed in Saccharomyces cerevisiae. Biochemistry 1990;29:11280-92. 40. Kaminsky LS, Dunbar DA, Wang PP, Beaune P, Larrey D, Guengerich FP, Schnellmann RG, Sipes IG. Human hepatic cytochrome P-450 composition as probed by in vitro microsomal metabolism of warfarin. Drug Metab Dispos 1984;12:470-7. 41. Rettie AE, Wienkers LC, Gonzalez FJ, Trager WF, Korzekwa KR. Impaired (S)-warfarin metabolism catalysed by the R144C allelic variant of CYP2C9. Pharmacogenetics 1994;4:39-42. 42. Crespi CL, Miller VP. The R144C change in the CYP2C9*2 allele alters interaction of the cytochrome P450 with NADPH:cytochrome P450 oxidoreductase. Pharmacogenetics 1997;7:203-10. 43. Aithal GP, Day CP, Kesteven PJ, Daly AK. Association of polymorphisms in the cytochrome P450 CYP2C9 with warfarin dose requirement and risk of bleeding complications. Lancet 1999;353:717-9. 44. Higashi MK, Veenstra DL, Kondo LM, Wittkowsky AK, Srinouanprachanh SL, Farin FM, Rettie AE. Association between CYP2C9 genetic variants and anticoagulation-related outcomes during warfarin therapy. JAMA 2002;287:1690-8. 45. Jahnchen E, Meinertz T, Gilfrich HJ, Kersting F, Groth U. Enhanced elimination of warfarin during treatment with cholestyramine. Br J Clin Pharmacol 1978;5:437-40. 46. Hewick DS, McEwen J. Plasma half-lives, plasma metabolites and anticoagulant efficacies of the enantiomers of warfarin in man. J Pharm Pharmacol 1973;25:458-65. 47. Sutcliffe FA, MacNicoll AD, Gibson GG. Aspects of anticoagulant action: a review of the pharmacology, metabolism and toxicology of warfarin and congeners. Rev Drug Metab Drug Interact 1987;5:225-72. 48. Breckenridge A, Orme M, Wesseling H, Lewis RJ, Gibbons R. Pharmacokinetics and pharmacodynamics of the enantiomers of warfarin in man. Clin Pharmacol Ther 1974;15:424-30. 49. Stockley I. Drug Interactions. Edn 5 ed. London: The Pharmaceutical Press; 1999.p. 233. 50. Suttie JW. Vitamin K and human nutrition. J Am Diet Assoc 1992;92:585-90.

References 217
51. Conly JM, Stein K. The production of menaquinones (vitamin K2) by intestinal bacteria and their role in maintaining coagulation homeostasis. Prog Food Nutr Sci 1992;16:307-43. 52. Karlson B, Leijd B, Hellstrom K. On the influence of vitamin K-rich vegetables and wine on the effectiveness of warfarin treatment. Acta Med Scand 1986;220:347-50. 53. Kim JS, Nafziger AN, Gaedigk A, Dickmann LJ, Rettie AE, Bertino JS, Jr. Effects of oral vitamin K on S- and R-warfarin pharmacokinetics and pharmacodynamics: enhanced safety of warfarin as a CYP2C9 probe. J Clin Pharmacol 2001;41:715-22. 54. Weintraub M, Griner PF. Alterations in the effects of warfarin in dogs by halofenate: an influence upon the kinetics of prothrombin. Thromb Diath Haemorrh 1975;34:445-54. 55. Payen C, Dachraoui A, Pulce C, Descotes J. Prothrombin time prolongation in paracetamol poisoning: a relevant marker of hepatic failure? Hum Exp Toxicol 2003;22:617-21. 56. Martini A, Jahnchen E. Studies in rats on the mechanism by which 6-mercaptopurine inhibits the anticoagulant effect of warfarin. J Pharmacol Exp Ther 1977;201:547-53. 57. Chan TY. Adverse interactions between warfarin and nonsteroidal antiinflammatory drugs: mechanisms, clinical significance, and avoidance. Ann Pharmacother 1995;29:1274-83. 58. Villegas I, La Casa C, de la Lastra CA, Motilva V, Herrerias JM, Martin MJ. Mucosal damage induced by preferential COX-1 and COX-2 inhibitors: role of prostaglandins and inflammatory response. Life Sci 2004;74:873-84. 59. Robinson DS, Benjamin DM, McCormack JJ. Interaction of warfarin and nonsystemic gastrointestinal drugs. Clin Pharmacol Ther 1971;12:491-5. 60. Benet LZ, Hoener BA. Changes in plasma protein binding have little clinical relevance. Clin Pharmacol Ther 2002;71:115-21. 61. Toon S, Trager WF. Pharmacokinetic implications of stereoselective changes in plasma-protein binding: warfarin/sulfinpyrazone. J Pharm Sci 1984;73:1671-3. 62. Gonzalez FJ, Liu SY, Yano M. Regulation of cytochrome P450 genes: molecular mechanisms. Pharmacogenetics 1993;3:51-7. 63. Quattrochi LC, Guzelian PS. Cyp3A regulation: from pharmacology to nuclear receptors. Drug Metab Dispos 2001;29:615-22.
References 218
64. Heimark LD, Gibaldi M, Trager WF, O'Reilly RA, Goulart DA. The mechanism of the warfarin-rifampin drug interaction in humans. Clin Pharmacol Ther 1987;42:388-94. 65. Lee CR, Goldstein JA, Pieper JA. Cytochrome P450 2C9 polymorphisms: a comprehensive review of the in-vitro and human data. Pharmacogenetics 2002;12:251-63. 66. Goodwin B, Redinbo MR, Kliewer SA. Regulation of cyp3a gene transcription by the pregnane X receptor. Annu Rev Pharmacol Toxicol 2002;42:1-23. 67. Chen Y, Ferguson SS, Negishi M, Goldstein JA. Induction of human CYP2C9 by rifampicin, hyperforin, and phenobarbital is mediated by the pregnane X receptor. J Pharmacol Exp Ther 2004;308:495-501. 68. Kliewer SA, Goodwin B, Willson TM. The nuclear pregnane X receptor: a key regulator of xenobiotic metabolism. Endocr Rev 2002;23:687-702. 69. Xie W, Evans RM. Orphan nuclear receptors: the exotics of xenobiotics. J Biol Chem 2001;276:37739-42. 70. Hirsh J. Oral anticoagulant drugs. N Engl J Med 1991;324:1865-75. 71. Chan E, McLachlan A, Rowland M. Renal handling of warfarin metabolites in man. European Journal of Pharmaceutical Sciences 1994;1:189-193. 72. Park BK. Warfarin: metabolism and mode of action. Biochem Pharmacol 1988;37:19-27. 73. Blumenthal M, Golberg, A. and Brinckman, J. St John's wort. In: Herbal Medicine Expanded Commission E Monographs: Integrative Medicine Communications; 2000. p. 359-366. 74. Barnes J, Anderson LA, Phillipson JD. St John's wort (Hypericum perforatum L.): a review of its chemistry, pharmacology and clinical properties. J Pharm Pharmacol 2001;53:583-600. 75. Bilia AR, Gallori S, Vincieri FF. St. John's wort and depression: efficacy, safety and tolerability-an update. Life Sci 2002;70:3077-96. 76. Greeson JM, Sanford B, Monti DA. St. John's wort (Hypericum perforatum): a review of the current pharmacological, toxicological, and clinical literature. Psychopharmacology (Berl) 2001;153:402-14. 77. Muller WE, Rossol R. Effects of hypericum extract on the expression of serotonin receptors. J Geriatr Psychiatry Neurol 1994;7:S63-4.

References 219
78. Muller WE, Rolli M, Schafer C, Hafner U. Effects of hypericum extract (LI 160) in biochemical models of antidepressant activity. Pharmacopsychiatry 1997;30:102-7. 79. Butterweck V. Mechanism of action of St John's wort in depression : what is known? CNS Drugs 2003;17:539-62. 80. Biber A, Fischer H, Romer A, Chatterjee SS. Oral bioavailability of hyperforin from hypericum extracts in rats and human volunteers. Pharmacopsychiatry 1998;31:36-43. 81. Staffeldt B, Kerb R, Brockmoller J, Ploch M, Roots I. Pharmacokinetics of hypericin and pseudohypericin after oral intake of the hypericum perforatum extract LI 160 in healthy volunteers. J Geriatr Psychiatry Neurol 1994;7:S47-53. 82. Effect of Hypericum perforatum (St John's wort) in major depressive disorder: a randomized controlled trial. JAMA 2002;287:1807-14. 83. Lecrubier Y, Clerc G, Didi R, Kieser M. Efficacy of St. John's wort extract WS 5570 in major depression: a double-blind, placebo-controlled trial. Am J Psychiatry 2002;159:1361-6. 84. Gupta RK, Moller HJ. St. John's Wort. An option for the primary care treatment of depressive patients? Eur Arch Psychiatry Clin Neurosci 2003;253:140-8. 85. http://www.fda.gov/cder/drug/advisory/stjwort.htm. In; 2000. 86. http://www.tga.health.gov.au/docs/html/info.htm. In; 2004. 87. Venkatakrishnan K, Greenblatt DJ, von Moltke LL, Shader RI. Alprazolam is another substrate for human cytochrome P450-3A isoforms. J Clin Psychopharmacol 1998;18:256. 88. Markowitz JS, DeVane CL, Boulton DW, Carson SW, Nahas Z, Risch SC. Effect of St. John's wort (Hypericum perforatum) on cytochrome P-450 2D6 and 3A4 activity in healthy volunteers. Life Sci 2000;66:PL133-9. 89. Schmider J, von Moltke LL, Shader RI, Harmatz JS, Greenblatt DJ. Extrapolating in vitro data on drug metabolism to in vivo pharmacokinetics: evaluation of the pharmacokinetic interaction between amitriptyline and fluoxetine. Drug Metab Rev 1999;31:545-60. 90. Johne A, Schmider J, Brockmoller J, Stadelmann AM, Stormer E, Bauer S, Scholler G, Langheinrich M, et al. Decreased plasma levels of amitriptyline and its metabolites on comedication with an extract from St. John's wort ( Hypericum perforatum ). J Clin Psychopharmacol 2002;22:46-54.

References 220
91. Gurley BJ, Gardner SF, Hubbard MA, Williams DK, Gentry WB, Cui Y, Ang CY. Cytochrome P450 phenotypic ratios for predicting herb-drug interactions in humans. Clin Pharmacol Ther 2002;72:276-87. 92. Wang Z, Gorski JC, Hamman MA, Huang SM, Lesko LJ, Hall SD. The effects of St John's wort (Hypericum perforatum) on human cytochrome P450 activity. Clin Pharmacol Ther 2001;70:317-26. 93. Rasmussen BB, Brosen K. Determination of urinary metabolites of caffeine for the assessment of cytochrome P4501A2, xanthine oxidase, and N-acetyltransferase activity in humans. Ther Drug Monit 1996;18:254-62. 94. Burstein AH, Horton RL, Dunn T, Alfaro RM, Piscitelli SC, Theodore W. Lack of effect of St John's Wort on carbamazepine pharmacokinetics in healthy volunteers. Clin Pharmacol Ther 2000;68:605-12. 95. Peter R, Bocker R, Beaune PH, Iwasaki M, Guengerich FP, Yang CS. Hydroxylation of chlorzoxazone as a specific probe for human liver cytochrome P-450IIE1. Chem Res Toxicol 1990;3:566-73. 96. Idle JR, Mahgoub A, Lancaster R, Smith RL. Hypotensive response to debrisoquine and hydroxylation phenotype. Life Sci 1978;22:979-83. 97. Turton-Weeks SM, Barone GW, Gurley BJ, Ketel BL, Lightfoot ML, Abul-Ezz SR. St John's wort: a hidden risk for transplant patients. Prog Transplant 2001;11:116-20. 98. Moschella C, Jaber BL. Interaction between cyclosporine and Hypericum perforatum (St. John's wort) after organ transplantation. Am J Kidney Dis 2001;38:1105-7. 99. Beer AM, Ostermann T. [St. John's wort: interaction with cyclosporine increases risk of rejection for the kidney transplant and raises daily cost of medication]. Med Klin 2001;96:480-3. 100. Ahmed SM, Banner NR, Dubrey SW. Low cyclosporin-A level due to Saint-John's-wort in heart transplant patients. J Heart Lung Transplant 2001;20:795. 101. Barone GW, Gurley BJ, Ketel BL, Abul-Ezz SR. Herbal supplements: a potential for drug interactions in transplant recipients. Transplantation 2001;71:239-41. 102. Karliova M, Treichel U, Malago M, Frilling A, Gerken G, Broelsch CE. Interaction of Hypericum perforatum (St. John's wort) with cyclosporin A metabolism in a patient after liver transplantation. J Hepatol 2000;33:853-5.

References 221
103. Mai I, Kruger H, Budde K, Johne A, Brockmoller J, Neumayer HH, Roots I. Hazardous pharmacokinetic interaction of Saint John's wort (Hypericum perforatum) with the immunosuppressant cyclosporin. Int J Clin Pharmacol Ther 2000;38:500-2. 104. Barone GW, Gurley BJ, Ketel BL, Lightfoot ML, Abul-Ezz SR. Drug interaction between St. John's wort and cyclosporine. Ann Pharmacother 2000;34:1013-6. 105. Breidenbach T, Hoffmann MW, Becker T, Schlitt H, Klempnauer J. Drug interaction of St John's wort with cyclosporin. Lancet 2000;355:1912. 106. Dresser GK, Schwarz UI, Wilkinson GR, Kim RB. Coordinate induction of both cytochrome P4503A and MDR1 by St John's wort in healthy subjects. Clin Pharmacol Ther 2003;73:41-50. 107. Bauer S, Stormer E, Johne A, Kruger H, Budde K, Neumayer HH, Roots I, Mai I. Alterations in cyclosporin A pharmacokinetics and metabolism during treatment with St John's wort in renal transplant patients. Br J Clin Pharmacol 2003;55:203-11. 108. Watkins PB. The role of cytochromes P-450 in cyclosporine metabolism. J Am Acad Dermatol 1990;23:1301-9; discussion 1309-11. 109. Lown KS, Mayo RR, Leichtman AB, Hsiao HL, Turgeon DK, Schmiedlin-Ren P, Brown MB, Guo W, et al. Role of intestinal P-glycoprotein (mdr1) in interpatient variation in the oral bioavailability of cyclosporine. Clin Pharmacol Ther 1997;62:248-60. 110. Perault MC, Bouquet S, Bertschy G, Vandel S, Chakroun R, Guibert S, Vandel B. Debrisoquine and dextromethorphan phenotyping and antidepressant treatment. Therapie 1991;46:1-3. 111. Roby CA, Dryer DA, Burstein AH. St. John's wort: effect on CYP2D6 activity using dextromethorphan-dextrorphan ratios. J Clin Psychopharmacol 2001;21:530-2. 112. Wakasugi H, Yano I, Ito T, Hashida T, Futami T, Nohara R, Sasayama S, Inui K. Effect of clarithromycin on renal excretion of digoxin: interaction with P-glycoprotein. Clin Pharmacol Ther 1998;64:123-8. 113. Cheng TO. St John's wort interaction with digoxin. Arch Intern Med 2000;160:2548. 114. Durr D, Stieger B, Kullak-Ublick GA, Rentsch KM, Steinert HC, Meier PJ, Fattinger K. St John's Wort induces intestinal P-glycoprotein/MDR1 and intestinal and hepatic CYP3A4. Clin Pharmacol Ther 2000;68:598-604.

References 222
115. Johne A, Brockmoller J, Bauer S, Maurer A, Langheinrich M, Roots I. Pharmacokinetic interaction of digoxin with an herbal extract from St John's wort (Hypericum perforatum). Clin Pharmacol Ther 1999;66:338-45. 116. Drescher S, Schaeffeler E, Hitzl M, Hofmann U, Schwab M, Brinkmann U, Eichelbaum M, Fromm MF. MDR1 gene polymorphisms and disposition of the P-glycoprotein substrate fexofenadine. Br J Clin Pharmacol 2002;53:526-34. 117. Wang Z, Hamman MA, Huang SM, Lesko LJ, Hall SD. Effect of St John's wort on the pharmacokinetics of fexofenadine. Clin Pharmacol Ther 2002;71:414-20. 118. St. John's wort found to lower nevirapine levels. Treatment update 2001;12:6. 119. James JS. St. John's wort warning: do not combine with protease inhibitors, NNRTIs. AIDS Treat News 2000:3-5. 120. de Maat MM, Hoetelmans RM, Math t RA, van Gorp EC, Meenhorst PL, Mulder JW, Beijnen JH. Drug interaction between St John's wort and nevirapine. Aids 2001;15:420-1. 121. Miller JL. Interaction between indinavir and St. John's wort reported. Am J Health Syst Pharm 2000;57:625-6. 122. Smith PF, DiCenzo R, Morse GD. Clinical pharmacokinetics of non-nucleoside reverse transcriptase inhibitors. Clin Pharmacokinet 2001;40:893-905. 123. Piscitelli SC, Burstein AH, Chaitt D, Alfaro RM, Falloon J. Indinavir concentrations and St John's wort. Lancet 2000;355:547-8. 124. Mathijssen RH, Verweij J, de Bruijn P, Loos WJ, Sparreboom A. Effects of St. John's wort on irinotecan metabolism. J Natl Cancer Inst 2002;94:1247-9. 125. Izurieta R, Rabatin JT. Sedation during mechanical ventilation: a systematic review. Crit Care Med 2002;30:2644-8. 126. Gorski JC, Hall SD, Jones DR, VandenBranden M, Wrighton SA. Regioselective biotransformation of midazolam by members of the human cytochrome P450 3A (CYP3A) subfamily. Biochem Pharmacol 1994;47:1643-53. 127. Sugimoto K, Ohmori M, Tsuruoka S, Nishiki K, Kawaguchi A, Harada K, Arakawa M, Sakamoto K, et al. Different effects of St John's wort on the pharmacokinetics of simvastatin and pravastatin. Clin Pharmacol Ther 2001;70:518-24. 128. Hatanaka T. Clinical pharmacokinetics of pravastatin: mechanisms of pharmacokinetic events. Clin Pharmacokinet 2000;39:397-412.

References 223
129. Ha HR, Chen J, Freiburghaus AU, Follath F. Metabolism of theophylline by cDNA-expressed human cytochromes P-450. Br J Clin Pharmacol 1995;39:321-6. 130. Nebel A, Schneider BJ, Baker RK, Kroll DJ. Potential metabolic interaction between St. John's wort and theophylline. Ann Pharmacother 1999;33:502. 131. Karyekar CS, Eddington ND, Dowling TC. Effect of St. John's Wort extract on intestinal expression of cytochrome P4501A2: studies in LS180 cells. J Postgrad Med 2002;48:97-100. 132. Lee CR, Pieper JA, Frye RF, Hinderliter AL, Blaisdell JA, Goldstein JA. Tolbutamide, flurbiprofen, and losartan as probes of CYP2C9 activity in humans. J Clin Pharmacol 2003;43:84-91. 133. Schwarz UI, Buschel B, Kirch W. Unwanted pregnancy on self-medication with St John's wort despite hormonal contraception. Br J Clin Pharmacol 2003;55:112-3. 134. Ratz AE, von Moos M, Drewe J. [St. John's wort: a pharmaceutical with potentially dangerous interactions]. Schweiz Rundsch Med Prax 2001;90:843-9. 135. Hall SD, Wang Z, Huang SM, Hamman MA, Vasavada N, Adigun AQ, Hilligoss JK, Miller M, et al. The interaction between St John's wort and an oral contraceptive. Clin Pharmacol Ther 2003;74:525-35. 136. Pfrunder A, Schiesser M, Gerber S, Haschke M, Bitzer J, Drewe J. Interaction of St John's wort with low-dose oral contraceptive therapy: a randomized controlled trial. Br J Clin Pharmacol 2003;56:683-90. 137. Zou L, Harkey MR, Henderson GL. Effects of herbal components on cDNA-expressed cytochrome P450 enzyme catalytic activity. Life Sci 2002;71:1579-89. 138. Roby CA, Anderson GD, Kantor E, Dryer DA, Burstein AH. St John's Wort: effect on CYP3A4 activity. Clin Pharmacol Ther 2000;67:451-7. 139. Obach RS. Inhibition of human cytochrome P450 enzymes by constituents of St. John's Wort, an herbal preparation used in the treatment of depression. J Pharmacol Exp Ther 2000;294:88-95. 140. Budzinski JW, Foster BC, Vandenhoek S, Arnason JT. An in vitro evaluation of human cytochrome P450 3A4 inhibition by selected commercial herbal extracts and tinctures. Phytomedicine 2000;7:273-82. 141. Lee JCT, VH. Duke, RK. Duke, CC. Furohypeforin as an inhibitor of the metabolic enzyme CYP3A4. Proceedings the Annual Conference of the Australasian Pharmaceutical Science Association (APSA) 2003:81.

References 224
142. Perloff MD, von Moltke LL, Stormer E, Shader RI, Greenblatt DJ. Saint John's wort: an in vitro analysis of P-glycoprotein induction due to extended exposure. Br J Pharmacol 2001;134:1601-8. 143. Hennessy M, Kelleher D, Spiers JP, Barry M, Kavanagh P, Back D, Mulcahy F, Feely J. St Johns wort increases expression of P-glycoprotein: implications for drug interactions. Br J Clin Pharmacol 2002;53:75-82. 144. Ginseng. In: British Pharmacopoeia; 2001. p. 793-5. 145. Gillis CN. Panax ginseng pharmacology: a nitric oxide link? Biochem Pharmacol 1997;54:1-8. 146. Blumenthal M, Golberg, A. and Brinckman, J. Ginseng. In: Herbal Medicine Expanded Commission E Monographs: Integrative Medicine Communications; 2000. p. 170-7. 147. Attele AS, Wu JA, Yuan CS. Ginseng pharmacology: multiple constituents and multiple actions. Biochem Pharmacol 1999;58:1685-93. 148. Coon JT, Ernst E. Panax ginseng: a systematic review of adverse effects and drug interactions. Drug Saf 2002;25:323-44. 149. Saito H, Tsuchiya M, Naka S, Takagi K. Effects of Panax Ginseng root on conditioned avoidance response in rats. Jpn J Pharmacol 1977;27:509-16. 150. Tsang D, Yeung HW, Tso WW, Peck H. Ginseng saponins: influence on neurotransmitter uptake in rat brain synaptosomes. Planta Med 1985:221-4. 151. Benishin CG. Actions of ginsenoside Rb1 on choline uptake in central cholinergic nerve endings. Neurochem Int 1992;21:1-5. 152. Wakabayashi C, Murakami K, Hasegawa H, Murata J, Saiki I. An intestinal bacterial metabolite of ginseng protopanaxadiol saponins has the ability to induce apoptosis in tumor cells. Biochem Biophys Res Commun 1998;246:725-30. 153. Ota T, Fujikawa-yamamoto K, Zong ZP, Yamazaki M, Odashima S, Kitagawa I, Abe H, Arichi S. Plant-glycoside modulation of cell surface related to control of differentiation in cultured B16 melanoma cells. Cancer Res 1987;47:3863-7. 154. Mochizuki M, Yoo YC, Matsuzawa K, Sato K, Saiki I, Tono-oka S, Samukawa K, Azuma I. Inhibitory effect of tumor metastasis in mice by saponins, ginsenoside-Rb2, 20(R)- and 20(S)-ginsenoside-Rg3, of red ginseng. Biol Pharm Bull 1995;18:1197-202.

References 225
155. Kim YS, Kim DS, Kim SI. Ginsenoside Rh2 and Rh3 induce differentiation of HL-60 cells into granulocytes: modulation of protein kinase C isoforms during differentiation by ginsenoside Rh2. Int J Biochem Cell Biol 1998;30:327-38. 156. Park HJ, Rhee MH, Park KM, Nam KY, Park KH. Effect of non-saponin fraction from Panax ginseng on cGMP and thromboxane A2 in human platelet aggregation. J Ethnopharmacol 1995;49:157-62. 157. Teng CM, Kuo SC, Ko FN, Lee JC, Lee LG, Chen SC, Huang TF. Antiplatelet actions of panaxynol and ginsenosides isolated from ginseng. Biochim Biophys Acta 1989;990:315-20. 158. Kimura Y, Okuda H, Arichi S. Effects of various ginseng saponins on 5-hydroxytryptamine release and aggregation in human platelets. J Pharm Pharmacol 1988;40:838-43. 159. Park HJ, Lee JH, Song YB, Park KH. Effects of dietary supplementation of lipophilic fraction from Panax ginseng on cGMP and cAMP in rat platelets and on blood coagulation. Biol Pharm Bull 1996;19:1434-9. 160. Kuo SC, Teng CM, Lee JC, Ko FN, Chen SC, Wu TS. Antiplatelet components in Panax ginseng. Planta Med 1990;56:164-7. 161. Yun YP, Do JH, Ko SR, Ryu SY, Kim JH, Song HC, Park YD, Ahn KS, et al. Effects of Korean red ginseng and its mixed prescription on the high molecular weight dextran-induced blood stasis in rats and human platelet aggregation. J Ethnopharmacol 2001;77:259-64. 162. Cui JF, Bjorkhem I, Eneroth P. Gas chromatographic-mass spectrometric determination of 20(S)-protopanaxadiol and 20(S)-protopanaxatriol for study on human urinary excretion of ginsenosides after ingestion of ginseng preparations. J Chromatogr B Biomed Sci Appl 1997;689:349-55. 163. Shibata S. Chemistry and cancer preventing activities of ginseng saponins and some related triterpenoid compounds. J Korean Med Sci 2001;16:S28-37. 164. Xu QF, Fang XL, Chen DF. Pharmacokinetics and bioavailability of ginsenoside Rb1 and Rg1 from Panax notoginseng in rats. J Ethnopharmacol 2003;84:187-92. 165. Anderson GD, Rosito G, Mohustsy MA, Elmer GW. Drug interaction potential of soy extract and Panax ginseng. J Clin Pharmacol 2003;43:643-8. 166. Donovan JL, DeVane CL, Chavin KD, Taylor RM, Markowitz JS. Siberian Ginseng (Eleutheroccus senticosus) Effects on CYP2D6 and CYP3A4 Activity in Normal Volunteers. Drug Metab Dispos 2003;31:519-22.

References 226
167. Janetzky K, Morreale AP. Probable interaction between warfarin and ginseng. Am J Health Syst Pharm 1997;54:692-3. 168. Zhu M, Chan KW, Ng LS, Chang Q, Chang S, Li RC. Possible influences of ginseng on the pharmacokinetics and pharmacodynamics of warfarin in rats. J Pharm Pharmacol 1999;51:175-80. 169. Henderson GL, Harkey MR, Gershwin ME, Hackman RM, Stern JS, Stresser DM. Effects of ginseng components on c-DNA-expressed cytochrome P450 enzyme catalytic activity. Life Sci 1999;65:PL209-14. 170. Kim HJ, Chun YJ, Park JD, Kim SI, Roh JK, Jeong TC. Protection of rat liver microsomes against carbon tetrachloride-induced lipid peroxidation by red ginseng saponin through cytochrome P450 inhibition. Planta Med 1997;63:415-8. 171. Chang TK, Chen J, Benetton SA. In vitro effect of standardized ginseng extracts and individual ginsenosides on the catalytic activity of human CYP1A1, CYP1A2, and CYP1B1. Drug Metab Dispos 2002;30:378-84. 172. Folium Ginkgo. In: Pharmacopoeia of The People's Republic of China; 2000. p. 55. 173. McKenna DJ, Jones K, Hughes K. Efficacy, safety, and use of ginkgo biloba in clinical and preclinical applications. Altern Ther Health Med 2001;7:70-86, 88-90. 174. Ahlemeyer B, Krieglstein J. Neuroprotective effects of Ginkgo biloba extract. Cell Mol Life Sci 2003;60:1779-92. 175. Blumenthal M, Golberg, A. and Brinckman, J. Ginkgo. In: Herbal Medicine Expanded Commission E Monographs: Integrative Medicine Communications; 2000. p. 160-9. 176. Maclennan KM, Darlington CL, Smith PF. The CNS effects of Ginkgo biloba extracts and ginkgolide B. Prog Neurobiol 2002;67:235-57. 177. DeFeudis FV, Papadopoulos V, Drieu K. Ginkgo biloba extracts and cancer: a research area in its infancy Ginkgo biloba extract (EGb 761) and CNS functions: basic studies and clinical applications. Fundam Clin Pharmacol 2003;17:405-17. 178. DeFeudis FV, Drieu K. Ginkgo biloba extract (EGb 761) and CNS functions: basic studies and clinical applications. Curr Drug Targets 2000;1:25-58. 179. Cheung F, Siow YL, O K. Inhibition by ginkgolides and bilobalide of the production of nitric oxide in macrophages (THP-1) but not in endothelial cells (HUVEC). Biochem Pharmacol 2001;61:503-10. 180. Bastianetto S, Quirion R. EGb 761 is a neuroprotective agent against beta-amyloid toxicity. Cell Mol Biol 2002;48:693-7.
References 227
181. Hibatallah J, Carduner C, Poelman MC. In-vivo and in-vitro assessment of the free-radical-scavenger activity of Ginkgo flavone glycosides at high concentration. J Pharm Pharmacol 1999;51:1435-40. 182. Steinke B, Muller B, Wagner H. [Biological standardization of Ginkgo extracts]. Planta Med 1993;59:155-60. 183. Akiba S, Kawauchi T, Oka T, Hashizume T, Sato T. Inhibitory effect of the leaf extract of Ginkgo biloba L. on oxidative stress-induced platelet aggregation. Biochem Mol Biol Int 1998;46:1243-8. 184. Lamant V, Mauco G, Braquet P, Chap H, Douste-Blazy L. Inhibition of the metabolism of platelet activating factor (PAF-acether) by three specific antagonists from Ginkgo biloba. Biochem Pharmacol 1987;36:2749-52. 185. Nunez D, Chignard M, Korth R, Le Couedic JP, Norel X, Spinnewyn B, Braquet P, Benveniste J. Specific inhibition of PAF-acether-induced platelet activation by BN 52021 and comparison with the PAF-acether inhibitors kadsurenone and CV 3988. Eur J Pharmacol 1986;123:197-205. 186. Koltringer P, Eber O. [Collagen-induced thrombocyte aggregation in parenteral therapy using Ginkgo biloba]. Wien Med Wochenschr 1989;139:92-4. 187. Kudolo GB, Dorsey S, Blodgett J. Effect of the ingestion of Ginkgo biloba extract on platelet aggregation and urinary prostanoid excretion in healthy and Type 2 diabetic subjects. Thromb Res 2002;108:151-60. 188. Umegaki K, Saito K, Kubota Y, Sanada H, Yamada K, Shinozuka K. Ginkgo biloba Extract Markedly Induces Pentoxyresorufin O-Dealkylase Activity in Rats. Jpn J Pharmacol 2002;90:345-51. 189. Bal Dit Sollier C, Caplain H, Drouet L. No alteration in platelet function or coagulation induced by EGb761 in a controlled study. Clin Lab Haematol 2003;25:251-3. 190. Drago F, Floriddia ML, Cro M, Giuffrida S. Pharmacokinetics and bioavailability of a Ginkgo biloba extract. J Ocul Pharmacol Ther 2002;18:197-202. 191. Fourtillan JB, Brisson AM, Girault J, Ingrand I, Decourt JP, Drieu K, Jouenne P, Biber A. [Pharmacokinetic properties of Bilobalide and Ginkgolides A and B in healthy subjects after intravenous and oral administration of Ginkgo biloba extract (EGb 761)]. Therapie 1995;50:137-44. 192. Biber A. Pharmacokinetics of Ginkgo biloba extracts. Pharmacopsychiatry 2003;36:S32-7.

References 228
193. Mauro VF, Mauro LS, Kleshinski JF, Khuder SA, Wang Y, Erhardt PW. Impact of ginkgo biloba on the pharmacokinetics of digoxin. Am J Ther 2003;10:247-51. 194. Ohnishi N, Kusuhara M, Yoshioka M, Kuroda K, Soga A, Nishikawa F, Koishi T, Nakagawa M, et al. Studies on interactions between functional foods or dietary supplements and medicines. I.Effects of ginkgo biloba leaf extract on the pharmacokinetics of diltiazem in rats. Biol Pharm Bull 2003;26:1315-1320. 195. Meisel C, Johne A, Roots I. Fatal intracerebral mass bleeding associated with Ginkgo biloba and ibuprofen. Atherosclerosis 2003;167:367. 196. Shinozuka K, Umegaki K, Kubota Y, Tanaka N, Mizuno H, Yamauchi J, Nakamura K, Kunitomo M. Feeding of Ginkgo biloba extract (GBE) enhances gene expression of hepatic cytochrome P-450 and attenuates the hypotensive effect of nicardipine in rats. Life Sci 2002;70:2783-92. 197. Engelsen J, Nielsen JD, Hansen KF. [Effect of Coenzyme Q10 and Ginkgo biloba on warfarin dosage in patients on long-term warfarin treatment. A randomized, double-blind, placebo-controlled cross-over trial]. Ugeskr Laeger 2003;165:1868-71. 198. Ginger. In: British Pharmacopoeia; 2001. p. 792-3. 199. Blumenthal M, Golberg, A. and Brinckman, J. Ginger. In: Herbal Medicine Expanded Commission E Monographs: Integrative Medicine Communications; 2000. p. 153-9. 200. Afzal M, Al-Hadidi D, Menon M, Pesek J, Dhami MS. Ginger: an ethnomedical, chemical and pharmacological review. Drug Metabol Drug Interact 2001;18:159-90. 201. Koo KL, Ammit AJ, Tran VH, Duke CC, Roufogalis BD. Gingerols and related analogues inhibit arachidonic acid-induced human platelet serotonin release and aggregation. Thromb Res 2001;103:387-97. 202. Srivas KC. Effects of aqueous extracts of onion, garlic and ginger on platelet aggregation and metabolism of arachidonic acid in the blood vascular system: in vitro study. Prostaglandins Leukot Med 1984;13:227-35. 203. Srivastava KC. Isolation and effects of some ginger components of platelet aggregation and eicosanoid biosynthesis. Prostaglandins Leukot Med 1986;25:187-98. 204. Srivastava KC. Aqueous extracts of onion, garlic and ginger inhibit platelet aggregation and alter arachidonic acid metabolism. Biomed Biochim Acta 1984;43:S335-46.

References 229
205. Verma SK, Singh J, Khamesra R, Bordia A. Effect of ginger on platelet aggregation in man. Indian J Med Res 1993;98:240-2. 206. Bordia A, Verma SK, Srivastava KC. Effect of ginger (Zingiber officinale Rosc.) and fenugreek (Trigonella foenumgraecum L.) on blood lipids, blood sugar and platelet aggregation in patients with coronary artery disease. Prostaglandins Leukot Essent Fatty Acids 1997;56:379-84. 207. Weidner MS, Sigwart K. The safety of a ginger extract in the rat. J Ethnopharmacol 2000;73:513-20. 208. Lumb AB. Effect of dried ginger on human platelet function. Thromb Haemost 1994;71:110-1. 209. Ding GH, Naora K, Hayashibara M, Katagiri Y, Kano Y, Iwamoto K. Pharmacokinetics of [6]-gingerol after intravenous administration in rats. Chem Pharm Bull (Tokyo) 1991;39:1612-4. 210. Phillips S, Hutchinson S, Ruggier R. Zingiber officinale does not affect gastric emptying rate. A randomised, placebo-controlled, crossover trial. Anaesthesia 1993;48:393-5. 211. Banerjee S, Sharma R, Kale RK, Rao AR. Influence of certain essential oils on carcinogen-metabolizing enzymes and acid-soluble sulfhydryls in mouse liver. Nutr Cancer 1994;21:263-9. 212. Robertson P, Jr., Hellriegel ET, Arora S, Nelson M. Effect of modafinil at steady state on the single-dose pharmacokinetic profile of warfarin in healthy volunteers. J Clin Pharmacol 2002;42:205-14. 213. Brown PM, Hursting MJ. Lack of pharmacokinetic interactions between argatroban and warfarin. Am J Health Syst Pharm 2002;59:2078-83. 214. Donovan JM, Stypinski D, Stiles MR, Olson TA, Burke SK. Drug interactions with colesevelam hydrochloride, a novel, potent lipid-lowering agent. Cardiovasc Drugs Ther 2000;14:681-90. 215. Kwan D, Bartle WR, Walker SE. The effects of acetaminophen on pharmacokinetics and pharmacodynamics of warfarin. J Clin Pharmacol 1999;39:68-75. 216. Tiseo PJ, Foley K, Friedhoff LT. The effect of multiple doses of donepezil HCl on the pharmacokinetic and pharmacodynamic profile of warfarin. Br J Clin Pharmacol 1998;46:45-50. 217. Antila S, Jarvinen A, Honkanen T, Lehtonen L. Pharmacokinetic and pharmacodynamic interactions between the novel calcium sensitiser levosimendan and warfarin. Eur J Clin Pharmacol 2000;56:705-10.

References 230
218. Yates RA, Wong J, Seiberling M, Merz M, Marz W, Nauck M. The effect of anastrozole on the single-dose pharmacokinetics and anticoagulant activity of warfarin in healthy volunteers. Br J Clin Pharmacol 2001;51:429-35. 219. Rahimy M, Hallen B, Narang P. Effect of tolterodine on the anticoagulant actions and pharmacokinetics of single-dose warfarin in healthy volunteers. Arzneimittelforschung 2002;52:890-5. 220. Duursema L, Muller FO, Schall R, Middle MV, Hundt HK, Groenewoud G, Steinijans VW, Bliesath H. Lack of effect of pantoprazole on the pharmacodynamics and pharmacokinetics of warfarin. Br J Clin Pharmacol 1995;39:700-3. 221. Mallikaarjun S, Bramer SL. Effect of cilostazol on the pharmacokinetics and pharmacodynamics of warfarin. Clin Pharmacokinet 1999;37:79-86. 222. Priskorn M, Sidhu JS, Larsen F, Davis JD, Khan AZ, Rolan PE. Investigation of multiple dose citalopram on the pharmacokinetics and pharmacodynamics of racemic warfarin. Br J Clin Pharmacol 1997;44:199-202. 223. Toon S, Holt BL, Mullins FG, Bullingham R, Aarons L, Rowland M. Investigations into the potential effects of multiple dose ketorolac on the pharmacokinetics and pharmacodynamics of racemic warfarin. Br J Clin Pharmacol 1990;30:743-50. 224. Niopas I, Toon S, Rowland M. Further insight into the stereoselective interaction between warfarin and cimetidine in man. Br J Clin Pharmacol 1991;32:508-11. 225. Yisak W, von Bahr C, Farde L, Grind M, Mattila M, Ogenstad S. Drug interaction studies with remoxipride. Acta Psychiatr Scand Suppl 1990;358:58-62. 226. Stoysich AM, Lucas BD, Mohiuddin SM, Hilleman DE. Further elucidation of pharmacokinetic interaction between diltiazem and warfarin. Int J Clin Pharmacol Ther 1996;34:56-60. 227. Schall R, Muller FO, Hundt HK, Ritter W, Duursema L, Groenewoud G, Middle MV. No pharmacokinetic or pharmacodynamic interaction between rivastatin and warfarin. J Clin Pharmacol 1995;35:306-13. 228. Hitzenberger G, Sommer W, Grandt R. Influence of vinpocetine on warfarin-induced inhibition of coagulation. Int J Clin Pharmacol Ther Toxicol 1990;28:323-8. 229. Pitsiu M, Parker EM, Aarons L, Holt B, Rowland M. A comparison of the relative sensitivities of factor VII and prothrombin time measurements in detecting drug interactions with warfarin. Eur J Clin Pharmacol 1992;42:645-9.

References 231
230. Benedek IH, King SY, Powell RJ, Agra AM, Schary WL, Pieniaszek HJ, Jr. Effect of moricizine on the pharmacokinetics and pharmacodynamics of warfarin in healthy volunteers. J Clin Pharmacol 1992;32:558-63. 231. Schall R, Muller FO, Hundt HK, Duursema L, Groenewoud G, Middle MV. Study of the effect of miglitol on the pharmacokinetics and pharmacodynamics of warfarin in healthy males. Arzneimittelforschung 1996;46:41-6. 232. Liao S, Palmer M, Fowler C, Nayak RK. Absence of an effect of levofloxacin on warfarin pharmacokinetics and anticoagulation in male volunteers. J Clin Pharmacol 1996;36:1072-7. 233. Stangier J, Su CA, Hendriks MG, van Lier JJ, Sollie FA, Oosterhuis B, Jonkman JH. Steady-state pharmacodynamics and pharmacokinetics of warfarin in the presence and absence of telmisartan in healthy male volunteers. J Clin Pharmacol 2000;40:1331-7. 234. Anderson DM, Shelley S, Crick N, Buraglio M. No effect of the novel antidiabetic agent nateglinide on the pharmacokinetics and anticoagulant properties of warfarin in healthy volunteers. J Clin Pharmacol 2002;42:1358-65. 235. Zhi J, Melia AT, Guerciolini R, Koss-Twardy SG, Passe SM, Rakhit A, Sadowski JA. The effect of orlistat on the pharmacokinetics and pharmacodynamics of warfarin in healthy volunteers. J Clin Pharmacol 1996;36:659-66. 236. Rocci ML, Jr., Vlasses PH, Distlerath LM, Gregg MH, Wheeler SC, Zing W, Bjornsson TD. Norfloxacin does not alter warfarin's disposition or anticoagulant effect. J Clin Pharmacol 1990;30:728-32. 237. Kong AN, Tomasko L, Waldman SA, Osborne B, Deutsch PJ, Goldberg MR, Bjornsson TD. Losartan does not affect the pharmacokinetics and pharmacodynamics of warfarin. J Clin Pharmacol 1995;35:1008-15. 238. Van Hecken A, Depre M, Verbesselt R, Wynants K, De Lepeleire I, Arnout J, Wong PH, Freeman A, et al. Effect of montelukast on the pharmacokinetics and pharmacodynamics of warfarin in healthy volunteers. J Clin Pharmacol 1999;39:495-500. 239. Van Hecken A, Verbesselt R, Depre M, Tjandramaga TB, Angehrn J, Cawello W, De Schepper PJ. Moexipril does not alter the pharmacokinetics or pharmacodynamics of warfarin. Eur J Clin Pharmacol 1993;45:291-3. 240. Trenk D, Mohrke W, Warth L, Jahnchen E. Determination of the interaction of 3S-hydroxy-10,11-dihydroquinidine on the pharmacokinetics and pharmacodynamics of warfarin. Arzneimittelforschung 1993;43:836-41.

References 232
241. Apseloff G, Wilner KD, Gerber N. Effect of tenidap sodium on the pharmacodynamics and plasma protein binding of warfarin in healthy volunteers. Br J Clin Pharmacol 1995;39:29S-33S. 242. Naidong W, Lee JW. Development and validation of a high-performance liquid chromatographic method for the quantitation of warfarin enantiomers in human plasma. J Pharm Biomed Anal 1993;11:785-92. 243. Hirauchi K, Sakano T, Nagaoka T, Morimoto A. Simultaneous determination of vitamin K1, vitamin K1 2,3-epoxide and menaquinone-4 in human plasma by high-performance liquid chromatography with fluorimetric detection. J Chromatogr 1988;430:21-9. 244. Levy RJ, Lian JB. gamma-Carboxyglutamate excretion and warfarin therapy. Clin Pharmacol Ther 1979;25:562-70. 245. Israel DS, Stotka J, Rock W, Sintek CD, Kamada AK, Klein C, Swaim WR, Pluhar RE, et al. Effect of ciprofloxacin on the pharmacokinetics and pharmacodynamics of warfarin. Clin Infect Dis 1996;22:251-6. 246. Quick AJ. The prothrombin time in hemophilia and in obstructive jaundics. J Biol Chem 1935;109:73-74. 247. Poller L. Thromboplastin and oral anticoagulant control. Br J Haematol 1987;67:116-7. 248. Duxbury BM, Poller L. The oral anticoagulant saga: past, present, and future. Clin Appl Thromb Hemost 2001;7:269-75. 249. Nicholson NS, Panzer-Knodle SG, Haas NF, Taite BB, Szalony JA, Page JD, Feigen LP, Lansky DM, et al. Assessment of platelet function assays. Am Heart J 1998;135:S170-8. 250. Berkowitz SD, Frelinger AL, 3rd, Hillman RS. Progress in point-of-care laboratory testing for assessing platelet function. Am Heart J 1998;136:S51-65. 251. Mukherjee D, Moliterno DJ. Monitoring antiplatelet therapy: What is the best method? Clin Pharmacokinet 2000;39:445-58. 252. Cardinal DC, Flower RJ. The electronic aggregometer: a novel device for assessing platelet behavior in blood. J Pharmacol Methods 1980;3:135-58. 253. Mukherjee D, Moliterno DJ. Applications of anti-platelet monitoring in catheterization laboratory. J Thromb Thrombolysis 2000;9:293-301. 254. Banfield C, Rowland M. Stereospecific high-performance liquid chromatographic analysis of warfarin in plasma. J Pharm Sci 1983;72:921-4.
References 233
255. Banfield C, Rowland M. Stereospecific fluorescence high-performance liquid chromatographic analysis of warfarin and its metabolites in plasma and urine. J Pharm Sci 1984;73:1392-6. 256. Carter SR, Duke CC, Cutler DJ, Holder GM. Sensitive stereospecific assay of warfarin in plasma: reversed-phase high-performance liquid chromatographic separation using diastereoisomeric esters of (-)-(1S,2R,4R)-endo-1,4,5,6,7,7-hexachlorobicyclo[2.2.1]-hept-5- ene-2-carboxylic acid. J Chromatogr 1992;574:77-83. 257. Andersen C, Balmer K, Lagerstrom PO. Enantioselective assay of warfarin in blood plasma by liquid chromatography on Chiralcel OC. J Chromatogr 1993;615:159-63. 258. Takahashi H, Kashima T, Kimura S, Muramoto N, Nakahata H, Kubo S, Shimoyama Y, Kajiwara M, et al. Determination of unbound warfarin enantiomers in human plasma and 7-hydroxywarfarin in human urine by chiral stationary-phase liquid chromatography with ultraviolet or fluorescence and on-line circular dichroism detection. J Chromatogr B Biomed Sci Appl 1997;701:71-80. 259. McAleer SD, Chrystyn H, Foondun AS. Measurement of the (R)- and (S)-isomers of warfarin in patients undergoing anticoagulant therapy. Chirality 1992;4:488-93. 260. Chu YQ, Wainer IW. The measurement of warfarin enantiomers in serum using coupled achiral/chiral, high-performance liquid chromatography (HPLC). Pharm Res 1988;5:680-3. 261. Naidong W, Ring PR, Midtlien C, Jiang X. Development and validation of a sensitive and robust LC-tandem MS method for the analysis of warfarin enantiomers in human plasma. J Pharm Biomed Anal 2001;25:219-26. 262. Rolan PE. Plasma protein binding displacement interactions--why are they still regarded as clinically important? Br J Clin Pharmacol 1994;37:125-8. 263. Wright JD, Boudinot FD, Ujhelyi MR. Measurement and analysis of unbound drug concentrations. Clin Pharmacokinet 1996;30:445-62. 264. Pacifici GM, Viani A. Methods of determining plasma and tissue binding of drugs. Pharmacokinetic consequences. Clin Pharmacokinet 1992;23:449-68. 265. Banfield C, O'Reilly R, Chan E, Rowland M. Phenylbutazone-warfarin interaction in man: further stereochemical and metabolic considerations. Br J Clin Pharmacol 1983;16:669-75. 266. System ECotCMitH. Complementary medicines in the Australian Health System - Report to the Paliamentary Secretary to the Minister for Health and Ageing. In; 2003.

References 234
267. WHO Expert Committee on specifications for pharmaceutical preparations. World Health Organ Tech Rep Ser 1996;863:1-194. 268. Garrard J, Harms S, Eberly LE, Matiak A, Bergonzi MC, Bilia AR, Gallori S, Guerrini D, et al. Variability in the content of the constituents of Hypericum perforatum L. and some commercial extracts. Arch Intern Med 2003;163:2290-5. 269. Bergonzi MC, Bilia AR, Gallori S, Guerrini D, Vincieri FF. Variability in the content of the constituents of Hypericum perforatum L. and some commercial extracts. Drug Dev Ind Pharm 2001;27:491-7. 270. Wurglics M, Schubert-Zsilavecz M. [Charge conformity and biopharmaceutic characterization. St. John's Wort extract preparations in comparison]. Pharm Unserer Zeit 2003;32:236-41. 271. Kressmann S, Muller WE, Blume HH. Pharmaceutical quality of different Ginkgo biloba brands. J Pharm Pharmacol 2002;54:661-9. 272. Kressmann S, Biber A, Wonnemann M, Schug B, Blume HH, Muller WE. Influence of pharmaceutical quality on the bioavailability of active components from Ginkgo biloba preparations. J Pharm Pharmacol 2002;54:1507-14. 273. Hypericum. In: British Pharmacopoeia; 2001. p. 887-8. 274. Wurglics M, Westerhoff K, Kaunzinger A, Wilke A, Baumeister A, Dressman J, Schubert-Zsilavecz M. Comparison of German St. John's wort products according to hyperforin and total hypericin content. J Am Pharm Assoc (Wash) 2001;41:560-6. 275. Bilia AR, Bergonzi MC, Morgenni F, Mazzi G, Vincieri FF. Evaluation of chemical stability of St. John's wort commercial extract and some preparations. Int J Pharm 2001;213:199-208. 276. Westerhoff K, Kaunzinger A, Wurglics M, Dressman J, Schubert-Zsilavecz M. Biorelevant dissolution testing of St John's wort products. J Pharm Pharmacol 2002;54:1615-21. 277. Petrini O. [Clinical development of phytopharmaceuticals]. Wien Med Wochenschr 2002;152:204-8. 278. Jiang X, Williams KM, Liauw WS, Ammit AJ, Roufogalis BD, Duke CC, Day RO, McLachlan AJ. Effect of St John's wort and ginseng on the pharmacokinetics and pharmacodynamics of warfarin in healthy subjects. Br J Clin Pharmacol 2004;57:592-9. 279. Choi S, Jung S, Kim C, Kim H, Rhim H, Kim S, Nah S. Effect of ginsenosides on voltage-dependent Ca(2+) channel subtypes in bovine chromaffin cells. J Ethnopharmacol 2001;74:75-81.
References 235
280. Bauer S, Stormer E, Kerb R, Johne A, Brockmoller J, Roots I. Differential effects of Saint John's Wort (hypericum perforatum) on the urinary excretion of D-glucaric acid and 6beta-hydroxycortisol in healthy volunteers. Eur J Clin Pharmacol 2002;58:581-5. 281. Ngui JS, Chen Q, Shou M, Wang RW, Stearns RA, Baillie TA, Tang W. In vitro stimulation of warfarin metabolism by quinidine: increases in the formation of 4'- and 10-hydroxywarfarin. Drug Metab Dispos 2001;29:877-86. 282. Moore LB, Goodwin B, Jones SA, Wisely GB, Serabjit-Singh CJ, Willson TM, Collins JL, Kliewer SA. St. John's wort induces hepatic drug metabolism through activation of the pregnane X receptor. Proc Natl Acad Sci U S A 2000;97:7500-2. 283. Robertson GR, Field J, Goodwin B, Bierach S, Tran M, Lehnert A, Liddle C. Transgenic mouse models of human CYP3A4 gene regulation. Mol Pharmacol 2003;64:42-50. 284. Tawab MA, Bahr U, Karas M, Wurglics M, Schubert-Zsilavecz M. Degradation of ginsenosides in humans after oral administration. Drug Metab Dispos 2003;31:1065-71. 285. Birks J, Grimley EV, Van Dongen M. Ginkgo biloba for cognitive impairment and dementia. Cochrane Database Syst Rev 2002:CD003120. 286. Suekawa M, Yuasa K, Isono M, Sone H, Ikeya Y, Sakakibara I, Aburada M, Hosoya E. [Pharmacological studies on ginger. IV. Effect of (6)-shogaol on the arachidonic cascade]. Nippon Yakurigaku Zasshi 1986;88:263-9. 287. In Vivo Bioeqivalence Guidances. In: U.S. Pharmacopeia 23/National formulary 18; 1995. p. 1929-32. 288. Umegaki K, Shinozuka K, Watarai K, Takenaka H, Yoshimura M, Daohua P, Esashi T. Ginkgo biloba extract attenuates the development of hypertension in deoxycorticosterone acetate-salt hypertensive rats. Clin Exp Pharmacol Physiol 2000;27:277-82.

Appendices 236
Appendices
Appendix 1. ANOVA test of sequence, period and treatment effects on logCmax of S-warfarin in study I investigating the effect of St John’s wort and ginseng on warfarin.
Number of obs = 36 R-squared = 0.2388 Root MSE = .066307 Adj R-squared = 0.0813 Source | Partial SS df MS F Prob > F Model | 0.040000003 6 0.006666667 1.52 0.2080 Treatment | 0.004999994 2 0.002499997 0.57 0.5725 Period | 3.1580e-15 2 1.5790e-15 0.00 1.0000 Sequence | 0.035000009 2 0.017500004 3.98 0.0297 Residual | 0.127500023 29 0.004396553 Total | 0.167500026 35 0.004785715
Appendix 2. ANOVA test of sequence, period and treatment effects on logCmax of R-warfarin in study I investigating the effect of St John’s wort and ginseng on warfarin. Number of obs = 36 R-squared = 0.2044 Root MSE = .071719 Adj R-squared = 0.0398 Source | Partial SS df MS F Prob > F Model | 0.03833334 6 0.00638889 1.24 0.3143 Treatment | 0.011666676 2 0.005833338 1.13 0.3356 Period | 1.2632e-14 2 6.3159e-15 0.00 1.0000 Sequence | 0.026666663 2 0.013333332 2.59 0.0921 Residual | 0.149166684 29 0.005143679 Total | 0.187500024 35 0.005357144

Appendices 237
Appendix 3. ANOVA test of sequence, period and treatment effects on logAUC0-∞ of S-warfarin in study I investigating the effect of St John’s wort and ginseng on warfarin. Number of obs = 36 R-squared = 0.4140 Root MSE = .073826 Adj R-squared = 0.2928 Source | Partial SS df MS F Prob > F Model | 0.111666994 6 0.018611166 3.41 0.0113 Treatment | 0.107222537 2 0.053611268 9.84* 0.0005 Period | 0.002222229 2 0.001111114 0.20 0.8167 Sequence | 0.002222229 2 0.001111114 0.20 0.8167 Residual | 0.158055956 29 0.005450205 Total | 0.26972295 35 0.00770637
*p<0.05
Appendix 4. ANOVA test of sequence, period and treatment effects on logAUC0-∞ of R-warfarin in study I investigating the effect of St John’s wort and ginseng on warfarin. Number of obs = 36 R-squared = 0.2214 Root MSE = .100525 Adj R-squared = 0.0603 Source | Partial SS df MS F Prob > F Model | 0.083333206 6 0.013888868 1.37 0.2580 Treatment | 0.068888795 2 0.034444397 3.41 0.0468 Period | 0.010555517 2 0.005277758 0.52 0.5986 Sequence | 0.003888895 2 0.001944447 0.19 0.8260 Residual | 0.293055232 29 0.010105353 Total | 0.376388439 35 0.010753955

Appendices 238
Appendix 5. ANOVA test of sequence, period and treatment effects on logAUC0-168 of INR in study I investigating the effect of St John’s wort and ginseng on warfarin. Number of obs = 36 R-squared = 0.1574 Root MSE = .184816 Adj R-squared = -0.0170 Source | Partial SS df MS F Prob > F Model | 0.184999999 6 0.030833333 0.90 0.5065 Treatment | 0.142222205 2 0.071111103 2.08 0.1429 Period | 0.027222208 2 0.013611104 0.40 0.6750 Sequence | 0.015555585 2 0.007777793 0.23 0.7978 Residual | 0.990555452 29 0.034157085 Total | 1.17555545 35 0.033587299 .
Appendix 6. ANOVA test of sequence, period and treatment effects on logAUC0-∞ of S-warfarin in Study II investigating the effect of ginkgo and ginger on warfarin. Number of obs = 36 R-squared = 0.2745 Root MSE = .097035 Adj R-squared = 0.1244 Source | Partial SS df MS F Prob > F Model | 0.103333414 6 0.017222236 1.83 0.1281 Treatment | 0.008888925 2 0.004444462 0.47 0.6284 Period | 0.077222263 2 0.038611132 4.10 0.0270 Sequence | 0.017222226 2 0.008611113 0.91 0.4119 Residual | 0.27305601 29 0.009415724 Total | 0.376389424 35 0.010753984

Appendices 239
Appendix 7. ANOVA test of sequence, period and treatment effects on logAUC0-∞ of R-warfarin in study II investigating the effect of ginkgo and ginger on warfarin.
Number of obs = 36 R-squared = 0.1088 Root MSE = .106269 Adj R-squared = -0.0755 Source | Partial SS df MS F Prob > F Model | 0.039999924 6 0.006666654 0.59 0.7353 Treatment | 0.001666663 2 0.000833332 0.07 0.9290 Period | 0.011666644 2 0.005833322 0.52 0.6020 Sequence | 0.026666616 2 0.013333308 1.18 0.3214 Residual | 0.327499375 29 0.011293082 Total | 0.367499299 35 0.01049998
Appendix 8. ANOVA test of sequence, period and treatment effects on logCmax, of S-warfarin in study II investigating the effect of ginkgo and ginger on warfarin. Number of obs = 36 R-squared = 0.5205 Root MSE = .076314 Adj R-squared = 0.4213 Source | Partial SS df MS F Prob > F Model | 0.183333441 6 0.030555573 5.25 0.0009 Treatment | 0.003888895 2 0.001944447 0.33 0.7189 Period | 0.117222246 2 0.058611123 10.06* 0.0005 Sequence | 0.0622223 2 0.03111115 5.34* 0.0106 Residual | 0.168888973 29 0.005823758 Total | 0.352222414 35 0.010063498
*p<0.05

Appendices 240
Appendix 9. ANOVA test of sequence, period and treatment effects on logCmax of R-warfarin in study II investigating the effect of ginkgo and ginger on warfarin. Number of obs = 36 R-squared = 0.4961 Root MSE = .082988 Adj R-squared = 0.3919 Source | Partial SS df MS F Prob > F Model | 0.196666749 6 0.032777791 4.76 0.0017 Treatment | 0.007222234 2 0.003611117 0.52 0.5975 Period | 0.115555547 2 0.057777774 8.39* 0.0013 Sequence | 0.073888968 2 0.036944484 5.36* 0.0104 Residual | 0.199722319 29 0.006886977 Total | 0.396389068 35 0.011325402
*p<0.05
Appendix 10. ANOVA test of sequence, period and treatment effects on logAUC0-168 of INR in study II investigating the effect of ginkgo and ginger on warfarin. Number of obs = 36 R-squared = 0.3296 Root MSE = .174005 Adj R-squared = 0.1909 Source | Partial SS df MS F Prob > F Model | 0.431666714 6 0.071944452 2.38 0.0546 Treatment | 0.003888888 2 0.001944444 0.06 0.9379 Period | 0.037222233 2 0.018611117 0.61 0.5477 Sequence | 0.390555592 2 0.195277796 6.45* 0.0048 Residual | 0.878055759 29 0.030277785 Total | 1.30972247 35 0.037420642
*p<0.05

Appendices 241
Appendix 11. Study I plasma concentration – time profile for S-warfarin and R-warfarin and the PCA% -time (elapsing time – td) profile following a single oral dose of 25 mg rac-warfarin alone or with St John’s Wort (warfarin + St John’s Wort) or with ginseng (Warfarin + Ginseng). (, observed data for S-warfarin; , observed data for R-warfarin; —, model predicted data).
Subject 1
Time (hours)
0 50 100 150 200
PCA%
0
25
50
75
10001111 Warfarin Only
Time (hours)
0 50 100 150 200
Conc. (ng/m
l)
100
101
102
103
104
01111 Warfarin Only
Time (hours)
0 50 100 150 200
PCA%
0
25
50
75
10001121 Warfarin + St John's wort
Time (hours)
0 50 100 150 200
Conc. (ng/m
l)
100
101
102
103
104
01121 Warfarin + St John's Wort
Time (hours)
0 50 100 150 200
PC
A%
0
20
40
60
80
10001131 Warfarin + Ginseng
Time (hours)
0 50 100 150 200
Conc. (ng/m
l)
100
101
102
103
104
01131 Warfarin + Ginseng

Appendices 242
Subject 2
Time (hours)
0 50 100 150 200
PC
A%0
25
50
75
10002111 Warfarin Only
Time (hour)
0 50 100 150 200
Conc. (ng/m
l)
100
101
102
103
104
02111 Warfarin Only
Time (hour)
0 50 100 150 200
Conc. (ng/m
l)
100
101
102
103
104
02121 Warfarin + St Jhn's wort
Time (hours)
0 50 100 150 200
PC
A%
0
25
50
75
10002121 Warfarin + St John's wort
Time (hour)
0 50 100 150 200
Conc. (ng/m
l)
100
101
102
103
104
02131 Warfarin + Ginseng
Time (hour)
0 50 100 150 200
PC
A%
0
25
50
75
10002131 Warfarin + Ginseng

Appendices 243
Subject 3
Time (hour)
0 50 100 150 200
Conc. (ng/m
l)
100
101
102
103
104
03111 Warfarin Only
Time (hour)
0 50 100 150 200
Conc. (ng/m
l)
100
101
102
103
104
03121 Warfarin + St John's wort
Time (hour)
0 50 100 150 200
PC
A%
0
25
50
75
10003121 Warfarin + St John's wort
Time (hour)
0 50 100 150 200
Conc. (ng/m
l)
100
101
102
103
104
03131 Warfarin + Ginseng
Time (hour)
0 50 100 150 200
PC
A%
0
20
40
60
80
10003111 Warfarin Only
Time (hour)
0 50 100 150 200
PC
A%
0
20
40
60
80
10003131 Warfarin + Ginseng
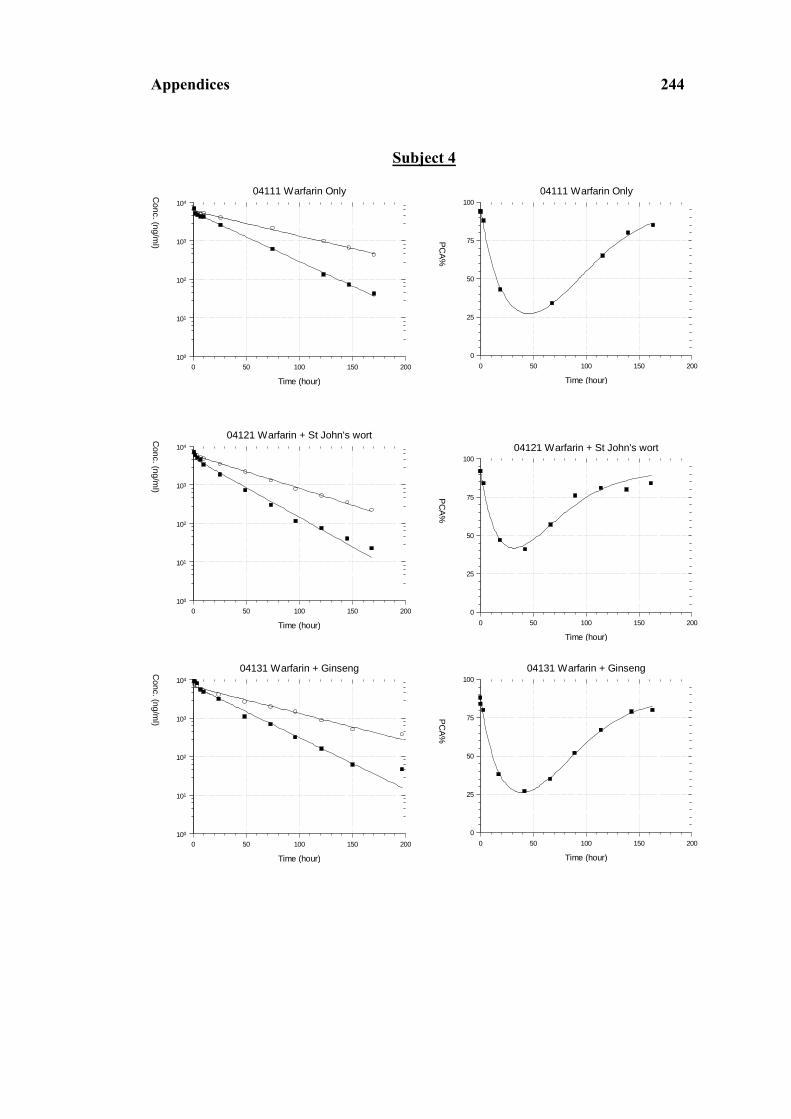
Appendices 244
Subject 4
Time (hour)
0 50 100 150 200
PCA%
0
25
50
75
10004111 Warfarin Only
Time (hour)
0 50 100 150 200
Conc. (ng/m
l)
100
101
102
103
104
04111 Warfarin Only
Time (hour)
0 50 100 150 200
PC
A%
0
25
50
75
10004121 Warfarin + St John's wort
Time (hour)
0 50 100 150 200
Conc. (ng/m
l)
100
101
102
103
104
04121 Warfarin + St John's wort
Time (hour)
0 50 100 150 200
PC
A%
0
25
50
75
10004131 Warfarin + Ginseng
Time (hour)
0 50 100 150 200
Conc. (ng/m
l)
100
101
102
103
104
04131 Warfarin + Ginseng

Appendices 245
Subject 5
Time (hour)
0 50 100 150 200
PC
A%0
25
50
75
10005311 Warfarin + Ginseng
Time (hour)
0 50 100 150 200
Conc. (ng/m
l)
100
101
102
103
104
05311 Warfarin + Ginseng
Time (hour)
0 50 100 150 200
PC
A%
0
25
50
75
10005321 Warfarin Only
Time (hour)
0 50 100 150 200C
onc. (ng/ml)
100
101
102
103
104
05321 Warfarin Only
Time (hour)
0 50 100 150 200
PC
A%
0
25
50
75
10005331 Warfarin + St John's wort
Time (hour)
0 50 100 150 200
Conc. (ng/m
l)
100
101
102
103
104
05331 Warfarin + St John's wort

Appendices 246
Subject 6
Time (hour)
0 50 100 150 200
PC
A%0
25
50
75
10006311 Warfarin + Ginseng
Time (hour)
0 50 100 150 200
Conc. (ng/m
l)
100
101
102
103
104
06311 Warfarin + Ginseng
Time (hour)
0 50 100 150 200
PC
A%
0
25
50
75
10006321 Warfarin Only
Time (hour)
0 50 100 150 200C
onc. (ng/ml)
100
101
102
103
104
06321 Warfarin Only
Time (hour)
0 50 100 150 200
PCA%
0
25
50
75
10006331 Warfarin + St John's wort
Time (hour)
0 50 100 150 200
Conc. (ng/m
l)
100
101
102
103
104
06331 Warfarin + St John's wort

Appendices 247
Subject 7
Time (hour)
0 50 100 150 200
PC
A%0
25
50
75
10007311 Warfarin + Ginseng
Time (hour)
0 50 100 150 200
Conc. (ng/m
l)
100
101
102
103
104
07311 Warfarin + Ginseng
Time (hour)
0 50 100 150 200
PC
A%
0
25
50
75
10007321 Warfarin Only
Time (hour)
0 50 100 150 200C
onc. (ng/ml)
100
101
102
103
104
07321 Warfarin Only
Time (hour)
0 50 100 150 200
PC
A%
0
25
50
75
10007331 Warfarin + St John's wort
Time (hour)
0 50 100 150 200
Conc. (ng/m
l)
100
101
102
103
104
07331 Warfarin + St John's wort

Appendices 248
Subject 8
Time (hour)
0 50 100 150 200
PC
A%0
25
50
75
10008311 Warfarin + Ginseng
Time (hour)
0 50 100 150 200
Conc. (ng/m
l)
100
101
102
103
104
08311 Warfarin + Ginseng
Time (hour)
0 50 100 150 200
PC
A%
0
25
50
75
10008321 Warfarin Only
Time (hour)
0 50 100 150 200
Conc. (ng/m
l)
100
101
102
103
104
08321 Warfarin Only
Time (hour)
0 50 100 150 200
PC
A%
0
25
50
75
10008331 Warfarin + St John's wort
Time (hour)
0 50 100 150 200
Conc. (ng/m
l)
100
101
102
103
104
08331 Warfarin + St John's wort

Appendices 249
Subject 9
Time (hour)
0 50 100 150 200
PC
A%0
25
50
75
10009211 Warfarin + St John's wort
Time (hour)
0 50 100 150 200
Conc. (ng/m
l)
100
101
102
103
104
09211 Warfarin + St John's wort
Time (hour)
0 50 100 150 200
PC
A%
0
25
50
75
10009221 Warfarin + Ginseng
Time (hour)
0 50 100 150 200
PC
A%
0
25
50
75
10009231 Warfarin Only
Time (hour)
0 50 100 150 200
Conc. (ng/m
l)
100
101
102
103
104
09221 Warfarin + Ginseng
Time (hour)
0 50 100 150 200
Conc. (ng/m
l)
100
101
102
103
104
09231 Warfarin Only
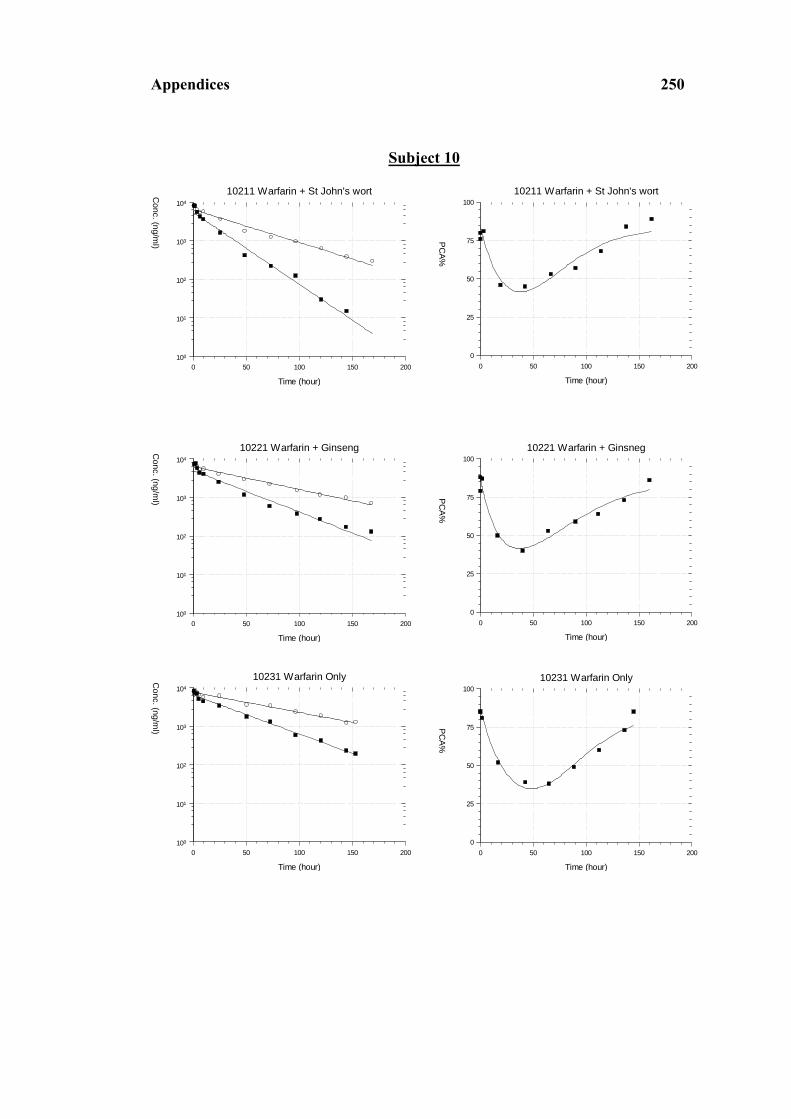
Appendices 250
Time (hour)
0 50 100 150 200
PC
A%
0
25
50
75
10010231 Warfarin Only
Subject 10
Time (hour)
0 50 100 150 200
PC
A%0
25
50
75
10010211 Warfarin + St John's wort
Time (hour)
0 50 100 150 200
Conc. (ng/m
l)
100
101
102
103
104
10211 Warfarin + St John's wort
Time (hour)
0 50 100 150 200
PC
A%
0
25
50
75
10010221 Warfarin + Ginsneg
Time (hour)
0 50 100 150 200C
onc. (ng/ml)
100
101
102
103
104
10221 Warfarin + Ginseng
Time (hour)
0 50 100 150 200
Conc. (ng/m
l)
100
101
102
103
104
10231 Warfarin Only

Appendices 251
Subject 11
Time (hour)
0 50 100 150 200
PC
A%
0
25
50
75
10011211 Warfarin + St John's wort
Time (hour)
0 50 100 150 200
Conc. (ng/m
l)
100
101
102
103
104
11211 Warfarin + St John's wort
Time (hour)
0 50 100 150 200
PC
A%
0
25
50
75
10011231 Warfarin Only
Time (hour)
0 50 100 150 200
Conc. (ng/m
l)
100
101
102
103
104
11231 Warfarin Only
Time (hour)
0 50 100 150 200
Conc. (ng/m
l)
100
101
102
103
104
11221 Warfarin + Ginseng
Time (hour)
0 50 100 150 200
PC
A%
0
20
40
60
80
10011221 Warfarin + Ginseng

Appendices 252
Subject 12
Time (hour)
0 50 100 150 200
PC
A%
0
25
50
75
10012211 Warfarin + St John's wort
Time (hour)
0 50 100 150 200
Conc. (ng/m
l)
100
101
102
103
104
12211 Warfarin + St John's wort
Time (hour)
0 50 100 150 200
PC
A%
0
25
50
75
10012221 Warfarin + Ginseng
Time (hour)
0 50 100 150 200C
onc. (ng/ml)
100
101
102
103
104
12221 Warfarin + Ginseng
Time (hour)
0 50 100 150 200
PC
A%
0
25
50
75
10012231 Warfarin Only
Time (hour)
0 50 100 150 200
Conc. (ng/m
l)
100
101
102
103
104
12231 Warfarin Only

Appendices 253
Appendix 12. Study II plasma concentration – time profile for S-warfarin and R-warfarin and the PCA% -time (elapsing time - td) profile following a single oral dose of 25 mg rac-warfarin alone or with ginkgo (Warfarin + Ginkgo) or with ginseng (Warfarin + Ginger) (, observed data for S-warfarin; , observed data for R-warfarin; —, model predicted data).
Subject 1
Time (hour)
0 50 100 150 200
PC
A%
0
20
40
60
80
10001112 Warfarin Only
Time (hour)
0 50 100 150 200
Conc. (ng/m
l)
100
101
102
103
104
01112 Warfarin Only
Time (hour)
0 50 100 150 200
PC
A%
0
20
40
60
80
10001122 Warfarin + Ginkgo
Time (hour)
0 50 100 150 200
Conc. (ng/m
l)
100
101
102
103
104
01122 Warfarin + Ginkgo
Time (hour)
0 50 100 150 200
PC
A%
0
20
40
60
80
10001132 Warfarin + Ginger
Time (hour)
0 50 100 150 200
Conc. (ng/m
l)
100
101
102
103
104
01132 Warfarin + Ginger

Appendices 254
Subject 2
Time (hour)
0 50 100 150 200
PC
A%
0
20
40
60
80
10002112 Warfarin Only
Time (hour)
0 50 100 150 200
Conc. (ng/m
l)
100
101
102
103
104
02112 Warfarin Only
Time (hour)
0 50 100 150
PC
A%
0
20
40
60
80
10002122 Warfarin + Ginkgo
Time (hour)
0 50 100 150 200C
onc. (ng/ml)
100
101
102
103
104
02122 Warfarin + Ginkgo
Time (hour)
0 50 100 150 200
PC
A%
0
20
40
60
80
10002132 Warfarin + Ginger
Time (hour)
0 50 100 150 200
Conc. (ng/m
l)
100
101
102
103
104
02132 Warfarin + Ginger

Appendices 255
Subject 3
Time (hour)
0 50 100 150 200
PC
A%
0
20
40
60
80
10003112 Warfarin Only
Time (hour)
0 50 100 150 200
Conc. (ng/m
l)
100
101
102
103
104
03112 Warfarin Only
Time (hour)
0 50 100 150
PC
A%
0
20
40
60
80
10003122 Warfarin + Ginkgo
Time (hour)
0 50 100 150 200C
onc. (ng/ml)
100
101
102
103
104
03122 WF + Ginkgo
Time (hour)
0 50 100 150
PC
A%
0
20
40
60
80
10003132 Warfarin + Ginger
Time (hour)
0 50 100 150 200
Conc. (ng/m
l)
100
101
102
103
104
03132 Warfarin + Ginger

Appendices 256
Subject 4
Time (hour)
0 50 100 150 200
PC
A%
0
20
40
60
80
10004112 Warfarin Only
Time (hour)
0 50 100 150 200
Conc. (ng/m
l)
100
101
102
103
104
04112 Warfarin Only
Time (hour)
0 50 100 150
PC
A%
0
20
40
60
80
10004122 Warfarin + Ginkgo
Time (hour)
0 50 100 150 200
Conc. (ng/m
l)
100
101
102
103
104
04122 Warfarin + Ginkgo
Time (hour)
0 50 100 150
PC
A%
0
20
40
60
80
10004132 Warfarin + Ginger
Time (hour)
0 50 100 150 200
Conc. (ng/m
l)
100
101
102
103
104
04132 Warfarin + Ginger

Appendices 257
Subject 5
Time (hour)
0 50 100 150 200
PC
A%0
20
40
60
80
10005212 Warfarin + Ginkgo
Time (hour)
0 50 100 150 200
Conc. (ng/m
l)
100
101
102
103
104
05212 Warfarin + Ginkgo
Time (hour)
0 50 100 150 200
PC
A%
0
20
40
60
80
10005222 Warfarin + Ginger
Time (hour)
0 50 100 150 200C
onc. (ng/ml)
100
101
102
103
104
05222 Warfarin + Ginger
Time (hour)
0 50 100 150 200
PC
A%
0
20
40
60
80
10005232 Warfarin Only
Time (hour)
0 50 100 150 200
Conc. (ng/m
l)
100
101
102
103
104
05232 Warfarin Only

Appendices 258
Subject 6
Time (hour)
0 50 100 150 200
PC
A%
0
20
40
60
80
10006212 Warfarin + Ginkgo
Time (hour)
0 50 100 150 200
Conc. (ng/m
l)
100
101
102
103
104
06212 Warfarin + Ginkgo
Time (hour)
0 50 100 150 200
PC
A%
0
20
40
60
80
10006222 Warfarin + Ginger
Time (hour)
0 50 100 150 200
Conc. (ng/m
l)
100
101
102
103
104
06222 Warfarin + Ginger
Time (hour)
0 50 100 150 200
PC
A%
0
20
40
60
80
10006232 Warfarin Only
Time (hour)
0 50 100 150 200
Conc. (ng/m
l)
100
101
102
103
104
06232 Warfarin Only
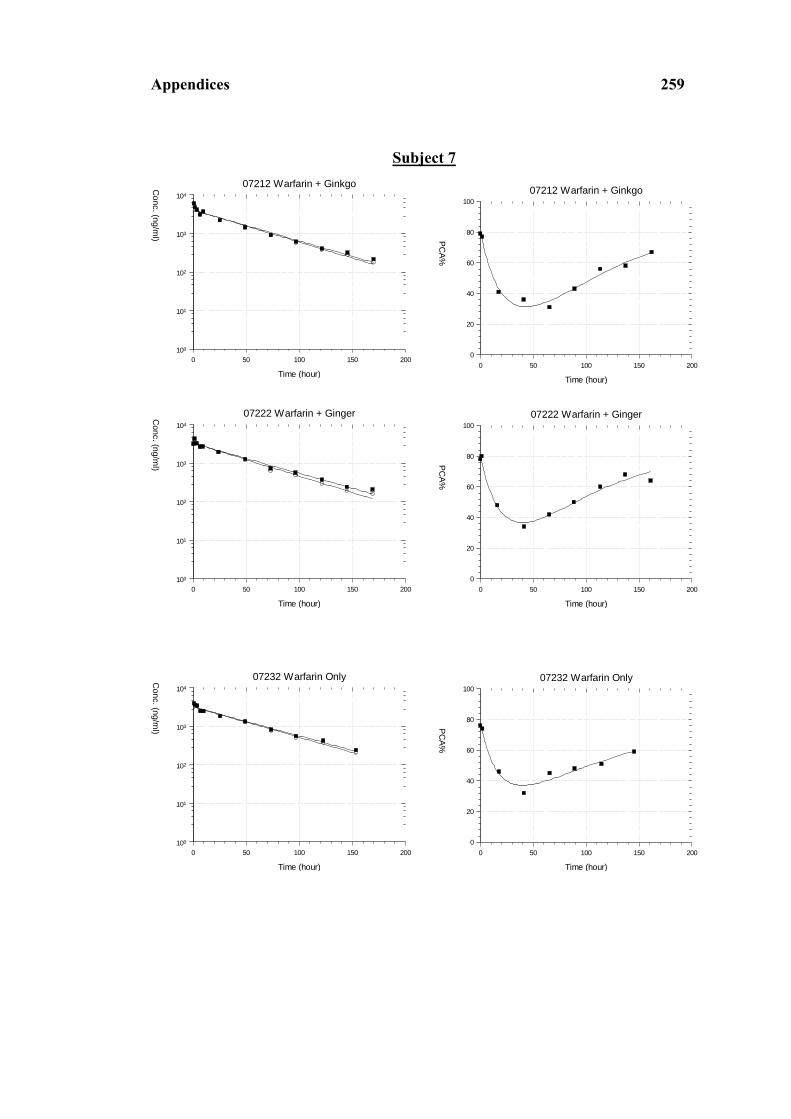
Appendices 259
Subject 7
Time (hour)
0 50 100 150 200
PC
A%0
20
40
60
80
10007212 Warfarin + Ginkgo
Time (hour)
0 50 100 150 200
Conc. (ng/m
l)
100
101
102
103
104
07212 Warfarin + Ginkgo
Time (hour)
0 50 100 150 200
PC
A%
0
20
40
60
80
10007222 Warfarin + Ginger
Time (hour)
0 50 100 150 200
Conc. (ng/m
l)
100
101
102
103
104
07222 Warfarin + Ginger
Time (hour)
0 50 100 150 200
PC
A%
0
20
40
60
80
10007232 Warfarin Only
Time (hour)
0 50 100 150 200
Conc. (ng/m
l)
100
101
102
103
104
07232 Warfarin Only

Appendices 260
Subject 8
Time (hour)
0 50 100 150 200
PC
A%
0
20
40
60
80
10008212 Warfarin + Ginkgo
Time (hour)
0 50 100 150 200
Conc. (ng/m
l)
100
101
102
103
104
08212 Warfarin + Ginkgo
Time (hour)
0 50 100 150 200
PC
A%
0
20
40
60
80
10008222 Warfarin + Ginger
Time (hour)
0 50 100 150 200
Conc. (ng/m
l)
100
101
102
103
104
08222 Warfarin+ Ginger
Time (hour)
0 50 100 150 200
PC
A%
0
20
40
60
80
10008232 Warfarin Only
Time (hour)
0 50 100 150 200
Conc. (ng/m
l)
100
101
102
103
104
08232 Warfarin Only

Appendices 261
Subject 9
Time (hour)
0 50 100 150 200
PC
A%
0
20
40
60
80
10009312 Warfarin + Ginger
Time (hour)
0 50 100 150 200
Conc. (ng/m
l)
100
101
102
103
104
09312 Warfarin + Ginger
Time (hour)
0 50 100 150 200
PC
A%
0
20
40
60
80
10009322 Warfarin Only
Time (hour)
0 50 100 150 200
Conc. (ng/m
l)
100
101
102
103
104
09322 Warfarin Only
Time (hour)
0 50 100 150 200
PC
A%
0
20
40
60
80
10009332 Warfarin + Ginkgo
Time (hour)
0 50 100 150 200
Conc. (ng/m
l)
100
101
102
103
104
09332 Warfarin + Ginkgo

Appendices 262
Subject 10
Time (hour)
0 50 100 150 200
PC
A%
0
20
40
60
80
10010312 Warfarin + Ginger
Time (hour)
0 50 100 150 200
Conc. (ng/m
l)
100
101
102
103
104
10312 Warfarin + Ginger
Time (hour)
0 50 100 150 200
PC
A%
0
20
40
60
80
10010322 Warfarin Only
Time (hour)
0 50 100 150 200
Conc. (ng/m
l)
100
101
102
103
104
10322 Warfarin Only
Time (hour)
0 50 100 150 200
PC
A%
0
20
40
60
80
10010332 Warfarin + Ginkgo
Time (hour)
0 50 100 150 200
Conc. (ng/m
l)
100
101
102
103
104
10332 Warfarin + Ginkgo

Appendices 263
Subject 11
Time (hour)
0 50 100 150 200
PC
A%
0
20
40
60
80
10011312 Warfarin + Ginger
Time (hour)
0 50 100 150 200
Conc. (ng/m
l)
100
101
102
103
104
11312 Warfarin + Ginger
Time (hour)
0 50 100 150 200
PC
A%
0
20
40
60
80
10011322 Warfarin Only
Time (hour)
0 50 100 150 200
Conc. (ng/m
l)
100
101
102
103
104
11322 Warfarin Only
Time (hour)
0 50 100 150 200
PC
A%
0
20
40
60
80
10011332 Warfarin + Ginkgo
Time (hour)
0 50 100 150 200
Conc. (ng/m
l)
100
101
102
103
104
11332 Warfarin + Ginkgo

Appendices 264
Subject 12
Time (hour)
0 50 100 150 200
PCA%
0
20
40
60
80
10012312 Warfarin + Ginger
Time (hour)
0 50 100 150 200
Conc. (ng/m
l)
100
101
102
103
104
12312 Warfarin + Ginger
Time (hour)
0 50 100 150 200
PC
A%
0
20
40
60
80
10012322 Warfarin Only
Time (hour)
0 50 100 150 200
Conc. (ng/m
l) 100
101
102
103
104
12322 Warfarin Only
Time (hour)
0 50 100 150 200
PC
A%
0
20
40
60
80
10012332 Warfarin + Ginkgo
Time (hour)
0 50 100 150 200
Conc. (ng/m
l)
100
101
102
103
104
12332 Warfarin + Ginkgo

Appendices 265
Appendix 13. Individual fraction of unbound (fu) warfarin in study I following administration a single oral 25 mg rac-warfarin (WF) alone, in combination with either St John’s wort (WF + SJW) or ginseng (WF + GS) (mean ± SD).
WF alone WF + SJW WF + GS Subject No fu of S-
warfarin fu of R-warfarin
fu of S-warfarin
fu of R-warfarin
fu of S-warfarin
fu of R-warfarin
1 0.004 0.004 0.003 0.003 0.005 0.004 2 0.004 0.005 0.004 0.005 0.005 0.005 3 0.004 0.005 0.005 0.005 0.005 0.006 4 0.005 0.005 0.004 0.004 0.004 0.004 5 0.004 0.005 0.004 0.005 0.004 0.005 6 0.003 0.004 0.004 0.004 0.002 0.004 7 0.002 0.004 0.002 0.005 0.003 0.004 8 0.003 0.005 0.003 0.005 0.002 0.004 9 0.003 0.005 0.004 0.006 0.003 0.005 10 0.005 0.004 0.005 0.004 0.005 0.004 11 0.002 0.005 0.004 0.004 0.007 0.004 12 0.002 0.006 0.002 0.006 0.002 0.006
Mean 0.003 0.005 0.004 0.005 0.004 0.005 SD 0.001 0.001 0.001 0.001 0.002 0.001
Appendix 14. Individual AUC0-∞ for warfarin in study I following administration a single oral 25 mg rac-warfarin (WF) alone, in combination with either St John’s wort (WF + SJW) or ginseng (WF + GS) (mean ± SD).
WF alone WF + SJW WF + GS Subject No AUC0-∞ of
S-warfarin (ng/ml×h)
AUC0-∞ of R-warfarin (ng/ml×h)
AUC0-∞ of S-warfarin (ng/ml×h)
AUC0-∞ of R-warfarin (ng/ml×h)
AUC0-∞ of S-warfarin (ng/ml×h)
AUC0-∞ of R-warfarin (ng/ml×h)
1 50900 101800 39500 82200 50300 93100 2 57100 88700 45100 80000 54500 83400 3 82500 165100 55900 113900 61400 121000 4 63500 129800 45300 93800 67300 121900 5 61400 100200 52200 76500 48000 96300 6 82500 120700 40200 58400 60007 90600 7 78000 107900 66000 99300 60500 94400 8 52400 142500 44800 104200 46300 126200 9 56700 89100 36200 77600 59700 96800 10 89200 202400 45400 104600 68000 148300 11 59300 95300 55400 97400 65000 119300 12 51400 107000 46400 104900 52000 105300
Mean 65400 120900 47700 91100 57800 108100 SD 13800 32900 8300 15400 7400 18300

Appendices 266
Appendix 15. Individual tmax for warfarin in study I following administration a single oral 25 mg rac-warfarin (WF) alone, in combination with either St John’s wort (WF + SJW) or ginseng (WF + GS) (mean ± SD).
WF alone WF + SJW WF + GS Subject No tmax of S-
warfarin (h)
tmax of R-warfarin
(h)
tmax of S-warfarin
(h)
tmax of R-warfarin
(h)
tmax of S-warfarin
(h)
tmax of R-warfarin
(h) 1 1.1 1.1 1.0 1.0 1.0 1.0 2 2.3 2.3 2.0 2.0 1.0 1.0 3 1.0 1.0 1.8 1.8 1.8 1.8 4 1.2 1.2 1.0 1.0 1.0 1.0 5 1.0 1.0 1.0 2.0 1.7 1.7 6 1.9 1.9 0.9 0.9 1.0 1.0 7 1.0 1.0 1.9 1.9 0.9 0.9 8 2.0 2.0 0.9 0.9 0.9 0.9 9 1.5 1.5 0.9 0.9 1.0 1.0 10 0.9 1.5 0.9 1.8 2.4 2.4 11 0.7 0.7 1.8 1.8 0.8 0.8 12 0.9 0.9 1.0 1.0 2.1 2.1
Mean 1.3 1.3 1.3 1.3 1.3 1.3 SD 0.5 0.5 0.5 0.5 0.6 0.5
Appendix 16. Individual Cmax for warfarin in study I following administration a single oral 25 mg rac-warfarin (WF) alone, in combination with either St John’s wort (WF + SJW) or ginseng (WF + GS) (mean ± SD).
WF alone WF + SJW WF + GS Subject No Cmax of S-
warfarin (ng/ml)
Cmax of R-warfarin (ng/ml)
Cmax of S-warfarin (ng/ml)
Cmax of R-warfarin (ng/ml)
Cmax of S-warfarin (ng/ml)
Cmax of R-warfarin (ng/ml)
1 1860 1750 1680 1720 1940 1880 2 1450 1480 1560 1680 2200 2110 3 2230 2370 1920 1980 2030 2100 4 1810 1850 1870 1820 2310 2020 5 1460 1420 1460 1410 1410 1450 6 2050 2360 1290 1240 1850 1740 7 1950 1860 1540 1660 1520 1470 8 1810 1890 2050 2020 2110 2110 9 1880 1900 1810 1800 1800 1740 10 2130 2250 2100 2180 1950 2040 11 2160 2000 2530 2670 2370 2330 12 1900 1820 2010 1960 1700 1700
Mean 1890 1920 1820 1840 1930 1890 SD 260 320 340 360 310 290

Appendices 267
Appendix 17. Individual t1/2 for warfarin in study I following administration a single oral 25 mg rac-warfarin (WF) alone, in combination with either St John’s wort (WF + SJW) or ginseng (WF + GS) (mean ± SD).
WF alone WF + SJW WF + GS Subject No t1/2 of S-
warfarin (h)
t1/2 of R-warfarin
(h)
t1/2 of S-warfarin
(h)
t1/2 of R-warfarin
(h)
t1/2 of S-warfarin
(h)
t1/2 of R-warfarin
(h) 1 26.0 47.1 23.6 39.8 27.0 42.5 2 30.5 42.0 25.6 37.7 25.2 37.7 3 34.3 64.8 24.6 41.7 25.6 46.5 4 27.3 54.6 24.5 41.8 26.7 50.6 5 36.7 52.1 26.5 36.9 41.5 56.8 6 37.3 40.3 27.6 38.7 26.0 37.9 7 36.7 51.3 35.9 47.8 34.5 51.3 8 26.3 58.2 20.8 41.5 25.5 51.3 9 29.5 43.9 28.8 42.5 27.3 41.3 10 36.9 70.7 20.4 43.0 35.0 63.0 11 31.5 40.8 22.7 32.5 30.0 42.5 12 26.9 54.6 20.7 40.3 25.7 53.3
Mean 31.7 51.7 25.1 40.3 29.2 47.9 SD 4.5 9.6 4.3 3.9 5.2 7.8
Appendix 18. Individual CL/F for warfarin in study I following administration a single oral 25 mg rac-warfarin (WF) alone, in combination with either St John’s wort (WF + SJW) or ginseng (WF + GS) (mean ± SD).
WF alone WF + SJW WF + GS Subject No CL/F of S-
warfarin (ml/h)
CL/F of R-warfarin (ml/h)
CL/F of S-warfarin (ml/h)
CL/F of R-warfarin (ml/h)
CL/F of S-warfarin (ml/h)
CL/F of R-warfarin (ml/h)
1 246 123 316 152 24 134 2 219 141 278 156 229 150 3 152 76 224 110 204 103 4 197 96 276 133 186 103 5 204 125 240 164 261 130 6 152 104 311 214 206 138 7 160 116 189 126 207 132 8 239 88 279 120 270 99 9 221 140 345 161 209 129 10 140 62 275 120 184 84 11 211 131 225 128 192 105 12 242 117 269 119 240 119
Mean 198 110 270 142 220 119 SD 38 25 44.0 29 29 20
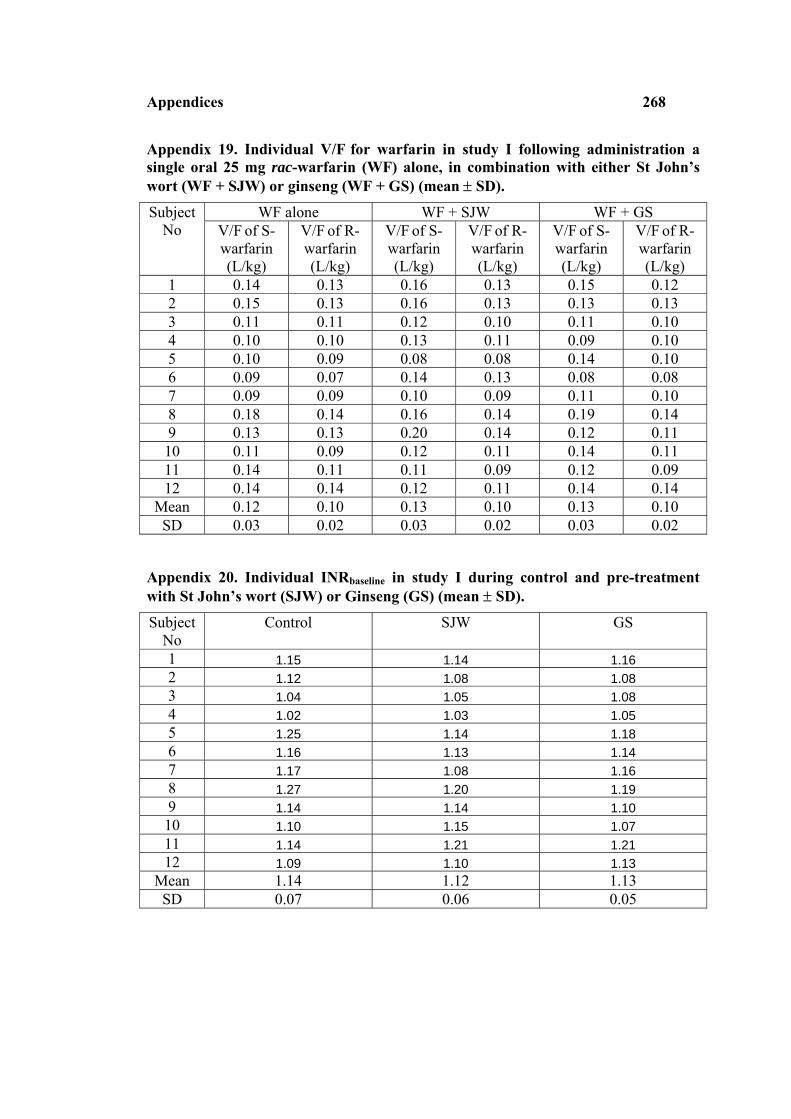
Appendices 268
Appendix 19. Individual V/F for warfarin in study I following administration a single oral 25 mg rac-warfarin (WF) alone, in combination with either St John’s wort (WF + SJW) or ginseng (WF + GS) (mean ± SD).
WF alone WF + SJW WF + GS Subject No V/F of S-
warfarin (L/kg)
V/F of R-warfarin (L/kg)
V/F of S-warfarin (L/kg)
V/F of R-warfarin (L/kg)
V/F of S-warfarin (L/kg)
V/F of R-warfarin (L/kg)
1 0.14 0.13 0.16 0.13 0.15 0.12 2 0.15 0.13 0.16 0.13 0.13 0.13 3 0.11 0.11 0.12 0.10 0.11 0.10 4 0.10 0.10 0.13 0.11 0.09 0.10 5 0.10 0.09 0.08 0.08 0.14 0.10 6 0.09 0.07 0.14 0.13 0.08 0.08 7 0.09 0.09 0.10 0.09 0.11 0.10 8 0.18 0.14 0.16 0.14 0.19 0.14 9 0.13 0.13 0.20 0.14 0.12 0.11 10 0.11 0.09 0.12 0.11 0.14 0.11 11 0.14 0.11 0.11 0.09 0.12 0.09 12 0.14 0.14 0.12 0.11 0.14 0.14
Mean 0.12 0.10 0.13 0.10 0.13 0.10 SD 0.03 0.02 0.03 0.02 0.03 0.02
Appendix 20. Individual INRbaseline in study I during control and pre-treatment with St John’s wort (SJW) or Ginseng (GS) (mean ± SD).
Subject No
Control SJW GS
1 1.15 1.14 1.16 2 1.12 1.08 1.08 3 1.04 1.05 1.08 4 1.02 1.03 1.05 5 1.25 1.14 1.18 6 1.16 1.13 1.14 7 1.17 1.08 1.16 8 1.27 1.20 1.19 9 1.14 1.14 1.10 10 1.10 1.15 1.07 11 1.14 1.21 1.21 12 1.09 1.10 1.13
Mean 1.14 1.12 1.13 SD 0.07 0.06 0.05

Appendices 269
Appendix 21. Individual AUC0-168 of INR for warfarin in study I following administration a single oral 25 mg rac-warfarin (WF) alone, in combination with either St John’s wort (WF + SJW) or ginseng (WF + GS) (mean ± SD).
Subject No
WF WF + SJW WF + GS
1 58.8 37.8 49.9 2 151.1 107.0 158.7 3 203.0 109.8 147.9 4 133.2 78.0 152.2 5 60.2 54.5 79.8 6 184.6 140.9 180.7 7 110.0 85.8 112.3 8 75.9 58.6 58.1 9 102.7 111.3 126.1 10 114.9 88.3 90.3 11 62.1 66.2 65.6 12 116.4 121.5 113.9
Mean 111.0 88.3 111.1 SD 49.3 30.7 43.1
Appendix 22. Individual tmax of INR for warfarin in study I following administration a single oral 25 mg rac-warfarin (WF) alone, in combination with either St John’s wort (WF + SJW) or ginseng (WF + GS) (mean ± SD).
Subject No
WF WF + SJW WF + GS
1 25.3 25.7 25.7 2 49.3 53.3 54.7 3 49.5 49.0 48.0 4 75.0 49.3 48.7 5 25.0 27.1 24.3 6 50.2 25.4 47.0 7 49.8 51.5 25.6 8 25.9 24.9 49.0 9 48.8 48.9 50.4 10 72.8 48.8 48.1 11 25.1 24.4 24.7 12 49.6 49.1 48.6
Mean 45.5 39.8 41.2 SD 17.4 12.7 12.1

Appendices 270
Appendix 23. Individual INRmax for warfarin in study I following administration a single oral 25 mg rac-warfarin (WF) alone, in combination with either St John’s wort (WF + SJW) or ginseng (WF + GS) (mean ± SD).
Subject No
WF WF + SJW WF + GS
1 1.6 1.6 1.6 2 3.2 2.6 3.5 3 3.5 2.3 3.3 4 2.6 2.2 3.2 5 1.7 1.6 2.0 6 3.8 3.1 3.9 7 1.7 2.2 2.5 8 2.0 2.0 1.7 9 3.0 2.8 3.2 10 2.3 2.0 2.0 11 1.6 1.9 1.9 12 2.2 2.7 2.4
Mean 2.4 2.2 2.6 SD 0.8 0.5 0.8
Appendix 24. Individual platelet aggregation for warfarin in study I during control, St John’s wort (SJW) or ginseng (GS) pre-treatment (mean ± SD).
Subject No
Control SJW GS
1* . . . 2 7.5 7.5 7.0 3 3.5 5.0 5.0 4 3.0 7.0 5.5 5 10.0 7.0 7.5 6 6.5 7.0 6.0 7 11.5 9.5 8.0 8 10.0 8.5 8.5 9 7.5 8.5 7.5 10 6.5 6.0 5.5 11 7.5 8.0 6.0 12 7.5 7.0 9.0
Mean 7.7 7.5 7.1 SD 2.2 1.1 1.4
* Not available

Appendices 271
Appendix 25. Individual fraction of unbound (fu) warfarin in study II following administration a single oral 25 mg rac-warfarin (WF) alone, in combination with either ginkgo (WF + Ginkgo) or ginger (WF + Ginger) (mean ± SD).
WF alone WF + Ginkgo WF + Ginger Subject No fu of S-
warfarin fu of R-warfarin
fu of S-warfarin
fu of R-warfarin
fu of S-warfarin
fu of R-warfarin
1 0.004 0.004 0.004 0.005 0.005 0.006 2 0.007 0.006 0.008 0.006 0.007 0.005 3 0.003 0.004 0.004 0.004 0.004 0.004 4 0.004 0.005 0.004 0.005 0.006 0.006 5 0.005 0.005 0.004 0.004 0.005 0.005 6 0.005 0.005 0.004 0.004 0.004 0.004 7 0.007 0.007 0.005 0.005 0.005 0.006 8 0.007 0.003 0.006 0.003 0.007 0.004 9 0.005 0.005 0.005 0.004 0.004 0.004 10 0.005 0.004 0.005 0.005 0.005 0.004 11 0.005 0.004 0.005 0.005 0.005 0.005 12 0.005 0.005 0.005 0.006 0.005 0.005
Mean 0.005 0.005 0.005 0.005 0.005 0.005 SD 0.001 0.001 0.001 0.001 0.001 0.001
Appendix 26. Individual AUC0-∞ for warfarin in study II following administration a single oral 25 mg rac-warfarin (WF) alone, in combination with either ginkgo (WF + Ginkgo) or ginger (WF + Ginger) (mean ± SD).
WF alone WF + Ginkgo WF + Ginger Subject No AUC0-∞ of
S-warfarin (ng/ml×h)
AUC0-∞ of R-warfarin (ng/ml×h)
AUC0-∞ of S-warfarin (ng/ml×h)
AUC0-∞ of R-warfarin (ng/ml×h)
AUC0-∞ of S-warfarin (ng/ml×h)
AUC0-∞ of R-warfarin (ng/ml×h)
1 72700 149300 61600 135300 60200 127800 2 70800 83700 63000 89900 52400 72800 3 74500 130300 56900 109900 63600 116800 4 71000 113700 55700 97000 46700 90800 5 82500 119300 93300 121300 86600 116000 6 52100 112700 54900 99500 47400 116700 7 64000 60700 72000 70600 62300 57300 8 86400 82300 101000 107600 74400 71600 9 73800 90900 76800 98900 114600 137100 10 62500 111900 55700 117700 67900 122700 11 56700 112100 49100 99600 62400 113100 12 49500 81800 49800 78700 54300 88400
Mean 68000 104000 65800 102200 66000 102600 SD 11400 24700 16800 18000 19000 25500

Appendices 272
Appendix 27. Individual tmax for warfarin in study II following administration a single oral 25 mg rac-warfarin (WF) alone, in combination with either ginkgo (WF + Ginkgo) or ginger (WF + Ginger) (mean ± SD).
WF alone WF + Ginkgo WF + Ginger Subject No tmax of S-
warfarin (h)
tmax of R-warfarin
(h)
tmax of S-warfarin
(h)
tmax of R-warfarin
(h)
tmax of S-warfarin
(h)
tmax of R-warfarin
(h) 1 1.9 1.9 1.2 1.2 2.0 2.0 2 1.9 1.9 1.9 1.9 1.0 1.0 3 1.0 1.0 1.1 1.1 1.0 1.0 4 2.1 2.1 1.0 1.0 1.0 1.0 5 3.5 3.5 1.0 1.0 0.7 0.7 6 1.2 1.2 0.8 0.8 3.8 3.8 7 1.0 1.0 1.0 1.0 1.5 1.5 8 2.0 2.0 1.0 1.0 1.7 1.7 9 1.2 1.2 0.9 0.9 1.2 1.2 10 1.1 1.1 1.9 1.9 2.0 2.0 11 4.0 4.0 3.7 6.9 2.1 2.1 12 3.9 3.9 1.0 1.0 1.1 1.1
Mean 2.1 2.1 1.4 1.6 1.6 1.6 SD 1.1 1.1 0.8 1.7 0.8 0.8
Appendix 28. Individual Cmax for warfarin in study II following administration a single oral 25 mg rac-warfarin (WF) alone, in combination with either ginkgo (WF + Ginkgo) or ginger (WF + Ginger) (mean ± SD).
WF alone WF + Ginkgo WF + Ginger Subject No Cmax of S-
warfarin (ng/ml)
Cmax of R-warfarin (ng/ml)
Cmax of S-warfarin (ng/ml)
Cmax of R-warfarin (ng/ml)
Cmax of S-warfarin (ng/ml)
Cmax of R-warfarin (ng/ml)
1 2500 2600 2300 2300 2000 2100 2 1800 1800 1500 1600 1600 1500 3 2200 2100 1600 1600 1600 1600 4 2400 2300 2200 2300 1800 1800 5 1400 1400 2100 2100 1700 1700 6 1700 1700 2100 2100 1300 1500 7 1100 1100 1600 1500 1200 1200 8 1500 1500 2000 1800 1200 1200 9 2000 2000 1900 1800 2600 2400 10 1700 1600 1500 1500 2100 2000 11 1300 1300 1000 1100 1500 1600 12 1300 1300 1500 1400 2000 1900
Mean 1700 1700 1800 1800 1700 1700 SD 500 500 400 400 400 400

Appendices 273
Appendix 29. Individual t1/2 for warfarin in study II following administration a single oral 25 mg rac-warfarin (WF) alone, in combination with either ginkgo (WF + Ginkgo) or ginger (WF + Ginger) (mean ± SD).
WF alone WF + Ginkgo WF + Ginger Subject No t1/2 of S-
warfarin (h)
t1/2 of R-warfarin
(h)
t1/2 of S-warfarin
(h)
t1/2 of R-warfarin
(h)
t1/2 of S-warfarin
(h)
t1/2 of R-warfarin
(h) 1 28.0 50.0 25.0 48.0 25.0 45.0 2 34.0 40.0 33.0 43.0 30.0 36.0 3 31.0 50.0 34.0 55.0 35.0 53.0 4 29.0 46.0 28.0 42.0 25.0 39.0 5 42.0 58.0 40.0 52.0 44.0 56.0 6 32.0 61.0 33.0 46.0 30.0 58.0 7 51.0 48.0 46.0 43.0 47.0 41.0 8 46.0 44.0 47.0 46.0 47.0 43.0 9 38.0 45.0 38.0 47.0 49.0 53.0 10 36.0 62.0 35.0 61.0 30.0 51.0 11 32.0 55.0 31.0 56.0 37.0 58.0 12 30.0 45.0 31.0 44.0 29.0 39.0
Mean 35.8 50.3 35.1 48.6 35.7 47.7 SD 7.2 7.1 6.7 6.1 8.9 8.0
Appendix 30. Individual CL/F for warfarin in study II following administration a single oral 25 mg rac-warfarin (WF) alone, in combination with either ginkgo (WF + Ginkgo) or ginger (WF + Ginger) (mean ± SD).
WF alone WF + Ginkgo WF + Ginger Subject No CL/F of S-
warfarin (ml/h)
CL/F of R-warfarin (ml/h)
CL/F of S-warfarin (ml/h)
CL/F of R-warfarin (ml/h)
CL/F of S-warfarin (ml/h)
CL/F of R-warfarin (ml/h)
1 172 84 203 92 208 98 2 177 149 198 139 239 172 3 168 96 220 114 197 107 4 176 110 224 129 268 138 5 151 105 134 103 144 108 6 240 111 228 126 264 107 7 195 206 174 177 201 218 8 145 152 124 116 168 175 9 170 138 163 126 109 91 10 200 112 225 106 184 102 11 220 112 254 125 200 111 12 253 153 251 159 230 141
Mean 188 127 200 126 201 131 SD 33 34 43 24 47 39

Appendices 274
Appendix 31. Individual V/F for warfarin in study II following administration a single oral 25 mg rac-warfarin (WF) alone, in combination with either ginkgo (WF + Ginkgo) or ginger (WF + Ginger) (mean ± SD).
WF alone WF + Ginkgo WF + Ginger Subject No V/F of S-
warfarin (L/kg)
V/F of R-warfarin (L/kg)
V/F of S-warfarin (L/kg)
V/F of R-warfarin (L/kg)
V/F of S-warfarin (L/kg)
V/F of R-warfarin (L/kg)
1 0.13 0.12 0.14 0.12 0.14 0.12 2 0.11 0.11 0.12 0.11 0.13 0.11 3 0.10 0.09 0.14 0.12 0.13 0.13 4 0.11 0.10 0.13 0.11 0.14 0.11 5 0.13 0.12 0.11 0.11 0.13 0.12 6 0.14 0.13 0.14 0.11 0.15 0.11 7 0.14 0.14 0.11 0.11 0.13 0.13 8 0.13 0.13 0.12 0.11 0.16 0.15 9 0.13 0.12 0.12 0.11 0.10 0.09 10 0.14 0.14 0.15 0.13 0.11 0.10 11 0.10 0.09 0.12 0.10 0.11 0.09 12 0.15 0.13 0.15 0.14 0.13 0.11
Mean 0.12 0.12 0.12 0.11 0.12 0.11 SD 0.02 0.02 0.01 0.01 0.02 0.02
Appendix 32. Individual INRbaseline for warfarin in study II during control, ginkgo or ginger pre-treatment (mean ± SD).
Subject No
Control Ginkgo Ginger
1 1.1 1.1 1.1 2 1.0 1.1 1.1 3 1.1 1.2 1.1 4 1.1 1.1 1.0 5 1.1 1.2 1.2 6 1.0 1.0 1.0 7 1.2 1.2 1.2 8 1.3 1.2 1.2 9 1.1 1.1 1.1 10 1.1 1.1 1.1 11 1.2 1.2 1.1 12 1.1 1.2 1.2
Mean 1.1 1.1 1.1 SD 0.1 0.1 0.1

Appendices 275
Appendix 33. Individual tmax of INR for warfarin in study II following administration a single oral 25 mg rac-warfarin (WF) alone, in combination with either ginkgo (WF + Ginkgo) or ginger (WF + Ginger) (mean ± SD).
Subject No
WF alone WF + Ginkgo WF + Ginger
1 48.9 24.1 25.5 2 49.7 25.6 25.9 3 49.4 50.4 49.9 4 49.5 51.0 50.8 5 50.9 72.2 48.3 6 28.6 48.3 48.1 7 49.2 73.3 49.3 8 49.4 49.3 48.9 9 26.2 31.0 25.7 10 48.7 25.5 49.7 11 49.0 48.3 49.0 12 48.8 49.3 48.7
Mean 45.7 45.7 43.3 SD 8.6 16.6 10.7
Appendix 34. Individual INRmax for warfarin in study II following administration a single oral 25 mg rac-warfarin (WF) alone, in combination with either ginkgo (WF + Ginkgo) or ginger (WF + Ginger) (mean ± SD).
Subject No
WF alone WF + Ginkgo WF + Ginger
1 2.04 1.86 1.86 2 1.87 1.70 1.59 3 3.19 2.80 2.70 4 2.45 2.18 2.80 5 3.65 4.27 3.80 6 2.27 2.47 2.82 7 2.73 2.79 2.54 8 2.96 3.01 2.27 9 2.02 1.79 2.21 10 1.85 1.67 2.99 11 2.99 3.33 2.95 12 2.53 2.47 2.99
Mean 2.60 2.50 2.60 SD 0.60 0.80 0.60

Appendices 276
Appendix 35. Individual AUC0-168 of INR for warfarin in study II following administration a single oral 25 mg rac-warfarin (WF) alone, in combination with either ginkgo (WF + Ginkgo) or ginger (WF + Ginger) (mean ± SD).
Subject No
WF alone WF + Ginkgo WF + Ginger
1 78.0 70.0 74.0 2 67.0 47.0 52.0 3 161.0 119.0 143.0 4 123.0 90.0 107.0 5 248.0 297.0 267.0 6 97.0 108.0 121.0 7 139.0 163.0 130.0 8 151.0 167.0 129.0 9 70.0 61.0 83.0 10 74.0 59.0 97.0 11 172.0 155.0 165.0 12 108.0 114.0 137.0
Mean 124.0 121.0 125.0 SD 54.0 69.0 55.0
Appendix 36. Individual baseline platelet aggregation for warfarin in study II during control, ginkgo or ginger pre-treatment (mean ± SD).
Subject No
Control Ginkgo Ginger
1 7.5 8.0 7.0 2 5.5 7.5 8.0 3 5.5 8.5 8.0 4 6.0 9.0 7.5 5 7.5 9.0 7.5 6 7.5 8.0 9.0 7 7.5 10.5 9.5 8 7.5 8.0 6.5 9 7.0 7.5 9.5 10 11.0 11.0 8.0 11 8.5 6.5 8.5 12 8.5 7.5 8.0
Mean 7.5 8.4 8.1 SD 1.5 1.3 0.9