effect of image size and compression on one-to-one
TRANSCRIPT

NISTIR 7201
Effect of Image Size and Compression on One-to-One Fingerprint Matching
Craig WatsonCharles Wilson

NISTIR 7201
Effect of Image Size and Compression on One-to-One Fingerprint Matching
Craig WatsonCharles Wilson
Information Technology LaboratoryInformation Access Division
February 2005
U.S. DEPARTMENT OF COMMERCECarlos M. Gutierrez, Secretary
TECHNOLOGY ADMINISTRATIONMichelle O’Neill, Acting Under Secretary of Commerce for Technology
NATIONAL INSTITUTE OF STANDARDS AND TECHNOLOGYWilliam A. Jeffrey, Director

Effect of Image Size and Compression on One-to-One Fingerprint Matching
Craig Watson and Charles Wilson
National Institute of Standards and Technology
Abstract
NIST has conducted testing of one-to-one fingerprint matching systems to evaluate the effect of image size and compression on the accuracy of the one-to-one matching process. Images from three live-scan fingerprint scanners collected by the Departments of State and Homeland Security were used as test samples. Image sizes from 368 pixels by 368 pixels down to 180 pixels by 180 pixels were tested and compression ratios from no compression up to 30:1 were tested. Three commercial fingerprint-matching systems were used in the test. The results of the study show that image cropping quickly degrade matcher performance. Compression degrades matcher performance more slowly and may increase performance for compression ratios of up to 15:1. The conclusion from this study is that Image sizes below 320 pixels by 320 pixels should not be used. Image compression in the range up 20:1 produces minimal negative effects on fingerprint matching accuracy.
2

Introduction
On February 4, 2003 a report titled “Use of Technology Standards and Interoperable Databases With Machine-Readable, Tamper-Resistant Travel Documents” [1] was submitted to the Congress jointly by the Attorney General, Secretary of State, Department of Homeland Security and NIST . (This report is informally referred to as the 303A Report and was mandated by [2] and [3]). It discusses measurements of the accuracy of both face and fingerprints as they relate to U.S. border entry and exit. This study is part of the work undertaken under the Patriot Act to measure the one-to-one accuracy of fingerprint matching systems using fingerprint images of different sizes and varying amount of image compression. The effect of image size and compression ratio on fingerprint matching accuracy is important because it determines the amount of memory and bandwidth needed for biometrically enabled travel documents. The results of the one-to-one fingerprint-matching tests performed at NIST using vendor supplied SDK libraries are discussed in [4]. The matching systems used in [4] were supplied by several vendors including all highly ranked vendors in the FpVTE fingerprint test [5]. This report contains results from three different vendors including the vendor currently used in the US-VISIT system. This test used data that was randomly selected from the DOS-C, POE, and NIST SD29 datasets. These different datasets are discussed below or in references [4,6]. Test Design
The goal of this test was to determine the smallest compressed fingerprint image size that could be used to provide satisfactory matching accuracy. The maximum size of the images obtained from fingerprint scanners for single finger live scan was 368 by 368 pixels.These images were centered and cropped using software based on the NFIS [7] package. The cropped image sizes used, in pixels, were 320 by 320, 280 by 280, 200 by 200 and 180 by 180. One set of cropped images was used in the test without compression. Other sets of cropped images were compressed using the WSQ (Wavelet Scalar Compression) implementation from [7] at ratios of 15, 20, 25, and 30 to one.
The criteria used to evaluate matching accuracy is the TAR (True Accept Rate) at a fixed
FAR (False Accept Rate) of 0.001. This is near the current operating point of the US-VISIT system and is therefore reasonable for BioVisa applications. The criterion used in selecting acceptable image size and compression ratio was a reduction in TAR of 0.01. This reduction is comparable to the reductions seen from other expected fluctuations in image quality for good quality images. Sufficient data is included in the appendices for the evaluation of the effects of image size and compression at other operating points.
3

Testing
Three SDK matchers were used in these tests. The matchers used were F, H, and J1 from
reference [4]. All testing was performed by NIST staff on NIST owned computers. The systems used for testing were dual-processor (3 GHz) PCs running windows 20001. This allowed the SDK to run on several different datasets in parallel. All results were scored with the software package used in the VTB report [6].
Evaluation Data The fingerprint datasets used to evaluate the one-to-one matchers included plain fingerprints
from inked paper and live-scan devices. The data is from several sources: Department of State (DOS-C), Department of Homeland Security (VISIT_POE), and NIST Special Database 29 (SD29). SD29 is the only database available to the public.
Random samples of 6,000 subjects were selected from the larger datasets (DOS-C, and POE).
All the subjects that did not have segmentation problems were used in the smaller dataset (SD29). The datasets were consolidated to find previously unknown mates and presumed mates that were not actual mates. Consolidation used the output of various matches to help identify potential errors and then human experts examined those fingerprints to make a final determination. The human experts are fingerprint examiners with over twenty years of experience. Since DHS2-C was consolidated after testing had started, the final dataset size after consolidation was only 5,888 not 6,000. The images in SD29 was all segmented with the NIST segmentor as discussed in the VTB report [4]. The details of the consolidation process are given in [8].
DOS-C contains live-scan plain impressions of the left and right index fingers. They were captured in an operational office environment. DOS-C fingerprints should give results typical of real time data of plain to plain (P2P) impression matching. SD29 contained ten-print card mates of inked paper segmented plain and rolled impressions (P2P, R2R, P2R). The dataset is from legacy inked paper data. The VISIT_POE data set was captured under operational condition at POE (Points of Entry) from travelers entering the US under the VISIT program. The fingerprints used in this study were primarily captured at airports.
1 These tests were performed for the Department of Homeland Security in accordance with section 303 of the Border Security Act, codified at 8 U.S.C. 1732. Specific hardware and software products identified in this report were used in order to adequately support the development of technology to conduct the performance evaluations described in this document. In no case does such identification imply recommendation or endorsement by the National Institute of Standards and Technology, nor does it imply that the products and equipment identified are necessarily the best available for the purpose.
4

Department of State Mexican Visa Database (DOS-C)
Department of State Mexican Visa Database (DOS-C) Description
DOS Mexican Visa cases Environment: Mexican Consulates offices
Number of Subjects ~274,000 (of 288,000) ~6 million Background
Instances per Subject Minimum of 2 cases per person, where each case contains one right index impression and one left index impression.
Impression Type Live-scan Plain
Finger Positions Captured Right and left index fingers
Capture Device(s) DFR-90
Availability Government use only
Data Preparation Include clean up steps – e.g. mate validation and mismatch detection. [8]
NIST Special Database 29 (SD29)
NIST Special Database 29 (SD29) Description
FBI Deceased Criminal File Number of Subjects
216 Instances per Subject
2 fingerprint cards per person Impression Type
Inked Rolled & Plain
Finger Positions Captured 10 finger positions segmented from rolled impressions on 10-print card, and 10 additional finger positions segmented from four-finger plain impressions on same 10-print card
Capture Device(s) UMAX PowerLook III flatbed scanner
Availability Public
Data Preparation Segmentation failures of the four-finger plain impressions were manually inspected and corrected to enable maximum yield
5

U.S. VISIT Point of Entry Data (VISIT_POE)
U.S. VISIT Point of Entry Data (VISIT_POE) Description
Data from U.S. VISIT captured from persons entering the U.S. at airport points of entry.
Number of Subjects
~1.3 Million with one instance
~106K with 2 or more instances
Instances per Subject One to many cases per person, with each case containing one right index finger impression and one left index finger impression.
Impression Type Live-scan Plain
Finger Positions Captured Right and Left Index
Capture Device(s) Cross Match 300A
Availability Government use only
Data Preparation All cases used in the report were consolidated using matchers and human examiners.
Results
Appendix A, B, and C each contains 20 sets of ROC plots for each of the F, H, and J SDKs
used in the test. The first test conducted was an analysis of the effect of image cropping on DOS-C images that were compressed at a ratio 15:1. All images were cropped using software from [7]. The results of this experiment are summarized in table 1. Similar results for US-VISIT_POE and SD29 are shown in tables 2 and 3. In all cases full ROC results are given in Appendix A. Greater weight should be given to POE and DOS-C data in these experiments since the images in these samples are acquired from live scan devices under operational conditions. The images in SD29 are from scanned paper and are introduced because this dataset in was the only uncompressed data available for test.
6

In all three tables the maximum TAR for 368 pixel images is a strong function of the image
quality of the data set. POE data has the best image quality followed by DOS-C. The effect of image quality on matcher performance is discussed in detail in [9]. SD29 has the worst image quality. If a criteria of a 0.01 drop in TAR at a FAR of 0.001 is applied to both right and left index fingers, image sizes below 320 pixels can not be allowed. The drop of 0.022 in right finger SD29 TAR is discounted in reaching this conclusion because of the small sample size and relatively poor image quality. These tables also show that even with a high quality commercial fingerprint matcher such as SDK-F small images such as the 180 pixel images would result in a 0.144 reduction in TAR which would place the fingerprint matching results far outside the required performance needed for most applications.
Image Size Right finger
Left finger
368 0.986 0.969 320 0.981 0.959 280 0.972 0.944 200 0.839 0.764 180 0.762 0.688
Table 1: TARs at FAR of 0.001 for DOS-C right and left index fingers as a function of center cropped image size. All images were compressed at 15:1.
Image Size Right finger
Left finger
368 0.993 0.986 320 0.990 0.982 280 0.985 0.977 200 0.908 0.888 180 0.847 0.832
Table 2: TARs at FAR of 0.001 for POE right and left index fingers as a function of center cropped image size. All images were compressed at 15:1.
Image Size Right finger
Left finger
368 0.959 0.963 320 0.937 0.968 280 0.940 0.947 200 0.696 0.708 180 0.650 0.644
Table 3: TARs at FAR of 0.001 for SD29 right and left index fingers as a function of center cropped image size. All images were compressed at 15:1.
7

The effects of different compression ratios are shown for 320 pixel and 368 pixel images in tables 4 and 5 for US-VISIT POE images. The effect of compression ratios for SD29 data are shown in tables 6 and 7. As above the SDK-F matcher was used for all tests. In all cases full ROC results are given in Appendix A. It must be noted that compression ratios greater than 16:1 in tables 4 and 5 were calculated by decompressing data which had been compressed (~15:1) at original capture and recompressing at 20:1` and 25:1. This accounts for at least part of change in TAR between the 15:1 and 20:1 lines in these tables.
Compression
Ratio Right finger Left finger
15 0.990 0.982 20 0.983 0.972 25 0.978 0.970
Table 4: TARs at FAR of 0.001 for right and left index fingers as a function of image compression ratio for 320 pixel images from the POE data set.
Compression Ratio
Right finger Left finger
15 0.993 0.986 20 0.988 0.979 25 0.985 0.979 30 0.982 0.975
Table 5: TARs at FAR of 0.001 for right and left index fingers as a function of image compression ratio 368 pixel images from the POE data set.
.
Compression Ratio
Right finger Left finger
00 0.947 0.964 15 0.959 0.963 20 0.954 0.974 25 0.963 0.968 30 0.944 0.957
Table 6: TARs at FAR of 0.001 for right and left index fingers as a function of image compression ratio 368 pixel images from the SD29 data set.
8

.
Compression Ratio
Right finger Left finger
00 0.949 0.957 15 0.937 0.968 20 0.935 0.963 25 0.932 0.956 30 0.929 0.942
Table 7: TARs at FAR of 0.001 for right and left index fingers as a function of image compression ratio 320 pixel images from the SD29 data set. When SD29 results are examined, a rise in TAR between uncompressed data and 15:1 compressed data is seen for both 368 pixel right finger and 320 pixel left fingerprint images. This is a common effect widely observed in fingerprint matching experiments. This effect is due to the fact that the WSQ algorithm used in fingerprint compression reduces the high frequency noise in the image and improves matcher performance. These tables show that compression beyond 20:1 will cause the decrease in TAR to exceed the specified value of 0.01.The degradation in performance with compression is much less abrupt than that caused by reducing image size.
.
Conclusions The results of the study show that image cropping quickly degrades matcher performance. Compression degrades matcher performance more slowly and may, for compression ratios of up to 15:1, increase performance. Image sizes below 320 pixels by 320 pixels should not be used due to poor matching performance. Image compression in the range up 20:1 produces minimal effects on fingerprint matching accuracy. In size critical applications, increasing compression will have less impact on matcher performance than decreasing image size.
9

References
[1] “Summary of NIST Standards for Biometric Accuracy, Tamper Resistance, and Interoperability,” PDF document at http://www.itl.nist.gov/iaui/894.03/fing/fing.html, November 2002.
[2] Public Law 107-56 (USA PATRIOT ACT); 107th United States Congress, Washington, D.C.; 26 October 2001
[3] Public Law 107-173 (Enhanced Border Security and Visa Entry Reform Act of 2002); 107th United States Congress, Washington, D.C.; 14 May 2002
[4] C. Watson, A. Wilson, K. Marshall, M. Indovina, R. Snelick. “Studies of one-to-one fingerprint matching with vendor SDK matchers,” NISTIR 7119 at http://fingerprint.nist.gov/SDK/ir_7119.pdf
[5] Charles Wilson, R. Austin Hicklin, Harold Korves, Bradford Ulery, Melissa Zoepfl, Mike Bone, Patrick Grother, Ross Micheals, Steve Otto, and Craig Watson,“Fingerprint Vendor Technology Evaluation 2003,” NISTIR 7123, June 2004 at http://fpvte.nist.gov/report/ir_7123_summary.pdf
[6] C L Wilson, C I Watson, M D Garris, A Hicklin; “Studies of Fingerprint Matching Using the NIST Verification Test Bed (VTB)” NIST IR 7020; National Institute of Standards and Technology; Gaithersburg Maryland , 07 July 2003 at ftp://sequoyah.nist.gov/pub/nist_internal_reports/ir_7020.pdf
[7] M.D. Garris, C.I. Watson, R.M. McCabe, C.L. Wilson. “User’s guide to NIST fingerprint image software.” NISTIR 6813. http://fingerprint.nist.gov/NFIS
[8] C. L. Wilson, M.D. Garris, C.I. Watson. “Matching performance for the US-VISIT IDENT system using flat fingerprints, NIST IR 7110”, May 2004 at http://www.itl.nist.gov/iad/894.03/pact/pact.html
[9] E. Tabassi, C. L. Wilson, and C. I. Watson, “Fingerprint Image Quality” NIST IR 7152, August 2004, at ftp://sequoyah.nist.gov/pub/nist_internal_reports/ir_7151/ir_7151.pdf .
10

APPENDIX A: ROC CURVES FOR MATCHER F
Figure F1: ROC plots for POE left index fingers using 15:1 compression for different image sizes.
Figure F2: ROC plots for POE right index fingers using 15:1 compression for different image sizes.
A-1

Figure F3: ROC plots for POE left index fingers using 320 by 320 images at different compressions ratios.
Figure F4: ROC plots for POE right index fingers using 368 by 368 images at different compressions ratios.
A-2
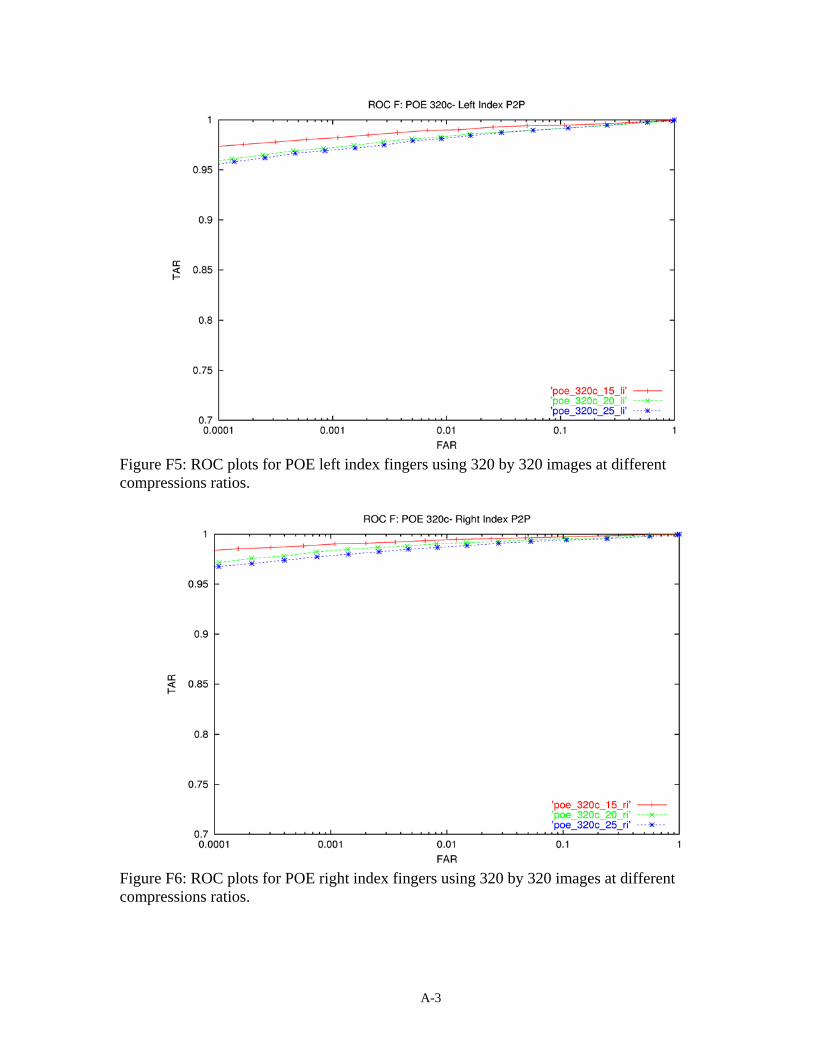
Figure F5: ROC plots for POE left index fingers using 320 by 320 images at different compressions ratios.
Figure F6: ROC plots for POE right index fingers using 320 by 320 images at different compressions ratios.
A-3

Figure F7: ROC plots for SD29 left index fingers using different image sizes for uncompressed data.
Figure F8: ROC plots for SD29 right index fingers using different images sizes and no compression.
A-4

Figure F9: ROC plots for SD29 left index fingers using different images sizes and 15:1 compression.
Figure F10: ROC plots for SD29 right index fingers using different images sizes and 15:1 compression.
A-5

Figure F11: ROC plots for SD29 left index fingers using different images sizes and 20:1 compression.
Figure F12: ROC plots for SD29 right index fingers using different images sizes and 20:1 compression.
A-6

Figure F13: ROC plots for SD29 left index fingers using different images sizes and 25:1 compression.
Figure F14: ROC plots for SD29 right index fingers using different images sizes and 25:1 compression.
A-7

Figure F15: ROC plots for SD29 left index fingers using different images sizes and 30:1 compression.
Figure F16: ROC plots for SD29 right index fingers using different images sizes and 30:1 compression.
A-8

Figure F17: ROC plots for SD29 left index fingers using different compression ratios for 320 pixel image.
Figure F18: ROC plots for SD29 right index fingers using different compression ratios for 320 pixel images.
A-9

Figure F19: ROC plots for SD29 left index fingers using different compression ratios for 368 pixel images.
Figure F20: ROC plots for SD29 right index fingers using different compression ratios for 368 pixel images.
A-10

APPENDIX B: ROC CURVES FOR MATCHER H
Figure H1: ROC plots for POE left index fingers using 15:1 compression for different image sizes.
Figure H2: ROC plots for POE right index fingers using 15:1 compression for different image sizes.
B-1

Figure H3: ROC plots for POE left index fingers using different compression for 368 images.
Figure H4: ROC plots for POE right index fingers using different compression for 368 images.
B-2

Figure H5: ROC plots for POE left index fingers using different compression for 320 images.
Figure H6: ROC plots for POE right index fingers using different compression for 320
images.
B-3

Figure H7: ROC plots for SD29 left index fingers using different image sizes for uncompressed data.
Figure H8: ROC plots for SD29 right index fingers using different image sizes for uncompressed data.
B-4
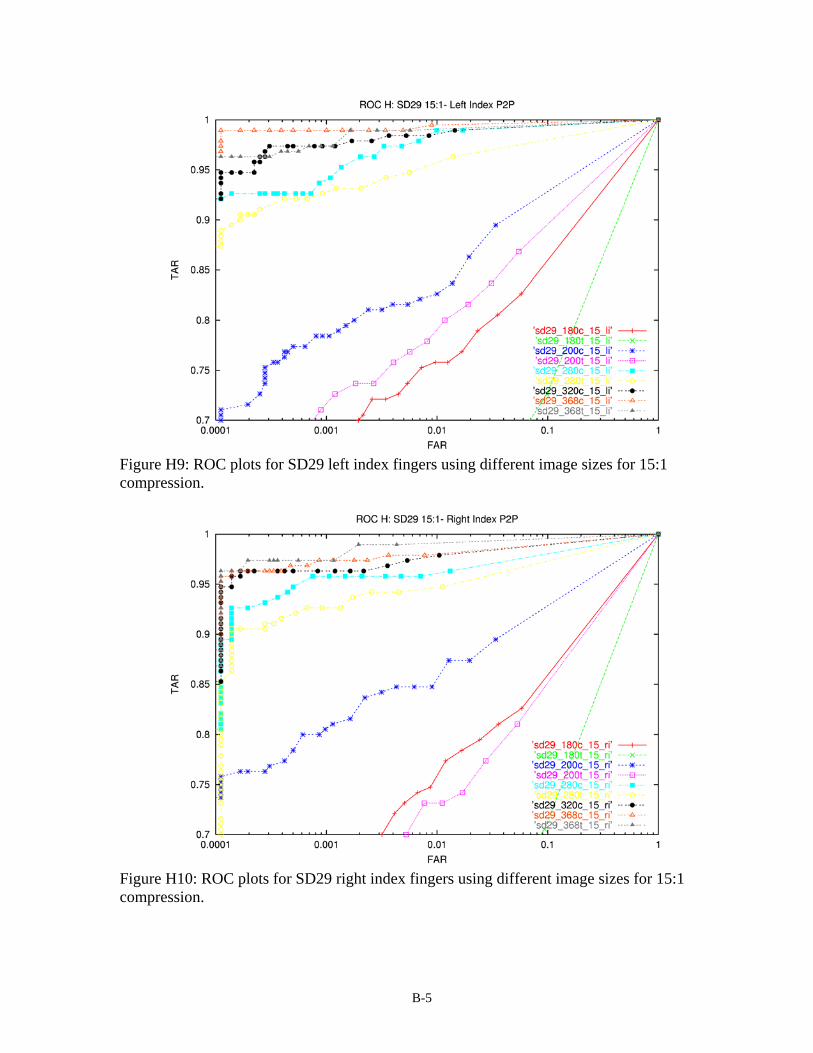
Figure H9: ROC plots for SD29 left index fingers using different image sizes for 15:1 compression.
Figure H10: ROC plots for SD29 right index fingers using different image sizes for 15:1 compression.
B-5

Figure H11: ROC plots for SD29 left index fingers using different image sizes for 20:1 compression.
Figure H12: ROC plots for SD29 right index fingers using different image sizes for 20:1 compression.
B-6

Figure H13: ROC plots for SD29 left index fingers using different image sizes for 25:1 compression.
Figure H14: ROC plots for SD29 right index fingers using different image sizes for 25:1 compression.
B-7

Figure H15: ROC plots for SD29 left index fingers using different image sizes for 30:1 compression.
Figure H16: ROC plots for SD29 right index fingers using different image sizes for 30:1 compression.
B-8
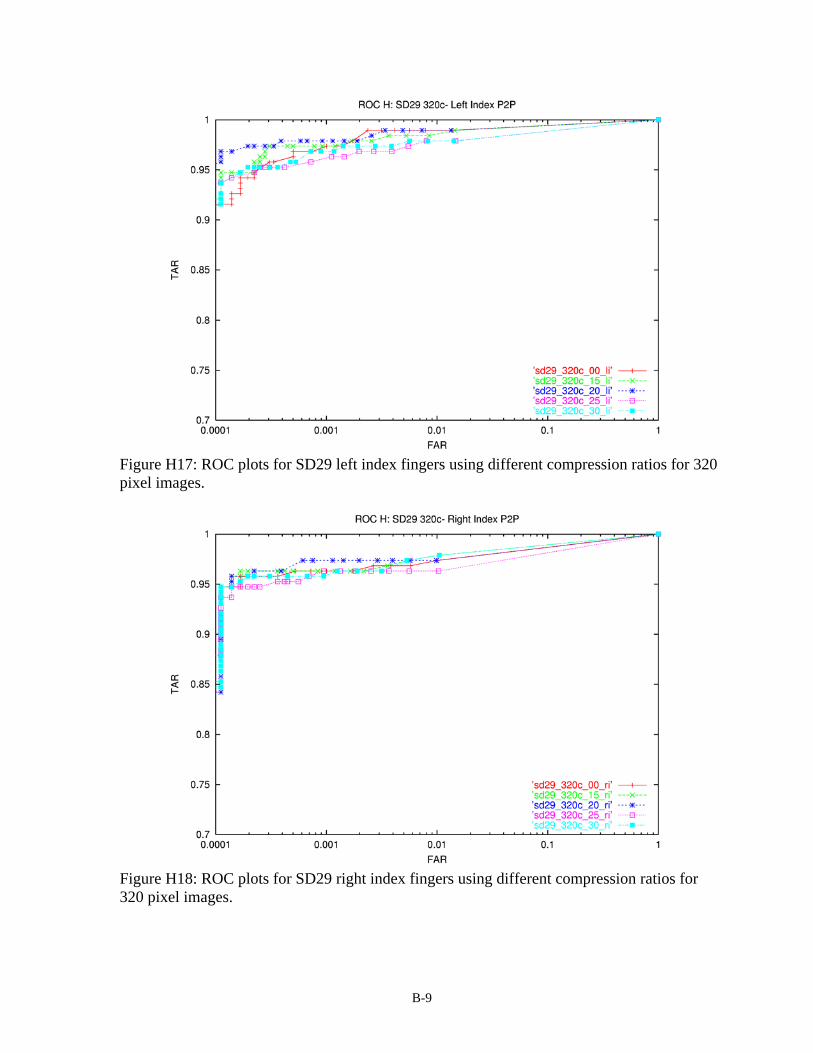
Figure H17: ROC plots for SD29 left index fingers using different compression ratios for 320 pixel images.
Figure H18: ROC plots for SD29 right index fingers using different compression ratios for 320 pixel images.
B-9

Figure H19: ROC plots for SD29 left index fingers using different compression ratios for 368 pixel images.
Figure H20: ROC plots for SD29 right index fingers using different compression ratios for 368 pixel images.
B-10

APPENDIX C: ROC CURVES FOR MATCHER J
Figure J1: ROC plots for POE left index fingers using 15:1 compression for different image sizes.
Figure J2: ROC plots for POE right index fingers using 15:1 compression for different image sizes.
C-1
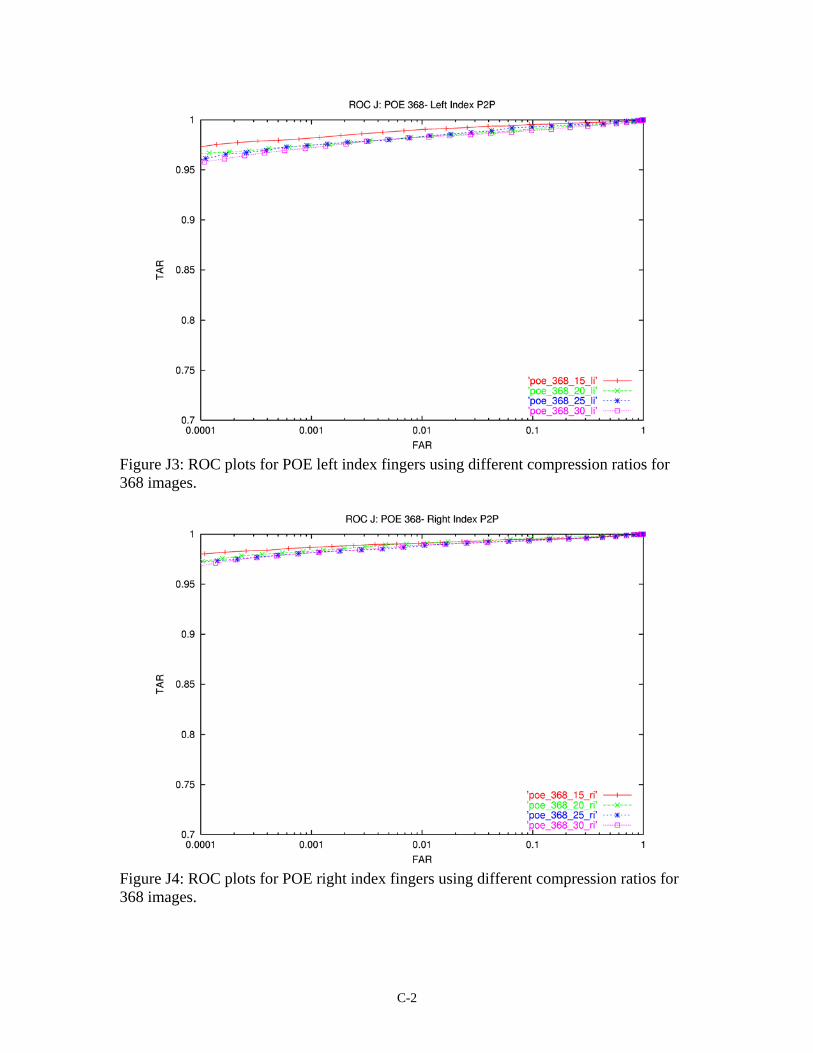
Figure J3: ROC plots for POE left index fingers using different compression ratios for 368 images.
Figure J4: ROC plots for POE right index fingers using different compression ratios for 368 images.
C-2

Figure J5: ROC plots for POE left index fingers using different compression ratios for 320 images.
Figure J6: ROC plots for POE right index fingers using different compression ratios for 320 images.
C-3
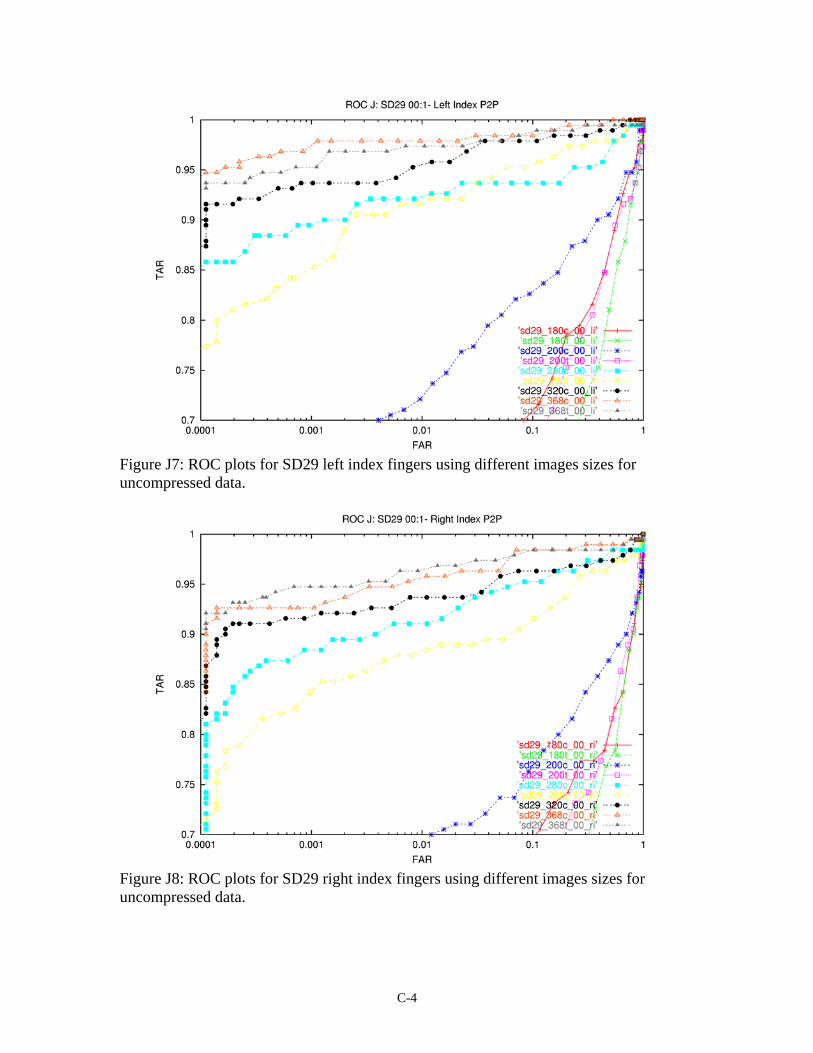
Figure J7: ROC plots for SD29 left index fingers using different images sizes for uncompressed data.
Figure J8: ROC plots for SD29 right index fingers using different images sizes for uncompressed data.
C-4

Figure J9: ROC plots for SD29 left index fingers using different images sizes for 15:1 compression.
Figure J10: ROC plots for SD29 right index fingers using different images sizes for 15:1 compression.
C-5

Figure J11: ROC plots for SD29 left index fingers using different images sizes for 20:1 compression.
Figure J12: ROC plots for SD29 right index fingers using different images sizes for 20:1 compression.
C-6
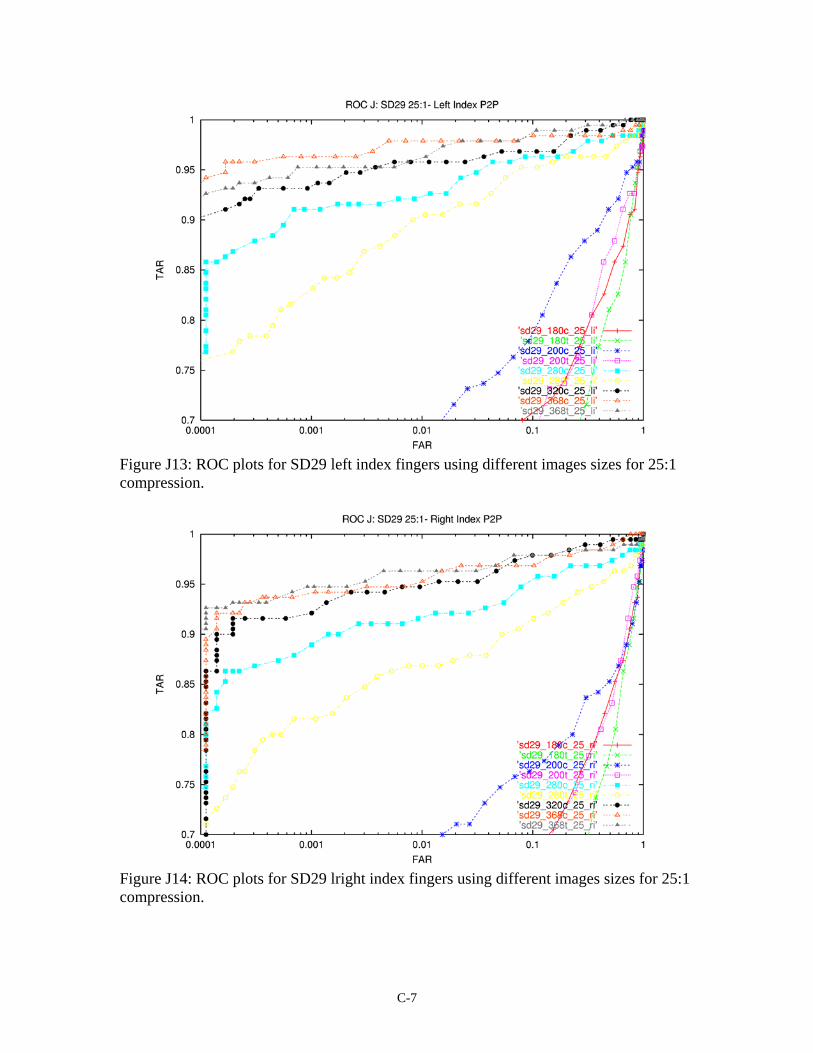
Figure J13: ROC plots for SD29 left index fingers using different images sizes for 25:1 compression.
Figure J14: ROC plots for SD29 lright index fingers using different images sizes for 25:1 compression.
C-7

Figure J15: ROC plots for SD29 left index fingers using different images sizes for 30:1 compression.
Figure J16: ROC plots for SD29 right index fingers using different images sizes for 30:1 compression.
C-8

Figure J17: ROC plots for SD29 left index fingers using different compression ratios for 320 pixel images.
Figure J18: ROC plots for SD29 right index fingers using different compression ratios for 320
pixel images.
C-9

Figure J19: ROC plots for SD29 left index fingers using different compression. ratios for 368 pixel images.
Figure J20: ROC plots for SD29 right index fingers using different compression. ratios for 368 pixel images.
C-10